Abstract
A single-slope greenhouse (SSG) is the general name of a kind of agricultural greenhouse facility widely used in China. Microclimate studies for SSGs in Weifang, Shandong Province, are relatively scarce. This paper mainly discusses the test data of nine SSGs including temperature, humidity, solar global radiation intensity, CO2 concentration, wind speed, and vapor pressure deficit (VPD) trend. Moreover, the conservation of quality method is used to estimate the ventilation volume and humidity growth after opening the top vent in the greenhouse. Through the analysis in this paper, for local SSGs, the internal environmental change has commonality but its internal environment is still influenced by many factors, such as plant planting density, internal cover, plant growth height, and vent opening time. In addition, the method in this paper can provide a quantitative tool for calculating and controlling humidity for researchers and greenhouse workers and provide a basis for greenhouse ventilation strategies.
1. Introduction
Greenhouse shelters have been widely applied for agricultural production because of their ability to enhance crop production by 10–20 times compared with outdoor cultivation and low investment costs [1]. Developed countries design appropriate greenhouses according to local natural conditions, agricultural resources, climate, and cultivation characteristics and make full use of the standard solar global radiation facilities to realize the serialization and standardization of agricultural facilities [2]. In China, although the materials of greenhouses by most farmers are under-developed compared to those of developed countries, the application of these greenhouses has optimized the agricultural development in northern China and promoted the growth of China’s vegetable production by 47% to 2004 [3]. Therefore, the microclimate of the agricultural greenhouse has been the object of interest for many scholars. Although many studies are detailed, the research conclusion cannot be directly applied to single-slope greenhouses (SSGs) in Weifang. First, most studies focus on the application of technology in one greenhouse with a specific test environment. For example, when discussing the impact of evaporative cooling fans on the greenhouse microclimate, only one house with 208 tomatoes was used as the research object [4] and the author discussed the planting area of plants without distinguishing the height of plant growth. In another example, some scholars divide greenhouse into three types: low technology, medium technology, and high technology in Canada [5]. Although this method of classification analysis is scientific, it is obviously not suitable for studying SSGs in Weifang, China, which use the economic structure and simple automatic control. Moreover, in the process of using Trnsys software to analyze the energy consumption of greenhouse multi-span greenhouses in South Korea, multi-span greenhouses are used as the research object and only energy transfer is considered [6]. Kittitas C and Bartzanas T found that CFD simulation data indicated different air velocity and humidity distributions in empty tunnel greenhouses with roll-up and pivoting door types on the coastal area of Eastern Greece [7]. Although these studies have significant scientific research value, it is not suitable for SSGs in Weifang. Not only are the regional climate characteristics different from those of Weifang, but there is also a lack of data about plant density and plant height in the greenhouses which should be considered as variables in the test. Secondly, most of the studies ignore the actual operation and maintenance of the greenhouse in detail. During the operation process of the greenhouse system, the ventilation maintains a reasonable level of internal temperature, airflow velocity, and humidity. Greenhouse ventilation control is usually based on staff experience, and objective test data are ignored in most areas of China. Therefore, the existence of a ventilation system should be considered in the study of the greenhouse microclimate. However, in the study on heat exchange of buried pipes in greenhouses [8], the author believed that the ventilation of the local greenhouse was always closed in winter. The operation scenario based on the assumption of researchers may be different from the actual scenario. Moreover, in the study of the solar heating and climatization system for greenhouses [9], the authors only used temperature and relative humidity data to analyze their performance without the situation with opening vent. Finally, there is a lack of research on the greenhouse ventilation temperature and humidity and the ability to remove internal vapor. For example, Tadili R et al. and Willits D H introduced the humidity ratio as the evaluation index of dehumidification and applied it to the application of a variable frequency fan and cooling fan in greenhouses [4,9]. However, the SSGs in Weifang use natural ventilation to dehumidify and the humidity ratio is insufficient to compare the dehumidification capacity of SSGs with different scales. Therefore, it is necessary to calculate the actual moisture discharge of SSGs.
For the issues above, three aspects should be considered for the greenhouse research model in Weifang city: the impact of greenhouse building size, the influence of plants in the greenhouse, and the impact of farmers’ habit of operating vents. This paper records the test process and research methods of nine SSGs. Meanwhile, because the health of crops is closely related to changes of humidity, a mass conservation analysis method is proposed to estimate the ventilation volume and air moisture changes when the top vent is opened. Combining the vapor pressure deficit (VPD) and its increment, an optimizing strategy is proposed. The nine SSGs are grouped and compared with each other according to the plant planting density, plant growth period, plant film covering, ventilation opening, and differences due to the size of the greenhouse (including sunlight and CO2, ventilation, moisture removal capacity, and VPD). Although the experimental site is located in Shandong Province, China, it is still helpful for agricultural operators with the same weather conditions around the world to adjust their greenhouse control strategies.
2. Research objects and methods
2.1. Specific Situation of the Object Greenhouses
The experimental location of this study is Weifang City, China. Weifang Shouguang city (longitude 119°15′ E and latitude 36°70′ N) is located in the middle of Shandong Peninsula. The coastline is 56 km long and covers an area of 2072 km3, accounting for 1.43% of Shandong’s total area. Shouguang is located in the mid-latitude zone adjacent to the Bohai Sea in the north and belongs to the continental climate of the warm temperate monsoon zone. Affected by the alternation of airflow, the climate characteristics of “dry and little rain in spring, hot and rainy in summer, cool and dry in autumn, cold and lack of snow in winter” are formed. The annual average temperature is 12.7 °C, the annual maximum temperature is 14.2 °C, and the annual minimum temperature is −11.4 °C. Nine local SSGs are selected and grouped according to the experimental objectives in winter.
Figure 1 illustrates the basic structure of one SSG. Depending on the location and function, the geometric parameter will change without specific shape changes. The nine SSGs are numbered G1–G9. Greenhouse planting situations and sensor setups are described as follows:
- (1)
- Greenhouse for planting chrysanthemum coronarium x2. Greenhouse identifier: G1, G2. The G1 greenhouse is fitted with temperature and humidity sensors, and the G2 greenhouse is fitted with a carbon dioxide sensor, temperature and humidity sensors, and a sunlight intensity sensor;
- (2)
- Greenhouse for planting watermelon seedlings x2. Greenhouse identifiers: G3, G4. This is a control group with sensors located vertically and horizontally or inside and outside of the heat preservation film;
- (3)
- Greenhouse for planting tomato x3. Greenhouse identifiers: G5, G6, G7. The G5 greenhouse adds carbon dioxide sensors, wind speed sensors, and sunlight intensity sensors in addition to temperature and humidity sensors. G6 and G7 have only temperature and humidity sensors installed. Plants in G5 are ripe tomatoes without tomatoes. Therefore, staff members need to guarantee a higher temperature (25–28) than fruited tomato plants promoting tomato outcomes. Plants in G6 have ripe fruits with similar height (1.6 m) of G5. Plants in G7 are growing tomatoes with a height of about 0.5 m;
- (4)
- Greenhouse for planting cherry tomato x1. Greenhouse identifier: G8. This greenhouse is equipped with temperature and humidity sensors;
- (5)
- Greenhouse for planting cucumber x1. Greenhouse identifier: G9. Wind speed sensors, carbon dioxide sensors, sunlight intensity sensors, and temperature and humidity sensors are installed inside or outside the greenhouse. The structure is the same as that of G8 greenhouse, but the internal crops are different. Additionally, it is the control group member of carbon dioxide, wind speed, and sunlight intensity change with G2 and G5.

Figure 1.
SSG structure: (a) Overview, L is total length, W is total width, H is total height; (b) Side view, W1 is bottom width of the back wall, W2 is pavement width, W3 is planting area width, WT is total width, H is total height.
As illustrated in Table 1 and Table 2, the building geometry and local staff operating rules of the greenhouses are different because of different crop planting and greenhouse systems in the planting base. However, the thermal insulation measures of the maintenance structure of all greenhouses are the same as shown in Table 3. According to the geometric dimensions of the greenhouse and the difference of the crops planted in the test, the functions of the control group are as follows:
- (1)
- G1 vs. G2. This control group is used to compare the temperature and humidity changes of dwarf crops under different planting densities.
- (2)
- G3 vs. G4. This control group mainly compares the temperature and humidity changes in the nursery shed with or without the multilayered film cover.
- (3)
- G5, G6 vs. G7. These three greenhouses are same size. The effect of crops at different growth periods on the internal environment are derived by comparing the temperature and humidity changes of G5, G6, and G7.
- (4)
- G8 vs. G9. This control group is mainly used to analyze the effect of delaying opening of top vents on environment inside greenhouses.
- (5)
- G3, G4, G6, and G8. This group displays the temperature and humidity data obtained by all sensors in these greenhouses to analyze the temperature distribution of each SSG in vertical direction.
- (6)
- Analysis of other environmental data. Other analyses included: G5 and G9, CO2 concentration under different weather conditions; ventilation rate when the top vents are opened; air moisture content calculation and analysis; VPD calculation and analysis.

Table 1.
Parameters of greenhouses.
Table 1.
Parameters of greenhouses.
| Crops | Chrysanthemum Coronarium | Watermelon Seedlings | Tomato | Cherry Tomato | Cucumber |
|---|---|---|---|---|---|
| Quantity | 2 | 2 | 3 | 1 | 1 |
| Number | G1, G2 | G3, G4 | G5, G6, G7 | G8 | G9 |
| L (m) | 130 | 130 | 80 | 180 | 180 |
| WT (m) | 35.5 | 35.5 | 24 | 23 | 23 |
| H (m) | 8.5 | 8.5 | 6.5 | 6.5 | 6.5 |
| W1 (m) | 10 | 10 | 8 | 7 | 7 |
| W2 (m) | 1.5 | 1.5 | 1 | 1 | 1 |
| W3 (m) | 22 | 22 | 12 | 14 | 14 |
Table 2.
Maintained temperature inside the greenhouse (local staff rules).
Table 2.
Maintained temperature inside the greenhouse (local staff rules).
| Greenhouse Number | G1 | G2 | G3 | G4 | G5 | G6 | G7 | G8 | G9 |
|---|---|---|---|---|---|---|---|---|---|
| Planting density (plants/m2) | 300 | 1500 | 20 | 20 | 6 | 6 | 6 | 6 | 4.6 |
| Crop height (m) | 0.1 | 0.5 | 0.05 | 0.1 | 1.6 | 1.6 | 0.5 | 1.6 | 1.5 |
| Minimum temperature (°C) | 8 | 8 | 20 | 16 | 15 | 15 | 15 | 15 | 18 |
| Suitable temperature (°C) | 15–20 | 15–20 | 28–30 | 28–30 | 25–28 | 15–28 | 25–28 | 25–28 | 25–30 |
| Maximum Temperature (°C) | 25 | 25 | 38 | 38 | 32 | 32 | 32 | 32 | 38 |
| Relative humidity (%) | 80–85 | 80–85 | 50 | 50 | 60–65 | 60–65 | 60–65 | 60–65 | 80–85 |
Table 3.
Membrane material.
Table 3.
Membrane material.
| Membrane Material | Thickness | Transmissivity | Heat Transfer Coefficient | Thermal Conductivity | Specific Heat Capacity |
|---|---|---|---|---|---|
| Polyethylene plastic film | 0.1–0.15 mm | 0.8 | 4.0 W/m2·K | 0.38 W/m·K | 2300 J/kg·K |
Partial literature documented that, to obtain suitable sunlight, the membrane parts were oriented east–west [10,11]. However, the greenhouse direction in this paper is all towards the south. The appearance of SSGs is shown in Figure 2. Every greenhouse includes gables at back side as the support and thermal insulation structure. The thermal insulation curtain is rolled in the daytime and covers the membrane at night (the accurate time is based on the internal temperature and sunlight situation). Additionally, Figure 2 also illustrates the internal view of the greenhouses planting different crops. The greenhouses planting watermelon seeding (G3 and G4) need to be covered by the thermal insulation curtain more than 22 h a day and set a multilayered membrane (G4). G3 and G4 require maintaining a temperature higher 30 °C in the daytime and of at least 15 °C at night.
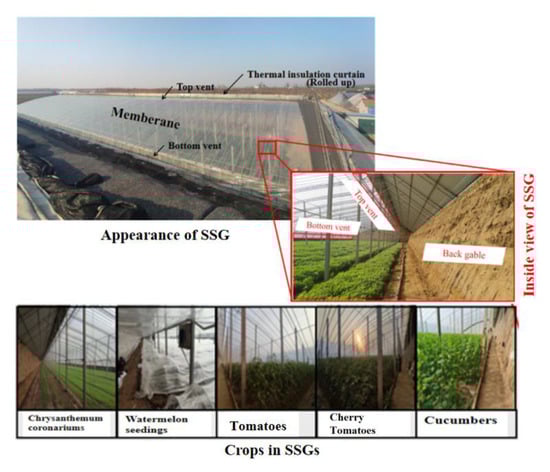
Figure 2.
Structure of the greenhouse.
2.2. Data Collection Method
Humidity, air temperature, temperature distribution, soil temperature, and outdoor and incident sunlight intensity were the parameters that were considered significant indices to study the environment in greenhouses. Hou Yicun et al. used a multipoint and nonuniform measurement scheme in a greenhouse to analyze the environmental data of a single greenhouse [12]. This arrangement of sensors makes full use of the limited number of sensors to obtain more effective and representative data. Because this study mainly aimed at the microclimate of the planting area, the sensor detection positions were selected within the plant growth height. Moreover, because of the tiny change in temperature and humidity at the same height, the measuring points are optimized and reduced in the horizontal direction. Figure 3 below shows the sensor positions set in each greenhouse planting area. The circle T points represent temperature and humidity sensors. The sensor at the lowest position is arranged 0.2 m away from the soil, and the sensor at the highest point is arranged near the highest plant growth height. Some greenhouses (G5 and G9) were also equipped with sunlight intensity and carbon dioxide concentration sensors. G5 and G9 were equipped with wind velocity sensors to collect wind speed data.
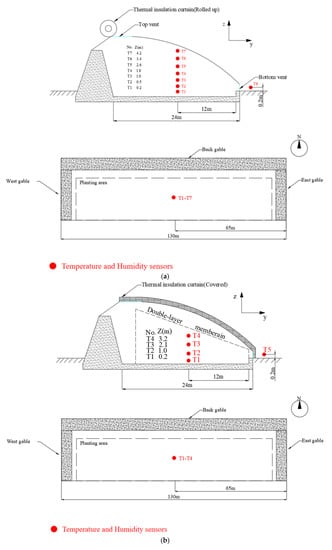
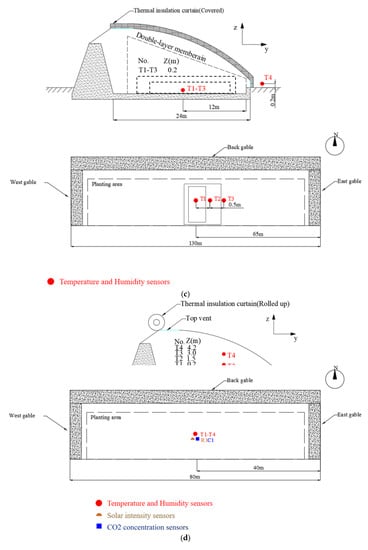
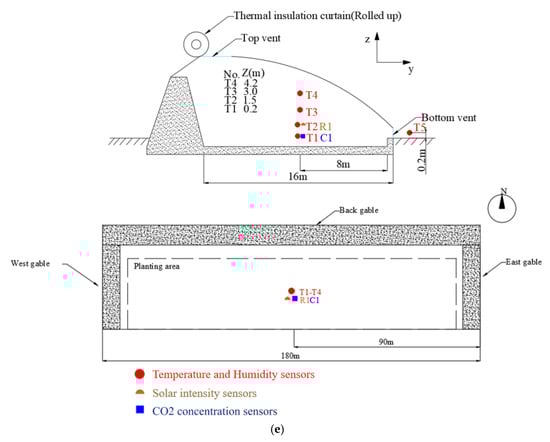
Figure 3.
Sensor location in each SSG. (a) Sensor location in G1 and G2; (b) Sensor location in G3; (c) Sensor location in G4; (d) Sensor location in G5–G7; (e) Sensor location in G8 and G9.
The temperature and humidity automatic recorder devices are model RR002 (China Academy of Building Research, temperature measuring range −10–50 °C, measurement uncertainty ±0.5 °C, humidity measurement range 0–95% RH, measurement uncertainty ±3% RH, resolution 0.1% RH). All the temperature and humidity data acquisition intervals are five minutes to ensure that all data were continuous. To avoid measurement errors caused by sunlight during the temperature and humidity sensor installation, its shell was wrapped with tin paper. The sunlight intensity data were collected by a QTS-4 all-weather global radiation data recorder (measuring range 0–2000 W/m2, accuracy 5%, resolution 1 W/m2). The solar global radiation data collection frequency was every five minutes from the opening time of the greenhouse thermal insulation quilt to the closing time of the thermal insulation quilt. The wind speed recorder device was a Swema3000 hot wire wind speed sensor (Swema, wind velocity measuring range 0.05–3 m/s, measurement uncertainty ±0.04 m/s). Due to the rapid change frequency of wind speed, the automatic recording frequency was set to record once per minute. The CO2 concentration recording equipment was TEL7001D (TELAIRE, American Co., measuring range 0–10,000 ppm, sensitivity 1 ppm, measurement uncertainty ±50 ppm). Since plant photosynthesis occurs under sunlight, the carbon dioxide concentration was recorded until the thermal insulation quilt was closed with a recording frequency of once every 5 min.
The data measurement time of the G1–G4 greenhouse was 23 December 2020. The G1–G4 are in the National Modern Agricultural Industrial Park in the Hanting district. The weather on the test day was cloudy. The top vents of the G1 and G2 greenhouses were opened in daytime, while the vents of the G3 and G4 were closed. The G5–G7 are in Qingshouting District Hanzi Village. The data were collected from December 24 to December 25. The G8 and G9 greenhouses are in Cuijiazhuang, Tianliu town. However, the differences in the operation, the opening or closing time of the thermal insulation quilt, and the vents were dissimilar. Data collection was from 26 December to 27 December. The specific experimental conditions and greenhouse operation are shown in Table 4.
Table 4.
Basic experimental conditions.
3. Results and Discussion
3.1. Indoor Temperature Distribution Analysis
Temperature is a significant environmental factor affecting crop yield [13]. Temperature affects photosynthetic electron transport and carbon assimilation in plants, but high temperatures damage photosynthetic organs [14,15]. As an important environmental indicator of greenhouse, temperature is of concern for farmers. Almost all greenhouses are equipped with electronic thermometers or liquid thermometers for temperature detection. This experiment includes several types of greenhouses with temperature data and the conclusion can be determined comparing the greenhouse data of each control group.
3.1.1. G1 vs. G2
Figure 4 illustrates the average temperature change in the G1 and G2 greenhouses. Although the air temperature inside G1 and G2 varies by approximately 1 °C, the overall temperature change trends of G1 and G2 are similar. The maximum difference is 1.95 °C at 14:00, half an hour after the vent is opened. The apparent temperature difference is mainly caused by the different vent openings, which are done manually by the staff. When the vent is opened, G1 and G2 ensures that the temperature is at least 5.55 °C and at most 8.35 °C higher than the external temperature, which avoids plant death due to the temperature drop during dehumidification through the opening vent. From Figure 4, the indoor air temperature increased gradually, and the temperature inside reached the highest value at 13:30. The temperature decreases inside the greenhouse due to heat and mass exchange through the top vents. After 14:00, when the temperature of each measuring point in the greenhouse dropped below 15 °C, the vent was closed in time. The measured data show that the average temperature in the G2 greenhouse is higher than that in the G1 greenhouse. This means that the higher the planting density is, the higher the average temperature in the low crop greenhouse.
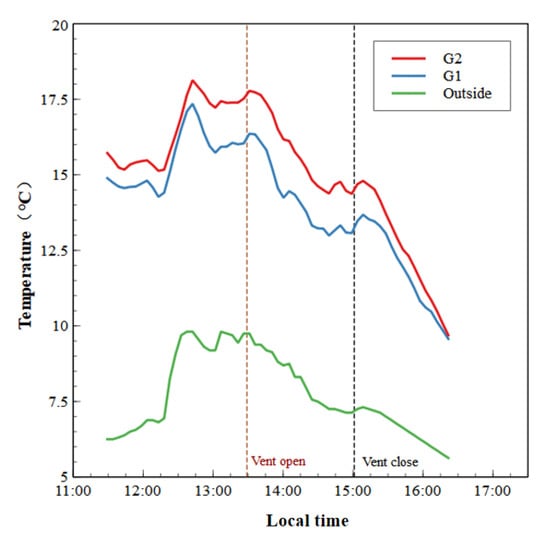
Figure 4.
G1 and G2 average temperature data.
From data analysis and comparison, although G1 and G2 have the same building structure, the average temperature of G2 is significantly higher than that of G1. When the sunlight shines into the greenhouse through the film, due to the higher planting density in G2 with more shielding of wet ground by leaves, the evaporation of wet ground is less than that in G1. Therefore, G2 loses less latent heat of vaporization. Although more plant density will lead to more intense plant transpiration, the data analysis shows that the cooling caused by ground water evaporation is more than that caused by plant transpiration.
3.1.2. G3 vs. G4
Figure 5 is the average temperature data of G3 and G4 from 11:00 to 17:00. The test is completed under the condition that the thermal insulation quilt is opened and sunlight is shining into the greenhouse. G3 and G4 belong to the watermelon seedling culture greenhouse, and the vent is permanently closed. Because G3 and G4 adopt a relatively sealed planting environment, there is a significant temperature difference with the external temperature. The sensors in G4 are close to the earth, and three layers of film cover the watermelon seedings. However, because the G3 internal temperature sensor is arranged in a vertical direction and is not covered by a film, the minimum temperature difference between G3 and the outdoors is 9.42 °C, and the maximum is 13.92 °C. The temperature measurement sensor is horizontally arranged near the ground and covered with film in G4, so the minimum temperature difference between G4 and the outdoors is 13.32 °C, and the maximum is 16.5 °C. From the figure, the temperature reaches the highest value at 12:45. Simultaneously, the maximum indoor temperature appears later than the outdoor. The indoor temperature increases from the outer membrane to the inner membrane, and the maximum temperature difference is 5.0 °C.
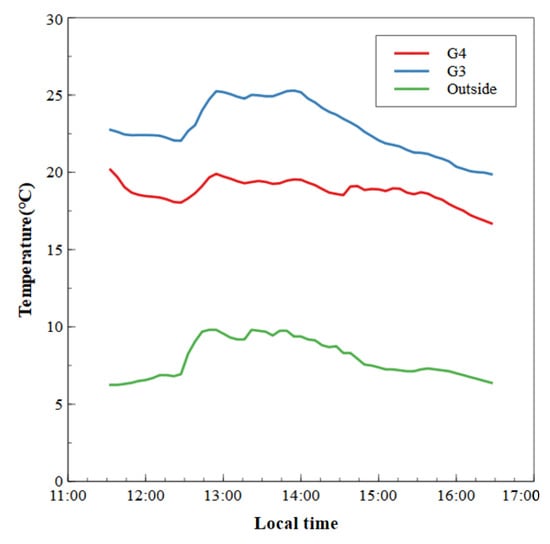
Figure 5.
G3 and G4 average temperature data.
According to the data, the average temperature of G4 is lower than G3. Because the temperature in the greenhouse is lower as it is closer to the ground, even if it is covered with film, the temperature increase due to the increase in height is more obvious. Therefore, the temperature of the seedling planting area is effectively raised by planting the seedlings in the form of pot on the shelf.
3.1.3. G5, G6 vs. G7
The three greenhouses, G5, G6, and G7, have the same structure and staff. Figure 6 shows the internal air temperature change trend in G5, G6, and G7. The maximum temperature was 31.85 °C on December 24 and 31.66 °C on December 25. After 18:00, the G5, G6, and G7 greenhouses were covered with thermal insulation cotton quilt, and the internal temperature decreased nearly linearly with time. The temperature of G5 decreased from 20.11 °C to 12.91 °C. The temperature of G6 decreased from 18.16 °C to 12.1 °C, and that of G7 decreased from 17.15 °C to 13.34 °C. The internal temperature began to rise gradually until 8:00 on the 25th. According to other staff’s experience, each top vent was opened for ventilation. Because the planting crop is growing tomatoes, the crop transpiration is intense and the indoor temperature rises slowly. To prevent the indoor temperature from falling too fast, the vent was closed at 14:30. During the ventilation period, the temperature fluctuated slightly and satisfied the most suitable growth temperature for tomato (25–28 °C) [16].
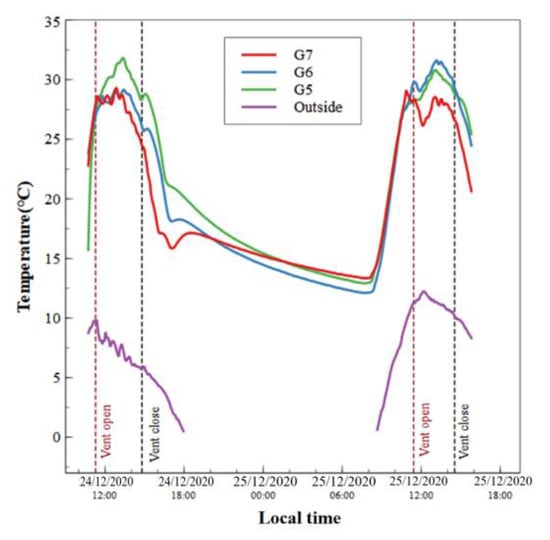
Figure 6.
G5, G6, and G7 average temperature data.
By comparing the average temperature data, the change trend of G5, G6, and G7 average temperature is similar. During daytime, the reason for the higher average indoor temperature in G5 and G6 than in G7 is that the taller crop obscures the sun exposure to the ground reducing water evaporation. Nocturnal heat loss was relatively less in G7 due to the weaker phytobiotic activities in G7 than in G5 and G6. In the same way, the difference between G5 and G6 is also responsible, but the difference is tiny.
3.1.4. G8 vs. G9
The G8 indoor temperature variation is shown in Figure 7. From 8:00, the air temperature rose rapidly and peaked at approximately 12:00–13:35. The highest temperature in G8 is 34.41 °C. Even when the outdoor temperature is at least 0.56 °C, the indoor temperature maintains an 11 °C difference that is higher than the outdoor temperature at 6:20–7:00. Additionally, when the internal temperature of the greenhouse reaches the maximum, the outdoor temperature is not the maximum. When the staff found that the temperature in the greenhouse was over the limit through the thermometer, they opened the vent to cool down. Therefore, when the outdoor temperature rose, the greenhouse was not overheated. Since the opening time of the vent is different from G8, the data of G9 are separately depicted in Figure 7. The temperature began to increase from 9:00 to 12:00 at a speed of 4–5 °C per hour. Subsequently, the velocity of the temperature increase reduced. At 13:00, the temperature reached the highest value, and the staff opened the top vent. Under joint wind pressure outside and thermal pressure inside, cold air flowed in, and hot air was discharged. Through convective heat transfer, the indoor temperature decreased quickly. Before the vent was closed, the temperature of each measuring sensor was between 28 and 35 °C. However, while the vent was open, the values from each sensor dropped to 25.5–30 °C. This means that opening the vent has a significant cooling effect. Planting crops with similar heights but different varieties will not seriously affect the trend of temperature change in similarly structured greenhouses. However, when the opening time of the top vent is different, the internal temperature change trend changes dramatically.
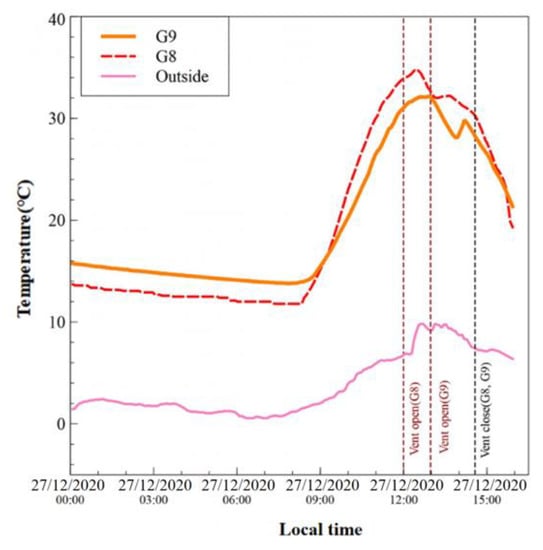
Figure 7.
G8 and G9 average temperature data.
In accordance with the data contrast, the average temperature inside the G8 greenhouse still rose after the top vent was opened with outdoor temperature increase and daylight enhancement. The G9 greenhouse opens the top vent when the outdoor temperature begins to decrease. At this time, the average temperature in the G9 greenhouse decreases rapidly. This means that outdoor climate change has a stronger impact on the interior of the greenhouse. Since the temperature is still rising, farmers should open the top vents earlier in order to exclude humid air from the greenhouse.
3.1.5. G3, G4, G6, and G8
Figure 8 shows the sensor data of G3, G4, G6, and G8. Comparing the sensors at different locations explains the temperature distribution at different heights in a greenhouse. Initially, with the increase of indoor temperature in G3 shown as Figure 8a, the temperature gradient gradually increased to 1.67 °C/m at 13:00. The upper space of the greenhouse belongs to an ‘invalid space’ for crops. However, hot air accumulated in the upper space. Therefore, this is a waste of energy and can be taken to transfer the energy to the growing area by appropriate methods. Secondly, Figure 8b illustrates watermelon seeding with covered double-layer films in G4, and the maximum temperature difference between the inner film and the greenhouse was 5.06 °C. The maximum temperature difference between the middle film and the greenhouse was 3.56 °C. The heat preservation effect is pronounced. Compared with other heating methods (hot blast stoves and electric heating sheets), this method has such advantages in its simple operation, low cost, and reusable material. Thirdly, Figure 8c displays the data of G6. At night, there was almost no gradient change in the G6 air temperature along the height direction. However, with solar energy heating and vent opening during the day, the temperature change along the height direction became more pronounced. Additionally, the temperature gradient change in G6 with time is described in the figure. At night, the temperature gradient was a negative value (minimum −0.14 °C/m), which means that the temperature decreased with increasing height, and the temperature distribution was relatively uniform. However, the temperature gradient became incremental, and the temperature rose with increasing height. The maximum value was 2.19 °C/m (at 13:00). the temperature stratification phenomenon was apparent. Before 15:00, the minimum temperature was 0.2 m, and the maximum temperature was 4.2 m. This means that the 4.2 m height was strongly affected by sunlight and crop transpiration. This temperature distribution is conducive to ventilation by hot pressure. Due to the low density and high-temperature air above, indoor air will flow out under thermal pressure after opening the vent. Finally, the temperature distribution of greenhouse G8 is shown in Figure 8d. The maximum temperature difference between 4.2 m and 0.2 m is 4.94 °C. At 11:50, because of plant transpiration, much sensible heat was produced and acted on the upper space in the greenhouse (24.69 °C). In contrast, due to the shelter of leaves and wet ground evaporation, the sensor data temperature was the lowest (21.19 °C) at the 0.2 m height. According to the collected data, the temperature stratification in the greenhouse was pronounced during the day. However, at night, the temperature distribution in the greenhouse was average, and there was no apparent stratification phenomenon. The maximum temperature difference of the sensors was 12.52 °C. The specific data are shown in Table 5.
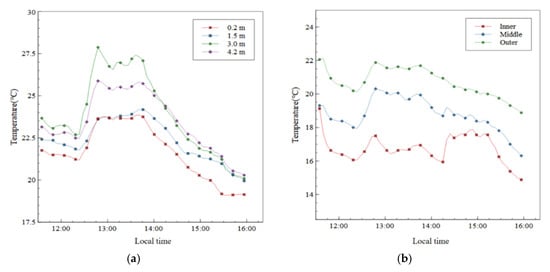
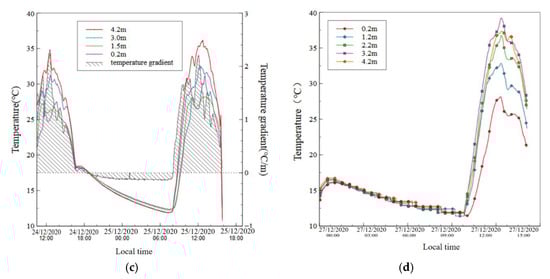
Figure 8.
Temperature data of sensors from different heights. (a) Sensor data of G3; (b) Sensor data of G4; (c) Sensor data of G6; (d) Sensor data of G8.
Table 5.
The maximum temperature difference (between max and min of sensor reading) in each greenhouse at the same time.
When the greenhouse was exposed to sunlight, the internal temperature increased gradually along height direction. First, in the G4 greenhouse, the multilayered film impedes the innermost layer of sunlight. Although the multi-layer film elevated the heat retention at night, it decreased the inner layer getting solar energy during the day. Secondly, although the geometric size of G6 is different from that of G8, the trend of temperature change was the same in both. Because of the similarities in its building structure, the temperature changing characteristics of this type of single slope greenhouse also have some similarities.
3.2. Analysis of Relative Humidity
Environmental humidity affects greenhouse plant growth and production [17]. The relative humidity is related to the quality of plant growth. High humidity levels may cause plant diseases or decreased crop quality due to fungi and lack of calcium and water [18]. Scholars are fully aware that studying humidity changes inside greenhouses is of great value for agricultural production. Therefore, the changes in humidity in the nine SSGs are described and analyzed in this paper. This is followed by an in-depth exploration of the variation of moisture rejection with VPD mentioned later.
As shown in Figure 9, the outdoor relative humidity remained stable throughout the day and was lower than the internal humidity of the greenhouse. Therefore, when the vents are opened, the inflow of outdoor air and indoor air discharge have a specific dehumidification effect. At night, the relative humidity of each greenhouse tended to be saturated. After 8:00, the sunlight increased gradually. The air temperature in the greenhouse increased with increasing solar global radiation. At this time, although the vent was closed, the indoor relative humidity rapidly decreased. When the staff found that the indoor temperature reached a high peak, they opened the vent of each greenhouse. This can be seen by comparing the relative humidity data between G1 and G2. Because the density of chrysanthemum planted in G2 is higher than that in G1, the transpiration of plants in the G2 greenhouse is stronger. This causes the relative humidity inside G2 to be higher than that in G1.
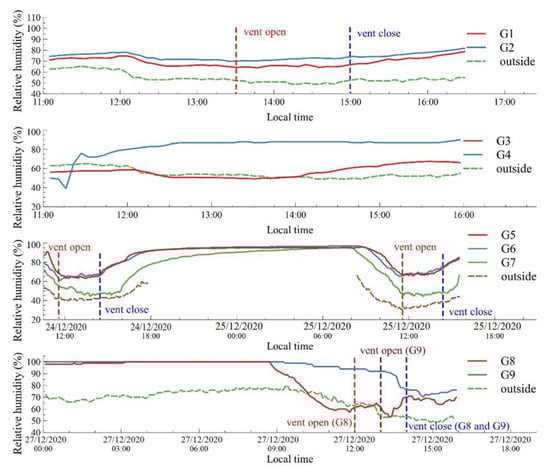
Figure 9.
Relative humidity data of each greenhouse.
Additionally, the relative humidity data of G5, G6, and G7 express the variation trend of relative humidity in a greenhouse with plants of different heights. The relative humidity in G7 (plant height 0.5 m) was significantly lower than that in G5 and G6 (plant height 1.6 m). In addition, the relative humidity data of G8 and G9 show the effect of the delayed opening of the vent on the change in relative humidity. When the vent was closed, the relative humidity decreased slowly. However, when the vent was opened, the relative humidity decreased quickly.
Firstly, because low crops are planted in the G1 and G2 greenhouses, plant respiration and transpiration caused by these crops are weak. The humidity changes are tiny even if the top air vent was opened. Secondly, because the vents are closed in G3 and G4 and seedlings are weakly biologically active, the cause of their internal humidity change is irrigation. Thirdly, the humidity change of G5 versus G6 was almost the same. This indicates that crops in the fruiting period have no effect on the humidity change in greenhouse. The relative humidity of G7 was lower than that of G5 and G6. This illustrates that the lower height of the plants, the lower the humidity inside the greenhouse. Further studies are needed to determine whether the reason for this result is the physiology of the plant or another reason. Finally, G8 and G9 had more distinguishable humidity data. From the humidity data, it can be found that the reason for the decrease in humidity was not because of the opening of the top vents. This illustrates that opening the top vent has a limited effect on relative humidity, although it is the main method for local farmers to dehumidify.
3.3. Analysis of Solar Global Radiation and CO2 Concentration
CO2 is an important raw material for plant photosynthesis and numerous studies have elucidated the importance of carbon dioxide for plants. Increasing the CO2 concentration in the atmosphere promotes plant growth and increases crop yield [19,20]. However, photosynthesis only occurs under light, and a high CO2 concentration enhances the absorption of CO2 by photosynthesis under sufficient light intensity for C3 plants [21,22]. Therefore, the study of CO2 concentration inside a warm room should be combined with sunlight intensity data. Figure 10 mainly shows the CO2 concentration change and solar global radiation variation in G5 and G9. The test data of G5 and G9 were collected on sunny days, so the variation trend of solar global radiation intensity was similar. At night, the CO2 released by plants during respiration is retained in the greenhouse because the greenhouse is unventilated and covered with a thermal insulation quilt. Until the thermal insulation quilt is opened and sunlight illuminates the greenhouse, the CO2 concentration continues to decline from the highest data peak. The lowest data point of each greenhouse appears after the maximum solar global radiation exists. As the light cooperation of plants consumes CO2, the indoor CO2 concentration will be lower than the outdoor CO2 concentration.
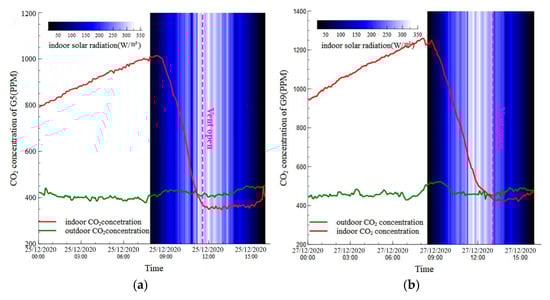
Figure 10.
Data on CO2 concentration and solar global radiation. (a) CO2 concentration data of G5; (b) CO2 concentration data of G9.
It can be seen from the figure that the operators of both greenhouses chose to open the top vent shortly after the CO2 concentration was just lower than the outdoor CO2 concentration. Both G5 and G9 have a common problem. Although opening the top vent can use concentration differences and ventilation to supplement CO2 consumption due to photosynthesis, the CO2 concentration is still lower than outdoors. This means that increasing ventilation will continue to replenish CO2. During this period of decline in CO2, solar energy is the most intense state during the day. Farmers may consider using solar-heated ventilation systems which increase ventilation after preheating the outdoor air.
3.4. Ventilation Rate during Vent Opening
Airflow directly affects energy and mass transfer for plant growth. Airflow promotes air convective heat transfer, gas exchange, and water evaporation/condensation on leaves [23,24]. To build a suitable environment, greenhouse ventilation is an effective way to create a suitable internal environment and promote gas exchange [25]. In this season, the staff only opened the top vent for ventilation. At that time, the whole greenhouse was ventilated by a single air outlet in the horizontal direction. Multiple wind speed sensors recorded the wind speed data at different vent positions during the experiment. The average value of these wind speed sensors was used as the wind speed value of the air outlet in the test and shown in Figure 11.
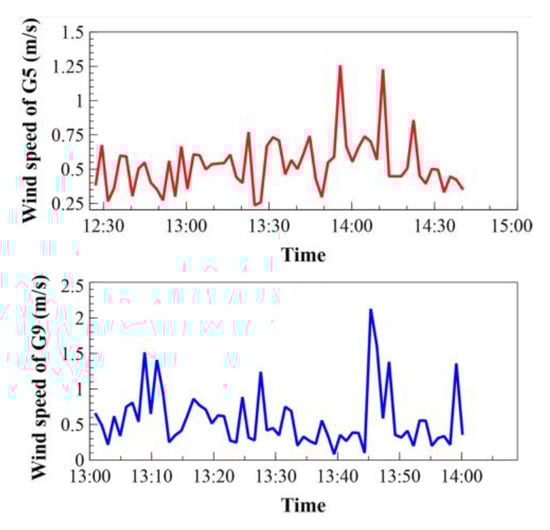
Figure 11.
G5 and G9 wind speed data.
Larsen TS described the volume flow rate of air flow driven by thermal buoyancy and wind in a single vent ventilation [26]. The mathematical expression is as in Equation (1):
where is the volume flow rate (m3/s), is the total area of the window (m2), and is the mean air velocity in the opening (m/s). According to the law of conservation of mass and wind speed data per second, Equation (2) should be used:
where is the inflow air volume rate (m3), is the outflow air volume (m3), and τ is the elapsed time. The specific ventilation volume of each time period is shown in Figure 12. The ventilation process is divided into several time segments, and each time segment is calculated to estimate the influence of ventilation on the total humidity in the greenhouse.
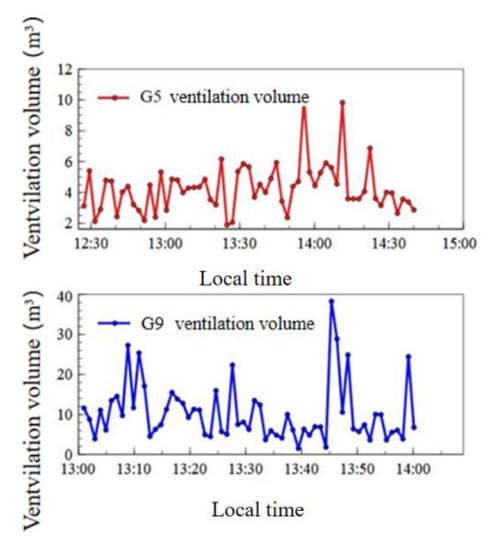
Figure 12.
Inflow air volume data of G5 and G9.
3.5. Relative Humidity Change during Ventilation
High humidity causes the exposure of plant surfaces and induces the reproduction of pathogenic fungi, which leads to plant diseases. High humidity directly affects crop yield and quality, primarily through the occurrence and severity of fungal diseases [27]. Therefore, removing excess moisture and paying attention to the weight of discharged moisture are beneficial to the growth of plants in the greenhouse. Without irrigation, it can be seen from the test data that the relative humidity in the greenhouse is almost unchanged from vent opening to vent closing. The greenhouse air moisture content change is mainly caused by ventilation and plant transpiration. The amount of moisture change in the air should match the following equation:
where is the vapor change inside the greenhouse, is the vapor change caused by ventilation, and is the moisture change by plant transpiration, soil water evaporation and other moisture sources. The calculation of the relative humidity of air by the micrometeorological model is shown in Equation (4) [28].
where RH is the relative humidity, is the vapor pressure, and is the saturation vapor pressure at the same temperature. Additionally, the formula of absolute humidity is shown in Equation (5). can be represented as Equation (6).
where is the mass of vapor per cubic meter of air (kg/m3) and is the specific gas constant for water vapor defined as 461.5. is the temperature (°C). Therefore, the water vapor carried by air can be obtained by Equations (4)–(6), and the equation is shown as Equation (7).
where is the mass of water vapor carried in air and is the volume of air in greenhouse. Therefore, in the process of greenhouse ventilation, the change in water vapor content caused by the mass exchange of indoor and outdoor air depends on the temperature, relative humidity and ventilation volume of indoor and outdoor air. The specific mathematical description is shown in Equation (8).
where is the absolute humidity of inflow air, is the absolute humidity of the air in the greenhouse, is the relative humidity of inflow air, and is the relative humidity of the air in the greenhouse. is the temperature of the inflow air, and is the temperature of the air in the greenhouse. Additionally, can be determined by collecting the data shown in Figure 13.
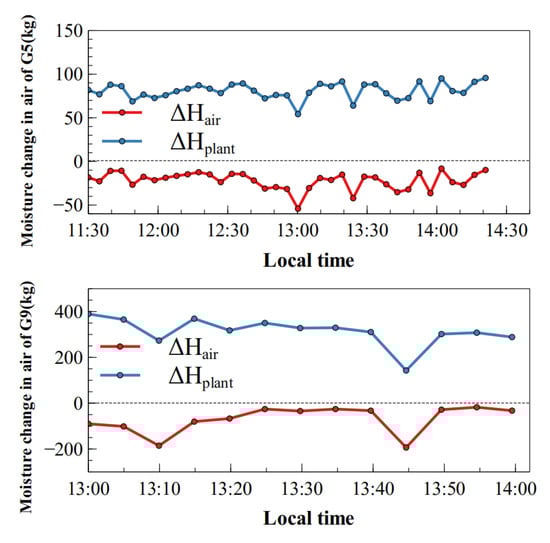
Figure 13.
Moisture change in the air of G5 and G9.
During the operation and maintenance of SSGs, the SSGs are closed for most of the day. Therefore, when the vent is open, it is possible to remove more water vapor through the mass exchange of air to effectively improve the probability of plant disease. The maximum reduction in water vapor in the G5 greenhouse at the data point occurred at 13:00. The water vapor reduction caused by ventilation at each data point was approximately 20 kg. The water vapor discharge rate by ventilation was approximately 279.72 kg/h. The water vapor generation rate in the greenhouse was approximately 1030.04 kg/h. In the G9 greenhouse, the water vapor reduction at data point was approximately 90 kg. The water vapor discharge rate by ventilation was approximately 1158.80 kg/h. The water vapor generation rate in the greenhouse was approximately 4892.70 kg/h. Therefore, the generation of water vapor in the greenhouse is approximately four times the vapor discharge rate. Therefore, the water vapor in the greenhouse lacked effective discharge during ventilation. When the top vent was closed, condensation was serious as the temperature decreased. In this case, the optimization strategy needs to open multiple air outlets or increase mechanical ventilation during ventilation. Meanwhile, the staff need to add isoenthalpy dehumidification equipment to ensure that the greenhouse will not have serious condensation phenomena at night without ventilation, which may cause plant mildew.
3.6. Analysis of VPD
In the existing studies, researchers explained the molecular mechanism of plant stomatal closure induced by high VDP by establishing a time-resolved experimental system of stomatal conductance [29]. VPD is a vital index to quantify the quality of the plant growth environment. This experiment mainly focuses on the actual changes in VPD under the influence of human factors and external environmental factors. That is, when the vent on the top of the greenhouse is open at noon, ventilation and sunshine influence the change in VPD in the greenhouse. The calculation formula of VPD is as follows [30]:
where T is the temperature near the leaf surface. According to the needs of local staff, only paying attention to the VPD value at a specific time cannot support the judgment of the VPD change after the greenhouse vent is opened. Therefore, it is necessary to determine the change in VPD.
where is the value of VPD change, T2 is the temperature after a period, and T1 is the initial temperature. RH2 is the relative humidity after a period, and RH1 is the initial relative humidity. At noon, when the staff opened the vent, the values of RH2 and T2 were directly related to ventilation and sunlight.
Figure 14 shows the change in VPD of the G5 and G9 greenhouses after opening the top vent and the change in VPD at the test time node. After opening the top vent, the VPD value and VPD change in the G5 and G9 greenhouses can be obtained according to the data on heat and humidity. It can be seen from the results that the change in VPD in the greenhouse is closely related to the change in sunshine intensity, ventilation volume of the vent, and internal humidity. The changing trend of VPD is the same as that of sunshine intensity on vent-opening time. This shows that sunlight significantly impacts the greenhouse’s internal temperature change, and the opening vent provides a relatively stable dehumidification condition. It can be seen from the figure that although opening the top vent reduces the VPD value from the high point, the biological mechanisms of plants and water evaporation in the soil still cause a high VPD value. Therefore, this type of greenhouse needs to adopt isothermal dehumidification equipment to assist in the process of thermal insulation and dehumidification when only the top vent is opened for natural ventilation.
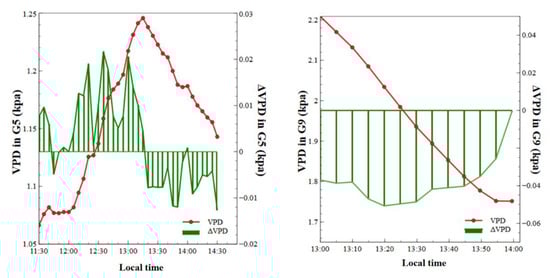
Figure 14.
VPD and ΔVPD values of G5 and G9.
4. Conclusions
The present study includes the data of nine SSGs that contain temperature, relative humidity, solar global radiation intensity, CO2 concentration, and wind speed. Based on the analysis of context, the conclusions can be listed as follows:
- (1)
- The temperature change trend of the greenhouses with a similar structure is the same. The larger the land covered by crop leaves in the greenhouse, the higher the average temperature is in daytime. At night, the leaf shelter has almost no impact with the temperature change. Crop mulching with multi-layer film enhances the effect of heat preservation at night, but this way also hinders the sunshine in the daytime. In the daytime, the temperature inside the multi-layer film is even lower than that outside the multi-layer film. In this paper, it is suggested to open the multi-layer film in the daytime, which can improve the air temperature around the seedlings. Although the top air vent opens before the outdoor temperature reaches the maximum point, the temperature in the greenhouse still rises. The air vent can be opened earlier to increase the time of moisture removal, because the temperature inside the greenhouse will still rise with the increase of outdoor temperature.
- (2)
- Water evaporation causes a relative humidity change in the greenhouse and the inflow of air from the vent in the daytime. The opening of the top vent can reduce the humidity, but its dehumidification capacity was lower than that of water evaporation and plant transpiration inside the greenhouse. Therefore, even if the top vent is opened and the internal temperature rises, the relative humidity will still increase at noon. At night, the internal relative humidity is close to 100% because the greenhouse is closed. High humidity will affect the average growth of crops, so appropriate dehumidification measures should be taken.
- (3)
- Because there is no light for plants in the greenhouse at night, the concentration of carbon dioxide continues to rise. Until the thermal insulation quilt is opened, the plants in the greenhouse receive sunlight, and the carbon dioxide concentration gradually decreases. When sunlight rises to its most vital point, the carbon dioxide concentration in the greenhouse was lower than that in the outdoor air. At this time, increasing ventilation can supplement carbon dioxide in the greenhouse. However, if the vent is opened, the temperature drops rapidly, affecting crop growth. Therefore, in future research, we should pay attention to the influence of the vent opening time and opening extent on the carbon dioxide concentration.
- (4)
- The change in the VPD value is influenced by heat and moisture exchange inside and outside the greenhouse. Combined with the temperature and sunshine intensity data, it can be seen that the response speed of the greenhouse internal temperature to sunshine intensity is fast. Additionally, the ability of the top vent to control temperature and humidity is limited, but it is still essential data that cannot be ignored in the calculation. It can be seen from the experimental and calculated data that the amount of moisture dissipation in the greenhouse is enormous. Although the top vent is opened, the VPD value in the greenhouse even reaches more than 2 kPa, which is unfavorable to plant growth. Therefore, an adequate ventilation strategy is needed in the greenhouse to solve dehumidification under thermal insulation.
Author Contributions
Conceptualization, H.L. and A.L.; methodology, H.L., A.L. and Y.H.; software, C.Z. and H.L.; validation, J.G.; formal analysis, H.L.; investigation, J.G., J.L. and Y.M.; data curation, J.L.; writing—original draft preparation, H.L. and T.W.; writing—review and editing, H.L. and Y.Y.; visualization, H.L.; supervision, H.L. and A.L.; project administration, H.L. All authors have read and agreed to the published version of the manuscript.
Funding
This research received no external funding.
Institutional Review Board Statement
Not applicable.
Informed Consent Statement
Not applicable.
Data Availability Statement
The authors confirm that the data supporting the findings of this study are available within the article.
Conflicts of Interest
The authors declare no conflict of interest.
References
- Vadiee, A.; Martin, V. Energy management in horticultural applications through the closed greenhouse concept, state of the art. Renew. Sustain. Energy Rev. 2012, 16, 5087–5100. [Google Scholar] [CrossRef]
- Von Elsner, B.; Briassoulis, D.; Waaijenberg, D.; Mistriotis, A.; Von Zabeltitz, C.; Gratraud, J.; Russo, G.; Suay-Cortes, R. Review of structural and functional characteristics of greenhouses in European Union countries, part I1: Typical designs. J. Agric. Eng. Res. 2000, 75, 111–126. [Google Scholar] [CrossRef]
- Weinberger, K.; Lumpkin, T. Diversification into horticulture and poverty reduction: A research agenda. World Dev. 2007, 35, 1464–1480. [Google Scholar] [CrossRef]
- Willits, D.H. Cooling fan-ventilated greenhouses: A modelling study. Biosyst. Eng. 2003, 84, 315–329. [Google Scholar] [CrossRef]
- Abbey, L.; Rao, S.A. Differential response of plant species to greenhouse microclimate created by design technology and ambient conditions. Can. J. Plant Sci. 2017, 98, 300–308. [Google Scholar] [CrossRef]
- Rasheed, A.; Kwak, C.S.; Na, W.H.; Lee, J.W.; Kim, H.T.; Lee, H.W. Development of a building energy simulation model for control of multi-span greenhouse microclimate. Agronomy 2020, 10, 1236. [Google Scholar] [CrossRef]
- Kittas, C.; Bartzanas, T. Greenhouse microclimate and dehumidification effectiveness under different ventilator configurations. Build. Environ. 2007, 42, 3774–3784. [Google Scholar] [CrossRef]
- Levit, H.J.; Gaspar, R.; Piacentini, R.D. Simulation of greenhouse microclimate produced by earth tube heat exchangers. Agric. For. Meteorol. 1989, 47, 31–47. [Google Scholar] [CrossRef]
- Tadili, R.; Dahman, A.S. Effects of a solar heating and climatisation system on agricultural greenhouse microclimate. Renew. Energy 1997, 10, 569–576. [Google Scholar] [CrossRef]
- Stanciu, C.; Stanciu, D.; Dobrovicescu, A. Effect of greenhouse orientation with respect to E–W axis on its required heating and cooling loads. Energy Procedia 2016, 85, 498–504. [Google Scholar] [CrossRef]
- Saberian, A.; Sajadiye, S.M. The effect of dynamic solar heat load on the greenhouse microclimate using CFD simulation. Renew. Energy 2019, 138, 722–737. [Google Scholar] [CrossRef]
- Yicun, H.; Angui, L.; Yue, L.; Dacheng, J.; Yu, T.; Da, Z.; Dingmeng, W.; Linhua, Z.; Wenjun, L. Analysis of microclimate characteristics in solar greenhouses under natural ventilation. Build. Simul. 2021, 14, 11. [Google Scholar]
- Liu, J.; Wisniewski, M. Effect of heat shock treatment on stress tolerance and biocontrol efficacy of biocontrol yeasts. Acta Hortic. 2011, 76, 145–155. [Google Scholar] [CrossRef]
- Mathur, S.; Mchta, P.; Jajoo, A. Effects of dual stress (high salt and high temperature) on the photochemical efficiency of what Icavcs (critic um acstivum). Physiol. Mol. Biol. Plants 2013, 19, 179–188. [Google Scholar] [CrossRef]
- Wise, R.R.; Olson, A.J.; Schrader, S.M.; Sharkey, T.D. Electron transport is the functional limitation of photosynthesis in field-grown Pima cotton plants at high temperature. Plant Cell Environ. 2010, 27, 717–724. [Google Scholar] [CrossRef]
- Ruiz-Nieves, J.M.; Ayala-Garay, O.J.; Serra, V.; Dumont, D.; Vercambre, G.; Génard, M.; Gautier, H. The effects of diurnal temperature rise on tomato fruit quality. Can the management of the greenhouse climate mitigate such effects? Sci. Hortic. 2021, 278, 109836. [Google Scholar] [CrossRef]
- Bakker, J.C. Analysis of Humidity Effects on Growth and Production of Glasshouse Fruit Vegetables. Ph.D. Thesis, Wageningen University and Research, Wageningen, The Netherlands, 1991. [Google Scholar]
- Trigui, M.; Barrington, S.F.; Gauthier, L. Effects of humidity on tomato (Lycopersicon esculentum cv. truss) water uptake, yield, and dehumidification cost. Can. Agric. Eng. 1999, 41, 135–140. [Google Scholar]
- Kimball, B.A. Carbon dioxide and agricultural yield: An assemblage and Analysis of 430 prior observations. Agron. J. 1983, 75, 779–788. [Google Scholar] [CrossRef]
- Kimball, B.A.; Zhu, J.; Cheng, L.; Kobayashi, K.; Bindi, M. Responses of agricultural crops of free-air CO2 enrichment. Ying Yong Sheng Tai Xue Bao 2002, 13, 1323–1338. [Google Scholar]
- Rogers, A. The response of photosynthesis and stomatal conductance to rising [CO2]: Mechanisms and environmental interactions. Plant Cell Environ. 2007, 30, 258–270. [Google Scholar]
- Urban, O.; Klem, K.; Holisova, P.; Teslovanavratilova, P.; Zitova, M.; Marek, M.V.; Grace, J. The impact of elevated CO2 concentration on dynamics of leaf photosynthesis in Fagus sylvatica is modulated by sky conditions. Environ. Pollut. 2014, 185, 271–280. [Google Scholar] [CrossRef] [PubMed]
- Gaastra, P. Climatic control of photosynthesis and respiration. In Environmental Control of Plant Growth; Evans, L.T., Ed.; John Wiley and Sons: New York, NY, USA, 1963; pp. 113–140. [Google Scholar]
- Monteith, J.L. Gas exchange in plant communities. In Environmental Control of Plant Growth; Evans, L.T., Ed.; John Wiley and Sons: New York, NY, USA, 1963; pp. 95–112. [Google Scholar]
- Ould Khaoua, S.A.; Bournet, P.E.; Migeon, C.; Boulard, T.; Chassériaux, G. Analysis of greenhouse ventilation efficiency based on computational fluid dynamics. Biosyst. Eng. 2006, 95, 83–98. [Google Scholar] [CrossRef]
- Larsen, T.S.; Heiselberg, P. Single-sided natural ventilation driven by wind pressure and temperature difference. Energy Build. 2008, 40, 1031–1040. [Google Scholar] [CrossRef]
- Hand, D.W. Effects of atmospheric humidity on greenhouse crops. Acta Hortic. 1998, 229, 143–158. [Google Scholar] [CrossRef]
- Goudriaan, J.; Van Laar, H.H. Modeling Potential Crop Growth Processes: Textbook with Exercises; Kluwer Academic Publishers: Dordrecht, The Netherlands, 1994; Volume 240. [Google Scholar]
- Hsu, P.K.; Takahashi, Y.; Merilo, E.; Costa, A.; Zhang, L.; Kernig, K.; Lee, K.H.; Schroeder, J.I. Raf-like kinases and receptor-like (pseudo)kinase ghr1 are required for stomatal vapor pressure difference response. Proc. Natl. Acad. Sci. USA 2021, 118, e2107280118. [Google Scholar] [CrossRef] [PubMed]
- Altieri, M.A. Principles of ecology in plant production. Crop Prot. 1998, 17, 681. [Google Scholar] [CrossRef]
Disclaimer/Publisher’s Note: The statements, opinions and data contained in all publications are solely those of the individual author(s) and contributor(s) and not of MDPI and/or the editor(s). MDPI and/or the editor(s) disclaim responsibility for any injury to people or property resulting from any ideas, methods, instructions or products referred to in the content. |
© 2023 by the authors. Licensee MDPI, Basel, Switzerland. This article is an open access article distributed under the terms and conditions of the Creative Commons Attribution (CC BY) license (https://creativecommons.org/licenses/by/4.0/).