1. Introduction
Because of unprecedented urbanization, China is now the world’s second-largest economy after the United States of America (USA). From 2001 to 2020, the average annual growth of the gross domestic product (GDP) was approximately 10-fold [
1]. Substantial progress with regards to China’s urbanization-driven economic growth can be attributed to the structure of its construction industry. Among all construction activities in China, buildings consume the most resources [
2], including requiring the most material stock [
3,
4,
5]. Material stocks are growing in all regions and show few signs of saturation yet. China has been the main driver of global stock flows since the 1990s [
6]. Material stock is a concept that represents the weight of society in time and space, as it represents potential developments that people (i.e., society) will interact with. To a certain extent, stock materials can be indicative not only of the development of a city but also the pace of development and its direction. At the same time, within the context of recycling, a detailed characterization of stock materials is important for transitioning into a circular economy; an economy that promotes the sustainable development of urban ecological spaces. Spatial analysis of urban metabolism has become an active field of research [
7]. Research on material stocks of social systems began more than 80 years ago. However, with the acceleration of global urbanization and the increase in urban metabolism research in the past 30 years, related research has gradually attracted considerable attention and has rapidly developed into a new hot spot in the field of regional sustainability and urban ecology research.
Residential buildings represent a large allocation of building materials in various cities [
3,
5,
8]. This has been translated to material-stock-related dynamics within the context of residential buildings, and has received considerable attention in recent studies [
9,
10,
11,
12,
13]. For example, Mastrucci et al. [
12] quantified material stock in relation to the environmental impact of end-of-life of residential buildings in Luxembourg, with the ultimate aim of supporting waste management policy. Mesta et al. [
13] used a geographic information system (GIS) model to study the geospatial characteristics of material inventories in urban residential areas in Latin America. As a developing country, especially in the less developed western region, China’s economy is still in a stage of rapid growth, and urban material stock is rising. Studies on the material stock of urban residential buildings are mostly concentrated in foreign cities. Material stock studies have been conducted in some big domestic cities, such as Shanghai [
14] and Beijing [
15]; however, there is a lack of research on Western China.
Material flow analysis (MFA) is the most widely accepted and standardized method in the study of material metabolism. Estimation approaches are generally categorized into the top-down approach, bottom-up approach, and their combination and extension. However, most studies on material stock are based on conventional statistical analyses, which are used to calculate the stock scale and total generation, to predict the stock scale of cities in the future. This approach does not allow for a detailed localization of material stock within a city [
8], and GIS can be used to easily address this problem. In the past few years, many studies have shown that GIS is useful in studying urban construction stock, as it has many advantages in data collection, storage, and analysis and presentation of summary results. It can also improve the accuracy of building stock models by providing geographic reference information. Tanikawa and Hashimoto studied the spatiotemporal changes in Japan’s material accumulation, showing the potential of analyzing the accumulation of material stock in space and time [
5]. This is the theoretical framework of the 4D-GIS model that is widely used at present. The 4D-GIS is a time series database based on GIS, and it can be applied to urban material stock analysis and spatial data analysis. In addition, it can also be used quantify and visualize the distribution characteristics and rules of urban construction material stock, acting as a robust reference point for yielding solutions for future urban planning. For example, Chen et al. used 4D-GIS to study the material metabolism and spatial structure of Ezhou City, Hubei Province, China [
16]. Wang et al. applied 4D-GIS to verify patterns in the urban village of Shenzhen, a rapidly developing megacity in Southern China [
17]. This study was intended to accurately draw a building and building activity map to help evaluate an urban planning project. The spatiotemporal dimension was used to characterize the material metabolism process of Shenzhen, allowing for the development of a system designed to accurately measure stock material dynamics to reduce the consumption of building materials and improve the recovery rate of construction and demolition waste.
In this study, a bottom-up method was used to obtain material stock data of residential buildings, and then a 4D-GIS model was used to identify the spatiotemporal distribution characteristics of stock in central Xi’an, across different time periods. We studied the time–space rules of residential building stock from different time periods and administrative regions. Combined with development rules given by the city, we explored the coupling relationship between the two and the main driving factors of residential building stock growth. The addition of a spatial dimension makes this study unique from other similar studies. Specifically, this study combines the spatiotemporal distribution characteristics of material stock with the spatial development rule, development speed, and the expansion direction of the city. These were carried out to clearly reveal the driving factors influencing residential building stock growth and the relationship between the growth of residential building stock and urban development.
This study primarily focuses on central Xi’an and aims to discuss three main aspects: (1) how material stock of residential buildings has developed in various districts (i.e., Beilin, Lianhu, Weiyang, Xincheng, Baqiao, Yanta, and Chang’an), (2) what are the main spatial distribution characteristics of residential building material stock, and (3) what are the driving factors for the growth of residential building stock.
2. Materials and Methods
A bottom-up method was used to calculate the material stock scale of residential buildings in Xi’an. Kernel density and hot spot analysis were used to obtain the distribution characteristics of the stock. Specifically, kernel density analysis reflects the specific agglomeration characteristics of stock growth, whereas hot spot analysis identifies areas with a relatively concentrated material stock and reveals the hot spots and cold spots of stock growth. Evolutionary patterns of residential building stock in the urban space were studied in the time dimension, and the distribution density and direction were studied using the standard deviation ellipse method. For identifying the study of the driving factors of stock growth, this study used multiple linear regression to reveal the correlation and characteristics of different driving factors of building stock growth.
2.1. Description of the Case Study
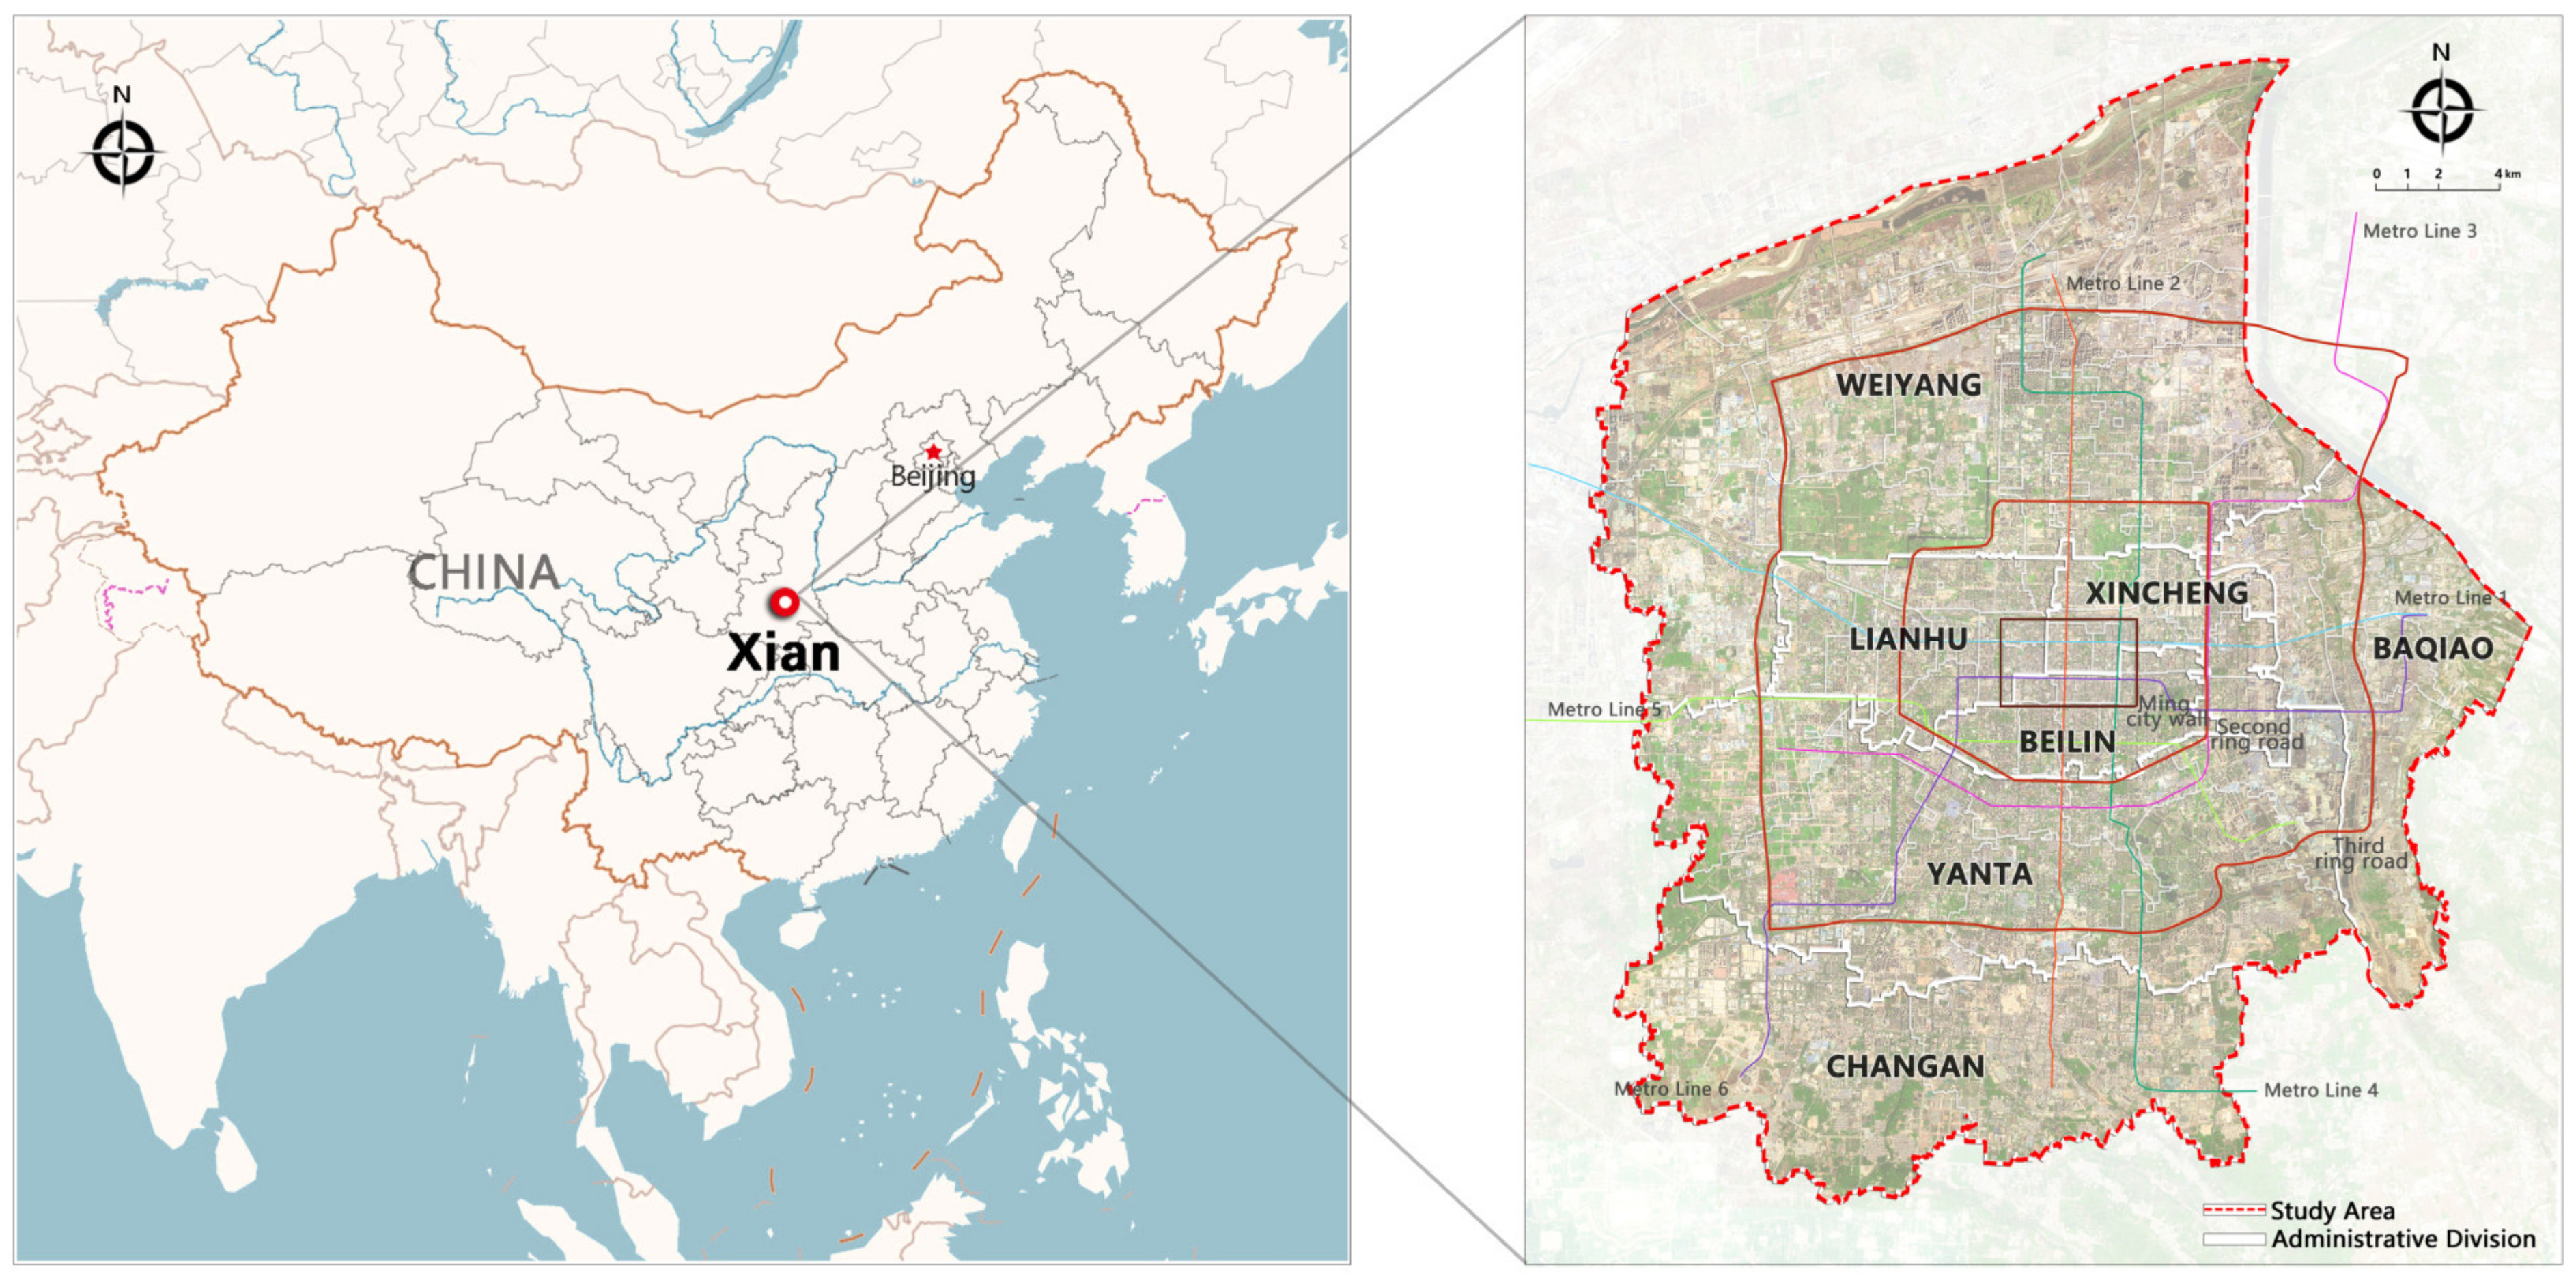
Xi’an, the capital city of Shaanxi Province in Western China, was selected as the main research area. Xi’an is not only a new first-tier city in China, but also an important central city in Western China. In recent years (since 1980), the city has developed and expanded rapidly. Its rapid development is considered recent because it is an ancient city with a long history of approximately 3200 years. It was identified as a “world famous historical city” by UNESCO in 1981. As a UNESCO site, the city has a complex and dual responsibility of protection and development. Therefore, research on the material stock of residential buildings in Xi’an is of utmost importance, as it is fully in line with the city’s responsibilities. Specifically, with the responsibilities of protection and development, any dynamics pertaining to the two responsibilities are supposed to be thoroughly characterized, as there is little scope for error.
Our study area was urban central Xi’an (
Figure 1). The prolific nature of its construction projects that are spread across its various districts, including Beilin, Xincheng, Lianhu, Yanta, Weiyang, Chang’an, and Baqiao Districts, makes it an ideal study area. Among them, Beilin, Xincheng, and Lianhu Districts are in the old urban areas of Xi’an within the city wall of the Ming Dynasty. Yanta, Weiyang, Chang’an, and Baqiao Districts are new areas on the periphery of the old urban areas. Chang’an District was withdrawn from county-level classification and divided into more districts in 2002. There are many streets under its jurisdiction; however, most of them are still in villages. Therefore, Guodu Street and Weiqu Street, as the most urbanized streets in Chang’an, were the only ones selected for this study.
2.2. Research Methods
2.2.1. Kernel Density Analysis
Kernel density analysis can be used to calculate the unit density of point feature measurements within a specified neighborhood range. It can directly reflect the distribution of discrete measured values in a continuous area. By using this method, we can clearly study the spatial distribution and aggregation characteristics of geographical elements. Its formula is:
where
is the kernel density,
is the kernel function,
is the bandwidth, and
> 0.
is the number of known points within the bandwidth.
represents the distance from the estimated point
to the sample point
. The larger the
value, the denser the point distribution.
2.2.2. Hot Spot Analysis
Hot spot analysis can be used to identify the spatial clustering of hot and cold spots with statistical significance in space and to identify the areas with concentrated residential building stock and their corresponding scale. The formula for this analysis is:
where
is the z-score. A high z-score for a feature indicates a spatial clustering of high values. A low negative z-score indicates a spatial clustering of low values. The higher (or lower) the z-score, the more intense the clustering.
is the attribute value of feature
.
is the spatial weight between features
and
.
is the total number of elements.
2.2.3. Standard Deviational Ellipse
The standard deviation ellipse method generates an ellipse by calculating the standard deviation of the distribution of point elements to characterize the distribution density and direction of the studied point data. The center of the ellipse represents the center of the distribution of point elements; the long axis of the ellipse represents the direction of the distribution of point elements; and the short axis represents the degree of dispersion of the overall data. The formula for this method is:
where
represents the abscissa of the ellipse.
represents the ordinate of the ellipse.
represents the weight.
represents the spatial position information of each element.
and
represent the average arithmetic center of each element.
is the ellipse rotation angle.
3. Theory/Calculation
3.1. Theory of Material Stock
At present, there are two different analytical methods for estimating building material stock, namely bottom-up and top-down methods [
4,
18]. The bottom-up method is based on dividing the stock into different categories, defining the material intensities (MIs) of typical buildings, and then applying them for the calculation of the whole stock [
12,
19].
In this study, the bottom-up method was used to calculate the material stock in residential buildings. The determination of residential building material stock primarily includes two parts; namely, the acquisition of gross floor area (GFA) and the determination of MIs.
3.2. Material Stock Analysis
3.2.1. Number of Dwellings and GFA
Locomotive Collector V8 is collection software for internet-based data capture, processing, analysis, and mining. Using Locomotive Collector V8 (locoySpider) to crawl data from SouFun (Lianjia, 58 Tongcheng, Anjuke) and other websites, we obtained housing-related data. Combined with the non-point source data of urban buildings in the study area, data on building base area, floor height, and building age were obtained from the ArcGIS platform, and the residential building area in the study of residential building stock in Xi’an was calculated using (8):
where
is the GFA of the community in Xi’an.
q is the buildings in the community.
n is total number of buildings in the community.
is the base area of the building
q.
is the floor height of the building
q.
3.2.2. Computing MIs
MIs refer to the average material mass per unit building volume. By consulting the statistical yearbook of Xi’an, and studying the relevant sources, after consulting with experienced scholars, we narrowed our focus to seven main components of the residential building system; namely, steel, cement, lime, gravel, glass, wood, and brick. The residential data list across different periods was calculated by years to obtain the average value, and the MIs were calculated according to the actual use of residential materials in Xi’an. Finally, the material use intensity coefficient of residential buildings in Xi’an in different years was determined.
3.2.3. Calculation of Material Stock
Combined with the obtained GFA and MIs, the total stock of various materials was calculated and summed (
Table 1). The stock of building materials in various urban areas over the years was determined using the following Formula (9):
where
is the total stock of residential materials
o in Xi’an in the year
t.
p is the quantity of materials.
o represents the seven material types, represented by their strength coefficients.
is the total residential area of any community in Xi’an in
t.
is the MI coefficient of residential buildings in year
t.
4. Results
4.1. Evolution of Residential Building Stock
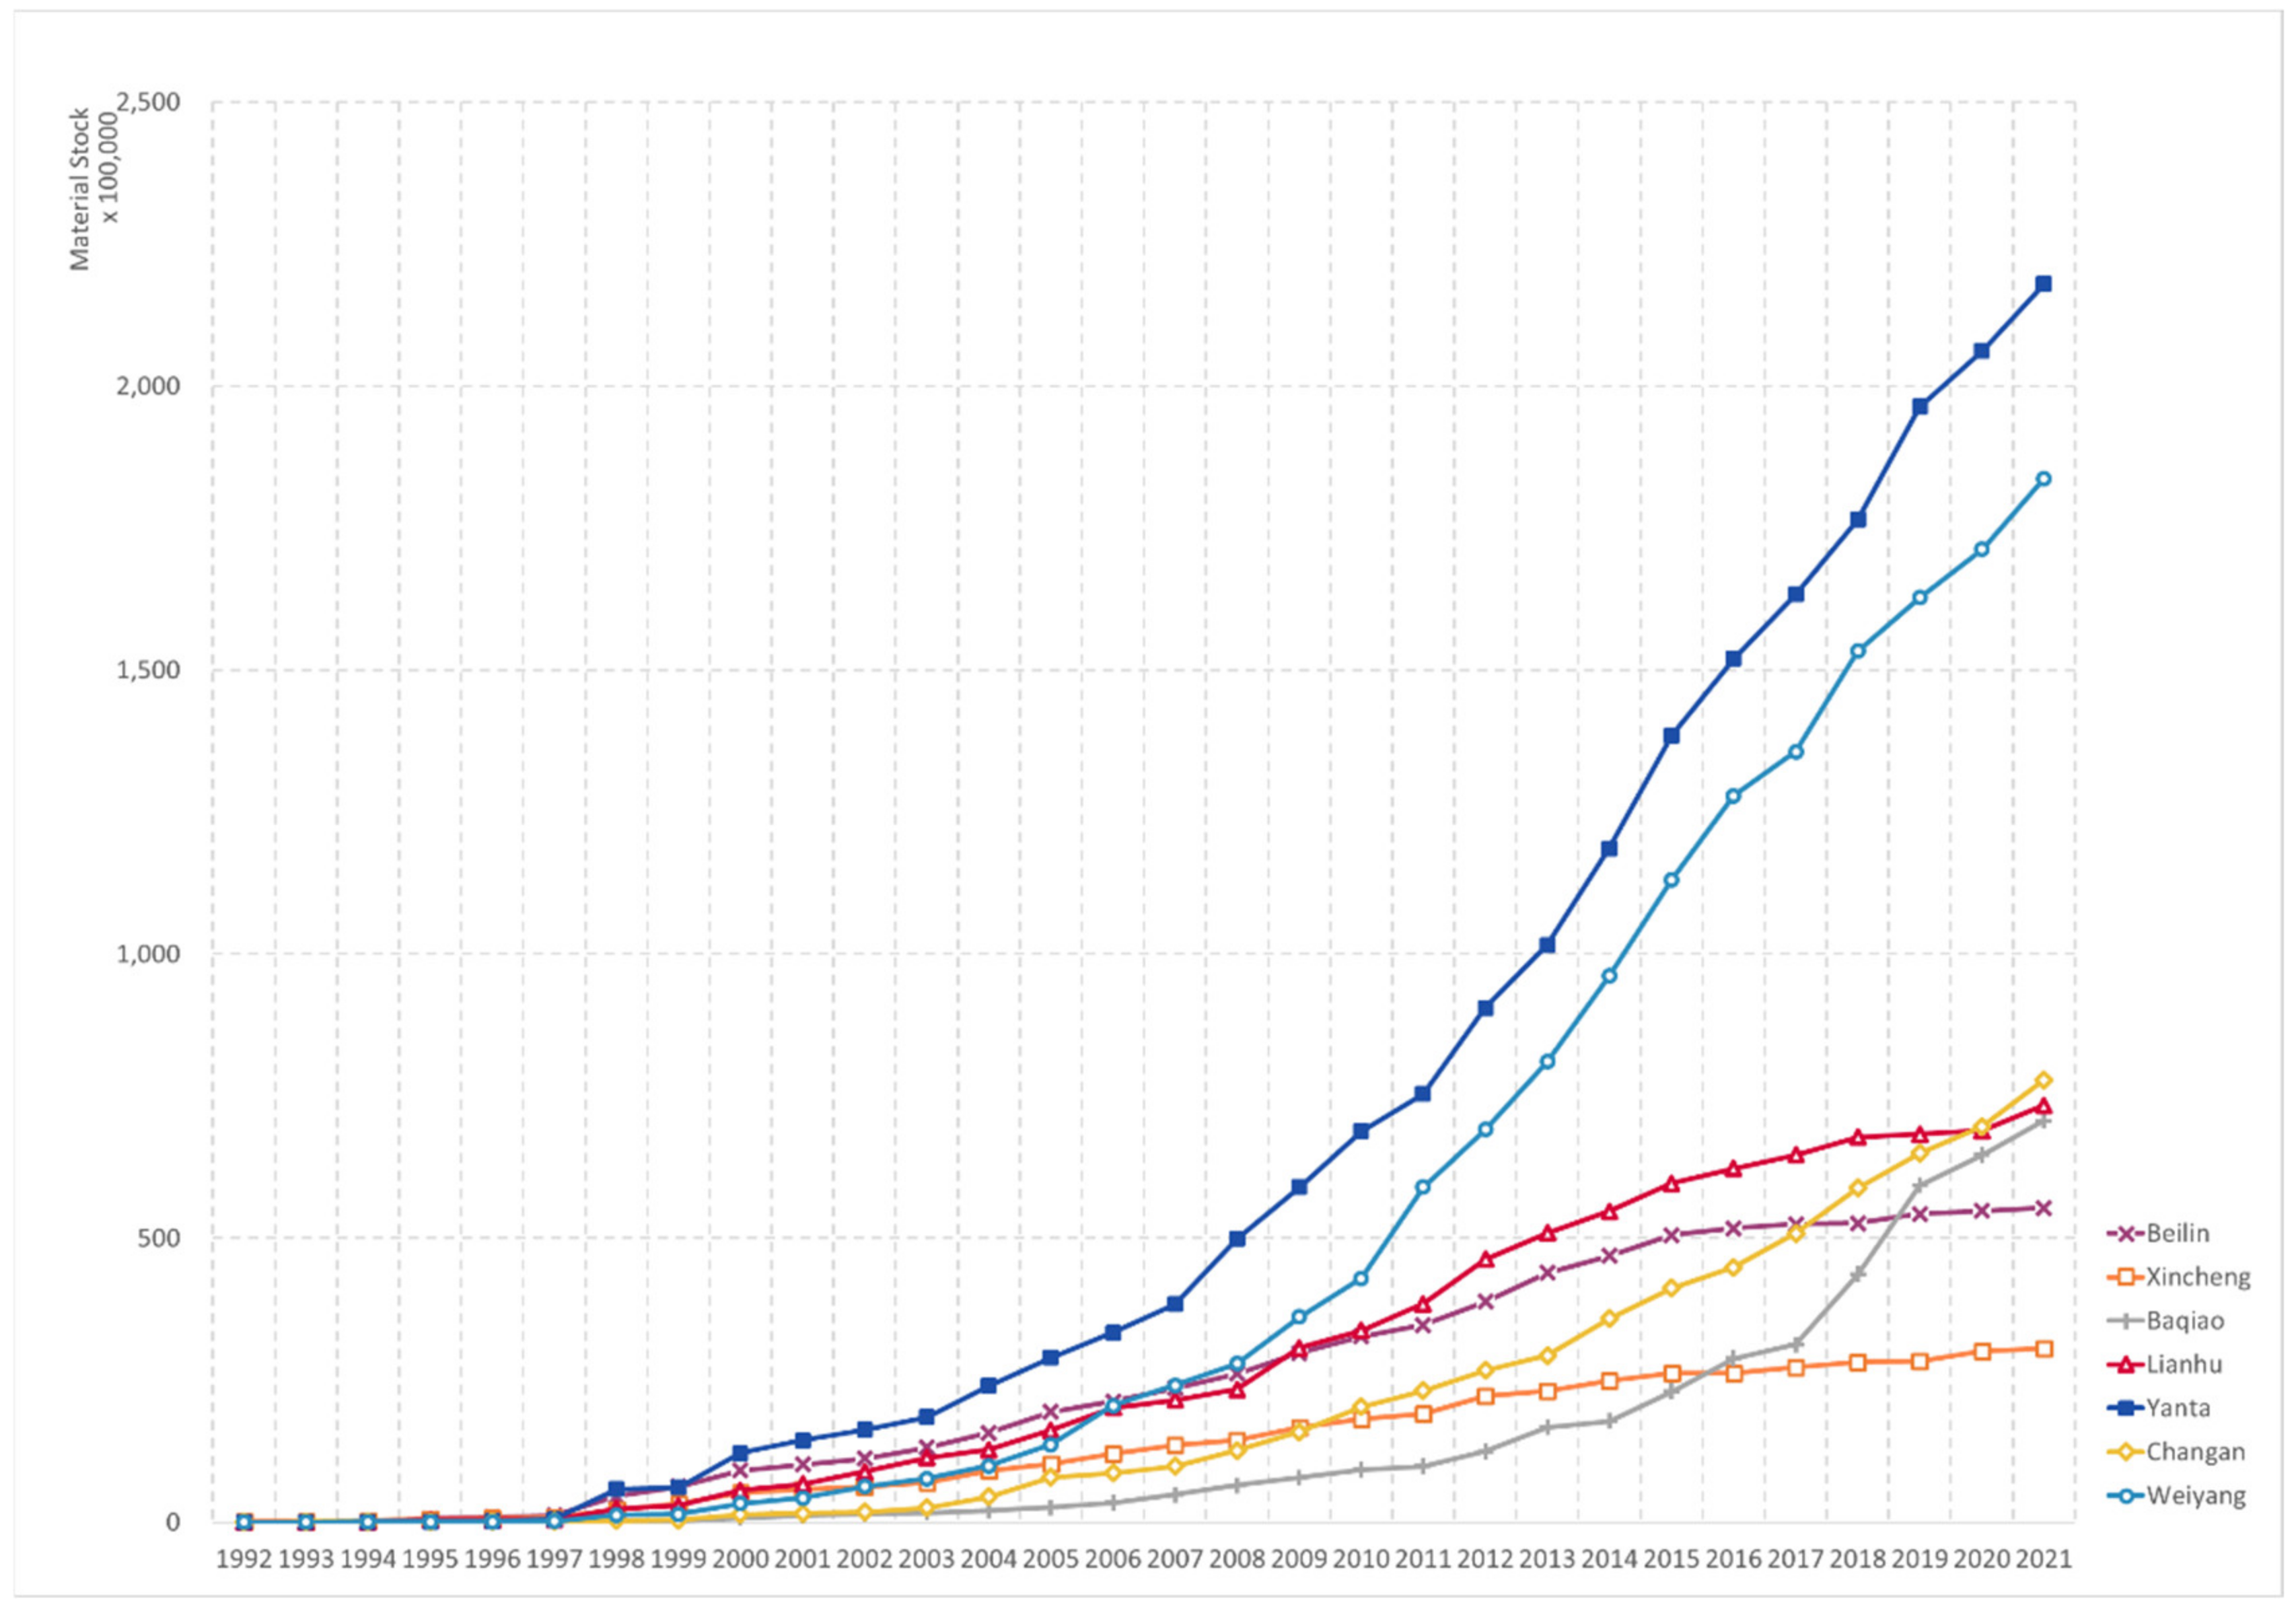
The material stock of residential buildings in the seven districts of central Xi’an was analyzed on an annual basis from 1992 to 2021.
Figure 2 shows the evolution of the material stock of residential buildings over time. As of 2021, the material stock of residential buildings in central Xi’an had increased 19-fold, equivalent to approximately 671.99 million tons of building material stock. Among the districts, Yanta District exhibited the greatest stock growth, accounting for 31% of the total growth. The growth of residential construction material stock in the new urban area was the least, accounting for 4.3% of the total stock growth. This paper primarily studied seven main residential building materials. During the study, the use of all materials demonstrated an increasing trend. Among the seven main building materials, gravel constituted the largest part, accounting for 52% of the total stock growth. Glass exhibited the smallest consumption, accounting for 0.17%, and the consumption of bricks was relatively stable.
The material stock of residential buildings in central Xi’an has been rising continuously from 1992 to 2021. Overall, the growth was divided into four stages. From 1992 to 1997, the growth rate of residential construction stock in each district was slow; from 1998 to 2007, the growth rate of residential construction stock in all districts began to accelerate, especially in Yanta Districts; from 2008 to 2015, the growth of residential building material stock was the greatest. After 2015, the stock of each district began to show a significant annual growth, whereas the growth of residential building material stock in Beilin, Xincheng, and Lianhu Districts tended to plateau after 2015.
In the three oldest urban areas of Xi’an, Beilin, Xincheng and Lianhu Districts, stock growth was less than that of other surrounding newly developed urban areas. Among the four newly developed and constructed urban areas, Weiyang and Yanta Districts had much higher stock growth rates than those of other municipal districts. Excluding the three oldest urban areas, the stock of urban areas is growing continuously.
4.2. Geospatial Characterization of Residential Building Stock
4.2.1. Spatial Agglomeration Characteristics
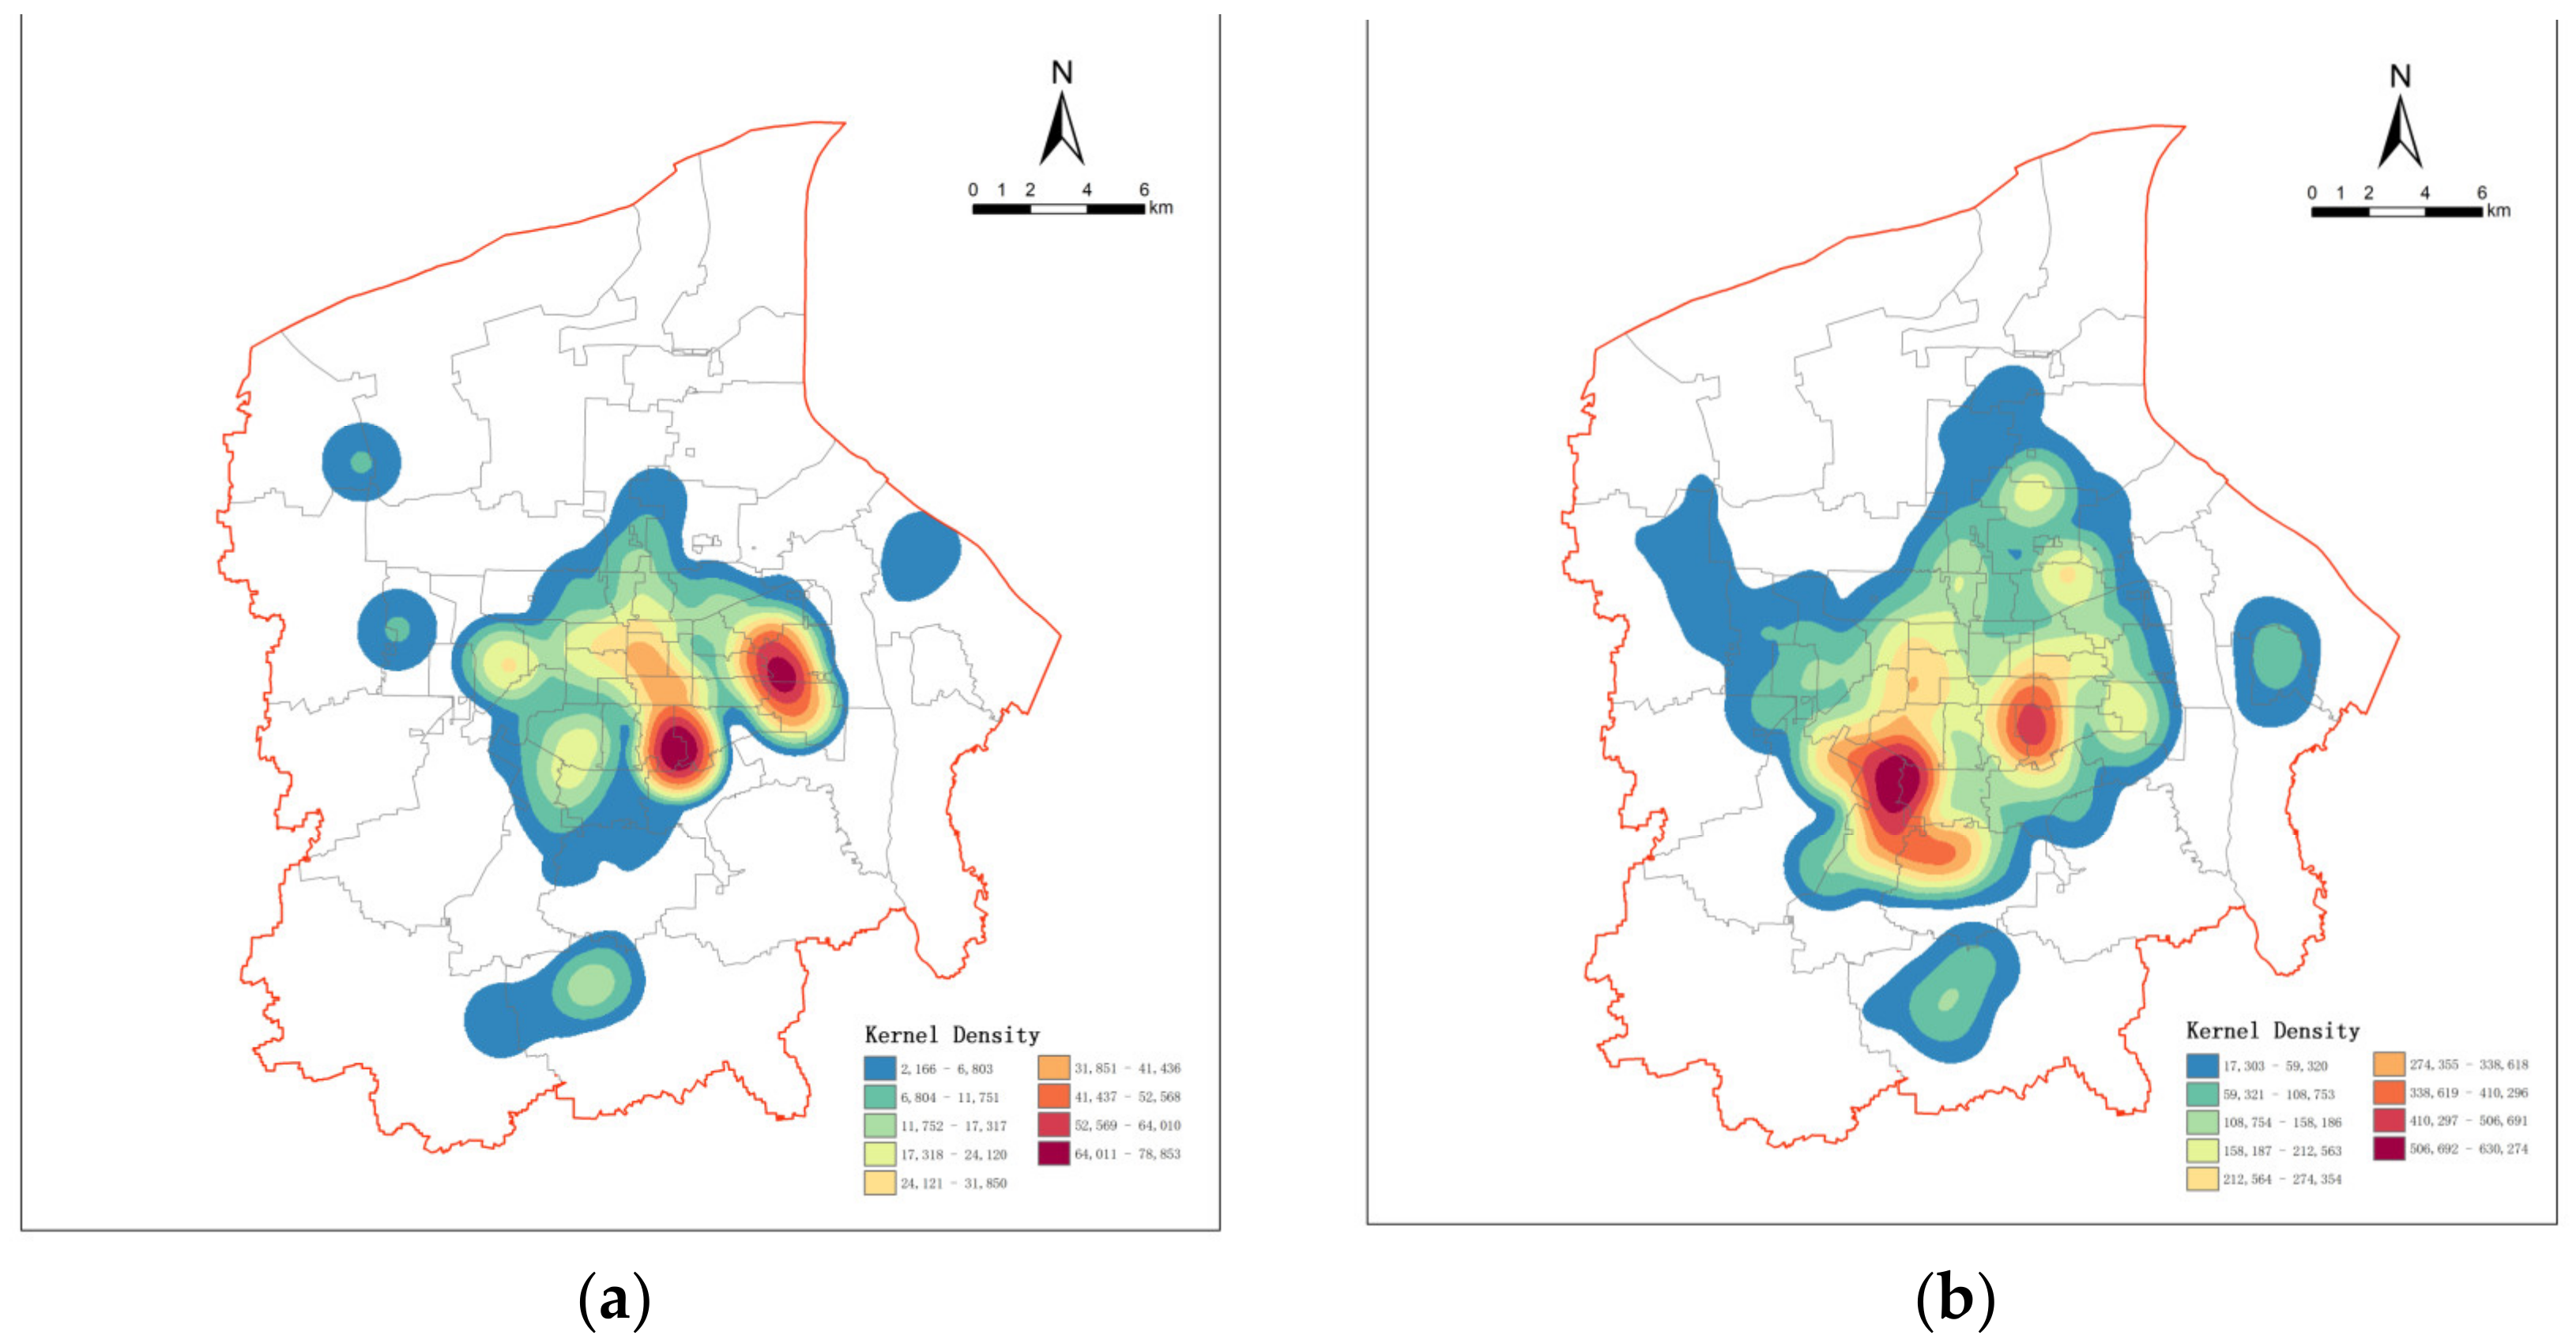
Looking at the different building ages in the datasets, and taking five years as the time period, we divided the data into the following time periods: 1992–1996, 1997–2001, 2002–2006, 2007–2011, 2012–2016, and 2017–2021. Using the kernel density analysis method as shown in Equation (1), the nuclear density of residential building material stock in six time periods was analyzed. Different nuclear density distribution patterns in six time periods showing the spatial agglomeration of residential building stock growth were revealed (
Figure 3).
According to the nuclear density analysis, the spatial growth and agglomeration characteristics of residential stock were distinct. Specifically, they showed multi-center agglomeration, and with the passage of time, the core agglomeration areas increased and spread from the city center to the surrounding areas. From 1992 to 1996, the core agglomeration areas of residential stock growth were next to the old urban areas, located southeast of the Yanta District and south of the Xincheng District. From 1997 to 2001, the core agglomeration areas of residential stock growth started to spread around the old urban areas, especially in Yanta and Weiyang Districts. The most important core agglomeration area is located in Xi’an Hi-tech Industries Development Zone, which is the new economic growth center of Xi ‘an. From 2002 to 2006, the core agglomeration areas of residential stock growth were located in the southern edge of Lianhu District, the new urban area, as well as the high-tech zone of Yanta District. Yanta District had the largest number of core agglomeration areas. The construction of the university town in Chang’an District has led to the expansion of material stock in the south of the city. From 2007 to 2011, the core agglomeration areas of residential stock growth were located near the Metro Line 2 in Weiyang District as well as near the new urban area and Yanta District; of these, Yanta District had the largest number of core agglomeration areas. From 2012 to 2016, the core agglomeration of residential stock growth was located in the Chanba ecological area in Weiyang District, the university town in Chang’an District, and the Qujiang area in Yanta District. The northward movement of the administrative center in Xi’an has significantly expanded material stock to the northern Weiyang District. From 2017 to 2021, the core agglomeration areas of residential stock growth were relatively scattered. The density of residential building material stock agglomeration areas in Weiyang, Baqiao, and Chang’an Districts was increasing, whereas that in the three old urban areas in the city center was decreasing. These core agglomeration areas tend to require more building materials and consume more energy. Therefore, these areas deserve more attention from resource managers and urban ecologists in the future. In the later chapters of this article, we focus on the spatial distribution characteristics of residential building stock in core agglomeration areas and the surrounding development and construction, as well as provide a classification and summary.
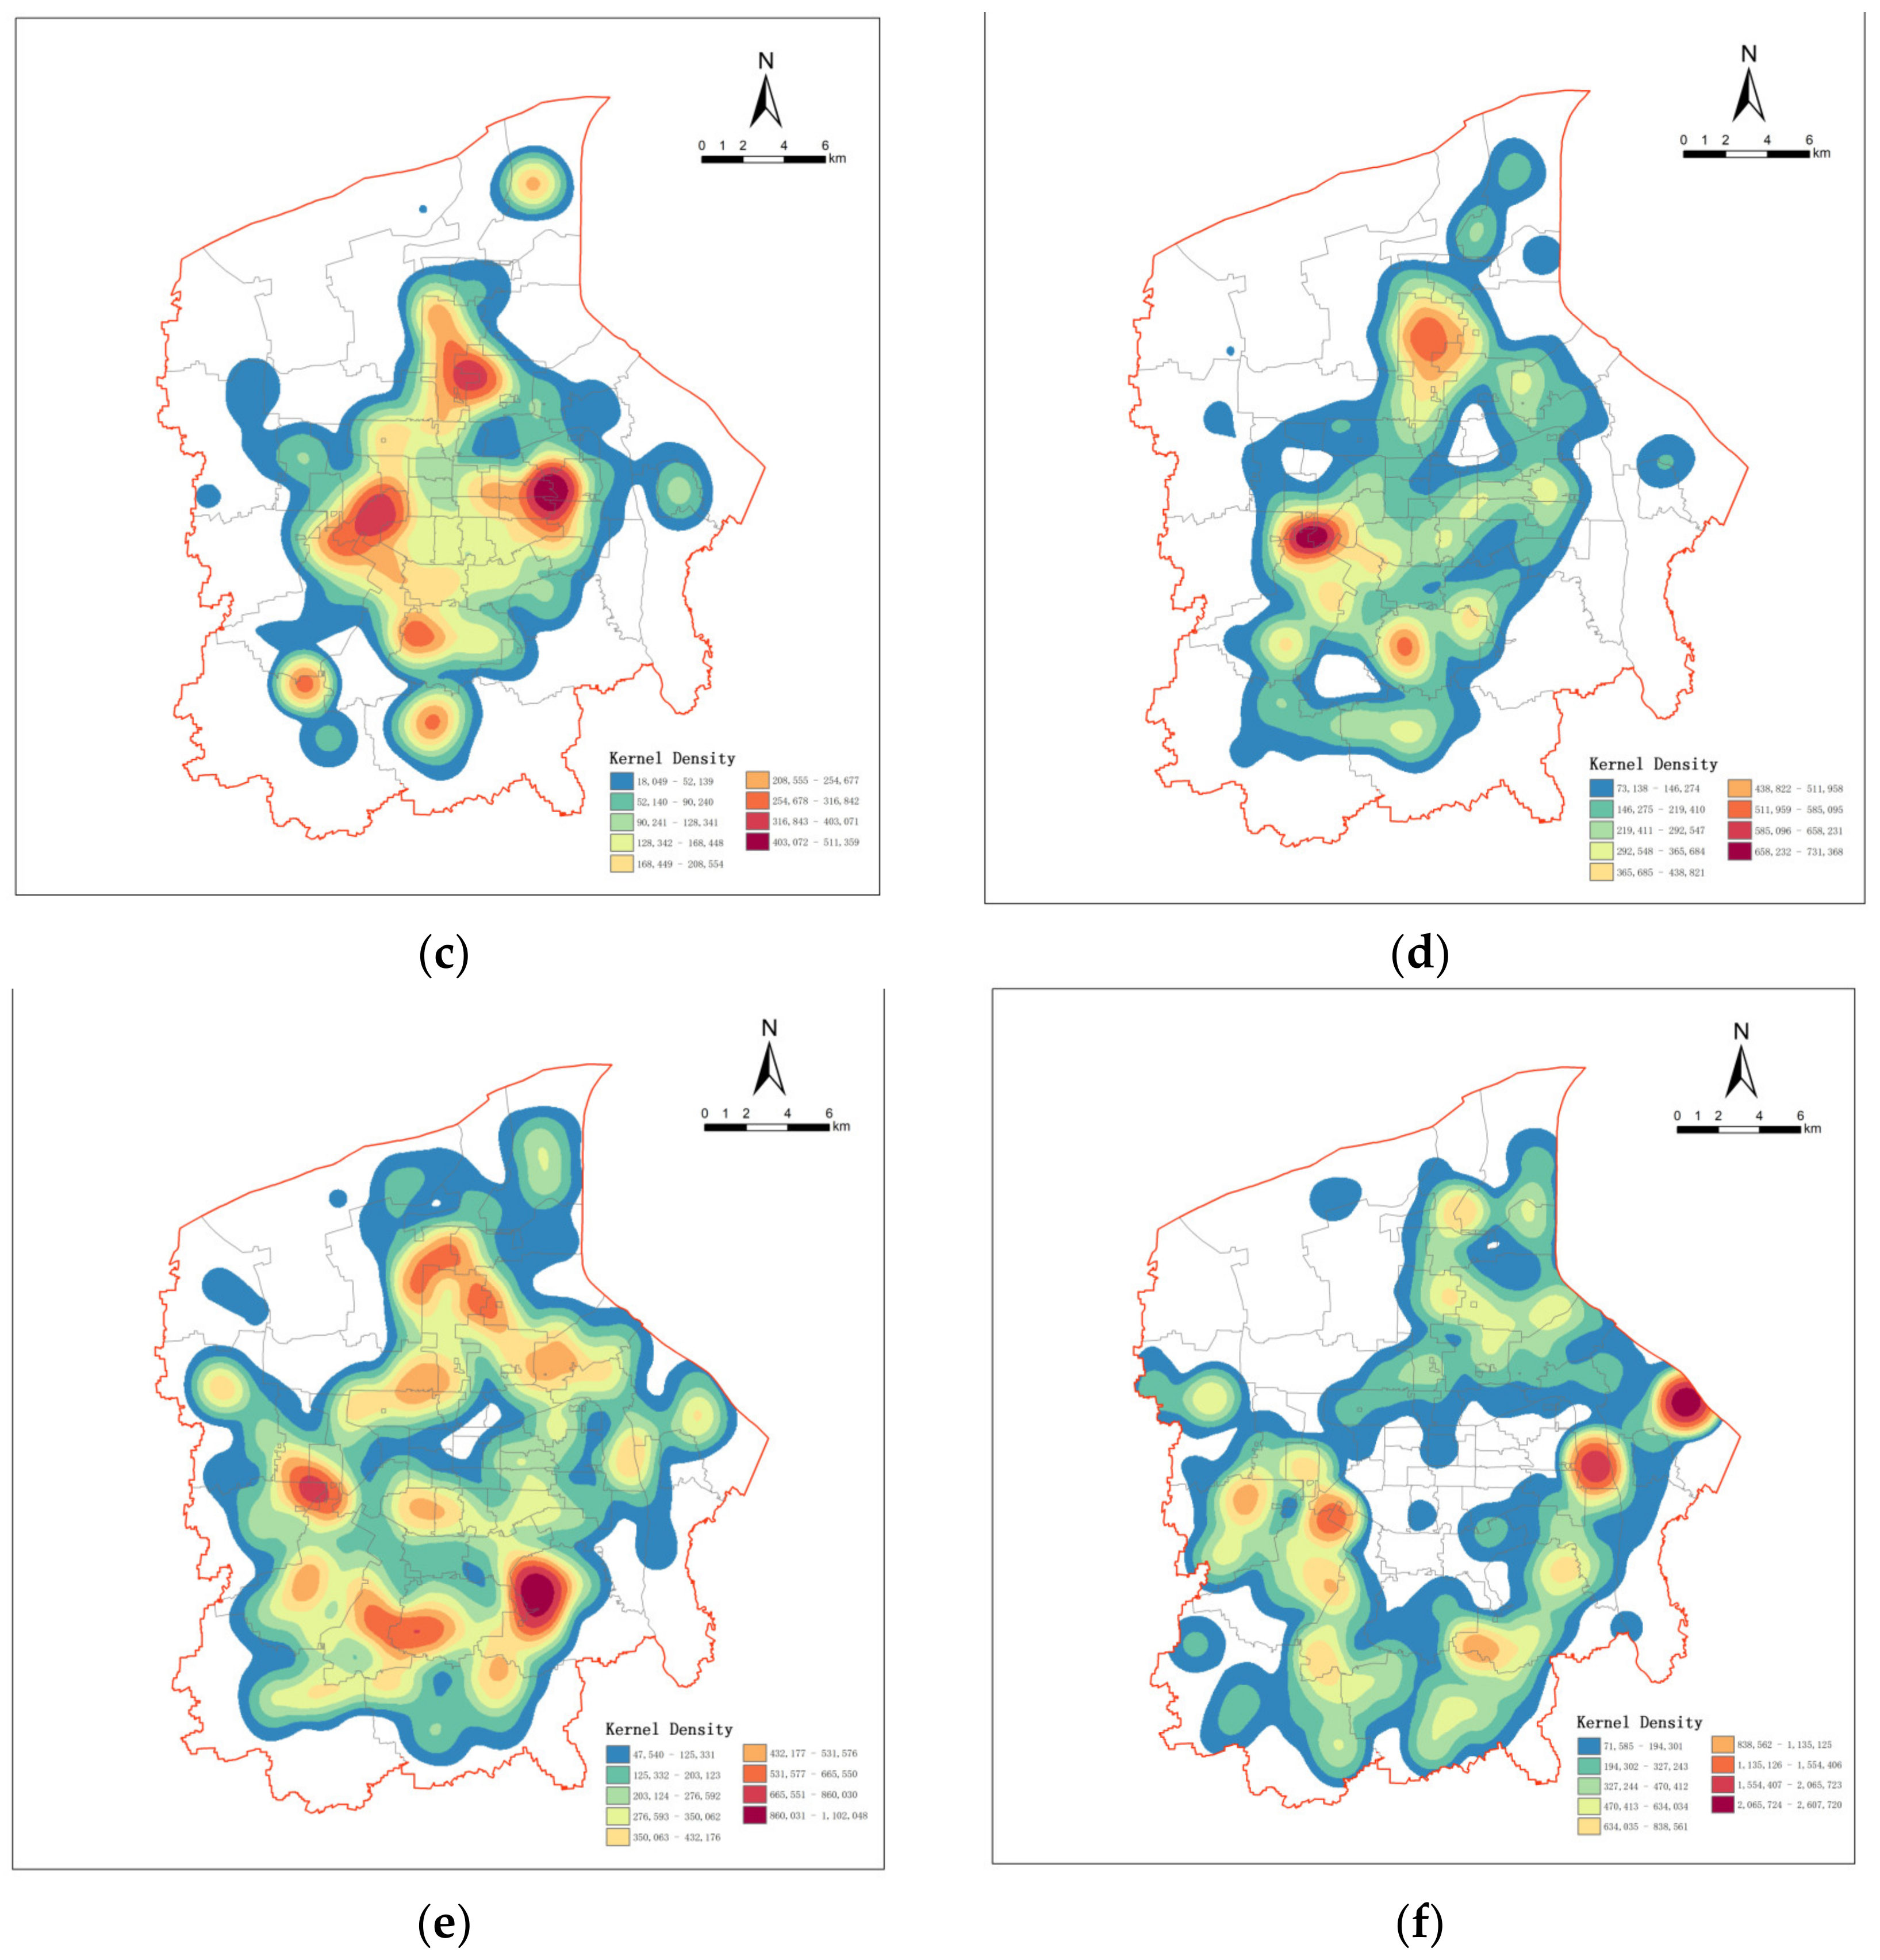
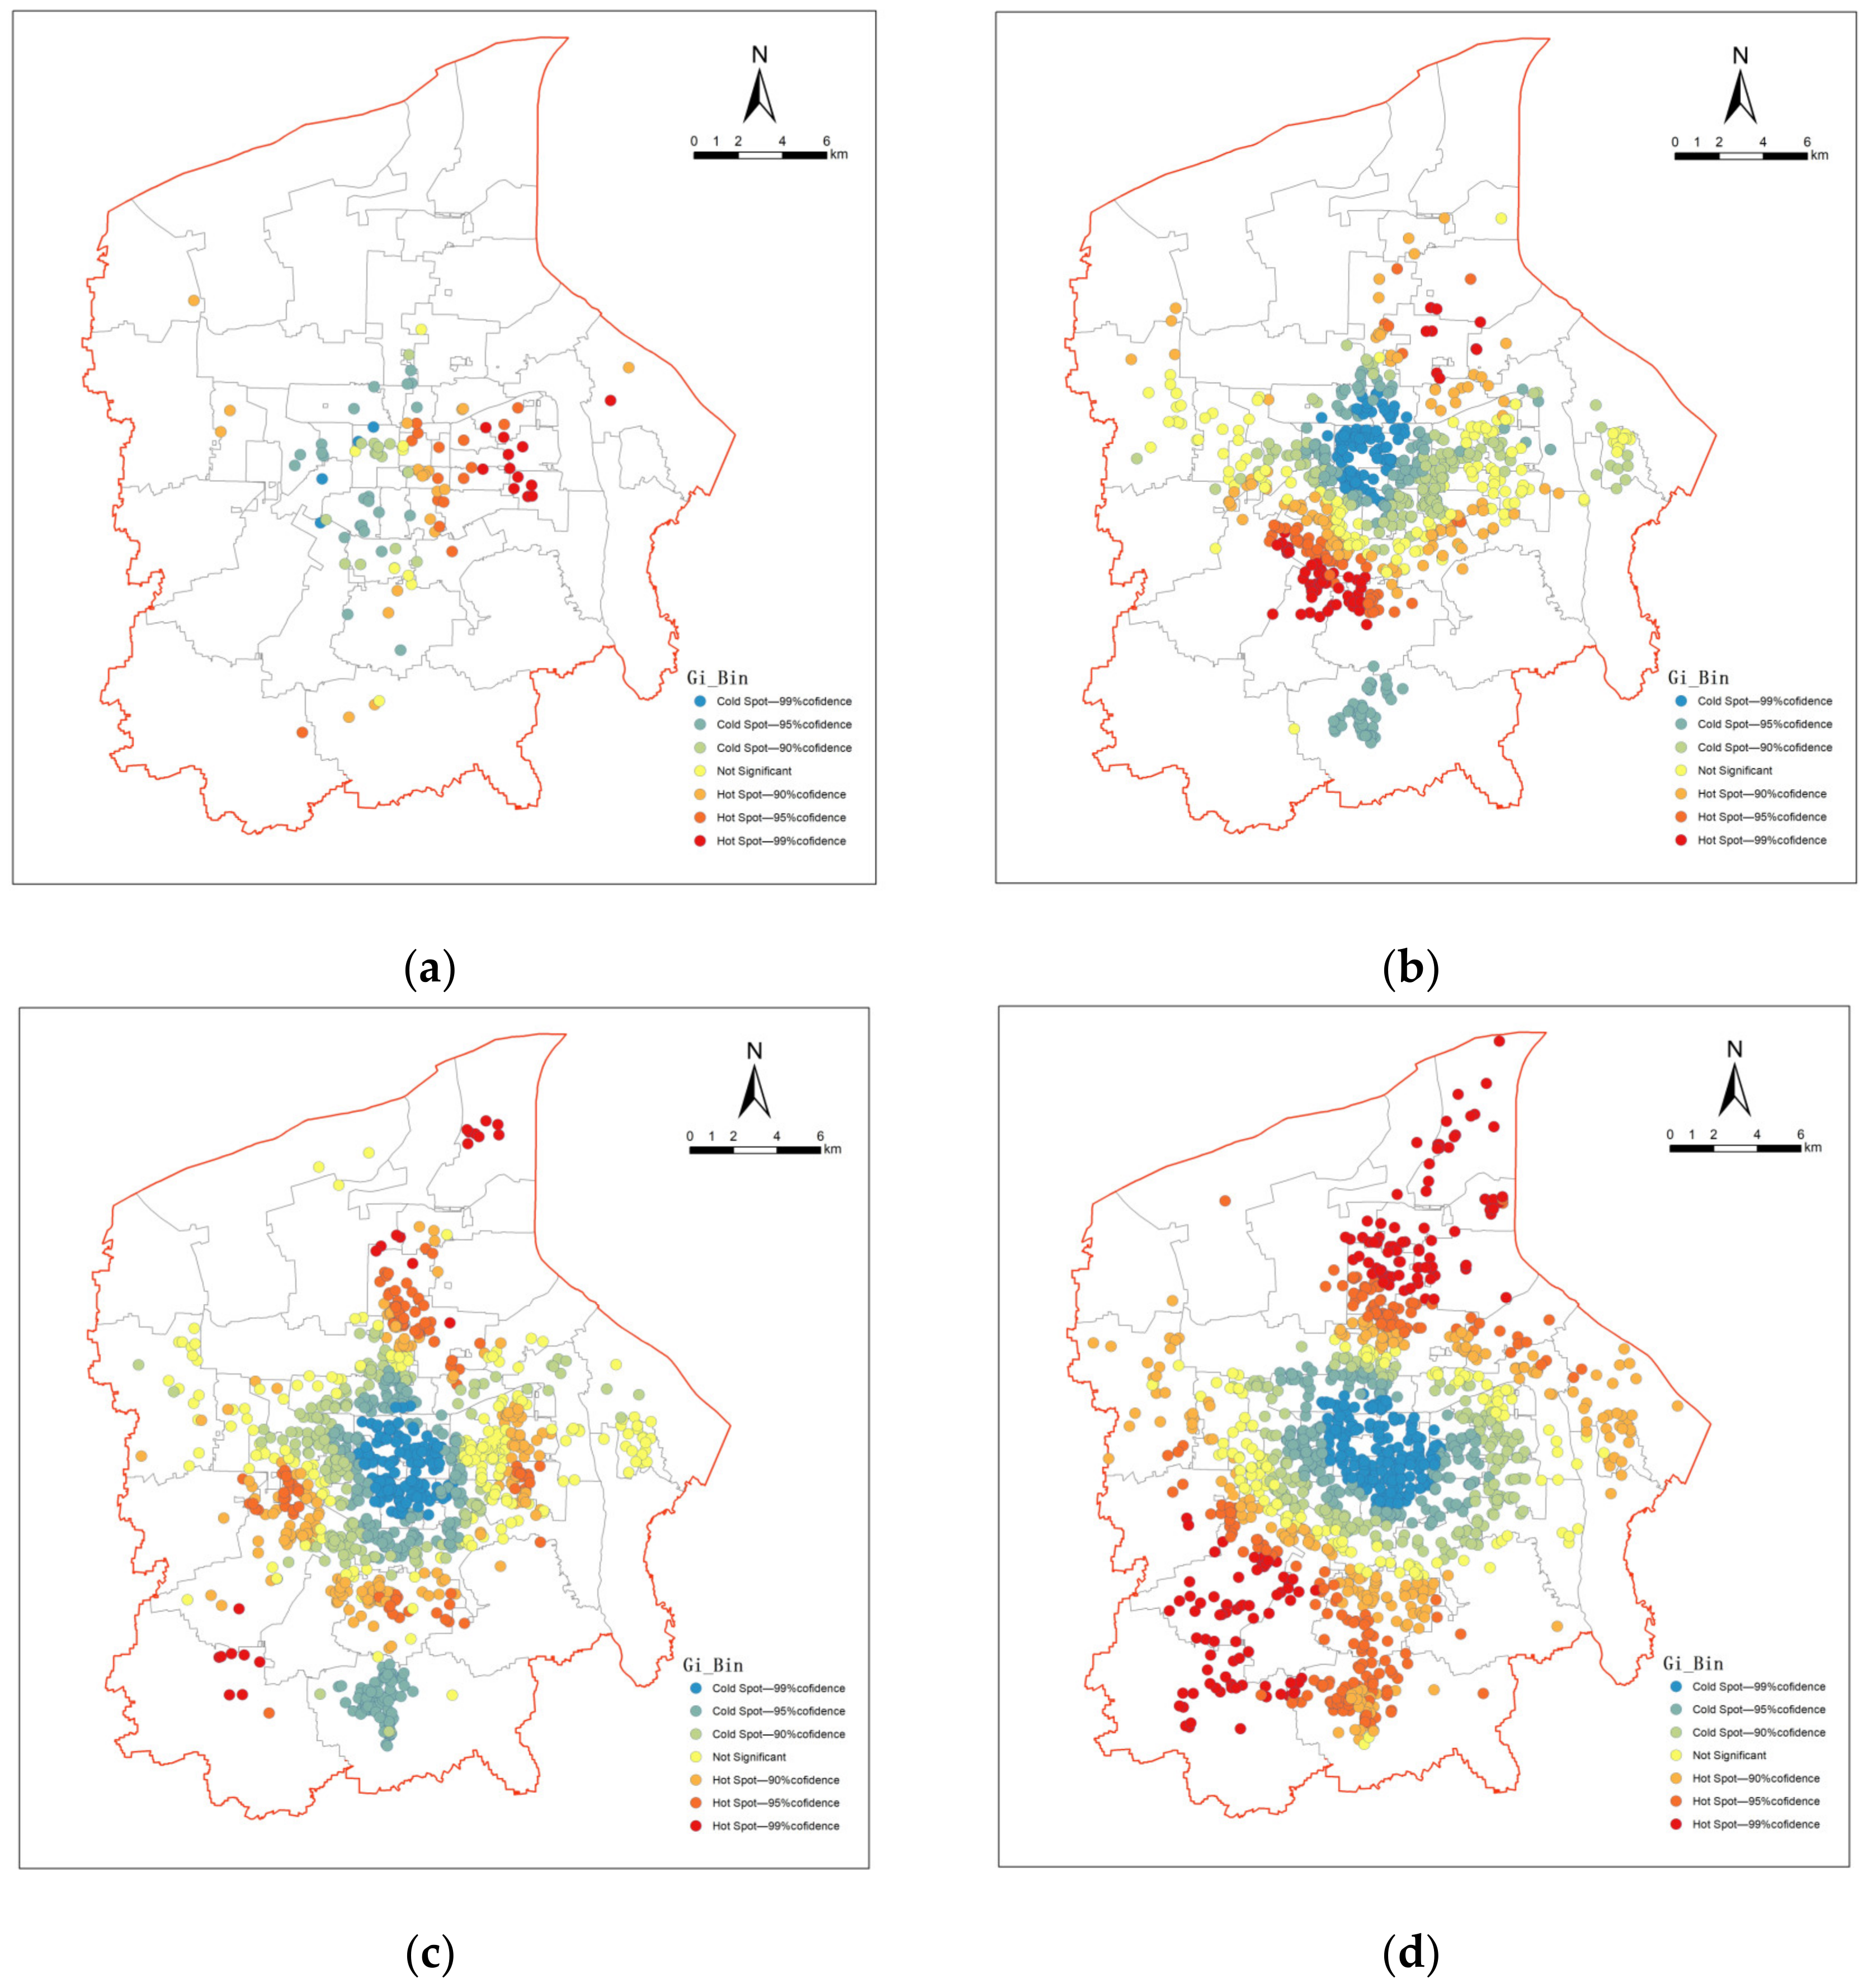
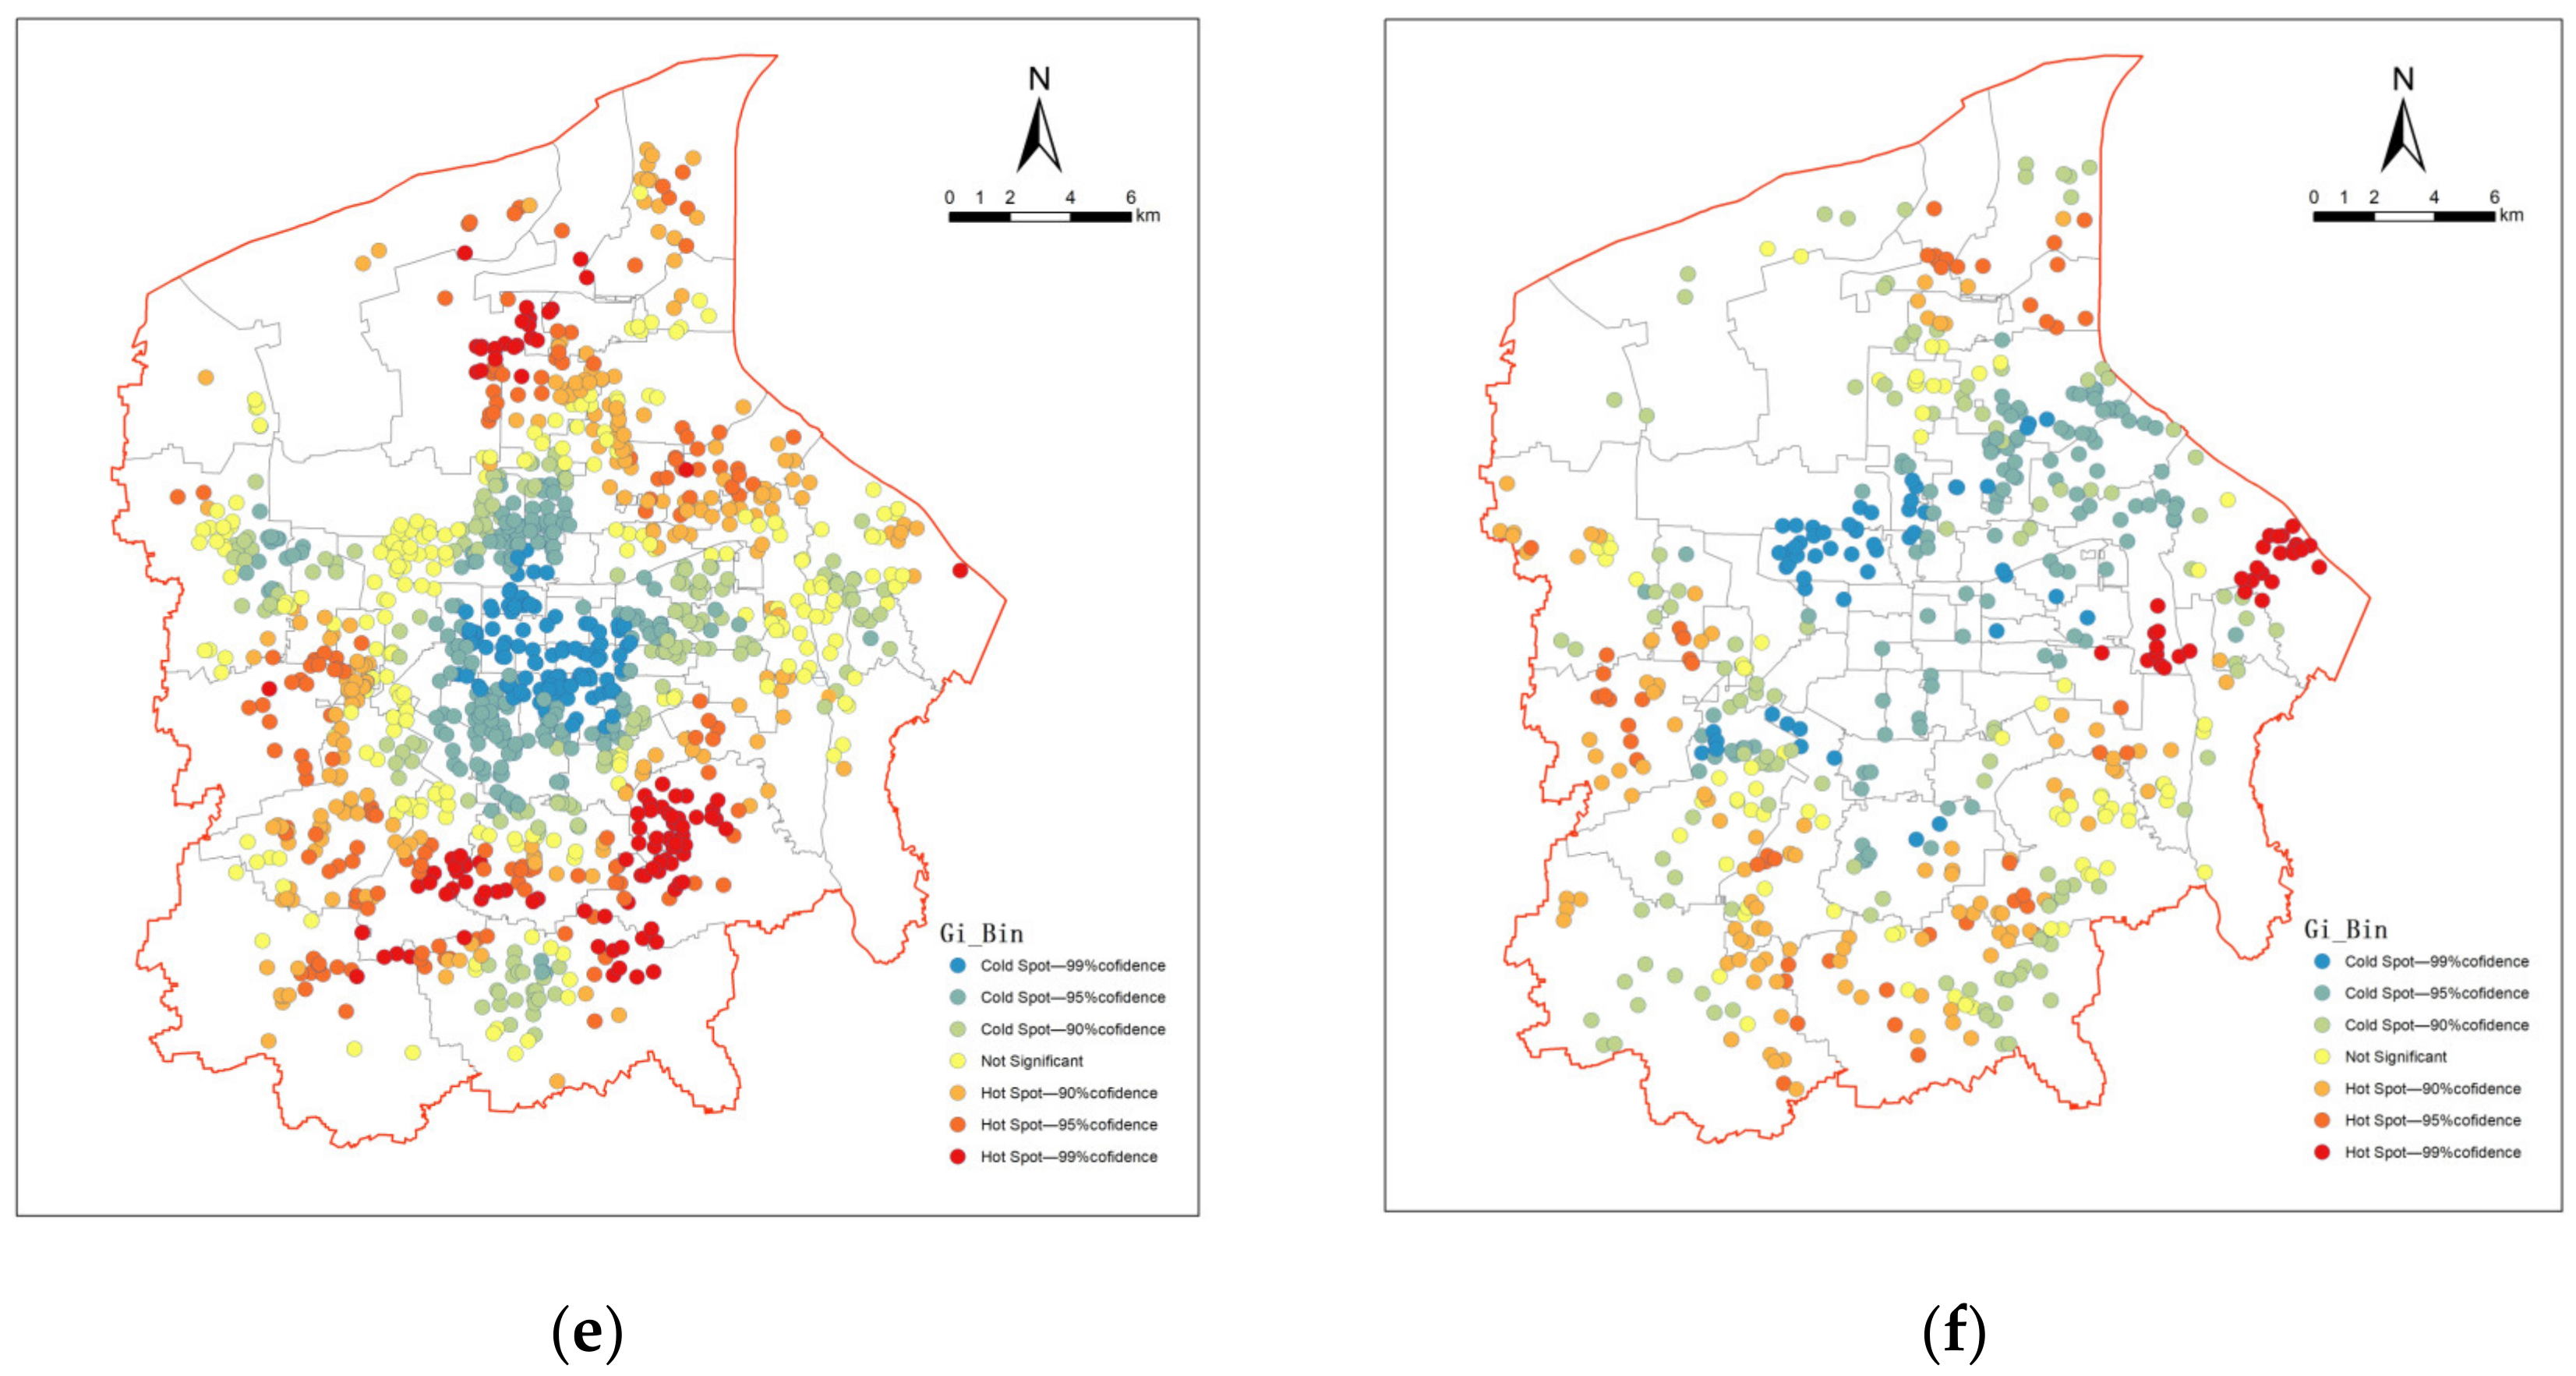
Hot spot analysis is generally used to identify spatial clustering of high value (hot spot) and low value (cold spot), as shown via statistical significance. The calculation method is shown in Equation (2). Based on ArcGIS10.2, the GETIS OrdGi* tool in the mapping cluster toolset, analyzed the hot spots of residential building material stock in six time periods, and its distribution pattern (
Figure 4).
The hot spot analysis of the residential building stock in central Xi’an clearly showed that the distribution of hot spots increased with an increase in building stock over time. This result is indirectly indicative of the development speed and expansion direction of urban areas.
Figure 4 shows the hot spot distributions of residential buildings in central Xi’an across different periods. With the acceleration of urbanization in Xi’an, the number of hot spots of residential building stock distribution has increased significantly. The growth hot spots of residential building material stock are concentrated in the periphery of the central area, that is, the boundary of urban growth, and this growth is increasing with the expansion of the central urban area. As the core of Xi’an, the old urban area has always been the growth cold spot of residential building material stock. Yanta and Weiyang Districts have been the main districts responsible for the growth of residential building stock since 1992. After 2016, the core agglomeration areas of centralized growth of material stock were relatively scattered and spread to the surrounding Baqiao and Chang’an Districts. This shows that since the beginning of this century, the construction of residential buildings has been characterized by an expansion from the center to the periphery; however, with respect to the center of the city, development has gradually slowed down. The development of residences is often interlinked with surrounding public service facilities (e.g., transportation), the level of economic development, and other urban factors. Therefore, the characteristics of residential building stock growth gathering outside the old city also indirectly reflect the main direction and rule of outward urban expansion in Xi’an and the spatial transfer of central urban development.
4.2.2. Expansion Trend of Material Stock in Spatial Distribution
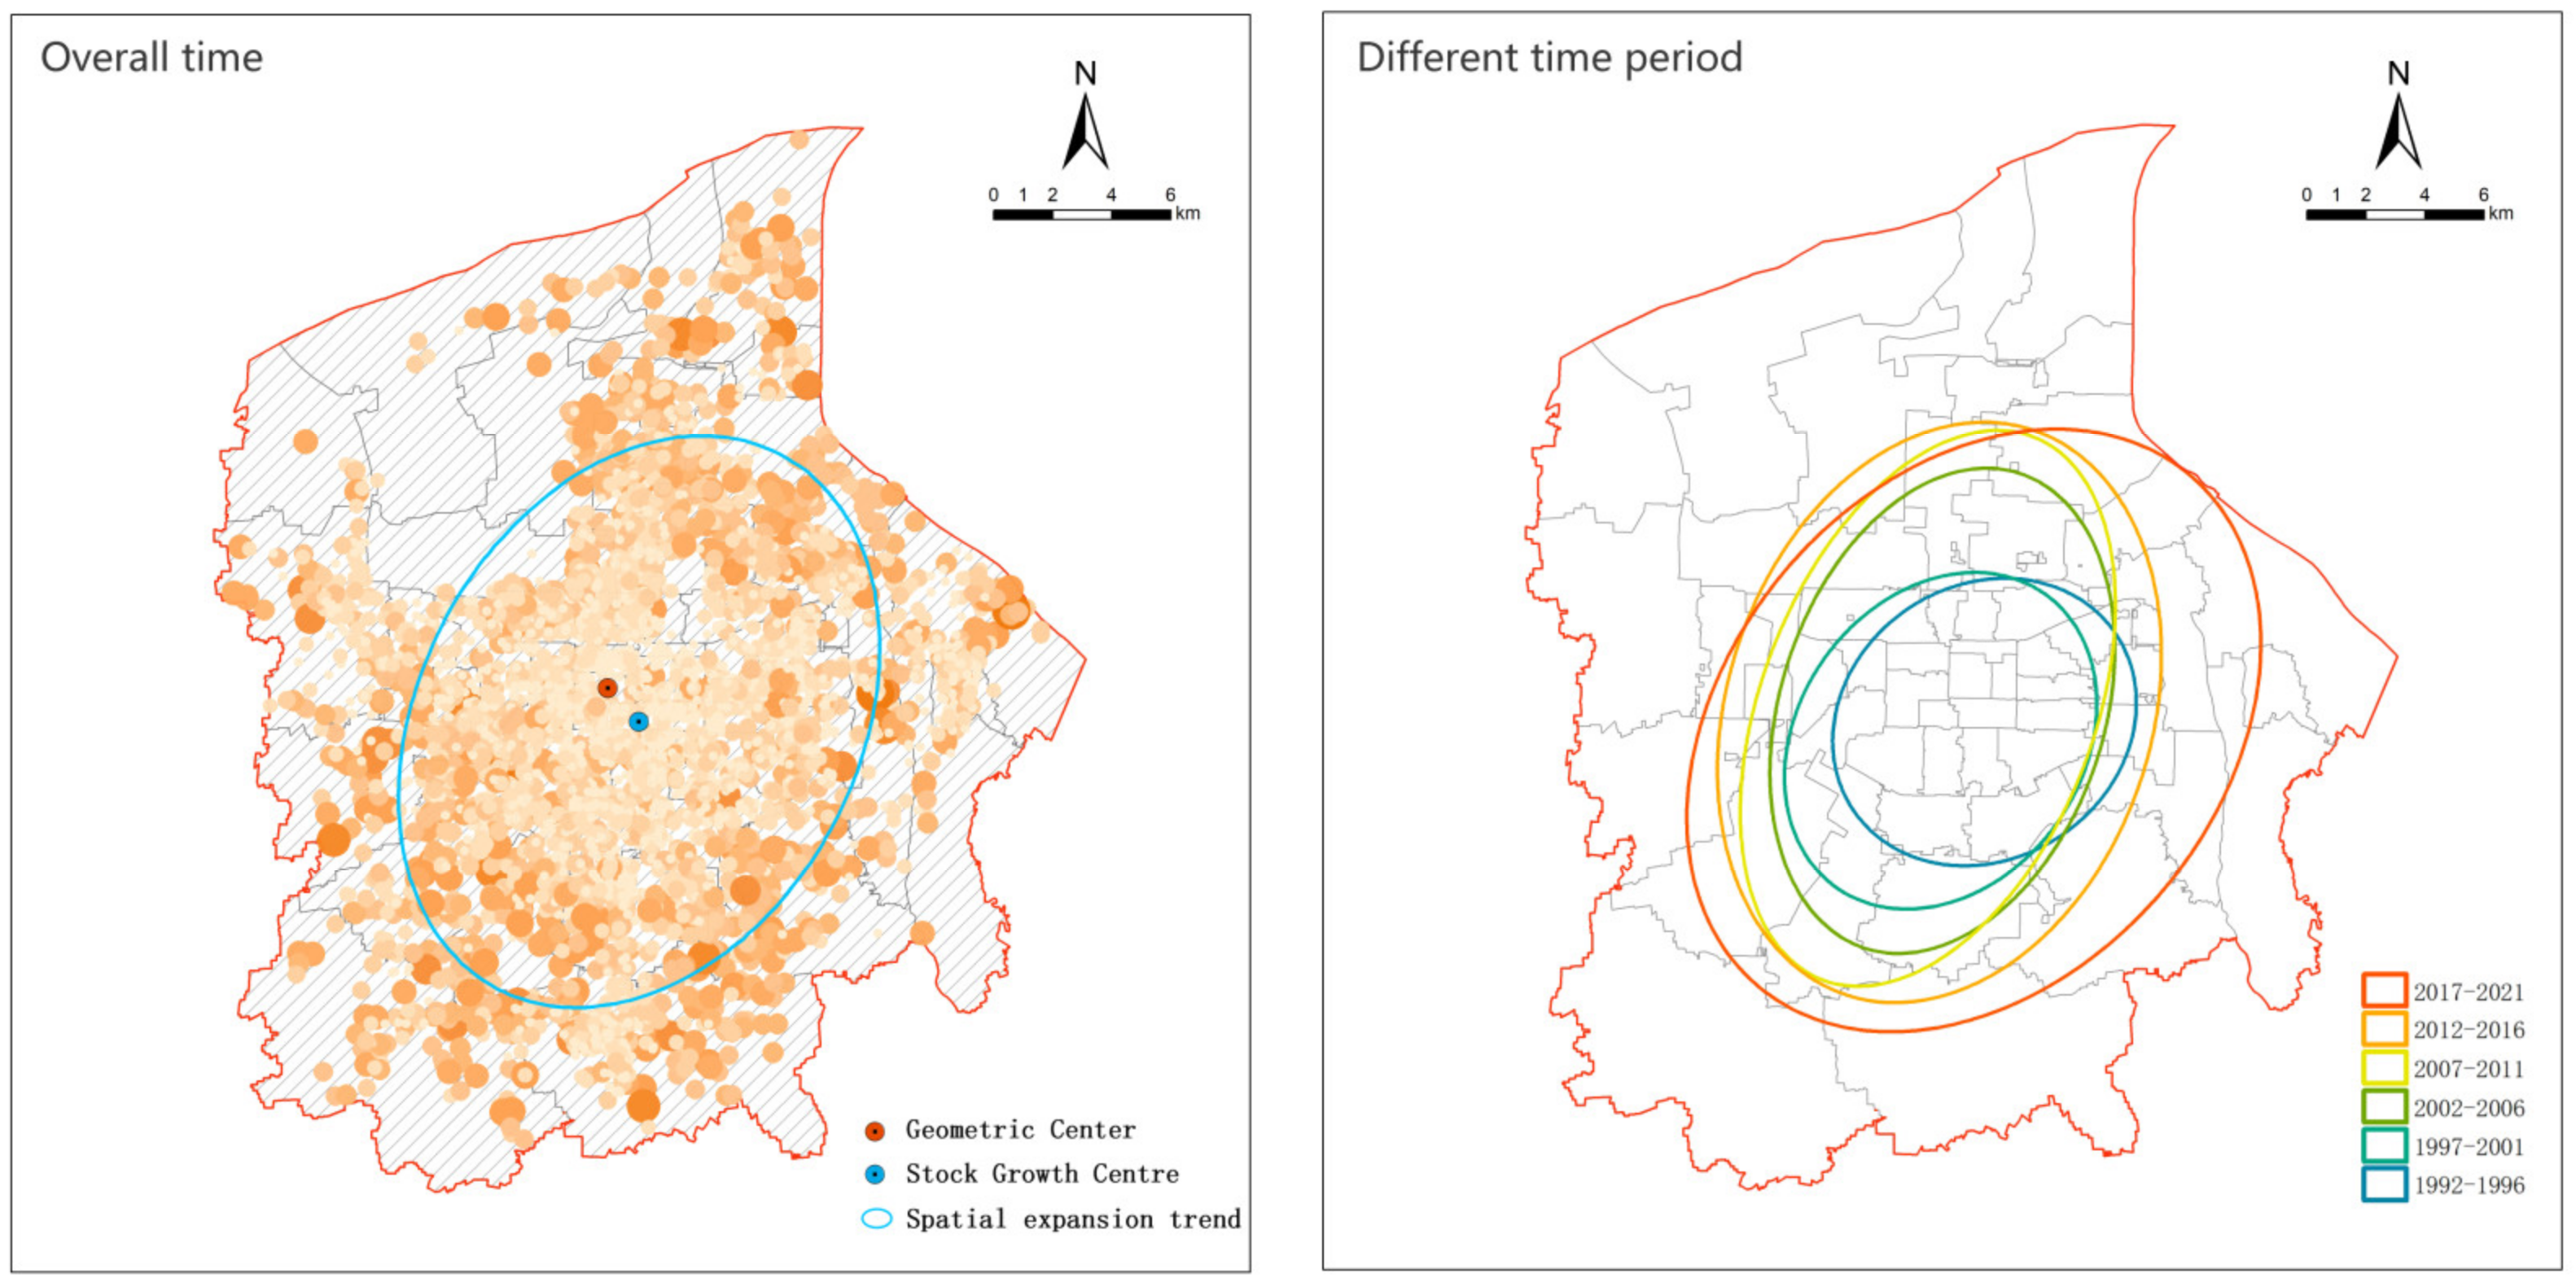
The standard deviation ellipse is one of the most important methods used to analyze the direction of spatial distribution. The size of the ellipse reflects the concentration of the overall elements of the spatial pattern, and the deflection angle reflects the dominant direction of the overall pattern (Equations (3)–(7)). The standard deviation ellipse can be used to analyze the spatial expansion trend and development direction of a residential building stock (
Figure 5). The results show that the growth of residential construction stock had an apparent directionality in space, primarily in the northeast–southwest direction. From 1992 to 2016, the distribution direction of residential building stock gradually rotated from northeast–southwest to north and to south. The elliptical distribution range, especially the major axis of the standard deviation ellipse in the north–south direction, gradually expanded, indicating that the stock expansion in the north–south direction was distinct. After 2017, the distribution direction of residential building stock returned to the northeast–southwest direction, and continued to expand. It is speculated that the rapid development of Qujiang New Area and Chanba District during this period has promoted the construction of residential buildings.
Combined with the spatial agglomeration characteristics of residential stock, it can be concluded that the residential construction material stock in Xi’an primarily expanded to Weiyang and Baqiao Districts in the northeast and Yanta and Chang’an Districts in the southwest. The center of the residential stock growth deviated from the southeast direction of the geometric center, by a straight-line distance of only 1.9 km. The geometric center and the center of stock growth did not coincide in space, but the distance was not so long. This verifies the imbalance in the spatial distribution of residential building material stock.
4.3. Driving Factor Analysis
The change in urban residential building material stock is a comprehensive reflection of the evolution of the spatial layout and structure in the process of urbanization, which are restricted by factors such as policy factors, natural conditions, and socioeconomic development, and is the result of the joint action of multiple factors. Therefore, referring to relevant literature and statistical yearbook data, this study discusses the driving factors of the growth of residential building material stock in the central urban area of Xi’an, within the context of socioeconomic and traffic-related factors.
4.3.1. Socioeconomic Factors
Socioeconomic factors have always been considered to be closely related to the material stock in a city. For example, Fishman et al. studied the stock dynamics related to population and economic drivers in Japan [
20]. This analysis provides a case study to illustrate how socioeconomic drivers and stock accumulation interact and change as a country matures. As one of the core cities in the western region, Xi’an has a large urban population, especially in its central urban area, which has a relatively high level of development. With the growth and agglomeration of populations, the demand for residential space increases. At the same time, the development of cities and the expansion of space are inseparable from the development of the social economy. GDP can best represent the economic development level of a city or region. Therefore, this study primarily analyzed population, GDP, and socioeconomic factors to explore whether the growth of residential construction stock in the central urban area of Xi’an was closely related to the growth of the regional population and economy.
We observed that from 2000 to 2018, the stock of residential buildings, GDP, and population expanded by 11.2, 11.19, and 1.6 times, respectively. The average annual growth rate of residential construction stock was 14.35%; the average annual growth rate of GDP was 14.36%; and the average annual growth rate of population was 2.73%. The residential construction stock, economy, and population in the study area showed a growth trend, in which the growth rate of the economy and material stock were similar and much higher than that of population.
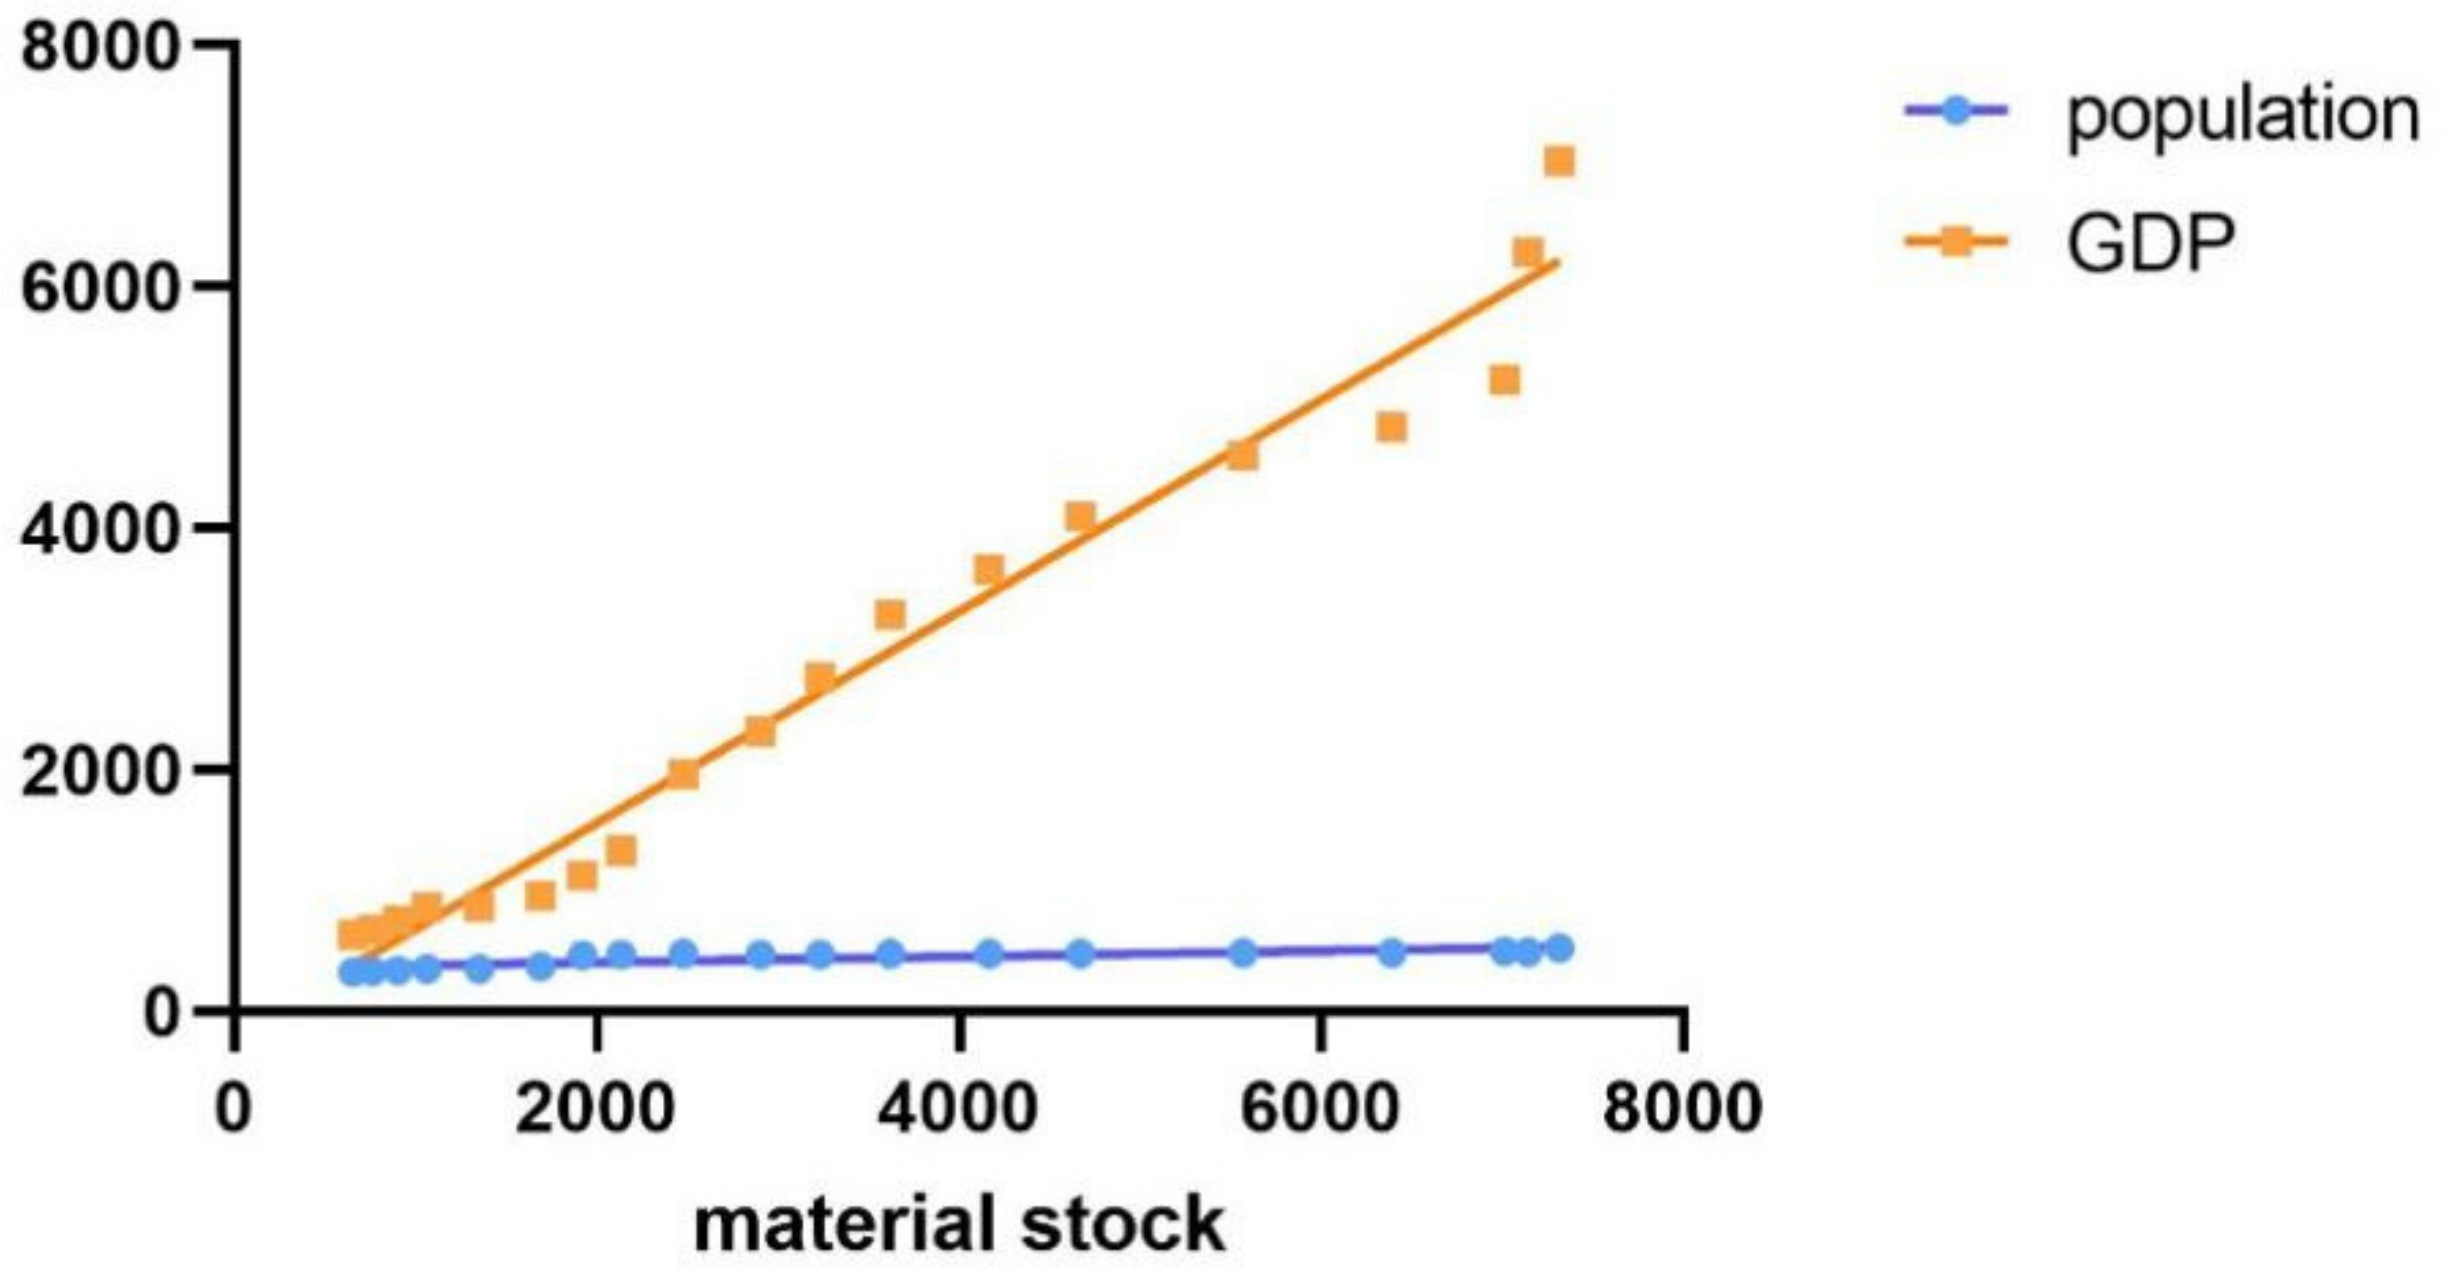
Multiple linear regression analysis was conducted in the study on the cumulative data of residential construction material stock in the calendar years 2000–2018 and the population and GDP data in the corresponding years. The following scatter plot (
Figure 6) and regression model (
Table 2 and
Table 3) were obtained.
According to
Table 1 and
Table 2, R = 0.986, R
2 = 0.97, the fitting degree was good, with a significance of <0.005, and the sample passed the significance test with the significance being high. Overall, this proves that the growth of residential building stock in the central urban area of Xi’an had a strong correlation with population factors and GDP. The observation shows that when the GDP reached a certain level, the increase of residential building stock slowed down gradually. This is indicative of the dependence of economic development in the central urban area, development of stock space, and that land development gradually weakened over time. Xi’an is not only a hub city in Western China, but also an internationally famous tourist city. It is one of the cities with the most concentrated key colleges and universities in China. The floating population in Xi’an accounts for a large proportion of the whole population. They are a group of people who reside in a given city for a certain amount of time and for various reasons, but are not considered part of the official census count. Among the population dynamics impacting trends seen in this city, its floating population is one of the most important factors. However, it has not been assessed in this study; and it should be considered in future studies.
In addition, national policies can effectively guide and control the development direction and intensity of cities to a certain extent, and promote their sound development. In 2000, the leading group for the development of the western region was established and began its work. In 2006, the Eleventh Five Year Plan for the development of the western region was reviewed and approved. In the central area of Xi’an, with the continuous accumulation of people and the expansion of urbanization, the demand for housing has increased. The material stock of residential building has coincidentally become the inflection point of rapid growth at two time nodes, 2000 and 2006. In 2013, China proposed the construction of the Silk Road Economic Belt. Xi’an, as the starting point of the Silk Road and one of the core cities of the economic belt, has received great development support and opportunities. After 2013, the material stock of residential buildings in Xi’an has maintained a high growth rate. In 2016, Xi’an issued a notice on further strengthening the regulation of the real estate market, namely via the “purchase restriction order”, which limits the number of people buying houses. The purchase restriction order has caused the contraction of housing demand and affected the redevelopment of land in the real estate industry. Since 2016, the growth rate of residential intensity in the central area of Xi’an has slowed down. In 2021, China proposed the outline of the ecological protection and high-quality development of the Yellow River basin, including Xi’an. The plan proposes to prevent the disorderly expansion of the city and promote the control of urban scale, and improve the quality of development of the major cities along the Yellow River. In the future, the expansion of Xi’an’s material stock will also be affected in space. In the context of the increasingly obvious land tightening situation in Xi’an, the policy of restraint has not completely restricted the growth of urban residential building stock, indicating that there is still a demand for residential buildings in Xi’an. Therefore, simply to protect resources and environment, it is difficult to reduce the input of residential materials. While reducing the pressure of urban resources and environment, it is necessary to strengthen the use efficiency of residential materials and material utilization, which is one of the feasible ways to achieve urban decompression and sustainable development.
4.3.2. Road Traffic Factors
Road traffic is one of the factors fueling continued urbanization and its expansion, which often directly affects the direction of urban development. Through the statistics of road traffic data in Xi’an (
Figure 7 and
Table 4), The total number of roads in Xi’an is increasing year by year, but the rising rate is gradually slowing down. In general, the total mileage of urban roads in Xi’an gradually increased from 1834.54 km in 2000 to 3966.47 km in 2020, and the growth rate was 61.44% in 2000–2010, higher than the 33.93% in 2010–2020; The total area of urban roads has gradually increased from 22.2187 km
2 in 2000 to 62.8331 km
2 in 2020, and the growth rate from 2000–2010 was 105.46%, far higher than the 37.64% in 2010–2020.
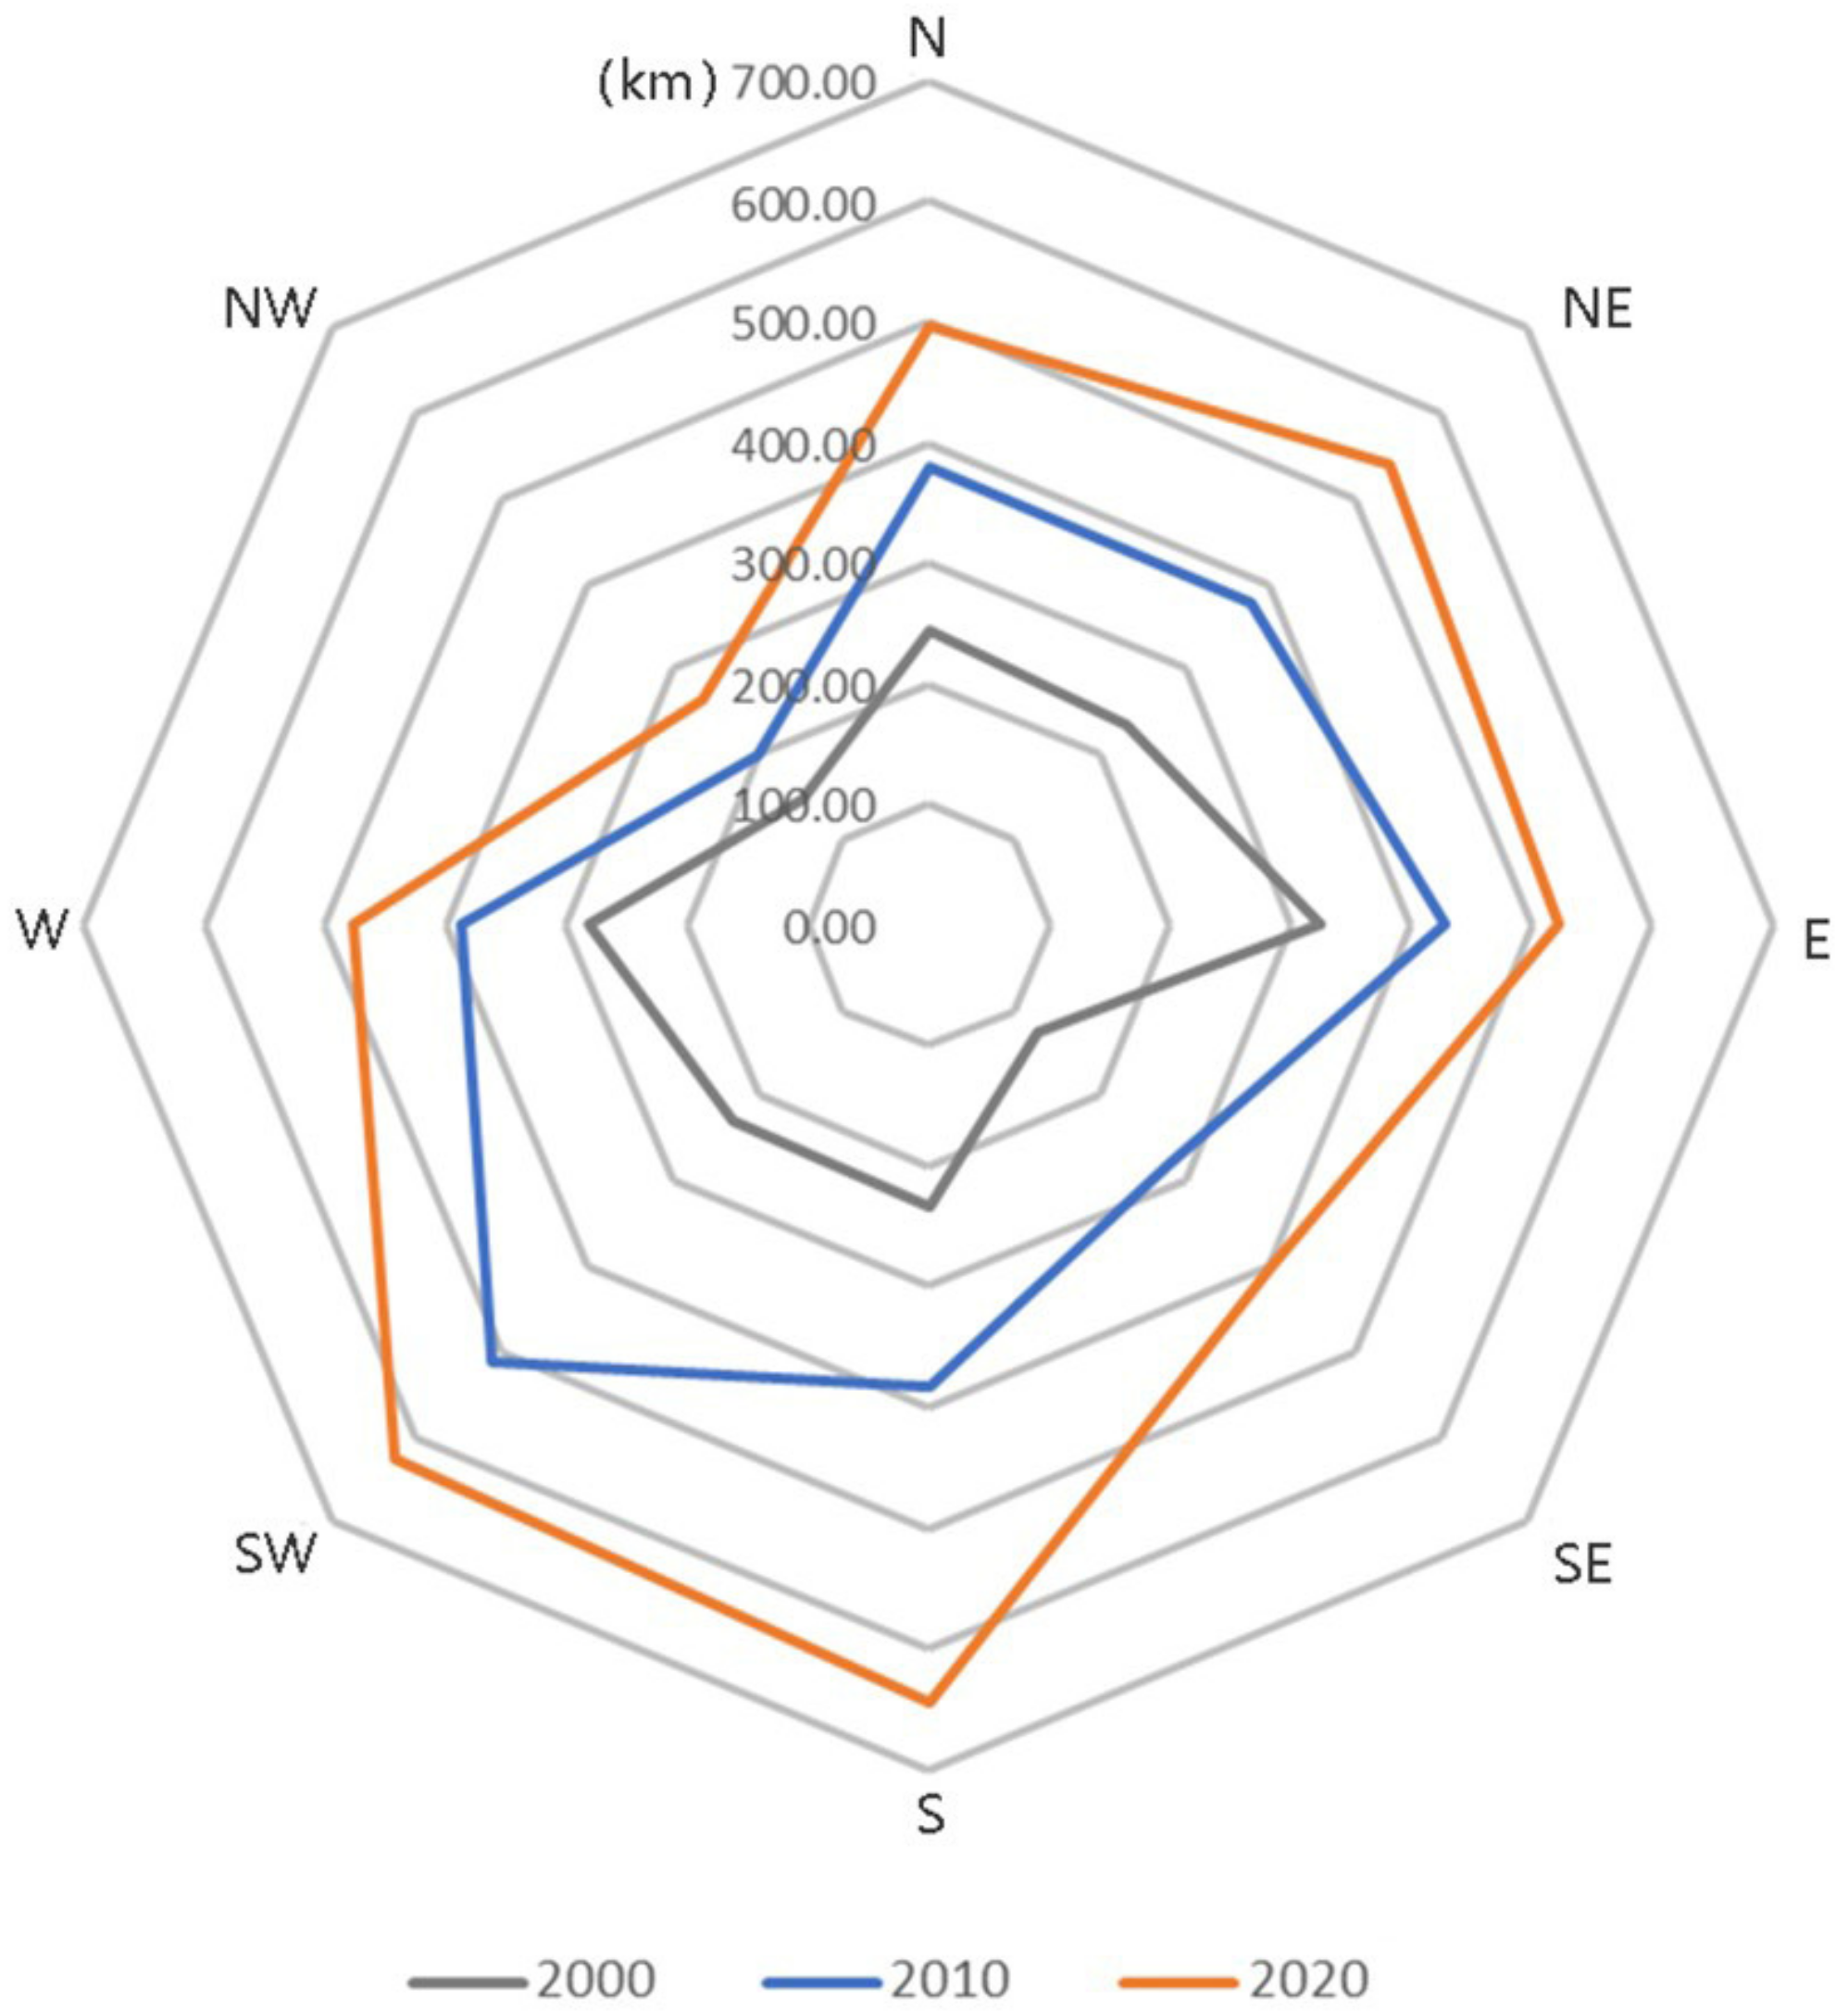
Taking the Bell Tower, the center of the old urban area of Xi’an, as the starting point, starting from 22.5° north by east, the study area was divided into eight squares clockwise, and the road mileage and area in each sector was separately counted (
Figure 8). The road mileage distribution in different directions of Xi’an was counted, and the distribution characteristics, expansion direction, and expansion intensity of the road network in Xi’an were analyzed, respectively. Over the past 20 years, the total mileage of traffic in different directions in Xi’an has steadily increased. In 2000, the mileage of roads in all directions in Xi’an city was generally balanced, with the total mileage of roads in the northeast–southwest direction being the longest and the northwest–southeast direction being the shortest. In 2010, the total mileage in the southwest direction was the longest, while the total mileage in the northwest and southeast directions was the shortest. In 2020, the total mileage in the south and southwest was long, while the northwest and southeast were still the weakest. The overall development trend of urban roads has coincided with the development of residential building stock.
Among the traffic factors, public transport cannot be ignored. For example, the subway is an important part of the urban public transport system. According to relevant reports, the subway in the first-tier cities can attract more than 30% of the population in the city. This mass transportation of inhabitants can effectively enhance the vitality of surrounding land, and attract the gathering of commercial activities and real estate development, forming a “subway economy” model. Especially for the houses in the non-central areas of the city, because of inferior traffic conditions compared with those in central urban areas, the houses generally show the phenomenon of centralized development before and after the opening of the subway. From the spatial distribution characteristics of the material stock of residential buildings in the central urban area of Xi’an, it can be seen that the construction of residential buildings in the urban area around the Ming city wall of Xi’an depends on the subway line. For example, the development of high-density residential buildings in Weiyang District is concentrated near Xi’an metro lines 1, 2, and 4. The high-density residential building development in Yanta District is distributed near Metro Line 3.
4.3.3. Regional Development Strategy and Planning Guidance
Urban master planning often not only guides the development direction of a city, but also reflects the future development trends of the particular city. The demand for residences is also changing with urban development, which is reflected in the distribution of residential stock growth in urban space. The master planning of Xi’an City (1995) has laid the foundation for its development of multiple centers (1995). Several industrial zones and high-tech industrial development zones have been gradually established in the southern and western suburbs of Xi’an, with the trend of industrial transfer from secondary to tertiary industry. The residential area has gradually crossed the second ring road and spread to the outer regions of the old urban area.
The urban master planning of Xi’an (2008–2020) proposes to accelerate the construction of economic and technological development zones, high-tech development zones, the Chanba ecological zone, and Qujiang New Area. The agglomerative growth of residential stock also shows that the construction of the four new areas has promoted a large amount of housing construction in the corresponding, and surrounding areas. At the same time, the plan proposes to expedite the industrial and functional adjustment of the old urban area, and the administrative units will gradually be relocated to facilitate the complete domination of tourism and commerce in the area. In the plan, an urban comprehensive area is proposed to the east of the city, which is dominated by headquarters linked to economy, commerce, and other functions. The southern region is the cultural, educational, and scientific research area; the southwest region has been expanded into a high-tech industrial zone; and the west has been developed into a comprehensive urban area with residential and pollution-free industries. The plan is to construct a domestic first-class commercial area dominated by a modern transportation hub in the north, and renovate the northeastern area into a residential and tourism ecological site, in combination with the regulation of Chanba River. The growth hot spots of residential construction stock are also primarily concentrated in the north, northeast, south, and southwest of the city. It can be clearly seen that urban planning plays a guiding role in space for the growth of residential building stock.
5. Discussion
5.1. Material Stock and Urban Development
5.1.1. Urban Residential Building Development
The increase in residential building stocks reflects the development of urban residential buildings, to a certain extent. Additionally, dense areas show a high level of social, economic, and urban development. By studying the spatial distribution characteristics of the core agglomeration area of residential building stock growth and the surrounding development and construction, we found that the core agglomeration area of residential building stock is often located near an economic development zone, culture and education zone, subway line hub station, or urban natural ecological landscape.
The economic development zone (EDZ) is often regarded as an area where “white-collar knowledge elites” are concentrated. The housing specifications and overall environment are comparatively superior. This zone hosts the highest density of medium- to high-end residential areas. Xi’an Industrial Development Zone (IDZ), Xi’an Hi-tech Industries Development Zone in Yanta District, and the Xi’an EDZ in Weiyang District are the core gathering areas of residential building stock. For example, the construction and placement of scientific research institutes such as the Institute of Aviation Industry, the China Institute of Electronic Science and Technology, the China Aircraft Strength Research Institute, and large backbone enterprises such as Xijing Electric Appliance Corporation and Huashan Semiconductor materials Co., Ltd. often support the living areas and service facilities of employees. Because of their presence, these entities continue to fuel the significant increase in the residential building stock. Overall, in this area, the construction and development of the core area (wealth center) of the central business district of the high-tech EDZ has driven the development and construction of surrounding residential buildings, especially mixed commercial and residential buildings.
Cultural and educational districts are often areas with a high-quality population concentration, characterized by a good humanistic and social environment. They are mostly favored by real estate developers. At the same time, they are also areas with a high concentration of family members linked to colleges and universities. For example, as a science, education, and cultural tourism area in Xi’an, Yanta District had 39 colleges and universities, 55 scientific research institutes above the provincial level, and 261 schools (i.e., primary and secondary schools and kindergartens) as of 2019. Educational resources attract real estate development, and bring a high premium for housing. As expected, the stock of high-density residential buildings in Yanta District is concentrated near colleges and universities. Chang’an District is the main location of Xi’an university towns. Since its establishment in 2003, it has acquired more than 30 universities and more than 20 scientific research institutes. It is the main growth area of residential building stock in Chang’an District.
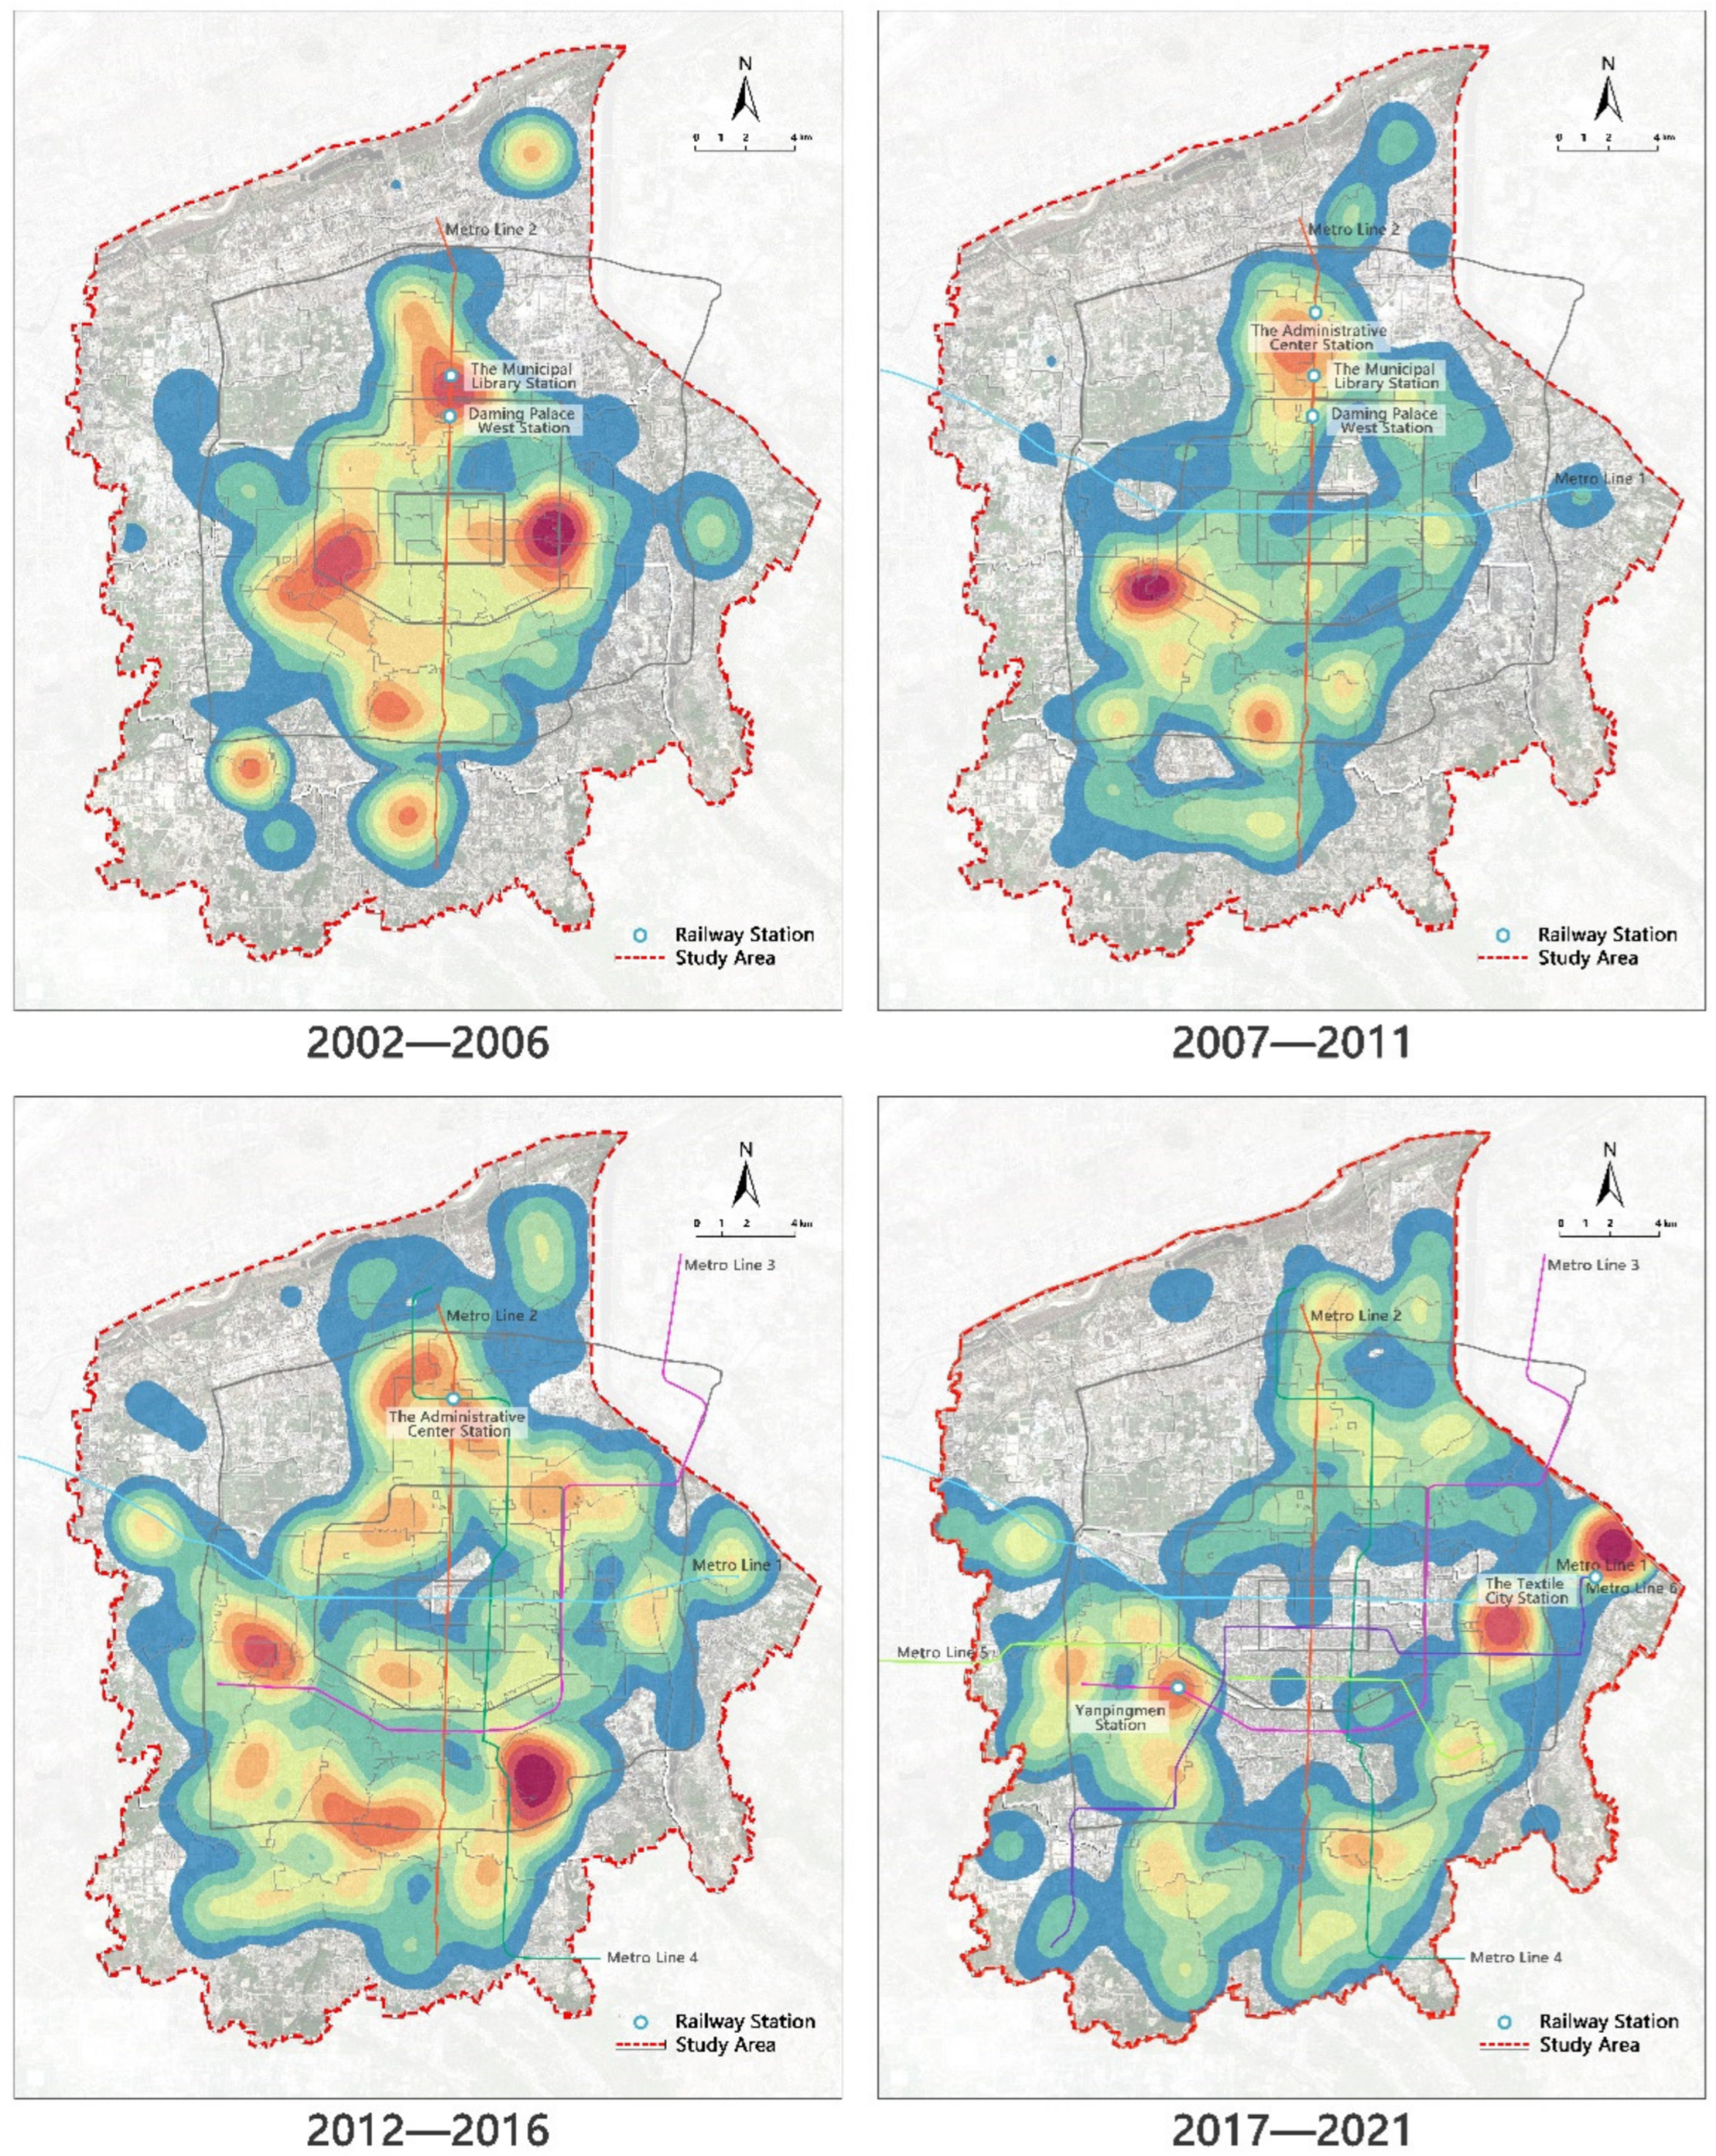
Subways can improve regional accessibility and attract a large number of passengers. Linear residential belts are often formed along subways, especially hub stations, culminating in high-density areas centered on stations. As shown in
Figure 9, Weiyang District, the core gathering area for the growth of its residential building stock from 2002 to 2011, is near the Municipal Library Station and Daming Palace West Station around Metro Line 2 (construction started in 2006 and was completed in 2011). From 2012 to 2016, the Administrative Center Station, and the transfer station of Metro Line 4 (construction started in 2012 and was completed in 2018) and Metro Line 2 formed a number of core agglomeration areas for the growth of residential building stock. From 2017 to 2021, the transfer stations of Metro Line 1 (construction started in 2008 and was completed in 2013) and Metro Line 6 (construction started in 2016 and was completed in 2020), Textile City Station, and Yanpingmen Station of Metro Line 3 formed a core agglomeration area for the growth of residential building stock.
The development of an urban ecological landscape often drives the construction of high-quality residential areas, including high-end communities and villas, such as the core cluster area surrounding the growth of residential building stock in Weiyang Lake Park from 2005 to 2009. In 2011, the ecological stock of Chanba District was approved by the state, driving the growth of surrounding ecological residential areas. From 2010 to 2014, the core agglomeration area for the growth of residential construction stock was also formed around Datang Furong Park and Qujiangchi Ruins Park.
5.1.2. Characteristics of Urban Expansion
One of the important driving forces for the continuous expansion of urban material space is the continuous growth of residential space. Through studying the spatial expansion trends of residential building stock, we found that the growth of residential building stock has mainly primarily been concentrated in the outer areas of the city, and it is expanding towards Weiyang District in the northeast, and Yanta and Chang’an Districts in the southwest. Xu studied the expansion of Xi’an through the lens of utilizing one dimension, namely space, applying the Xi’an urban expansion intensity index classification mapping, and found that between 1988 and 2010, the city had been in a high-speed development period [
21]. The slowing of Xi’an’s central development has been a manifestation of the city shifting its focus to the expansion of the peripheral suburbs, and from 2002 to 2010, most of the space units were in a medium and rapid development stage, mainly primarily distributed in the west and northwest of Weiyang District and the west and southwest of Chang’an District. These trends are consistent with our results, indicating that the growth of residential building stock and urban expansion have a mutualistic effect, which is mainly primarily reflected in the direction of urban expansion and other spatial characteristics. The main expansion direction of the residential stock in the future will also reflect the main development and construction trend of the city in the future, which is bound to consume more energy and emit more greenhouse gases than the current consumption and emissions, respectively. Therefore, in the planning and construction development of these areas in the future, the impact of resource consumption on the environment should be considered first. The consumption of resources can be reduced by developing an efficient transportation network and the use of environmentally friendly building materials.
6. Conclusions
From the perspective of urban expansion and development rules, this study analyzed the spatiotemporal patterns of residential building stock in central Xi’an from 1992 to 2021. From 1992 to 2021, the stock of residential buildings increased from 0.18 million tons to 709.51 million tons. As of 2021, the material stock of residential buildings in central Xi’an was found to have increased 19-fold, which translates to approximately 671.99 million tons of stock. The spatial and temporal distribution characteristics of residential building material stock in each district were obtained. The results show that the stock of residential building materials in the three old districts of Beilin, Xincheng, and Lianhu in Xi’an has had the same flat growth trend and the residential stock increment accounts for 29% of the total. The growth trend of the other four peripheral municipal districts has been approximately the same; however, their growth rates and total stock are much higher. Yanta District exhibited the greatest stock growth, accounting for 31% of the total growth. The spatial distribution of residential building stock growth is much more densely concentrated at the periphery of Xi’an. Regarding urban renewal, a detailed characterization of material stock is important for transitioning into a circular economy. At the same time, it promotes the sustainable development of urban space.
In terms of urban space, the spatial growth of residential building stock has a distinct multi-center agglomeration pattern. Additionally, the growth of residential building stock hot spots is concentrated in the central city edge and the edge of the city, and is based on a preliminary judgment of 2021′s trends. Housing development in Xi’an city center is still in the comparatively high-speed development stage. The growth of residential building stock has an apparent direction, occurring primarily from a northeast–southwest direction. Combined with the spatial agglomeration characteristics of residential building stock, it can be concluded that the residential building material stock in Xi’an has primarily expanded to Weiyang and Baqiao Districts in the northeast, and Yanta and Chang’an Districts in the southwest. It can also be inferred from the expansion trend that stock will continue to expand in this direction. To some extent, the growth of residential building stock also reflects the situation of urban residential building development and the spatial characteristics of urban expansion. Dense regions also show higher levels of social, economic, and urban development, which is concurrent with their substantial development. For a rapidly developing city, land space is one of the most important resources to support urban development. Xi’an should strengthen its planning legislation, emphasize the guiding role of planning, strengthen the coordination role of planning in urban layout, and the comprehensive deployment of urban housing construction. The scale of residential land should be controlled reasonably to prevent the low-density and low-efficiency expansion of urban residential stock in urban fringe areas, and improve the use intensity of residential materials and the use efficiency of residential stock. In the future, planners should focus on improving the level of intensive use of land, strengthening the intensive construction of new residential buildings, increasing the efficiency of infrastructure utilization on the basis of improving the mixed use of land, avoiding the disorderly expansion of residential material stock in the urban interior space, to reduce the waste of land resources and promote the sustainable development of the city. From the perspective of environmental sustainability, areas where stock growth is concentrated tend to consume more energy and emit more greenhouse gases, leading to microclimate warming. Therefore, identification of these clusters will provide resource managers and urban ecologists with a useful research basis for achieving sustainable urban development.
Combined with the development characteristics of each district and the major construction projects in Xi’an city, this study preliminarily analyzed the driving factors of the expansion of residential building stock and found that social, economic, and traffic-related factors are the main drivers of the growth of house construction material stock. The key to the optimization of residential building material input is to reasonably predict the future population and development status of the city, balance the supply and demand relationship between population and housing, avoid the structural contradiction between housing supply and demand, inhibit the rapid growth of new real estate development and investment, and standardize the development and transaction behavior of real estate development. The positive correlation between material stocks and GDP suggests that policymakers in rich cities would do well by relying on urban planning that strictly controls construction activity and setting an early warning for future construction waste generation that requires proper disposal. However, this correlation cautions developing cities in Central and Western China, whose construction quality has not yet reached the level of eastern metropolises, to consider the environmental impacts of resource consumption above growth. Otherwise, the resources invested in construction may be wasted, with the generated waste exceeding the scope of local waste management capacity. Therefore, a society that is sustainable from both an environmental and an economic point of view, aimed at the effective use, protection, and restoration of resources, should be established. This should be seen as an opportunity to develop urban plans that take urban sprawl into account and prioritize resource dialogue, efficient transport networks, and ecological sustainability. This study provides necessary insights for urban planners, stakeholders, and policymakers to better understand the spatiotemporal distribution characteristics of residential building stock in the urban environment and its relationship with urban development. In future research, we will combine the present results to make reasonable predictions and suggestions on the material stock, and development direction and trends of Xi’an’s residential buildings.
Author Contributions
All authors contributed to the research and manuscript writing. The study conception, data collection, data analysis, and other aspects were completed jointly. All authors have read and agreed to the published version of the manuscript.
Funding
This research was funded by the Project Supported by Natural Science Basic Research Plan in Shaanxi Province of China, grant number [No. 2020-JM-418].
Institutional Review Board Statement
Not applicable.
Informed Consent Statement
This manuscript has not been published or presented elsewhere in part or in entirety and is not under consideration by another journal. We have read and understood your journal’s policies, and we believe that neither the manuscript nor the study violates any of these. Informed consent was obtained from all subjects involved in the study.
Data Availability Statement
All data, models, and code generated or used during the study appear in the submitted article. The data presented in this study are available on request from the corresponding author.
Conflicts of Interest
The authors declare no conflict of interest.
References
- National Bureau of Statistics of People’ s Republic of China. 2021 Statistical Communique on National Economic and Social Development; National Bureau of Statistics of People’ s Republic of China: Beijing, China, 2021. [Google Scholar]
- Miatto, A.; Schandl, H.; Wiedenhofer, D.; Krausmann, F.; Tanikawa, H. Modeling material flows and stocks of the road network in the United States 1905–2015. Resour. Conserv. Recycl. 2017, 127, 168–178. [Google Scholar] [CrossRef]
- Huang, C.; Han, J.; Chen, W.Q. Changing patterns and determinants of infrastructures’ material stocks in Chinese cities. Resour. Conserv. Recycl. 2015, 228, 47–53. [Google Scholar] [CrossRef]
- Tanikawa, H.; Fishman, T.; Okuoka, K.; Sugimoto, K. The Weight of Society Over Time and Space: A Comprehensive Account of the Construction Material Stock of Japan, 1945–2010. J. Ind. Ecol. 2015, 19, 778–791. [Google Scholar] [CrossRef]
- Tanikawa, H.; Hashimoto, S. Urban stock over time: Spatial material stock analysis using 4d-GIS. Build. Res. Inf. 2009, 37, 483–502. [Google Scholar] [CrossRef]
- Wiedenhofer, D.; Fishman, T.; Plank, B.; Miatto, A.; Lauk, C.; Haas, W.; Haberl, H.; Krausmann, F. Prospects for a saturation of humanity’s resource use? An analysis of material stocks and flows in nine world regions from 1900 to 2035. Glob. Environ. Chang. 2021, 71, 102410. [Google Scholar] [CrossRef]
- Miatto, A.; Schandl, H.; Forlin, L.; Ronzani, F.; Borin, P.; Giordano, A.; Tanikawa, H. A spatial analysis of material stock accumulation and demolition waste potential of buildings: A case study of Padua. Resour. Conserv. Recycl. 2019, 142, 245–256. [Google Scholar] [CrossRef]
- Kleemann, F.; Lederer, J.; Rechberger, H.; Fellner, J. GIS-based Analysis of Vienna’ s Material Stock in Buildings. J. Ind. Ecol. 2017, 21, 368–380. [Google Scholar] [CrossRef]
- Arora, M.; Raspall, F.; Cheah, L.; Silva, A. Residential building material stocks and component-level circularity: The case of Singapore. J. Clean. Prod. 2019, 216, 239–248. [Google Scholar] [CrossRef]
- Bergsdal, H.; Bohne, R.A.; Müller, D.B. Dynamic material flow analysis for Norway’s dwelling stock. Build. Res. Inf. 2007, 35, 557–570. [Google Scholar] [CrossRef]
- Condeixa, K.; Haddad, A.; Boer, D. Material flow analysis of the residential building stock at the city of Rio de Janeiro. J. Clean. Prod. 2017, 149, 1249–1267. [Google Scholar] [CrossRef]
- Mastrucci, A.; Marvuglia, A.; Popovici, E.; Leopold, U.; Benetto, E. Geospatial characterization of building material stocks for the life cycle assessment of end-of-life scenarios at the urban scale. Resour. Conserv. Recycl. 2017, 123, 53–66. [Google Scholar] [CrossRef]
- Mesta, C.; Kahhat, R.; Santa-Cruz, S. Geospatial Characterization of Material Stock in the Residential Sector of a Latin-American City. J. Ind. Ecol. 2018, 23, 280–291. [Google Scholar] [CrossRef]
- Gao, X.; Nakatani, J.; Zhang, Q.; Huang, B.; Wang, T.; Moriguchi, Y. Dynamic material flow and stock analysis of residential buildings by integrating rural–urban land transition: A case of Shanghai. J. Clean. Prod. 2020, 253, 119941. [Google Scholar] [CrossRef]
- Dan, H.; Fang, Y.; Zhao, Y.; Yuan, Y.; Liu, T.; Cao, A.; Wang, Z.; Zhang, J. Input, stocks and output flows of urban residential building system in Beijing city, China from 1949 to 2008. Resour. Conserv. Recycl. 2010, 54, 1177–1188. [Google Scholar]
- Chen, C.; Shi, F.; Okuoka, K.; Tanikawa, H. The Metabolism Analysis of Urban Building by 4d-GIS—A Useful Method for New-type Urbanization Planning in China. Univers. J. Mater. Sci. 2016, 4, 40–46. [Google Scholar] [CrossRef]
- Wang, H.; Chen, D.; Duan, H.; Yin, F.; Niu, Y. Characterizing urban building metabolism with a 4D-GIS model: A case study in China. J. Clean. Prod. 2019, 228, 1446–1454. [Google Scholar] [CrossRef]
- Augiseau, V.; Barles, S. Studying construction materials flows and stock: A review. Resour. Conserv. Recycl. 2016, 123, 153–164. [Google Scholar] [CrossRef]
- Lichtensteiger, T.; Baccini, P. Exploration of urban stocks. Environ. Eng. Manag. J. 2008, 18, 41–48. [Google Scholar]
- Fishman, T.; Schandl, H.; Tanikawa, H. The socio-economic drivers of material stock accumulation in Japan’ s prefectures. Ecol. Econ. 2015, 113, 76–84. [Google Scholar] [CrossRef]
- Xu, G.; Zhang, F.; Zhao, S. Dynamics of urban land expansion in Xi’an. J. Arid. Land Resour. Environ. 2012, 26, 37–43. [Google Scholar]
| Disclaimer/Publisher’s Note: The statements, opinions and data contained in all publications are solely those of the individual author(s) and contributor(s) and not of MDPI and/or the editor(s). MDPI and/or the editor(s) disclaim responsibility for any injury to people or property resulting from any ideas, methods, instructions or products referred to in the content. |
© 2023 by the authors. Licensee MDPI, Basel, Switzerland. This article is an open access article distributed under the terms and conditions of the Creative Commons Attribution (CC BY) license (https://creativecommons.org/licenses/by/4.0/).


