Article

Influence of Complex Hydraulic Environments on the Mechanical Properties of Pile-Soil Composite Foundation in the Coastal Soft Soil Area of Zhuhai

1
Zhuhai Aviation City Engineering Construction Co., Ltd., Zhuhai 519000, China
2
Southern Marine Science and Engineering Guangdong Laboratory, School of Civil Engineering, Sun Yat-sen University, Zhuhai 519082, China
3
Zhuhai Institute of Urban Planning & Design, Zhuhai 519000, China
*
Author to whom correspondence should be addressed.
Buildings 2023, 13(2), 563; https://doi.org/10.3390/buildings13020563
Submission received: 17 January 2023 / Revised: 14 February 2023 / Accepted: 16 February 2023 / Published: 18 February 2023

Abstract

:
Based on a plain concrete pile composite foundation project in the coastal area of Zhuhai, considering the complex hydraulic load environment induced by tidal water-level changes, finite element simulations and parameter calibrations were carried out to determine the physical and mechanical properties of plain concrete pile composite foundation. The hardening soil small (HSS) model, which can be used to simulate the complex mechanical behavior of soft soil under small strain, was selected for modeling analysis. Model parameters were calibrated through resonance column tests, triaxial consolidation drainage loading and unloading shear tests. The complex hydraulic loads were analyzed, including the effects of cyclic tidal action and the sudden rise and fall of the water level induced by strong storm surges on the force, deformation of plain concrete piles, and the mechanical seepage properties of soft soil around piles. The results indicate that: (1) Compared with coastal soft soil in Shanghai, Zhoushan, Tianjin, and other areas, the soft soil in the Zhuhai area has a smaller dynamic shear modulus, cohesion and internal friction angle, and worse engineering properties. (2) The sudden rise of water level leads to a sudden change in the pore pressure of the groundwater, which induces a large deformation of the pile-soil composite foundation. If the foundation on the offshore (dike) side exhibits the most prominent deformation and foundation damage, such as uneven settlement is prone to occur. (3) The offshore side pile is most affected by the hydraulic loads. The deformation of the pile body along the pile body is uneven and the deformation of the upper pile body is relatively large, which may cause fracture damage.

1. Introduction

The Guangdong-Hong Kong-Macao Greater Bay Area in China has witnessed rapid economic and infrastructure construction-scale development. However, coastal soft soil, as the main infrastructure carrier, is generally characterized by high porosity, low strength, high water content, low permeability, strong compression, and slow consolidation [1,2,3,4]. These characteristics bring great challenges to design, construction, and operation. Deep and thick soft soil is widely distributed in the Zhuhai area and its engineering properties are poor, which leads to frequent engineering accidents in infrastructure construction, such as foundation pit collapse and pipe pile fracture [5,6].
The treatment of deep and thick soft soil foundations in offshore waters usually adopts prestressed high-strength concrete pipe pile [7,8,9], cement fly ash gravel pile [10,11], and plain concrete pile composite foundations [12,13,14]. Among them, plain concrete pile composite foundation is widely used in the Zhuhai area because of its high strength, simple construction, and low cost. Additionally, under the action of tides and strong storm surges, the water level of coastal soft soil foundation is prone to sudden change that results in changes in the stress field of the foundation, which will induce overall foundation settlement and the destruction of piles in severe cases. At present, the research methods on the response of coastal structures under a change in the seawater table are divided into the following three types: analytical methods, experimental methods, and numerical methods. Li et al. [15] used MATLAB to determine the spatiotemporal evolution of the deep foundation pit seepage field and coastal seepage field evolution model. Based on the large-scale excavation model, Zhang and Xiao et al. [16] deduced the analytical solution of the response of excess pore water pressure of foundation soil in the coastal area under a change in the seawater table. Ying et al. [17] carried out an experimental study on the over-pore pressure response of foundation pits near the sea under the action of waves by building an indoor sink. Hong et al. [18] systematically revealed the plastic failure mechanisms of excavations associated with sea level fluctuation, through a centrifuge model test.
With the development of computer technology, numerical methods are more and more popular in the above research. Xiang et al. [19] analyzed the influence of tides on the consolidation behavior of silt subgrade using the finite element method and found that the settlement-time history curve changes periodically with tides. Ying et al. [20,21] conducted theoretical derivation and numerical simulation of the pore pressure response around the foundation pit near the sea under the condition of seawater table fluctuation. They decoupled the Biot consolidation equation, and used Laplace and Fourier transforms to derive the two-dimensional semi-analytical solution of pore pressure response around the foundation pit under the condition of water-level fluctuation, and carried out stability analysis with the PLAXIS program. Li et al. [22] proposed a numerical model based on the boundary element method, and it reproduced the asymmetry spatially dependent damping and phase lagging of water table fluctuations. Based on the total stress framework, Liu et al. [23] used commercial finite element software ABAQUS to study the influence of cyclic load (wave, tide, etc.) on the ability of clay-embedded circular foundation, and systematically revealed the foundation strain softening mechanism. Cheng et al. [24] used Midas GTS to study the performance of a foundation pit support structure in offshore deep soft soil foundation under the action of wave and tide, which has provided a reference for studying mechanical properties of the construction of offshore foundation pits.
The above studies mainly focus on the influence of tidal water-level fluctuations on the seepage and mechanical behavior of coastal foundation pits. Few research studies have been conducted on the influence of plain concrete pile composite foundations in complex hydraulic environments. In fact, changes in groundwater level and pore water pressure can easily lead to an uneven distribution of effective stress in foundation soil, resulting in the weakening of pile-soil interaction and particle loss, inducing of uneven foundation settlement, and weakening of the bearing capacity. The weakening mechanism of the pile-soil composite foundation caused by complex hydraulic loads, therefore, needs to be urgently studied.
This research uses a coastal plain concrete pile composite foundation project in Zhuhai as an example for analyzing the deformation and mechanical characteristics of a pile-soil composite foundation under the action of hydraulic load changes. First, the HSS model, which can accurately reflect the mechanical behavior of soil under small strain conditions, was selected to carry out laboratory tests and parameter calibration. Second, PLAXIS-2D finite element software was used to conduct numerical simulations of the mechanical behavior of plain concrete composite foundation under various water-level conditions while considering the interaction between multi-layer soft soil and groundwater level. Additionally, the safety of the composite foundation under normal tidal action and extreme storm surge action was predicted and evaluated, including pile group displacement, deformation, and soil seepage characteristics around the pile. The results provide theoretical guidance and reference for evaluating the deformation and stability design of coastal soft soil composite foundation.

2. Engineering Geological Conditions

The project is located in Sanzao Town, Jinwan District, Zhuhai City. The landform of the site is a marine plain in front of a mountain that has been artificially filled to form a land area. There is a large area of deep soft soil in the site, and the soil layers include artificial filling, a quaternary marine-terrestrial interfacial sedimentary layer, a residual layer, Yanshan Phase III, a weathered granite layer, and a Devonian sandstone weathered layer. Among these soft soil layers, such as silt and silty soil, are deeply and widely distributed on the site, and the engineering properties are poor.
For construction of upper infrastructure structures in deep and soft soil areas, it is necessary to conduct site treatment on the soft soil foundation. This treatment area is the road closest to the sea within the whole site and its foundation treatment method is plain concrete pile-soil composite foundation. In this research, a typical road section is studied to discuss the influence of complex hydraulic loads, such as tidal water-level fluctuation and sudden rise and fall of the water level, on the mechanical properties of plain concrete pile composite foundation.

3. Parameter Calibration and Model Setting

3.1. Model Analysis

Commercial finite element software PLAXIS-2D was used to study a typical section in the area. Figure 1a shows a typical geological profile within the construction area. As we can see, the sediment below −54 m is in fact the coarser sand and weathered sandstone, which may have the strong capacity of sustaining the overlying backfills and can be normally taken as a non-deformable layer compared to the upper layers. Therefore, in this study, only the soil layer with elevation above −54 m was modeled and meshed. The specific model and grid division are shown in Figure 1b. There are three layers of soil in this area that are, from top to bottom, plain fill (3.8 to −0.6 m), silt (−0.6 to −17 m), and muddy soil (−17 to −54 m). The total length of the model in the x direction is 240 m. The leftmost pile is 90 m away from the left boundary of the model, which is about three times the width of the pile group. Therefore, the influence of the boundary effect on the simulation results can be ignored [25]. The total length of the model in the y direction is 57.8 m. In the y direction, the muddy soil bottom is used as the bottom boundary of the model. For the model displacement boundary, the bottom is a fixed constraint that does not allow displacement in any direction; the left and right are horizontal constraints allowing displacement in the vertical direction, and the top is a free boundary. In the model area, except for the bottom boundary where seepage is not allowed, the other three boundaries are all permeable. The model is divided into 11,909 triangular unit meshes with 102,849 nodes. Some meshes of the composite foundation and dike are encrypted.
The plain concrete pile group is simulated with the embedded beam row pile element built into PLAXIS. The embedded beam row structure element can simplify the simulation of a row of piles in the out-of-plane direction of the 2D plane strain model, in which the piles and soil elements are connected by a special interface element in the out-of-plane direction. Additionally, the embedded beam row pile element can specify pile type, diameter, lateral friction resistance, end resistance, material property, and spacing in the out-of-plane direction. In three-dimensional space, the projection is plum-shaped piles and the pile spacing is 1.6 m. A total of 21 plain concrete piles with a length of 25 m and a pile diameter of 0.4 m are arranged in the cross section of the road, and the pile tops are at the same elevation as the top of the plain fill layer. The bottom of the pile is located in the middle of the muddy soil layer. The pile body does not penetrate the soft soil layer and it is in a suspended state. The pile group is arranged in a quincunx pattern with a spacing S = 1.6 m, which is transformed into a square distribution according to the principle of equal replacement rates [26], as shown in Figure 2. The equation for this transformation is as follows:
m = π d 2 4 l 2 = π d 2 2 3 S 2
where m represents the area replacement rate, d is the diameter of the plain concrete pile, S is the actual pile spacing, and l is the spacing when the piles are arranged in a square. After calculation, a pile spacing of one equals 1.5 m after transforming into square piles. Therefore, the designated pile type is a large-volume round pile; the diameter of the pile body is 0.4 m, and the distance between the piles in the out-of-plane direction is 1.5 m. At the same time, the side friction of the pile is specified such that it is related to the soil layer in order to consider the difference in the side friction resistance of the pile in different soil layers. The bearing capacity of the pile tip is half of the ultimate bearing capacity measured in the experiment.
Part of the dike structure is relatively complex, so it is partially simplified in this research. The material model of the dike is linear elastic and values are shown in Table 1. The Mohr–Coulomb model (M-C) is used for the filling layer and the HSS model is used for the soft soil layer of silt and muddy soil. The HSS model considers the small strain stiffness of the soil, which can accurately reflect the deformation and mechanical behavior of soil in the construction area under small strain conditions (10−4–10−6) [27,28,29]. The main model parameters include the dynamic shear modulus, triaxial drainage test secant modulus, and shear strain level. In order to accurately obtain the required HSS parameters, laboratory experiments under various loading conditions were carried out using resonance columns, triaxial consolidation drainage shearing, and triaxial consolidation drainage loading and unloading tests. This paper takes the resonant column test results as an example calibration of the dynamic shear modulus in the HSS model. Saturated silt samples under different confining pressures are selected for the resonance column test. The dynamic shear modulus of the samples in the small strain range was measured as a function of the strain amplitude, as shown in Figure 3.
In the resonant column test, the shear modulus–damping ratio (Gd—γd) characteristic curve can be described by a hyperbolic model, that is, 1/Gd = a + b × γd. The obtained relationship curve is shown in Figure 3b. a and b are test constants whose values can be obtained through regression statistical analysis of the test data. When γd tends to zero, 1/Gd tends to a and Gd is represented by G0, that is, G0 = 1/a, where G0 is the initial shear modulus. The reference dynamic shear modulus,  G 0 r e f , of each sample under the reference confining pressure, Pref = 100 kPa, can be calculated by:
G 0 = G 0 r e f ( c cos φ σ 3 sin φ c cos φ + p r e f sin φ ) m
where  c  is the cohesion force,  φ  is the internal friction angle,  σ 3  is the effective confining pressure, and m is the relative power exponent of the stiffness stress level. The calculation results are provided in Table 2.
From the results in Table 2, the reference dynamic shear modulus of the mud sample under the reference confining pressure is about 15.5 MPa. Other parameters required by the model are obtained from tests such as those for triaxial consolidation drainage shear, triaxial consolidation drainage loading and unloading shear, etc. The parameter calibration is shown in Table 3. The HSS model parameters for the remaining regions are shown in Table 4. Table 3 and Table 4 show that the soft soil cohesion, internal friction angle, standard triaxial drainage test secant stiffness, small strain reference dynamic shear modulus, and other mechanical parameters of the soft soil in the construction area of Zhuhai Jinwan are generally small. Compared with the soft soil HSS model parameters in the Yangtze River Delta [30,31] and the Bohai Rim regions [32,33], the strength and engineering properties of Zhuhai soft soil are poor and it is necessary to adopt appropriate soft foundation treatment methods to improve its bearing characteristics.

3.2. Simulation of the Complex Hydraulic Load Process

According to many years of tidal water-level monitoring data from the construction area, an average sea level height of 0.5 m (Yellow Sea elevation coordinate system) was selected as the initial water level of the model as a whole. According to observation data, the tide is an irregular semi-diurnal mixed-tide type, with two high tides and low tides in one day on average. The design high and low water levels are 1.8 m and −0.8 m, respectively. Therefore, the normal tidal action, which is called Case1, is simplified as a simple harmonic fluctuation with a period of 0.5 d and an amplitude of 1.3 m at mean sea level. For a sudden rise and drop of water level during extreme weather, which is called Case 2 and Case 3, respectively, the extreme high water level and low water level in a 50-year return period are 3.5 m and −1.4 m, respectively, according to observation data. Therefore, a sudden rise of water level are simplified as a linear rise to 3.5 m in 1/4 d, and then, the water level is maintained at 3.5 m for 3/4 d. Similarly, a sudden drop of water level is simplified as a linear drop to −1.4 m in 1/4 d, and then, a −1.4-m water level is maintained for 3/4 d. The time-varying curves of water-level change in the above three cases are shown in Figure 4.
The whole simulation process is divided into five steps:
(1)
Balance the ground stress, select gravity loading for the calculation type, and select the phreatic level for the pore pressure calculation type;
(2)
Activate the plain concrete piles, select the plasticity calculation for the calculation type and the phreatic water level for the pore pressure calculation type;
(3)
Activate the subgrade and pavement, select the plastic calculation for the calculation type, and select the phreatic level for the pore pressure calculation type;
(4)
Eliminate excess pore pressure generated by pile formation, choose the consolidation calculation for the calculation type, and use the previous stage pressure for the pore pressure calculation type. This fourth step aims to eliminate the influence of self-settlement of the pile and soil in the subsequent simulation process. After this calculation, the displacement is cleared to zero; that is, the subsequent excess pore pressure, displacement, and deformation are the net excess pore pressure, net displacement, and net deformation caused by changes in external conditions, respectively;
(5)
Apply tidal water-level changes (tidal action, maintained level after the water level rises sharply, and maintain level after the water level falls sharply). Select fluid–solid coupling for calculation type to analyze the simultaneous development of deformation and pore pressure in the soil. The method takes the vertical boundary of the land area on the left side of the model as a fixed water head that is consistent with the mean sea level (0.5 m). The right side of the model is the initial water level of 0.5 m, and three groups of time-related variable head groundwater seepage boundaries are considered.

4. Results and Discussion

4.1. Model Validation

In the actual project, the groundwater-level at point J (see Figure 1) on the seaside of the subgrade has been continuously monitored (25 h). To verify the reliability of the model, the relative groundwater-level fluctuation data of the actual monitoring point is compared with the simulated data of the corresponding position in the numerical simulation model. Figure 5 shows the measured and simulated data of the relative groundwater-level fluctuation at point J as a function of the tide. Comparing the measured and simulated data of the groundwater level at the monitoring points, the overall trends of the two are highly consistent. The magnitude of the numerical deviation is also within an acceptable range, so the simulation results are considered reliable.

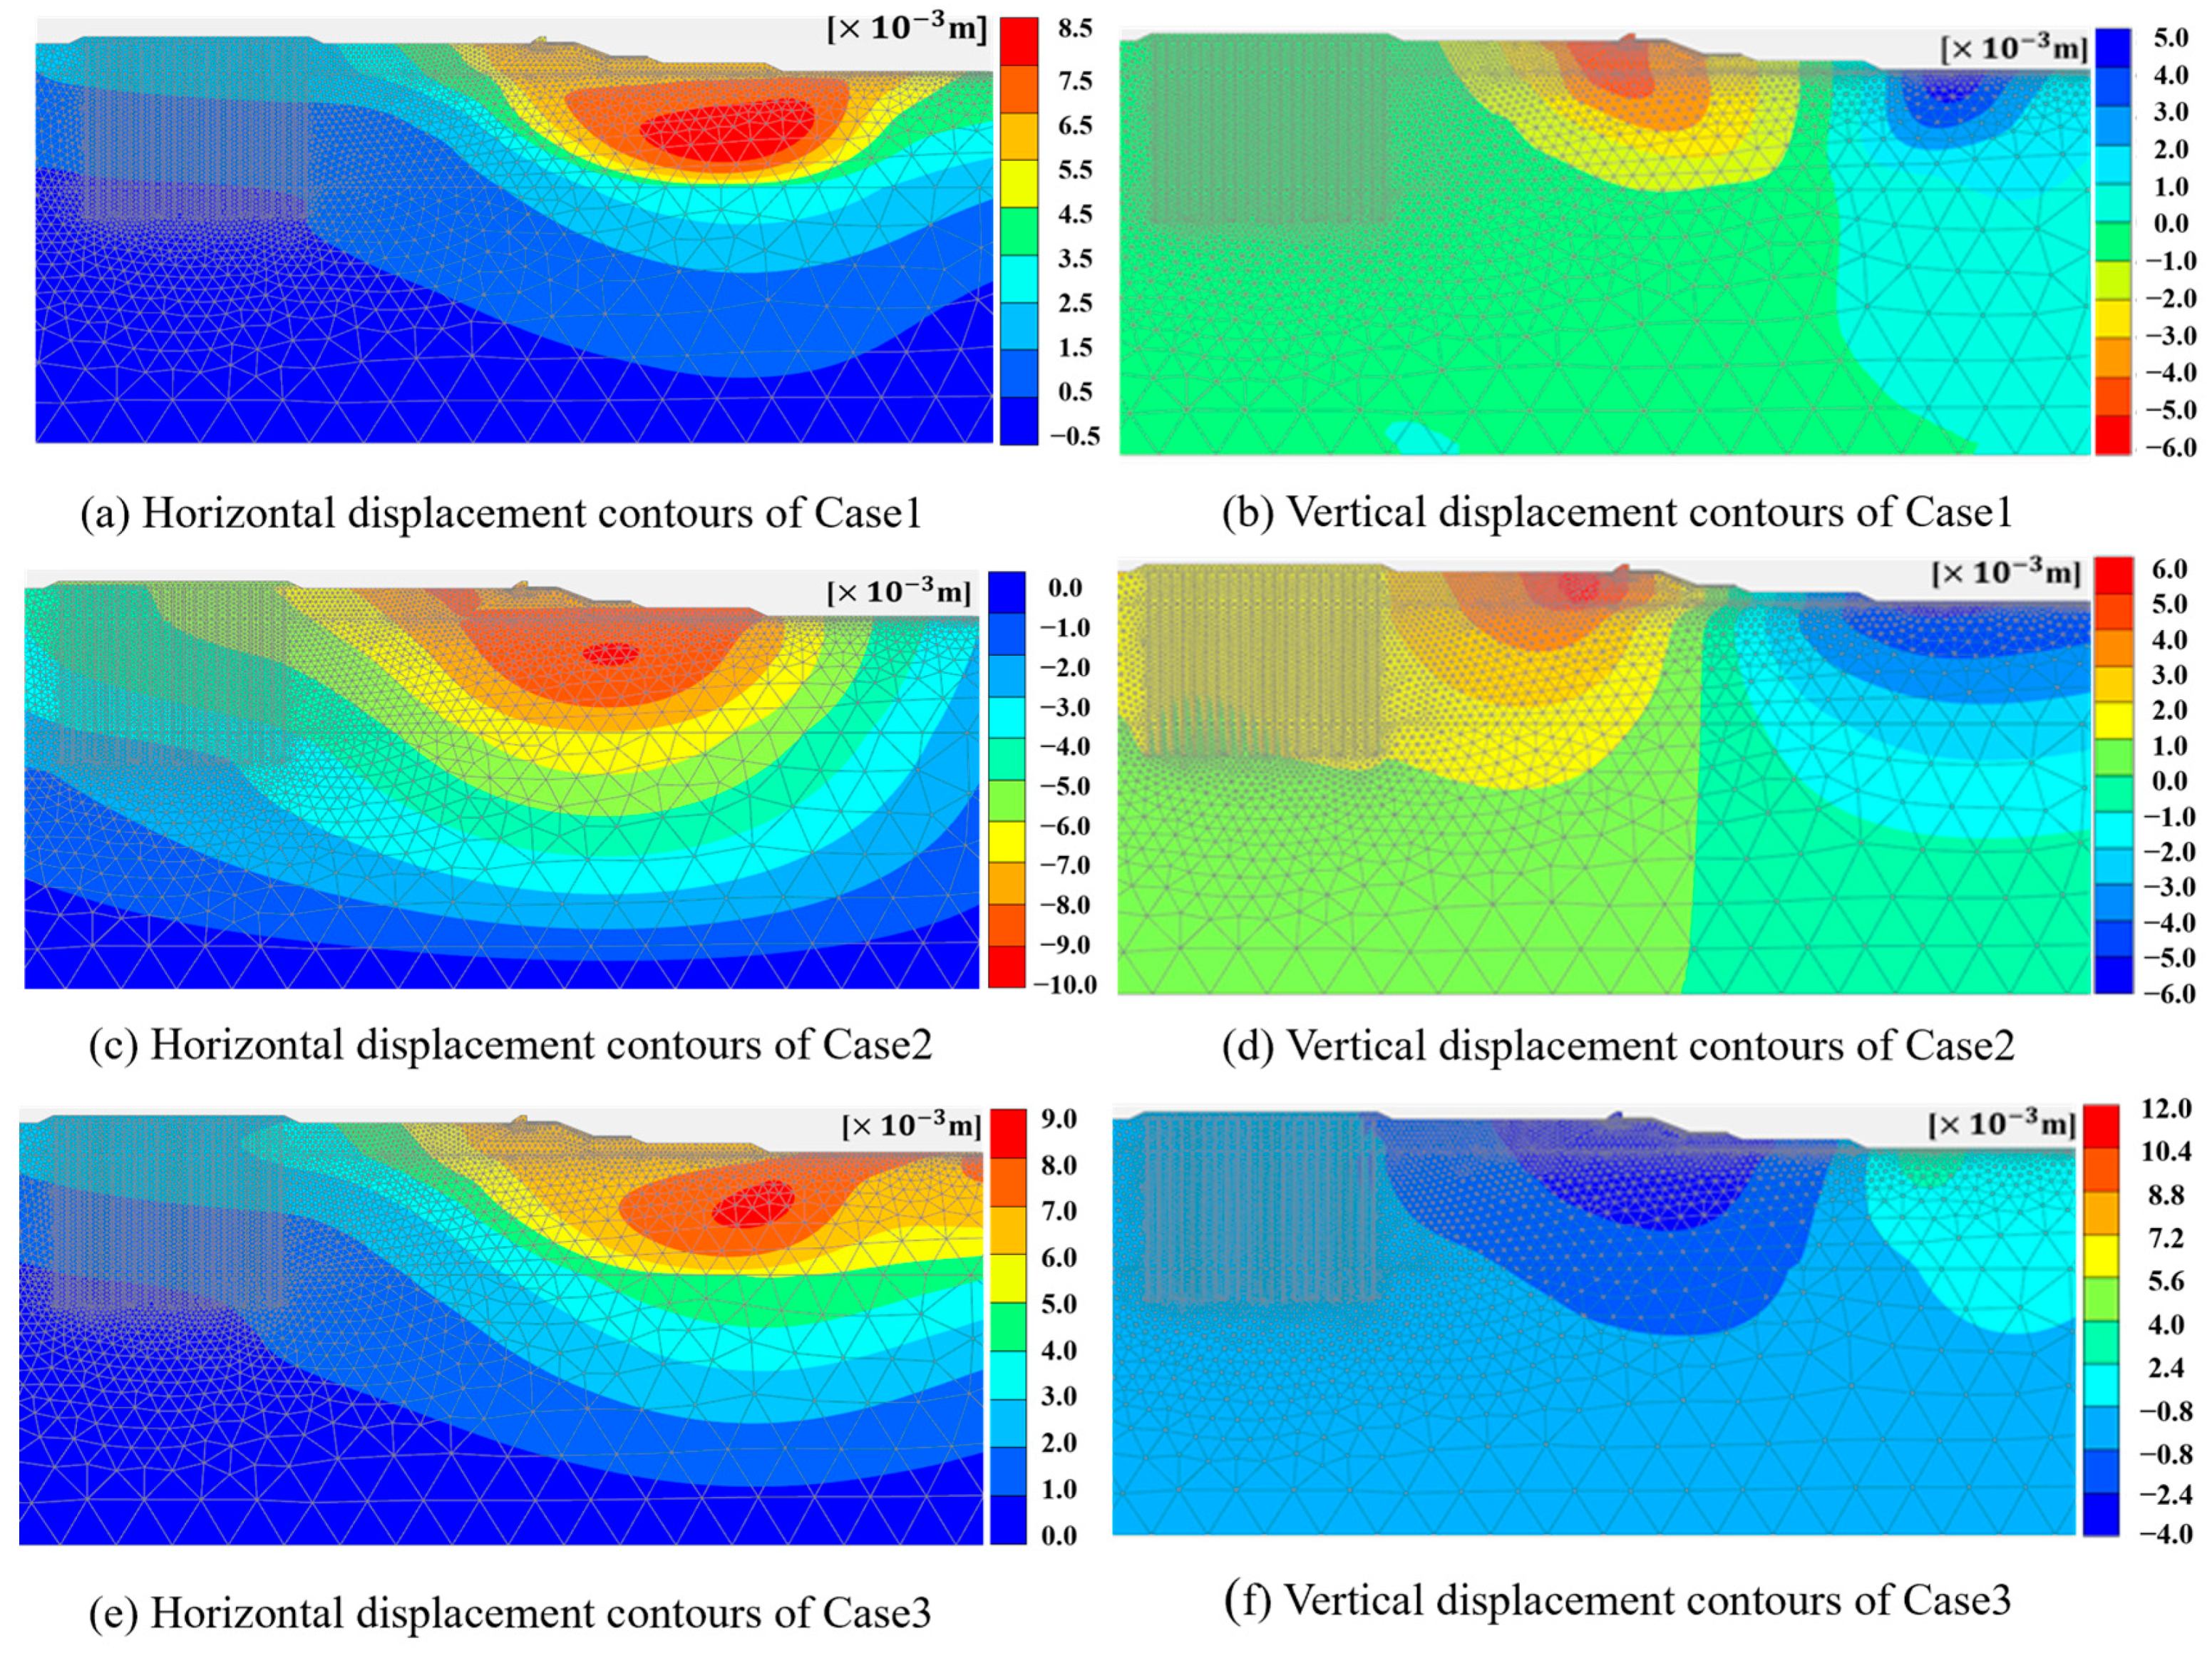
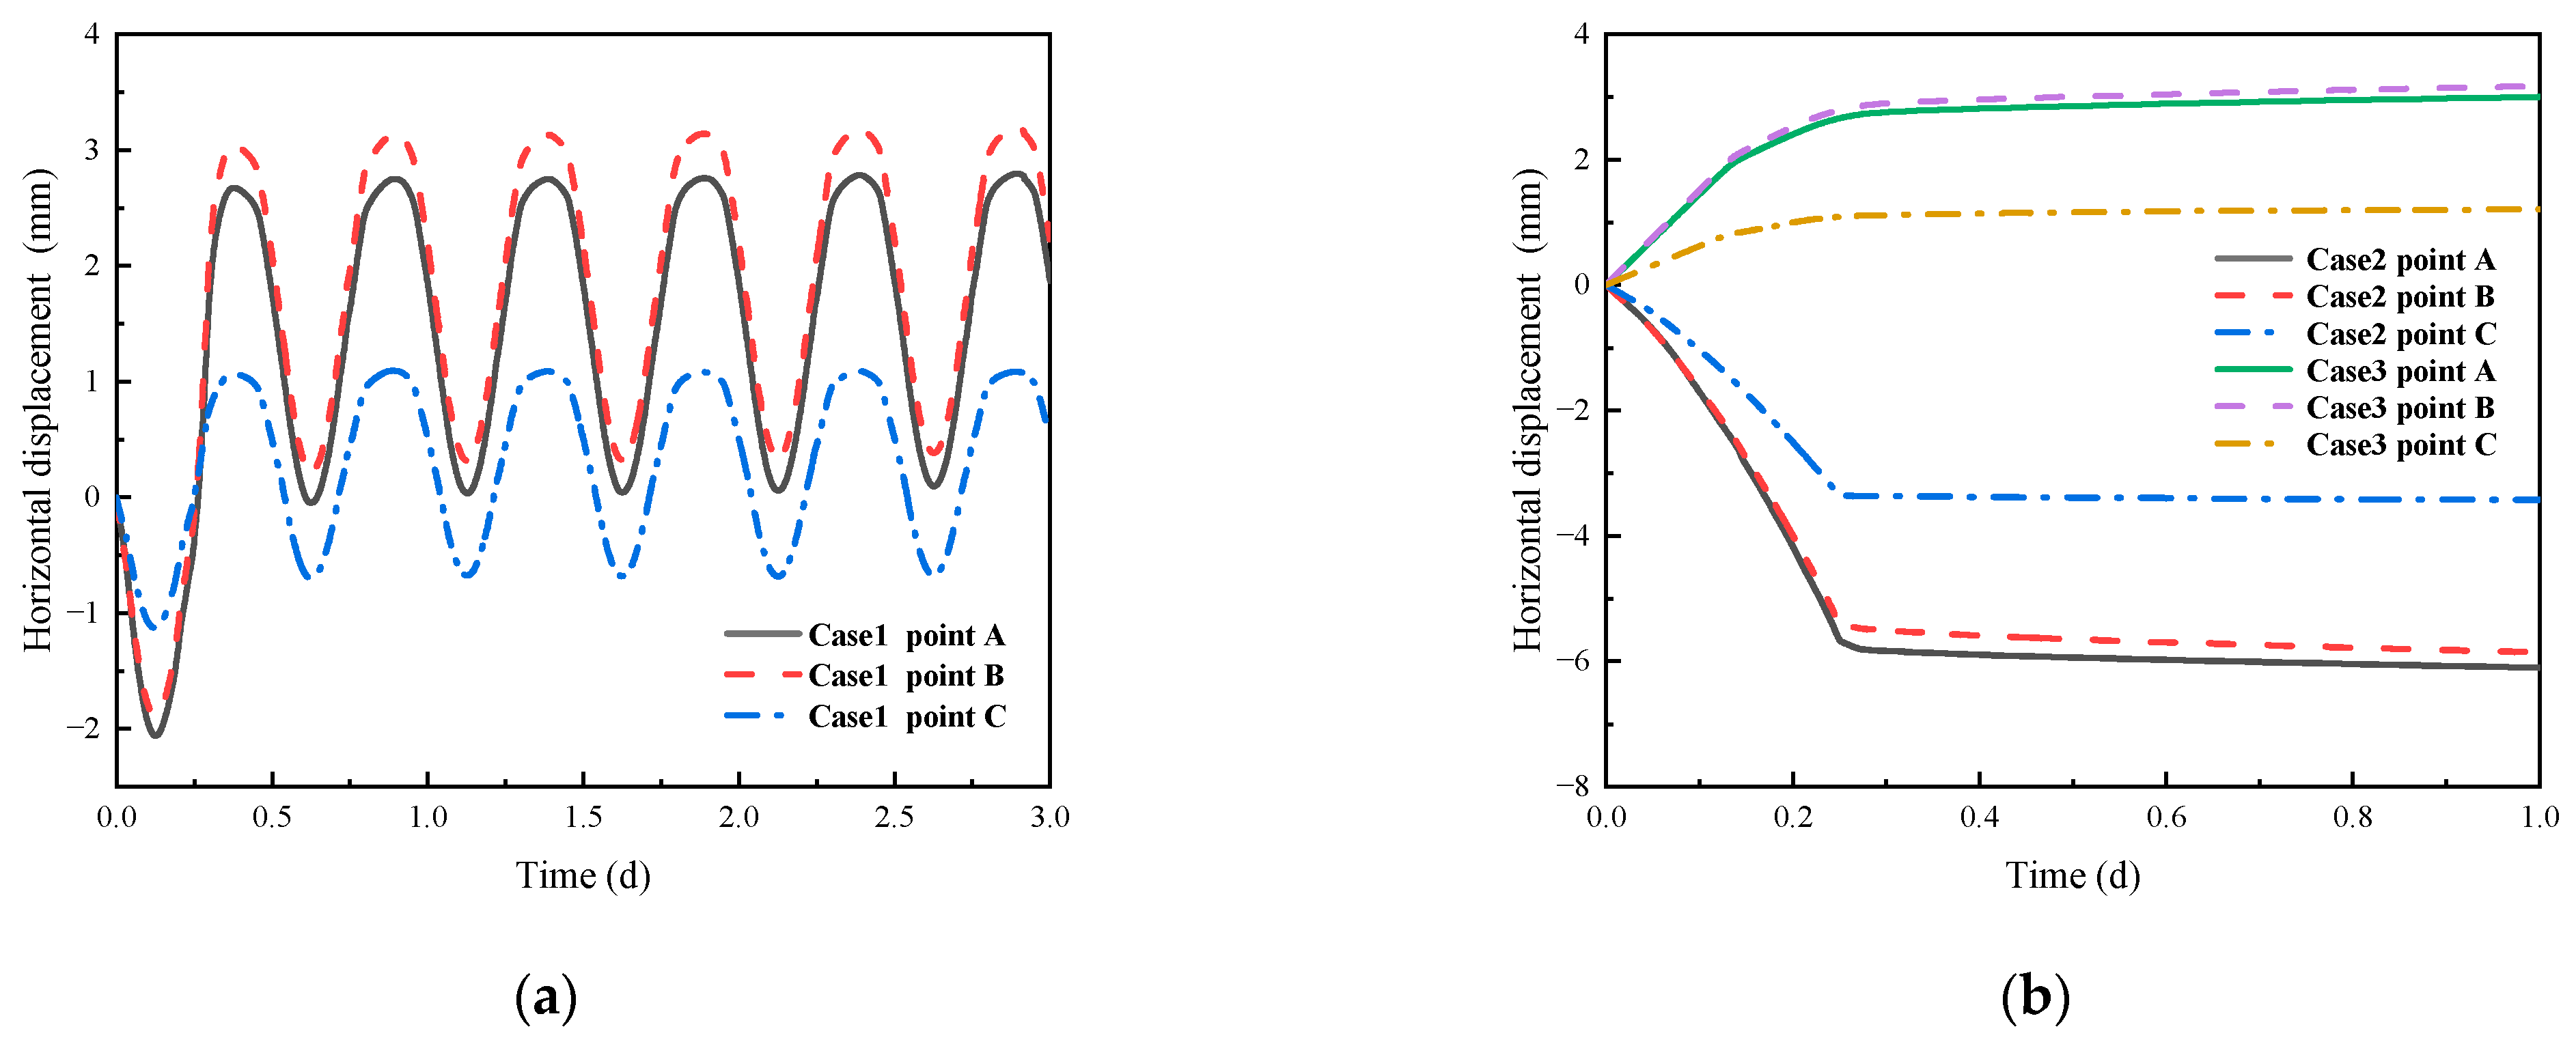
4.2. Deformation Law of Foundation Soft Soil

Composite foundation piles risk horizontal fracture and vertical uneven settlement. Figure 6 reveals the displacement contours of the model in the horizontal and vertical directions under three cases. It is found that the dike area close to the sea is directly affected by the rise and fall of the water level, resulting in large horizontal deformation of the soil below the dike. The maximum local horizontal displacement (near the breakwater) induced by tidal action, water level sudden rise, and water level sudden drop are 8.5 mm, −10 mm, and 9 mm, respectively. At the same time, the soil deformation is also affected by the groundwater seepage caused by the water-level difference between the land and sea. Seepage mainly occurs in the foundation of the lower part of the dike and dredger fill, resulting in a relatively large vertical deformation at the junction between the left side of the dike foundation and dredge fill.
The soil deformation in the two dike areas will also impact the composite foundation. The deformation of the composite foundation is affected by the seepage of groundwater. Since the topsoil of the composite foundation is dredger fill, the permeability coefficient is much larger than that of the silt and muddy soil below it. Therefore, the impact of seepage is also greater than that on the other two layers of soil, and deformation in the horizontal and vertical directions is also greater than that of other parts of the composite foundation. From the numerical analysis of the deformation of the composite foundation under the three cases, it can be seen that the maximum deformation is located at the No. 1 pile on the offshore side of the composite foundation (as shown in Figure 1). Compared with the deformation in the vertical direction, the deformation in the horizontal direction is larger such that the most unfavorable deformation situation of the composite foundation is the displacement of the No. 1 pile in the horizontal direction.
The horizontal and vertical displacement between the No. 1 pile on the coastal side and No. 21 pile on the far seaside (as shown in Figure 1) of the composite foundation after one day under the three cases are illustrated in Figure 7. The relative displacement is defined as the difference between the displacements of the No. 1 and No. 21 piles at the same time. It is found that the tidal action and water level drop produced positive relative horizontal displacement and negative relative vertical displacement, and the maximum relative horizontal displacement and vertical displacement along the pile body were only 0.75 mm and −0.2 mm, respectively. The overall relative displacement is not obvious.
The sudden rise in water level produced negative relative horizontal displacement and positive relative vertical displacement. The maximum relative horizontal displacement along the pile body was −2.0 mm and maximum relative vertical displacement was only 0.17 mm. Compared with the previous two conditions, the water level rises sharply and the sea level changes the most within a day. The groundwater seepage is most obvious, resulting in relatively large relative horizontal displacement of the pile body. However, this groundwater seepage is still within a controllable range. Given the most unfavorable situation above, the displacement evolution of the No. 1 pile in the horizontal direction is further discussed below.
Under the tidal action and within one period (12 h), the deformation of the No. 1 pile in the horizontal direction is illustrated in Figure 8a. The range 0 to T/4 corresponds to seawater rising from the mean sea level to the design high water level, and the No. 1 pile deforms from the initial position to the negative direction of the x axis. T/4 to T/2 corresponds to the ebb tide from the design high water level to the mean sea level, and the composite foundation deforms from the point where the deformation in the negative direction of the x axis is largest compared to the initial position. T/2 to 3T/4 corresponds to the ebb tide from the mean sea level to the design low water level and the composite foundation deforms from the position close to the initial position to the positive direction of the x axis. 3T/4 to 1T corresponds to the rise of seawater from the design low tide level to the mean sea level, and the composite foundation deforms from the maximum deformation value in the positive direction of the x axis to the initial position. After one period ends, the pile body does not completely return to the initial position and there is a certain lag. As the depth increases, the horizontal deformation along the pile depth shows a trend of increasing, gradually decreasing, and the extreme value appears near the mean sea level.
As shown in Figure 8b, under the cases of sudden rise and fall of water level, the deformation of the No. 1 pile mainly occurs in the first 1/4 d before the sudden rise and drop of the water level. In the subsequent 3/4 d when the water level is stable, the magnitude of the deformation significantly reduces although the pile body still deforms. The variation of deformation along the pile body in the horizontal direction is similar to that of the tidal action and is greater than that of the tidal action in the numerical value. Moreover, the horizontal displacement of the pile body caused by the sudden rise of the water level is greater than the horizontal displacement of the pile body caused by the sudden drop of the water level, which is the most unfavorable case among the three cases.
Point A at the top of pile No. 1, point B at the intersection with the mean sea level (0.5 m), and point C at the bottom of the pile (as shown in Figure 8) are selected for further investigation. The displacement of these three feature points in the horizontal direction are observed as a function of time, in which the tidal action time is selected to be 3 d and a total of 6 cycles. The displacement of the three feature points in the horizontal direction changes with time, as shown in Figure 9a,b.
It is seen that for the tidal action in Figure 9a that, the horizontal displacement of the three feature points changes with time and satisfies simple harmonic vibration. This is similar to the period of a simple harmonic wave that simulates the tidal action, but the amplitude is different. Among the three feature points, point B has the largest amplitude, which reaches 2.5 mm in the first period and maintains an amplitude of 1.3 mm in the next five periods. The amplitude of point C is the smallest, reaching 1 mm in the first period and remaining unchanged at 0.8 mm in the following five periods. The evolutions of the variation of the horizontal displacement of the three feature points with time under the sudden rise and fall of the water level are presented in Figure 9b. The displacement mainly occurred in the first 1/4 of the day and the sea level remained unchanged in the next 3/4 of the day. Only a small displacement occurred under the action of steady-state groundwater seepage. When the water level rises suddenly, the horizontal displacement of point A is largest, reaching −6.0 mm. When the water level drops suddenly, the horizontal displacement of point B is slightly larger than that of point A on the top of the pile, which is 3.0 mm. The horizontal displacement of point C at the bottom of the pile is the smallest in both cases.

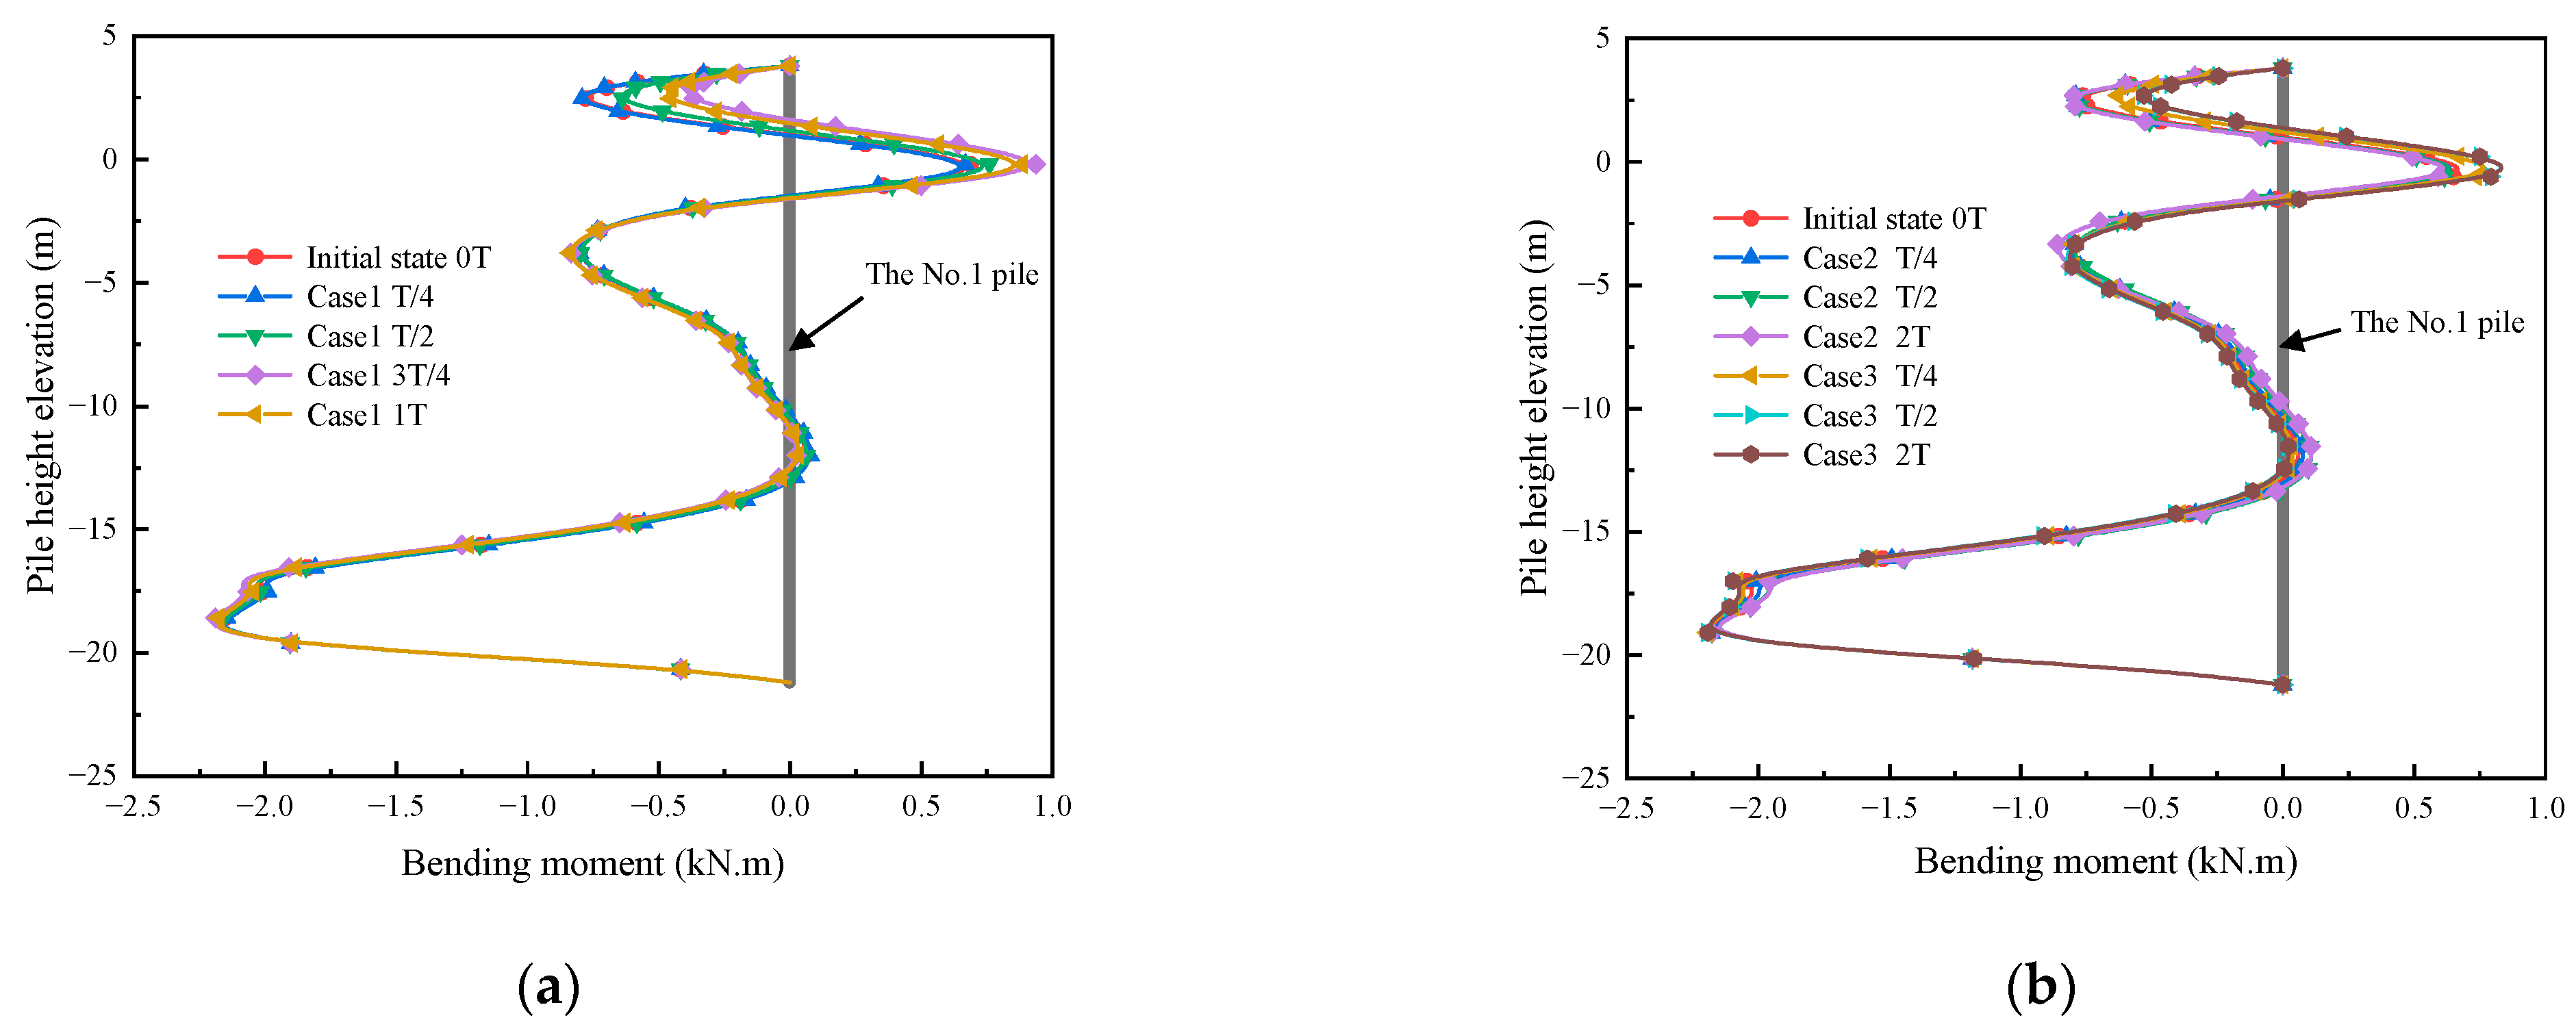
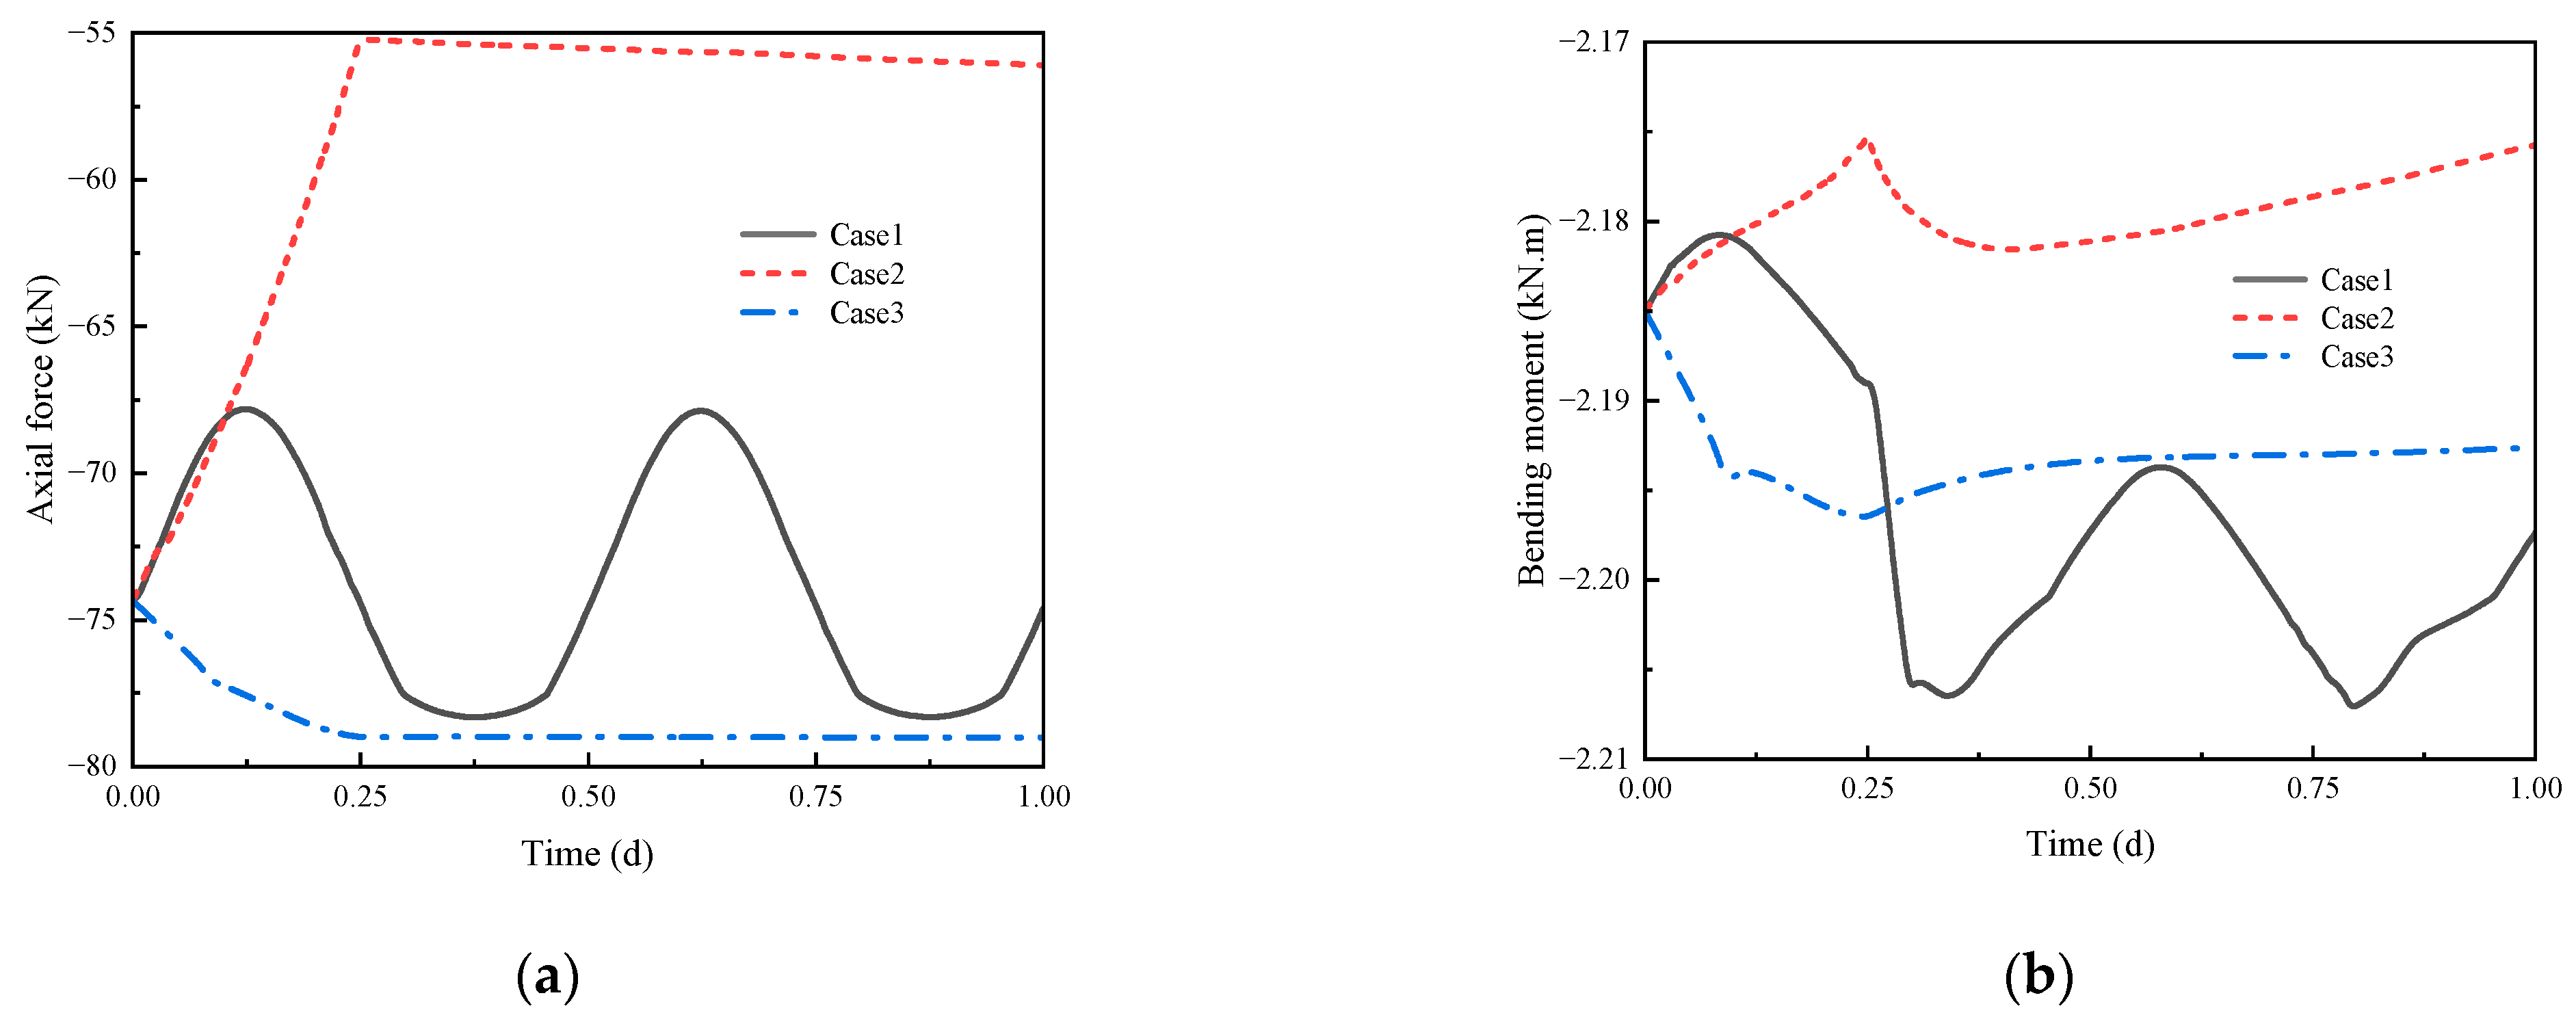
4.3. Pile Axial Force and Bending Moment

From the above analysis, it is evident that the closer to the sea, the more affected is the pile foundation by the tidal water-level change. Based on the abovementioned displacement analysis, the axial force and bending moment of the No. 1 pile closest to the sea area are analyzed.
The distribution of the axial force of the No. 1 pile body under tidal action is illustrated in Figure 10a. In one period (1T), all parts of the pile body are under pressure (the minus sign indicates compression) and the maximum pressure value appears in the middle of the pile body. Before the tidal action is applied, the maximum pressure generated by the external load on the pile body is 74 kN. At T/4, the pressure on any position of the pile decreases compared with the initial moment, indicating that in the first 1/4 cycle, the change in groundwater level in the land area causes the relative displacement between the pile and soil due to the rise of the tidal water level, and the pile “sinks” relative to the soil. During the 1/4–1/2 period, the external tidal water level drops from the highest point to the initial sea level and the corresponding pressure on any position of the pile increases compared with that at T/4. When close to the pressure distribution at the initial moment, the pile “floats” relative to the soil, resulting in negative frictional resistance. This indicates that the change in the axial force of the pile corresponds well with the change in the tide. Specifically, the rise of the tidal water level reduces the pressure on the pile body and the decrease in the tidal water level increases the pressure on the pile body. In the last 1/2 cycle, the change in the axial force of the pile body and the rise and fall of the tidal water level also meet the same law. After one period of tidal action, the distribution of the axial force of the pile body is not exactly the same as the initial moment, but the difference is not significant. It can be considered that the pile foundation and soil have returned to the initial stress state.
The axial force distribution of the No. 1 pile body under sudden water level rise and drop is presented in Figure 10b. The axial force at any position of the front T/2 inner pile body shows a decreasing trend as the sea level rises. This indicates that, within the period of 0–T/2, the pile foundation as a whole “sinks” relative to the soil. In the subsequent 3/2 period, the axial force remains constant since the water level remains at the highest water level and does not change. The results under the condition of sudden water level drop are opposite to those of sudden water level rise. The axial force of the inner pile body in the front T/2 increases with decreasing sea level and the axial force remains unchanged in the subsequent 3/2 period. At the same time, the height of the sudden drop of the water level is 1.9 m since the height of the sudden rise of the water level is 3 m. Therefore, the magnitude of the axial force decrease under the sudden rise case is greater than that of the axial force increase under the sudden drop case.
The evolution of the distribution of the bending moment on the No. 1 pile body under tidal action is presented in Figure 11a. During the whole period (1T), the bending moment on the pile body changes slightly (the side of the curve indicates that the side is subjected to tensile stress). When no tidal action is applied, the maximum bending moment generated by the upper load on the pile body is 2.184 kN·m. After one period of tidal action, the position of the maximum bending moment remains the same and the value increases slightly. The bending moment distribution of the No. 1 pile body under conditions of sudden water level rise and drop is illustrated in Figure 11b. It is found that the change in the external tidal water level does not significantly change the bending moment, indicating that the change in the pile bending moment caused by the change in sea level is small in all cases.
Figure 12a is the time-history change curve of the axial force in the section where the axial force is maximum under three cases. The initial value of the axial force is 74 kN and the maximum value of the axial force is 79 kN (a minus sign indicates compression). Therefore, the initial compressive stress and maximum compressive stress generated by the axial force on the pile section are as follows:
σ c i n i = F c i n i / π r 2 = 74 / ( π × 0.2 × 0.2 ) = 589   KPa
and
σ c m a x = F c m a x / π r 2 = 79 / ( π × 0.2 × 0.2 ) = 628   KPa
The evolution of the time-history variation curve of the bending moment in the section at the maximum bending moment under the three cases is presented in Figure 12b. The initial value of the bending moment is 2.184 kN·m and the maximum value of the bending moment is 2.208 kN·m. Therefore, the initial and maximum (compressive) tensile stresses produced by the bending moment on the pile body section are as follows:
σ f i n i = M i n i × r / ( π r 4 / 4 ) = 2.184 × 0.2 / ( π × 0.2 4 / 4 ) = 348   KPa
and
σ f m a x = M m a x × r / ( π r 4 / 4 ) = 2.208 × 0.2 / ( π × 0.2 4 / 4 ) = 352   KPa
In the above three cases, the maximum compressive stress caused by the axial force is generated near the middle of the No. 1 pile under the action of hydraulic load and its value is 628 kPa, which is 6.6% higher than the normal water level. The maximum tensile stress caused by the bending moment near the bottom of the No. 1 pile is 352 kPa, which is 1.1% higher than the normal water level. The hydraulic load leads to the increase in the axial force and bending moment of the No. 1 pile, which in turn leads to the increase in the maximum compressive stress and maximum tensile stress.

4.4. Pore Water Pressure and Mean Effective Stress

Figure 13 illustrates the pore water pressure distribution inside the model under the three cases. The pore water pressure mainly changes in the soil below the dike. The change in pore water pressure is most obvious when the water level rises abruptly. However, the changes in pore water pressure seem to be negligible under the other two cases. After a period of tidal action, the pore pressure does not return to the initial position because the soil is deformed, and the generated ultra-clean pore water pressure does not dissipate in time. Compared with Figure 6, the position where the pore water pressure changes significantly corresponds to the position where the soil deformation is large. The reason for this is that the increase in pore water pressure will lead to a smaller effective stress of the soil, which will lead to a decrease in soil shear strength. The change in pore water pressure in the composite foundation is closely related to the rise and fall in the tidal water level. The feature point D in the middle of the pile body of the No. 1 pile (as shown in Figure 8) is further studied.
Figure 14a reveals the variation in pore pressure of feature point D with time and under three cases. Under the tidal action, the pore water pressure at point D changes as a simple harmonic vibration. The pore water pressure at point D increases during high tide and decreases at low tide. The change period and law of the pore water pressure and tidal action tend to be consistent, but there is a certain hysteresis phenomenon. A sudden rise in the water level is equivalent to a rising tide, so the pore water pressure increases. In the subsequent stage, the water level remains extremely high and the pore water pressure remains unchanged. In the same way, a sudden drop in water level is equivalent to the fall of the tide, so the pore water pressure decreases and the water level remains extremely low in the subsequent stage with the pore water pressure unchanged.
Figure 14b illustrates the evolution of the average effective stress of feature point D with time under the three cases. The average effective stress at point D in tidal action is roughly in the form of simple harmonics. The average effective stress at point D decreases at high tide and increases at low tide. The change period and law of the average effective stress and tidal action tend to be consistent, and there is also a certain hysteresis effect. The average effective stress decreases when the water level rises sharply, and the water level remains extremely high in the subsequent stage while the average effective stress changes little during this period. The average effective stress increases when the water level drops sharply and the water level remains extremely low in the subsequent stage. The average effective stress hardly changes during this period. Comparing Figure 13a,b, the change trend in the average effective stress corresponds to the change trend in the pore water pressure; the two show a trend of ebb and flow. Additionally, the shear strength of the composite foundation in case 2 is the lowest among the three cases, which is the most unfavorable working condition, since the average effective stress is directly related to the shear strength. This also corresponds to the maximum deformation of the pile body in the case of a sudden rise in the water level mentioned above.

5. Conclusions

A road under construction in Jinwan District, Zhuhai City has adopted the soft foundation treatment method of plain concrete pile composite foundation. Considering the deep thickness of the soft base and proximity of the road to the sea, the soft base is easily affected by changes in tidal water level after treatment. Parameter calibration and finite element modeling based on the HSS model were carried out for this soft foundation soil layer. The influence of tidal water-level change on the performance of plain concrete pile composite foundation was studied for three typical cases. The main conclusions are as follows:
(1)
Based on the resonance column, triaxial consolidation drainage shear, triaxial consolidation drainage loading and unloading shear, and basic physical property tests, the HSS model parameters of typical silt and silty soil layers in the construction area were calibrated. Reliable parameters of the Zhuhai soft soil HSS model were determined. Compared with the soft soil in coastal areas, such as the Yangtze River Delta and Bohai Bay, Zhuhai soft soil exhibits worse engineering properties, including smaller dynamic shear modulus, cohesion, and internal friction angle.
(2)
Through numerical simulations, the deformation laws of the composite foundation under three cases of cyclic tidal action, water-level maintenance after sudden rise and drop are explored. Since the sea level rises the most under the condition of a sudden water-level rise and the rightmost side of the composite foundation is closest to the dike, the deformation of the pile foundation near the sea of the composite foundation is the largest, which is the most unfavorable condition among the three cases.
(3)
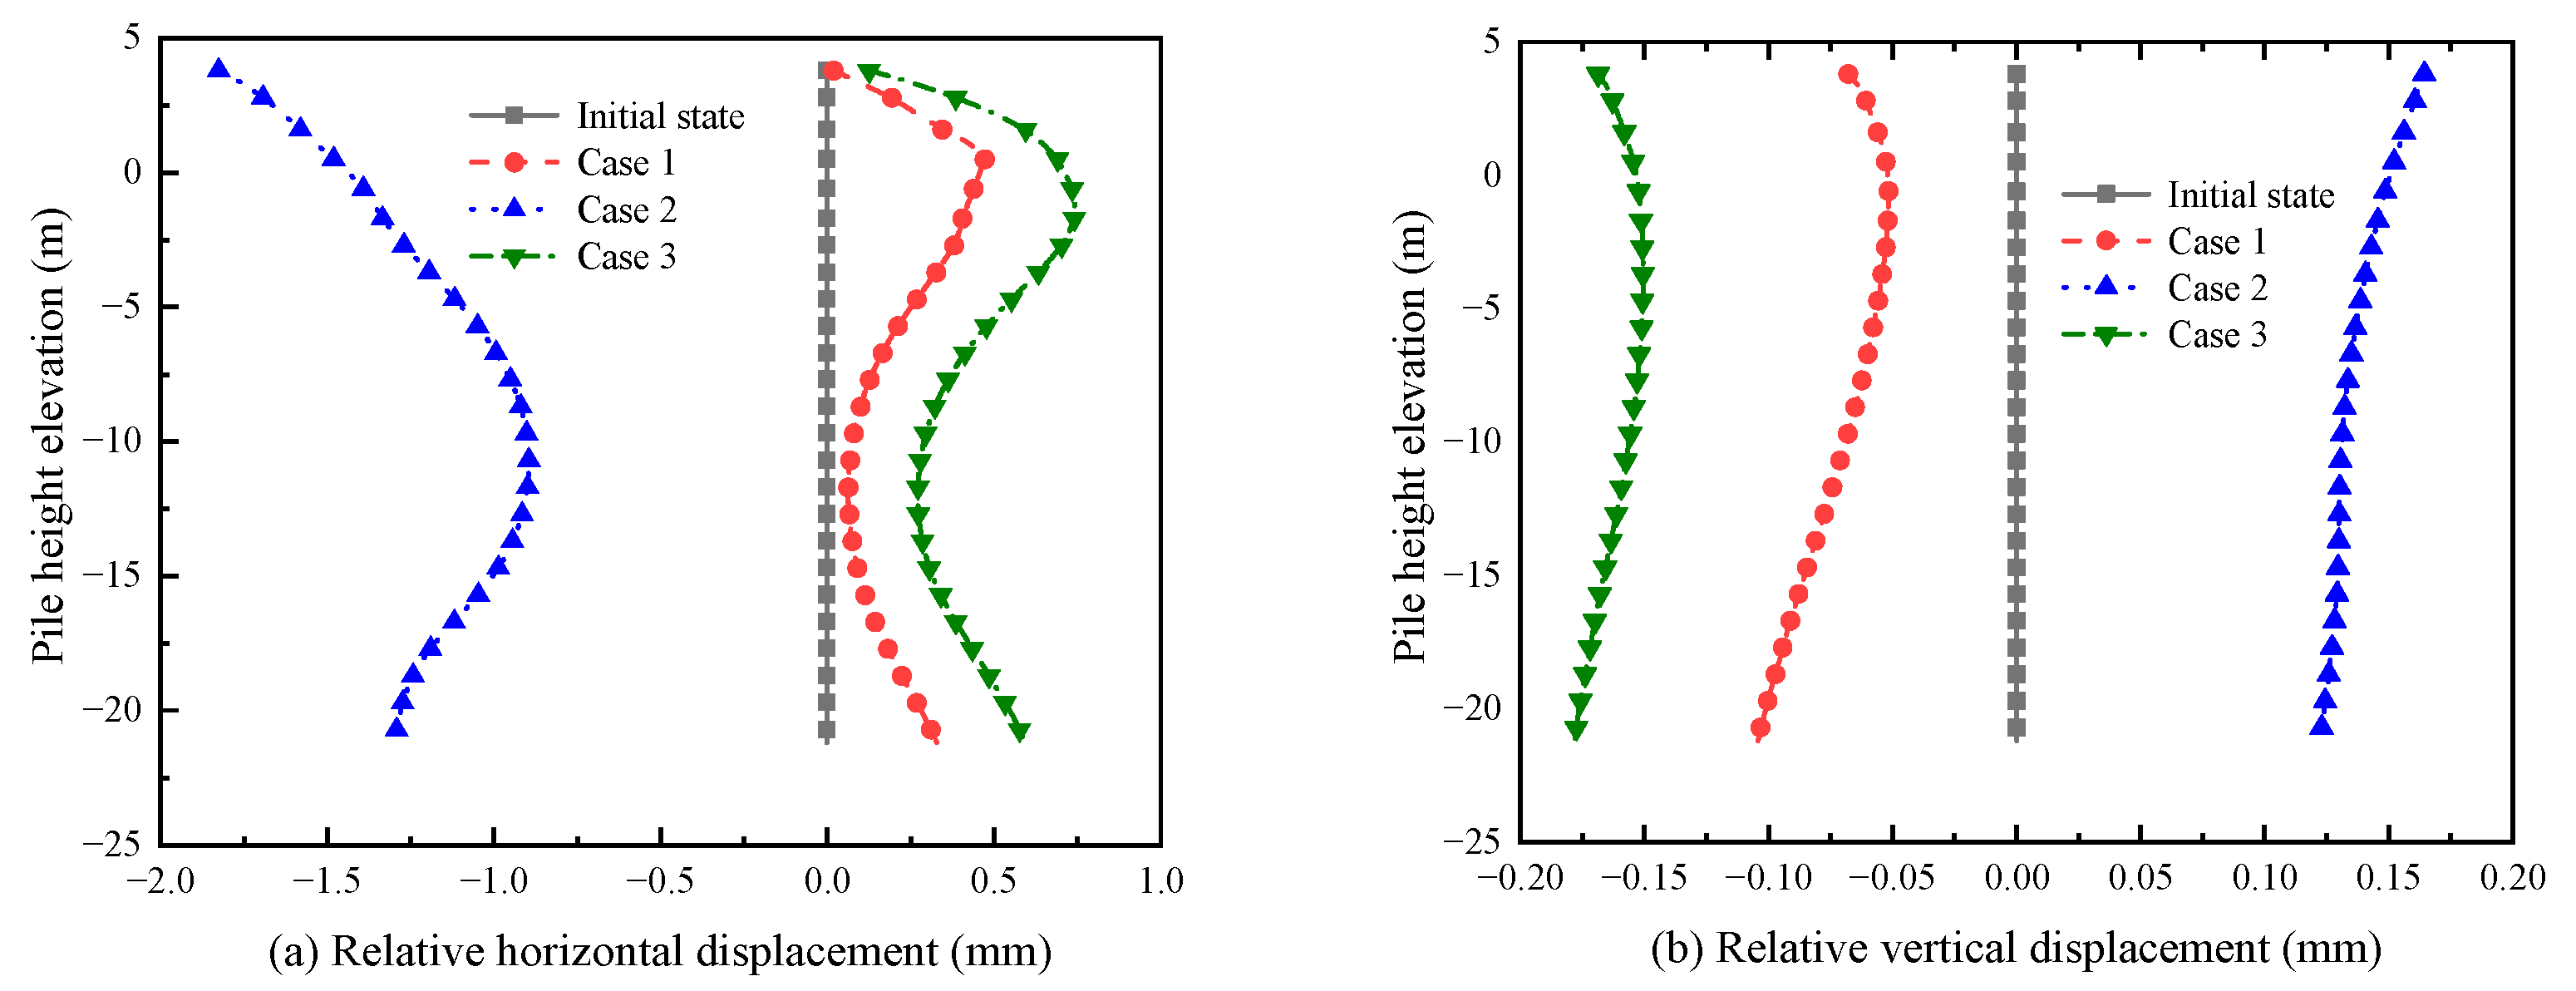
Under the three cases, the relative displacement of the No. 1 pile on the offshore side and the No. 21 pile on the far seaside in the composite foundation is small. The risk of problems, such as inclination, extrusion, and cracking of the composite foundation superstructure, is relatively small. The maximum deformation of the pile occurs at the No. 1 pile on the offshore side and its upper part passes through the dredger fill layer with a large permeability coefficient. Under the influence of groundwater seepage, the pile may cause a large horizontal displacement and tilt. After checking the calculation, deformation and force are less than the standard design value, so no additional protective measures were taken in the construction process.
(4)
The hydraulic load increases the axial force and bending moment of the pile, which needs to be considered for actual engineering. The average effective stress in the composite foundation corresponds to the changing trend in the pore water pressure, showing a changing law of ebb and flow.

Author Contributions

Conceptualization, J.L. (Jinze Li). and J.L. (Jiankun Liu); funding acquisition, C.T.; investigation, X.F.; methodology, Z.H.; resources, C.T.; supervision, J.L. (Jiankun Liu); validation, Z.H.; writing – original draft, X.F.; writing – review & editing, J.L. (Jinze Li). All authors have read and agreed to the published version of the manuscript.

Funding

This research was funded by the National Natural Science Foundation of China (grant number 52008409), Basic and Applied Basic Research Foundation of Guangzhou (grant number 202102020212), Industry-university-research Collaboration Project of Zhuhai, China (grant number ZH22017001200149PWC) and Science and Technology Project of Zhuhai, China (grant number. ZH22036204200009PWC).

Institutional Review Board Statement

Not applicable.

Informed Consent Statement

Not applicable.

Data Availability Statement

The data presented in this study are available on request from the corresponding author.

Conflicts of Interest

The authors declare no conflict of interest.

References

  1. Lin, D.F.; Lin, K.L.; Hung, M.J.; Luo, H.L. Sludge Ash/Hydrated Lime on the Geotechnical Properties of Soft Soil. J. Hazard. Mater. 2007, 145, 58–64. [Google Scholar] [CrossRef]
  2. Burland, J.B. On the Compressibility and Shear Strength of Natural Clays. Geotechnique 1990, 40, 329–378. [Google Scholar] [CrossRef]
  3. Tavenas, F.; Leroueil, S. The Behaviour of Embankments on Clay Foundations. Can. Geotech. J. 1980, 17, 236–260. [Google Scholar] [CrossRef]
  4. Jean, P.; Leblond, P. The Permeability of Natural Soft Clays. Part Ⅱ: Permeability Characteristics. Can. Geotech. J. 1983, 20, 645–660. [Google Scholar]
  5. Lin, Y.; Ai, K.; Huang, L. Issues of Engineering Characteristics and Engineering Construction of Soft Clay in Zhuhai Region. Chinese J. Rock Mech. Eng. 2006, 25, 3372–3376. [Google Scholar]
  6. Peng, L.C.; Lin, Y.X.; Huang, L.J. Analysis and Treatment of Quality Accident of Pipe Piles in Soft Clay Area of Zhuhai. Chinese J. Geotech. Eng. 2011, 33, 169–173. [Google Scholar]
  7. Wang, Y.; Chen, Y.; Qiao, W.; Zuo, D.; Hu, Z.; Feng, Q. Road Engineering Field Tests on an Artificial Crust Layer Combined with Pre-Stressed Pipe Piles over Soft Ground. Soil Mech. Found. Eng. 2018, 54, 402–408. [Google Scholar] [CrossRef]
  8. Chen, K.; Gan, G. Flexural Test and Numerical Simulation of a New Combination Splice for Prestressed, Precast Concrete Piles Using High-Strength Steel Strands. Buildings 2022, 12, 1371. [Google Scholar] [CrossRef]
  9. Wang, Y.; Sang, S.; Zhang, M.; Bai, X.; Su, L. Investigation on In-Situ Test of Penetration Characteristics of Open and Closed PHC Pipe Piles. Soils Found. 2021, 61, 960–973. [Google Scholar] [CrossRef]
  10. Umravia, N.B.; Solanki, C.H. Comparative Study of Existing Cement Fly Ash Gravel Pile and Encased Stone Column Composite Foundation. IOP Conf. Ser. Mater. Sci. Eng. 2021, 1197, 1–9. [Google Scholar] [CrossRef]
  11. Zou, X.J.; Zhao, Z.M.; Xu, D.B. Consolidation Analysis of Composite Foundation with Partially Penetrated Cement Fly-Ash Gravel (CFG) Piles under Changing Permeable Boundary Conditions. J. Cent. South Univ. 2015, 22, 4019–4026. [Google Scholar] [CrossRef]
  12. Wang, D.F.; Wang, X.Q.; Zhang, N.T.; Chen, Y. Numerical Simulation of Reinforcement Effect and Settlement of Concrete Pile Composite Foundation. Adv. Mater. Res. 2013, 779, 434–438. [Google Scholar] [CrossRef]
  13. Wang, L.; Zhao, Q.; Mao, J.; Wu, J.; Guo, F. Bearing Capacity and Simplified Calculation Approach for Large-Diameter Plain-Concrete Piles. Arab. J. Geosci. 2021, 14, 1–13. [Google Scholar] [CrossRef]
  14. Zhu, Q.; Zuo, W.; Xu, P.; Wang, H. Research and Application of Stress and Strain Testing Method for Plain Concrete Pile. E3S Web Conf. 2021, 233, 3–6. [Google Scholar] [CrossRef]
  15. Li, S.C.; Xie, C.; Liang, Y.H.; Yan, Q. Seepage Flow Model and Deformation Properties of Coastal Deep Foundation Pit under Tidal Influence. Math. Probl. Eng. 2018, 2018, 1–11. [Google Scholar] [CrossRef] [Green Version]
  16. Zhang, L.; Wei, X. Responses of Excavation Base under Influences of Confined Aquifer: An Analytical Approach. Mar. Georesources Geotechnol. 2021, 39, 241–254. [Google Scholar] [CrossRef]
  17. Ying, H.W.; Sun, W.; Zhu, C.W. Experiment Research on Response of Excess Pore Pressure to Wave around Near-Sea Excavation. Rock Soil Mech. 2016, 37, 187–194. [Google Scholar]
  18. Hong, Y.; Ng, C.W.W. Base Stability of Multi-Propped Excavations in Soft Clay Subjected to Hydraulic Uplift. Can. Geotech. J. 2013, 50, 153–164. [Google Scholar] [CrossRef]
  19. Xiang, X.C.; Hou, J.S.; Zhu, C.Q. Consolidation Deformation Properties of Silt Roadbed under Effect of Tide. Rock Soil Mech. 2009, 7598, 1142–1146. [Google Scholar]
  20. Ying, H.W.; Nie, W.F.; Huang, D.Z. Semi-Analytical Solution of Pore Pressure Response around Excavations to Groundwater Level Fluctuation. Chinese J. Geotech. Eng. 2014, 36, 1012–1019. [Google Scholar]
  21. Ying, H.; Nie, W.; Huang, D. Influences of Groundwater Level Fluctuation on the Stability of Gravity Retaining Wall of Pits. Chinese J. Rock Mech. Eng. 2014, 33, 2370–2376. [Google Scholar]
  22. Li, L.; Barry, D.A.; Pattiaratchi, C.B. Numerical Modelling of Tide-Induced Beach Water Table Fluctuations. Coast. Eng. 1997, 30, 105–123. [Google Scholar] [CrossRef]
  23. Liu, R.; Yuan, Y.; Fu, D.; Sun, G. Numerical Investigation to the Cyclic Loading Effect on Capacities of the Offshore Embedded Circular Foundation in Clay. Appl. Ocean Res. 2022, 119, 103022. [Google Scholar] [CrossRef]
  24. Chen, J.; Lin, C.; Liu, S.; Mo, H. Study on Supporting Structure Performance of Deep Soft Soil Foundation Pit near Sea under Waves, Tides, Vibration, and Unbalanced Loads. Adv. Civ. Eng. 2020, 2020, 1–18. [Google Scholar] [CrossRef]
  25. Hsieh, P.G.; Ou, C.Y. Shape of Ground Surface Settlement Profiles Caused by Excavation. Can. Geotech. J. 1998, 35, 1004–1017. [Google Scholar] [CrossRef]
  26. Samanta, M.; Bhowmik, R. 3D Numerical Analysis of Piled Raft Foundation in Stone Column Improved Soft Soil. Int. J. Geotech. Eng. 2019, 13, 474–483. [Google Scholar] [CrossRef]
  27. Gu, X.Q.; Wu, R.T.; Liang, F.Y.; Gao, G.Y. On HSS Model Parameters for Shanghai Soils with Engineering Verification. Rock Soil Mech. 2021, 42, 833–845. [Google Scholar]
  28. Cudny, M.; Truty, A. Refinement of the Hardening Soil Model within the Small Strain Range. Acta Geotech. 2020, 15, 2031–2051. [Google Scholar] [CrossRef] [Green Version]
  29. Clayton, C.R.I. Stiffness at Small Strain: Research and Practice. Geotechnique 2011, 61, 5–37. [Google Scholar] [CrossRef] [Green Version]
  30. Huang, X.; Schweiger, H.F.; Huang, H. Influence of Deep Excavations on Nearby Existing Tunnels. Int. J. Geomech. 2013, 13, 170–180. [Google Scholar] [CrossRef]
  31. Yin, J. Application of Hardening Soil Model with Small Strain Stiffness in Deep Foundation Pits in Shanghai. J. Geotech. Eng. 2010, 32, 166–172. [Google Scholar]
  32. Liu, R.; Basu, P.; Xiong, H. Laboratory Tests and Thermal Buckling Analysis for Pipes Buried in Bohai Soft Clay. Mar. Struct. 2015, 43, 44–60. [Google Scholar] [CrossRef]
  33. Liu, R.; Yan, S.; Wu, X. Model Test Studies on Soil Restraint to Pipeline Buriedin Bohai Soft Clay. J. Pipeline Syst. Eng. Pract. 2013, 4, 49–56. [Google Scholar] [CrossRef]
Figure 1. (a) Typical geotechnical profile, (b)Finite element model and grid division.
Buildings 13 00563 g001
Figure 2. Top view of the standard section of the foundation. (a) Plum blossom pile (b) Square pile.
Buildings 13 00563 g002
Figure 3. (a) Dynamic shear modulus–dynamic strain amplitude relationship curve under different confining pressure, (b) Reciprocal of dynamic shear modulus–dynamic strain amplitude relationship curve under different confining pressure.
Buildings 13 00563 g003
Figure 4. Time-varying curves of water-level changes under three cases.
Buildings 13 00563 g004
Figure 5. Measured and simulated data of fluctuation amplitude of water table.
Buildings 13 00563 g005
Figure 6. Contours of horizontal displacement and vertical displacement of foundation soil under three cases.
Buildings 13 00563 g006
Figure 7. Horizontal and vertical displacement of No. 1 pile relative to No. 21 pile.
Buildings 13 00563 g007
Figure 8. Horizontal displacement of the No. 1 pile under three cases: (a) Horizontal displacement of No. 1 pile in one tidal action period. (b) Horizontal displacement of No. 1 pile when the water level suddenly rises and drops.
Buildings 13 00563 g008
Figure 9. Time-history curves of the horizontal displacement of three characteristic points (indicated in Figure 8) of the No. 1 pile under three cases: (a) Horizontal displacement of feature points in 3 d due to tidal action. (b) Horizontal displacement of feature points when the water level rises and drops suddenly.
Buildings 13 00563 g009
Figure 10. Axial force distribution of the No. 1 pile body under three cases: (a) Axial force distribution of the No. 1 pile body under tidal action. (b) Axial force distribution of the No. 1 pile body under sudden water level rise and drop.
Buildings 13 00563 g010
Figure 11. Bending moment distribution of pile No. 1 under three cases: (a) Bending moment distribution of the No. 1 pile body under tidal action. (b) Bending moment distribution of the No. 1 pile body when the water level rises and falls suddenly.
Buildings 13 00563 g011
Figure 12. Time-history curves of maximum axial force and bending moment of the No. 1 pile under three cases: (a) Time-history curve of maximum axial force. (b) Time-history curve of maximum bending moment.
Buildings 13 00563 g012
Figure 13. Contours of pore water pressure in the initial state and at the end of moment of the three cases.
Buildings 13 00563 g013
Figure 14. Fluctuation at feature point D under three cases:(a) Pore water pressure fluctuation. (b) Average effective stress fluctuation.
Buildings 13 00563 g014
Table 1. Dike material parameters.
Structure TypeMaterial ModelElastic Modulus/MPaPoisson’s RatioPermeability Coefficient m/d
DikeLinear elasticity 30   ×  1030.10
Dike stoneLinear elasticity 28   × 1030.15100
Dry block stoneLinear elasticity 26 × 1030.2100
Two pieces of stoneLinear elasticity 20 ×  1030.2100
Filter layerLinear elasticity 15 ×  1030.2550
Fence boardLinear elasticity 15 ×  1030.25100
Masonry stoneLinear elasticity 23 × 1030.18 2.6   ×  10−3
C30 concreteLinear elasticity 30   × 1030.20.026 ×  10−3
Table 2. Reference dynamic shear modulus of each sludge sample under different confining pressures.
Confining Pressure /kPaa /MPa−1   G 0 /MPa G 0 r e f /MPa G 0 a v e r e f /MPa
1500.109.3313.3215.5
21000.06814.7814.78
31500.04721.3216.40
42000.03627.7917.37
Table 3. Soil layer material parameters.
Soil TypeMaterial Model   γ u n s a t   γ s a t   E 50 r e f   E e o d r e f   E u r r e f m   c   φ k   G 0 r e f   γ 0.7
/(kN/m3)/(kN/m3)/MPa/MPa/MPa /kPa/(m/d)/MPa
Dredging FillM–C182050 2320.3
SiltHSS1515.433100.751190.8 × 10−3162 × 10−4
Muddy soilHSS16.516.83.53.5140.716.4103.3 × 10−320 1.5 × 10⁻⁴
Note: The parameters in the table, from left to right, are: unsaturated gravity, saturation weight, standard triaxial drainage test secant stiffness, confining compression test tangent stiffness, unloading and reloading stiffness, stress-dependent power exponent of stiffness, effective cohesion, effective friction angle, permeability coefficient, and shear strain corresponding to when the shear modulus decays to 70% of the initial shear modulus.
Table 4. Comparison of HSS model parameters.
Soft Soil HSS Model Parameters   c
/Kpa
φ
E 50 r e f
/MPa
G 0 r e f
/MPa
γ 0.7
Zhuhai area (this test)1193162 × 10−4
Yangtze River Delta Region (Shanghai)1223.33.338.8 3.2 × 10⁻⁴
Bohai rim (Tianjin)2025650 3.6 × 10⁻⁴
Note: The symbols have the same meaning as those in Table 3.
Disclaimer/Publisher’s Note: The statements, opinions and data contained in all publications are solely those of the individual author(s) and contributor(s) and not of MDPI and/or the editor(s). MDPI and/or the editor(s) disclaim responsibility for any injury to people or property resulting from any ideas, methods, instructions or products referred to in the content.

