Article

High-Speed Videogrammetry for Seismic Performance of the Spherical Reticulated Shell Structure on the Shaking Table

Key Laboratory for Urban Geomatics of National Administration of Surveying, Mapping and Geoinformation, Beijing University of Civil Engineering and Architecture, 1 Zhanlanguan Road, Beijing 100048, China
*
Author to whom correspondence should be addressed.
Buildings 2023, 13(2), 553; https://doi.org/10.3390/buildings13020553
Submission received: 18 November 2022 / Revised: 27 December 2022 / Accepted: 11 February 2023 / Published: 17 February 2023
(This article belongs to the Special Issue Nondestructive Evaluation (NDE) of Buildings and Civil Infrastructure)

Abstract

:
Spherical reticulated shell structure is an important structural form of large-span space buildings. It is of great significance to monitor three-dimensional (3D) dynamic responses of spherical reticulated shell structure to better understand its seismic performances, which will be helpful in the future to ensure the healthy condition of large-span space buildings during their lifespan. In this study, with the advantages of non-contact and high accuracy, a high-speed videogrammetric measurement method is proposed for monitoring the 3D dynamic responses of the seismically isolated, spherical, reticulated shell structural model. Two issues—the high-speed videogrammetric acquisition system and network configuration, as well as image sequence target tracking and positioning—are emphasized to achieve a cache of high-speed images and to improve the accuracy of tracking and positioning target points. The experimental results on the shaking table from the proposed method have been compared with those from traditional Optotrak Certus and accelerometers. The results prove that the proposed method is capable and useful for analyzing the seismic performance of spherical reticulated shell structures, as the dynamic responses monitoring accuracy of the method can reach the submillimeter level, with root mean square error values of 0.32 mm, 0.7 mm and 0.06 mm in the X, Y and Z directions, respectively.

1. Introduction

Spherical reticulated shell structure is one of the important structural forms of large-span space buildings. With the advantages of cheap materials and excellent performance, it has been a great development prospect in recent years [1]. At present, spherical reticulated shell structures are mainly used for airports, stations, gymnasiums and other densely populated infrastructures. However, as a multi-degree-of-freedom nonlinear structure, the structure members and nodes of the spherical reticulated shell structure may be deformed in three dimensions when an earthquake occurs. For example, Lushan Gymnasium, the largest-span space structure in Lushan County, Ya’an City, Sichuan Province, China, suffered different degrees of damage in its members and nodes during the Lushan earthquake in 2013 [2]. Therefore, we need to monitor the three-dimensional (3D) dynamic responses and analyze the seismic performance of shell structure before it is used to construct large-span space buildings [3].
In general, the earthquake shaking table can be used to test the seismic performance of scaled structure models, which is a specific device for shaking structural models by creating simulated seismic waves [4]. Moreover, displacement and acceleration are the most frequently used response parameters for analyzing the seismic performance of structures [5,6]. Contact-based transducers, such as linear variable differential transformers [7], strain gauges [8] and accelerometers [9], are commonly applied to acquire the dynamic responses of monitored structures on the shaking table. However, there are several limitations for contact-based transducers: (1) If a large number of transducers are arranged, it is time-consuming and inconvenient to install contact-based transducers on the monitored structures [10]. (2) When a structure has been damaged or experienced a large deformation, the transducer may be out of its range, and the correct dynamic results cannot be obtained. In order to solve the defects of contact-based transducers, non-contact-based transducers, such as Global Positioning System (GPS), Laser Doppler Vibrometer (LDV), Terrestrial Laser Scanning (TLS) and Digital Holographic Interferometry (DHI), have been applied to obtain the dynamic responses of structures. However, due to some different disadvantages, such as high cost, low acquisition frequency and small measurement range, it is not suitable to monitor large and complex reticulated shell structures using the above non-contact-based transducers [11,12,13,14,15,16].
In recent years, with the continuous development of image sensors, the frame rate per second (fps) of high-speed cameras can exceed 10,000 frames, with a one-million level of resolution for image sensors. Therefore, with the advantages of high frame rate, high resolution and low cost, high-speed cameras have been greatly applied and developed in the fields of civil engineering, medicine, military and biology [17,18,19,20]. For example, Steinbauer et al. used a Y4 high-speed camera with a frame rate of 6000 fps to trace the impact of hailstones on an external thermal insulation composite system [21]. Bailey et al. used two high-speed cameras with a frame rate of 240 fps to accurately calculate the changes in translational and rotational velocity of a helmet and further analyze American football helmet kinematics [22]. Ma et al. used two high-speed cameras at 320 × 320 resolution and 2681 fps to obtain the bullet velocity parameter [23]. However, since high-speed cameras generate massive amounts of image data per second, images will be lost if the acquisition system cannot meet the requirements of high-speed storage. Moreover, the massive image storage integrity can also affect the accuracy of image processing results. Therefore, it is necessary to configurate an adapted hardware system (including high-speed transmission cables, acquisition card and high-speed storage media) and design an efficient writing strategy (buffer pool) to realize high-speed image storage. At present, many scholars have proposed solutions to solve the problem of high-speed image storage in real time. Combining asynchronous First Input First Output (FIFO) and the Double Data Rate 2 (DDR2) caching method, Wang et al. designed a high-speed image acquisition system with a transmission speed of 800 Mb/s [24]. With the method of memory ping-pong operation and channel arbite, Zhou et al. optimized the DMA dual channel for a high-speed data acquisition system that can receive optical fiber data at the rate of 7.57 Gb/s [25]. Sanskriti et al. proposed the Reconfigurable First-In First-Out (r-FIFO) method to acquire Complementary Metal Oxide Semiconductor (CMOS) data [26]. However, these methods only provide the framework for the overall design of the buffer pool and do not mention how to set the size of individual buffers. Therefore, combined with the minimal storage unit size of the storage media, an adaptive optimal buffer pool is designed to cache high-speed images in this paper.
As high-speed videogrammetric network configuration can determine the position of the target in the image, which affects the accuracy of target point tracking and positioning, it is also important to configure the high-speed videogrammetric network after configuring the high-speed videogrammetric acquisition system. High-speed videogrammetric network configuration mainly includes a high-speed camera configuration and control network configuration. High-speed camera configuration includes normal case photography and convergent photography. For high-speed videogrammetry, the convergent photography can obtain higher accuracy than normal case photography [27]. The control network configuration method, including the relative control method and control points method, can obtain the scale and orientation parameters of the images. For example, Rajaram et al. placed coded markers at different locations on the wall of masonry buildings to obtain the scale parameters in the relative control method [28]. The relative control method was very effective for measuring targets at the same base plane. Yet, because the nodes in the spherical reticulated shell structures were not at the same base plane, the method was not suitable for spherical reticulated shell structures. The control points method can obtain more accurate scale and orientation parameters of different spatial positions by the 3D coordinates of the control targets [29,30]. Therefore, according to the spatial geometric characteristics of the spherical reticulated shell structures, a high-speed videogrammetric network configuration is designed in this study to improve the accuracy of target point tracking and positioning.
In general, for structure monitoring, the commonly used excitation frequency is about in the range of 0.1 Hz~50 Hz. Therefore, in order to obtain the accurate dynamic response of the structure, the frame rate of the camera is set in the range of 50 fps~1000 fps. For such massive image sequences, it is difficult to track and position the targets, which will affect the accuracy of the 3D reconstruction of targets. Therefore, it is crucial to track and position the targets of image sequences. At present, the target-tracking and positioning algorithms have been relatively mature in videogrammetry. For example, with a camera at 50 fps and a single camera template-matching algorithm, Feng et al. measured the bridge displacement for low-cost video measurement of structural health monitoring [31]. Wei et al. proposed a multi-camera 3D DIC method to measure the seismic performance of large structures with 4 high-speed cameras at 50 fps and a resolution of 2048 × 2048 pixels [32]. Using a high-speed camera with a resolution of 512 × 400 and a frame rate of 1000 fps, Goyal et al. obtained the displacement for a single-room full-scale model of an interlinked block masonry system on the shaking table [33]. With less than 0.5 mm displacement accuracy, Tong et al. successfully conducted a rubber support shaking table experiment to monitor the 3D displacement time curve at key points by using a 3-camera high-speed video measurement system consisting of 3 CMOS high-speed cameras at a speed of 300 fps [34]. Our team has proposed a videogrammetric image sequence processing technique for tracking target detection [35]. The method has been successfully applied for 3D, structural, progressive collapse measurement. Thus, in this study, we would like to further apply the proposed method to monitor the seismic response of the more complex spatial spherical reticulated shell structure.
In order to acquire the dynamic response of the spherical reticulated shell structure on the shaking table, this study proposed a high-speed videogrammetric measurement method. The method can obtain the 3D dynamic information of the key locations on the monitored structural model accurately through: (1) proposing a high-speed videogrammetric hardware system and network configuration method to solve the problem of massive image storage and improve the accuracy of target tracking and positioning, and (2) applying the critical technique of image sequence tracking and positioning to obtain the precise 3D coordinates of the targets. The rest of the paper is organized as follows. Section 2 presents the methodology of the proposed high-speed videogrammetry. Section 3 presents the experimental setup, experimental results and accuracy analysis. Some conclusions are presented in Section 4.

2. Methods

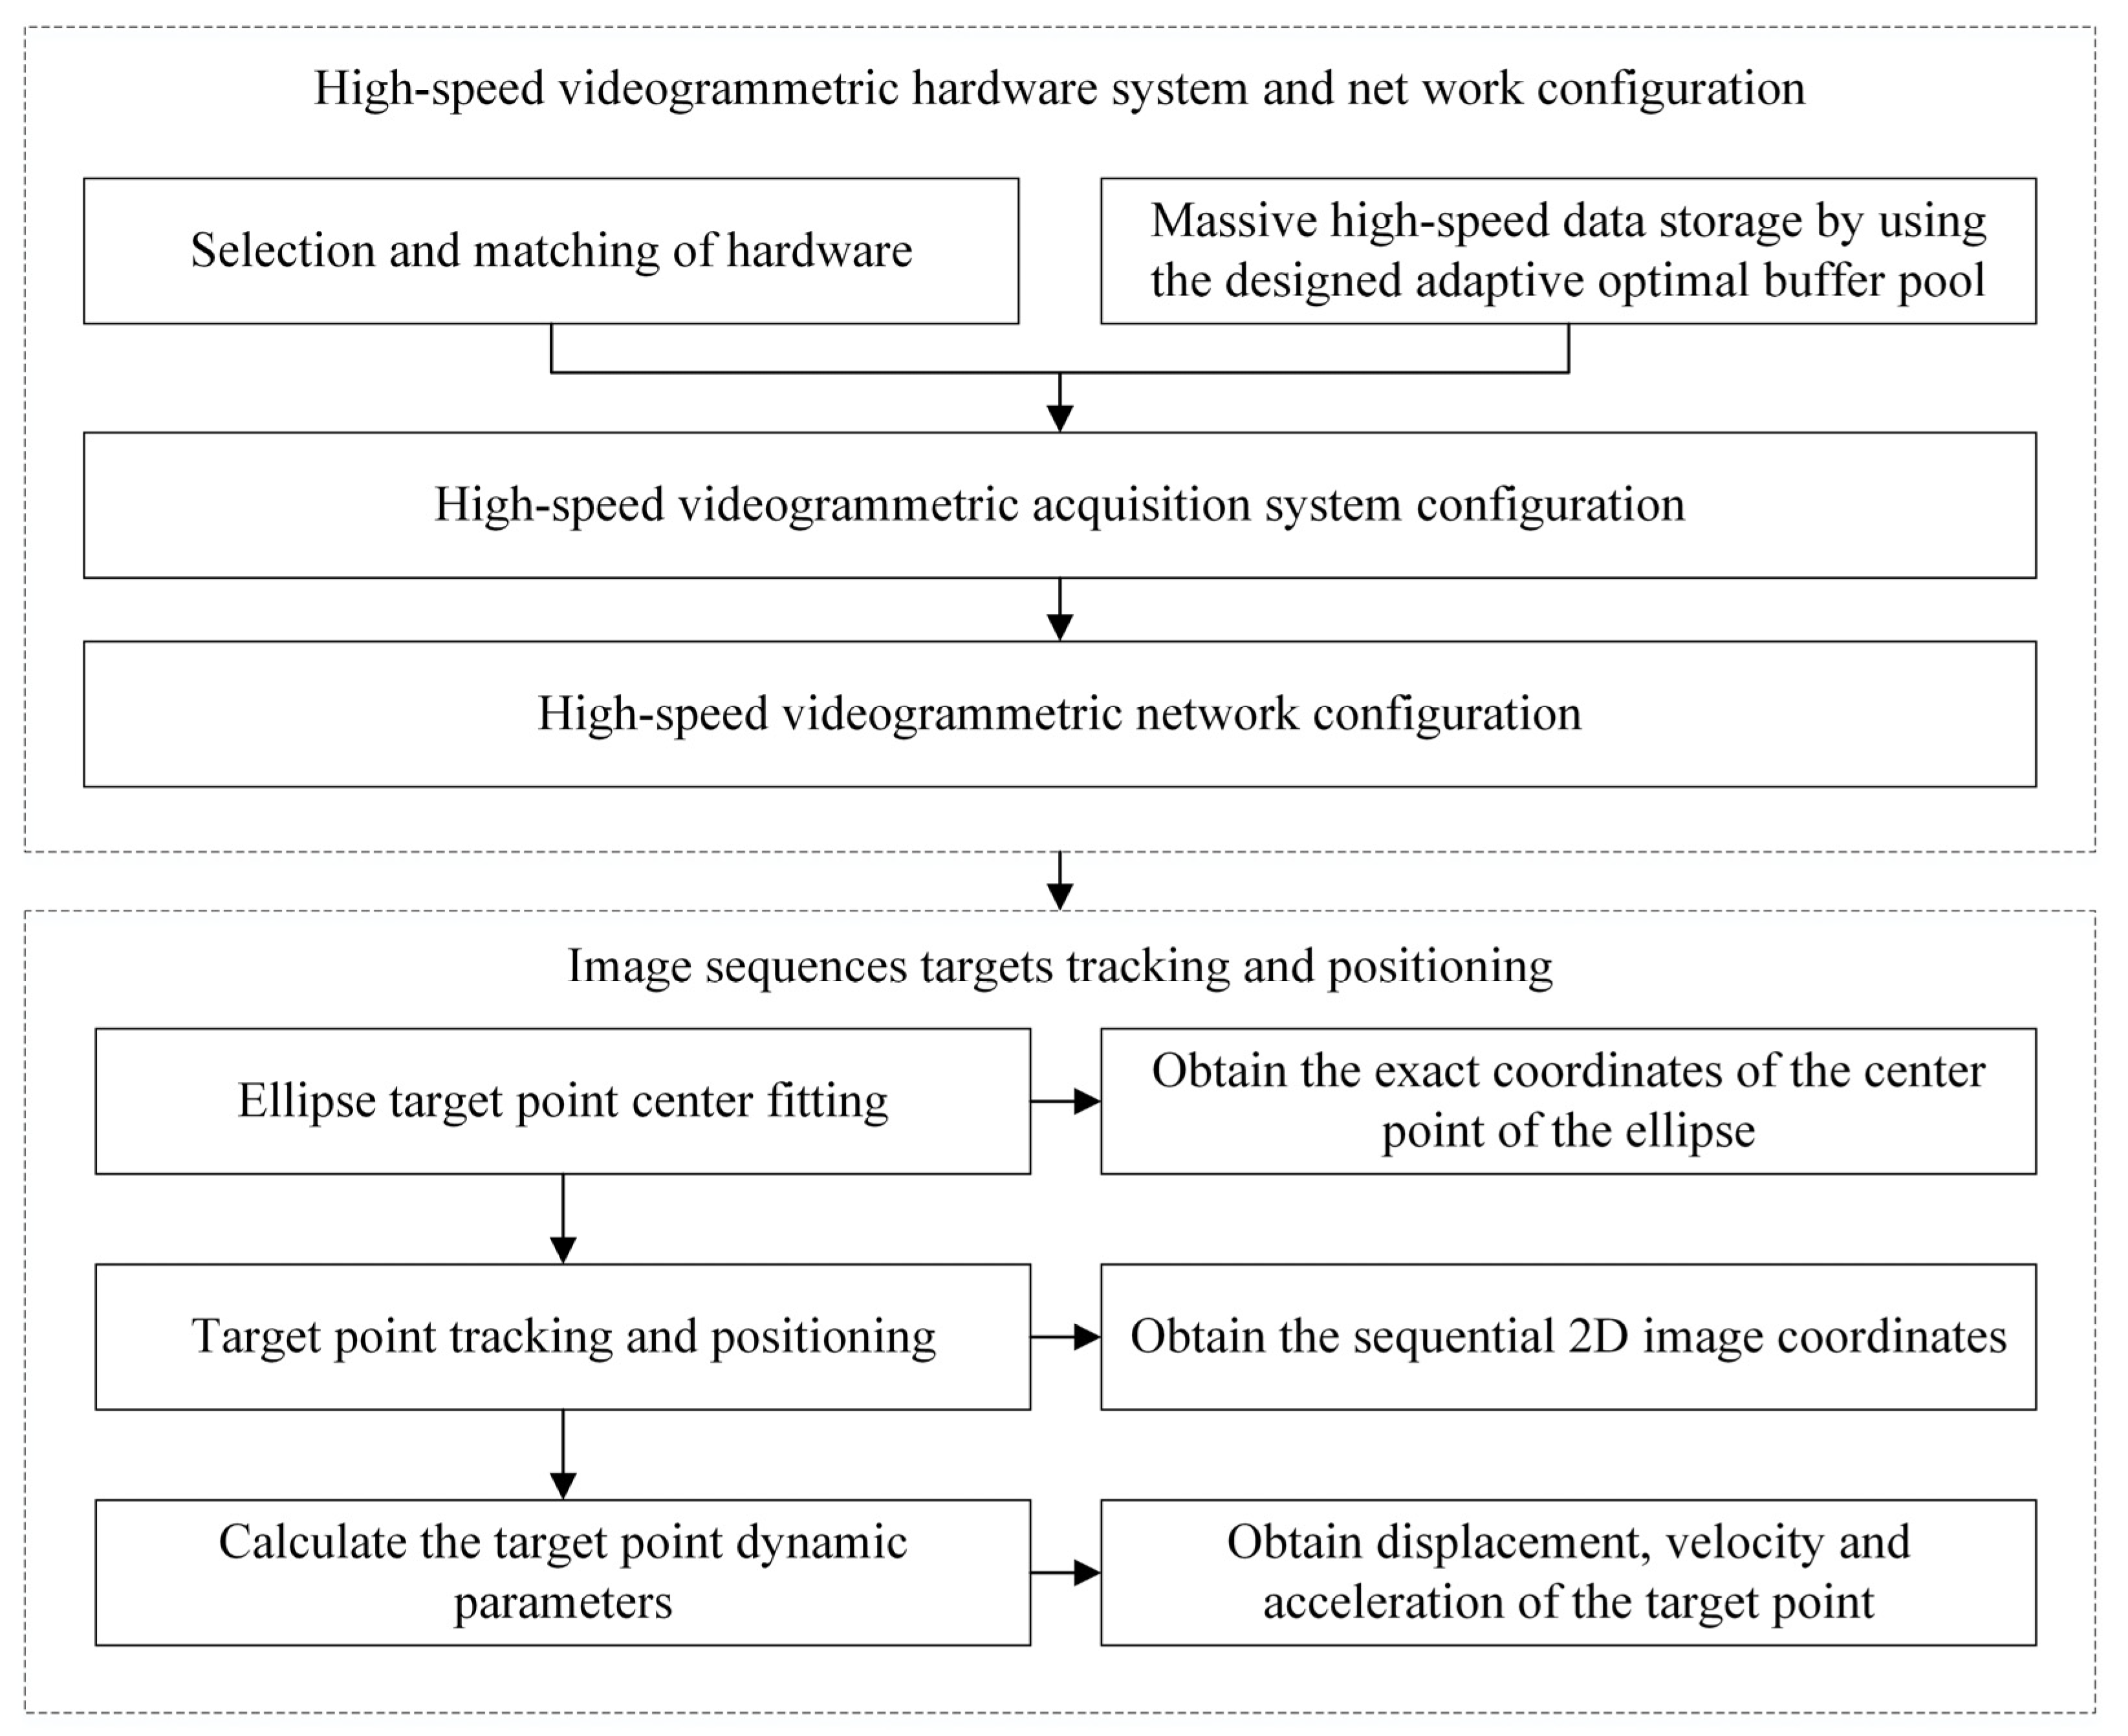
Figure 1 shows the entire framework of the proposed high-speed videogrammetric-based methodology, which includes the following two key components: (1) high-speed videogrammetric acquisition system and network configuration, and (2) targets tracking and positioning in the obtained image sequences.

2.1. High-Speed Videogrammetric Acquisition System and Network Configuration

2.1.1. High-Speed Videogrammetric Acquisition System Configuration

In general, the higher accuracy of the 3D spatial coordinates of critical points can be guaranteed by the used high-speed cameras with a higher resolution and a higher frame rate. It is important to acquire and store massive images in real time to further calculate the 3D coordinates of targeting points. A high-speed videogrammetric hardware system and massive image sequence transmission are the two critical issues in the high-speed videogrammetric acquisition system.
(1) High-speed videogrammetric hardware system construction is necessary to achieve the acquisition of massive images in real time. In this study, two high-speed CMOS cameras (OPTRONIS CP80-4-M500; parameters shown in Table 1), two high-speed acquisition cards, one high-speed synchronous controller, two Industrial Personal Computers (IPC, one of which was used as the host computer) and eight CoaXPress (CXP) cables were integrated to construct the high-speed videogrammetric hardware system. In the high-speed videogrammetric hardware system, as shown in Figure 2, two high-speed acquisition cards were plugged into two IPCs. The high-speed CMOS cameras were connected to the high-speed acquisition card via four CXP cables. The synchronous controller was connected to the host computer and the two high-speed cameras through the cables. The host computer would send synchronous signals to the two cameras through the synchronous controller, and then two high-speed cameras would capture images simultaneously and store the image sequences in the high-speed Solid-State Drive (SSD) of the IPC through the high-speed acquisition cards. The above high-speed videogrammetric hardware system can ensure the stability of the acquisition system.
(2) High efficiency of massive image sequence transmission is an essential part to ensure the storage efficiency of massive images in real time. As shown in Figure 3, high-speed image sequences are outputted from the acquisition card and are stored from memory to a high-speed SSD. The read and write performance of the high-speed SSD cannot be fully released due to the impact of the operating system (OS). Therefore, it is important to release the hardware performance from the software layer. Thus, in this study, firstly, according to the principle of file writing, an adaptive optimal buffer pool was designed to cache high-speed image sequences from the acquisition card. With the purpose of changing the size of a single buffer into a multiple of the minimum storage unit (4 k bytes) of a high-speed SSD, the capacity of a single buffer was expanded to a multiple of 4096 (4 k) bytes, which could improve storage efficiency. Secondly, a storage strategy of the cache buffer of the high-speed SSD was applied to the high-speed image sequences. Due to the limitation of Input/Output (I/O) per second for the high-speed SSD, the proposed storage strategy could reduce the number of I/O to improve the storage efficiency.

2.1.2. High-Speed Videogrammetric Network Configuration

The position of the target in the image is determined by the network configuration. Therefore, the network configuration affects the accuracy of target tracking and positioning. There are three issues that need to be addressed for an optimal high-speed videogrammetric network configuration: (1) the location of cameras, (2) the design of artificial targets and (3) the location of artificial targets.
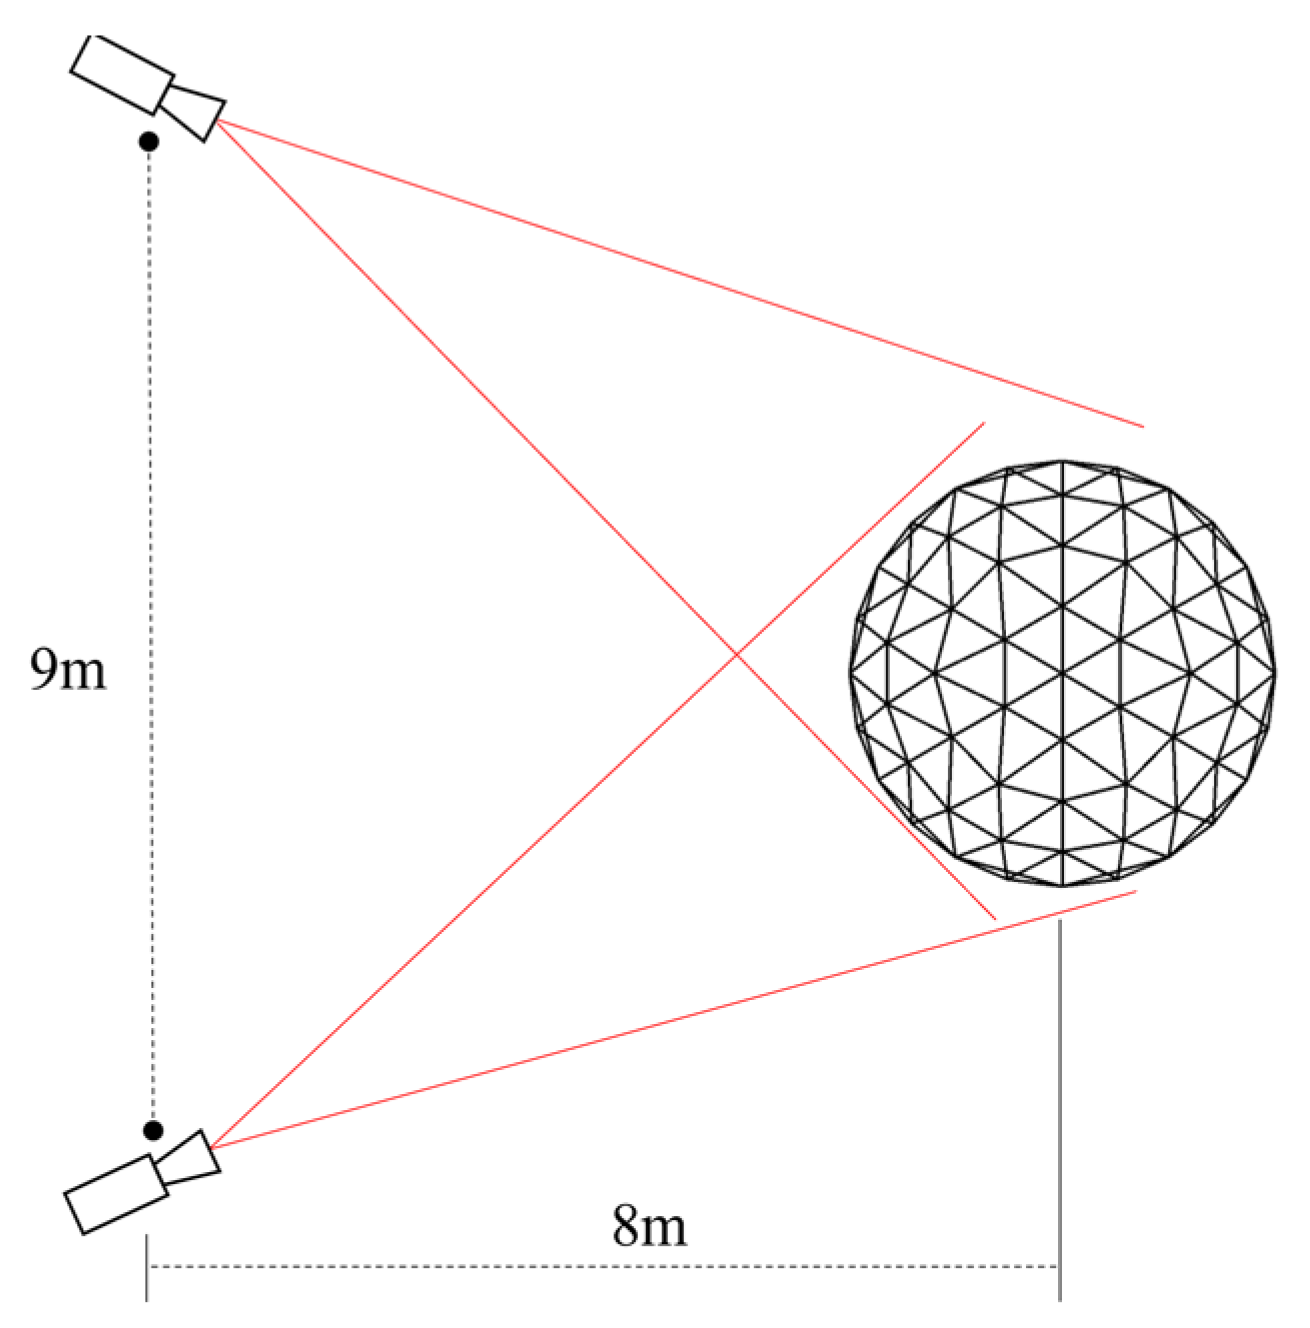
(1) The location of the cameras will determine the optimal convergent angle and the similarity between the circular targets and imaged elliptical targets. These two factors will influence the accuracy of the reticulated shell structures, 3D, dynamic monitoring using videogrammetry [36]. In order to improve the monitoring accuracy, in this study, the photographic baseline was set at 9 m and the object distance at 8 m, which could ensure the convergent angle was about 60° between the two cameras; the similarity was better than 0.9 between the circular targets and imaged elliptical targets, as shown in Figure 4. Moreover, two OPTRONIS CP80-4-M500 CMOS cameras with two AF Nikkor 35 mm f/2 d lenses were used to satisfy the depth-of-field requirements of the shaking table experiment. The actual size of the camera’s field of view was 4.02 m × 3.00 m, which could ensure to fully cover the structure model. The resulting actual size of each pixel was 1.7 mm.
(2) The circular target is an elliptical form with five degrees of freedom in the image. Thus, compared with the point or line target with only two degrees of freedom, the circular target is more stable. In this study, the side length of the artificial targets and the diameter of the inner circle were designed to be 16 cm and 10 cm, respectively. To obtain accurate videogrammetric results, two types of target points, control points and tracking points were designed in this study [37]. The control points were used to determine the exterior orientation parameters of the two cameras. The tracking points were used to obtain the dynamic 3D coordinates of the key locations on the structure model. As shown in Figure 5, the black crosswire of the artificial targets was designed to determine the coordinates of the center circle. The control points were affixed with a reflective sheet, of which 3D coordinates were acquired by a total station.
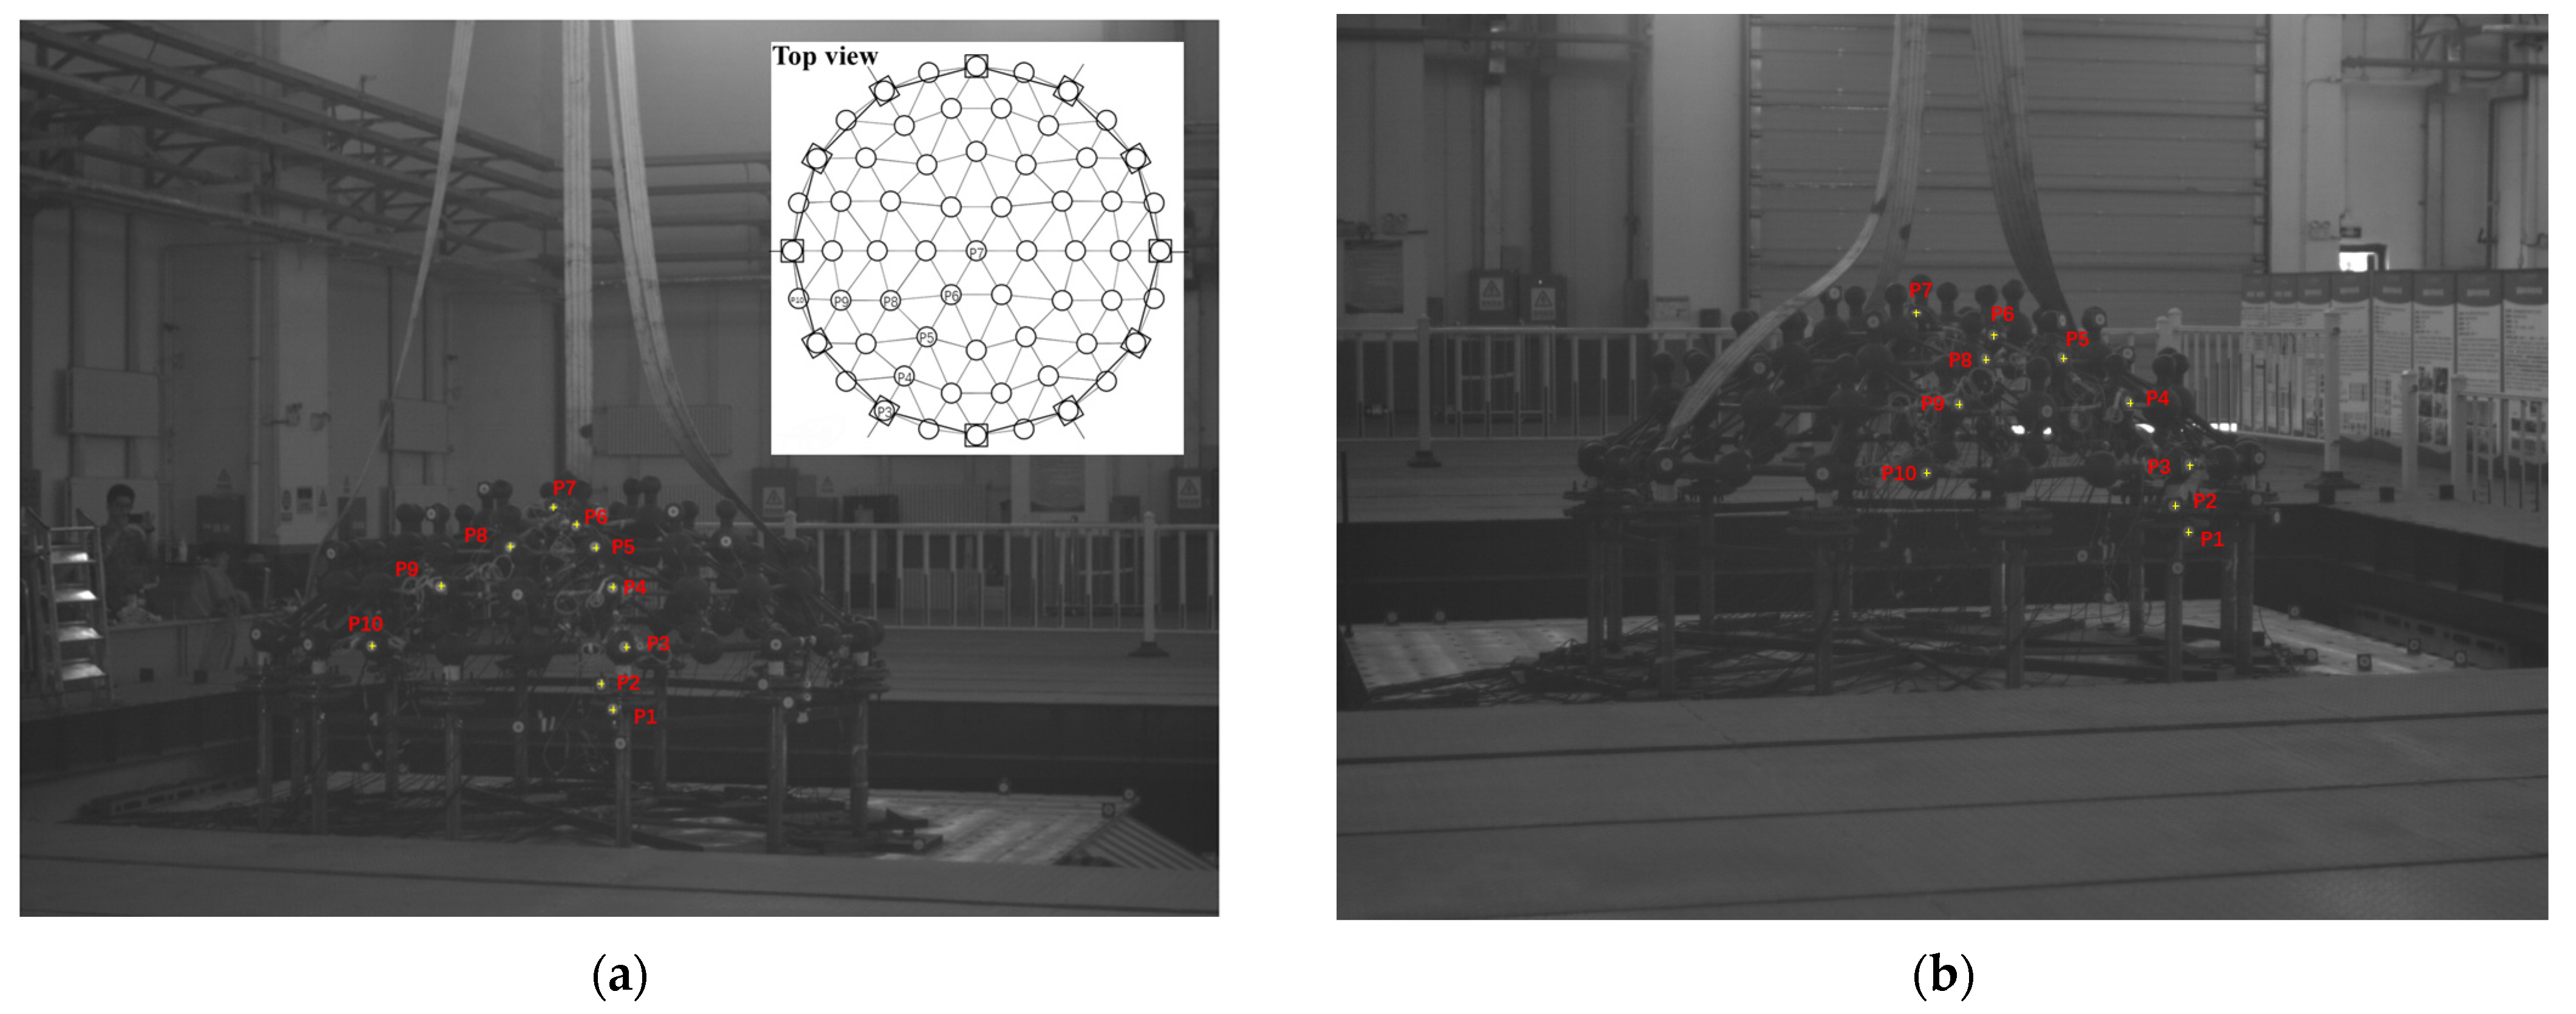
(3) If the locations of the artificial target points (especially the control points) are not placed in the correct position, it will affect the calculation accuracy of the tracking target 3D coordinates. Thus, in this study, 11 control points were placed on the spherical reticulated shell structure with different depths, under the principle that control points should be evenly placed near the tracking targets. Control point 1 and control point 6 would be used to check the accuracy of the results of the proposed method. Moreover, due to the symmetry of the spherical reticulated shell structure, 10 tracking points were deployed at the representative locations of the spherical reticulated shell structure. As shown in Figure 6, control points are red and tracking points are white. Among these tracking points, points 1–2 were deployed on the bottom and top plates of the Friction Pendulum Bearing (FPB), and points 3–10 were deployed on the corresponding nodes of the spherical reticulated shell structure. To improve the contrast of the obtained images, a flicker-free 500-watt illumination source was placed in front of the structural model. Besides the above configuration of the high-speed videogrammetric network, the cameras were calibrated with the Zhang model [38] to obtain accurate internal orientation parameters and lens distortion parameters.

2.2. Image Sequences Targets Tracking and Positioning

Among all the massive image sequences, it is crucial to track and position target points with an efficiency algorithm. There are three critical techniques for tracking and positioning targets in image sequences: (1) elliptical target point center fitting; (2) target point tracking and positioning and (3) target point dynamic response parameters calculation.
(1) Elliptical target point center fitting combines the feature-based elliptic contour extraction and optimal least squares fitting methods.
Due to the obvious difference between the artificial targets and the background, the elliptical targets can be quickly identified and extracted based on the characteristics of perimeter, area and circularity. After obtaining the ellipse contour, the exact coordinate of the ellipse center can be calculated using the optimal least square algorithm combined with the nonlinear optimization Levenberg–Marquardt method.
(2) Target point tracking and positioning with a coarse-to-fine matching strategy.
Firstly, coarse matching was used to obtain initial point locations in the search area with the algorithm of normalized correlation coefficient. Secondly, fine matching was used to obtain sub-pixel accurate locations of the target points with the least squares matching method. For homonymous point matching, the positions of the tracking target points were obtained by manual matching in the initial image. Therefore, the initial image would be used as the reference image, and the subsequent images were matched with the reference image, which can effectively avoid the accumulation of errors.
Target point dynamic response parameters can be calculated from the 3D spatial coordinates of the tracking points. The accuracy of the 3D spatial coordinates of the tracking target points directly determines the accuracy of the dynamic analysis of the spherical reticulated shell structure. Therefore, the bundle adjustment algorithm was adopted to calculate the 3D spatial coordinates of the tracking target points. The dynamic parameters of the tracking target point mainly include displacement, velocity and acceleration. The displacement of the tracking point is the distance difference between the initial coordinate and current spatial coordinate of the tracking target points. The velocity and acceleration values were obtained by the displacement differential, and the wavelet domain denoising algorithm was adopted to reduce the effects of the noise caused by the displacement differential.

3. Results and Discussion

3.1. Experiment Site and Structure Model

The experiment in this study was conducted on the large-scale multi-functional shaking table array at Beijing University of Civil Engineering and Architecture, as shown in Figure 7. The shaking table includes four multi-functional shaking tables, with three directions and six degrees of freedom. Each table has the size of 5 m by 5 m, the single load of 60 tons, the maximum horizontal acceleration of 1.5 g and the maximum vertical acceleration of 1.2 g, which can be used to test the performance of the structure models under the conditions of large earthquakes.
Figure 8 shows the scale model of the spherical reticulated shell structure, which has a span of 3.0 m, a vector height of 0.6 m and a column height of 0.9 m. The nodes of the spherical reticulated shell structure are solid cast iron spheres. The Shape Memory Alloy (SMA)-FPB were installed between the shell structure model and the rigid bearing model.
In this study, the working frequency of the shaking table is in the range of 0.1 Hz~100 Hz, and the used excitation frequency of the shaking table was less than 30 Hz. In order to avoid aliasing accused between the acquisition frequency and excitation frequency, the acquisition frequency should be more than twice the excitation frequency, according to the Nyquist–Shannon sampling theorem. Thus, the frame rate of the used CMOS cameras was set at 300 fps, that is, the acquisition frequency was 300 Hz. With the peak ground acceleration of 0.6 g and the recording time of 22 s, the Newhall wave was selected for the simulated seismic wave. According to the seismic design principle, the peak acceleration was adjusted to X:Y:Z = 1:0.85:0.65.

3.2. Dynamic Response Results of Target Points

In this study, the shaking table experiment lasted about 22 s, and the resulting 6822 images were acquired to reflect the dynamic response of the whole process of the structural seismic response. Figure 9 shows a pair of stereo images from the right and left high-speed camera in the experiment. According to the circular spatial characteristics of the mesh shell structure, the mesh shell structure could be divided into six sectors, each of which is critical in the seismic experiments. We selected one of these sectors for seismic response monitoring and installed tracking points at representative nodes in each layer of this sector. Where P3~P10 were installed on the spherical nodes of the structure model, P1 and P2 were installed on the corresponding top and bottom plates of the FPB. Figure 10 shows the process of the seismic response of the structure model using 7 images cropped at the same location, including the 1400th frame, 1500th frame, 1600th frame, 1700th frame, 1800th frame, 1900th frame and 2000th frame. Obviously, it is not significant for the displacement of the spherical reticulated shell structure model on the shaking table.
According to the image sequence processing method expressed in Section 2.2, the instantaneous displacement, velocity and acceleration were calculated at the 10 tracking points P1-P10. Figure 11 shows the displacement, velocity and acceleration changes of points 1~10 within 14 s in the X, Y and Z directions, respectively. Obviously, the structure was vibrated intensely in the interval of about 3 to 8 s. The inspection from this figure highlights: (1) All tracking points show the same trend of displacement, velocity and acceleration in the X, Y and Z directions. The variations are greater in the X and Y directions and smaller in the Z direction. (2) The values of the displacement, velocity and acceleration placed at P1 are significantly smaller than other tracking points. The reason for this phenomena is that the bottom plate of FPB is connected to the substructure, and P1 can be regarded as part of the substructure. Therefore, P1 is not affected by FPB. (3) The trend of displacement variations from point 2 to point 10 is basically the same, which is the expected result. The displacement difference between adjacent points is less than 4 mm. The maximum displacement is not more than 40 mm in the whole process of the shaking table experiment, which is reflected as a maximum displacement of 20 pixels in the image. Therefore, it explains the small displacement of the structure model on the shaking table, as shown in Figure 10.
To verify the feasibility for the shaking table experiment using high-speed videogrammetry with different frame rates, the displacement results were compared at 300 fps, 150 fps, 50 fps and 25 fps for Point 3 in the X direction, as shown in Figure 12. The inspection of the figure highlights: (1) As the frame rate decreased, so did the amount of data, which lost some detailed information. (2) For the results from the videogrammetry with 25 fps, it did not acquire the information of the wave trough. The reason may be that the low frame rate caused aliasing. In addition, as a dense acquisition for the image sequence at high frame rates, it is a small displacement of the target point between adjacent images, even if a large deformation occurs. Therefore, for some destructive experiments, such as the structural progressive collapse, high-speed videogrammetry can still capture the small displacements of targets accurately.

3.3. Accuracy Assessment of Videogrammetric Results

In the following study, the accuracy of the monitoring results acquired from the proposed high-speed videogrammetric-based method is validated by the following three aspects: (1) The selected control points are used to analyze the accuracy of the 3D reconstruction of the target points. (2) The results of another optical tracking measurement method (optical triangulation technique) are used to analyze the accuracy of the displacement results. (3) The results of the accelerometer are used to analyze the accuracy of the acceleration results.
(1) In order to verify the spatial coordinate accuracy from the proposed high-speed videogrammetry method, 3D coordinates of 2 control points (control point 1 and control point 6 in Figure 6) were used to make a comparison with the ones from the total station. Table 2 shows the differences between the coordinates from the high-speed videogrammetric-based method and the total station. The inspection from this table highlights: (a) the maximum difference is 0.97 mm in the Y direction, and the minimum difference is 0 mm in the Z direction; and (b) the root men square errors (RMSE) are 0.32 mm, 0.7 mm and 0.06 mm in the X, Y and Z direction, respectively. Therefore, it can be seen through this experiment that the accuracy of the point coordinates acquired from high-speed videogrammetry using the proposed method can be less than 1 mm.
(2) With the submillimeter accuracy, an optical measurement method proposed by Northern Digital Inc (NDI, a company from Canada) had resulted in a mature industrial product, Optotrak Certus. Optotrak Certus is a device for obtaining 3D coordinates of a target point with three infrared array cameras and an optical triangulation algorithm, which has the disadvantage of a small measurement range. Optotrak Certus can only place four marks in this experiment because the position of the camera is fixed, as shown in Figure 13. As an example, the displacement of point 3 acquired from high-speed videogrammetry will be compared with that from Optotrak Certus. Figure 14 shows the displacement results from high-speed videogrammetry compared with those from Optotrak Certus at point 3, where the blue line is the result from high-speed videogrammetry, and the red line is from Optotrak Certus. Inspection of this figure highlights: (a) two curves highly overlap, except some small differences at the peak, and (b) the videogrammetry used in this study highlights more detailed information than Optotrak Certus. The similarity of the two curves can be evaluated by the RMSE and the correlation coefficient. Due to the acquisition frequency of the two sensors being different, the RMSE and the correlation coefficient are calculated by the time interval of 0.02 s. After calculation, the RMSE of the two curves is 0.66 mm, and the correlation coefficient of the two curves is 0.99. Therefore, the accuracy of the monitoring results from the proposed method in this study is as good as the accuracy from established commercial measurement products. In addition, high-speed videogrammetry also has the advantages of a more extensive measurement range and the rich detail of the results.
Figure 15 shows a comparison result of acceleration between the proposed high-speed videogrammetric method and the accelerometer method at point 3, which have the same trend. Moreover, to validate the reliability of the acceleration obtained by high-speed videogrammetry, the natural frequency of the structural model is calculated by the Fast Fourier Transform (FFT), as shown in Figure 16. The first natural frequency was 2.331 Hz, identified by high-speed videogrammetry, while that obtained by the accelerometer was 2.343 Hz. Although the accelerometer could detect more frequencies, the first frequencies were nearly identical in both methods, which demonstrated the potential of high-speed videogrammetry in monitoring the seismic performance of structures.

4. Conclusions

In this paper, to compensate for the limitations of traditional contacted transducers, a non-contacted, high-speed, videogrammetric-based measurement method was proposed to monitor the seismic performance of the spherical reticulated shell structure. An experiment to monitor the seismic responses of the seismically isolated, spherical, reticulated shell structural model was conducted at Beijing University of Civil Engineering and Architecture. In the experiment, the high-speed videogrammetric hardware system consisted of a hardware system and software system. The high-speed videogrammetric hardware system consisted of two CMOS high-speed cameras, two high-speed capture cards, one high-speed synchronous controller, two IPCs and eight CXP cables. The software system used the technology of the adaptive optimal buffer pool. Based on the geometric characteristics of the spherical reticulated shell structure, 10 tracking points were selected, and 11 control points (among which, control point 1 and control point 6 were used to check the measurement accuracy) were set up on other nodes of the mesh shell structure. The frame rate of the two high-speed CMOS cameras was set at 300 fps, and the consumed time of the experiments was 14 s. With three techniques (circular target point center fitting, target point tracking and positioning, and target point dynamic response results calculation), the problem of image sequences tracking and positioning can be solved.
For measurement of 3D spatial coordinates, sub-millimeter accuracy can be achieved using the proposed high-speed videogrammetric-based method, with the RMSE being 0.32 mm, 0.7 mm and 0.06 mm in the X, Y and Z direction, respectively. The results from both the proposed videogrammetric method and the Optotrak Certus indicated that the proposed high-speed videogrammetric-based method had the advantage of a more extensive measurement range and rich detail of the results in the case of the same accuracy. The results from both the proposed method and the accelerometer method showed a consistent trend in acceleration and a nearly consistent natural frequency. All the results indicated that the proposed high-speed videogrammetric-based method had high accuracy and was capable of analyzing the seismic performances of the spherical reticulated shell structure.
With the advantages of non-contacted, high-frequency and 3D measurement, the proposed high-speed videogrammetric measurement method can acquire the accurate 3D dynamic response of the monitored objects. Thus, the method may be applied in more areas. For example, in the field of civil engineering, it can be used for large-scale shaking table tests, structural progressive collapse tests, etc. In the military field, it can be applied to weapons ballistic tests, etc. In the medical field, it can be applied to observe the behavioral characteristics of patients, etc. However, for the proposed high-speed videogrammetric measurement method, there are two important issues that need to be investigated. One is that it should identify and match the targets in the first image automatically in order to improve the efficiency of the obtained image sequences. The other is that the robustness of the target-tracking algorithm should be further studied to improve the stability of the obscured targets during image sequence processing.

Author Contributions

Conceptualization, X.L., P.Z. and R.W.; methodology, X.L., P.Z. and R.W.; validation, X.L. and R.W.; formal analysis, P.Z., Z.J., Y.C. and S.L.; investigation, X.L. and P.Z.; writing—original draft preparation, P.Z., Z.J., Y.C. and S.L.; writing—review and editing, X.L., P.Z. and R.W.; supervision, X.L. and R.W.; funding acquisition, X.L. and R.W. All authors have read and agreed to the published version of the manuscript.

Funding

This study was funded by the Ministry of Science and Technology of the People’s Republic of China, grant number 2018YFE0206100; the National Natural Science Foundation of China, grant numbers 41871367, 42171416 and 42201488; the Joint Project of Beijing Municipal Commission of Education and Beijing Natural Science Foundation, grant number KZ202210016022; the Pyramid Talent Training Project of Beijing University of Civil Engineering and Architecture, grant number JDJQ20220804; the Fundamental Research Funds for Beijing Universities, grant number X20150; and the BUCEA Postgraduate Innovation Project.

Data Availability Statement

Some or all data or models used during the study are available from the corresponding author by request.

Conflicts of Interest

The authors declare no conflict of interest.

References

  1. Shen, S.Z.; Lan, T.T. A Review of the Development of Spatial Structures in China. Int. J. Space Struct. 2001, 16, 157–172. [Google Scholar] [CrossRef]
  2. Nie, G.; Zhang, C.; Dai, J.; Liu, K. Seismic Damage Investigation and Seismic Performance Study of Space Double-Layered Lattice Structure. J. Perform. Constr. Facil. 2018, 32, 04018003. [Google Scholar] [CrossRef]
  3. Zayas, V.A.; Low, S.A.; Bozzo, L.; Mahin, S.A. Feasibility and Performance Studies on Improving the Earthquake Resistance of New and Existing Buildings Using the Friction Pendulum System; Earthquake Engineering Research Center: Berkeley, CA, USA, 1989. [Google Scholar]
  4. Ghaemmaghami, A.R.; Ghaemian, M. Experimental Seismic Investigation of Sefid-Rud Concrete Buttress Dam Model on Shaking Table. Earthq. Eng. Struct. Dyn. 2008, 37, 809–823. [Google Scholar] [CrossRef]
  5. Liu, T.; He, Z.; Yang, Y. Vertical Earthquake Vulnerability of Long-Span Spherical Lattice Shells with Low Rise-Span Ratios. Eng. Struct. 2020, 207, 110181. [Google Scholar] [CrossRef]
  6. Du, W.F.; Yu, F.D.; Zhou, Z.Y. Dynamic Stability Analysis of K8 Single-Layer Latticed Shell Structures Suffered from Earthquakes. In Applied Mechanics and Materials; Trans Tech Publications Ltd.: Bäch, Switzerland, 2011; Volume 94, pp. 52–56. [Google Scholar]
  7. Chang, C.-Y.; Huang, C.-W. Non-Contact Measurement of Inter-Story Drift in Three-Layer RC Structure under Seismic Vibration Using Digital Image Correlation. Mech. Syst. Signal Process. 2020, 136, 106500. [Google Scholar] [CrossRef]
  8. Cengiz, C.; Güler, E. Seismic Behavior of Geosynthetic Encased Columns and Ordinary Stone Columns. Geotext. Geomembr. 2018, 46, 40–51. [Google Scholar] [CrossRef]
  9. Chen, Z.-P.; Feng, D.-C.; Ma, K.-J.; Wu, G. Shaking Table Test and Evaluation of a Novel High-Rise Large Span Concrete Cassette Structure. Eng. Struct. 2021, 238, 112205. [Google Scholar] [CrossRef]
  10. Liu, X.; Tong, X.; Lu, W.; Liu, S.; Huang, B.; Tang, P.; Guo, T. High-Speed Videogrammetric Measurement of the Deformation of Shaking Table Multi-Layer Structures. Measurement 2020, 154, 107486. [Google Scholar] [CrossRef]
  11. Overgaard, L.C.; Lund, E.; Thomsen, O.T. Structural Collapse of a Wind Turbine Blade. Part A: Static Test and Equivalent Single Layered Models. Compos. Part A Appl. Sci. Manuf. 2010, 41, 257–270. [Google Scholar] [CrossRef]
  12. Qian, K.; Li, B. Experimental and Analytical Assessment on RC Interior Beam-Column Subassemblages for Progressive Collapse. J. Perform. Constr. Facil. 2012, 26, 576–589. [Google Scholar] [CrossRef] [Green Version]
  13. Wu, C.; Kuo, W.-W.; Yang, Y.-S.; Hwang, S.-J.; Elwood, K.J.; Loh, C.-H.; Moehle, J.P. Collapse of a Nonductile Concrete Frame: Shaking Table Tests. Earthq. Eng. Struct. Dyn. 2009, 38, 205–224. [Google Scholar] [CrossRef]
  14. Chen, J.; Huang, X.; Ma, R.; He, M. Experimental Study on the Progressive Collapse Resistance of a Two-Story Steel Moment Frame. J. Perform. Constr. Facil. 2012, 26, 567–575. [Google Scholar] [CrossRef]
  15. Sasani, M.; Sagiroglu, S. Progressive Collapse Resistance of Hotel San Diego. J. Struct. Eng. 2008, 134, 478–488. [Google Scholar] [CrossRef]
  16. Sasani, M.; Kazemi-Moghaddam, A. Experimental and Analytical Evaluation of Progressive Collapse Resistance of a Full-Scale Structure Following Sever Loss of Load Bearing Elements. In Applied Mechanics and Materials; Trans Tech Publications Ltd.: Bäch, Switzerland, 2011; Volume 82, pp. 326–331. [Google Scholar]
  17. Pankow, M.; Justusson, B.; Waas, A.M. Three-Dimensional Digital Image Correlation Technique Using Single High-Speed Camera for Measuring Large out-of-Plane Displacements at High Framing Rates. Appl. Opt. 2010, 49, 3418–3427. [Google Scholar] [CrossRef]
  18. Decker, R.; Duca, M.; Spickert-Fulton, S. Measurement of Bullet Impact Conditions Using Automated In-Flight Photography System. Def. Technol. 2017, 13, 288–294. [Google Scholar] [CrossRef]
  19. Ma, L.; Zhao, Z.; Zhang, B.; Jiang, W.; Fu, L.; Zhang, X.; Liao, H. Three-Dimensional Augmented Reality Surgical Navigation with Hybrid Optical and Electromagnetic Tracking for Distal Intramedullary Nail Interlocking. Int. J. Med. Robot. Comput. Assist. Surg. 2018, 14, e1909. [Google Scholar] [CrossRef]
  20. Kunicka-Kowalska, Z.; Landowski, M.; Sibilski, K. Deformable Model of a Butterfly in Motion on the Example of Attacus Atlas. J. Mech. Behav. Biomed. Mater. 2022, 133, 105351. [Google Scholar] [CrossRef]
  21. Steinbauer, V.; Kaufmann, J.; Zurbriggen, R.; Bühler, T.; Herwegh, M. Tracing Hail Stone Impact on External Thermal Insulation Composite Systems (ETICS)—An Evaluation of Standard Admission Impact Tests by Means of High-Speed-Camera Recordings. Int. J. Impact Eng. 2017, 109, 354–365. [Google Scholar] [CrossRef] [Green Version]
  22. Bailey, A.; Funk, J.; Lessley, D.; Sherwood, C.; Crandall, J.; Neale, W.; Rose, N. Validation of a Videogrammetry Technique for Analysing American Football Helmet Kinematics. Sport. Biomech. 2020, 19, 678–700. [Google Scholar] [CrossRef]
  23. Ma, H.; Chen, P.; Shi, H.; Zhao, J. Measurement of Bullet Velocity Parameter from High-Speed Sequential Images. J. Phys. Conf. Ser. 2021, 1827, 012027. [Google Scholar] [CrossRef]
  24. Wang, H.; Weng, Z.; Li, Y. Design of High-Speed Image Acquisition System Based on FPGA. In Proceedings of the 2018 Chinese Control and Decision Conference (CCDC), Shenyang, China, 9–11 June 2018; IEEE: Piscataway, NJ, USA, 2018; pp. 2682–2686. [Google Scholar]
  25. Zhou, W.; Yang, S. Optimization Design of High-Speed Data Acquisition System Based on DMA Double Cache Mechanism. Microelectron. J. 2022, 129, 105577. [Google Scholar] [CrossRef]
  26. Gupta, S.; Sharma, M.; Chawla, R. FPGA Implementation of R-FIFO-Based High-Speed Data Acquisition IOT Architecture Model. SN Appl. Sci. 2020, 2, 661. [Google Scholar] [CrossRef] [Green Version]
  27. Burnside, C.D.; Dowman, I.J.; Proctor, D.W.; Farrow, J.E.; Atkinson, K.B.; Tait, D.A.; Allan, J.A.; Baldwin, R.A. XVIth INTERNATIONAL CONGRESS OF PHOTOGRAMMETRY AND REMOTE SENSING. Photogramm. Rec. 1989, 13, 3–25. [Google Scholar] [CrossRef]
  28. Rajaram, S.; Vanniamparambil, P.A.; Khan, F.; Bolhassani, M.; Koutras, A.; Bartoli, I.; Moon, F.; Hamid, A.; Benson Shing, P.; Tyson, J. Full-Field Deformation Measurements during Seismic Loading of Masonry Buildings. Struct. Control. Health Monit. 2017, 24, e1903. [Google Scholar] [CrossRef]
  29. Tong, X.; Gao, S.; Liu, S.; Ye, Z.; Chen, P.; Yan, S.; Zhao, X.; Du, L.; Liu, X.; Luan, K. Monitoring a Progressive Collapse Test of a Spherical Lattice Shell Using High-Speed Videogrammetry. Photogramm. Rec. 2017, 32, 230–254. [Google Scholar] [CrossRef]
  30. Gao, S.; Ye, Z.; Wei, C.; Liu, X.; Tong, X. Development of a High-Speed Videogrammetric Measurement System with Application in Large-Scale Shaking Table Test. ISPRS Ann. Photogramm. Remote Sens. Spat. Inf. Sci. 2019, 4, 33–38. [Google Scholar] [CrossRef] [Green Version]
  31. Feng, D.; Feng, M.Q. Experimental Validation of Cost-Effective Vision-Based Structural Health Monitoring. Mech. Syst. Signal Process. 2017, 88, 199–211. [Google Scholar] [CrossRef]
  32. Wei, K.; Yuan, F.; Shao, X.; Chen, Z.; Wu, G.; He, X. High-Speed Multi-Camera 3D DIC Measurement of the Deformation of Cassette Structure with Large Shaking Table. Mech. Syst. Signal Process. 2022, 177, 109273. [Google Scholar] [CrossRef]
  33. Goyal, A.; Agarwal, P. Earthquake-Resistant Interlinked Block Masonry System with Energy Dissipator Viscoelastic Links. Pract. Period. Struct. Des. Constr. 2017, 22, 04017001. [Google Scholar] [CrossRef]
  34. Tong, X.; Luan, K.; Liu, X.; Liu, S.; Chen, P.; Jin, Y.; Lu, W.; Huang, B. Tri-Camera High-Speed Videogrammetry for Three-Dimensional Measurement of Laminated Rubber Bearings Based on the Large-Scale Shaking Table. Remote Sens. 2018, 10, 1902. [Google Scholar] [CrossRef] [Green Version]
  35. Liu, X.; Tong, X.; Yin, X.; Gu, X.; Ye, Z. Videogrammetric Technique for Three-Dimensional Structural Progressive Collapse Measurement. Measurement 2015, 63, 87–99. [Google Scholar] [CrossRef]
  36. Abdel-Aziz, Y.I. Expected Accuracy of Convergent Photos. Photogramm. Eng. 1974, 40, 1341–1346. [Google Scholar]
  37. Triggs, B. Camera Pose and Calibration from 4 or 5 Known 3d Points. In Proceedings of the Seventh IEEE International Conference on Computer Vision, Corfu, Greece, 20–25 September 1999; IEEE: Piscataway, NJ, USA, 1999; Volume 1, pp. 278–284. [Google Scholar]
  38. Zhang, Z. A Flexible New Technique for Camera Calibration. IEEE Trans. Pattern Anal. Mach. Intell. 2000, 22, 1330–1334. [Google Scholar] [CrossRef] [Green Version]
Figure 1. Framework of the entire methodology.
Buildings 13 00553 g001
Figure 2. High-speed videogrammetric hardware system.
Buildings 13 00553 g002
Figure 3. Flow of massive image sequence transmission.
Buildings 13 00553 g003
Figure 4. Configuration of high-speed videogrammetric network.
Buildings 13 00553 g004
Figure 5. Artificial targets of (a) tracking point and (b) control point.
Buildings 13 00553 g005
Figure 6. Tracking and control point targets on spherical reticulated shell structure.
Buildings 13 00553 g006
Figure 7. The large-scale multi-functional shaking table array at Beijing University of Civil Engineering and Architecture.
Buildings 13 00553 g007
Figure 8. The scaled model of the shell structure. (a) Shell structure model, (b) Seismic isolation and rigid bearing model.
Buildings 13 00553 g008
Figure 9. The stereo images of epoch 1 of the spherical reticulated shell structure model from (a) left and (b) right high-speed camera.
Buildings 13 00553 g009
Figure 10. The process of the seismic response of the structure model.
Buildings 13 00553 g010
Figure 11. The curves of the displacement, velocity and acceleration of 10 tracking points on the model in the X, Y and Z direction.
Buildings 13 00553 g011
Figure 12. The displacement results of Point 3 at 300 fps, 150 fps, 50 fps and 25 fps in the X direction.
Buildings 13 00553 g012
Figure 13. Marks of Optotrak Certus.
Buildings 13 00553 g013
Figure 14. Comparison between displacements from the proposed videogrammetric method and Optotrak Certus at point 3.
Buildings 13 00553 g014
Figure 15. A comparison between the proposed videogrammetric method and the traditional accelerometer measurement method in terms of the acceleration of point 3.
Buildings 13 00553 g015
Figure 16. (a) Fourier magnitude spectrum from high-speed videogrammetry, (b) Fourier magnitude spectrum from accelerometer.
Buildings 13 00553 g016
Table 1. Main parameters of OPTRONIS CP80-4-M500.
ParametersValue
Maximum resolution2304(H) × 1720(V)pixels
Pixel size7 µm × 7 µm
Dynamic range48 dB
Table 2. Accuracy of the point coordinates obtained from the videogrammetric system.
IDResult of VideogrammetryResult of Total StationDifference (mm)
X Y Z X Y Z X Y Z
1−41.5817112.918835.6−41.1821111.946735.4782−0.40.970.12
6−84.7448−108.680476.4999−84.5414−108.460676.4978−0.2−0.20
RMSE 0.320.70.06
Disclaimer/Publisher’s Note: The statements, opinions and data contained in all publications are solely those of the individual author(s) and contributor(s) and not of MDPI and/or the editor(s). MDPI and/or the editor(s) disclaim responsibility for any injury to people or property resulting from any ideas, methods, instructions or products referred to in the content.

