Abstract
In the case of post-tensioned or geotechnical structures, the anchorage zone is considered a critical part of the design and construction process. Generally, the failure of the anchorage zone is one of the most common problems. High-bearing stresses create significant transverse tension. For these reasons, conventional reinforcement, usually in the form of closed stirrups, must be designed. The presented analysis is focused on the possible increase of load-carrying capacity of the anchorage zone with steel fiber-reinforced concrete. Three types of specimens were analyzed. The first type of specimen represented the anchorage zone made from standard reinforced concrete. The second and third series of specimens were designed from fiber-reinforced concrete with two different volumes of steel fibers added into the anchorage zone. The parameters used in the numerical analysis of the anchorage zone were experimentally determined on a set of beam specimens. In the analysis, the anchorage zone was loaded by a node force applied on a steel load distribution plate placed on the top edge of the bloc. The performed numerical study suggests that the load-bearing capacity can be increased by adding fiber-reinforced concrete with a higher volume of fiber (Dramix 3D 55/30, volume of fiber of 110 kg/m3) into the vicinity of the anchorage plate.
1. Introduction
Prestressed concrete (PC) structures are among the most recent types of construction in civil engineering. The first applications of prestressed concrete members were not very successful because of significant prestress losses. However, in the early 20th century, French engineer Eugène Freyssinet managed to overcome this problem [1]. Freyssinet replaced low-strength steel with high-strength steel, which resulted in much better performance. Since then, prestressed concrete structures have become a crucial part of our infrastructure. These types of structures have various applications in bridge engineering and other engineering structures [2,3]. For instance, since 2010, approximately 45% of bridges built in the United States of America have been designed from this type of construction material [4]. The advantages of prestressed concrete come from the essence of preloading of structures by compressive force, which fully (or sometimes only partially) counteracts the tensile stresses. As a result, prestressing negates the main drawback of concrete—tensile strength. Moreover, prestressed concrete enables engineers to design long-span bridges or smaller cross-sections, which can lead to lower dead loads [1,2,3,4].
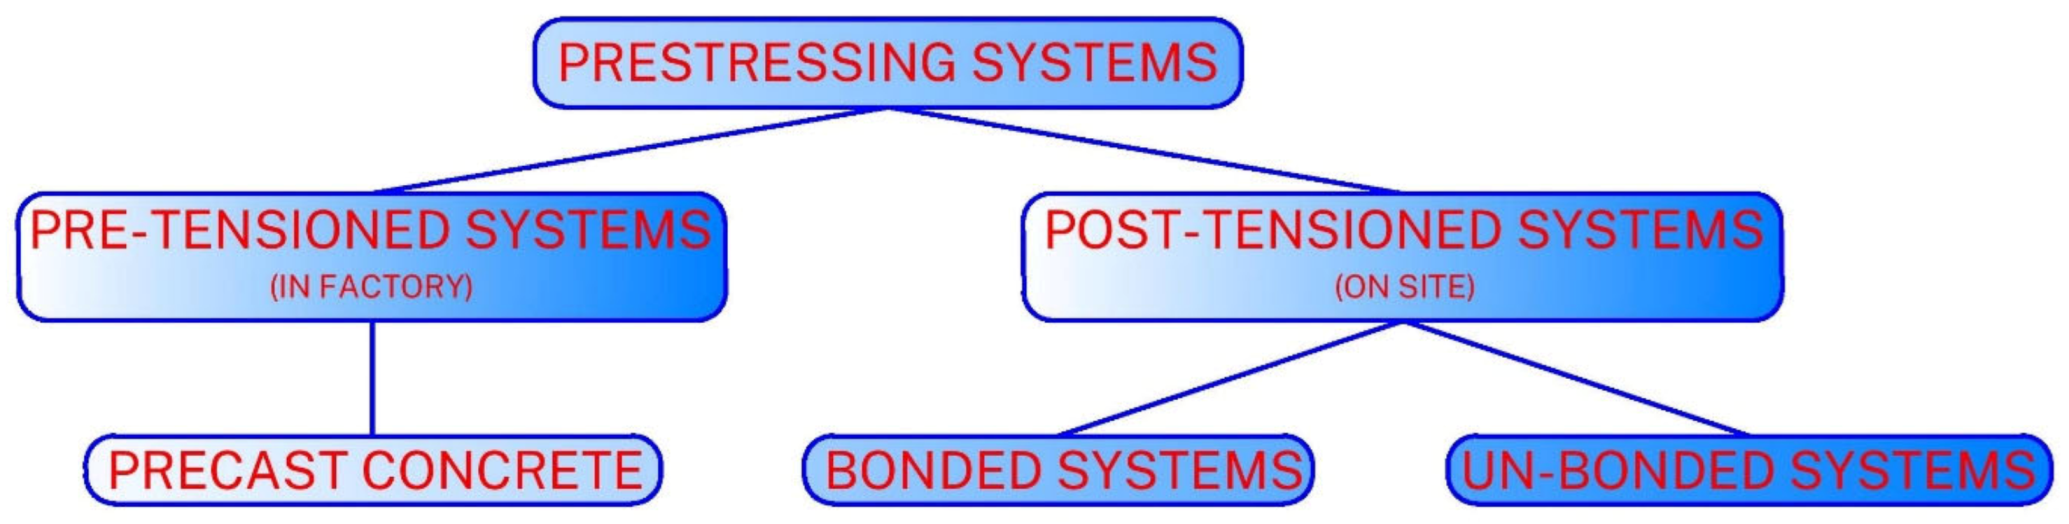
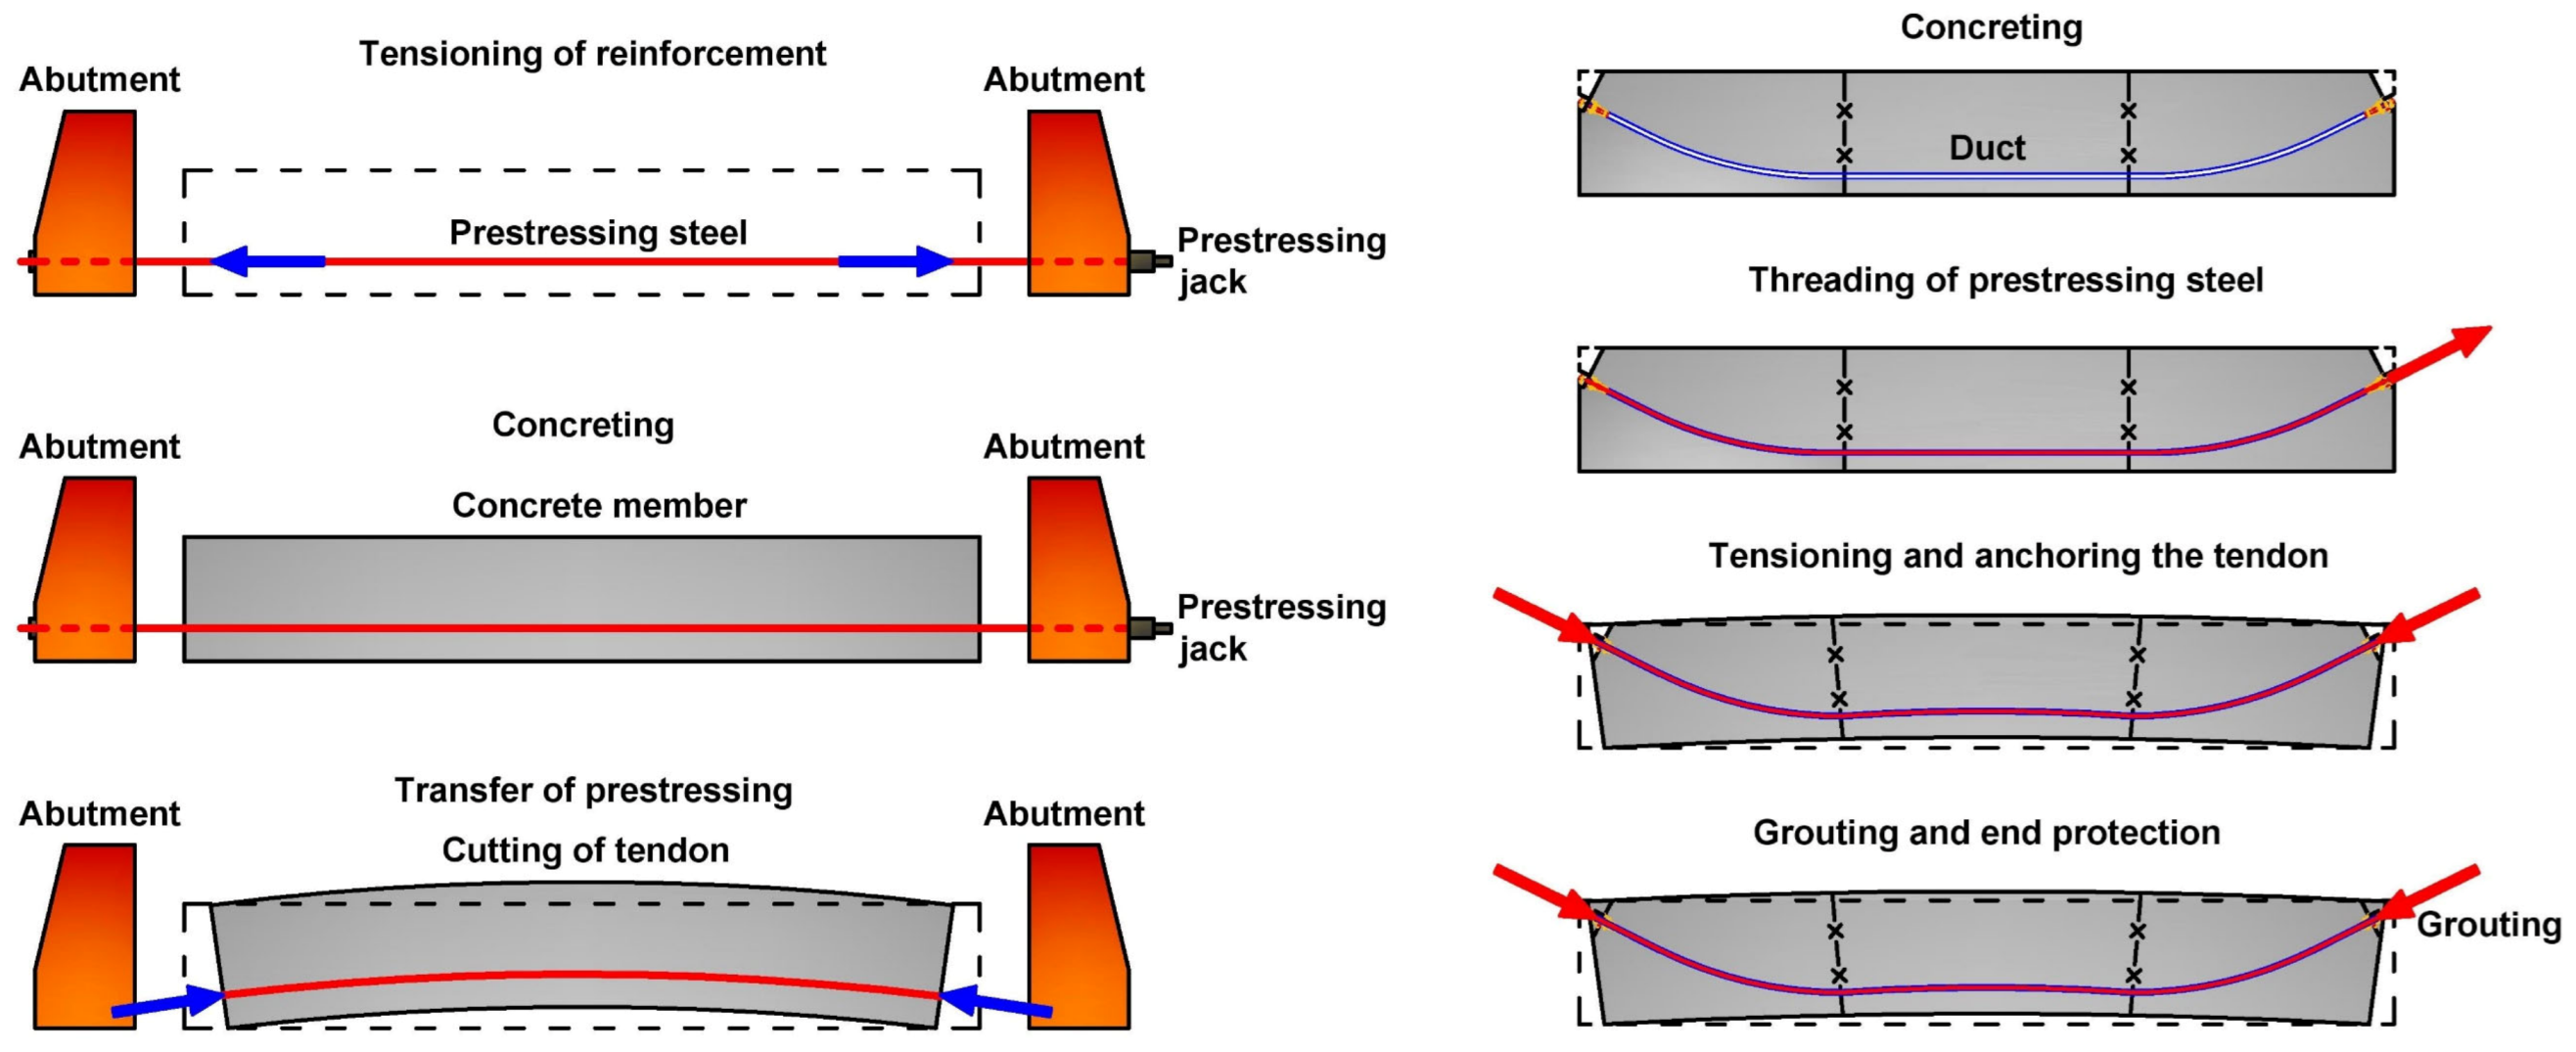
Two main groups of prestressed systems are known—pre-tensioning and post-tensioning (see Figure 1). First, pre-tensioning is a technology based on the tensioning of prestressing steel (e.g., strands, and wires) prior to casting of the concrete and usually is carried out in a factory environment. Prestressing steel is stressed between abutments. In the case of this technology, the prestressing is transferred into to member through the bond between prestressing steel and concrete. The second prestressing technology is called post-tensioning, and it is based on the tensioning of prestressing steel (tendons consisting of numerous strands) after the casting of the concrete member. This technology is usually carried out on-site and offers significant flexibility in terms of a wide range of structures and possible adjustment of tendon profiles (layout). In this case, the prestressing is transferred in the anchorages. Moreover, if the tendon is grouted with cement grout, the prestressing is also transferred via the bond. Post-tensioning can be also applied by internal tendons (part of the cross-section) or by external tendons (connected with the structure only through deviators) [2,4,5,6]. A comparison of both prestressing systems can be seen in Figure 2.
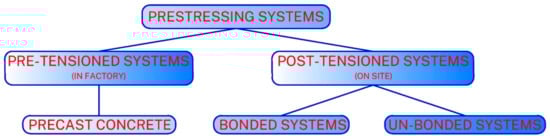
Figure 1.
Classification of prestressing systems.
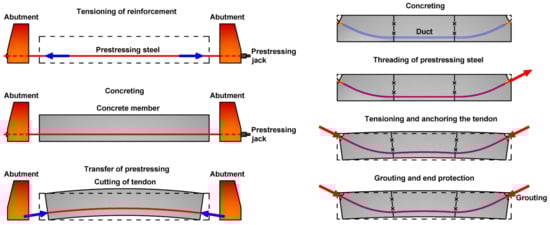
Figure 2.
Prestressing systems—comparison.
1.1. Anchorage Zone
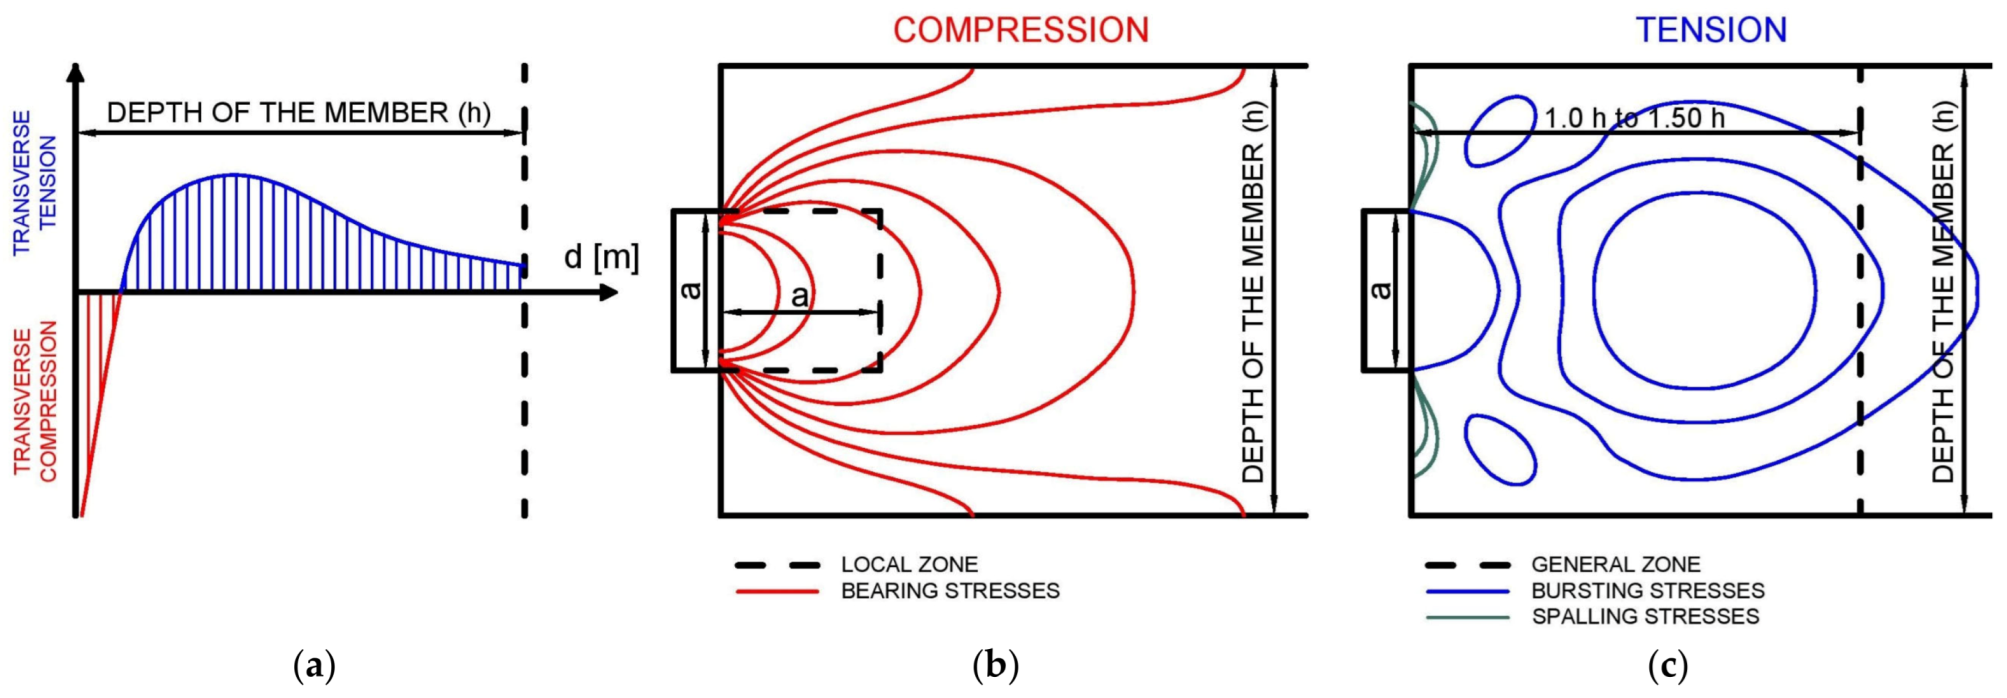
This paper is focused on the numerical study of the anchorage zone based on the experimentally determined parameters of fiber-reinforced concrete (FRC). In the case of post-tensioned structures, failure of this zone is among the most common problems [7,8,9]. The study is focused on areas described by disturbed region length, where simple beam theory cannot be applied. In this area, high transverse stresses are produced by concentrated loads. These stresses are displayed in Figure 3 [2,10]. Therefore, reinforcement must be present to resist transversal tensile stresses (usually referred to as bursting stresses) [11]. The application of fiber concrete could reduce the costs of conventional reinforcement in this zone.
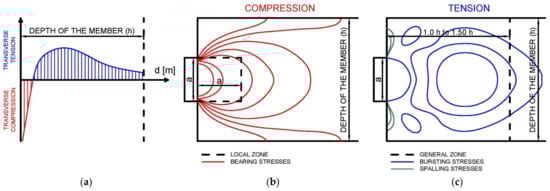
Figure 3.
Stresses in the disturbed region: (a) transverse stresses; (b) compressive stresses; (c) tensile stresses.
We distinguish three critical stress regions—bearing stresses (compressive stresses), spalling stresses, and bursting stresses (tensile stresses). Bearing stresses are located immediately under the anchorage and are the result of applied external loads. Spalling stresses can be found on or near the end of the member, parallel to the end face, and away from the point of loading. Finally, bursting stresses are located along the axis of loading, normal to the axis, and away from the point of loading [10]. The local zone is in the immediate vicinity of anchorages, while the general zone is the area where tensile stresses develop due to the spreading of tensile forces. The general zone’s length usually equals 1.0 to 1.5 times transverse dimensions [11]. According to [12], the anchorage zone can be studied using the following approaches:
- ▪
- Theory of Elasticity,
- ▪
- Equilibrium Method of Elasticity,
- ▪
- Strut and Tie model,
- ▪
- Finite Element Analysis,
- ▪
- Experimental Solution.
1.2. Fiber-Reinforced Concrete
Fiber concrete is a composite material that consists of a concrete matrix supplemented with fibers that stiffen the fiber-reinforced concrete structure. The use of fiber in the cement matrix leads to an increase in mechanical properties, such as tensile strength, toughness, ductility, abrasion resistance, and increased durability. Fiber-reinforced concrete also better resists changes in volume due to shrinkage during solidification and hardening and due to changes in ambient temperatures. The use of fiber in the concrete matrix results in an increase in tensile strength, which means that when a crack is created in the cement matrix, it is possible to state in certain situations of positioning in relation to the direction of propagation of the crack, to the crack being stopped. The level of tensile stresses that the cement composite is able to carry depends on the fiber used [13,14,15].
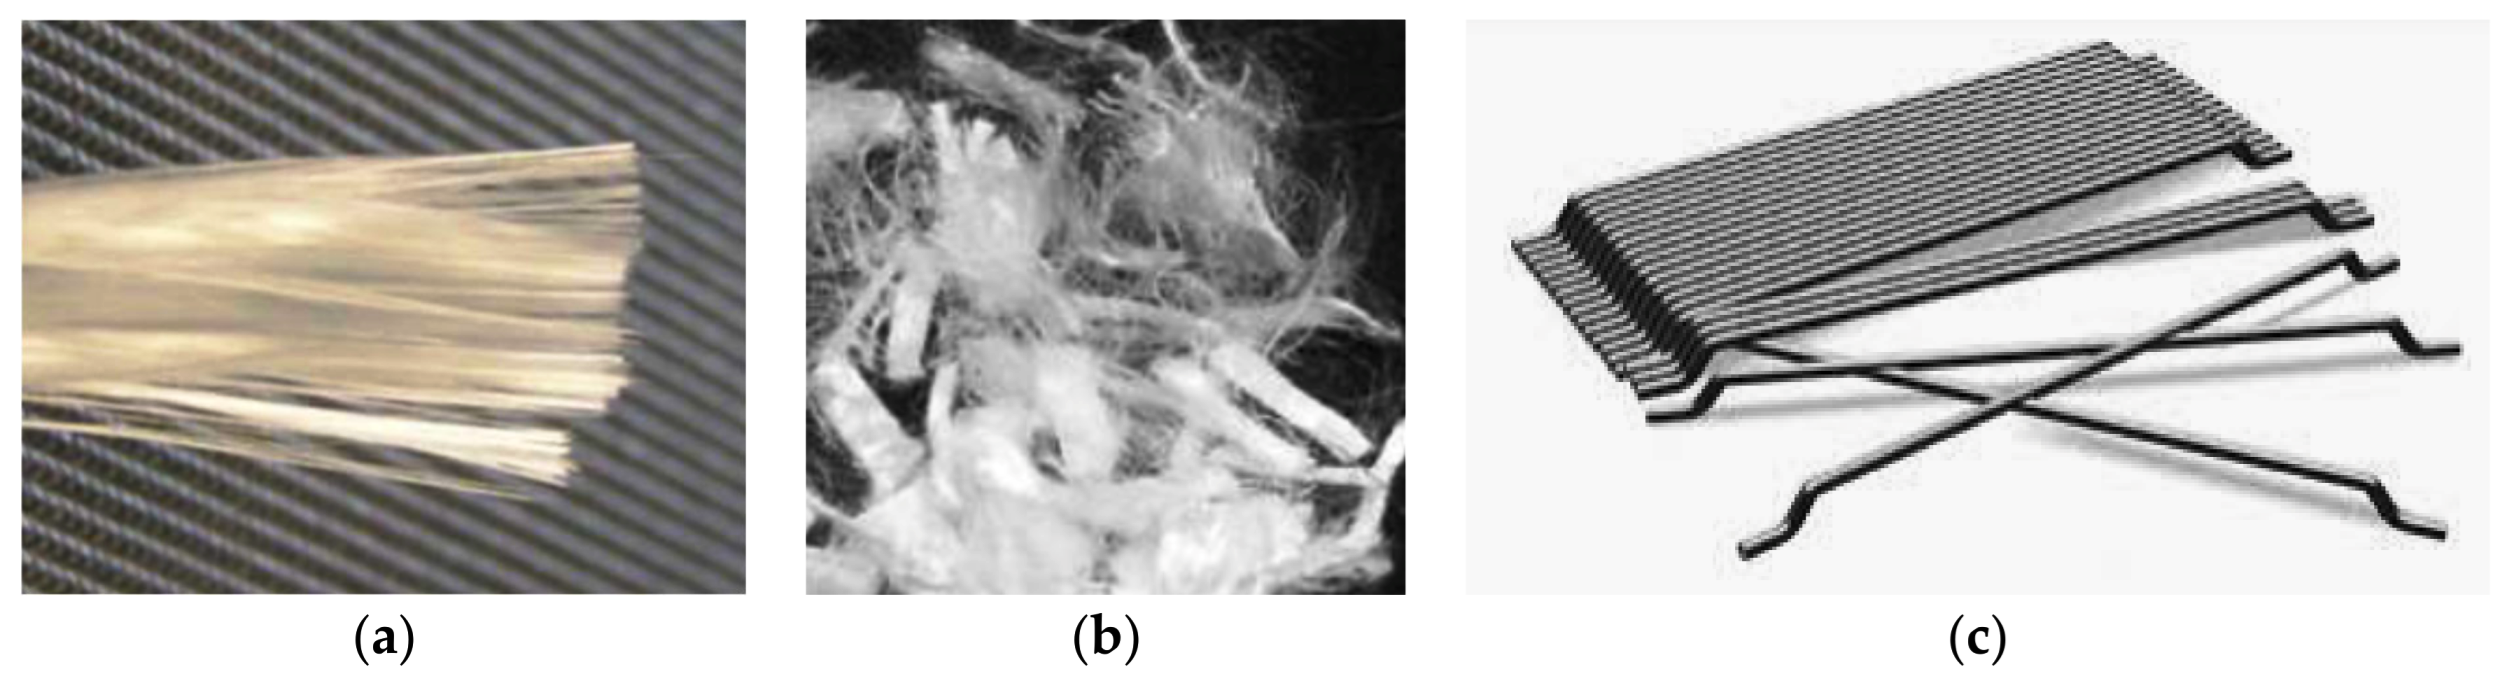
Currently, various types of fiber reinforcement are used for the production of fiber-reinforced concrete. The main classification is according to material—non-metallic and metallic fiber. Non-metallic fiber include glass fiber, polypropylene, basalt fiber, and so on (Figure 4a,b). The application of non-metallic fiber is mostly used in the case of less mechanically stressed structures, e.g., base plates. The use of this fiber is mostly for structures that are not designed to be extremely mechanically loaded [16,17,18]. The disadvantage of non-metallic fiber is their low ductility and weak mechanical anchoring in the cement matrix.
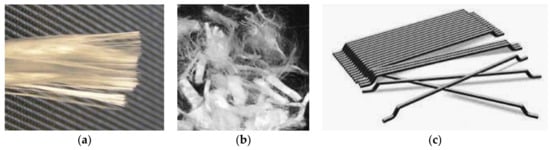
Figure 4.
Various types of fiber: (a) glass fiber; (b) polypropylene fiber; (c) steel fibers.
The second group is metal fiber (see Figure 4c). The advantage of metallic fiber over non-metallic, in addition to mechanical advantages, is the anchoring in the cement matrix. The high variability of shape types of fiber leads to an increase in mechanical properties, especially tensile strength. The tensile strength of fiber concrete depends on the mechanical resistance of the fiber and the modification of the anchoring in the cement matrix.
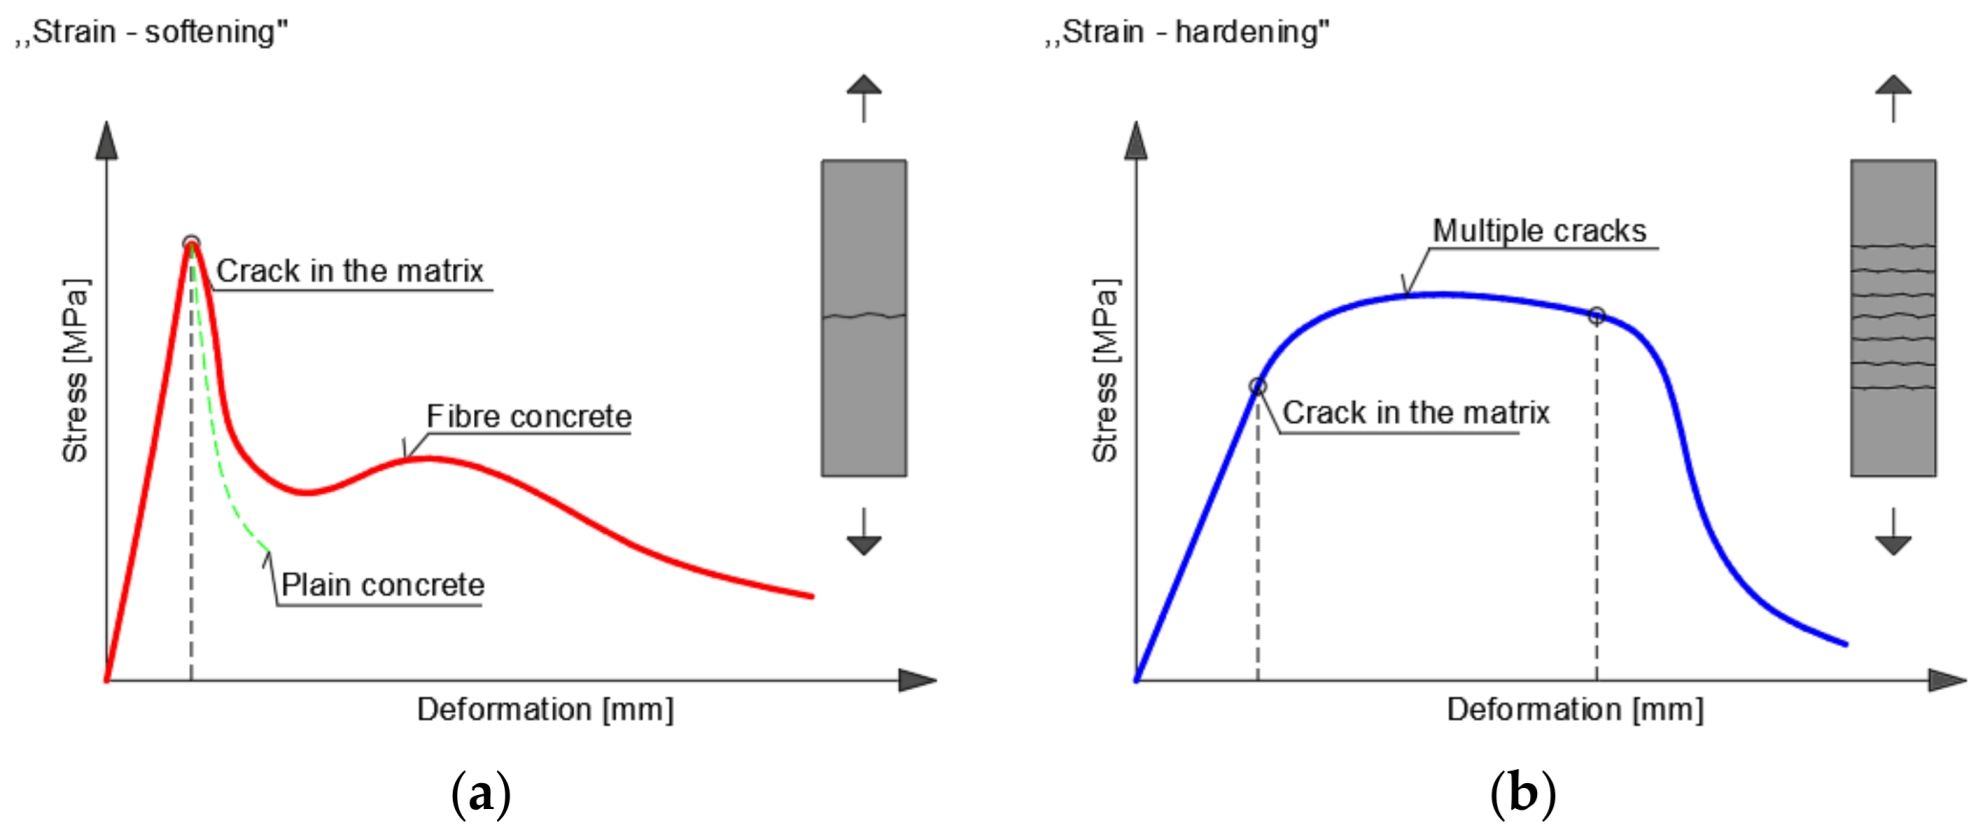
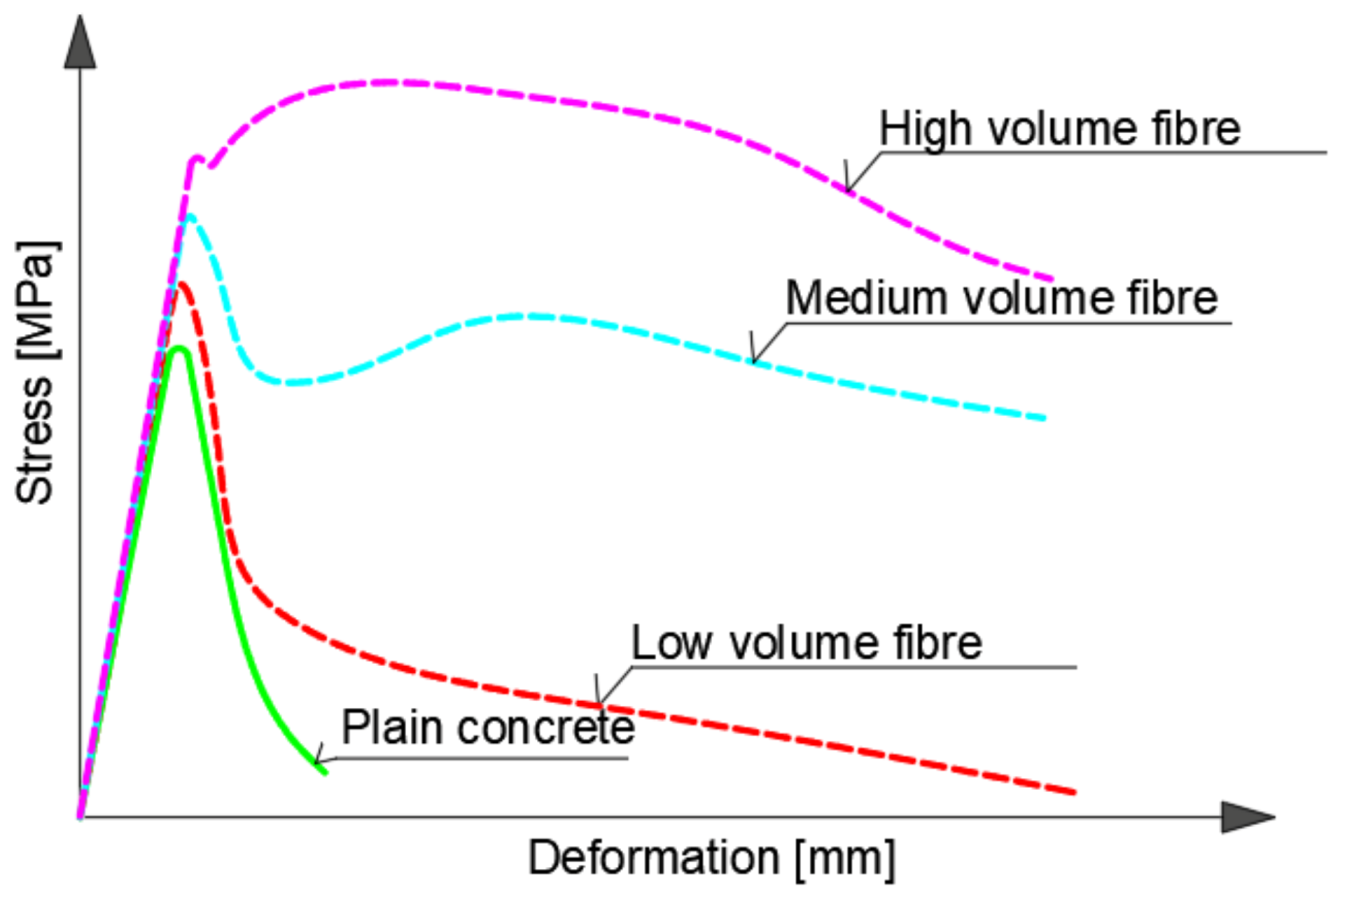
Another factor affecting the tensile strength is the volume of added fiber in the cement composite. Depending on the volume of fiber added, two situations of crack formation can occur. The first situation is softening of the composite (Figure 5a); at this stage there is a decrease in the loading force with increasing deformation. This stage is characterized by the pulling out of fiber from the cement matrix. In the second case, there is tensile strengthening (Figure 5b). This stage occurs only at a high (supercritical) volume fraction of fiber. At this stage, uniform cracks are formed in the cement composite. The tensile stress is transferred through the cracks by means of fiber [18,19,20]. A detailed review in the field of fiber-reinforced concrete can be found in [21]. This review presents the description of various types of FRC, including basalt, carbon, glass, steel, and aramid fiber.
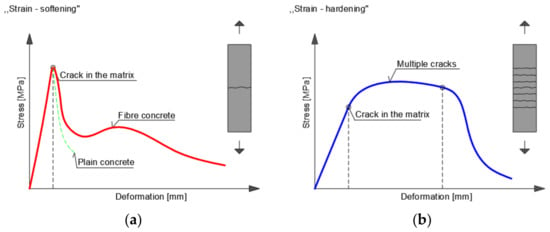
Figure 5.
Development of cracks: (a) strain—softening; (b) strain—hardening.
1.3. Bending Test
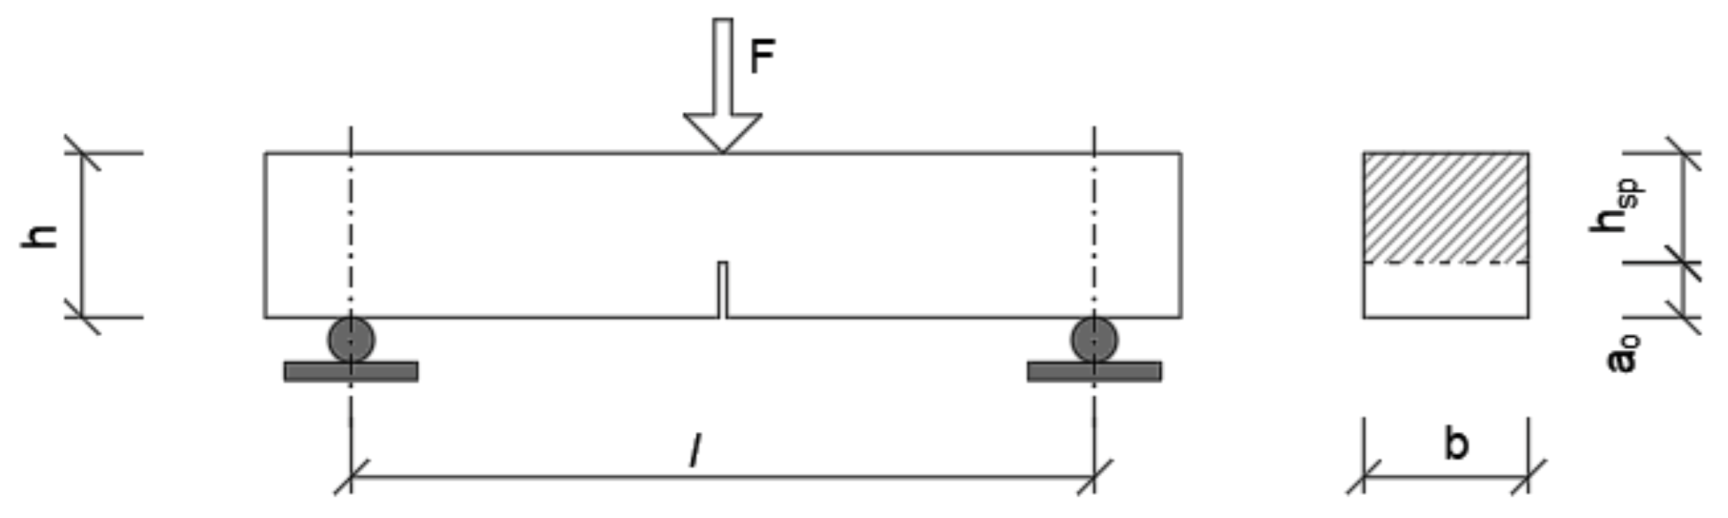
The documents issued by fib [22] and RILEM [23] recommend a three-point bending test for the determination of cementitious composite tensile strengths [24]. The specimens are simply supported beams with dimensions of 150 × 150 × 550 mm (or 150 × 150 × 700 mm) with a 5 mm deep notch applied in the middle of the span (see Figure 6). The span of the tested specimen test is 500 mm. The test arrangement allows the force to be recorded, namely, deflection dependence (F—δ) or the load force—crack mouth opening displacement (F—CMOD).
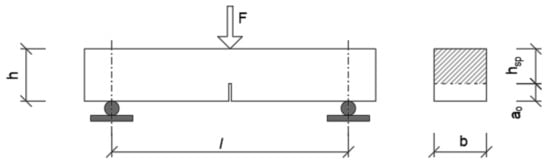
Figure 6.
Three-point bending test.
1.4. Fracture Energy
Fracture energy can be defined as the amount of absorbed energy required to create a one-unit crack area. Concrete is a brittle material, which means that its fracture toughness decreases with increasing tensile strength, or as the strength increases, so does the sensitivity to the presence of cracks [25]. The evaluation of the fracture energy of fiber-reinforced concrete is the area under the load–deformation curve obtained from the 3-point bending test with a notch [26,27]. Fracture energy is given by the relation as a ratio of the dissipated energy to the initial surface and is expressed by Equation (1) as follows:
where is the area under the load–deformation curve, b and h are the dimensions of the test beam, and is the depth of the notch.
To determine the fracture energy parameters of fiber concrete, it is necessary to perform a 3-point bending test. From these tests, we can assume the elastic behavior of fiber concrete until reaching the crack initiation limit. After the formation of a crack, the ultimate stress occurs in the outer fiber. The tension determined in this way is called the bending tensile strength , and its value is determined according to Equation (2):
where is the maximum force; is the distance between the supports; is the width of the test beam; is the depth of the notch; and is the height of the test beam measured from the upper edge of the notch to the top of the compressed area.
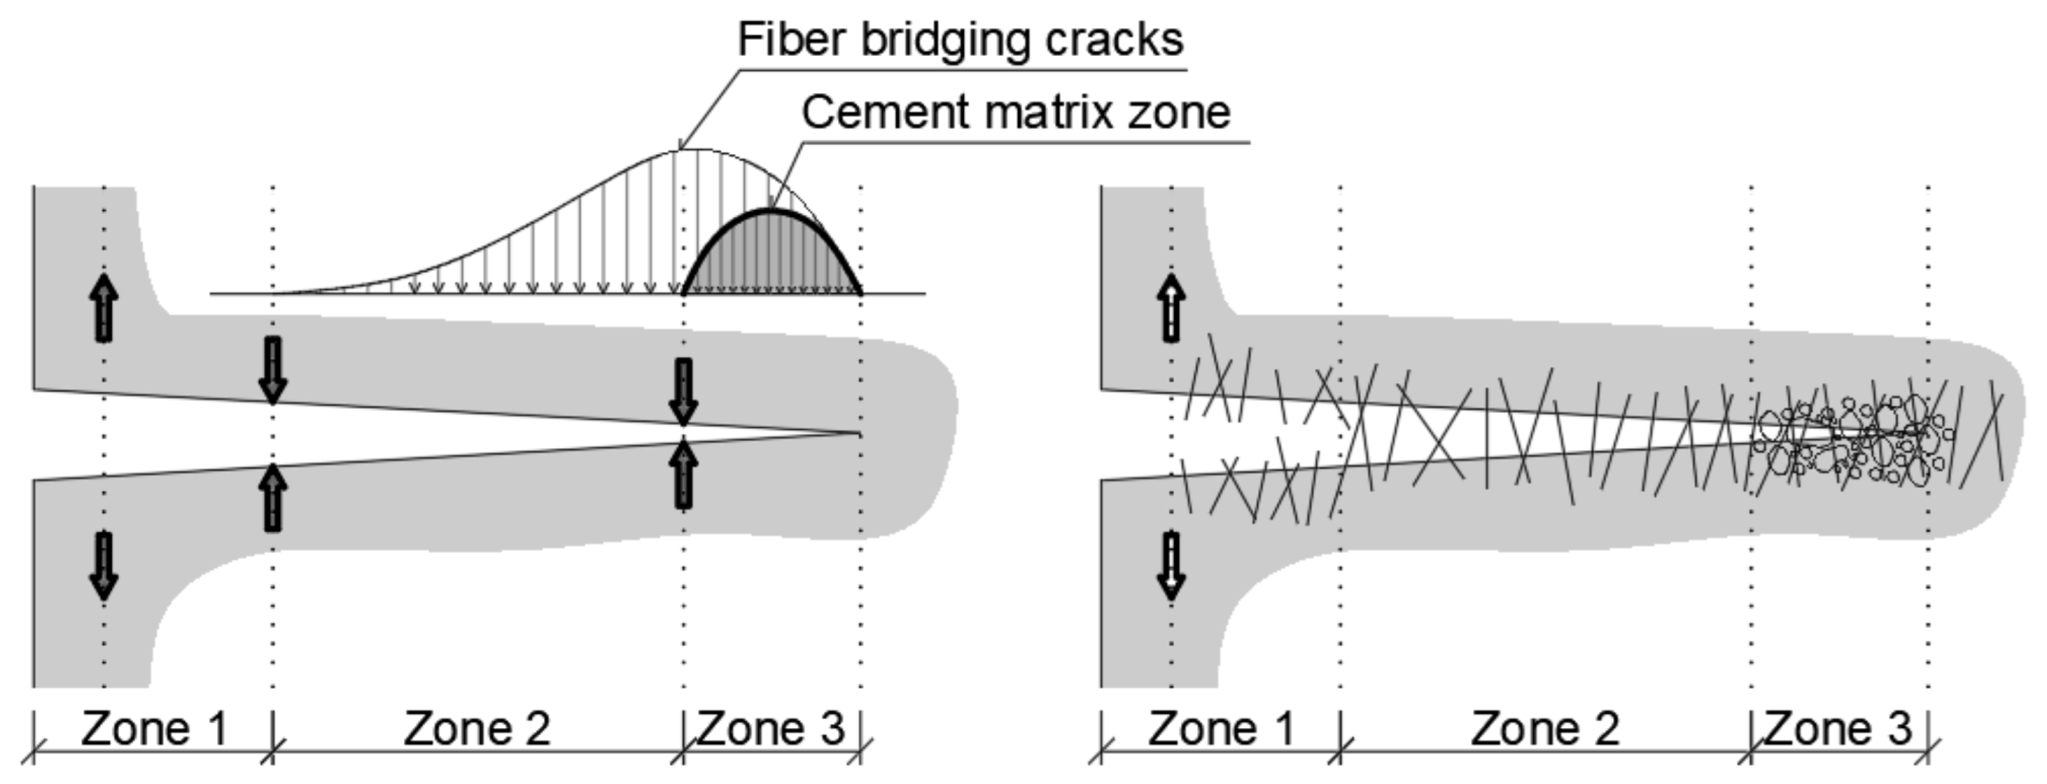
1.5. Crack Development Mechanism
If a crack forms in the cement composite, the fiber serves to slow down the unstable crack propagation (see Figure 7). Tensile stress is transferred across the crack by various mechanisms [28]. Three distinct zones can be identified in fiber-reinforced cement composite:

Figure 7.
Tension around the crack.
- (1)
- Zone without stress;
- (2)
- The zone in which the fibers bridge the crack—the stress is transmitted by the fibers;
- (3)
- Matrix process zone containing microcracks but with sufficient continuity.
2. Experimental and Numerical Analysis Performed on Beams
The input values of materials such as fiber-reinforced concrete are not easy to determine. The reason is that it is not possible to predict the dispersion of fibers in the cement composite. The random dispersion of fiber greatly affects the mechanical properties of fiber concrete; it increases tensile strength and toughness. As already mentioned, this behavior is influenced by the type of fiber and the volume of added fiber [25,26,27,28]. Figure 8 shows the dependence of stress and deformation on the volume of added fiber. If the volume of fiber is sufficient, the composite hardens, and conversely, if the volume of fiber is insufficient, the composite softens.
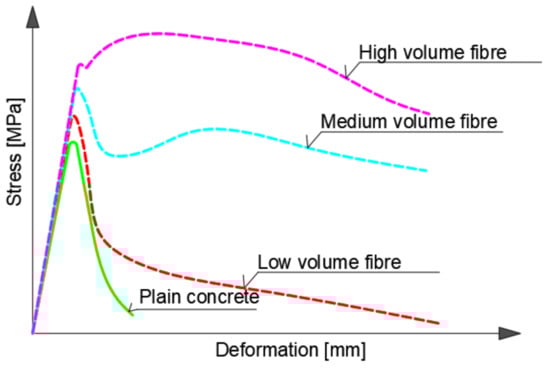
Figure 8.
Comparison of fiber volume in concrete matrix.
For the experimental study, the Dramix 3D 55/30 fiber type was used. This type of fiber has a higher efficiency of anchoring in the cement matrix. Thanks to the final treatment, this fiber is able to transmit higher tensile strength compared to straight fiber. The design mixtures of the cement composite are listed in Table 1, where FRC represents the fiber-reinforced concrete. For comparison, two volumes of added fiber were used, namely, 75 kg/m3 and 110 kg/m3. The specimens were subjected to a 3-point bending test. The dimensions of the test beams were 150 × 150 × 700 mm (Figure 9a). The distance between the supports was 500 mm. The depth of the notch in the middle of the span was 25 mm, which corresponds to 1/6 of the height of the specimen [20]. The specimens were loaded at a constant speed of 0.05 mm/min until the opening of the crack CMOD = 0.1 mm, and then the loading speed was increased to 0.2 mm/min. The end of the test occurred when the crack opening value CMOD = 4 mm was reached.

Table 1.
Design of mixtures.
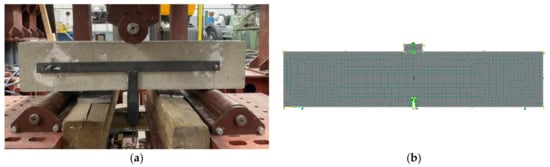
Figure 9.
Experimental program: (a) basic sample for 3-point bending test; (b) numerical model.
The numerical model for obtaining the properties of fiber-reinforced concrete was created using ATENA 2D software (version ATENA 5.7.0n, Červenka Consulting, Prague, Czech Republic) [29,30,31]. The model consisted of two macroelements, namely, a beam and a steel plate. The SBeta model was used for simulation of the material. This material model will be described in the following chapter. The FE mesh of macroelements was smoothed into the size of elements of 10 mm (see Figure 9b). The numerical model was loaded with load steps. Each load step was defined as a combination of load cases. The main loading state was external load, and the steps of the loading state were identical according to the experiment. To determine the behavior of fiber-reinforced concrete, the fracture energy parameters and tensile strength were adjusted, and the resulting values are listed in Table 2. Using ATENA 2D software, it was not possible to enter the bending tensile strength (fR) directly. Therefore, for the numerical model, tensile strength (ft) was modified to obtain the correct behavior of fiber concrete.
Table 2.
Basic values of fiber-reinforced concrete assigned to the numerical model.
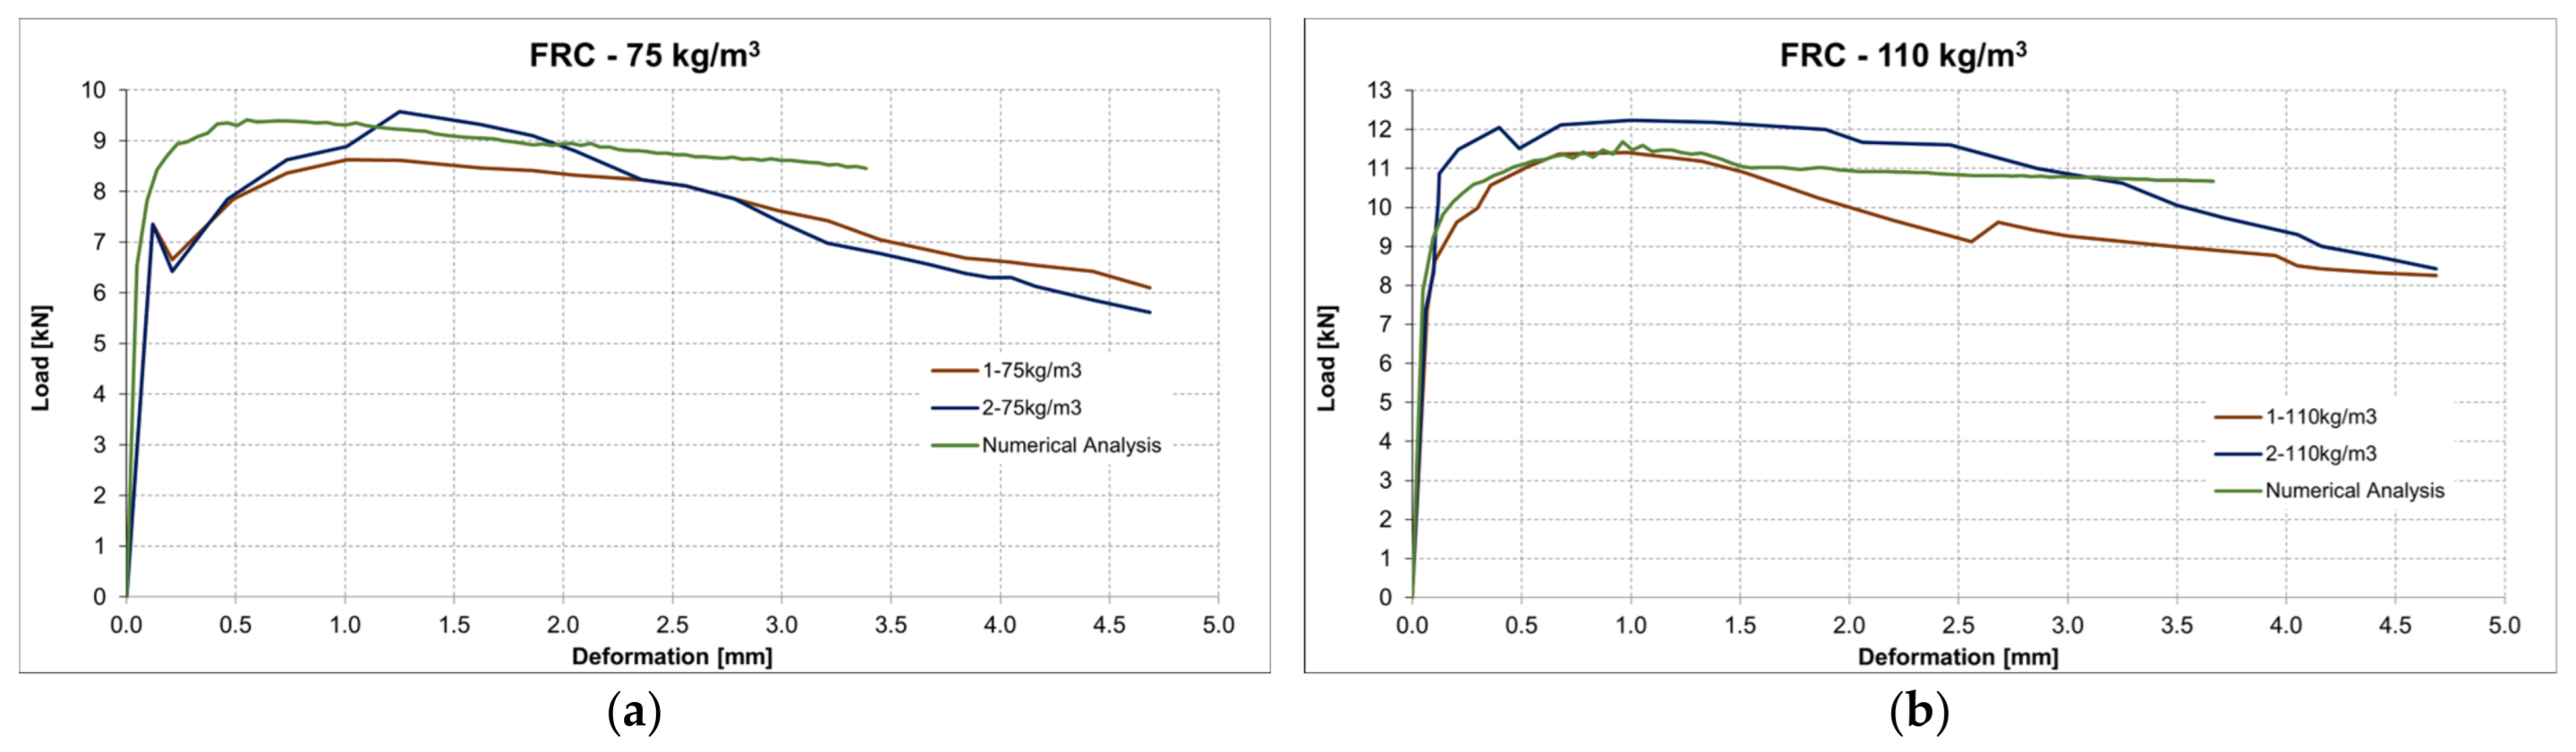
By modifying the mentioned parameters, two models were calibrated for two types of fiber volume. The results are shown in Figure 10. The contribution of steel fiber is considered in terms of higher fracture energy instead of the parameter of tensile strength.
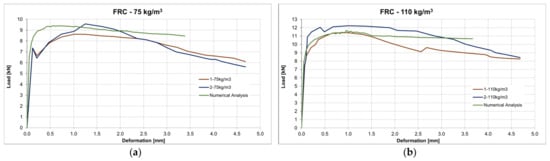
Figure 10.
Comparison of numerical model and experiment: (a) the volume of 75 kg/m3; (b) the volume of 110 kg/m3.
3. Numerical Analysis of Anchorage Zone
3.1. Specimen of Anchorage Zone
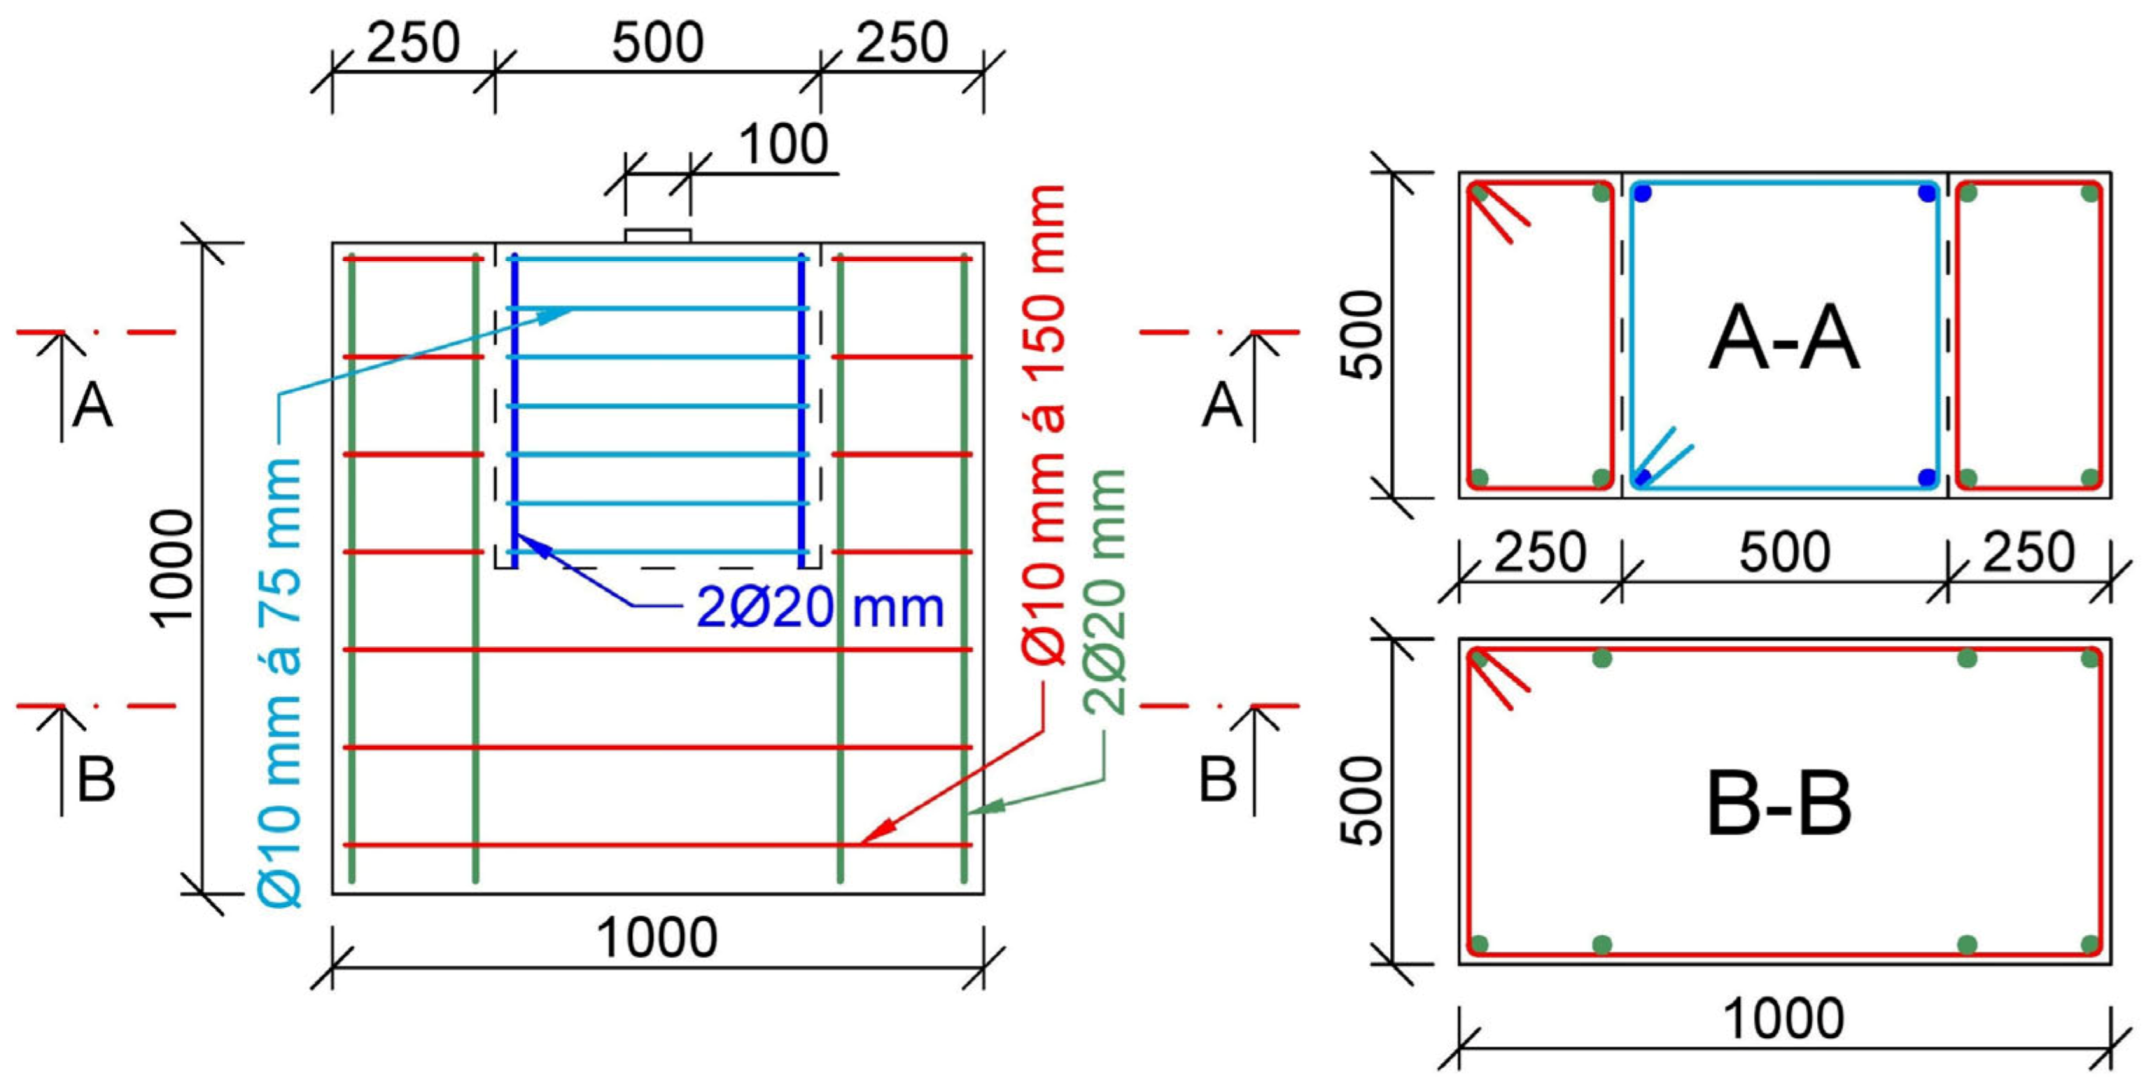
For the numerical study, a block specimen with a length and width of 1000 mm and depth of 500 mm was designed. Three types of specimens were analyzed. First, the anchorage zone was cast from standard reinforced concrete (grade C30/37). Second and third, the anchorage zone was created by adding fiber-reinforced concrete with two different fiber volumes. In the case of the casting of the specimen, the cubic gap was created in the anchorage area with a size of 500 mm. Later, fiber-reinforced concrete block with two different amounts of steel fibers was cast in this gap. In the analysis, fiber-reinforced concrete was considered with the following parameters: the volume of fiber of 75 kg/m3; and the volume of fiber of 110 kg/m3. The conventional reinforcement (grade B500B) of the specimen consisted of longitudinal bars with a diameter of 20 mm and two-legged stirrups with a diameter of 10 mm and spacing of 150 mm. In the anchorage zone, the spacing of two-legged stirrups was 75 mm. The conventional reinforcement layout was the same for both types of specimens (with/without fiber-reinforced concrete). The specimen is depicted in Figure 11.
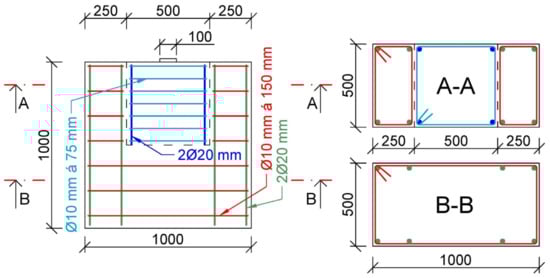
Figure 11.
Specimen for numerical analysis of anchorage zone (dimensions in mm).
The contact between the concrete specimen and the later-added anchorage block was considered rigid because of compressive load. The analysis of contact between new and old layers of concrete using various surface modifications was presented, for example, in [26].
3.2. Nonlinear Numerical Analysis
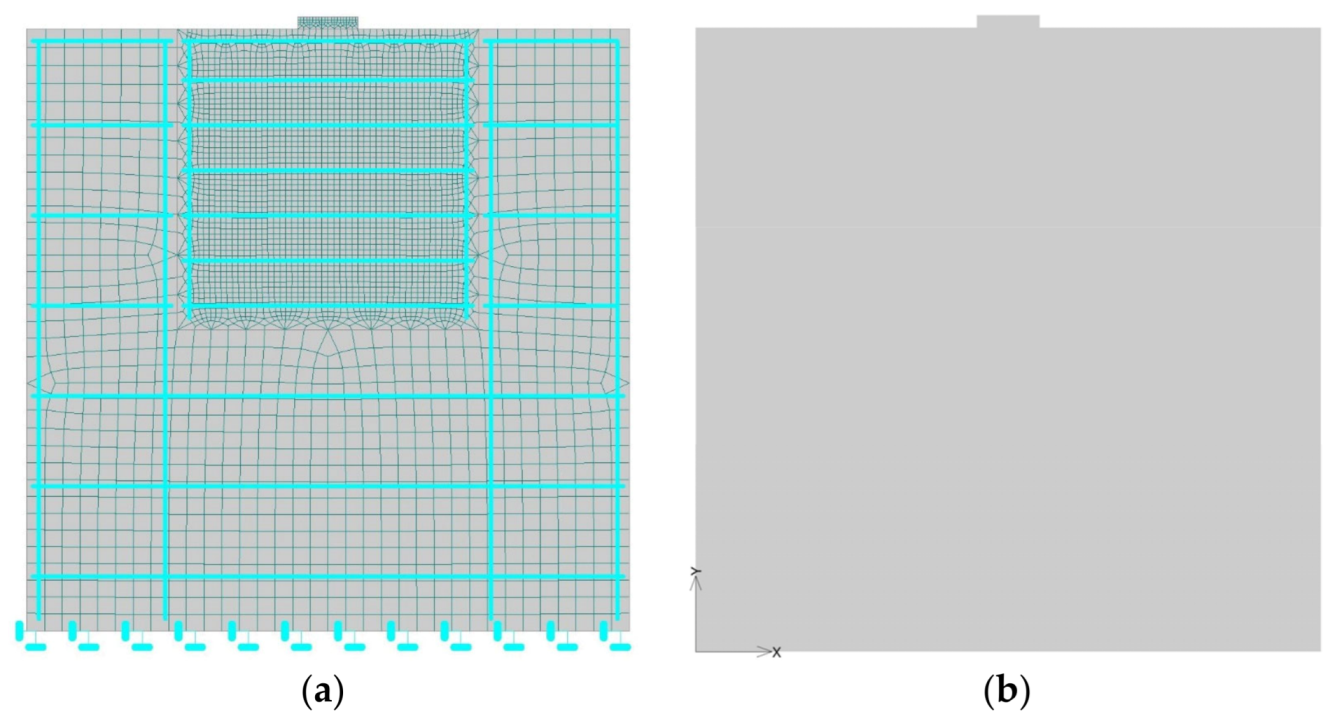
For the analysis of the possible application of fiber-reinforced concrete in the anchorage zone, nonlinear numerical analysis using ATENA 2D software (version ATENA 5.7.0n, Červenka Consulting, Prague, Czech Republic) was performed [29,30,31]. The executed simulation should help us to understand the behavior of the specimens with different anchorage blocks. The specimen simulating the anchorage zone was modelled as a 2D finite element. The material properties that were assigned to individual materials are listed in Table 3. These properties were based on the analysis of the already-mentioned test beams. The dimensions and the materials of the specimen for numerical analysis were described in Section 3.1. The boundary conditions were modelled as the line supports on the bottom edge of the specimen (restraints along the x- and y-axis). The steel load-distribution plate with dimensions of 100 × 500 mm (simulation of the anchorage plate) was modelled on the top edge of the specimen. Conventional reinforcement bars were assigned as 1D elements. The load was applied in increments of 20 kN using the node force located in the center of the steel plate. The FE numerical model can be seen in Figure 12a and the axis orientation in Figure 12b.
Table 3.
Assigned properties to materials in the numerical analysis.
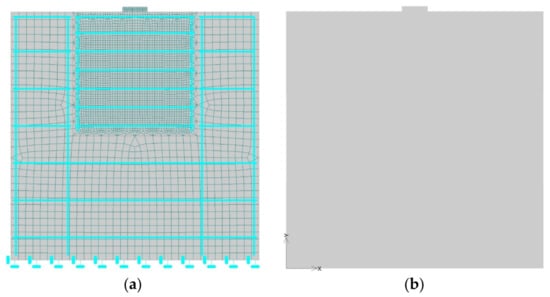
Figure 12.
(a) FEM model of anchorage zone with conventional reinforcement in ATENA 2D software; (b) axis orientation.
A major part of the specimen, which was designed from the concrete of grade C30/37, was modelled from Quadrilateral CCQ10SBeta 30 mm large elements. The mesh of the anchorage block was smoothed into Quadrilateral CCQ10SBeta with a size of 10 mm. Steel distribution plates consisted of Quadrilateral Elements CCQ10 with a size of 5 mm. These parameters are listed in Table 4.
Table 4.
Size of FE mesh of individual macroelements.
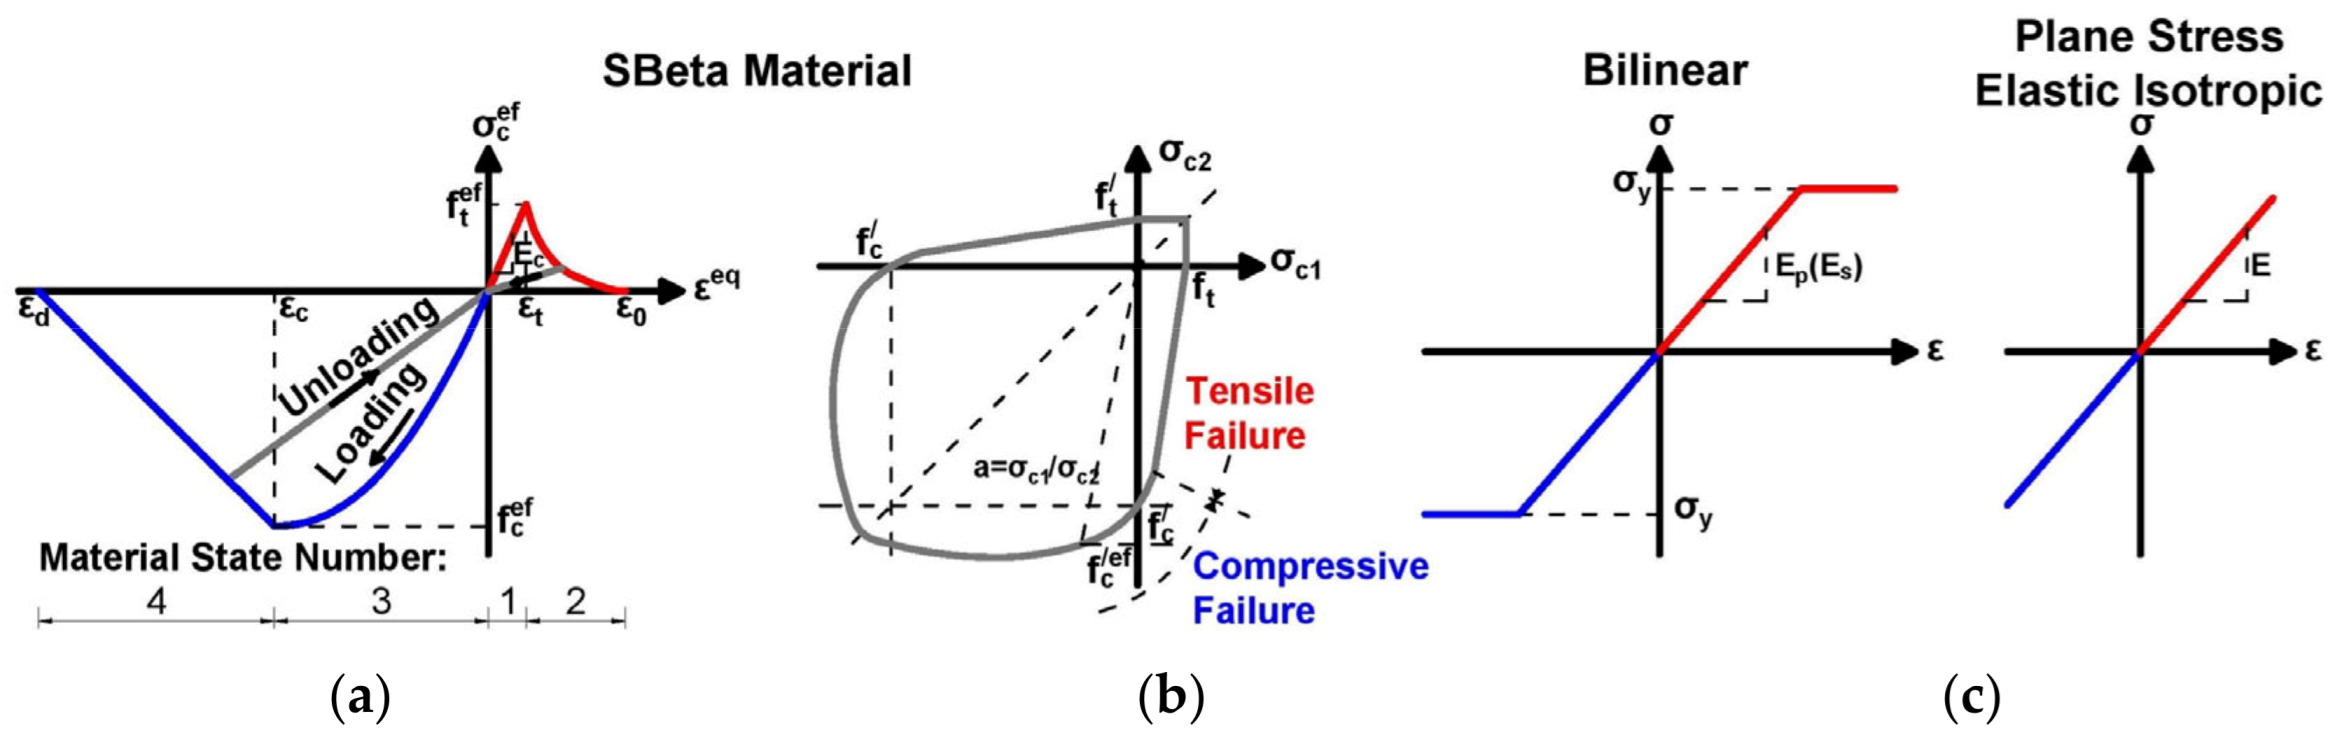
The applied SBeta constitutive model of concrete includes twenty material parameters. The parameters used were assigned according to ATENA 2D software guidelines for finite element analysis. The formulation of constitutive relations was considered in the plane stress state. The stress–strain curves of individual modelled materials can be seen in Figure 13. A more detailed description of the used SBeta constitutive model is presented in [29].
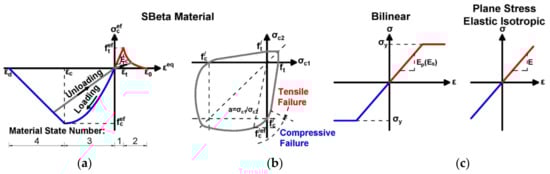
Figure 13.
(a) Stress–strain curve for concrete, and biaxial failure function for concrete; (b) stress–strain curve for reinforcement; (c) stress–strain curve for steel plates.
4. Discussion
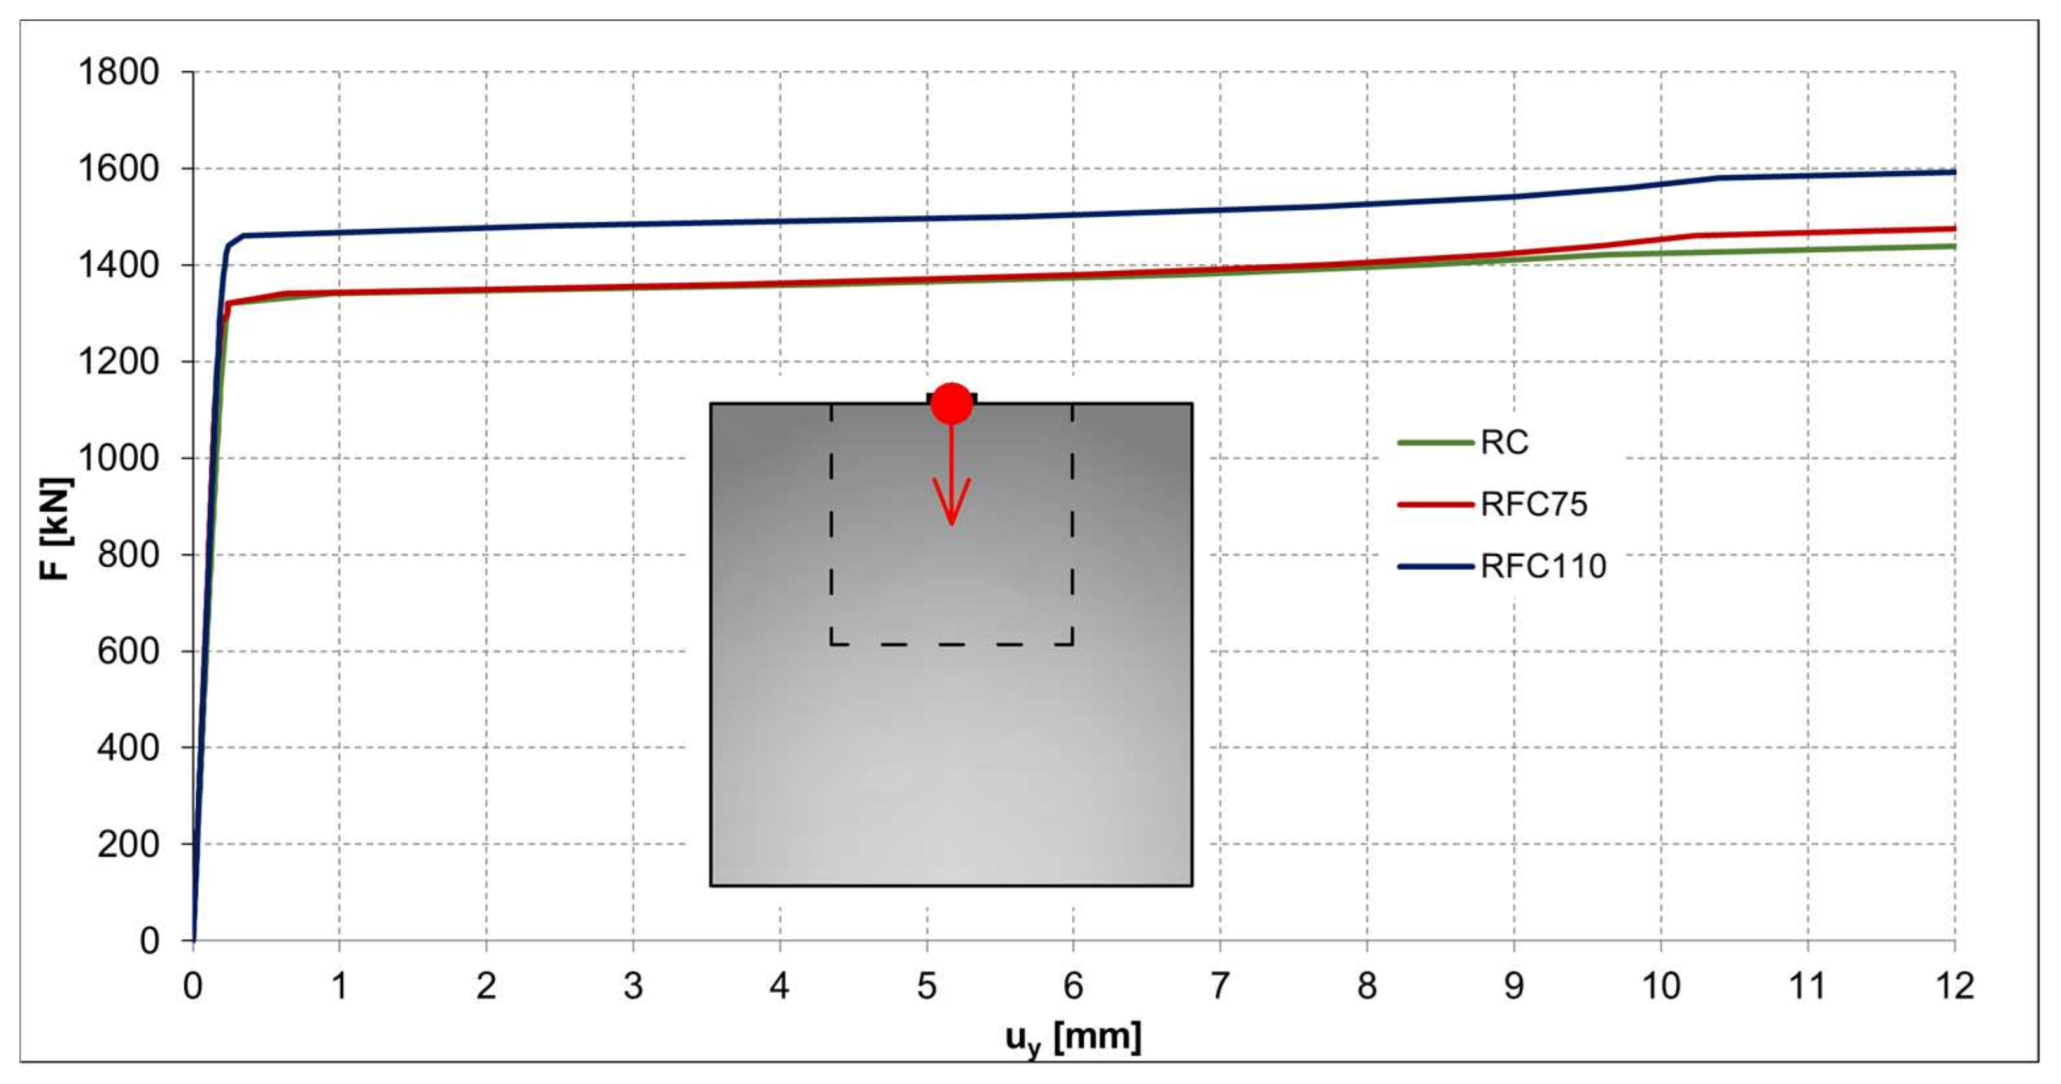
Numerical analysis was performed to compare the influence of adding Dramix 3D 55/30 fiber into the anchorage zone. In Figure 14, it can be seen that the relationship between the applied force and displacement is similar for the anchorage zone from standard reinforced concrete and fiber-reinforced concrete with a lower volume of fiber (75 kg/m3). In this case, the effect of the presence of fiber is negligible. However, in the case of a higher volume of fiber (110 kg/m3), the load-carrying capacity is higher by almost 10%. Red (deformation) and blue (stresses) marks in Figure 14, Figure 15 and Figure 16 represent monitoring points.
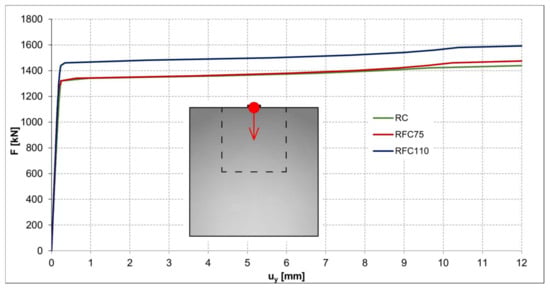
Figure 14.
Relationship between deformation uy and applied external force F.
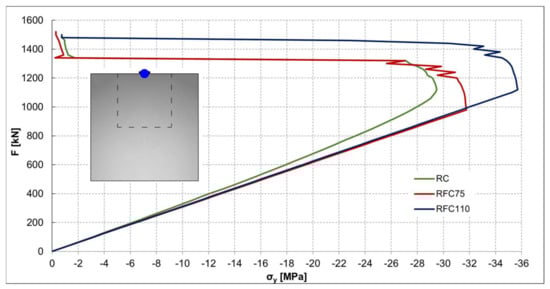
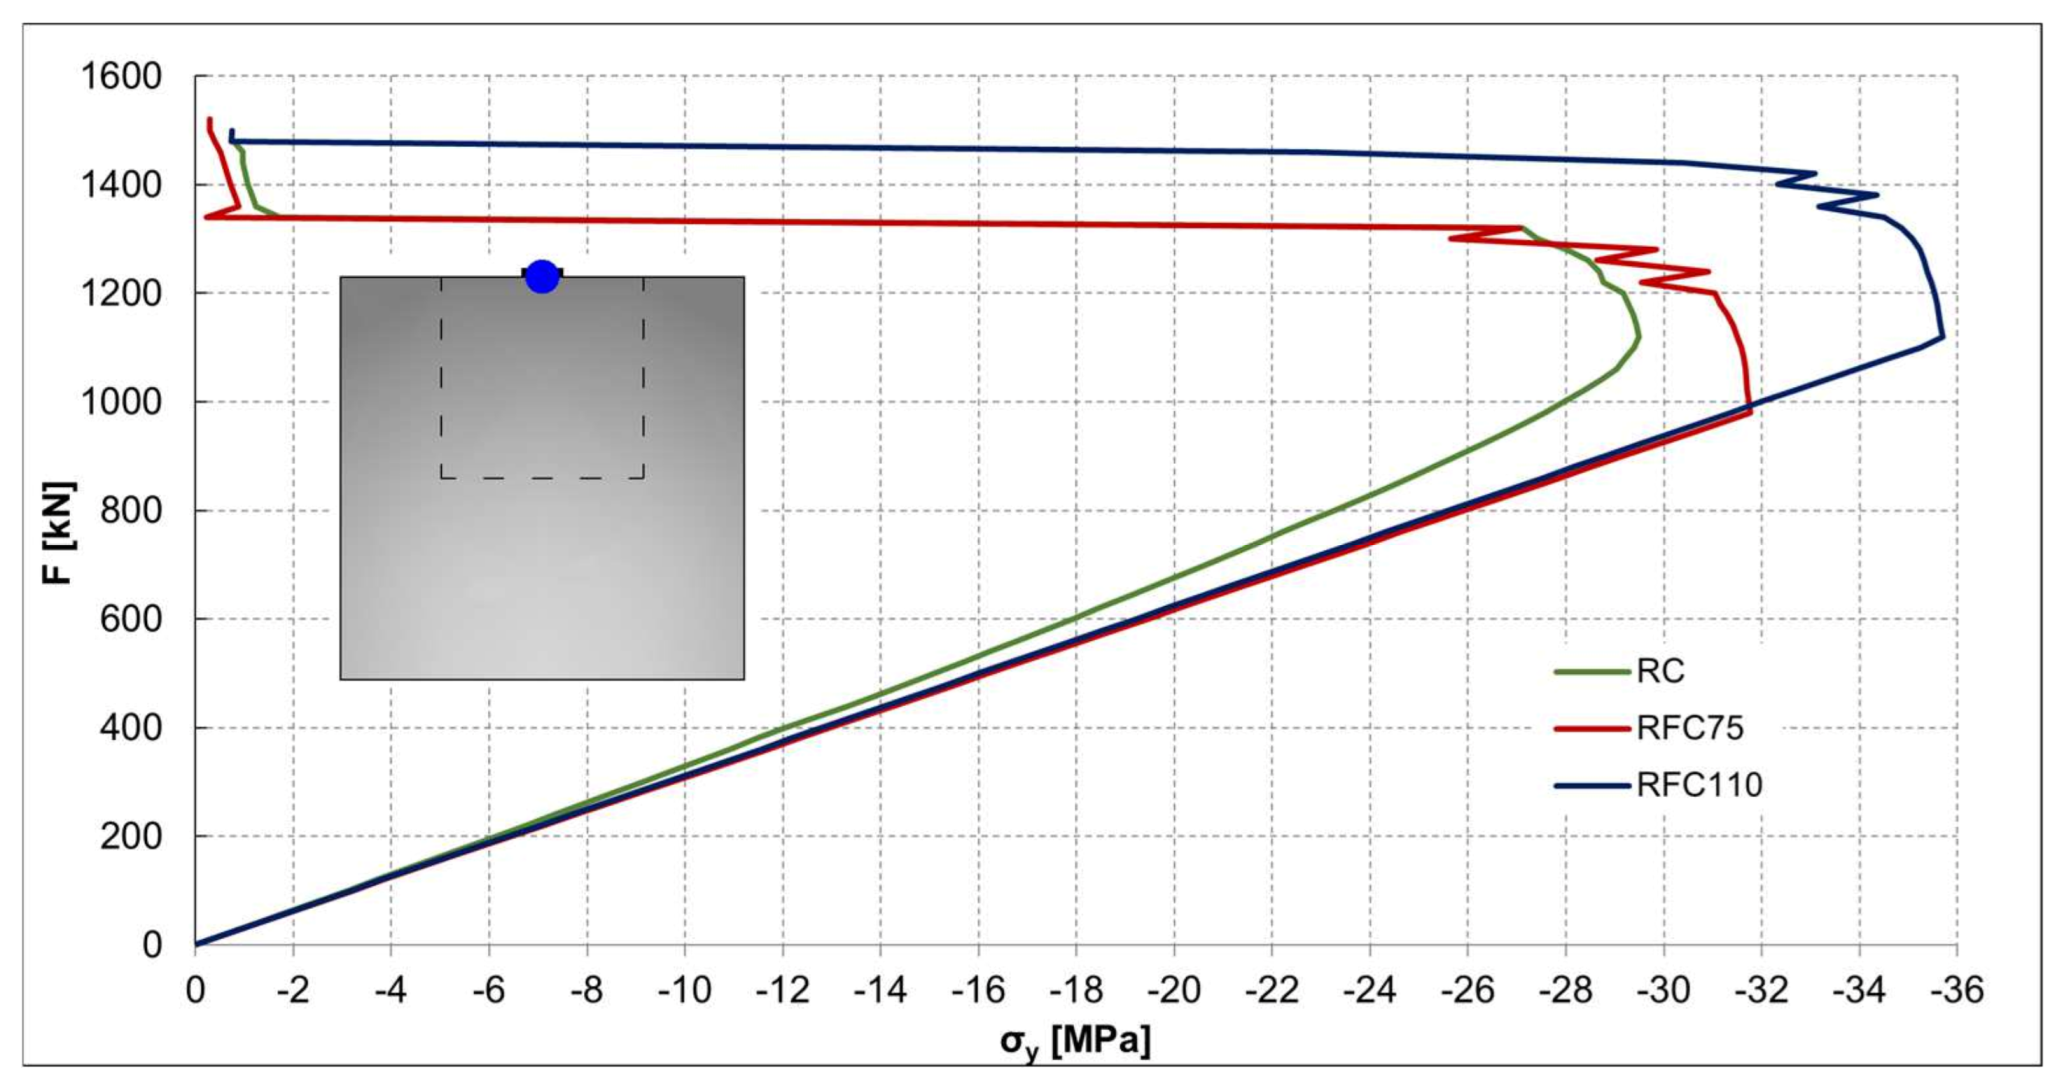
Figure 15.
Relationship between stress σy and applied external force F.
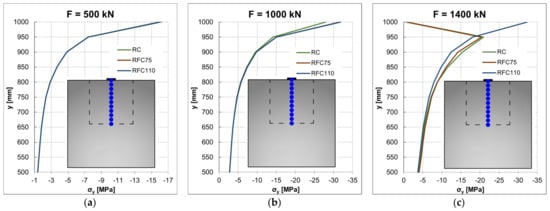
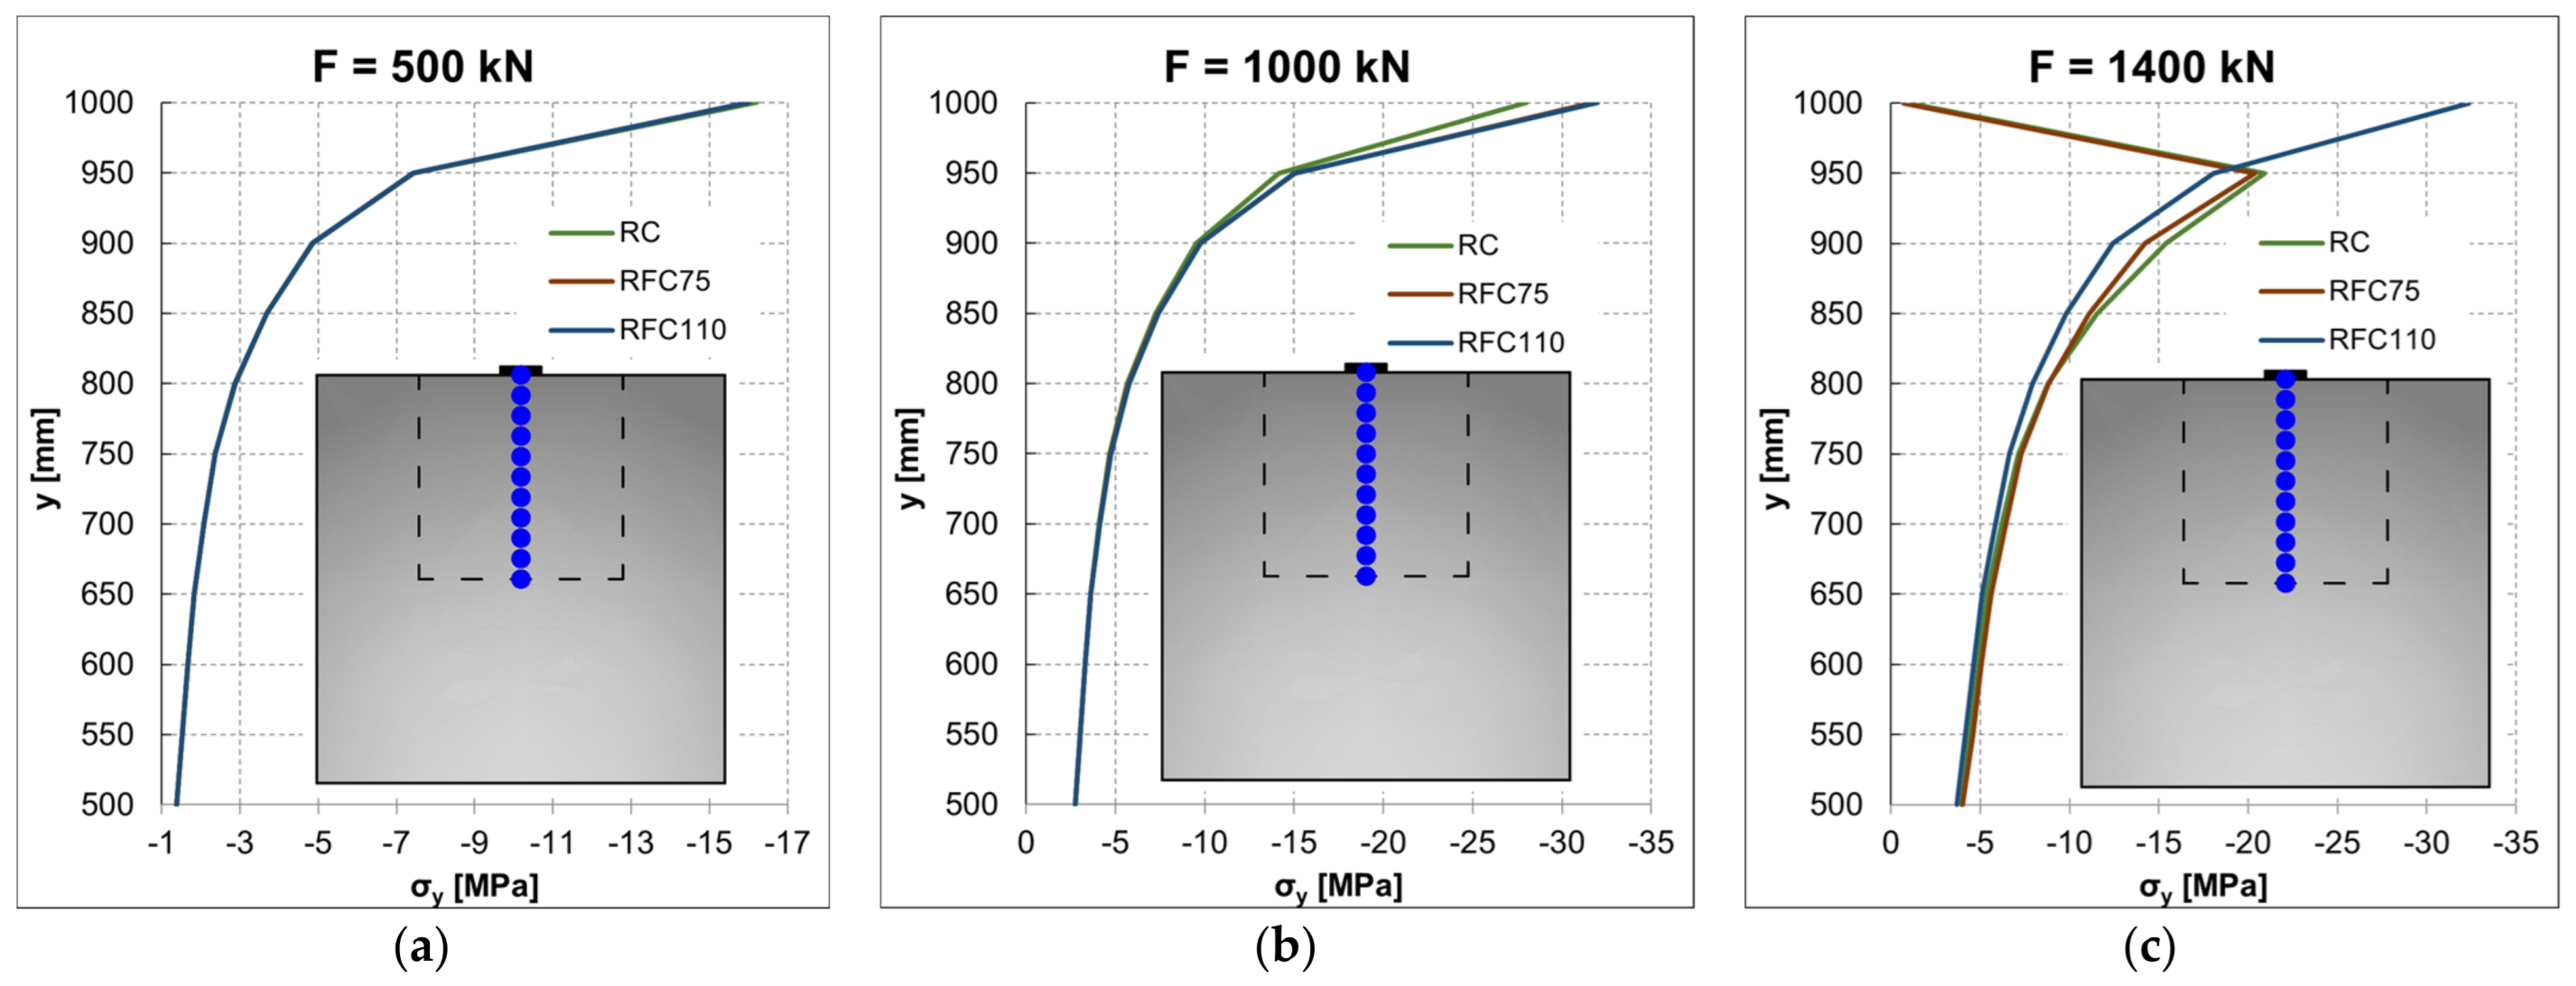
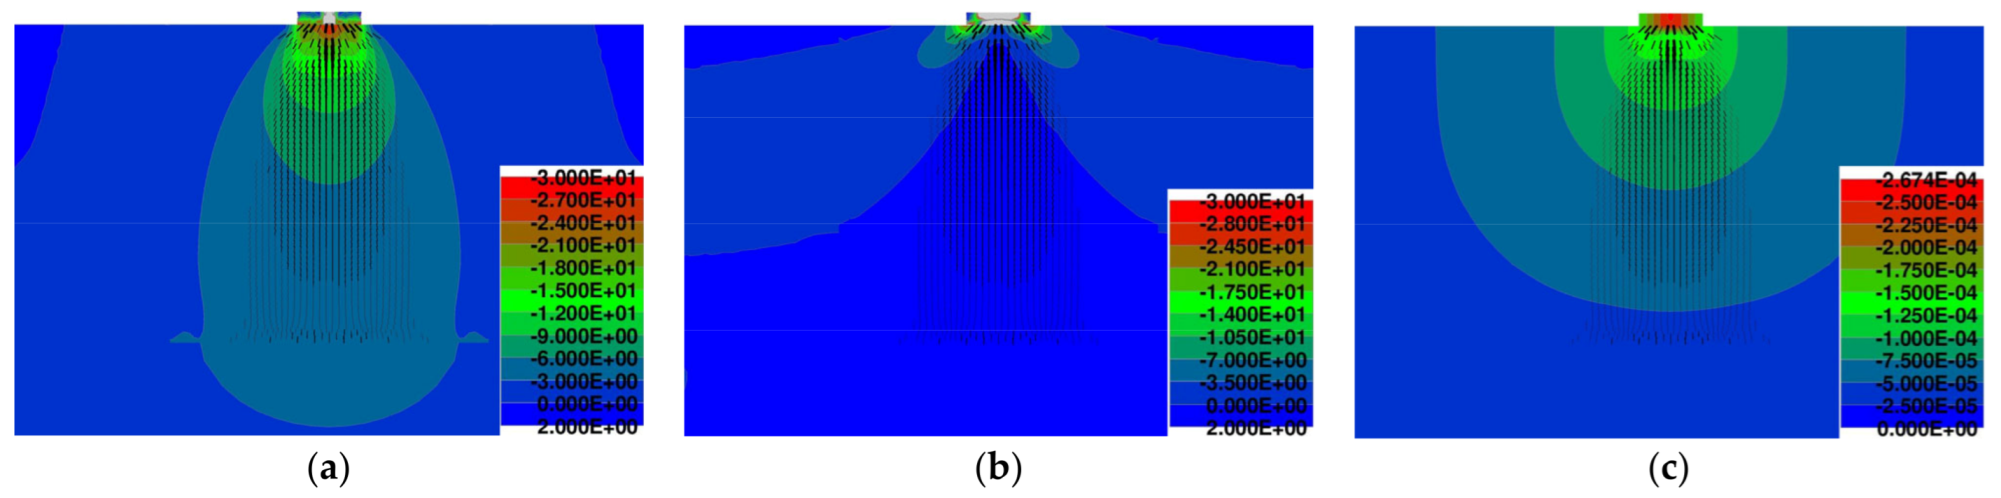
Figure 16.
Stress σy distribution along the height of the anchorage block: (a) F = 500 kN; (b) F = 1000 kN; (c) F = 1400 kN.
Figure 15 shows that the initiation of cracks is not significantly influenced by the lower value of fiber in the anchorage zone. On the other hand, the higher volume of fiber increased the level of critical load by approximately 14%. In the case of the anchorage zones, it is very important to keep the area crack-free. Thus, the zone is protected against the corrosion of the reinforcement.
Figure 16 displays the stress σy distribution in the anchorage block from reinforced concrete of fiber-reinforced concrete (75 kg/m3 and 110 kg/m3). It can be seen that in the case of force F = 500 kN and 1000 kN, no cracks are expected (Figure 16a,b). On the other hand, for F = 1400 kN, the anchorage zone stays crack-free only in the case of fiber-reinforced concrete with a higher volume of fiber (see Figure 16c).
Figure 17, Figure 18 and Figure 19 depict the stresses σy and σx and the displacements in the case of failure of the anchorage zone (detail on the anchorage block). The axis orientation in FEM model is displayed in Figure 10b. Moreover, these figures display crack propagation. The critical load is listed in Table 5. In the case of specimens with an anchorage zone from FRC, cracks with small widths can be seen along the anchorage zone. This can be attributed to numerical analysis and the parameter of fracture energy.
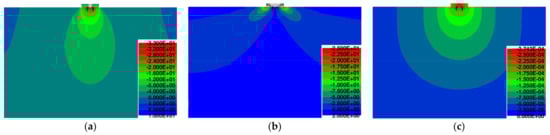
Figure 17.
Failure of the specimen with anchorage block from RC: stress (MPa) (a) σy; (b) σx; (c) displacement (m).
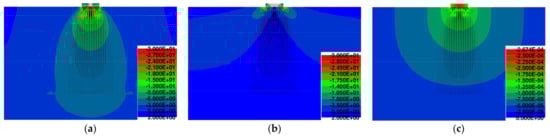
Figure 18.
Failure of the specimen with anchorage block from FRC 75 kg/m3: stress (MPa) (a) σy; (b) σx; (c) displacement (m).
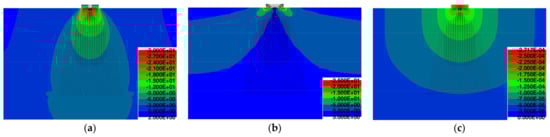
Figure 19.
Failure of the specimen with anchorage block from FRC 110 kg/m3: stress (MPa) (a) σy; (b) σx; (c) displacement (m).
Table 5.
Critical loads of individual specimens.
5. Conclusions
The presented paper focused on the analysis of the application of fiber-reinforced concrete in the anchorage zone of civil engineering structures. The essence of the performed analysis was to consider the possibility of an increased load-carrying capacity of the anchorage zone by adding Dramix 3D 55/30 fiber. The parameters of two different fiber volumes in fiber-reinforced concrete for the simulations in ATENA 2D software were experimentally determined. As a result of the study, the following conclusions can be summarized:
- The lower volume of Dramix 3D 55/30 fiber (75 kg/m3) does not significantly influence the response of the compressed anchorage zone, and the performance is similar to standard reinforced concrete.
- A higher volume of Dramix 3D 55/30 fiber (110 kg/m3) can increase the load-carrying capacity of the anchorage zone. In the case of the performed analysis, the resistance was higher by nearly 10%, and the cracks were formed for approximately 14% higher load in comparison with standard reinforced concrete and the lower value of fiber.
- The cracks were only longitudinal, so in the case of the analyzed specimen, the transverse tensile stresses were successfully transferred into the conventional reinforcement and fibers.
- Consequently, it can be stated that the addition of fibers leads to better mechanical properties of the anchorage zone. Besides the higher tensile strength, the compressive strength was also increased.
Consequently, the performed study suggests that the application of fiber-reinforced concrete in the case of anchorage zones of various structures can be a possibility to increase the load-carrying capacity of such structures. However, it seems that for a notable increase, a higher volume of fiber is needed. In practice, it can be effective to cast the whole structure from standard reinforced concrete in advance and subsequently cast fiber-reinforced concrete block in the anchorage zone. This approach can be applied, for example, in the case of prestressed concrete or geotechnical structures. Based on the performed analysis, the recommendation includes performing a three-point bending test, which is essential for the proper determination of fiber-reinforced concrete behavior. Subsequently, obtained data should be used for the design of the anchorage zone. Importantly, it is suitable to focus on the analysis of fiber-reinforced concrete performance with higher volumes of added fibers. Nevertheless, given that our findings are based on a limited number of performed tests and simulations, the results from such an experimental program supported with numerical analysis should, therefore, be treated with considerable caution.
Future research should be focused on the following:
- The analysis of different types of anchorage zones—the study of eccentric anchorages and anchorage zones with multiple anchorage plates and sizes.
- Application of various types of conventional reinforcement arrangements and concrete classes.
- Comparison of performance of different types of fibers—length, shape, and material.
- Evaluation of the application of standard reinforced concrete from a higher class or ultra-high-performance concrete (UHPC) [32,33,34] in the anchorage zone.
- Assessment of the fiber volume.
Author Contributions
Conceptualization, J.K.; methodology, M.V. and J.K.; part—fiber-reinforced concrete, M.V.; software, M.V. and J.K.; validation, M.V. and J.K.; formal analysis, J.K.; investigation, M.V.; resources, M.V.; data curation, M.V. and J.K.; writing—original draft preparation, M.V. and J.K.; writing—review and editing, J.K.; visualization, J.K.; supervision, M.V. and J.K. All authors have read and agreed to the published version of the manuscript.
Funding
This paper was supported under the project of Operational Programme Integrated Infrastructure: Application of innovative technologies focused on the interaction of engineering constructions of transport infrastructure and the geological environment, ITMS2014+ code 313011BWS1. The project is co-funding by European Regional Development Fund.
Conflicts of Interest
The authors declare no conflict of interest.
Nomenclature
| PC | prestressed concrete |
| RC | reinforced concrete |
| FRC | fiber-reinforced concrete |
| FRC 75 kg/m3 | fiber-reinforced concrete—fiber volume of 75 kg/m3 |
| FRC 110 kg/m3 | fiber-reinforced concrete—fiber volume of 110 kg/m3 |
| Ec (Es) | modulus of elasticity |
| fc,cyl | cylindrical compressive strength of concrete (MPa) |
| ft (fr) | tensile strength of concrete (MPa) |
| fy | yield stress/strength (MPa) |
| NA | numerical analysis |
| FEM | finite element method |
| ft | tensile strength of concrete (MPa) |
| Gf | fracture energy (MN/m) |
| ν | Poisson’s ratio |
| W0 | area under the load–deformation curve (m2) |
| b, h | dimensions of tested beam (m) |
| a0 | depth of the notch (m) |
| F | maximum force (kN) |
| l | distance between the supports (m) |
| hsp | height of the tested beam (m) |
| CMOD | crack mouth opening displacement (m) |
| UHPC | ultra-high-performance concrete |
| wd | critical compressive displacement (m) |
References
- Bonopera, M.; Chang, K.-C.; Lee, Z.-K. State-of-the-Art Review on Determining Prestress Losses in Prestressed Concrete Girders. Appl. Sci. 2020, 10, 7257. [Google Scholar] [CrossRef]
- Hurst, M.K. Prestressed Concrete Design, 2nd ed.; E & FN SPON, An Imprint of Routledge: London, UK, 1998. [Google Scholar]
- Al-Hilali, A.M.; Izzet, A.F. Performance of Prestressed Concrete Hunched Beams with Multi-Quadrilaterals Opening. Civ. Environ. Eng. 2022, 18, 461–471. [Google Scholar] [CrossRef]
- Navrátil, J. Prestressed Concrete Structures, 2nd ed.; Technical University of Ostrava, Faculty of Civil Engineering: Ostrava, Czech Republic, 2014. [Google Scholar]
- Moravčík, M. Design of Prestressed Structures According to Eurocodes, 1st ed.; EDIS: Žilina, Slovakia, 2017. [Google Scholar]
- Abdel-Jaber, H.; Glisic, B. Monitoring of prestressing forces in prestressed concrete structures—An overview. Struct. Control Health Monit. 2019, 26, e2374. [Google Scholar] [CrossRef]
- Moravčík, M.; Bujňáková, P.; Bahleda, F. Failure and damage of a first-generation precast prestressed bridge in Slovakia. Struct. Concr. 2020, 21, 2353–2362. [Google Scholar] [CrossRef]
- Moravčík, M.; Bujňáková, P.; Bahleda, F. Conceptual Problems of First Generation of Precast Bridges. In Proceedings of the International Fib Symposium on Conceptual Design of Structures, Madrid, Spain, 26–28 September 2019; pp. 301–308. [Google Scholar]
- Bujňáková, P. Anchorage System in Old Post-tensioned Precast Bridges. Civ. Environ. Eng. 2020, 16, 379–387. [Google Scholar] [CrossRef]
- Robinson, B.; Tawfiq, K.; Yazdani, N. Using Steel Fiber Reinforced Concrete in Post-Tensioned Anchorage Zones. Struct. Congr. 2009, 270–279. [Google Scholar] [CrossRef]
- Stone, W.C.; Breen, J.E. Behavior of Post-tensioned Girder Anchorage Zones. PCI J. 1984, 29, 64–109. [Google Scholar] [CrossRef]
- Jain, M.; Khapre, R. Post-tensioned anchorage zone: A review. Structures 2022, 46, 31–48. [Google Scholar] [CrossRef]
- Hudoba, I. High Performance Concrete; Slovak University of Technology in Bratislava: Bratislava, Slovakia, 2008. [Google Scholar]
- Pierre-Claude, A. High-Performance Concrete; Expodata-didot: Brno, Czechia, 2005; ISBN 80-86769-39-9. [Google Scholar]
- Krátky, J.; Trtík, K.; Vodička, J. Fiber-Reinforced Concrete Structures; ČKAIT: Prague, Czechia, 1999; p. 177. [Google Scholar]
- EN 14889-1:206; Fibres for Concrete. Steel Fibers. Definitions, Specifications & Conformity. British Standards Institution: London, UK, 2006.
- EN 14845-1:2007; Test Methods for Fibers in Concrete. British Standards Institution: London, UK, 2007.
- Jansson, A.; Gylltoft, K.; Löfgren, I.G. Design methods for fibre-reinforced concrete: A state-of-the art review. Resour. Conserv. Recycl. 2008, 171, 105565. [Google Scholar] [CrossRef]
- Bentur, A.; Mindess, S. Fibre Reinf Orced Cementitious Composites; Taylor & Francis: London, UK, 2007. [Google Scholar]
- Vítek, J.L.; Smiřinský, S. Interaction of traditional reinforcement and spread reinforcement. BETON- Technol. Struct. Rehabil. 2010, 2, 48–52. [Google Scholar]
- Anas, S.M.; Alam, M.; Umair, M. Experimental and numerical investigations on performance of reinforced concrete slabs under explosive-induced air-blast loading: A state-of-the-art review. Structures 2021, 31, 428–461. [Google Scholar] [CrossRef]
- Fib. Model Code for Concrete Structures 2010; International Federation for Structural Concrete (Fib): Lausanne, Switzerland, 2013. [Google Scholar]
- Vandewalle, L.; Nemegeer, D.; Balazs, L.; Barr, B.; Barros, J.; Bartos, P.; Banthia, N.; Criswell, M.; Denarie, E.; Di Prisco, M.; et al. RILEM TC 162-TDF: Test and design methods for steel fibre reinforced concrete σ-ε design method. Mater. Struct. 2003, 36, 560–567. [Google Scholar]
- Krátky, J.; Trtík, K.; Vodička, J. Brittleness and Fracture Mechanics of Cement Composites; Vědecké spisy Vysokého učení technického v Brně: Brno, Czech Republic, 2005. [Google Scholar]
- Vavruš, M.; Koteš, P. Numerical comparison of concrete columns strengthened with layer of fibre concrete and reinforced concrete. In Proceedings of the 13th International Scientific Conference on Suitable, Modern and Sade Transport (TRANSCOM 2019), Stary Smokovec, Slovakia, 29–31 May 2019. [Google Scholar]
- Vavruš, M.; Koteš, P.; Bahleda, F.; Jošt, J. Analysis of shear contact between wrapped layout of fiber reinforced concrete. Pollack Period. Int. J. Eng. Inf. Sci. 2019, 16, 77–82. [Google Scholar] [CrossRef]
- Chan, R.; Liu, X.; Galobardes, I. Parametric study of functionally graded concretes incorporating steel fibres and recycled aggregates. Constr. Build. Mater. 2020, 242, 118186. [Google Scholar] [CrossRef]
- Wecharatana, M.; Shah, S.P. A model for predicting fracture resistance of fibre reinforced concrete. Cem. Concr. Res. 1986, 13, 819–829. [Google Scholar] [CrossRef]
- Červenka, V.; Jendele, L.; Červenka, J. ATENA Program Documentation—Part 1. Theory. Prague, 26 January 2018. Available online: https://www.cervenka.cz/assets/files/atena-pdf/ATENA_Theory.pdf (accessed on 10 January 2023).
- Červenka, J. ATENA Program Documentation—Part 4-1. Tutorial for Program ATENA 2D. Prague, 2 June 2015. Available online: https://www.cervenka.cz/assets/files/atena-pdf/ATENA-Engineering-2D_Tutorial.pdf (accessed on 10 January 2023).
- Janda, Z.; Červenka, J. ATENA Program Documentation—Part 4-3. Tutorial for Construction Process Modelling in ATENA 2D. Prague, 9 March 2009. Available online: https://www.cervenka.cz/assets/files/atena-pdf/ATENA-Engineering-2D_Tutorial_Construction_Process.pdf (accessed on 10 January 2023).
- Sucharda, O.; Marcalikova, Z.; Gandel, R. Microstructure, Shrinkage, and Mechanical Properties of Concrete with Fibers and Experiments of Reinforced Concrete Beams without Shear Reinforcement. Materials 2022, 15, 5707. [Google Scholar] [CrossRef] [PubMed]
- Vítek, J.L.; Boháček, L.; Čítek, D.; Coufal, R. Strengthening of Concrete Structures Using UHPC. In Proceedings of the 6th Fib International Congress on Concrete Innovation for Sustainability, Oslo, Norway, 12–16 June 2022; pp. 2248–2257, ISBN 978-294064315-8. [Google Scholar]
- Holý, M.; Čítek, D.; Tej, P.; Vráblík, L. The Experimental Timber–UHPC Composite Bridge. Sustainability 2021, 13, 4895. [Google Scholar] [CrossRef]


Disclaimer/Publisher’s Note: The statements, opinions and data contained in all publications are solely those of the individual author(s) and contributor(s) and not of MDPI and/or the editor(s). MDPI and/or the editor(s) disclaim responsibility for any injury to people or property resulting from any ideas, methods, instructions or products referred to in the content. |
© 2023 by the authors. Licensee MDPI, Basel, Switzerland. This article is an open access article distributed under the terms and conditions of the Creative Commons Attribution (CC BY) license (https://creativecommons.org/licenses/by/4.0/).