
Predictive Maintenance 4.0 for Chilled Water System at Commercial Buildings: A Methodological Framework


Abstract
:1. Introduction
1.1. Overview
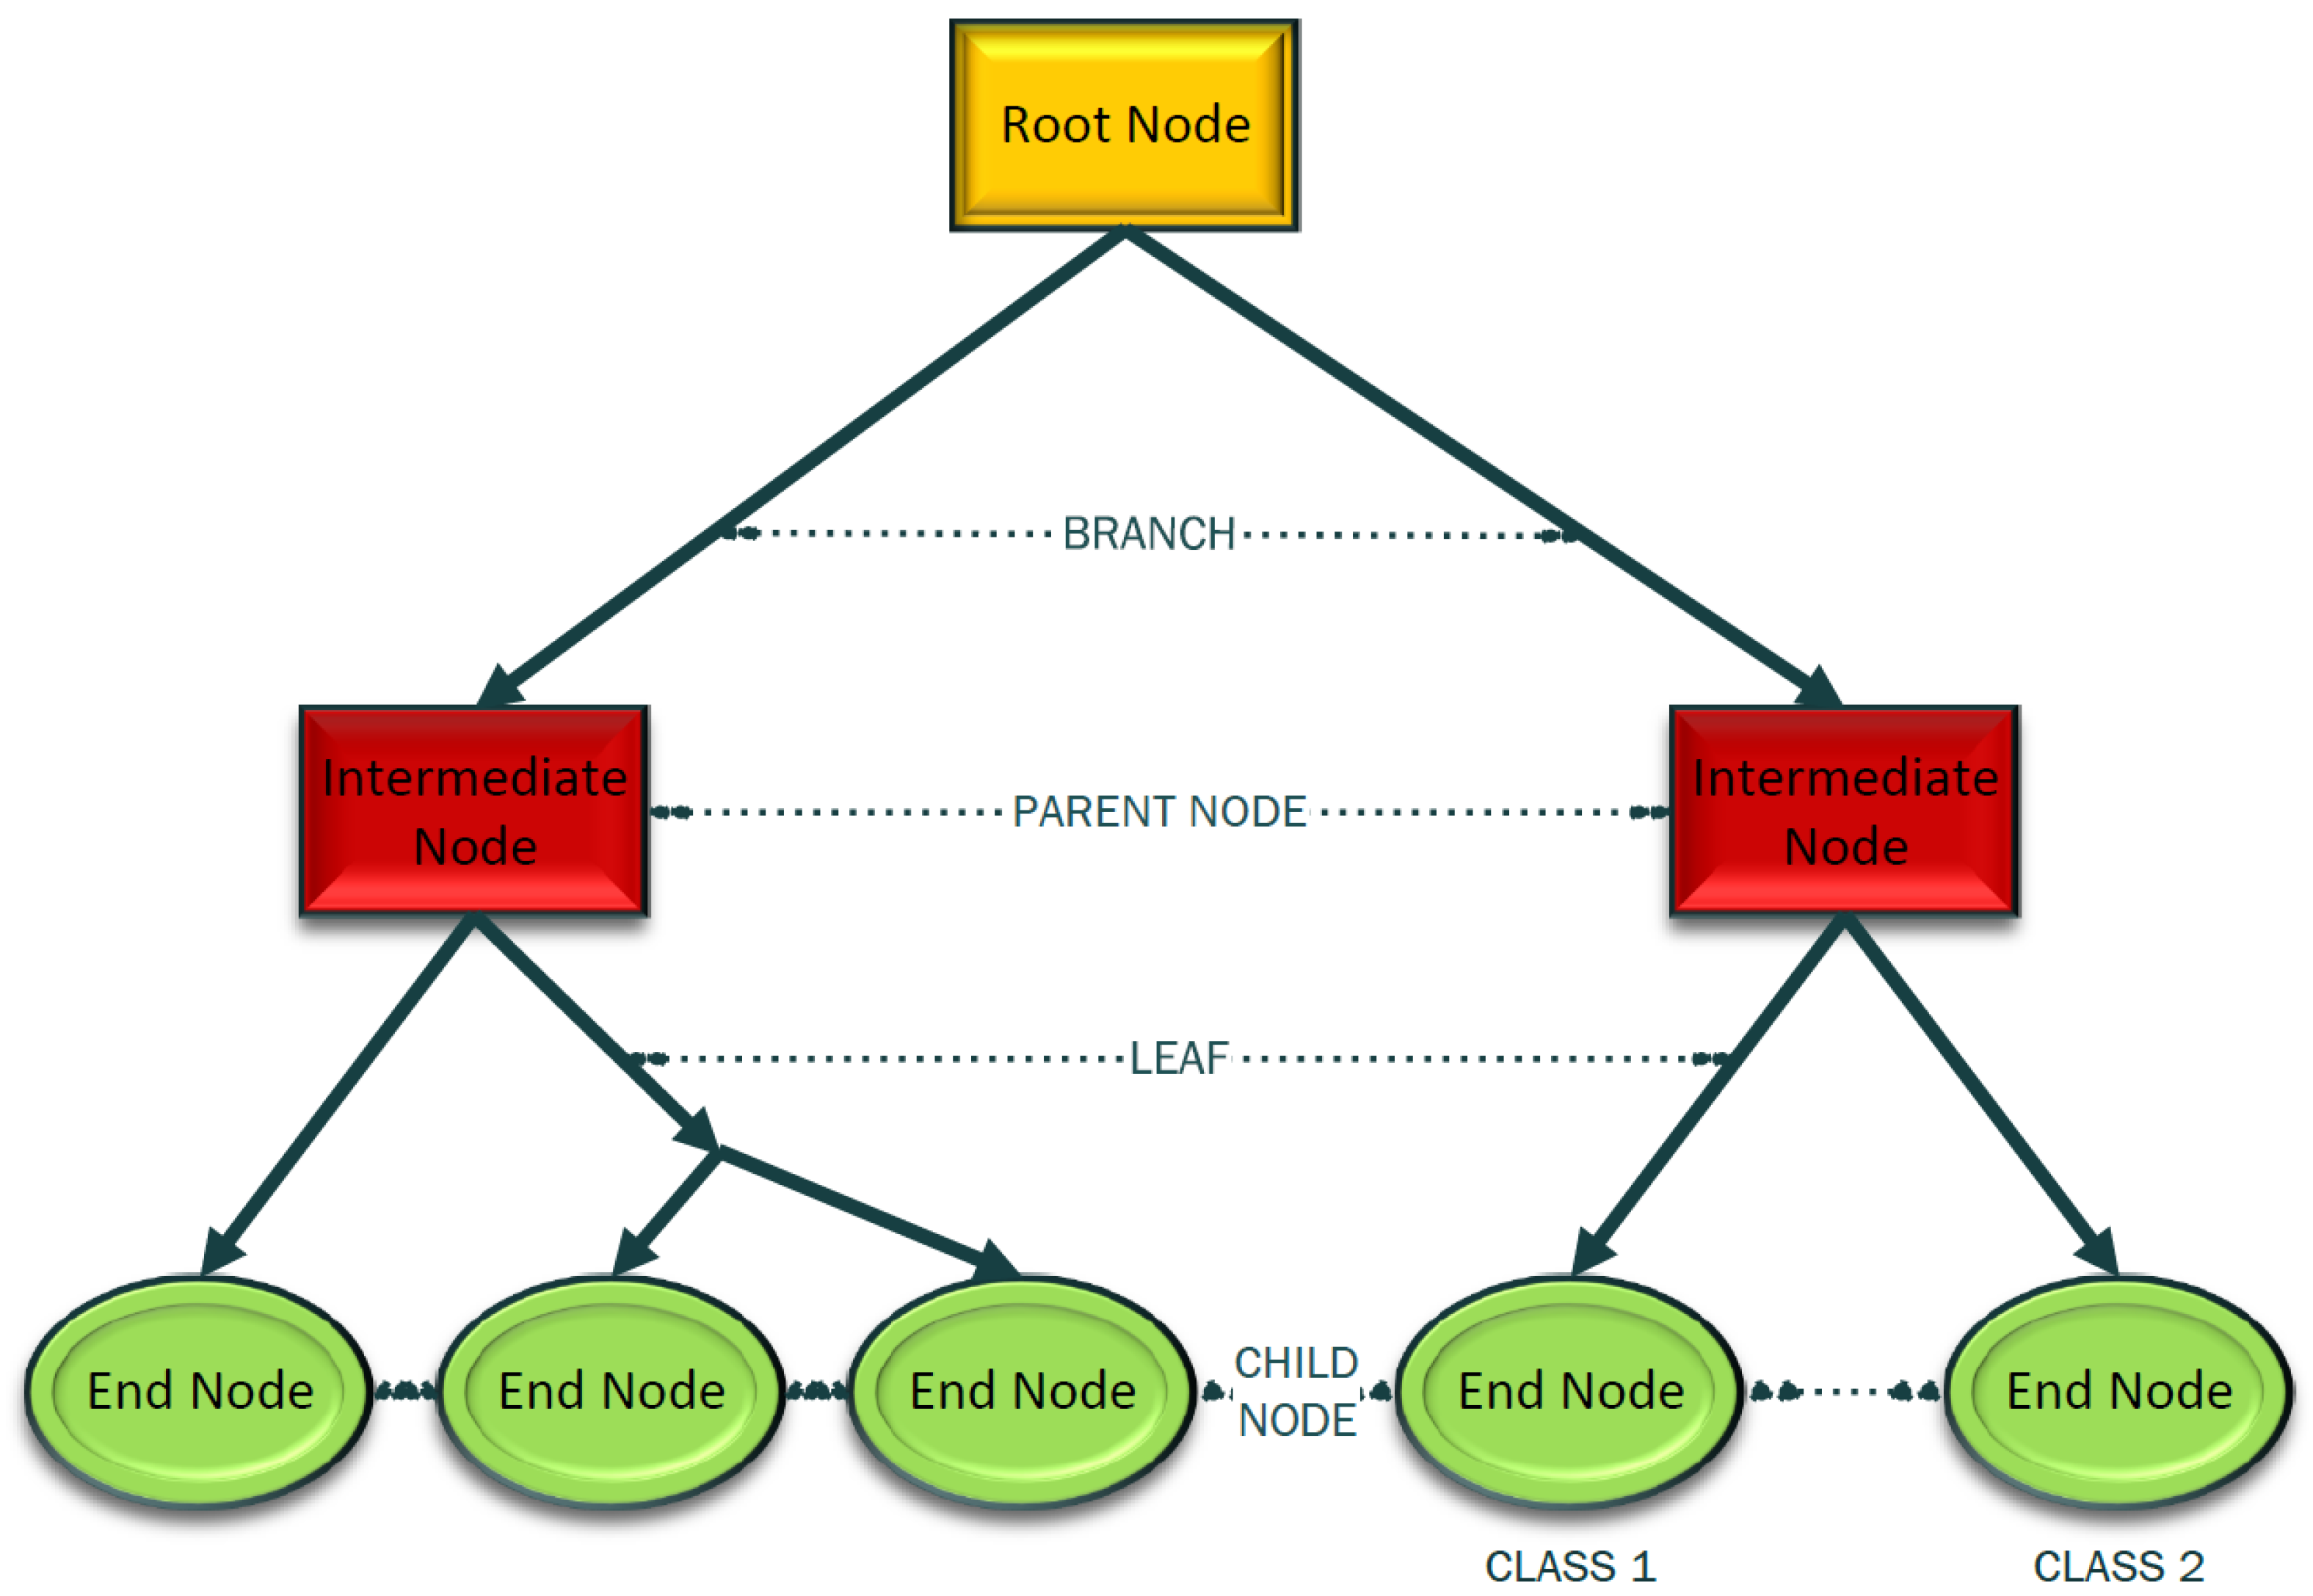
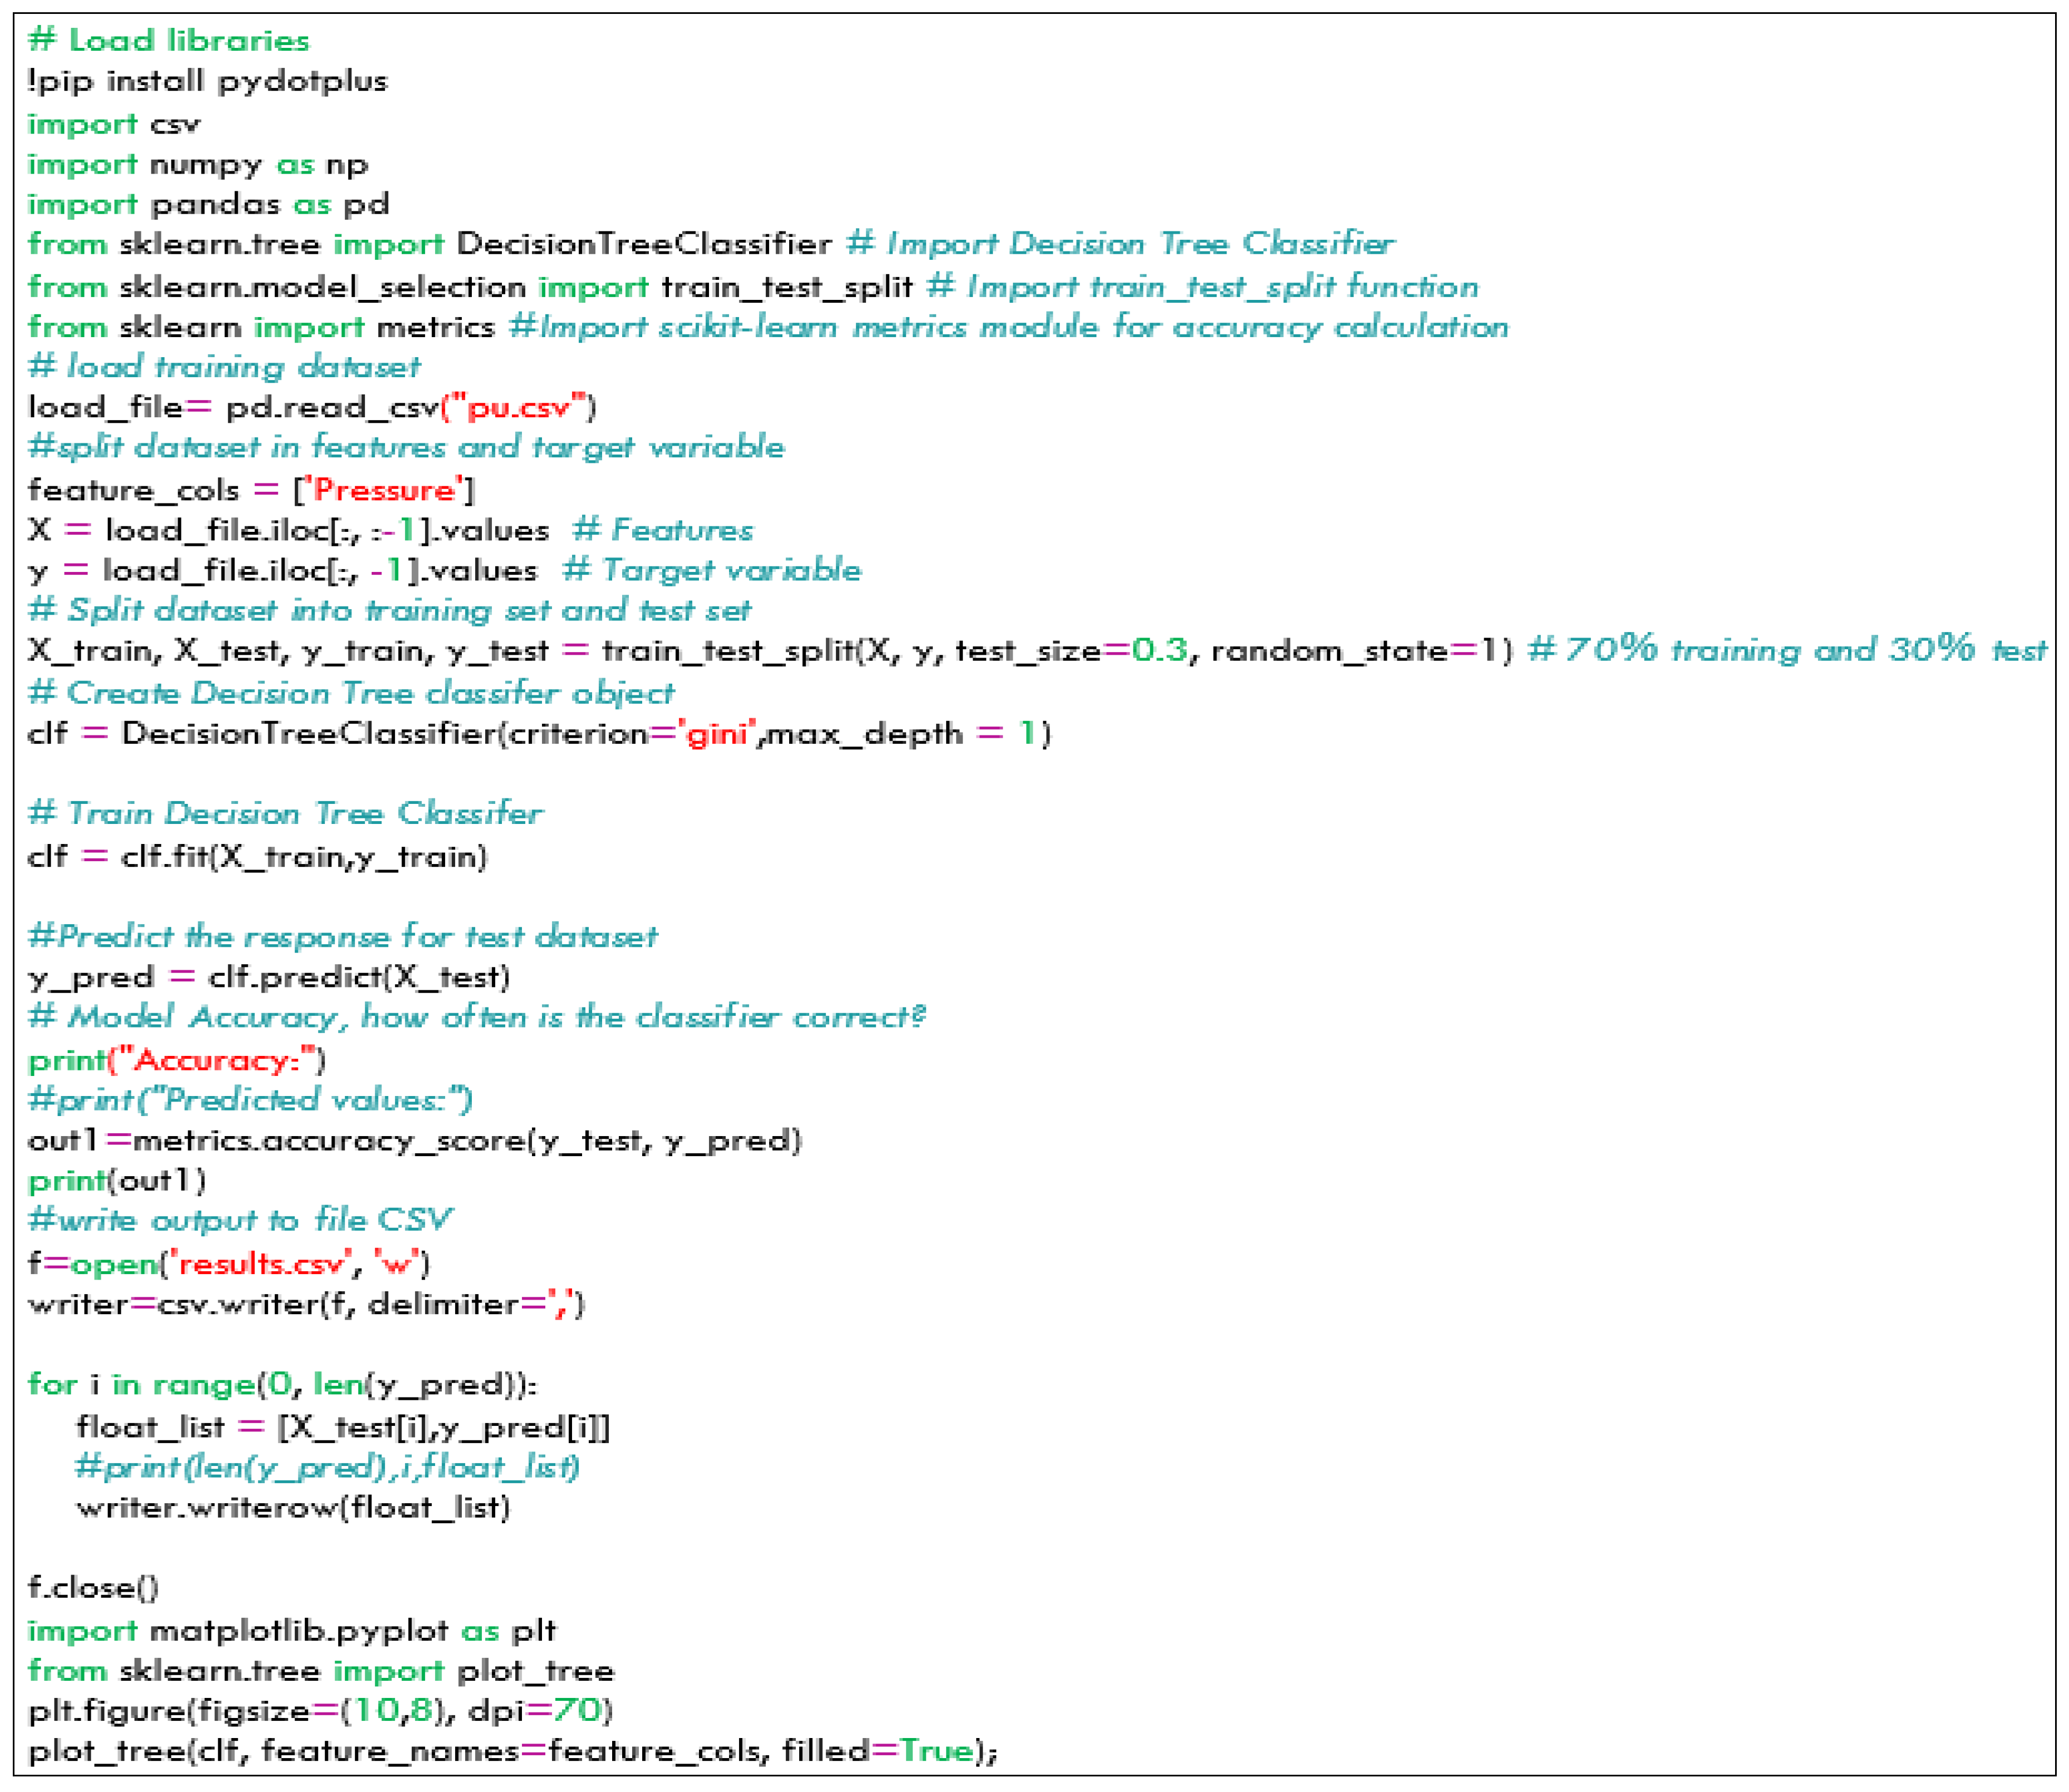
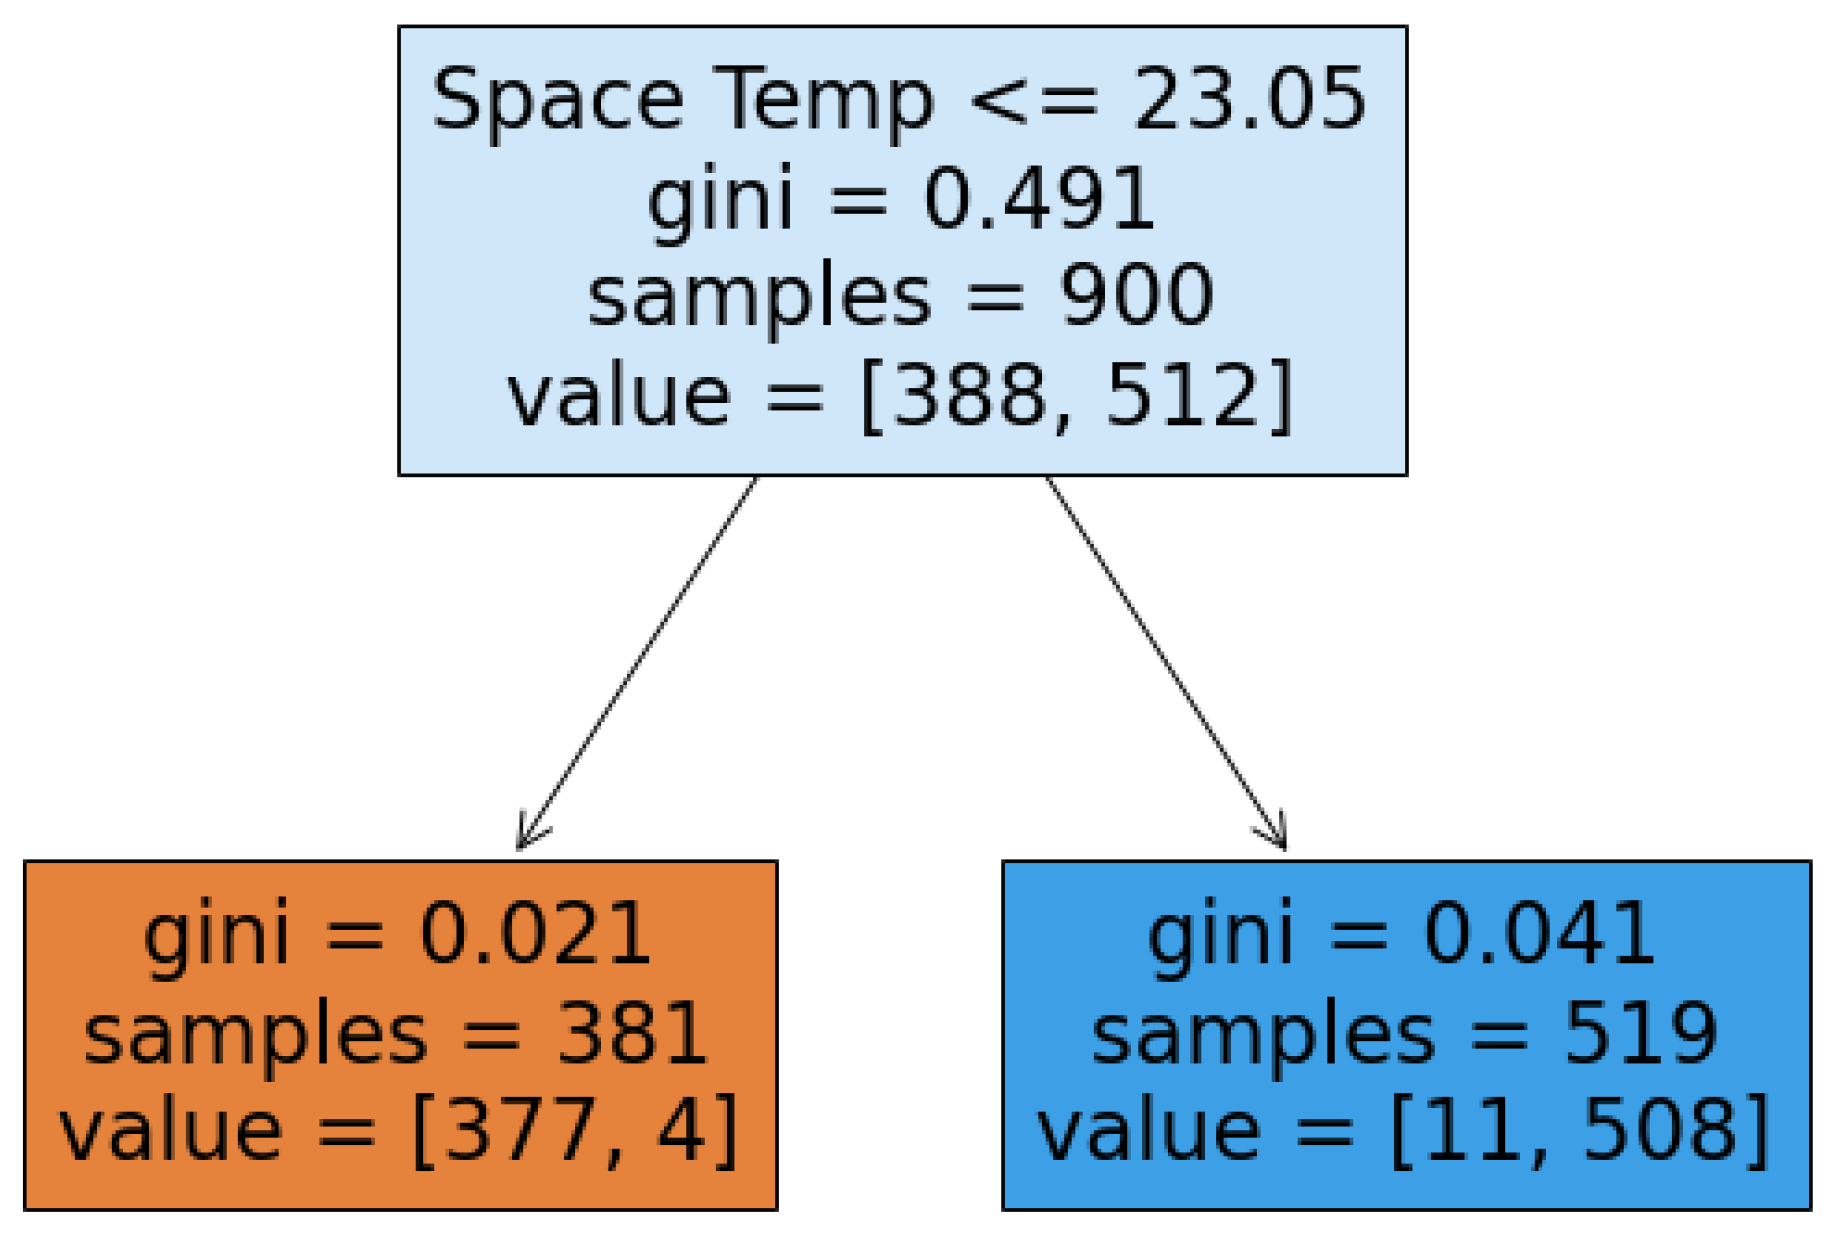
1.2. Decision Tree Algorithm
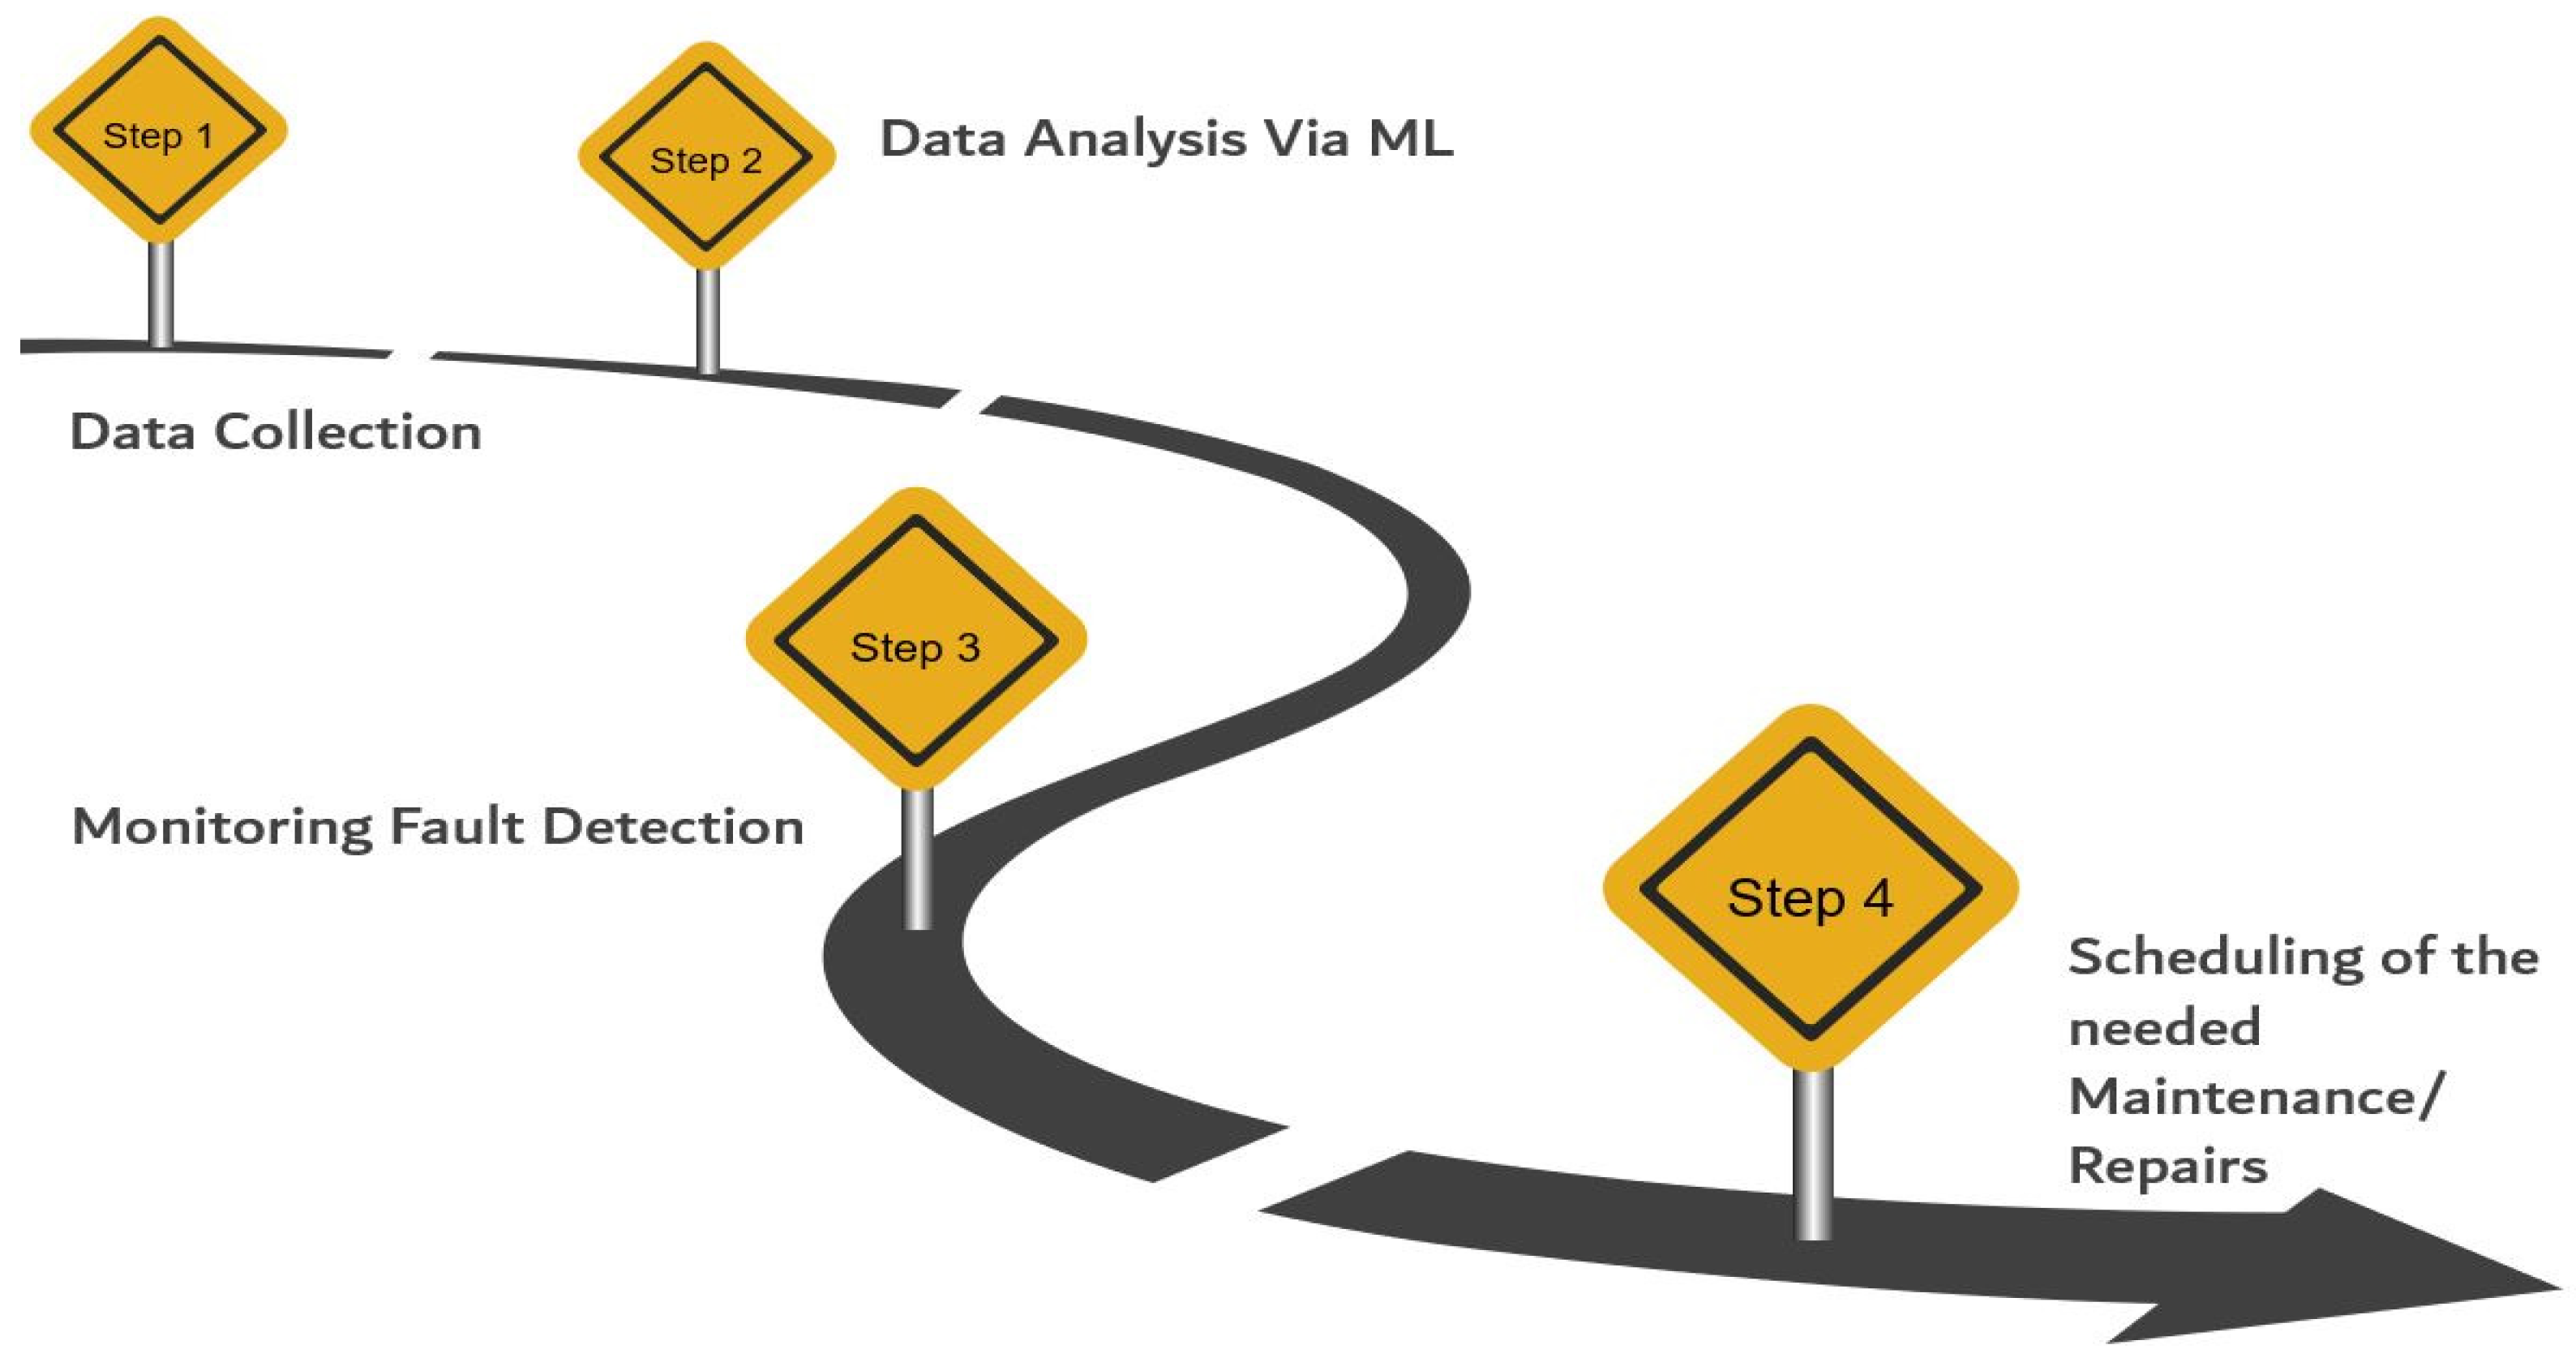
2. Methodological Framework
2.1. Setup Part
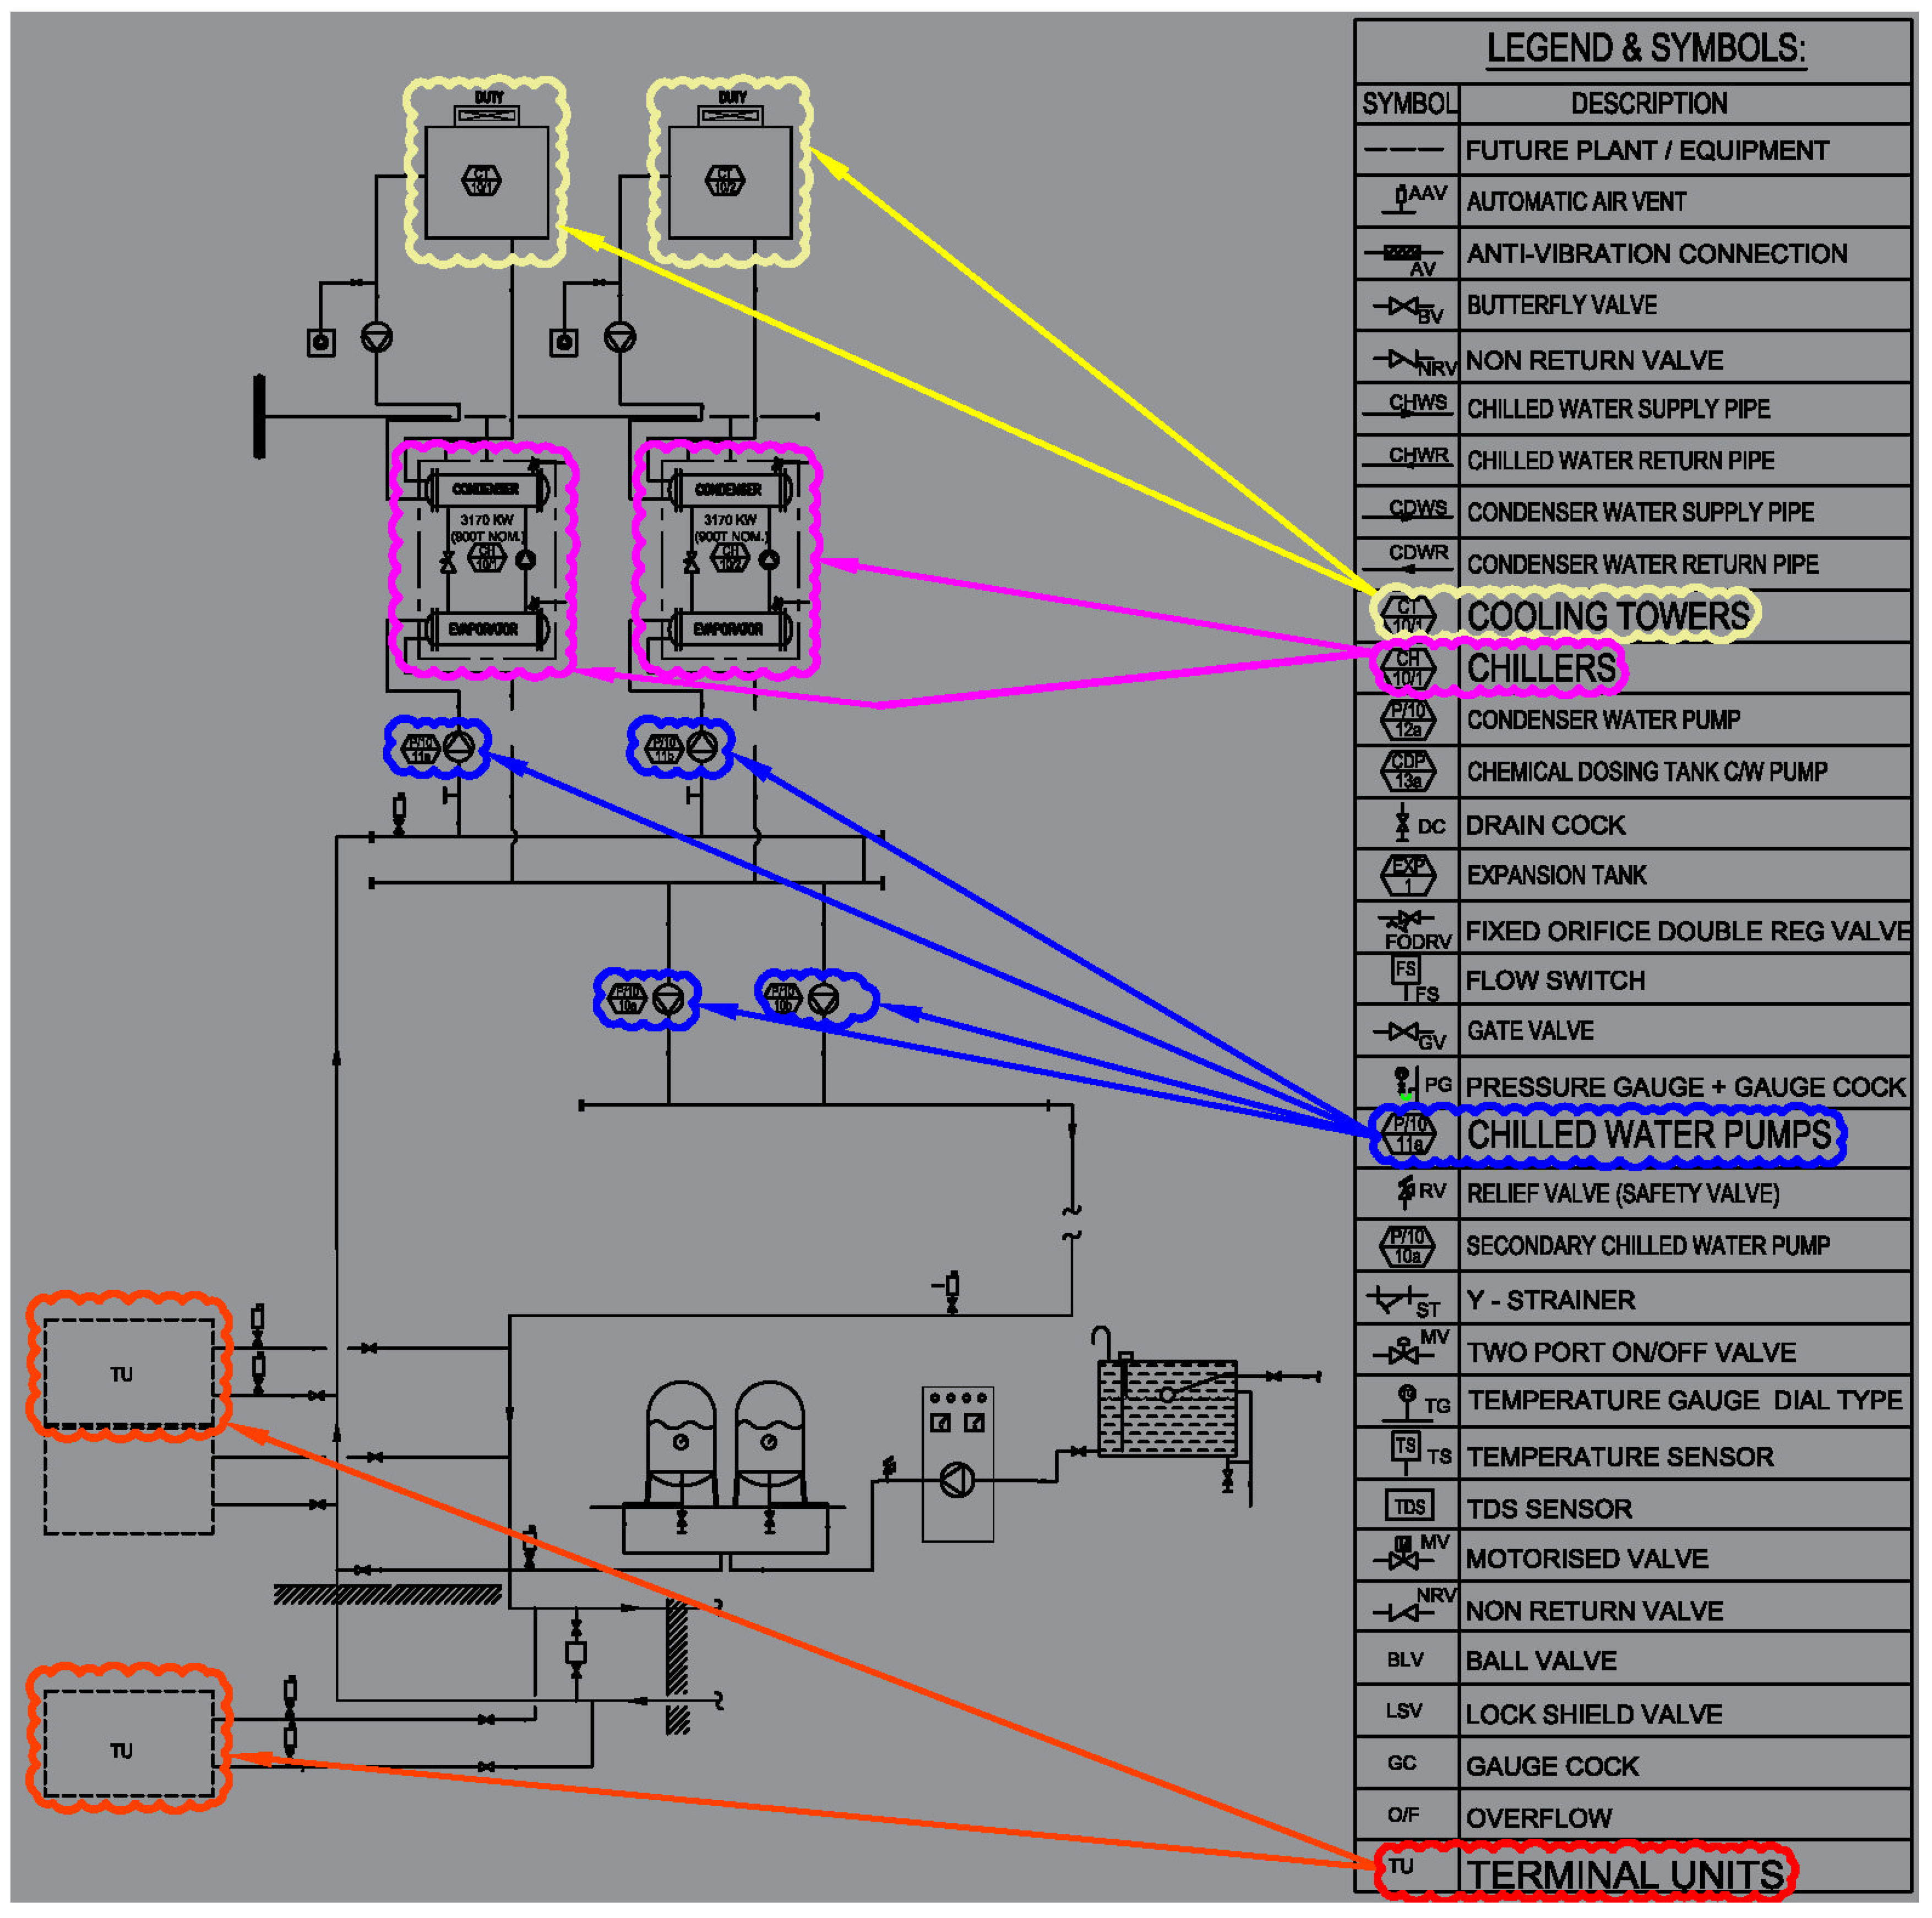
2.1.1. CWS Drawing
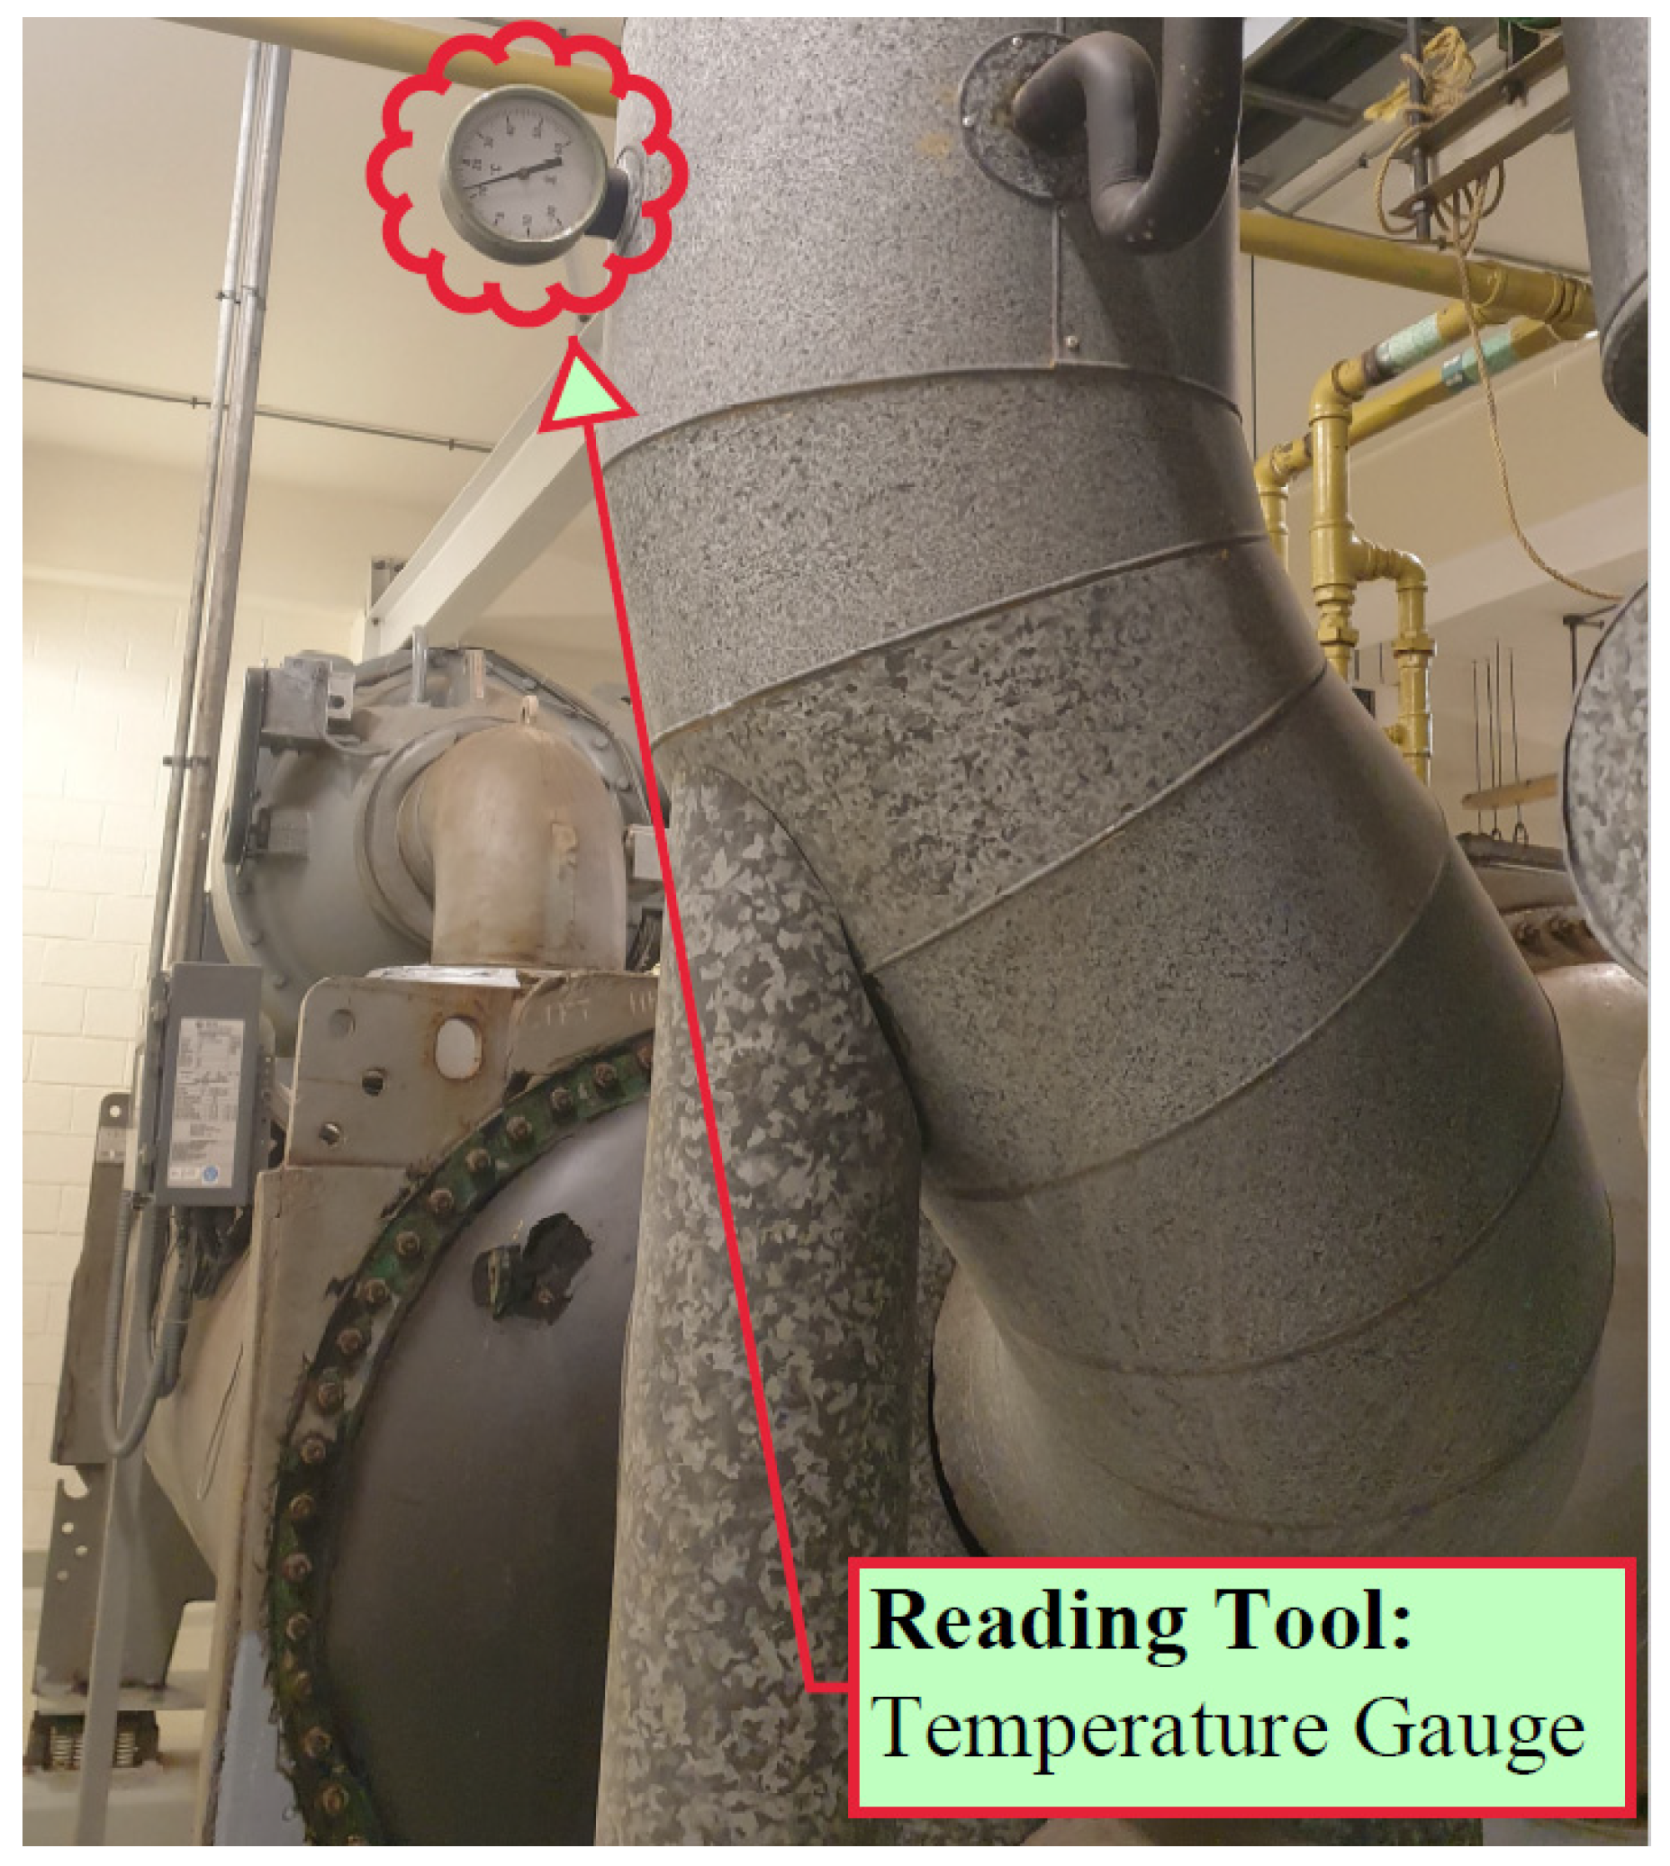
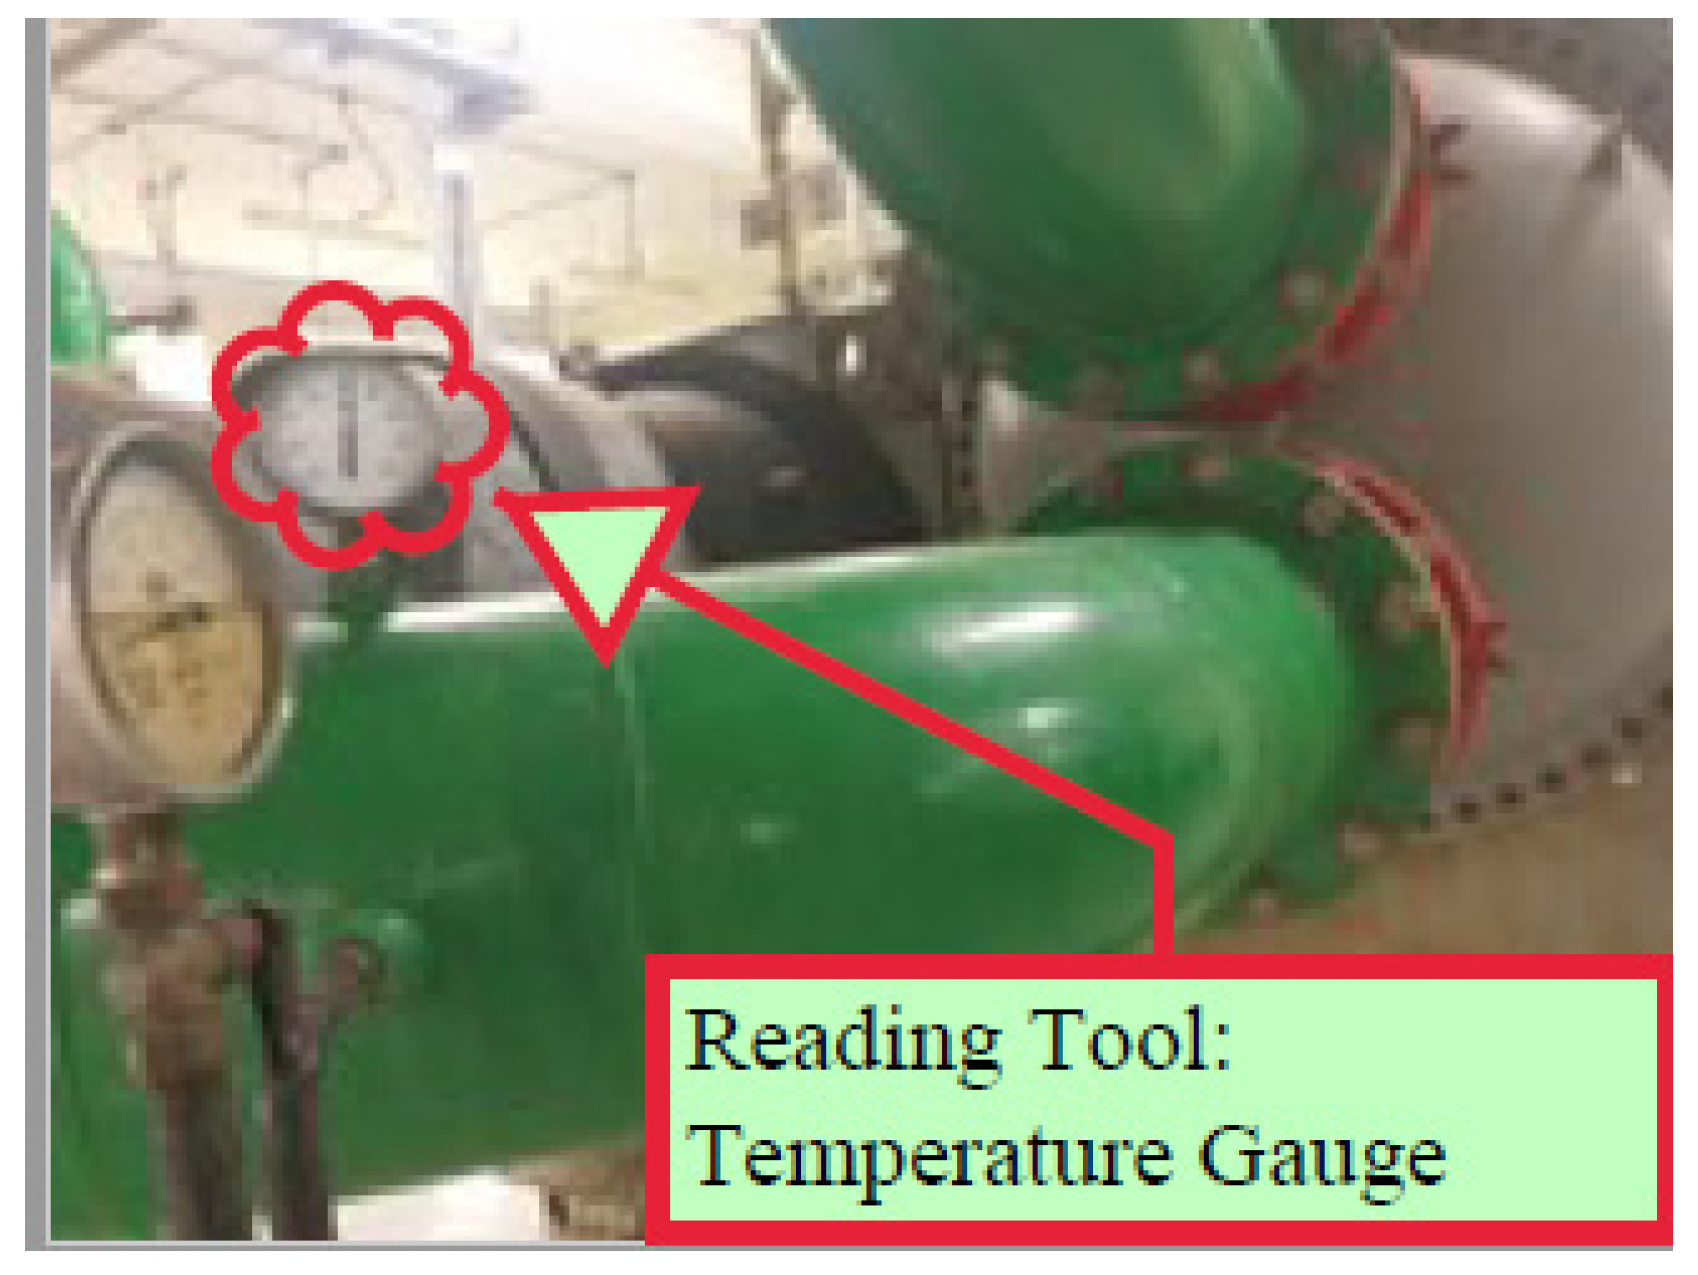
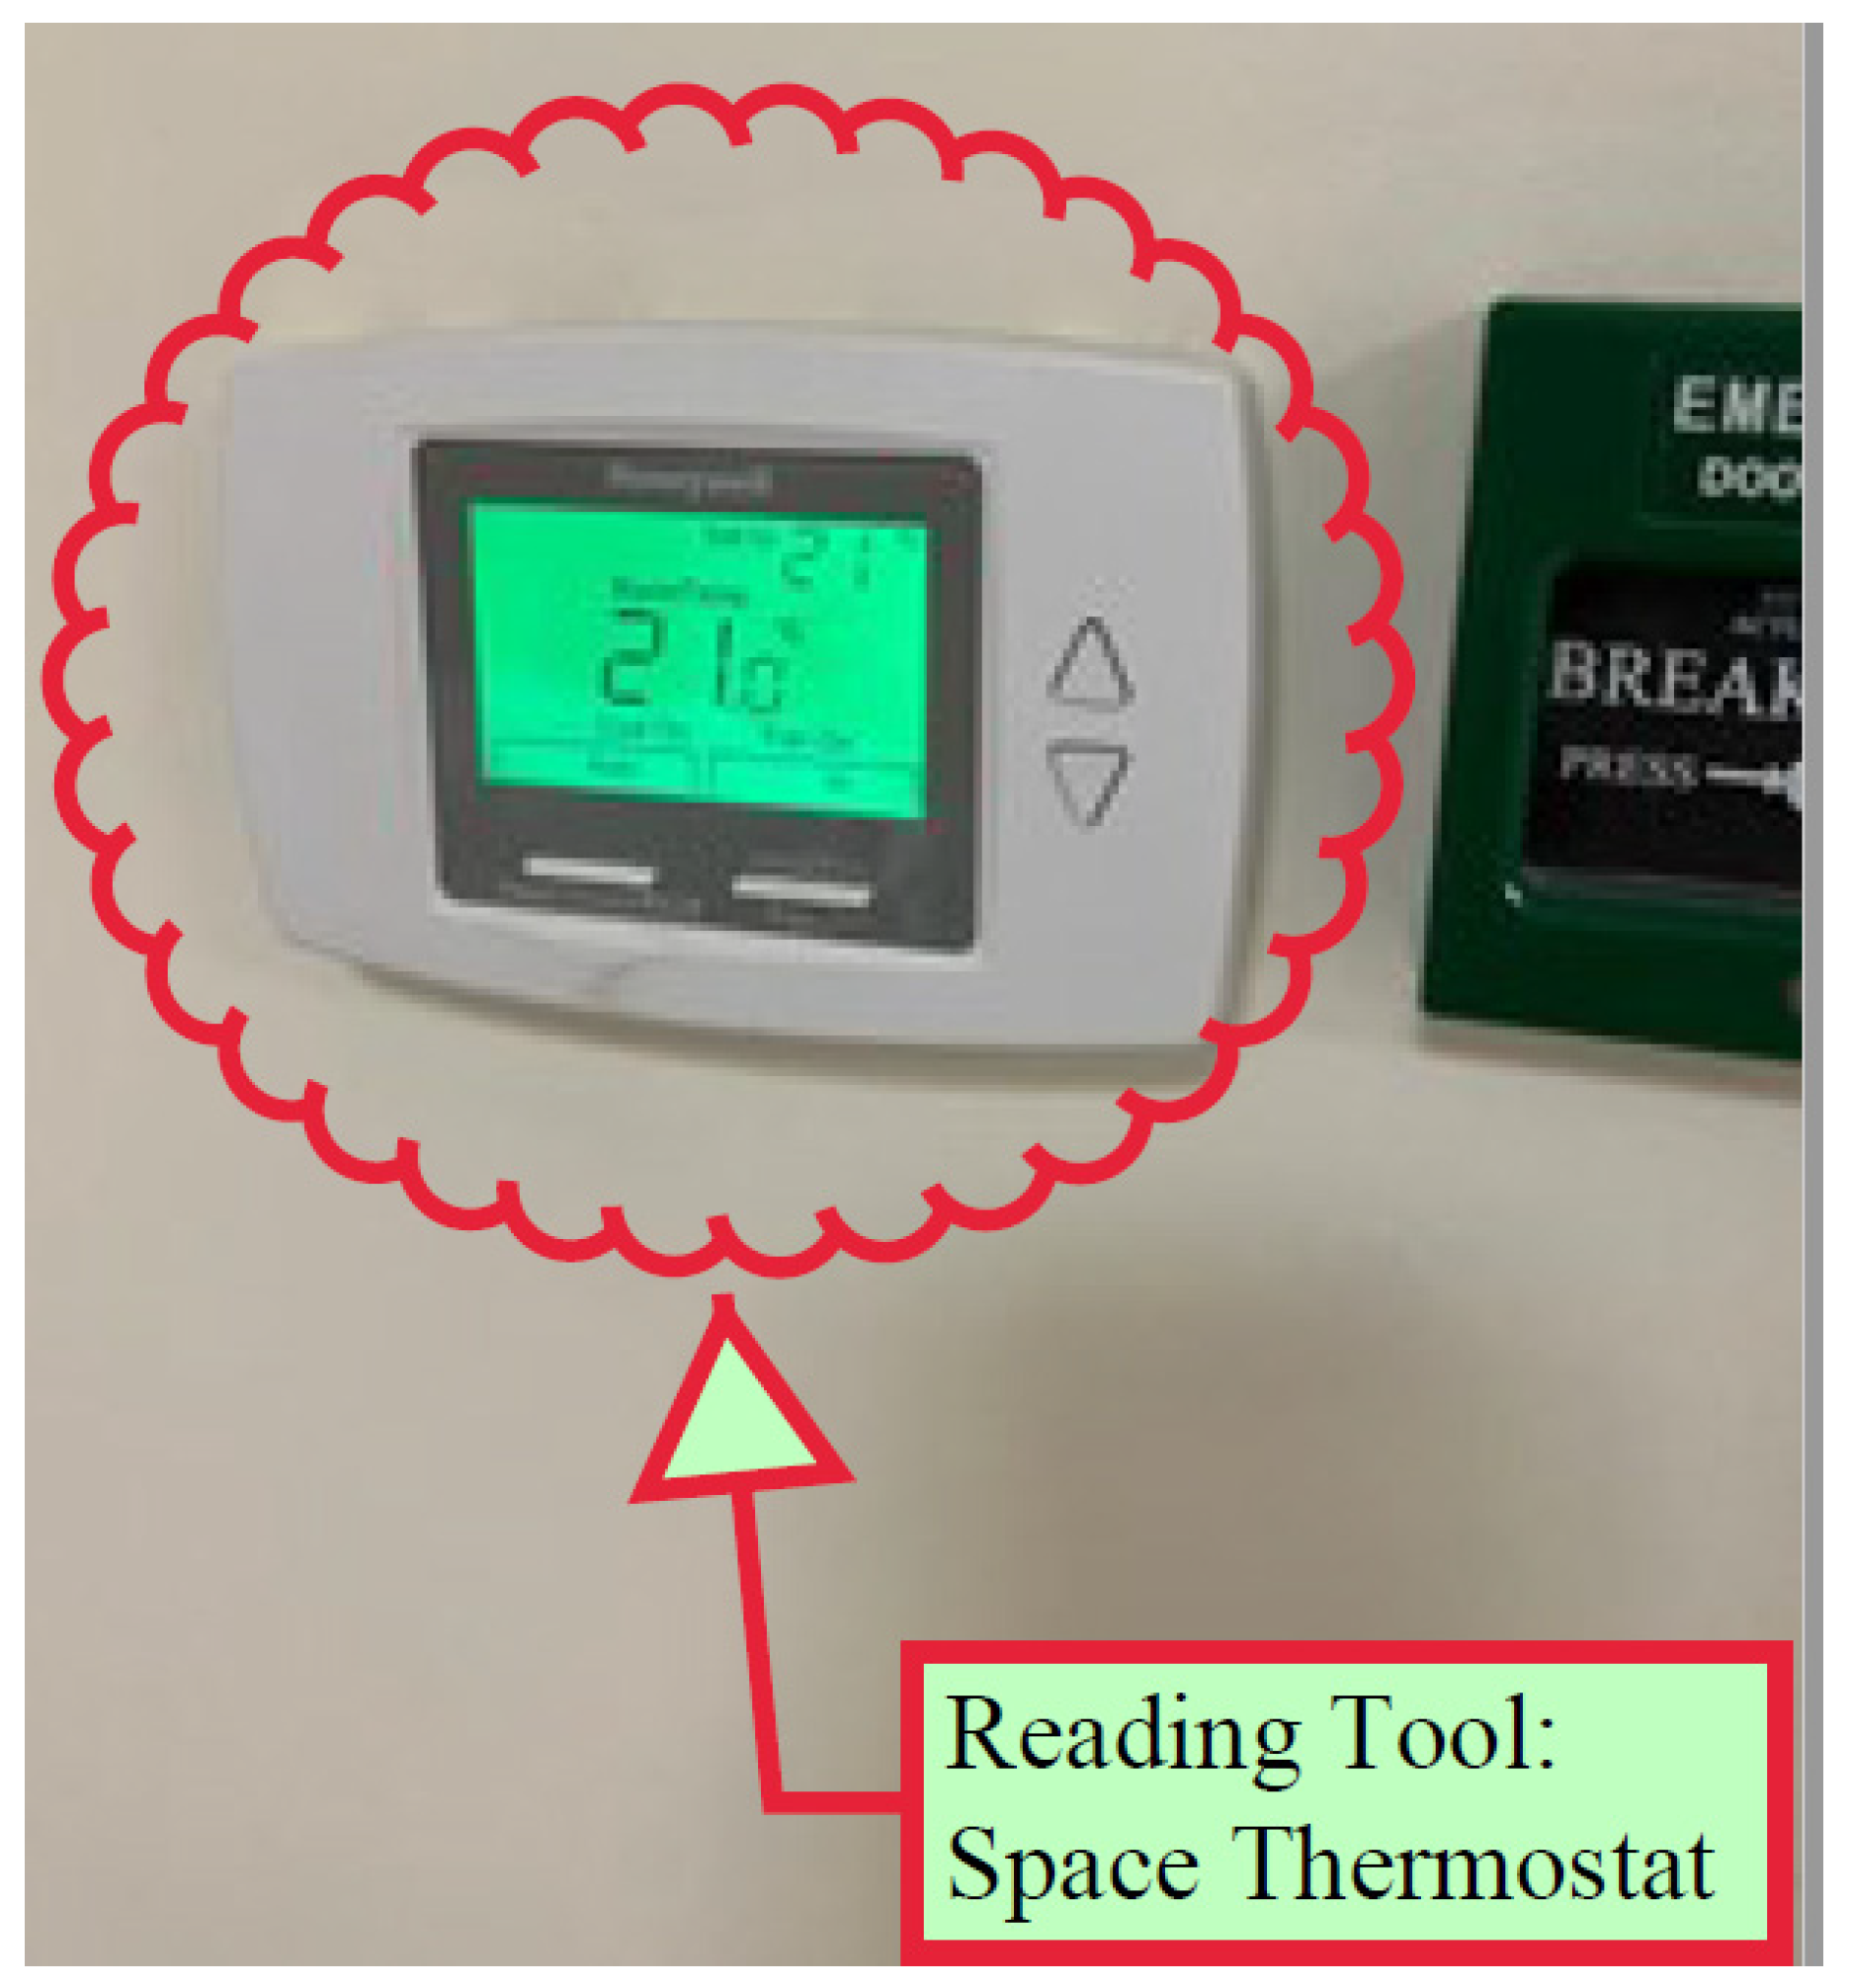
2.1.2. Reading Tools for Operational Parameters
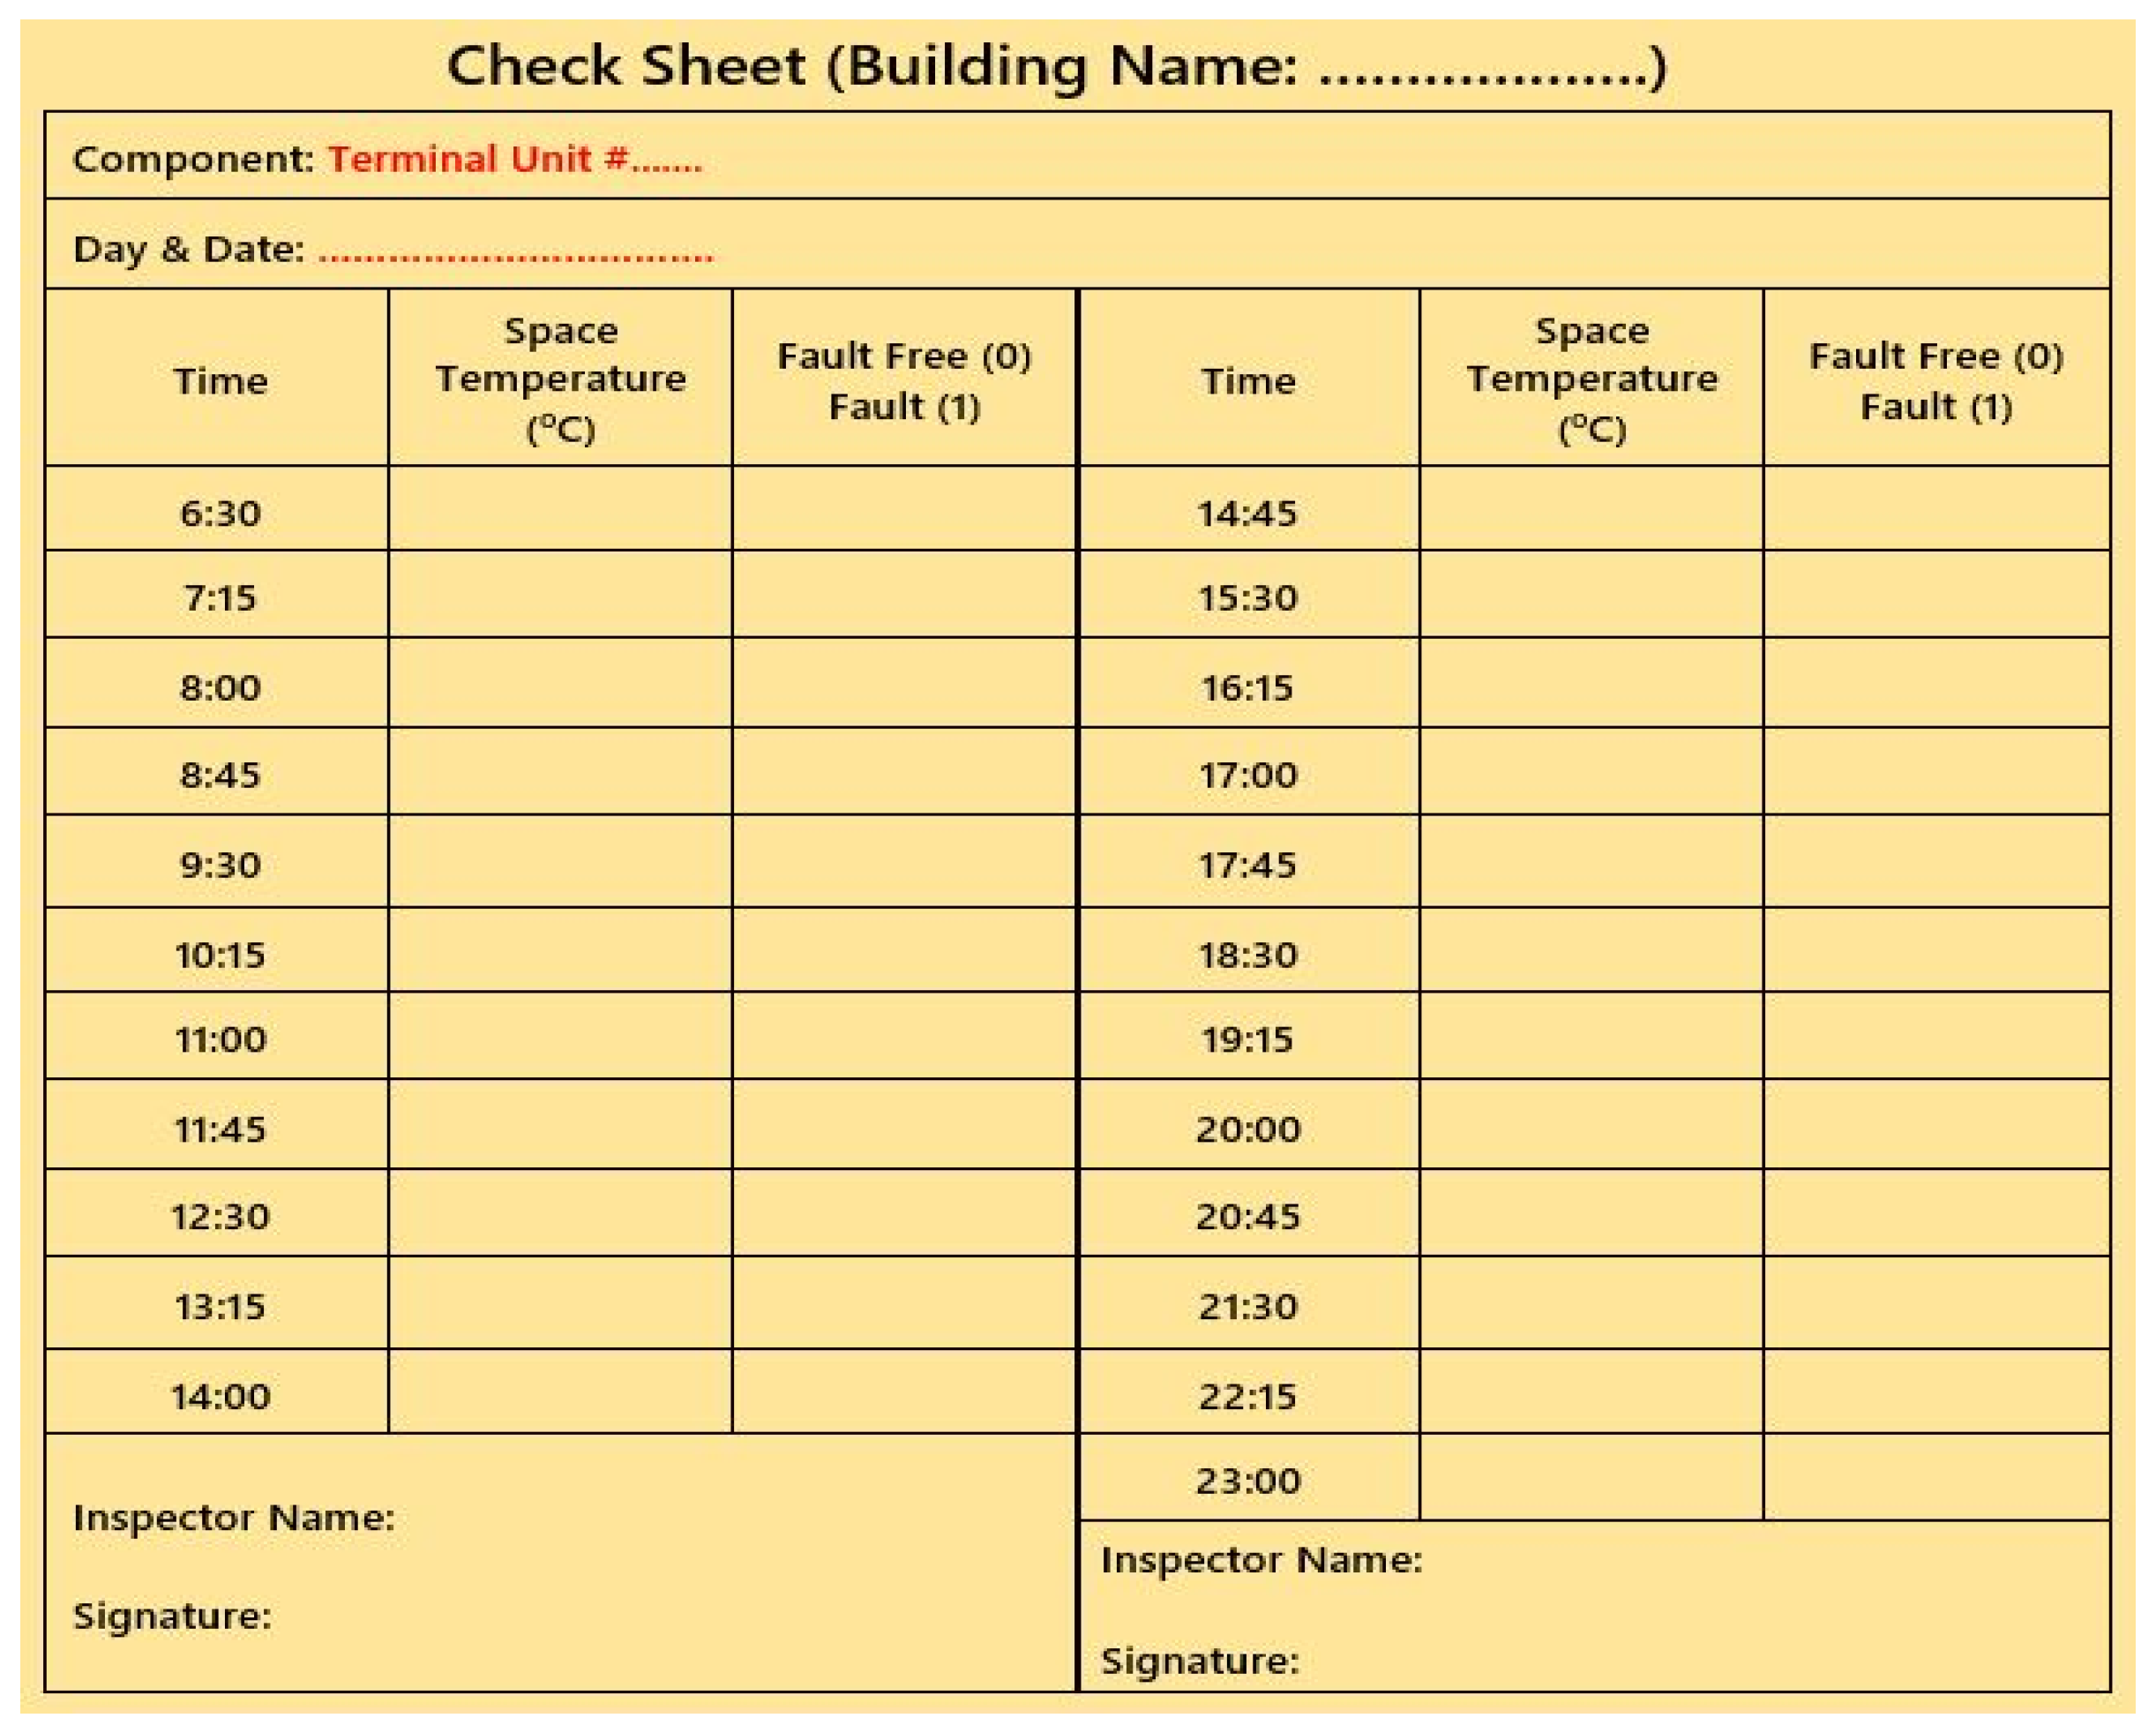
2.1.3. Data Collection
2.2. Machine Learning Part
2.3. Quality Control Part
- Listing the lessons learned from the proposed PdM program, such as focusing on the faults that occurred, and then brainstorming permanent solutions to avoid the reoccurrence of such faults;
- Tracking the spare part stock;
- Ensuring that the CU is working efficiently;
- Training more technicians to be familiar with the prediction model;
- Making regular reports about the performance of the proposed PdM program for future improvements.
3. Implementation and Results
3.1. Implementaion of Setup Part
3.1.1. CWS Drawing
3.1.2. Reading Tools
3.1.3. Data Collection
3.2. Implementation of the Machine Learning Part
3.3. Implementation of the Quality Control Part
4. Discussion
- The C4.5 and CART algorithms had a similar prediction accuracy for each CWS component.
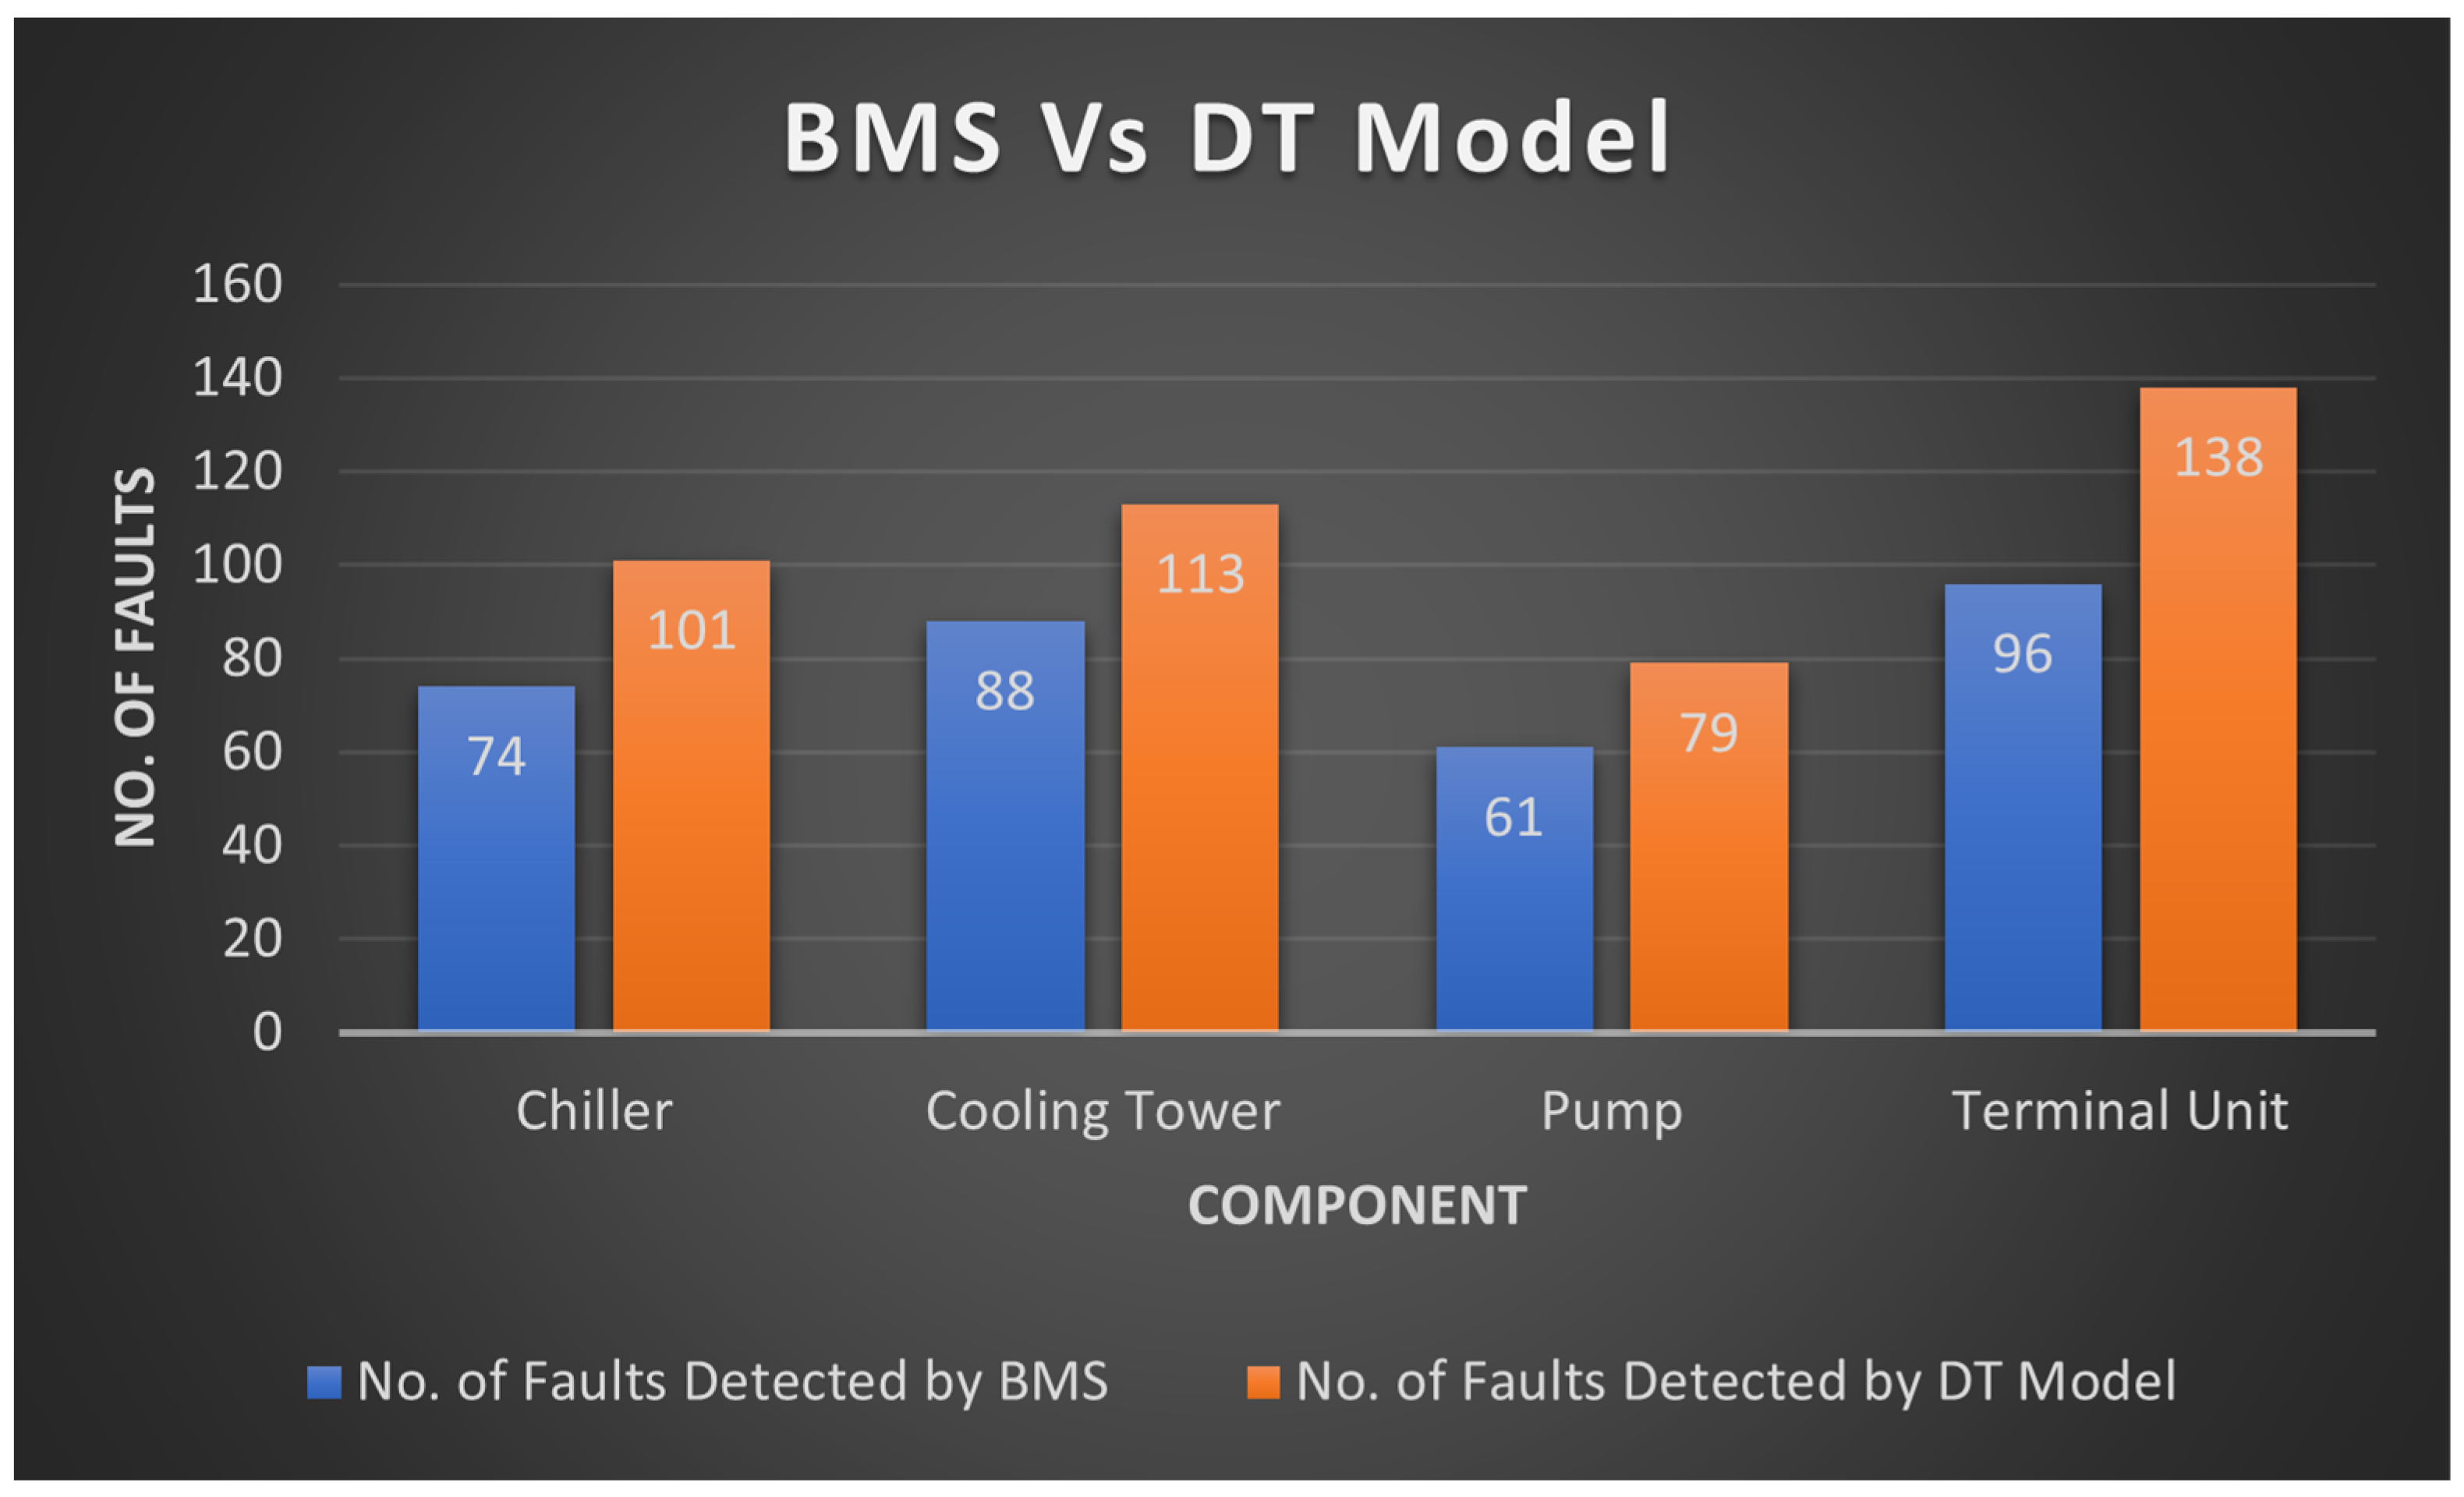
- The DT model had a better performance than the BMS in predicting the faults for all CWS components, as shown in Figure 14. This fulfilled the requirements of the facility department, who manage the CWS at the university.
- A malfunctioning blowdown system was the most common fault in the cooling towers. This finding matches what was found in the IS study [20]. The IS study stated that the majority of the survey’s participants suffered from this fault;
- With regard to the pumps, a noisy non-return valve occurred most often. This also matches the information provided by the IS study [20], where the majority of the survey’s participants faced this fault continuously;
- Low static pressure in the terminal units occurred more than twice a day. The IS study [20] had already confirmed that the most of the survey’s participants were finding this fault on a regular basis while operating the associated terminal unit;
- The solutions provided in the IS study [20] gave practical actions to rectifying the predicted faults. In this regard, one of the research gaps listed by the SLR study was that the previous 168 studies considered did not cover the whole CWS (i.e., all for components) and ended their PdM programs once detecting the faults [19]. However, the SLR study recommended having control measures, including fault solution, after completing the prediction model, which will allow a comprehensive PdM program, such as the proposed framework.
- The availability of the data source;
- The experience of the team who collect the data;
- The organizational culture at the building, which may not be cooperative;
- The associated costs, such as arranging the reading tools, the CU, and the labor.
5. Conclusions
- To discuss how to integrate the ML models with the building automation and management systems such as BMS, for a more efficient prediction model;
- To propose an intelligent system for updating the datasets, which are required to build the prediction model, in order to rise the control efficiency of commercial buildings;
- To investigate and give more focus to the repeated occurrence of faults, especially the aforementioned four faults, which are refrigeration leaks in chillers, malfunctioning blowdown systems in cooling towers, noisy non-return valves in pumps, and low static pressure in terminal units;
- To use the ideas of this research, which built the framework, and extend them to other HVAC systems such as heating systems, as well as for other utility systems, such as the electrical system.
Author Contributions
Funding
Institutional Review Board Statement
Informed Consent Statement
Data Availability Statement
Acknowledgments
Conflicts of Interest
Appendix A
Appendix B

Appendix C

References
- Kullu, O.; Cinar, E. A Deep-Learning-Based Multi-Modal Sensor Fusion Approach for Detection of Equipment Faults. Machines 2022, 10, 1105. [Google Scholar] [CrossRef]
- Sahal, R.; Breslin, J.G.; Ali, M.I. Big data and stream processing platforms for Industry 4.0 requirements mapping for a predictive maintenance use case. J. Manuf. Syst. 2020, 54, 138–151. [Google Scholar] [CrossRef]
- Bousdekis, A.; Apostolou, D.; Mentzas, G. Predictive maintenance in the 4th industrial revolution: Benefits, business opportunities, and managerial implications. IEEE Eng. Manag. Rev. 2019, 48, 57–62. [Google Scholar] [CrossRef]
- Cotrufo, N.; Saloux, E.; Hardy, J.M.; Candanedo, J.A.; Platon, R. A practical artificial intelligence-based approach for predictive control in commercial and institutional buildings. Energy Build. 2020, 206, 109563. [Google Scholar] [CrossRef]
- Simon, L.; Rauffet, P.; Guérin, C.; Seguin, C. Trust in an autonomous agent for predictive maintenance: How agent transparency could impact compliance. In Proceedings of the 13th AHFE Conference (Applied Human Factors and Ergonomics), New York, NY, USA, 24–28 July 2022; HAL Open Science: Lyon, France, 2022; pp. 61–67. [Google Scholar]
- Villa, V.; Bruno, G.; Aliev, K.; Piantanida, P.; Corneli, A.; Antonelli, D. Machine Learning Framework for the Sustainable Maintenance of Building Facilities. Sustainability 2022, 14, 681. [Google Scholar] [CrossRef]
- Achouch, M.; Dimitrova, M.; Ziane, K.; Sattarpanah Karganroudi, S.; Dhouib, R.; Ibrahim, H.; Adda, M. On Predictive Maintenance in Industry 4.0: Overview, Models, and Challenges. Appl. Sci. 2022, 12, 8081. [Google Scholar] [CrossRef]
- Almobarek, M.; Mendibil, K.; Alrashdan, A. Faults handling in chilled water system maintenance program. In Proceedings of the 12th International Conference on Industrial Engineering and Operations Management, Istanbul, Turkey, 7–10 March 2022; IEOM Society International: Southfield, MI, USA, 2022; pp. 1616–1625. [Google Scholar]
- Almobarek, M.; Mendibil, K.; Alrshdan, A. Study of Factors Influencing Room Ambient Temperature Using Design of Experiments. In Proceedings of the 11th International Conference on Industrial Engineering and Operations Management, Singapore, Singapore, 7–11 March 2021; IEOM Society International: Southfield, MI, USA, 2021; pp. 1509–1516. [Google Scholar]
- Li, D.; Zhou, Y.; Hu, G.; Spanos, C.J. Fusing system configuration information for building cooling plant Fault Detection and severity level identification. In Proceedings of the 2016 IEEE International Conference on Automation Science and Engineering (CASE), Fort Worth, TX, USA, 21–25 August 2016; IEEE: Piscataway, NJ, USA, 2016; pp. 1319–1325. [Google Scholar]
- Yan, R.; Ma, Z.; Kokogiannakis, G.; Zhao, Y. A sensor fault detection strategy for air handling units using cluster analysis. Autom. Constr. 2016, 70, 77–88. [Google Scholar] [CrossRef]
- Tehrani, M.M.; Beauregard, Y.; Rioux, M.; Kenne, J.P.; Ouellet, R. A Predictive Preference Model for Maintenance of a Heating Ventilating and Air Conditioning System. IFAC-Pap 2015, 48, 130–135. [Google Scholar] [CrossRef]
- Rueda, E.; Tassou, S.A.; Grace, I.N. Fault detection and diagnosis in liquid chillers. Proc. Inst. Mech. Eng. Part E J. Process. Mech. Eng. 2005, 219, 117–125. [Google Scholar] [CrossRef]
- Zhou, Q.; Wang, S.; Xiao, F. A novel strategy for the fault detection and diagnosis of centrifugal chiller systems. HVACR Res. 2009, 15, 57–75. [Google Scholar] [CrossRef]
- Dudzik, M.; Romanska-Zapala, A.; Bomberg, M. A neural network for monitoring and characterization of buildings with Environmental Quality Management, Part 1: Verification under steady state conditions. Energies 2020, 13, 3469. [Google Scholar] [CrossRef]
- Montazeri, A.; Kargar, S.M. Fault detection and diagnosis in air handling using data-driven methods. J. Build. Eng. 2020, 31, 101388. [Google Scholar] [CrossRef]
- Liang, J.; Du, R. Model-based fault detection and diagnosis of HVAC systems using support vector machine method. Int. J. Refrig. 2007, 30, 1104–1114. [Google Scholar] [CrossRef]
- Hu, R.; Granderson, J.; Auslander, D.; Agogino, A. Design of machine learning models with domain experts for automated sensor selection for energy fault detection. Appl. Energy 2018, 235, 117–128. [Google Scholar] [CrossRef]
- Almobarek, M.; Mendibil, K.; Alrashdan, A. Predictive Maintenance 4.0 for Chilled Water System at Commercial Buildings: A Systematic Literature Review. Buildings 2022, 12, 1229. [Google Scholar] [CrossRef]
- Almobarek, M.; Mendibil, K.; Alrashdan, A.; Mejjaouli, S. Fault Types and Frequencies in Predictive Maintenance 4.0 for Chilled Water System at Commercial Buildings: An Industry Survey. Buildings 2022, 12, 1995. [Google Scholar] [CrossRef]
- Jebreen, I. Using inductive approach as research strategy in requirements engineering. Int. J. Comput. Inf. Technol. 2012, 1, 162–173. [Google Scholar]
- Malachowski, A. The New Pragmatism, 1st ed.; Routledge: London, UK, 2014. [Google Scholar]
- Bacon, M. Pragmatism: An Introduction; Polity Press: Cambridge, UK, 2012. [Google Scholar]
- Sakib, N.; Wuest, T. Challenges and opportunities of condition-based predictive maintenance: A review. Procedia CIRP 2018, 78, 267–272. [Google Scholar] [CrossRef]
- Sharma, H.; Kumar, S. A survey on decision tree algorithms of classification in data mining. Int. J. Sci. Res. 2016, 5, 2094–2097. [Google Scholar]
- Fletcher, S.; Islam, M.Z. Decision tree classification with differential privacy: A survey. ACM Comput. Surv. (CSUR) 2019, 52, 1–33. [Google Scholar] [CrossRef]
- Wildenauer, A.; Mbabu, A.; Underwood, J.; Basl, J. Building-as-a-Service: Theoretical Foundations and Conceptual Framework. Buildings 2022, 12, 1594. [Google Scholar] [CrossRef]
- Ellis, G. What Are as Built Drawings? Digital Builder Blog, Autodesk Construction Cloud. 2021. Available online: https://constructionblog.autodesk.com/as-built-drawings/ (accessed on 2 December 2022).
- ASHRAE Handbook. Available online: www.ashrae.org (accessed on 5 December 2022).
- Lam, H.F.; Yang, J.H.; Hu, Q. How to install sensors for structural model updating? Procedia Eng. 2011, 14, 450–459. [Google Scholar] [CrossRef]
- Beckmann, C.; Consolvo, S.; LaMarca, A. Some Assembly Required: Supporting End-User Sensor Installation in Domestic Ubiquitous Computing Environments. In Ubiquitous Computing; Davies, N., Mynatt, E.D., Siio, I., Eds.; Springer: Berlin/Heidelberg, Germany, 2004. [Google Scholar]
- Kayastha, N.; Niyato, D.; Hossain, E.; Han, Z. Smart grid sensor data collection, communication, and networking: A tutorial. Wirel. Commun. Mob. Comput. 2014, 14, 1055–1087. [Google Scholar] [CrossRef]
- Javed Mehedi Shamrat, F.M.; Ranjan, R.; Hasib, K.M.; Yadav, A.; Siddique, A.H. Performance Evaluation Among ID3, C4.5, and CART Decision Tree Algorithm. In Pervasive Computing and Social Networking; Ranganathan, G., Bestak, R., Palanisamy, R., Rocha, Á., Eds.; Springer: Singapore, 2022. [Google Scholar]
- Grąbczewski, K. Meta-Learning in Decision Tree Induction; Springer: New York, NY, USA, 2014. [Google Scholar]
- Guttag, J. Introduction to Computation and Programming Using Python: With Applications to Understanding Data, 2nd ed.; The MIT Press: Cambridge, MA, USA, 2017. [Google Scholar]
- Almobarek, M.; Alrashdan, A. Water budget control using DMAIC in commercial buildings. Int. J. Six Sigma Compet. Advant. 2022, 14, 86–208. [Google Scholar] [CrossRef]


| Research Question | Research Gap |
|---|---|
| (1) How can faults be identified, in order to predict them? | (1) The literature did not consider the same faults and only concentrated on selected faults, as some faults were either not stated/mentioned or were not fully described. |
| 2) What are the methods that can be used to predict the faults? | (2) The current literature does not specify how data were collected or justify the period or the frequency of the collected data, as well as being limited to testing the model and not controlling it. |
| (3) The suggested programs/frameworks/models did not contain, or contained inconclusive, solutions for the mentioned faults from a management point of view, as they ended at how to detect/predict the faults. Moreover, these programs did not comprehensively study/cover the whole system. |
| Part | Objective |
|---|---|
| Setup |
|
| Machine Learning |
|
| Quality Control |
|
| CWS Component | Location |
|---|---|
| Chiller | Chilled water supply header |
| Cooling Tower | Straight pipeline entering the condenser |
| Pump | Discharge pipeline |
| Terminal Unit | 1.5 m above the floor level in a space or in the return air duct |
| Quality Control Action | Description | Responsible |
|---|---|---|
| Monitoring | The prediction model should be connected to the reading tools, which were connected to the CU during the setup part. This is to ensure that the CU shows a continuous reading for each CWS component. | Information Technology (IT) Department or Programming Supplier |
| Response | When the prediction model shows a fault, which is a “1” as a result of a particular reading, the related component should be inspected and then to be rectified as per the solutions tabulated in the IS article [20]. | Facility Department Officer/technician |
| CWS Component | Quantity |
|---|---|
| Chiller | 5 |
| Cooling Tower | 7 |
| Pump | 19 |
| Terminal Unit | 72 |
| CWS Component | Time Interval for Reading and Inspection (Minutes) | Study Time (Weeks) | Study Period |
|---|---|---|---|
| Chiller | 30 | 12 | From 29 May 2022 to 20 August 2022 |
| Cooling Tower | 30 | 16 | From 29 May 2022 to 17 September 2022 |
| Pump | 60 | 24 | From 29 May 2022 to 12 November 2022 |
| Terminal Unit | 45 | 8 | From 29 May 2022 to 23 July 2022 |
| CWS Component | Attribute | Data Size |
|---|---|---|
| Chiller | Water Leaving Temperature (°C) | 2688 |
| Cooling Tower | Water Leaving Temperature (°C) | 3584 |
| Pump | Pressure (Bar) | 2688 |
| Terminal Unit | Space Temperature (°C) | 1288 |
| CWS Component | Prediction Accuracy (%) |
|---|---|
| Chiller | 98.50 |
| Cooling Tower | 99.60 |
| Pump | 99.80 |
| Terminal Unit | 99.20 |
| CWS Component | Number of Faults | Most Occurred Fault |
|---|---|---|
| Chiller | 101 | Refrigeration Leak |
| Cooling Tower | 113 | Malfunctioning Blowdown System |
| Pump | 79 | Noisy Non-Return Valve |
| Terminal Unit | 138 | Low Static Pressure |
Disclaimer/Publisher’s Note: The statements, opinions and data contained in all publications are solely those of the individual author(s) and contributor(s) and not of MDPI and/or the editor(s). MDPI and/or the editor(s) disclaim responsibility for any injury to people or property resulting from any ideas, methods, instructions or products referred to in the content. |
© 2023 by the authors. Licensee MDPI, Basel, Switzerland. This article is an open access article distributed under the terms and conditions of the Creative Commons Attribution (CC BY) license (https://creativecommons.org/licenses/by/4.0/).
Share and Cite
Almobarek, M.; Mendibil, K.; Alrashdan, A. Predictive Maintenance 4.0 for Chilled Water System at Commercial Buildings: A Methodological Framework. Buildings 2023, 13, 497. https://doi.org/10.3390/buildings13020497
Almobarek M, Mendibil K, Alrashdan A. Predictive Maintenance 4.0 for Chilled Water System at Commercial Buildings: A Methodological Framework. Buildings. 2023; 13(2):497. https://doi.org/10.3390/buildings13020497
Chicago/Turabian StyleAlmobarek, Malek, Kepa Mendibil, and Abdalla Alrashdan. 2023. "Predictive Maintenance 4.0 for Chilled Water System at Commercial Buildings: A Methodological Framework" Buildings 13, no. 2: 497. https://doi.org/10.3390/buildings13020497
APA StyleAlmobarek, M., Mendibil, K., & Alrashdan, A. (2023). Predictive Maintenance 4.0 for Chilled Water System at Commercial Buildings: A Methodological Framework. Buildings, 13(2), 497. https://doi.org/10.3390/buildings13020497