Abstract
The stress state of the cable group in a cable-stayed bridge directly affects the overall performance. A novel method for assessing grouped cable forces using deflection data is proposed in this article. Firstly, a simplified equation between the variation in cable forces and the girder deflection was built according to the geometric relationship of the deformation. Secondly, the threshold value of cable force change rate for a single cable can be determined by the proposed theoretical equation and the deflection limit in the specification. On this basis, the evaluation standard of single cable force of piecewise linear mode was established. Thirdly, considering the uniform and non-uniform changes in the cable forces, the condition assessment method of grouped cable forces was established based on the variable weight synthesis method and the gray correlation degree theory. Finally, a case study of a real bridge was undertaken. The results show that the case data validate the correctness of the proposed theoretical equation. The threshold of change rate for long cable is 30%. Six-year assessment scores of grouped cables are generally decreasing, which also reflects the development of other component defects from the side.
1. Introduction
Long-span cable-stayed bridges are widely used in the engineering field due to their advantages of large span capability, beautiful structural form, and good economy [1]. They are typically situated in key areas of the transportation system, such as large rivers or canyons [2,3], and play critical roles in urban construction [4]. The stay cable is one of the main load-bearing components of the cable-stayed bridge, and the cable group represents the force distribution of the whole structure. With the increase in bridge service life, pylon-top displacement and main girder alignment may lead to a redistribution of cable forces [5,6]. In addition, under the reciprocating action of the external environment and vehicle load, the fatigue strength of stay cables is reduced [7]. Therefore, the cable force within a reasonable range has a significant impact on the overall stress state of the bridge. In view of the operational safety of cable-stayed bridges, it is critical to assess cable force.
With the development of health-monitoring technology, it has become an important way to evaluate the safety of stay cables by monitoring and studying the load effect and mechanical property evolution of stay cables [8,9]. In addition to installing sensors on bridges to monitor cable force, sensors can also be installed on test vehicles to indirectly monitor cable force damage (the vehicle scanning method) [10]. At present, the assessment method of cable force in China’s standard for technical condition evaluation of highway bridges (JTG/T H21-2011) [11] (hereinafter referred to as STCE2011) adopts the control index of change rate of a single cable force. A deviation of more than 10% from the initial data detected may indicate an anomaly for a stay cable. In AASHTO standard of America, a 75% limit value of normal condition is set as the cable force warning [12]. The safety level 1 criterion value is set at 6% above the base cable force in the current Korean management criteria, while the safety level 2 criterion value is set at 12% above the base value [13]. These estimation methods have several limitations. On one hand, quantitative evaluation is impossible due to the lack of a rational threshold system; on the other hand, the safety of bridge structures is related to grouped cables, and the above evaluation methods have not determined a reasonable evaluation standard for grouped cables.
There are many other improved methods to determine the cable force threshold. The Pauta criterion (also known as the 3s criterion) is a well-known statistical method to calculate abnormal boundaries of a warning index. It is often applied to determine the upper and lower criteria for cable force damage detection [14,15]. Ren et al. [16] used a linear moderation model to score individual points of cable force, specifying a score of 0 when the change rate in cable force exceeds 40% or more. Cho et al. [13] used the probability distribution model for the cable force and reliability analysis to determine the new management standard for cable forces. Huang et al. [17] proposed a new method to measure the real-time deflection of a cable-stayed bridge based on the established relationship between cable force variation and bridge deflection. This theoretical relationship provides a better idea for the determination of the cable force threshold.
In terms of assessment methods of grouped cables, many researchers have attempted to consider the relevance of grouped cables. At present, the most used method for assessing grouped cable forces is the gray correlation degree method [18]. It can evaluate the correlation between cables, and the damage state of cables can be predicted. In addition, the cloud model and Dempster–Shafer evidence theory are also applied to the assessment of stay cables [19,20]. The cloud model may describe both randomness and fuzziness of index, while the evidence theory might combine numerous indices with relative weights to reduce uncertainty. Dan et al. [21] proposed a reasonable assessment method that considers the dissimilarity measure of grouped cable forces. The Monte Carlo method can be used to establish the threshold system of dissimilarity measure of grouped cable forces.
Summarizing the previous research work, we find that in the current cable force threshold system, the determination of the threshold value of a single cable lacks a theoretical basis and there is no detailed grade classification. In addition, the cable force monitoring data often contain load information such as vehicle and temperature. How to obtain the cable force due to dead load and consider the difference between different cables are challenges for the assessment of cable groups.
In this paper, the theoretical relationship between deflection of main girder and cable force is firstly built and verified with monitoring data. Then, the deflection limit of the girder in the specification is used to determine the threshold value and evaluation standard of single cable force. The assessment problem of grouped cable forces is solved by variable weight synthesis method and gray correlation degree theory. The cable force data come from the monitoring value during bridge closure to eliminate the effects of vehicles and temperature. Finally, the proposed cable force assessment method is applied in a case study.
2. Methodology for Cable Force Assessment
2.1. Relationship between Cable Force and Girder Deflection
First, we study the relationship between cable force and deflection in order to determine the cable force threshold. In a cable-stayed bridge, the ends of the cable are anchored to the main girder and the pylon. The load path is such that the self-weight of the structure and the vehicle loads are transferred to the pylon by cables and then to the foundation through the pylon [22]. Figure 1 depicts the structural deformation brought on by the cable force as it varies. It is clear that the stiffness of pylon and stay cables will cause the main girder deflection [23].

Figure 1.
Schematic diagram of structural deformation caused by cable force change.
The main girder of a cable-stayed bridge can be thought of as a continuous beam with elastic supports, per the theory of an elastic foundation beam [17]. The deflection of the main girder is mainly caused by the elongation of the stay cables and the bending of the pylon.
- (1)
- Assuming that the pylon’s bending stiffness is infinite, the cable’s elongation is the only factor contributing to the girder’s deflection, as shown in Figure 2a. The lateral stiffness of the girder is much stronger than the vertical stiffness, so its lateral displacement can be ignored.
- (2)
- Assuming that the axial stiffness of the cable is infinite, the girder’s deflection is exclusively caused by the pylon’s bending, as shown in Figure 2b.

Figure 2.
Two hypothetical relationships between cable force and girder deflection: (a) girder deflection due to cable elongation; (b) girder deflection due to bending of the pylon.
Figure 2.
Two hypothetical relationships between cable force and girder deflection: (a) girder deflection due to cable elongation; (b) girder deflection due to bending of the pylon.

The theoretical relationship between the cable force and the girder deflection is derived from these two aspects.
In the first case, a relationship between the cable force and the deflection of the girder has been introduced in [17] and can be expressed by Equation (1).
where A is the cable cross-sectional area, ∆T is the cable force variation, Lc is the cable length, α is the horizontal angle between cable and deck, and Eeq is the equivalent elastic modulus of cables. Because of the sag effect of the long stay cable, the Ernst formula [24] is used to consider the nonlinear effect, and the specific correction formula is shown in Equation (2).
where Ec is the elastic modulus of the cable, w0 is the cable weight per unit length, l is the length of the cable horizontal projection, and T is the cable force.
In the second case, the relationship between cable force and girder deflection can be expressed by Equation (3) [17].
where ∆v is the longitudinal displacement of the anchor point between the pylon and the stay cable.
Therefore, the deformation of the main girder consists of the above two cases, namely the girder deflection caused by the extension of the cable alone and the girder deflection caused by the deformation of the main pylon alone. The specific expression is as follows:
It can be seen from Equation (4) [17] that in order to obtain the main girder deflection, the horizontal displacement of the pylon at the longest cable (∆v) must first be solved. Figure 3 depicts the equivalent mechanical model of the pylon’s deformation, and each pylon is anchored by n pairs of cables. For a pylon subjected to a series of concentrated loads, the superposition principle states that [17]:
where Ep is the pylon elastic modulus, Ip is the area moment of inertia of pylon, ∆Ti is the variation in cable force of the ith cable on the river side, ∆T’i is the variation in cable force of the ith cable on the bank, hi is the height of the ith cable from the deck, and n is the number of pairs of cables anchored at each pylon.
Figure 3.
Mechanical model of the deformation of the pylon.
According to Equations (2), (4), and (5), the expression of the relationship between the cable force variation (ΔT) and the deflection of the girder (Δu) can be expressed as:
2.2. Condition Assessment Method of Grouped Cable
2.2.1. Evaluation Standard of Single Cable
According to the Specifications for Design of Highway Cable-stayed Bridge (JTG/T 3365-01-2020) [25], the threshold value of vertical deflection of a steel girder is 0.0025 of the calculated span of a cable-stayed bridge. In this paper, the limit of girder deflection is used to determine the cable force threshold based on the previously derived relationship between cable force and girder deflection.
Assuming that there is only one variable in Equation (6), the cable force threshold (θ) can be obtained by substituting the deflection range of the girder. Then, referring to the component grading deduction standard of STCE 2011 [11], the five-level criteria for evaluating cable force variation rate are established in a piecewise linear manner, as shown in Figure 4.
Figure 4.
Criteria for evaluating cable force variation rate.
2.2.2. Assessment of Grouped Cable
The monitoring data of cable force comprise a serial index, and their changes include two cases, namely uniform change and non-uniform change, which are fluctuations around the initial value and translation change in the initial value. For uniform changes, if the monitoring data fluctuate greatly, the significant changes in a certain index cannot be clearly reflected in the constant weight evaluation results, and thus, some damages and diseases of the bridge will be ignored. The variable weight synthesis principle takes into account the balance of the evaluation, and can better reflect the local degradation of the structure by amplifying the weight of the strongly perturbed cable force. For non-uniform changes, the gray correlation analysis method is adopted, which can quantitatively analyze the development trend of the system and reflect the non-uniformity of cable force data. The specific calculation is shown in Equation (7) [26].
where V is the grouped cable assessment value (0 ≤ V ≤ 100). An assessment value of 100 indicates that the grouped cable is in intact condition, and 0 indicates poor condition. U is the score for uniform variation, m is the total number of cable force monitoring points, yi is the score value of the ith monitoring point (0 ≤ yi ≤ 100), and ωi is the weight of the ith monitoring point [27], as shown in Equation (8) [26]. r is a non-uniform variation coefficient. To ensure order preservation, the slope correlation degree is used for the non-uniform change coefficient, as shown in Equation (9) [26].
where xk(0) is the kth initial monitoring cable force and xk is the kth current monitoring cable force.
The assessment value of the grouped cable can be calculated by the steps described above. Then, the condition level can be determined according to the classification of technical conditions in STCE2011 (Table 1) [11]. Level 1 represents that the bridge is in excellent condition and only needs daily maintenance or preventive maintenance. Level 2 represents that the bridge is in fair condition and needs preventive maintenance or repair maintenance. Level 3 represents that the bridge is in poor condition and needs repair maintenance or bridge rehabilitation. Level 4 represents that the bridge is in critical condition and needs repair maintenance or bridge rehabilitation. Traffic control is required while maintenance work is carried out and the bridge may have to be closed if necessary. Level 5 represents that the bridge is in imminent failure condition and needs replacement or rehabilitation. The bridge is closed to traffic.

Table 1.
Bridge technical condition classification boundary.
3. Case Study
3.1. Engineering Background
The Third Nanjing Yangtze River Bridge, a mega-span double-pylon, double-cable deck steel cable-stayed bridge in China, was taken as the engineering background bridge. The bridge is oriented north to south and measures 1288 m in length overall with a 648 m main span. The steel pylon and steel box are made of Q345D steel. A total of 168 stay cables, each made up of 109 to 241 wires with a diameter of 7 mm, support the deck. The stay cables adopt low-relaxation, ultra-high-strength galvanized steel wire, and the tensile strength of the steel wire is 1670 MPa. The bridge was opened to traffic in 2005. Figure 5 shows its elevation.
Figure 5.
Elevation of the Third Nanjing Yangtze River Bridge (unit: m).
Due to the large number of cables, they need to be numbered. According to the characteristics of the north–south direction of the bridge, the number contains two letters and one number. The first is S or N, representing the south pylon or the north pylon; the second is J or A, representing the river side or the bank side; and the last is 1 to 21, representing the shortest cable to the longest cable. For example, SJ15 stands for the 15th cable on the river side of the south pylon. Sometimes, a third letter, S or X, is added to represent upstream or downstream.
To ensure the safe operation of the bridge, a bridge structural health-monitoring system was installed. The main girder deflection monitoring was carried out by the closed connected pipe method with ROSEMOUNT 3051S sensors, which were arranged longitudinally in the side and middle spans of the bridge. Taking the upstream as an example, there are 22 effective measuring points (Figure 6). R.M.YOUNG-41372 temperature and humidity sensors (accuracy ±0.3 °C, ±2% RH, sampling frequency 10 Hz) from the USA were used to monitor the ambient temperature. The anchor load cell (ALC) sensors were installed in the anchors of stay cables that achieve measuring cable force directly. ALCs with a relative inaccuracy of 1% and an acquisition frequency of 10 Hz were installed in all 168 of the stay cables [12]. The specific distribution and quantity of monitoring sensors of the Third Nanjing Yangtze River Bridge are shown in Figure 6.
Figure 6.
Sensor layout of the Third Nanjing Yangtze River Bridge.
3.2. Verification of the Relationship between Cable Force and Deflection
The bridge was relatively stable in the first few years of operation and can be used to verify the theoretical relationship established above, between cable force and girder deflection. To ensure similar monitoring time and temperature and relatively stable vehicle load, the monitoring data on 7 January 2007 at 1:00 am, 20 January 2008 at 1:00 am, and 15 January 2009 at 1:00 am were selected. Their temperatures were 3.12, 3.13, and 3.10 °C, respectively. Taking the monitoring data after the completion of the bridge in 2005 as the initial value, the deflection change value and cable force change rate of the girder in 2007, 2008, and 2009 were calculated, as shown in Figure 7. It can be seen that the deflection difference was about ±10 mm, and the maximum was −29.58 mm. The change rate of cable force was mostly within 5%, and the maximum was 10%. Overall, the structural change was relatively stable and can be regarded as a non-destructive state. Therefore, these three sets of monitoring data can be used to verify the theoretical relationship between girder deflection and cable force proposed in Section 2.1.
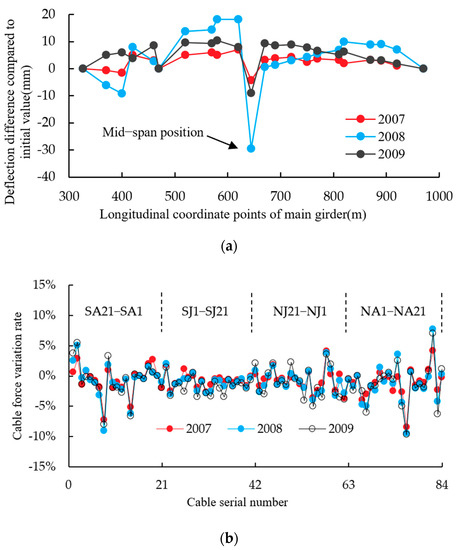
Figure 7.
Three groups of deflection and cable force change from 2007 to 2009: (a) deflection difference compared to initial value; (b) cable force variation rate.
It is known that Ep = 2.06 × 10⁵ MPa, Ip = 8.468 m4, A = 92.75 × 10⁻⁴ m2, Eeq = 1.706 × 10⁵ MPa. The cable force monitoring data are substituted into Equation (6) to obtain the deflection change value, and the mid-span monitoring data are compared with it (Figure 8). It can be seen that the theoretical calculation values of the three groups of deflection changes are in agreement with the monitoring data, and the corresponding errors are 2%, 5%, and 6%. Therefore, the established theoretical relationship between cable force and girder deflection is reasonable and can be used to determine the cable force threshold.
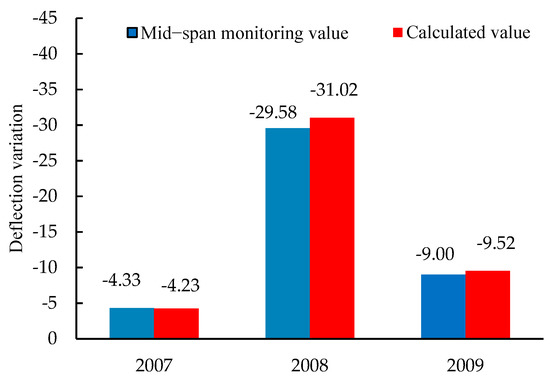
Figure 8.
Comparison of monitored and calculated values of mid-span girder deflection.
3.3. Assessment Example
(1) Determination of single cable force threshold
Taking eight long cables as an example, according to the assessment method in Section 2.2, their average variation rate is 30% (Table 2). The calculation equation of the five-level evaluation criteria of the cable force variation rate is shown in Equation (10).
where x is the cable force variation rate (%) and yi is the score value of the ith monitoring point (0 ≤ yi ≤ 100).
Table 2.
Cable force variation rate of long cables.
(2) Condition assessment of grouped cable
To make the cable force data over the years comparable, the influence of other factors must be eliminated. Temperature and vehicle load affect the cable force. The research shows that compared with the cable force due to dead load, the change in cable force caused by vehicle load is less than 2%, and the influence is small, while the change in cable force caused by temperature ranges from −5.7% to 5.2%. From 2007 to 2013, the Third Nanjing Yangtze River Bridge was closed six times due to foggy weather in a short period. The influence of temperature and live load on the cable force can be eliminated, and the cable force due to dead load can be obtained. Therefore, the researchers selected these six instances of cable force due to dead load, which were more comparable.
According to the previous analysis, the influence of a long cable on cable force is relatively large [28,29]. Therefore, the cable forces of 16 cables (No. 18–21) during the six closure periods were selected. In fact, due to the failure of two sensors, the cable forces of 14 cables were selected, namely SA21, SA19, SA18, SJ18, SJ19, SJ20, and SJ21 in the south pylon and NA21, NA19, NA18, NJ18, NJ19, NJ20, and NJ21 in the north pylon. The variation rate of cable force in each period was obtained by comparing these cable forces with the initial cable forces (Figure 9). We can see that the long cable forces of the south pylon vary greatly; some of them increase or decrease year by year, some of them remain basically unchanged, and the maximum change rate is about 8%. In addition, the long cable force of the north pylon changes slightly, with a change of about 4%.
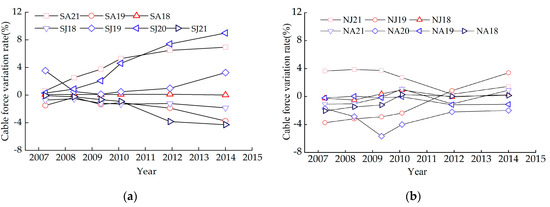
Figure 9.
Variation trend of cable force in six times: (a) cable force variation rate in the south pylon; (b) cable force variation rate in the north pylon.
According to Equations (7)–(10), the cable forces of 14 cables were evaluated. The detailed assessment results are shown in Table 3.
Table 3.
Assessment results of grouped cable forces.
The data in Table 3 show the trend of cable force degradation. According to the classification of technical conditions in STCE2011 (Table 1) [11], the cable force belonged to level 2 from 2007 to 2013. Although the condition level of grouped cable forces remains the same, the assessment result, the uniform assessment score, and the non-uniform coefficient all show a downward trend. Moreover, it can be predicted that the score of the grouped cables will probably be lower than 80 after 2014, entering level 3, which needs repair maintenance or rehabilitation. The Annual Bridge Inspection Report shows that there is no damage to the internal and external of stay cables and the anchor connection, while there are more cracks at the welding hole of the inclined web member in the steel box girder (see Figure 10), which may be the cause of the cable force changes. The total length of cracks in each box chamber section of the steel box girder was counted, and the crack distribution diagram of the steel box girder was obtained, as shown in Figure 11. It can be seen that the number and length of cracks increased year by year from 2010 to 2014, which indicates that cracks in the steel box girder are becoming more and more serious. In terms of the longitudinal distribution of the main girder, there are fewer cracks near the two main pylons, but more cracks are distributed near the quarter point of the midspan and the auxiliary pier. This will lead to uneven stress of the main girder, which will cause the fluctuation of cable forces, and then lead to poor evaluation results of grouped cable forces.
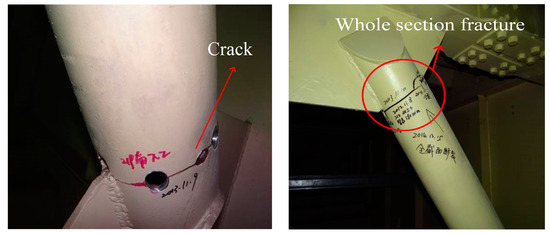
Figure 10.
Cracks detected on site in steel box girder.

Figure 11.
Crack distribution in steel box girder.
4. Conclusions
In this paper, based on the relationship between the girder deflection and the cable force, and using the deflection data of the main girder, an evaluation method of the cable force was proposed and applied to the Third Nanjing Yangtze River Bridge. The following conclusions were obtained:
- (1)
- According to the geometric relationship of the deformation in cable-stayed bridge, a simplified equation between the variation in cable forces and the girder deflection was built. A practical case study validated the correctness of the proposed theoretical equation.
- (2)
- The threshold value of cable force change rate for a single cable can be determined by a simplified equation between the cable force and girder deflection and the deflection limit in the specification. In this case, the threshold of a long cable is 30%. On this basis, the evaluation standard of a single cable force of piecewise linear mode was obtained according to the specifications.
- (3)
- A condition assessment method of grouped cable forces was established based on the variable weight synthesis method and gray correlation degree theory, which considers the uniform and non-uniform changes in cable force. The 6-year evaluation results of grouped cables of a real bridge show that the cable forces are generally decreasing year by year, and it also reflects the development of other component defects from the side.
Author Contributions
Conceptualization, X.L. and X.Y.; methodology, X.Y.; resources, X.L.; data curation, X.Y.; writing—original draft preparation, X.L.; writing—review and editing, B.W.; visualization, X.Y. and Y.L.; supervision, Y.L.; funding acquisition, X.L. and B.W. All authors have read and agreed to the published version of the manuscript.
Funding
This research was financially supported by the National Natural Science Foundation of China (no. 51808301), the Scientific Research Fund of Zhejiang Provincial Education Department (no. Y202248860), and the National “111” Centre on Safety and Intelligent Operation of Sea Bridge (D21013).
Data Availability Statement
Not applicable.
Conflicts of Interest
The authors declare no conflict of interest.
Abbreviations
The following symbols are used in this paper:
| A | Cable cross-sectional area |
| Eeq | Equivalent elastic modulus of cables |
| Ec | Elastic modulus of cable |
| Ep | Pylon elastic modulus |
| hi | Height of the ith cable from the deck |
| Ip | Area moment of inertia of pylon |
| Lc | Cable length |
| l | Length of the cable horizontal projection |
| m | The total number of cable force monitoring points |
| n | Number of pairs of cables anchored at each pylon |
| r | Non-uniform variation coefficient |
| T | Cable force |
| U | Score for uniform variation |
| V | Grouped cable assessment value |
| xk(0) | The kth initial monitoring cable force |
| xk | The kth current monitoring cable force |
| x | Cable force variation rate |
| yi | Score value of the ith monitoring point |
| α | Horizontal angle between cable and deck |
| w0 | Cable weight per unit length |
| ωi | Weight of the ith monitoring point |
| ∆T | Cable force variation |
| ∆Ti | Variation in cable force of the ith cable on the river side |
| ∆T’i | Variation in cable force of the ith cable on the bank |
| ∆u1 | Deflection of main girder caused by cable extension |
| ∆u2 | Deflection of main girder caused by pylon’s bending |
| ∆u | Deflection of main girder (∆u1 + ∆u2) |
| ∆v | Longitudinal displacement of the anchor point |
References
- Gimsing, N.J.; Georgakis, C.T. Cable Supported Bridges: Concept and Design; John Wiley & Sons, Inc.: Hoboken, NJ, USA, 2011. [Google Scholar]
- Jin, D.; Liu, X.; Wang, B.; Huang, Q. Main girder deflection variations in cable-stayed bridge with temperature over various time scales. Math. Probl. Eng. 2020, 2020, 4316921. [Google Scholar] [CrossRef]
- Guo, J.; Gu, Y.; Wu, W.; Chu, S.; Dang, X. Seismic fragility assessment of cable-stayed bridges crossing fault rupture zones. Buildings 2022, 12, 1045. [Google Scholar] [CrossRef]
- Liu, Z.; Guo, T.; Chai, S. Probabilistic fatigue life prediction of bridge cables based on multiscaling and mesoscopic fracture mechanics. Appl. Sci. 2016, 6, 99. [Google Scholar] [CrossRef]
- Ma, Y.; Peng, A.; Wang, L.; Dai, L.; Zhang, J. Structural performance degradation of cable-stayed bridges subjected to cable damage: Model test and theoretical prediction. Struct. Infrastruct. Eng. 2021, 1–17. [Google Scholar] [CrossRef]
- Yao, S.; Peng, B.; Wang, L.; Chen, H. Structural Performance and Reasonable Cross-Ratio of Cross-Cable Multi-Tower Cable-Stayed Bridges. Buildings 2022, 12, 764. [Google Scholar] [CrossRef]
- Soe, T.T.T. Evaluation of cable force changes effects on cable stayed bridge. KSCE J. Civ. Eng. 2020, 6, 2159–2174. [Google Scholar] [CrossRef]
- Civera, M.; Calamai, G.; Fragonara, L.Z. System identification via fast relaxed vector fitting for the structural health monitoring of masonry bridges. Structures 2021, 30, 277–293. [Google Scholar] [CrossRef]
- Li, H.; Ou, J. The state of the art in structural health monitoring of cable-stayed bridges. J. Civ. Struct. 2016, 6, 43–67. [Google Scholar] [CrossRef]
- Wang, Z.L.; Yang, J.P.; Shi, K.; Xu, H.; Qiu, F.Q.; Yang, Y.B. Recent advances in researches on vehicle scanning method for bridges. Int. J. Struct. Stab. Dyn. 2022, 22, 2230005. [Google Scholar] [CrossRef]
- JTG/T H21-2011; Standards for Technical Condition Evaluation of Highway Bridges. Ministry of Transport of the People’s Republic of China: Beijing, China, 2011.
- Fan, Z.Y.; Huang, Q.; Ren, Y.; Zhu, Z.Y.; Xu, X. A cointegration approach for cable anomaly warning based on structural health monitoring data: An application to cable-stayed bridges. Adv. Struct. Eng. 2020, 23, 2789–2802. [Google Scholar] [CrossRef]
- Cho, H.N.; Choi, Y.M.; Lee, S.C.; Kang, K.K.; Choi, M.Y. Critical threshold value for monitoring & management of cable tension force in cable-stayed bridge. Key Eng. Mater. 2004, 270–273, 1977–1982. [Google Scholar]
- Liang, Y.; Li, D.; Song, G.; Feng, Q. Frequency Co-integration-based damage detection for bridges under the influence of environmental temperature variation. Measurement 2018, 125, 163–175. [Google Scholar] [CrossRef]
- Chen, C.C.; Wu, W.H.; Liu, C.Y.; Lai, G. Damage detection of a cable-stayed bridge based on the variation of stay cable forces eliminating environmental temperature effects. Smart Struct. Syst. 2016, 17, 859–880. [Google Scholar] [CrossRef]
- Ren, Y.; Liu, X.L.; Huang, Q. The long-term trend analysis and assessment of the cable forces due to dead load in cable-stayed bridges. J. Harbin. Inst. Technol. 2015, 47, 103–108. [Google Scholar]
- Huang, Y.; Wang, Y.; Fu, J.; Liu, A.; Gao, W. Measurement of the real-time deflection of cable-stayed bridge based on cable tension variations. Measurement 2018, 119, 218–228. [Google Scholar] [CrossRef]
- Cong, L. Research on safety assessment method for bridge structure based on variable weight synthesis method. Perspect. Sci. 2016, 7, 200–203. [Google Scholar] [CrossRef]
- Sun, S.; Liang, L.; Li, M. Condition assessment of stay cables via cloud evidence fusion. KSCE J. Civ. Eng. 2021, 25, 866–878. [Google Scholar] [CrossRef]
- Xu, X.; Huang, Q.; Ren, Y.; Sun, H.B. Condition assessment of suspension bridges using local variable weight and normal cloud model. KSCE J. Civ. Eng. 2018, 22, 4064–4072. [Google Scholar] [CrossRef]
- Dan, D.H.; Zhao, Y.M.; Yang, T.; Yan, X.F. Health condition evaluation of cable-stayed bridge driven by dissimilarity measures of grouped cable forces. Int. J. Distrib. Sens. Netw. 2013, 9, 818967. [Google Scholar] [CrossRef]
- Wang, P.H.; Lin, H.T.; Tang, T.Y. Study on nonlinear analysis of a highly redundant cable-stayed bridge. Comput. Struct. 2002, 80, 165–182. [Google Scholar] [CrossRef]
- Xiang, H.F. Advanced Theory of Bridge Structures, 2nd ed.; China Communications Press: Beijing, China, 2013. [Google Scholar]
- Wen, Y.; Zhou, Z. Qualification of the Ernst formula for modeling the sag effect of super-long stay cables in the long-span railway cable-stayed bridges. Structures 2022, 45, 99–109. [Google Scholar] [CrossRef]
- JTG/T 3365-01-2020; Specifications for Design of Highway Cable-Stayed Bridge. Ministry of Transport of the People’s Republic of China: Beijing, China, 2020.
- Xiong, W.; Tu, X.; Xiao, R. Condition assessment of stay cable forces based on variation and trend coefficients. J. Tongji Univ. Nat. Sci. 2011, 39, 1575–1580. [Google Scholar]
- Lan, H.; Shi, J.J. Degree of grey incidence and variable weight synthesizing applied in bridge assessment. J. Tongji Univ. Nat. Sci. 2001, 29, 50–54. [Google Scholar]
- Fu, Z.; Ji, B.; Yang, M.; Sun, H.; Maeno, H. Cable replacement method for cable-stayed bridges based on sensitivity analysis. J. Perform. Constr. Facil. 2015, 29, 04014085. [Google Scholar] [CrossRef]
- Mehrabi, A.B. Performance of cable-stayed bridges: Evaluation methods, observations, and rehabilitation case. J. Perform. Constr. Facil. 2016, 30, C4014007. [Google Scholar] [CrossRef]


Disclaimer/Publisher’s Note: The statements, opinions and data contained in all publications are solely those of the individual author(s) and contributor(s) and not of MDPI and/or the editor(s). MDPI and/or the editor(s) disclaim responsibility for any injury to people or property resulting from any ideas, methods, instructions or products referred to in the content. |
© 2023 by the authors. Licensee MDPI, Basel, Switzerland. This article is an open access article distributed under the terms and conditions of the Creative Commons Attribution (CC BY) license (https://creativecommons.org/licenses/by/4.0/).