Article

Research on the Preferred Illuminance in Office Environments Based on EEG

School of Environment and Municipal Engineering, Qingdao University of Technology, Qingdao 266525, China
*
Author to whom correspondence should be addressed.
Buildings 2023, 13(2), 467; https://doi.org/10.3390/buildings13020467
Submission received: 31 December 2022 / Revised: 23 January 2023 / Accepted: 2 February 2023 / Published: 8 February 2023
(This article belongs to the Special Issue Impact of Physical Environments on Occupant Comfort)

Abstract

:
The quality of the indoor light environment in buildings directly influences the emotional state, health condition, and work efficiency of people. The application of EEG to indoor light environments is beneficial to further reveal the neural mechanisms of light comfort. In this study, the absolute power of spontaneous EEG was calculated as an objective physiological index, and its trend with the illuminance level of the task area was analyzed. Then, the absolute power of the band, which has the strongest correlation with subjective evaluation and task performance, was selected as the characteristic value. The subjective and objective parameters were validated to explore the preferred illuminance choices for subjects’ comfort and efficiency during the rest stage and the task stage, respectively. The results showed that the power of the δ band and β band at partial channels in the parietal region had statistically significant differences under five illuminance levels in the resting state. The total logarithmic power of EEG and the logarithmic power of the δ band at the Cz channel were negatively correlated with the subjective evaluation. The total logarithmic power of EEG was relatively low when the subjective evaluation was comfortable. There was no statistical difference in the total EEG logarithmic power among the five illuminance levels in the task state, but the subjects had the highest performance indicator and the best cognitive task performance at 500 lux and 750 lux conditions. This research may provide a design reference for the selection of task area illuminance levels for staff during high-intensity mental work and rest.

1. Introduction

With the development of technology and the gradual improvement of people’s living standards, building indoor environments have been studied with respect to both well-being and energy efficiency. Research shows that the quality of the indoor environment directly affects the physical and mental health of building users as well as their work efficiency [1,2,3]. Visual information accounts for more than 90% of the information that humans obtain from the outside world [4]. Therefore, among the physical environment, the light environment, which is closely related to visual information transmission, is an extremely important part of the building environment. A well-designed indoor light environment facilitates the positive response of staff to external stimuli in both physiological and psychological terms [5,6,7,8], in addition to improving work efficiency. Long-term exposure to a low-quality light environment can lead to visual fatigue, reduced visual function, headache, distraction, blurred vision, slow reaction time, and increased rate of operational errors [9,10]. Investigating the needs of staff in terms of the light environment, designing the lighting environment rationally, as well as achieving dynamic and continuous adjustment of the light environment parameters are topics receiving increasing attention from researchers [11,12,13]. Physiological indicators are superior to physical parameters obtained from measurements in the study of light comfort. The assessment of indoor light environments by obtaining objective physiological data from users through professional equipment in combination with subjective perception evaluation is an important current research trend. EEG collection can record the conscious and subconscious responses of subjects without interrupting them. EEG characteristics analysis is an effective way to study the physiological and psychological state of the human body and has been applied from clinical diagnosis to ergonomics [14,15]. The application of EEG to the evaluation of indoor light environments is of great importance for the study of light comfort.
Numerous parameters are available to evaluate the quality of the light environment, and the main control indicators involved in the indoor lighting design standard ISO 8995:2002(E) [16] include illuminance, color temperature, illuminance uniformity, glare, etc. However, in practical engineering applications, illuminance is the most basic indicator for evaluating the comfort and ergonomics of the light environment and plays a decisive role in the visibility of visual objects [17,18,19]. The European indoor lighting standard [20] recommends that the reference illuminance of office task areas is 500 lux; the Japanese lighting design standard [21] requires general office illuminance to be within the range of 500–750 lux; China’s GB 50034-2013 [22] specifies that the minimum value of office illuminance for different types of use is not less than 300–500 lux. The above standards set the minimum levels of task area illuminance after balancing visual ergonomics and practical experience. However, it has been shown that the demand for task area illuminance is significantly higher than the standard when performing high-intensity mental work for a short-term period. Grünberger et al. [23] found that subjects’ attention level was significantly higher at 2500 lux illuminance than at 500 lux. The results of Tanabe [24] showed that 3 lux was more likely to trigger visual fatigue than an 800 lux environment, but no statistically significant differences were found in the task performance of additive calculation. Studies by Cajochen C et al. [25] and Xiao H et al. [26] revealed that bright light improves alertness and reduces drowsiness. Jhm A et al. [27] simulated office lighting design through an immersive virtual environment and observed that subjects’ task performance improved with increasing illuminance. T Ru et al. [28] concluded that an appropriate increase in illuminance can improve the accuracy and speed of memory tasks. It was found in a study by Lin [29] that 500 lux and 800 lux illuminance environments can improve performance in character recognition tasks when compared to 200 lux. Other studies [30,31] have also shown that people perform better at relatively higher illuminance levels when processing cognitive tasks of equal difficulty. It can be seen that the demand for illuminance in indoor light environments depends on the specific scenario and task. In the office environment, how to balance the need for illuminance between high-intensity mental work and rest is one of the topics of this study.
Another issue that needs to be discussed is whether it is possible to physiologically demonstrate the difference in human illuminance requirements under various task loads based on subjective evaluation. For this purpose, we analyzed the applicability and advantages of the electroencephalogram (EEG) for studying this topic in terms of theory, application scenarios, and neurophysiological effect mechanism. EEG is the sum of excitatory synaptic and inhibitory postsynaptic potentials of neuronal clusters in the cerebral cortex, especially pyramidal cells, and reflects the overall electrophysiological activity of the brain as measured by the cerebral cortex or scalp surface [32]. Nowadays, EEG is widely used to assess the state of the human body in indoor environments and thus to evaluate the environmental quality. The relevant studies fully demonstrate that EEG application in the indoor environment is mature and feasible [33,34,35,36,37,38].
For the study of EEG applied to indoor light environments, especially for illuminance, Hu et al. [39] applied visual evoked potentials and subjective evaluation to the study of illuminance environments and proposed a visual comfort characterization method based on visual evoked potentials. Shin et al. [40] recorded the EEG of subjects in light environments created by different lighting methods and concluded that θ band oscillatory activity may be related to emotional states in different lighting environments. Research by Byoung-Kyong Min et al. [41] found that a higher illuminance environment reduced the activity in the Alpha band of the personnel’s occipital region during the execution of cognitive tasks. Jin Y P et al. [42] recorded EEG signals from subjects engaged in cognitive tasks under four light environment conditions, objectively demonstrating the modulatory effect of light on brain activity. The results of Kuller R et al. [43] showed that high illuminance levels are more likely to awaken the central nervous system. Kong et al. [44] collected and analyzed the EEG signals of 41 subjects to study the effects of different indoor natural lighting designs on the physical and mental performance of individuals. Hsieh et al. [45] assessed participants’ attention levels during a sustained attention task under different illuminance environments using task performance, EEG and cortisol secretion.
From the neurophysiological perspective, light from the external environment is projected into the human eye and imaged on the retina. Photoreceptors on the retina process the light signal into an electrical signal [46], which is transmitted by the optic ganglion cells [47]. The optic nerve intersects at the optic cross and transmits information to the contralateral hemisphere, where the optic tracts on both sides terminate in the lateral geniculate nucleus. The lateral geniculate nucleus is the gateway for information to enter the cerebral cortex. The integrated and shunted information enters the primary visual cortex to be further processed by the ventral and dorsal pathways [48]. The cerebral cortex serves as the basis of the nervous system, which governs the activities of the body. It can be divided into frontal, parietal, occipital and temporal regions according to the relationship between its various regions and the control of body functions. In particular, the visual center is located in the occipital area. The parietal area is the center of the somatic senses, which is closely related to the perception of the surroundings [49]. The study was designed to investigate the illuminance environment, which induces relevant channel responses in the occipital and parietal regions.
During the whole process of nerve impulse transmission, ion channels in the cell membrane are activated by neurotransmitters. The “passive diffusion” and “active entry”, which are triggered by the difference in the concentration of Na+ and K+, achieve a dynamic balance between the resting and excited states of neurons, resulting in rhythmic fluctuations of neuronal populations in the brain [50]. Several studies have confirmed the relevance of EEG oscillations to human perception [51,52,53]. The more intense the oscillations, the more bioenergy the Na+ and K+ pump has to consume to regulate the potential balance. The difference in concentration between different environmental conditions directly causes the variance in the intensity of oscillations, which affects energy consumption. A study by Eroğlu et al. [54] revealed that different brightness of visual stimuli induced the average power of responses to fluctuate in the occipital and parietal regions. Subramanian et al. [55] discovered that low-illuminance flash stimuli affect the variability of visual evoked potentials. The research by Münch et al. [56] revealed that the very short-term EEG response is influenced by a priori light adaptation and the spectral quality of the light stimulus. Reference [57] found that the EEG power of subjects suffering from seasonal affective disorder (SAD) varied after receiving light therapy. The results of all the above studies indicate that light stimulation affects EEG activity, which is directly reflected in differences in energy and other parameters. Therefore, the absolute power of spontaneous EEG was calculated as an objective physiological indicator in the study.
Work mode and rest mode are two typical behavioral patterns of people in the office environment, with the former comprising the majority of the time. People have different states in the two behavior modes and different demands for illuminance environments. In this study, the absolute power of spontaneous EEG was calculated as an objective physiological index, and its trend with the illuminance level of the task area was analyzed. Then, the absolute power of the band, which has the strongest correlation with subjective evaluation and task performance, was selected as the characteristic value. The subjective and objective parameters were validated to explore the preferred illuminance choices for subjects’ comfort and efficiency during the rest stage and the task stage, respectively. The results of this study will provide new ideas for the optimization of indoor light environments. With the update of portable EEG devices and the development of intelligent system control in buildings, the methods and conclusions of this study may be extended to personalized dynamic lighting design.

2. Materials and Methods

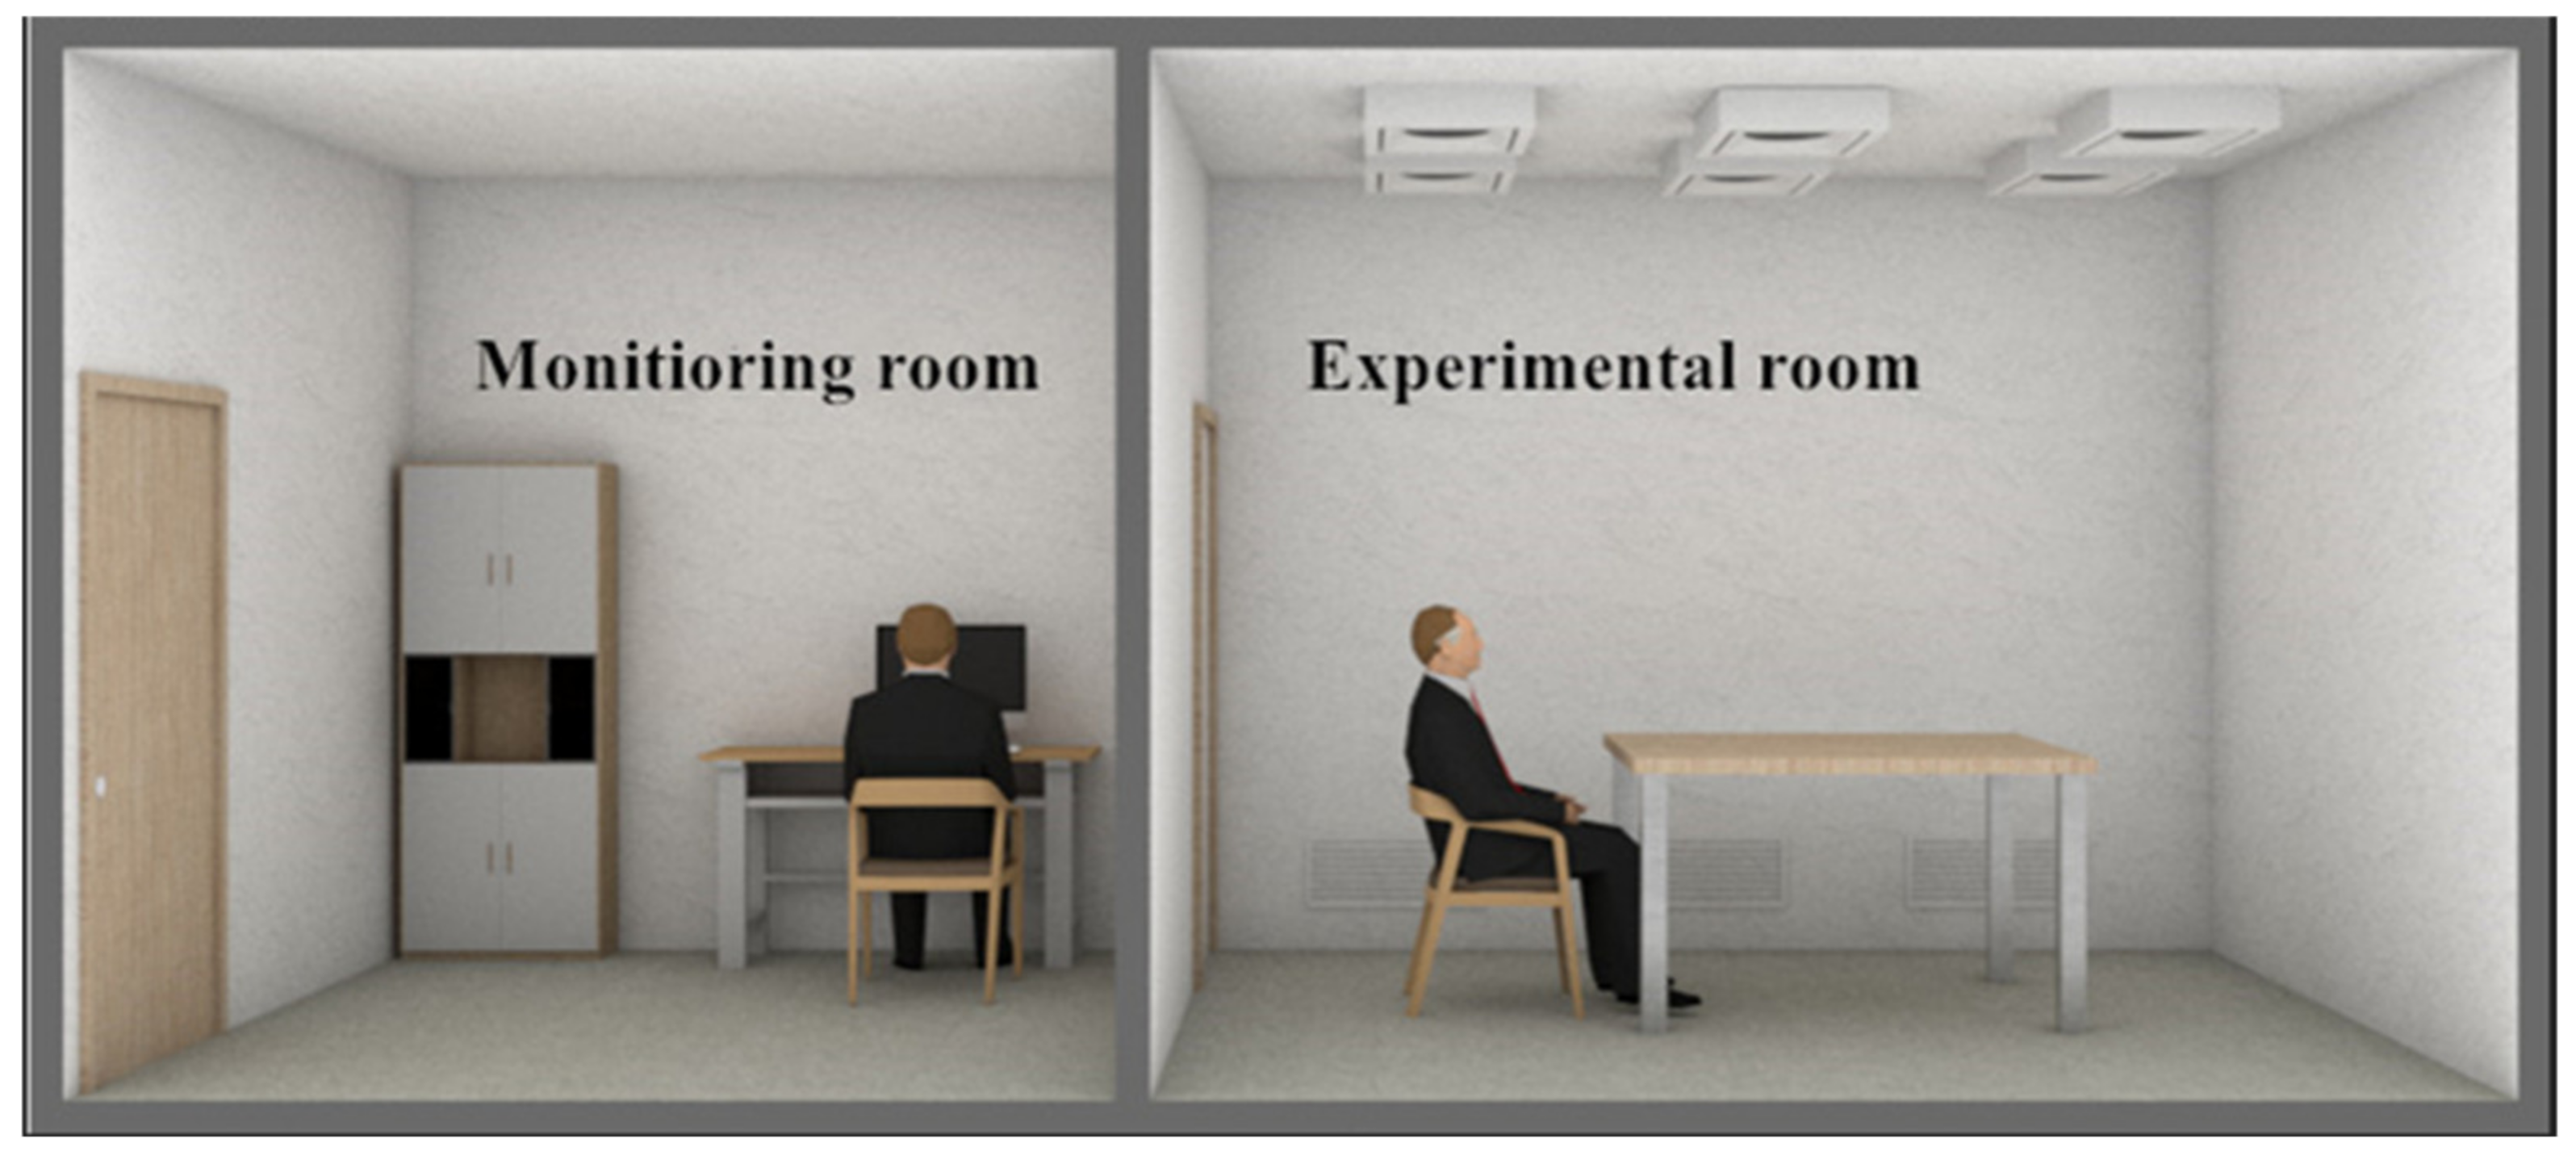
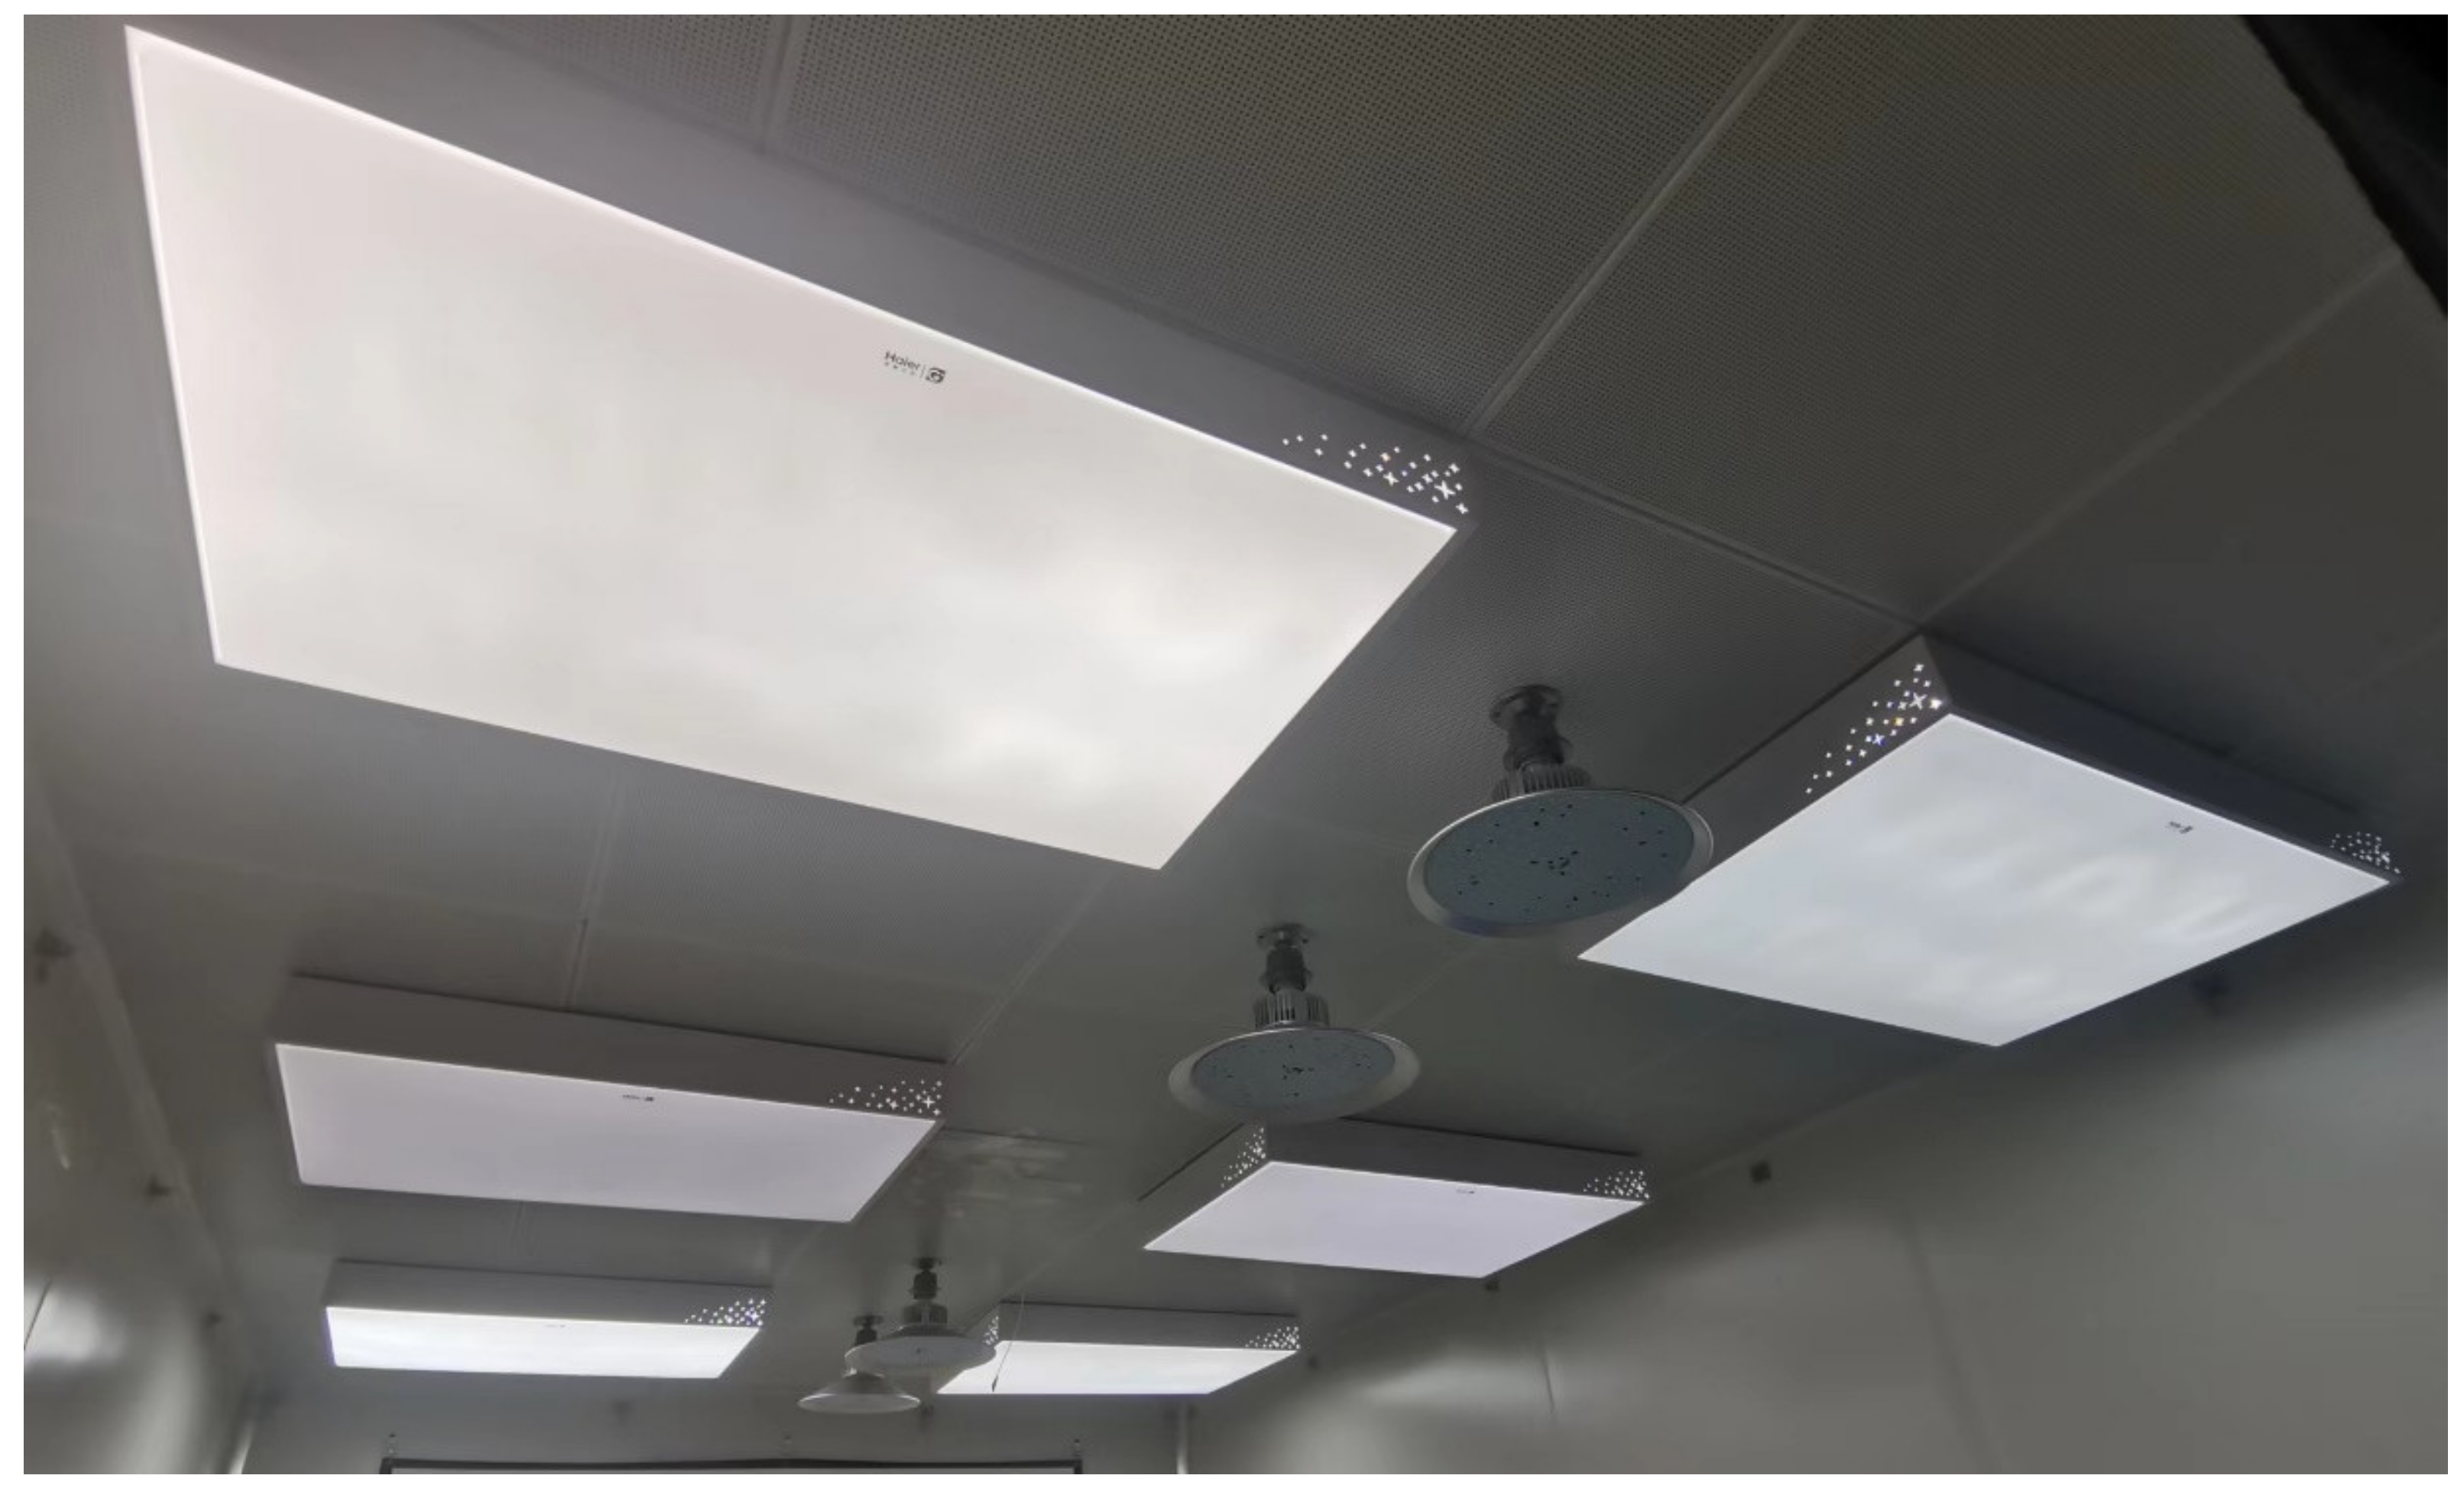
2.1. Experimental Environment

This experiment was conducted in July 2022 in an artificial climate chamber (L × W × H: 5000 × 3000 × 2600 mm) at Qingdao University of Technology; the layout of the chamber is shown in Figure 1. The climate chamber adopts a high-precision constant temperature and humidity air-conditioning system, which can precisely regulate the indoor temperature and humidity parameters. As shown in Figure 2, six lamps (Haier-ZW, Qingdao, China) were installed at equal intervals on the roof, with the illuminance adjustment range of 0–1500 lux on the 0.75 m horizontal task area and the related color temperature adjustment range of 2000–7000 K, to meet the test needs. The illuminance of the task area can be adjusted continuously and freely by the controller.

2.2. Experimental Conditions

To examine the psychological and physiological effects under various illuminances, we designed 75 lux, 300 lux, 500 lux, 750 lux, and 1200 lux conditions. The experimental illuminance gradient was set with reference to the literature [58], taking into account the need to induce identifiable EEG signal fluctuations in relevant brain functional areas. The illuminance value in this experiment is the average illuminance on the 0.75 m task area. The illuminance measurement points were arranged as shown in Figure 3. The final illuminance value was determined using the mean value of the illuminance at the midpoint of each side and the intersection of the diagonal. The illuminance uniformity on the task area of each working condition was greater than 0.7, which meets the requirements of the CIE standard [16]. The relevant color temperature was uniformly set to neutral 4000 K. There were no additional light sources or reflective surfaces in the room that triggered uncomfortable glare.
To avoid the effects of indoor thermal and acoustic environments on people, and ensuring the subjects’ PMV∈ (−0.5, +0.5) [59], the calculated indoor environmental parameters were set as shown in Table 1, after considering the subjects’ clothing insulation (0.75 clo) and metabolic rate (1.0 met). The details of the instruments used to measure the indoor physical environment parameters in the experiment are shown in Table 2. The specifications of the measurement instruments used and the measurement process meet the requirements of the relevant standards [16,60,61].

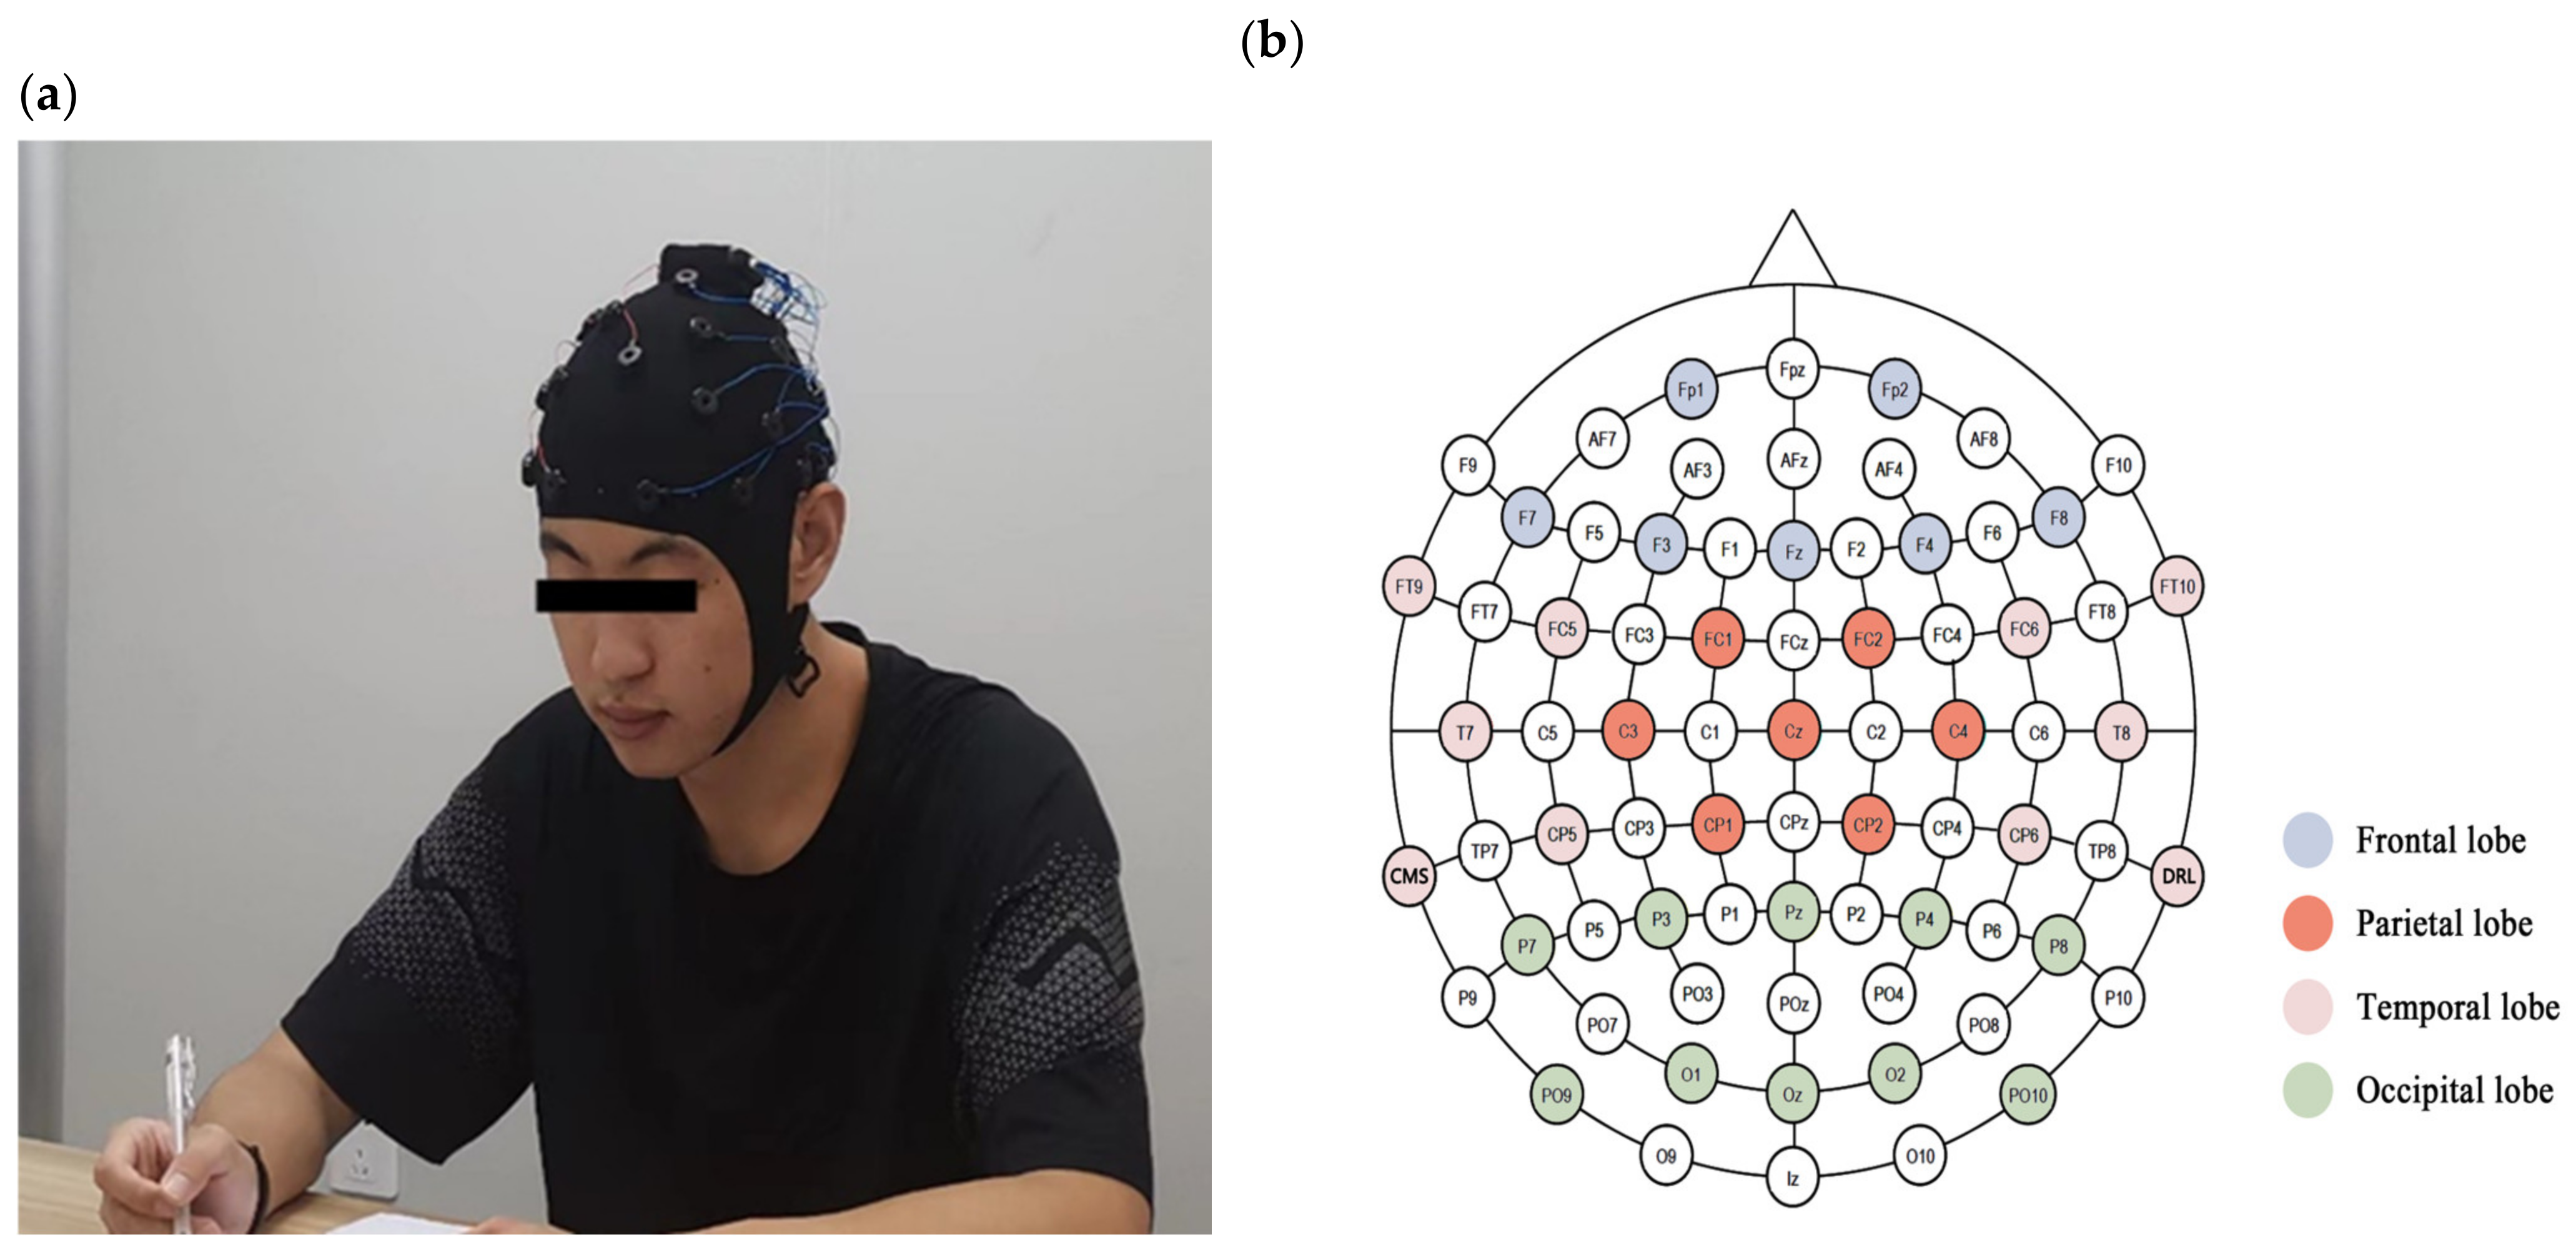
2.3. Selection of Subjects

A total of 28 (23 males and 5 females) postgraduate students were recruited as subjects in the experiment. The basic information about the subjects is shown in Table 3. All were in good health and had sufficient reading and cognitive abilities. Their visual acuity was not less than 5.0 on the standard logarithmic visual acuity test after optical correction. The degree of vision correction was less than 400°. All subjects were informed of the experimental procedure and precautions and signed the informed consent form. To improve the stability and reliability of the experimental results, the subjects were asked to get adequate sleep, eat regularly, and show no major mood fluctuations before the experiment. They were prohibited from taking neurologic drugs that may affect EEG. No consumption of alcohol, coffee, and other stimulant drinks was permitted 12 h before the test and no smoking within 8 h.

2.4. Test Contents

2.4.1. Subjective Evaluation

In the study of indoor thermal environments, “that condition of mind that expresses satisfaction with the thermal environment and is assessed by subjective questionnaire” is generally defined as “thermal comfort” internationally and provides a scale for evaluation [61]. However, there has been no uniform and clear definition of “light comfort” in the field, and the common evaluation index of light environment comfort is based on the “NON-annoyance approach” [62]. The questionnaire was designed to obtain the real visual perception of people in the room under different illuminance levels, using a five-point Likert evaluation scale. This evaluation scale was also applied in the study of Yao [63] and Zhang et al. [64]. The evaluation scale is shown in Figure 4.

2.4.2. Task Evaluation

Task evaluation reflects the ability of subjects to acquire and process information in the current environment. The Stroop test, a classical neuropsychological test, has been widely used to assess the ability to inhibit cognitive interference [65]. It was adopted as a cognitive task test in the study because it is low in basic difficulty, easy to perform, significantly influenced by the indoor light environment, and closely associated with visual perception. The test simulates the work process of people categorizing and integrating information, and responding to it selectively. As shown in Figure 5, subjects were asked to read the color of the words. Accuracy (AC), reaction time (RT), and performance indicator (PI) were used as evaluation criteria to measure task completion. As shown in Formula (1), AC refers to the ratio of the number of correct answers to the total number of words given by the subjects; RT is the time required to complete the task; PI is the AC per unit of RT, calculated as shown in Formula (2). To reduce the effect on learning ability, subjects had practiced the cognitive task prior to the start of the experiment.
AC = CA TA × 100 %
PI = AC RT
In Formula (1), AC is accuracy, RT is reaction time, CA is number of words with correct response color, TA is total number of words answered. In Formula (2), PI is performance indicator.

2.4.3. Physiological Evaluation

In this study, the EEG signals of the subjects were collected. The EEG signals have different frequency characteristics depending on the behavioral state of the person. Researchers have divided the EEG signal in the frequency domain into four basic rhythms: δ (0.5–4 Hz), θ (4–8 Hz), α (8–13 Hz), and β (13–30 Hz) [66]. The basic characteristics of each rhythm are presented in Table 4. For the δ band, higher power indicates relatively more fatigue or sleepiness [67], and for the β band, power is related to the degree of attention and the thinking state [68,69,70], while the θ band and α band are commonly applied to the study of the acoustic environment [71,72,73]. Therefore, energy variations of the δ band and α band were emphasized in this study. Refs. [74,75] have used a similar EEG study method.
The Emotiv EPOC device (Flex Saline Sensor Kit, Emotiv Inc., San Francisco, CA, USA) was used to record EEG signals; the reliability of its signal acquisition quality has been demonstrated [76]. The device is a non-invasive, portable wireless headset that is easy to install and use. The device has a total of 32 channels, arranged according to the 10–20 system proposed by the International EEG Society. The reference electrodes are CMS and DRL. The device has an internal sampling rate of 1024 Hz, down-sampled to 128 Hz output, and the data are sent to a computer via a USB connected to Bluetooth, with the contact pad wetted with saline to improve conductivity. The software development kit (SDK) has a packet counting function to check for data loss and a real-time sensor contact quality display. The actual wear of the device and the electrode arrangement are shown in Figure 6.
The EEG signal procedure in this study is shown in Figure 7. The EEG signal is susceptible to various artifacts and noise [77,78], so preprocessing of the raw EEG signal is required. The toolbox EEGLAB [79] (version v2021.1), developed based on the Matlab (Mathworks) operating environment, was applied for the preprocessing of the data. The EEG signal was effectively recorded by rolling the time series to ensure that non-stereotyped artifacts resulting from atypical causes (e.g., large body movement) were removed. Then, the EEG data in the 0.5–48 Hz band were preserved by filtering to eliminate low-frequency skin potential artifacts and high-frequency noise. ICA has been shown to be an effective method for solving the blind source separation problem [80]. Applying this method during pre-processing can effectively eliminate artifacts, including eye movements and muscle potential, to improve the signal-to-noise ratio.
After the EEG signal preprocessing is completed, the Fourier Transform can realize the conversion of the EEG signal from time domain to frequency domain. Formulas (3) and (4) are the mathematical expressions of Fourier Transform and Inverse Fourier Transform, respectively. In the actual calculation process, the fast Fourier Transform (FFT) is improved based on the characteristics of the Fourier transform, which has obvious speed advantages and is more suitable for application to the processing of EEG signals [81,82].
F ω = + f t e i ω t d t
f t = 1 2 π + F ω e i ω t d ω
After the EEG signal is converted to the frequency domain, the four bands δ, θ, α, and β are divided according to the frequency band, and the power is calculated separately. As shown in Formula (5), the power P k of a band is the sum of squares of the frequency domain sequence of that band. Since the calculated results are of a large order of magnitude, the logarithmic power P l is obtained by logarithmic transformation, as shown in Formula (6), which facilitates subsequent statistical analysis. As shown in Formula (7), the total EEG power P t is the sum of the waveband powers, and P l t is obtained by logarithmic transformation, as shown in Formula (8).
P k = n = i j X n 2
P l = l o g 10 P k
P t =     P k
P l t = l o g 10 P t
where P k —the power of a band; i —the lower limit of frequency; j —the upper limit of frequency; X n —the frequency domain sequence; P l —the logarithmic power of a band; P t —the total EEG power; P l t —the total EEG logarithmic power.

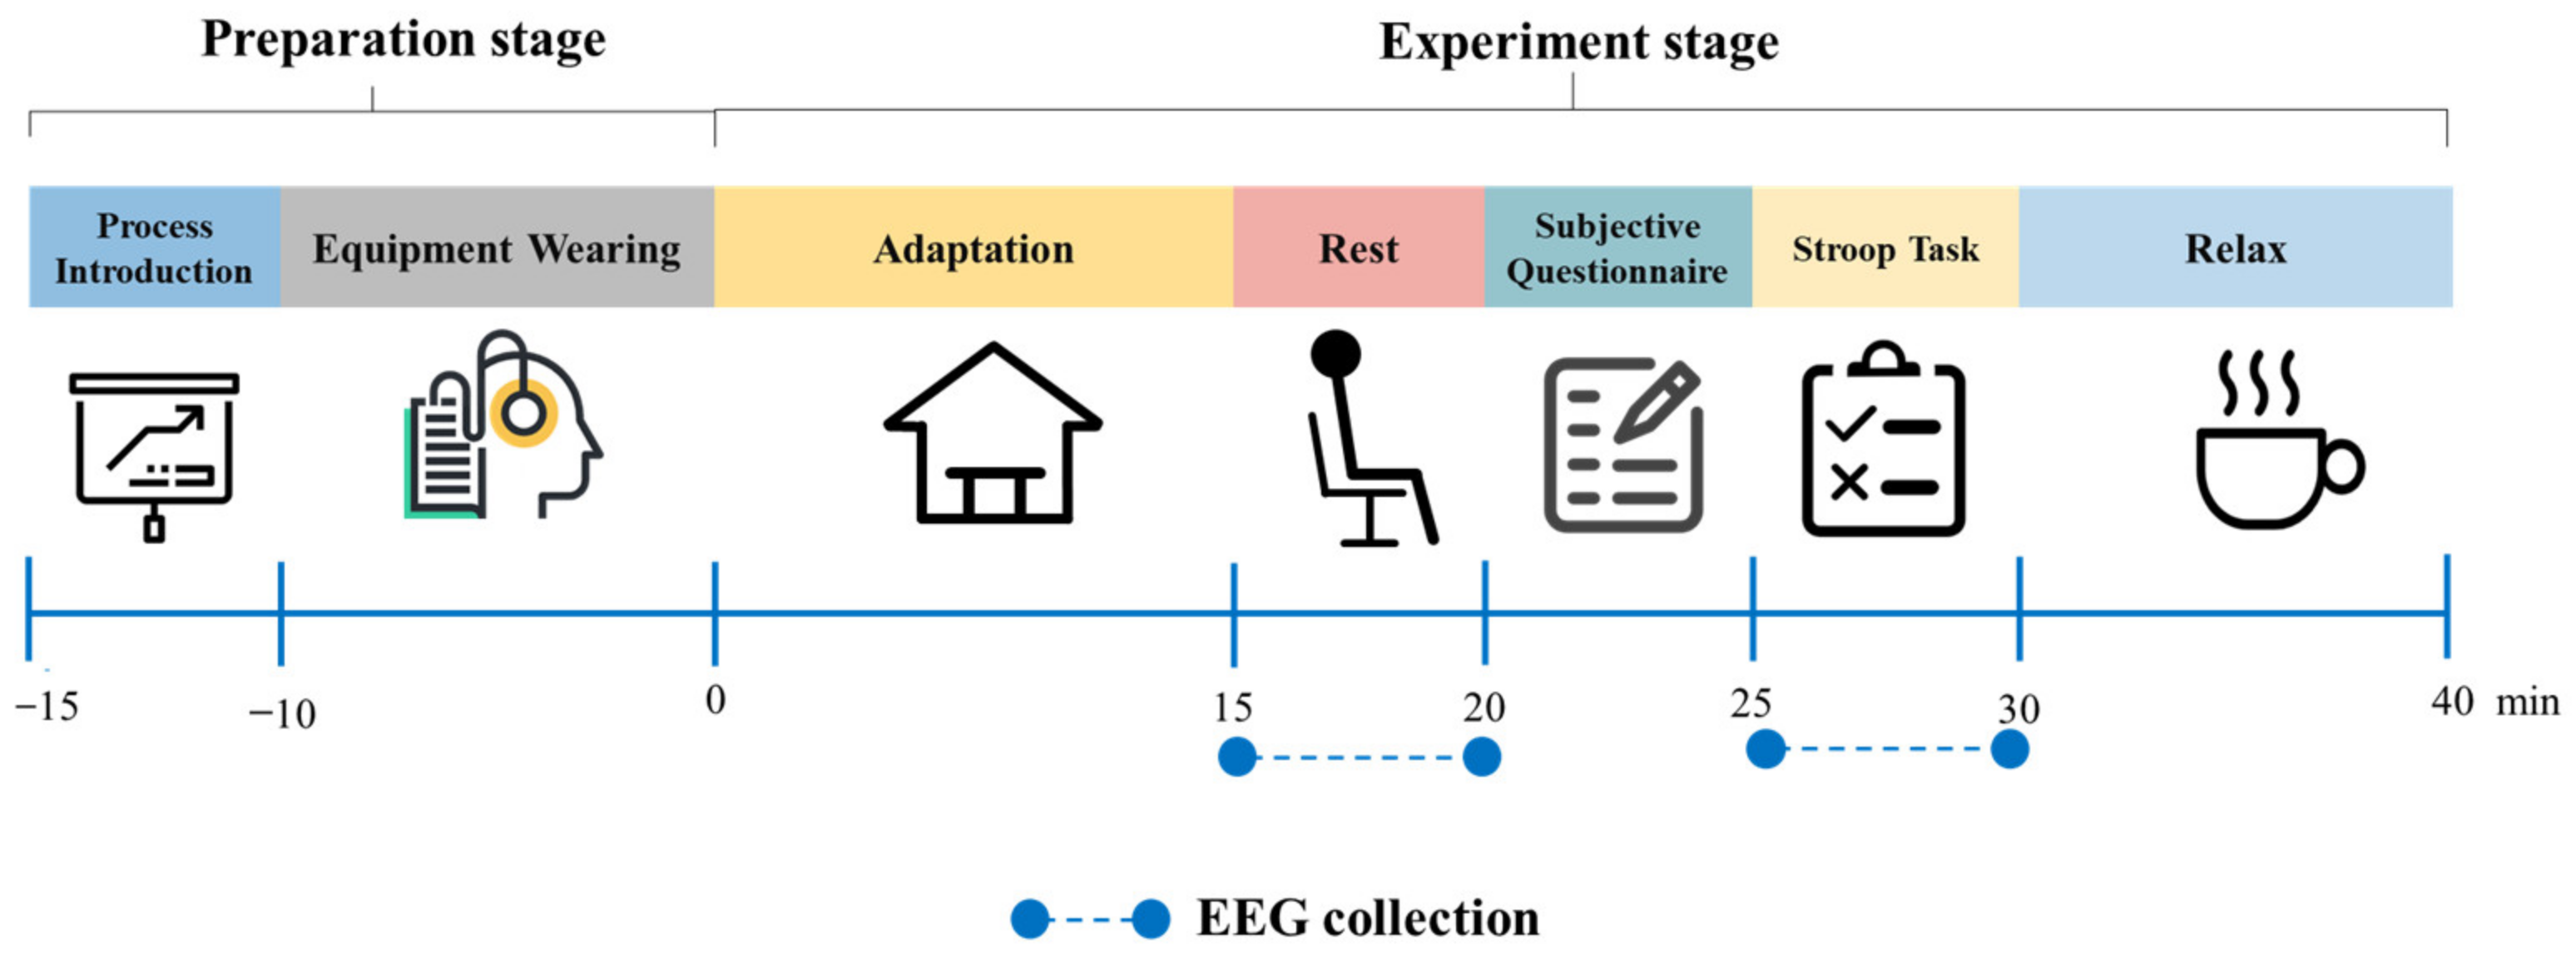
2.5. Experimental Procedure

The experiment procedure for each working condition is shown in Figure 8. Before the start of the test, the staff introduced the basic information of the test to the subject and put on the device for the subject. After entering the chamber, the subject was given 15 min to adapt to the set illuminance conditions, and the EEG signal in the rest stage was collected. Then, subjects filled out a questionnaire based on their subjective perceptions of the current environment and performed a Stroop test. The EEG signal of the subject’s task state was captured. Each working condition lasted approximately 35–40 min. During the experiment, the subject remained sedentary and was not allowed to use any electronic devices. The experiment was fixed between 9:00 a.m. and 12:00 a.m., and each subject completed only one working condition per day. In order to avoid the sequence effect triggering the subjects’ visual fatigue and affecting the experimental results, a Latin square design was used for the sequence of conditions as shown in Table 5.

2.6. Statistical Analysis

The content and structure of the data to be analyzed in the experiment are shown in Figure 9. The Shapiro–Wilk test was used to test the normality of the data. The Levene test was conducted to check the chi-squareness of the data. One-way ANOVA was adopted to analyze the variability of the data under different illuminance levels. The Pearson correlation coefficient method was applied in this study to analyze the closeness of the relationship between variables. All data processing was completed through SPSS 26.0 (SPSS Inc., Chicago, IL, USA).

3. Results

3.1. Rest Stage

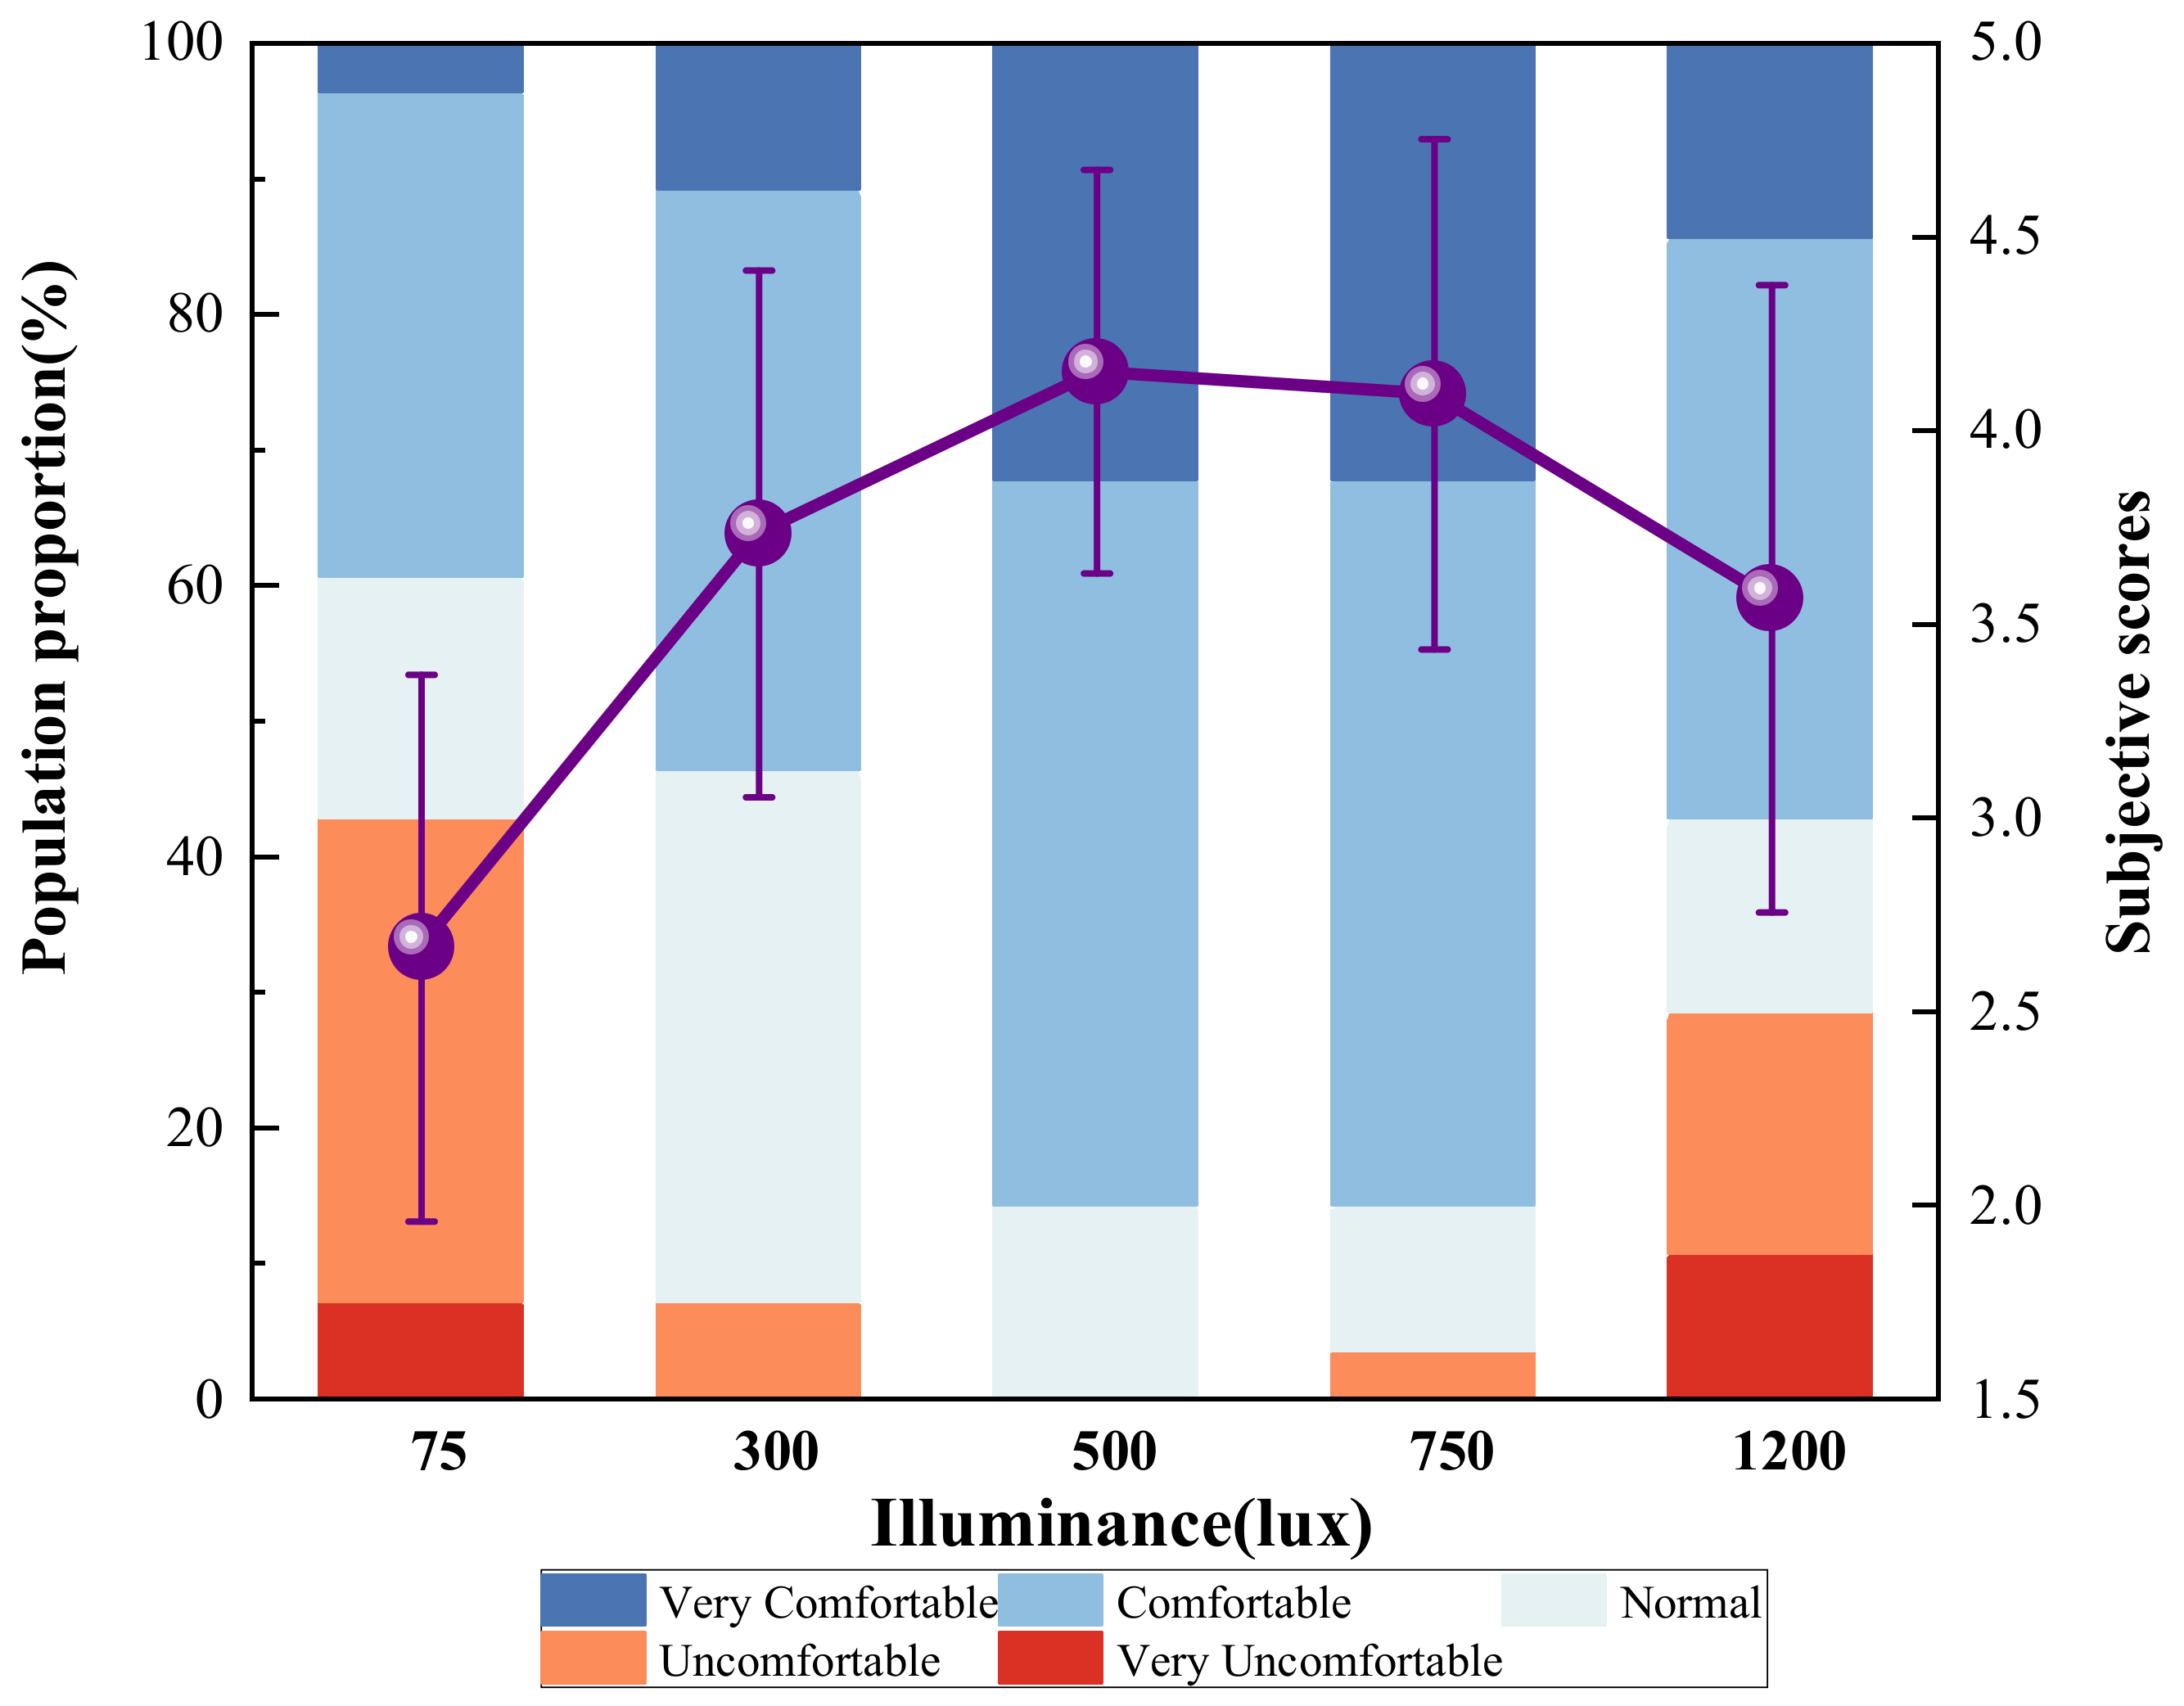
3.1.1. Subjective Evaluation

The subjective evaluation data of five working conditions were tested to satisfy the normal distribution. According to the Levene test, the significance was 0.187 > 0.05, which was consistent with the chi-square. One-way ANOVA was conducted on the subjective evaluation results of 28 subjects under five working conditions, and the results are shown in Table 6. The results showed that there was a statistically significant difference in the subjective evaluation of light comfort among the subjects under different illuminance levels. As shown in Figure 10, when the horizontal task area illuminance was 75 lux, 35.71% of the subjects felt uncomfortable in this environment and 7.14% of the subjects felt extremely uncomfortable. The percentage of uncomfortable people was the highest among the five working conditions. The illuminance working condition of 300 lux meets the minimum illuminance requirements for the office environment in the relevant standard [22], and the percentage of participants who were comfortable in this environment was substantially increased to more than 50% compared with the 75 lux working condition. At 500 lux, the mean value of subjective evaluation was 4.15, which was the highest among the five working conditions, with 53.57% of subjects feeling comfortable and 32.14% of subjects feeling very comfortable. This result is close to the findings obtained in the study [83]. With a further rise in illuminance, the willingness began to diverge, and the percentage of comfortable people did not increase but slightly decreased; 28.57% of the subjects evaluated chose a level less than 3 as an uncomfortable state in an illuminance environment of 1200 lux.

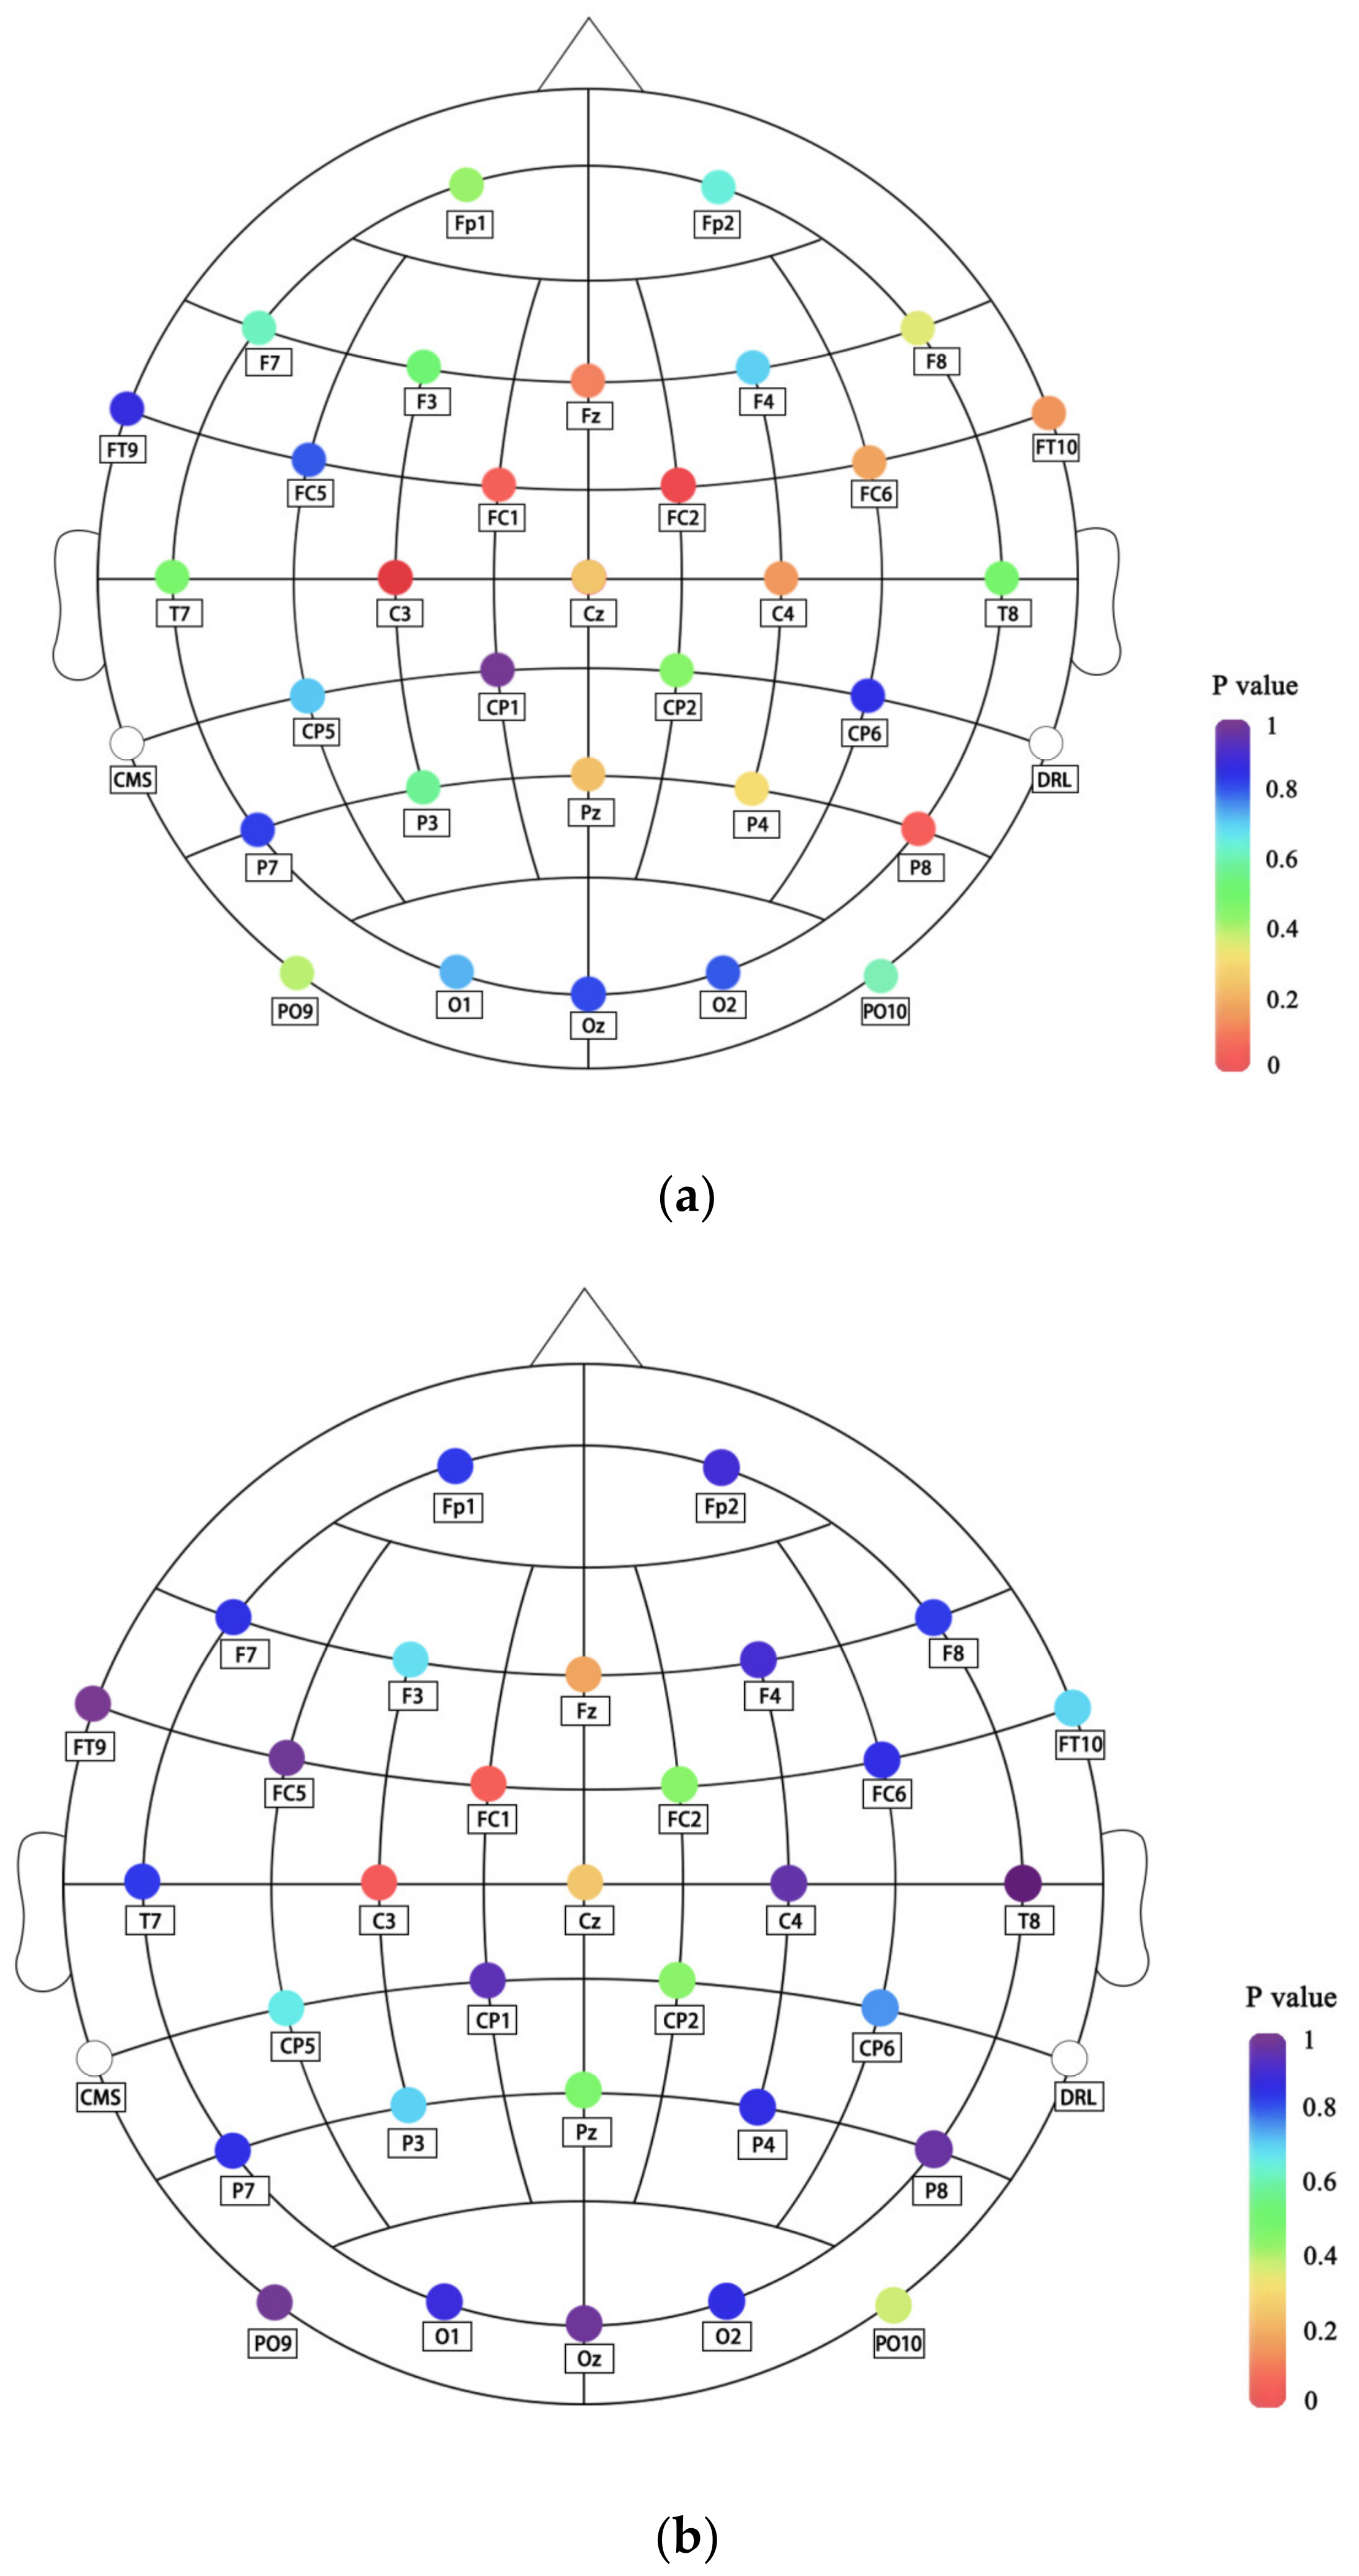
3.1.2. EEG Analysis of the Rest Stage

We calculated P l t for each illuminance condition separately to analyze the changes in EEG energy between conditions, and the results are shown in Figure 11, where P l t differed significantly (p = 0.049) between working conditions. P l t was maximum in the 75 lux working condition, gradually decreased with the increase of illuminance, and reached the minimum value in the 500 lux working condition; the inverse calculation to find the P t of the 500 lux working condition was 49.07% lower than that in the 75 lux illuminance environment. After that, the P l t value continued to increase with the rise of illuminance.
The EEG energy variation of each channel was further analyzed. The P l values of the δ band and β band of all channels in five illuminance environments were tested by the Shapiro–Wilk and Levene tests, which conform to normal distribution and chi-squared. We compared the P l values of the δ band and β band at each of the 32 channels in different illuminance environments, and the significant results of the one-way ANOVA were marked on the electrode layout maps, as shown in Figure 12, with the red color indicating stronger significance. For P l values in the δ band, significant differences were found at the C3 electrode (p = 0.001), Cz electrode (p = 0.032), FC1 electrode (p = 0.050), and FC2 electrode (p = 0.008) in the parietal region. For P l values of the β band, significant differences were found at both the C3 channel (p = 0.031) and FC1 channel (p = 0.048). The detailed statistics are shown in Table 7 and Table 8.
As shown in Figure 13, even at different channels, the P l of δ and β bands shows a U-shaped trend of decreasing and then increasing with the rise of illuminance. The maximum value of P l mostly appears in the dimmer 75 lux illuminance environment, and the minimum in the 300 lux or 500 lux environment. Taking the δ band of the C3 channel as an example, the P t value at 500 lux illuminance is 79% lower than that at 75 lux illuminance. The reason might be that under the light environment of excessive or insufficient illuminance, the subjects need to consume more energy to maintain normal visual information acquisition and processing functions, which leads to increased fatigue and higher P l of the δ and β bands. In contrast, at 300 lux or 500 lux, the subjects are more relaxed mentally, considering that they were in a resting state and not engaged in mental work.

3.1.3. The Relationship between the EEG Power and Subjective Evaluation

To further investigate the possible connection between subjective evaluation and physiological parameters, the correlation between the subjective evaluation results and the significant bands of energy variation at different illuminance levels was analyzed by the Pearson correlation coefficient method during data analysis. The results are shown in Table 9. P l t and P l of the δ band at C3, Cz and FC2 channels, and P l of the β band at the C3 channel were negatively correlated with the subjective evaluation results.
As shown in Figure 14, the trends of P l t and P l of the δ band at the Cz channel are the same, both decreasing at first and then increasing with the rise of illuminance, while the mean value of subjective evaluation shows the opposite trend. In the 500 lux working condition with the highest mean subjective evaluation, P l t and P l of the δ band at the Cz channel are the lowest.

3.2. Task Stage

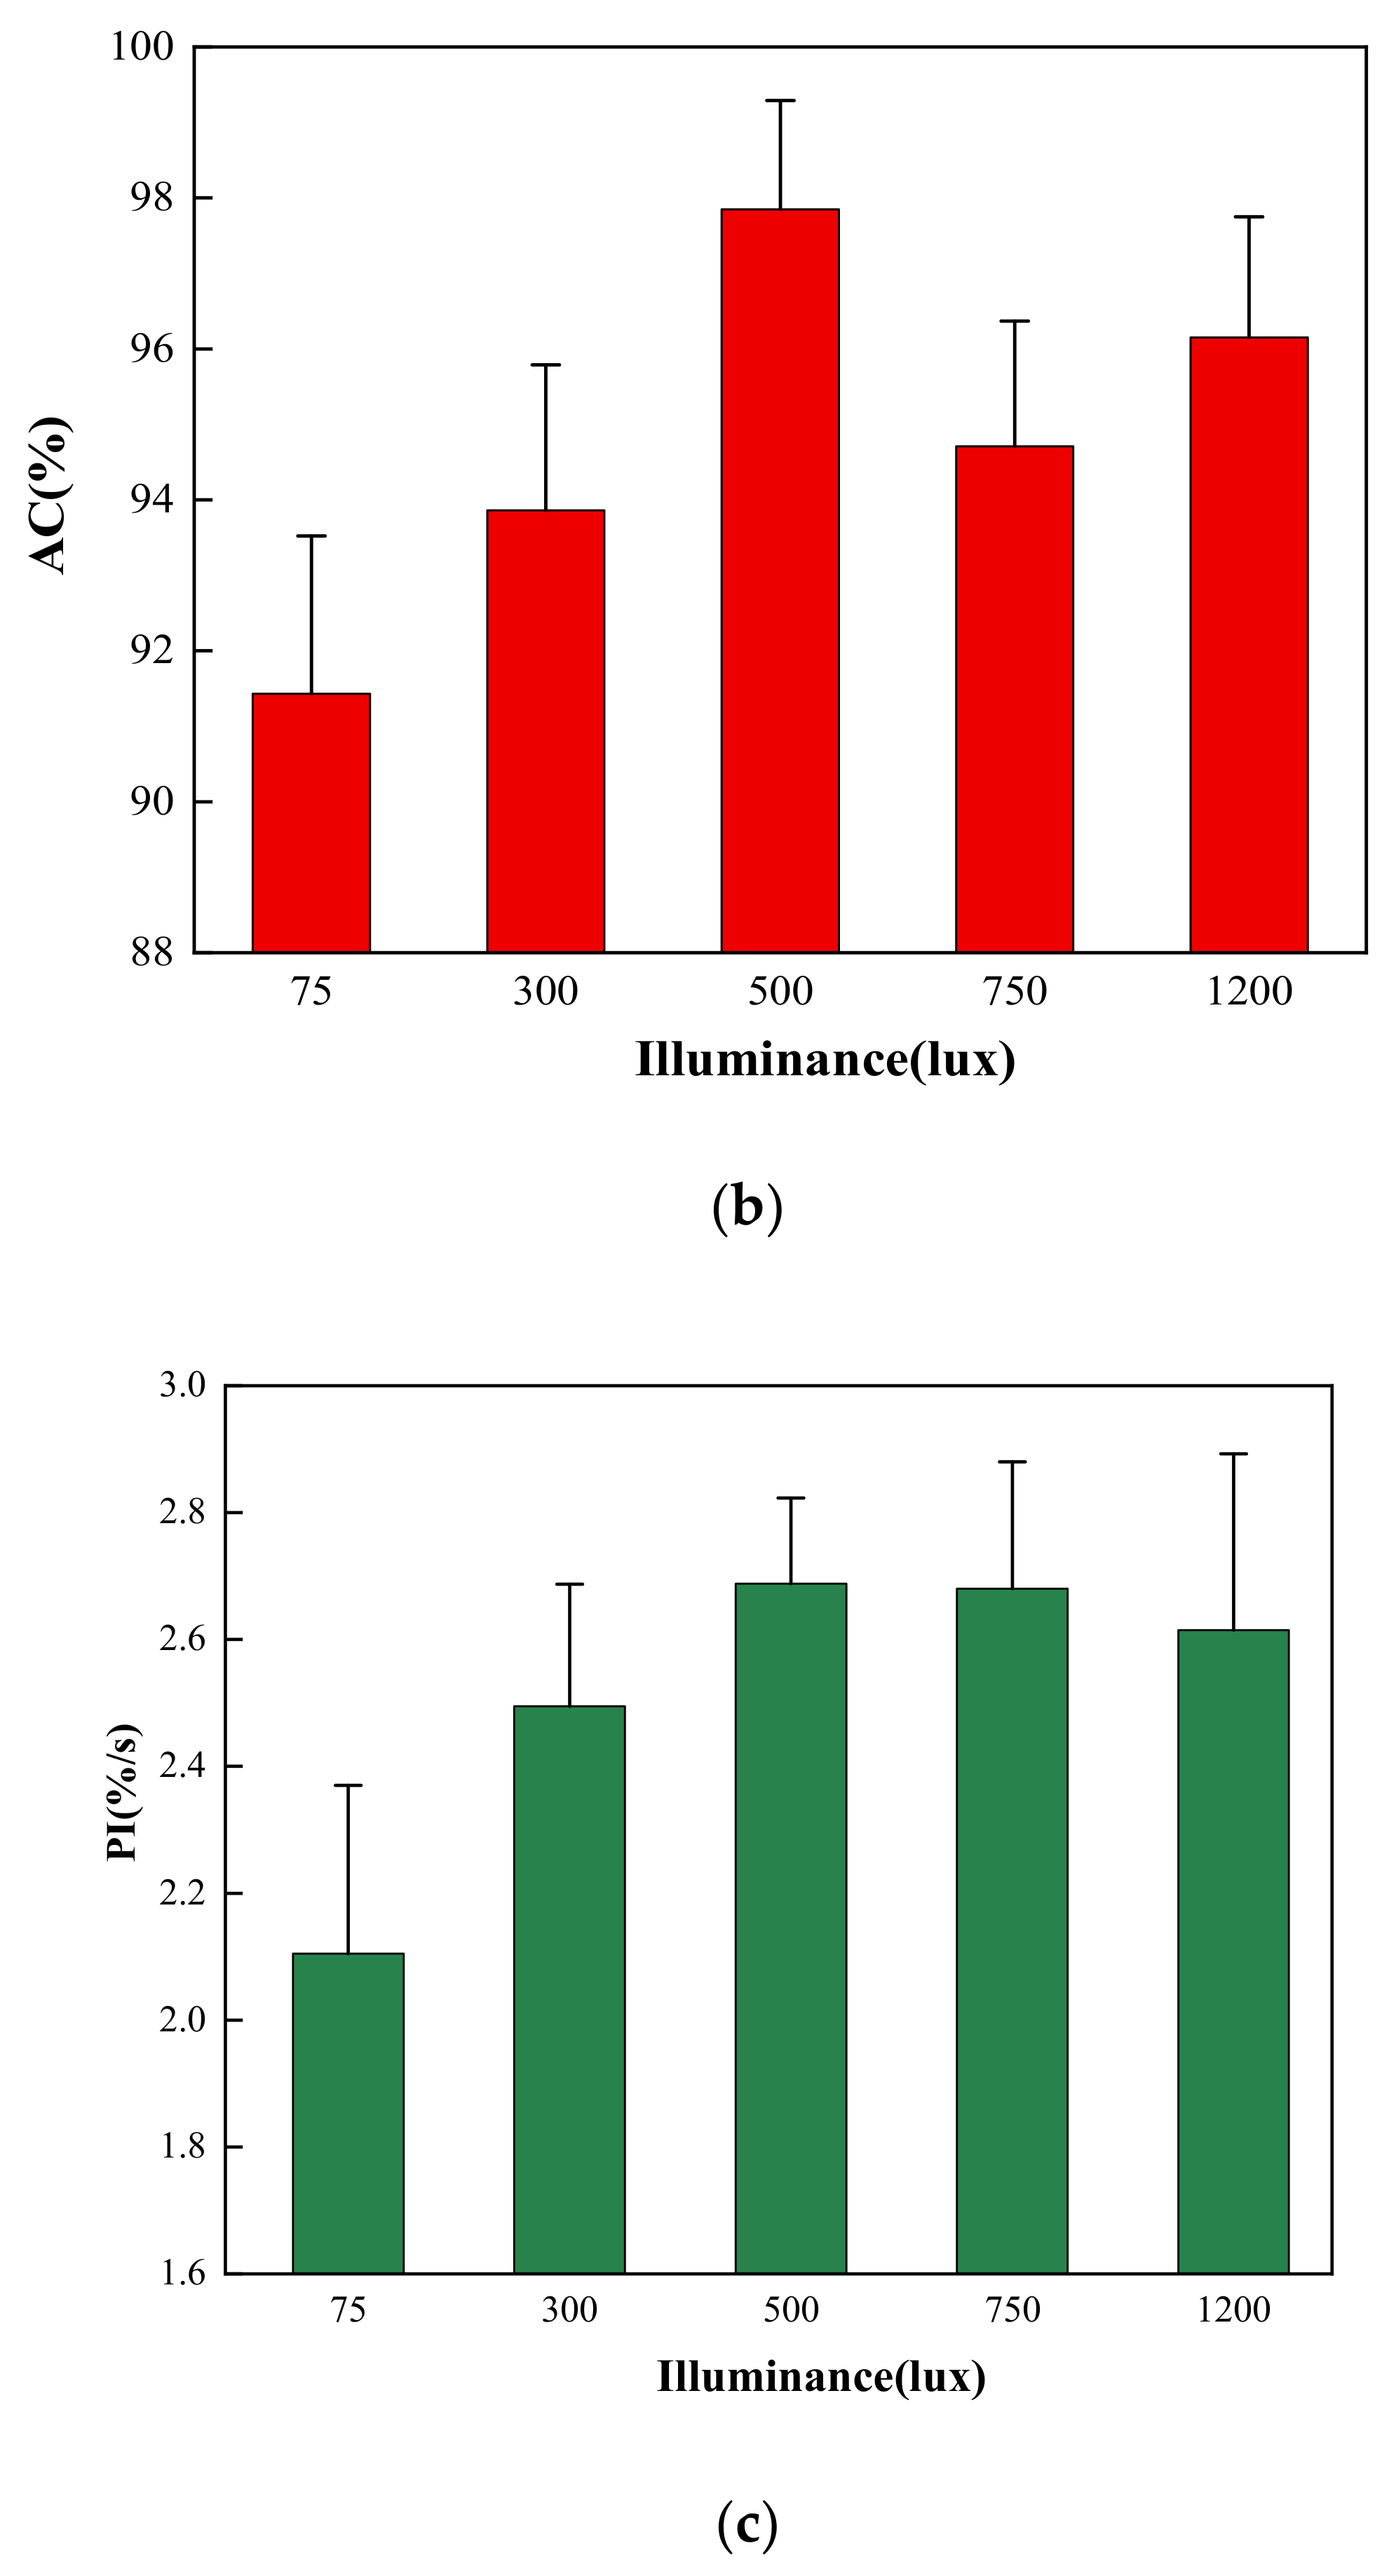
3.2.1. Task Performance

The RT, AC, and PI of 28 subjects in each working condition were tested by the Shapiro–Wilk and Levene tests. All data conformed to normal distribution and chi-squared. One-way ANOVA was performed on RT, AC, and PI at cognitive task completion for 28 subjects under different working conditions, and the results are shown in Table 10. Significant differences were found for all three indicators. As shown in Figure 15, the subjects have the longest RT, the lowest AC, and the worst PI in the 75 lux illuminance environment. As the illuminance level increased, the subjects’ RT was significantly shorter and the AC improved. The reason is likely that with the increase of the illuminance of the task area in a dim environment, the participants’ thinking activity and learning efficiency improved more significantly. The PI shows a trend of increasing and then slightly decreasing with increasing illuminance, reaching a maximum of 2.68 at 500 lux and 750 lux.

3.2.2. EEG Analysis of the Task Stage

Subjects’ P l t during the task stage under five working conditions was found to be normally distributed and chi-squared. Similarly, we used one-way ANOVA to compare P l t when subjects were in the task stage under five illuminance environments. The results are shown in Table 11. There was no significant difference in the P l t of individuals between different illuminance working conditions. It is possible that during the execution of the cognitive task, the subjects’ brain resources were more engaged in information acquisition and processing, which consequently reduced the perception of changes in the room light environment, and thus the EEG energy did not fluctuate significantly with illuminance changes.

4. Discussion

4.1. Neurophysiological Analysis

Based on the results of EEG analysis during the rest stage of this study, the channels that showed significant variations in band power at different task area illuminance levels (C3, Cz, FC1, and FC2 electrodes) are located in the parietal region, which is closely related to human perceptual activity [74], rather than in the occipital region, where the visual center is located. This result seems to indicate that after sufficient adaptation, the different illuminance environments do not affect subjects as external visual stimuli, instead affecting the organism’s information processing and integration in relation to the perception of the surrounding environment, which triggers a response in the relevant functional areas of the cerebral cortex.
In the analysis of combining EEG with subjective evaluation during the rest stage, it was observed that the minimum P l t values were found in the working condition with the best subjective evaluation of light comfort, while the maximum P l t values were reached in the illuminance environment with the highest discomfort. This seems to predict that the total EEG energy of the human body is higher in the uncomfortable condition than in the comfortable condition. Similar conclusions were obtained in previous studies [84,85]. The reason might be that when the discomforting effects of the external environment are so extensive that they exceed the amount of neural resources at the body’s disposal, the organism requires more energy consumption in an effort to maintain normal self-regulation and information processing functions [86,87], which manifests itself in the cerebral cortex as changes in the energy of the EEG-related waveforms. A long-term sustained state of resource overload can induce health problems [88].
During the task stage of this study, the P l t values did not vary significantly across work conditions, but there were significant differences in task evaluation indicators. During the task stage, the subjects were all actively engaged in mental work, and the cortical neurons were all more active. More neural resources were applied to thinking and solving specific problems r than perceiving changes in the external environment, which may lead to insignificant differences in EEG energy under different working conditions. However, the illuminance level of the task area has an impact on the execution of tasks through the action of visual pathways, which is directly reflected in the differences of task performance. The 75 lux and 1200 lux working conditions showed poorer task performance compared to others. This may be due to the fact that high or low illuminance in the task area, in addition to directly increasing the regulatory burden on the visual system of the human eye [89] and causing visual fatigue, also increases the cognitive load on the brain and consumes more cognitive resources. Negative subjective evaluation in both working conditions can also have an impact on task completion. It has been demonstrated that negative emotions can directly interfere with information processing ability and reduce work efficiency [90].
A comprehensive analysis of the subjects’ performance during the rest stage and the task stage reveals that the most comfortable working condition subjectively evaluated by the participants during the rest stage is 500 lux; during the task stage, the highest PI of the subjects is 500–750 lux. The staff needed a slightly higher task area illuminance environment when they were engaged in mental work than when resting. In other words, there are differences in the light environment requirements of people at different states. The results may provide a reference for the control strategy of dynamically adjusting the light environment parameters according to the state of the individual in the room.

4.2. Limitations of the Study

To minimize the interference of other factors in the experiment, the light environment in this study was created in a small closed room, relying on artificial lighting regulation, while the actual office lighting environment generally takes into account both natural and artificial lighting. There are differences between the experimental environment and the actual indoor light environment. In addition, although the illuminance level, as the main light environment parameter, has a direct impact on the subjective evaluation and work efficiency of the subjects, the design of the actual indoor light environment should consider multiple indicators, such as color temperature, illuminance uniformity, and glare value, according to the specific task type.
In this study, the subject population comprised graduate students, with similar work patterns and intensity as the office population, but with a younger average age compared to the general office population. However, studies have found differences in light needs among different age groups due to different visual characteristics [91]. Gender differences were not considered in this study, and some studies [92] have found that men produce more negative emotions than women in high illuminance environments.

5. Conclusions

(1) During the rest stage, the subjective evaluation score of light comfort showed a trend of increasing and then decreasing with rising illuminance. Under the 500 lux illuminance environment, subjective evaluation was the best; under 75 lux working conditions, people felt the strongest discomfort. The P l t value and δ band of multiple channels in the parietal area (C3, Cz, FC1, and FC2) and the P l of β band (C3 and FC1) varied significantly under different task area illuminance environments. The P l t value and the P l value of the δ band at the Cz channel were negatively correlated with the subjective evaluation results. P l t obtained the minimum value under the most comfortable working conditions (500 lux).
(2) During the task stage, the accuracy, reaction time, and performance indicator of the completed tasks under various working conditions were significantly different. The 500 lux and 750 lux conditions showed the highest performance indicator of 2.68 and the best task performance. The P l t value was not significantly affected by the illuminance of the task area during the task stage.

Author Contributions

Conceptualization, L.T.; methodology N.L.; investigation, S.H.; writing—original draft preparation, N.L.; writing—review and editing, N.L. and M.L.; visualization, Y.Z.; supervision, X.M. All authors have read and agreed to the published version of the manuscript.

Funding

This paper is supported and funded by Natural Science Foundation of Shandong Province (ZR2021ME186).

Data Availability Statement

Data are not publicly available due to restrictions regarding the privacy of the participants.

Conflicts of Interest

The authors declare no conflict of interest.

Abbreviations

Symbol/AcronymDefinitionUnit
ACAccuracy%
RTReaction Times
PIPerformance Indicator%/s
P k Power of a band μ V 2
P l Logarithmic power of a band lg μ V 2
P t EEG total power μ V 2
P l t EEG total logarithmic power lg μ V 2

References

  1. Fisk, W.J.; Singer, B.C.; Chan, W.R. Association of Residential Energy Efficiency Retrofits with Indoor Environmental Quality, Comfort, and Health: A Review of Empirical Data. Build. Environ. 2020, 180, 107067. [Google Scholar] [CrossRef]
  2. Jia, L.-R.; Li, Q.-Y.; Chen, X.; Lee, C.-C.; Han, J. Indoor Thermal and Ventilation Indicator on University Students’ Overall Comfort. Buildings 2022, 12, 1921. [Google Scholar] [CrossRef]
  3. Wolkoff, P.; Azuma, K.; Carrer, P. Health, Work Performance, and Risk of Infection in Office-like Environments: The Role of Indoor Temperature, Air Humidity, and Ventilation. Int. J. Hyg. Environ. Health 2021, 233, 113709. [Google Scholar] [CrossRef] [PubMed]
  4. Yang, G. Vision and Visual Environment (Revised Edition); Tongji UniversityPress: Shanghai, China, 2002. [Google Scholar]
  5. Burattini, C.; Piccardi, L.; Curcio, G.; Ferlazzo, F.; Giannini, A.M.; Bisegna, F. Cold LED lighting affects visual but not acoustic vigilance. Build. Environ. 2019, 151, 148–155. [Google Scholar] [CrossRef]
  6. Van Duijnhoven, J.; Aarts, M.; Aries, M.; Rosemann, A.; Kort, H.S.M. Systematic review on the interaction between office light conditions and occupational health: Elucidating gaps and methodological issues. Indoor Built Environ. 2019, 28, 152–174. [Google Scholar] [CrossRef]
  7. Kim, J.; Dear, R.D. Nonlinear relationships between individual IEQ. factors and overall workspace satisfaction. Build. Environ. 2012, 49, 33–40. [Google Scholar] [CrossRef]
  8. Wilkins, A.J. Visual Stress; Oxford University Press: New York, NY, USA, 1996. [Google Scholar]
  9. Winterbottom, M.; Wilkins, A. Lighting and discomfort in the classroom—ScienceDirect. J. Environ. Psychol. 2009, 29, 63–75. [Google Scholar] [CrossRef]
  10. Boyce, P.R. Review: The Impact of Light in Buildings on Human Health. Indoor Built Environ. 2010, 19, 8–20. [Google Scholar] [CrossRef]
  11. Sorooshnia, E.; Rashidi, M.; Rahnamayiezekavat, P.; Samali, B. Optimizing Window Configuration Counterbalancing Energy Saving and Indoor Visual Comfort for Sydney Dwellings. Buildings 2022, 12, 1823. [Google Scholar] [CrossRef]
  12. Zeng, Y.; Sun, H.; Lin, B.; Zhang, Q. Non-visual effects of office light environment: Field evaluation, model comparison, and spectral analysis. Build. Environ. 2021, 197, 107859. [Google Scholar] [CrossRef]
  13. Kompier, M.E.; Smolders, K.C.H.J.; Kort, Y.A.W.D. Abrupt Light Transitions in Illuminance and Correlated Color Temperature Result in Different Temporal Dynamics and Interindividual Variability for Sensation, Comfort and Alertness. PLoS ONE 2021, 16, e0243259. [Google Scholar] [CrossRef]
  14. Liu, Y.; Chen, D. An analysis on EEG power spectrum under pressure of girdle. Int. J. Cloth. Sci. Technol. 2015, 27, 495–505. [Google Scholar] [CrossRef]
  15. MORI, Y.; IKAMI, K.; SUGITA, A.; KIOKA, E. Clothing Comfort of the Material (RAFUMA-Mixed Cotton) of Pajamas from the Point of Biological Reactions. J. Home Econ. Jpn. 2005, 56, 233–240. [Google Scholar]
  16. ISO 8995-1:2002-05; CIE S 008:2002-05. CIE Central Bureau: Vienna, Austria, 2002.
  17. Zhang, S. Demonstration of Natural Lighting Design Optimization Using Galapagos and Octopus Taking the Daylighting Opening of Institutional Pension Building as an Example; TianJin University: Tianjin, China, 2017. [Google Scholar]
  18. Logar, V.; Kristl, Z.; Skrjanc, I. Using a fuzzy black-box model to estimate the indoor illuminance in buildings. Energy Build. 2014, 70, 343–351. [Google Scholar] [CrossRef]
  19. Wagiman, K.R.; Abdullah, M.N.; Hassan, M.Y.; Radzi, N.H.M. A New Optimal Light Sensor Placement Method of an Indoor Lighting Control System for Improving Energy Performance and Visual Comfort. J. Build. Eng. 2020, 30, 101295. [Google Scholar] [CrossRef]
  20. UNE-EN 12464-1-2012; Light and lighting—Lighting of workplaces—Part 1: Indoor workplaces. British Standards Institution: London, UK, 2012.
  21. JISZ9110:2010; Japanese Industrial Standards. Japanese Standards Association: Tokyo, Japan, 2011.
  22. GB50034-2013; Architectural Lighting Design Standard. China Architecture Industry Press: Beijing, China, 2013.
  23. Grünberger, J.; Linzmayer, L.; Dietzel, M.; Saletu, B. The effect of biologically-active light on the noo- and thymopsyche and psychophysiological variables in healthy volunteers. Int. J. Psychophysiol. Off. J. Int. Organ. Psychophysiol. 1993, 15, 27. [Google Scholar] [CrossRef]
  24. Tanabe, S.; Nishihara, N. Productivity and fatigue. Indoor Air 2004, 14 (Suppl. S7), 126. [Google Scholar] [CrossRef]
  25. Cajochen, C.; Zeitzer, J.; Czeisler, C.; Dijk, D. Dose-response relationship for light intensity and ocular and electroencephalographic correlates of alertness in humans. Behav. Brain Res. 2000, 115, 75–83. [Google Scholar] [CrossRef]
  26. Xiao, H.; Cai, H.; Li, X. Non-visual effects of indoor light environment on humans: A review. Physiol. Behav. 2020, 228, 113195. [Google Scholar] [CrossRef]
  27. Jhm, A.; Jin, K.; Shc, C. Effects of lighting CCT and illuminance on visual perception and task performance in immersive virtual environments. Build. Environ. 2021, 209, 108678. [Google Scholar]
  28. Ru, T.; Smolders, K.C.H.J.; Chen, Q.; Zhou, G.; de Kort, Y.A.W. Diurnal effects of illuminance on performance: Exploring the moderating role of cognitive domain and task difficulty. Light. Res. Technol. 2021, 53, 727–747. [Google Scholar] [CrossRef]
  29. Lin, C. Effect of noise intensity and illumination intensity on visual performance. Percept. Mot. Ski. 2014, 119, 441–454. [Google Scholar] [CrossRef] [PubMed]
  30. Ru, T.; de Kort, Y.A.W.; Smolders, K.C.H.J.; Chen, Q.; Zhou, G. Non-image forming effects of illuminance and correlated color temperature of office light on alertness, mood, and performance across cognitive domains. Build. Environ. 2019, 149, 253–263. [Google Scholar] [CrossRef]
  31. Huiberts, L.M.; Smolders, K.; Kort, Y.D. Shining light on memory: Effects of bright light on working memory performance. Behav. Brain Res. Int. J. 2015, 294, 234–245. [Google Scholar] [CrossRef]
  32. Teplan, M. Fundamentals of EEG measurement. Meas. Sci. Rev. 2002, 2, 1–11. [Google Scholar]
  33. Choi, Y.; Kim, M.; Chun, C. Measurement of occupants’ stress based on electroencephalograms (EEG) in twelve combined environments. Build. Environ. 2015, 88, 65–72. [Google Scholar] [CrossRef]
  34. Shan, X.; Yang, E.H.; Zhou, J.; Victor, W.-C. Chang Human-building interaction under various indoor temperatures through neural-signal electroencephalogram (EEG) methods. Build. Environ. 2018, 129, 46–53. [Google Scholar] [CrossRef]
  35. Kim, H.; Hong, T.; Kim, J.; Yeom, S. A psychophysiological effect of indoor thermal condition on college students’ learning performance through EEG measurement. Build. Environ. 2020, 184, 107223. [Google Scholar] [CrossRef]
  36. Li, J.; Wu, W.; Jin, Y.; Bian, W. Research on environmental comfort and cognitive performance based on EEG+VR+LEC evaluation method in underground space. Build. Environ. 2021, 198, 107886. [Google Scholar] [CrossRef]
  37. Mansi, S.A.; Pigliautile, I.; Pisello, A.L. A novel methodology for human thermal comfort decoding via physiological signals measurement and analysis. Build. Environ. 2022, 222, 109385. [Google Scholar] [CrossRef]
  38. Wang, H.; Hou, K.; Kong, Z.; Guan, X.; Hu, S.; Lu, M.; Piao, X.; Qian, Y. In-Between Area” Design Method: An Optimization Design Method for Indoor Public Spaces for Elderly Facilities Evaluated by STAI, HRV and EEG. Buildings 2022, 12, 1274. [Google Scholar] [CrossRef]
  39. Lu, M.; Hu, S.; Mao, Z.; Liang, P.; Xin, S.; Guan, H. Research on Work Efficiency and Light Comfort Based on EEG Evaluation Method. Build. Environ. 2020, 183, 107122. [Google Scholar] [CrossRef]
  40. Shin, Y.-B.; Woo, S.-H.; Kim, D.-H.; Kim, J.; Kim, J.-J.; Park, J.Y. The effect on emotions and brain activity by the direct/indirect lighting in the residential environment. Neurosci. Lett. Int. Multidiscip. J. Devoted Rapid Publ. Basic Res. Brain Sci. 2015, 584, 28–32. [Google Scholar] [CrossRef]
  41. Min, B.-K.; Jung, Y.-C.; Kim, E.; Park, J.Y. Bright illumination reduces parietal EEG alpha activity during a sustained attention task. Brain Res. 2013, 1538, 83–92. [Google Scholar] [CrossRef]
  42. Park, J.Y.; Min, B.-K.; Jung, Y.-C.; Pak, H.; Jeong, Y.-H.; Kim, E. Illumination Influences Working Memory: An Eeg Study. Neurosci. Int. J. Under Editor. Dir. IBRO 2013, 247, 386–394. [Google Scholar] [CrossRef]
  43. Kuller, R.; Wetterberg, L. Melatonin, cortisol, EEG, ECG and subjective comfort in healthy humans: Impact of two fluorescent lamp types at two light intensities. Light. Res. Technol. 1993, 25, 71–80. [Google Scholar] [CrossRef]
  44. Kong, Z.; Hou, K.; Wang, Z.; Chen, F.; Li, Y.; Liu, X.; Liu, C. Subjective and Physiological Responses towards Interior Natural Lightscape: Influences of Aperture Design, Window Size and Sky Condition. Buildings 2022, 12, 1612. [Google Scholar] [CrossRef]
  45. Hsieh, M.-C.; Zhang, Y.-Q.; Dong, R.; Lee, Y.-C.; Ni, C.-y. Use of EEG signals, cortisol secretion, and task performance to evaluate the effects of different lighting environments on concentration level in a sustained attention task. Int. J. Ind. Ergon. 2022, 92, 103371. [Google Scholar] [CrossRef]
  46. Gollisch, T.; Meister, M. Eye Smarter than Scientists Believed: Neural Computations in Circuits of the Retina. Neuron 2010, 65, 150–164. [Google Scholar] [CrossRef]
  47. Xiaoling, L.; Zhengqin, Y.; Yuansheng, Y. Visual Neurophysiology; People’s Medical Publishing House: Beijing, China, 2011. [Google Scholar]
  48. Gazzaniga, M.S.; Ivry, R.B.; Mangun, G.R.; Steven, M.S. Cognitive Neuroscience: The Biology of the Mind; W. W. Norton & Company: New York, NY, USA; Oxford University Press: New York, NY, USA, 1998. [Google Scholar]
  49. Yang, L.; Ma, R.; Zhang, H.M.; Guan, W.; Jiang, S. Driving Behavior Recognition Using EEG Data from a Simulated Car-Following Experiment. Accid. Anal. Prev. 2018, 116, 30–40. [Google Scholar] [CrossRef]
  50. Cohen, M.X. Analyzing Neural Time Series Data: Theory and Practice; MIT Press: Cambridge, MA, USA, 2014. [Google Scholar]
  51. Buzsaki, G. Rhythms of the Brain; Oxford University Press: New York, NY, USA, 2006. [Google Scholar]
  52. Christoph, S. Human EEG responses to 1–100. Herrmann 2001, 137, 346–353. [Google Scholar] [CrossRef]
  53. Klimesch, W.; Russegger, H.; Doppelmayr, M.; Pachinger, T. A method for the calculation of induced band power: Implications for the significance of brain oscillations. Electroencephalogr. Clin. Neurophysiol. Evoked Potentials Sect. 1998, 108, 123–130. [Google Scholar] [CrossRef] [PubMed]
  54. Eroğlu, K.; Kayıkçıoğlu, T.; Osman, O. Effect of Brightness of Visual Stimuli on EEG Signals. Behav. Brain Res. 2020, 382, 112486. [Google Scholar] [CrossRef] [PubMed]
  55. Subramanian, S.K.; Gaur, G.S.; Narayan, S.K. Low Luminance/Eyes Closed and Monochromatic Stimulations Reduce Variability of Flash Visual Evoked Potential Latency. Ann. Indian Acad. Neurol. 2013, 16, 614–618. [Google Scholar] [CrossRef]
  56. Münch, M.; Plomp, G.; Thunell, E.; Kawasaki, A.; Scartezzini, J.L.; Herzog, M.H. Different Colors of Light Lead to Different Adaptation and Activation as Determined by High-Density EEG. NeuroImage 2014, 101, 547–554. [Google Scholar] [CrossRef]
  57. Passynkova, N.R.; Volf, N.V. Seasonal Affective Disorder: Spatial Organization of EEG Power and Coherence in the Depressive State and in Light-Induced and Summer Remission. Psychiatry Res. Neuroimaging 2001, 108, 169–185. [Google Scholar] [CrossRef]
  58. Hu, S.; Lu, M.; He, M.; Wang, G.; Liang, P.; Tong, L.; Liu, G. Research on the Light Comfort Characterization Method Based on Visual Evoked Potential Energy. Build. Environ. 2021, 197, 107831. [Google Scholar] [CrossRef]
  59. ASHRAE 55–2017; Thermal Environment Conditions for Human Occupancy, American Society of Heating. Ventilating and Air-Conditioning Engineers: Atlanta, GA, USA, 2017.
  60. ISO 7726; Ergonomics of the Thermal Environment—Instruments for Measuring Physical Quantities, Measurement of the Mean Radiant Temperature. Danish Standards Association: Charlottenlund, Denmark, 2001.
  61. ANSI/ASHRAE Standard 55; Thermal Environmental Conditions for Human Occupancy. ASHRAE: Atlanta, GA, USA, 2020.
  62. Iacomussi, P.; Radis, M.; Rossi, G.; Rossi, L. Visual comfort with LED lighting. Energy Procedia 2015, 78, 729–734. [Google Scholar] [CrossRef]
  63. Fu, Y.; Wu, Y.; Gao, W.; Hui, R. The Effect of Daylight Illumination in Nursing Buildings on Reading Comfort of Elderly Persons. Buildings 2022, 12, 214. [Google Scholar] [CrossRef]
  64. Zhang, J.; Lv, K.; Zhang, X.; Ma, M.; Zhang, J. Study of Human Visual Comfort Based on Sudden Vertical Illuminance Changes. Buildings 2022, 12, 1127. [Google Scholar] [CrossRef]
  65. Scarpina, F.; Tagini, S. The Stroop Color and Word Test. Front. Psychol. 2017, 8, 557. [Google Scholar] [CrossRef]
  66. Sanei, S.; Chambers, J. EEG Signal Processing; John Wiley & Sons: Hoboken, NJ, USA, 2007. [Google Scholar]
  67. Zhang, C.; Zheng, C.; Pei, X.; Ouyang, Y. Multiparametric EEG power spectroscopy analysis of physiological mental fatigue. J. Biomed. Eng. 2009, 26, 6. [Google Scholar]
  68. Baumeister, J.; Barthel, T.; Geiss, K.R.; Weiss, M. Influence of phosphatidylserine on cognitive performance and cortical activity after induced stress. Nutr. Neurosci. 2008, 11, 103–110. [Google Scholar] [CrossRef]
  69. Gola, M.; Magnuski, M.; Szumska, I.; Wróbel, A. EEG beta band activity is related to attention and attentional deficits in the visual performance of elderly subjects. Int. J. Psychophysiol. Off. J. Int. Organ. Psychophysiol. 2013, 89, 334–341. [Google Scholar] [CrossRef]
  70. Zhu, M.; Liu, W.; Wargocki, P. Changes in EEG signals during the cognitive activity at varying air temperature and relative humidity. J. Expo. Sci. Environ. Epidemiol. 2020, 30, 285–298. [Google Scholar] [CrossRef]
  71. Nawrocka, A.; Holewa, K. The Analysis of the Different Frequencies Sound Waves Effect on the EEG Signal. Diffus. Defect Data. Solid State Data Part B Solid State Phenom. 2014, 208, 177–182. [Google Scholar]
  72. Li, Z.G.; Di, G.Q.; Li, J. Relationship between Electroencephalogram Variation and Subjective Annoyance under Noise Exposure. Appl. Acoust. 2014, 75, 37–42. [Google Scholar] [CrossRef]
  73. Sun, Y.; Ye, N.; Wang, X.; Xu, X. The Research of EEG Analysis Methods Based on Sounds of Different Frequency. In Proceedings of the 2007 IEEE/ICME International Conference on Complex Medical Engineering, Beijing, China, 23–27 May 2007; pp. 1746–1751. [Google Scholar]
  74. Shan, X.; Yang, E.H.; Zhou, J.; ChangVictor, W.C. Neural-signal electroencephalogram (EEG) methods to improve human-building interaction under different indoor air quality. Energy Build. 2019, 197, 188–195. [Google Scholar] [CrossRef]
  75. Zhang, X.; Hu, S.; Song, P.; Ma, H.; Liu, R.; Lu, M.; Liu, G.; Liu, B.; Feature, L.T. and relationship between electroencephalogram power and salivary S-IgE concentration in healthy adults in different indoor temperatures. Build. Environ. 2021, 210, 108688. [Google Scholar] [CrossRef]
  76. Lievesley, R.; Wozencroft, M.; Ewins, D. The Emotiv EPOC neuroheadset: An inexpensive method of controlling assistive technologies using facial expressions and thoughts? J. Assist. Technol. 2011, 5, 67–82. [Google Scholar] [CrossRef]
  77. Li, X.; Chen, X.; Yan, Y.; Wei, W.; Wang, Z.J. Classification of EEG Signals Using a Multiple Kernel Learning Support Vector Machine. Sensors 2014, 14, 12784–12802. [Google Scholar] [CrossRef] [PubMed]
  78. Fauvel, S.; Ward, R.K. An Energy Efficient Compressed Sensing Framework for the Compression of Electroencephalogram Signals. Sensors 2014, 14, 1474–1496. [Google Scholar] [CrossRef] [PubMed]
  79. Delorme, A.; Makeig, S. EEGLAB: An open source toolbox for analysis of single-trial EEG dynamics including independent component analysis. J. Neurosci. Methods 2004, 134, 9–21. [Google Scholar] [CrossRef] [PubMed]
  80. Hyvarinen, A.; Oja, E. Independent Component Analysis: Algorithms and Applications. Neural Netw. 2000, 13, 411–430. [Google Scholar] [CrossRef]
  81. Van, L. Computational Frameworks for the Fast Fourier Transform; SIAM: Philadelphia, PA, USA, 1992. [Google Scholar]
  82. Murugappan, M.; Murugappan, S. Human emotion recognition through short time electroencephalogram (EEG) signals using fast Fourier transform(FFT). In Proceedings of the 2013 IEEE 9th International Colloquium on Signal Processing and its Applications, Kuala Lumpur, Malaysia, 8–10 March 2013; pp. 289–294. [Google Scholar]
  83. Zhonghua, G.; Stephen, L.; Yu, S.; Hai, Y. Visual alliesthesia: The gap between comfortable and stimulating illuminance settings. Build. Environ. 2014, 82, 42–49. [Google Scholar] [CrossRef]
  84. Guan, H.; Hu, S.; Lu, M.; He, M.; Zhang, X.; Liu, G. Analysis of human electroencephalogram features in different indoor environments. Build. Environ. 2020, 186, 107328. [Google Scholar] [CrossRef]
  85. Han, J.; Chun, C. Differences between EEG during thermal discomfort and thermal displeasure. Build. Environ. 2021, 204, 108220. [Google Scholar] [CrossRef]
  86. Lan, L.; Lian, Z. Use of Neurobehavioral Tests to Evaluate the Effects of IE on Productivity. First Int. Conf. Build. Energy Environ. 2009, 44, 2208–2217. [Google Scholar]
  87. Lan, L.; Lian, Z.; Pan, L.; Ye, Q. Neurobehavioral approach for evaluation of office workers’ productivity: The effects of room temperature. Build. Environ. 2009, 44, 1578–1588. [Google Scholar] [CrossRef]
  88. Cacioppo, J.T.; Tassinary, L.G. Principles of psychophysiology: Physical, social, and inferential elements. Princ. Psychophysiol. Phys. Soc. Inferent. Elem. 1990, 2, 23–33. [Google Scholar] [CrossRef]
  89. Reinhold, K.; Tint, P. Lighting of Workplaces and Health Risks. Elektron. Ir Elektrotechnika 2009, 90, 11–14. [Google Scholar]
  90. Joynt, R.J. Descartes’ Error—Emotion, Reason and the Human Brain. JAMA 1995, 273, 1463–1464. [Google Scholar] [CrossRef]
  91. Lafosse, E.; Wolffsohn, J.S.; Talens-Estarelles, C.; García-Lázaro, S. Presbyopia and the aging eye: Existing refractive approaches and their potential impact on dry eye signs and symptoms. Contact Lens Anterior Eye 2019, 43, 103–144. [Google Scholar] [CrossRef]
  92. Legge, G.E. Psychophysics of Reading in Normal and Low Vision; CRC Press: Boca Raton, FL, USA, 2006. [Google Scholar]
Figure 1. Layout of the artificial climate chamber.
Buildings 13 00467 g001
Figure 2. Layout of lamps.
Buildings 13 00467 g002
Figure 3. Task area measurement point layout.
Buildings 13 00467 g003
Figure 4. Subjective evaluation scale.
Buildings 13 00467 g004
Figure 5. Stroop test.
Buildings 13 00467 g005
Figure 6. Emotiv EPOC Flex (a) setup and (b) EEG electrode distribution.
Buildings 13 00467 g006
Figure 7. EEG processing.
Buildings 13 00467 g007
Figure 8. Experimental procedure.
Buildings 13 00467 g008
Figure 9. Data structure.
Buildings 13 00467 g009
Figure 10. Proportion of subjective evaluation population and scoring.
Buildings 13 00467 g010
Figure 11. Plt at different illuminances.
Buildings 13 00467 g011
Figure 12. Significant brain dot distribution: (a) δ band and (b) β band.
Buildings 13 00467 g012
Figure 13. P l of each channel: (a) δ band and (b) β band.
Buildings 13 00467 g013
Figure 14. P l of the δ band at the Cz channel with subjective evaluation under different illuminance.
Buildings 13 00467 g014
Figure 15. Cognitive task performance at different illuminances: (a) RT, (b) AC, and (c) PI.
Buildings 13 00467 g015aBuildings 13 00467 g015b
Table 1. Environmental parameter settings.
ParametersTemperature/°CRelative Humidity/%Air Speed/(m/s)Sound Pressure Level/(dB)
Set value24 ± 0.560 ± 50.05<40
Table 2. Experimental equipment.
InstrumentTypeDetectable RangeResolutionPhysical map
IlluminometerTES-136,
China
0.1 to 99,990 lux
0.1 to 9999 K
±0.02 lux/±0.02 KBuildings 13 00467 i001
Temperature and
humidity recorder
TR-72U,
Japan
−40 to 110 °C
10 to 95%RH
±0.3 °C/±5%Buildings 13 00467 i002
Hot-wire
anemometer
WFWZY-1,
China
0.05 to 30 m/s±(50%Va + 0.05) m/sBuildings 13 00467 i003
Sound-level meterTES-1357,
China
30 to 130 dB±1.5 dBBuildings 13 00467 i004
Table 3. Basic information of subjects.
MaleFemaleTotal
Age
Max312431
Min222222
Mean ± SD24.09 ± 0.4123.2 ± 0.3723.93 ± 0.35
Vision correction
Yes18321
No527
Table 4. EEG characteristics of different frequency fields.
WaveFrequency/HzBody State
δ0.5~4Extreme fatigue, deep sleep
θ4~8Blurred consciousness, sleepiness, mute
α8~13Relaxed, calm, eyes closed but awake
β13~30Thinking or processing information
Table 5. Sequence table of working cases.
Illuminance luxOrderABCDE
Subjects
1750500120030075
2120075075500300
3751200300750500
4300755001200750
5500300750751200
28300755001200750
Table 6. Subjective evaluation one-way ANOVA results.
Illuminance/luxN x ¯ ± s Fp
75282.67 ± 0.7018.560.000 **
300283.74 ± 0.68
500284.15 ± 0.52
750284.09 ± 0.66
1200283.57 ± 0.81
Notes: ** means p < 0.01.
Table 7. β-band One-Way ANOVA results.
ChannelIlluminance/luxN x ¯ ± s Fp
C375287.58 ± 0.332.770.031 *
300287.36 ± 0.26
500287.35 ± 0.34
750287.37 ± 0.25
1200287.49 ± 0.25
FC175287.53 ± 0.233.660.048 *
300287.35 ± 0.19
500287.41 ± 0.31
750287.45 ± 0.20
1200287.55 ± 0.28
Notes: * means p < 0.05.
Table 8. δ-band One-Way ANOVA results.
ChannelIlluminance/luxN x ¯ ± s Fp
C375288.27 ± 0.325.280.001 **
300288.08 ± 0.38
500287.81 ± 0.32
750288.01 ± 0.29
1200288.10 ± 0.39
Cz75288.27 ± 0.802.750.032 *
300287.94 ± 0.35
500287.87 ± 0.29
750287.91 ± 0.31
1200288.04 ± 0.36
FC175288.21 ± 0.462.450.050 *
300287.92 ± 0.43
500288.02 ± 0.42
750287.97 ± 0.23
1200288.22 ± 0.51
FC275288.16 ± 0.383.660.008 **
300287.89 ± 0.43
500287.81 ± 0.42
750287.84 ± 0.30
1200288.09 ± 0.39
Notes: * means p < 0.05; ** means p < 0.01.
Table 9. Correlation analysis results.
Statistics P l   of   Delta P l   of   Beta P l t
C3CzFC1FC2C3FC1
Light comfortCorrelation coefficient−0.892−0.983−0.697−0.908−0.927−0.566−0.980
Significance0.042 *0.003 **0.1910.033 *0.024 *0.3200.003 **
Notes: * means p < 0.05; ** means p < 0.01.
Table 10. Task evaluation indicator One-way ANOVA results.
StatisticsIlluminance/luxN x ¯ ± s Fp
Reaction Time (s)752845.90 ± 8.587.730.000 **
3002839.78 ± 8.06
5002836.91 ± 6.37
7502836.31 ± 5.78
12002837.36 ± 5.56
Accuracy (%)752891.43 ± 6.093.800.006 **
3002893.86 ± 6.93
5002897.85 ± 3.43
7502894.71 ± 5.66
12002896.15 ± 5.60
75282.10 ± 0.576.220.000 **
300282.49 ± 0.49
Performance Indicators (%/s)500282.68 ± 0.53
750282.68 ± 0.50
1200282.61 ± 0.48
Notes: ** means p < 0.01.
Table 11. Task stage P l t One-way ANOVA results.
Illuminance/luxN x ¯ ± s Fp
75289.89 ± 0.360.5180.722
300289.95 ± 0.37
500289.91 ± 0.35
750289.90 ± 0.29
12002810.02 ± 0.35
Disclaimer/Publisher’s Note: The statements, opinions and data contained in all publications are solely those of the individual author(s) and contributor(s) and not of MDPI and/or the editor(s). MDPI and/or the editor(s) disclaim responsibility for any injury to people or property resulting from any ideas, methods, instructions or products referred to in the content.

