1. Introduction
The earthquake performance of historical masonry structures tends to deteriorate day by day due to the seismic activities and other environmental effects they are exposed to throughout their lifetime. During an earthquake, wall failure usually occurs in the out-of-plane (OOP) direction before the walls reach their in-plane (IP) strength [
1,
2,
3,
4,
5,
6]. This weakness leading to the OOP damage of walls has been revealed by damage observations after earthquakes (
Figure 1) [
7,
8,
9]. Numerous OOP collapses have been reported, particularly in buildings without a diaphragm effect and with long unsupported wall lengths. This weak behavior of masonry is also due to its inherent mechanical characteristics, heterogeneity, anisotropy, and assembly deficiencies [
10]. However, there is a primary need for developing cost-effective tools for use in assessing the performance levels of historical masonry structures.
Research has focused on the OOP behavior of historical masonry structures in the recent decade. OOP loading tests are performed under static or dynamic loads, i.e., using an actuator [
11,
12,
13,
14,
15], an airbag [
16,
17,
18], or a shake table [
19,
20,
21]. Specimens prepared to represent the OOP behavior of historic masonry walls are often simplified due to laboratory limitations, e.g., the production of large-scale specimens and the complexity and size of the geometric properties of representative structures. For this cases, small-scale specimens were tested [
22,
23,
24]. However, since the response of brick-and-mortar phases forming the wall under lateral loading varies with the size of the specimen and the loading rates, it becomes more difficult to fulfill the requirements of similitude laws as the geometric scale becomes smaller. Moreover, even if the brick size and mortar thickness are properly reduced, small-scale masonry tends to be highly strong, but, also, highly flexible [
22]. Therefore, generally, subsystem tests were performed on full- or large-scale specimens [
16,
25,
26,
27].
Finite element (FE) modeling of masonry is still in development. Three main modeling approaches are being adopted, namely, macro, meso, and micro modeling [
1]. Even for meso-scale modeling, where nonlinear behavior is represented by interfaces, its use in the seismic assessment of the whole structure is not feasible due to its complexity and computational cost. Therefore, meso- and micro-scale models are preferred in research where detailed damage assessments are examined [
28,
29,
30]. The macro modeling approach is, thus, generally preferred in such large analyses, and the homogenization methods [
31] are emphasized. Although this approach is insufficient in determining local collapse mechanisms [
32], it has been shown that it simulates cracks that occur due to seismic actions on the structure properly. This explains why the macro modeling approach is generally preferred to obtain the global behavior of masonry structures [
18,
32,
33,
34,
35,
36,
37,
38]. However, when seismic assessment of historical masonry buildings modeled with macro elements is needed, it is seen that displacement-based metrics in the out-of-plane direction to determine the damage level of the walls are missing. Recently, out-of-plane drift limits have been proposed by Misir et al. (2022) as a common indicator of damage and for use in evaluating the performance levels of stone masonry walls during a non-linear analysis [
15].
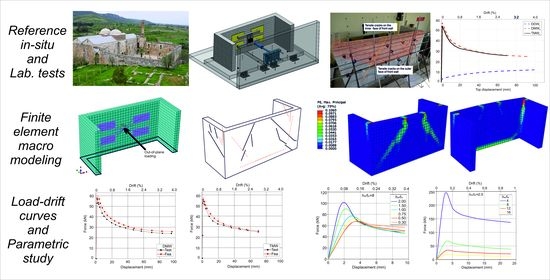
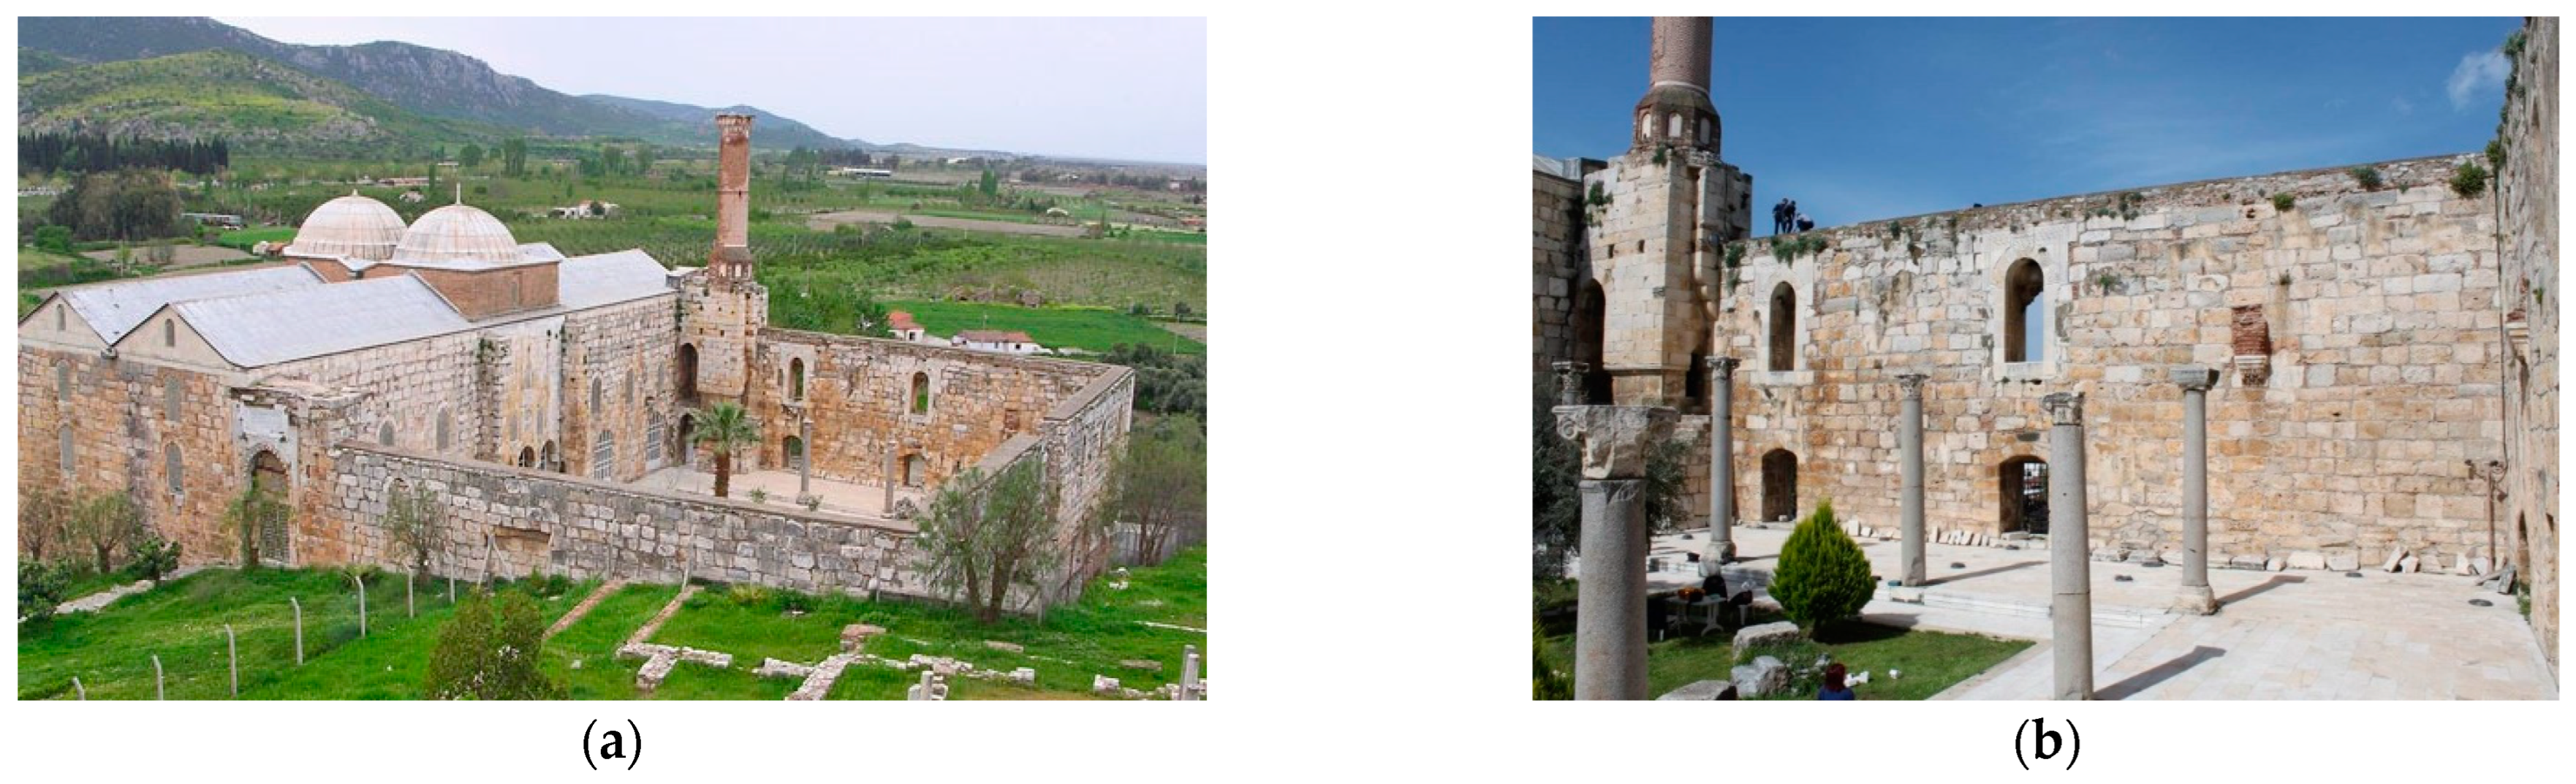
This paper mainly presents a nonlinear model updating work on macro-scale FE models calibrated based on both dynamic and quasi-static test data of large-scale stone masonry wall specimens tested in the OOP direction. Material model parameters, including the degrading strengths at post-peak, were obtained in the full range of responses. Moreover, the level of damage in the wall specimens and the numerical results were compared. Performance limits in terms of OOP drift ratios were used to assess the damage states of the models. The paper first summarizes the in situ mechanical and ambient vibration tests (AVT) on Isabey Mosque (
Figure 2), dated 1375, taken as the reference historical structure, and the dynamic and quasi-static cyclic OOP tests on three wall specimens representing the reference [
39]. Test data have been successfully used in nonlinear simulations of two U-shaped stone masonry wall specimens with the same geometry but different morphology (i.e., double-leaf DMW and three-leaf TMW mortared walls). Processing of AVT data with Operational Modal Analysis (OMA) allowed the estimation of elastic material parameters, and quasi-static tests allowed the determination of OOP load–drift responses leading to calibration in the nonlinear range by a set of nonlinear static pushover analyses. Finally, results of a parametric study aimed at generalizing the findings from these limited number of scaled tests were given.
2. Reference OOP Tests
The test data of three stone masonry wall specimens, namely, the double-leaf dry-jointed wall (DDW), the double-leaf wall with hydraulic lime mortar (DMW), and the three-leaf wall specimen with hydraulic lime mortar (TMW), were used in the simulations as the reference experimental data [
39]. The latter wall includes two outer stone leaves and a rubble infill layer as the third leaf.
Figure 3a and
Figure 3b show the geometries of the two- and three-leaf specimens, respectively. The specimens had 1/6 scale U-shaped geometry aimed at the interaction of the front and transverse walls interfering at steep corners. The specimens reflect the geometric and material properties of the reference historical structure, Isabey Mosque, such as the wall morphology, stone material type, mortar content and strength, rubble infill-to-total wall thickness ratio, total rows at wall height, aspect ratio and slenderness ratio. Additionally, the absence of lead clamps connecting the stones, overlapping features in wall-to-wall connections, and the absence of a rigid diaphragm effect are among the common features of the reference structure and the test specimens. The reference historical structure has walls of 1.8 m thick and up to 15 m high that surround the courtyard from its three sides [
39]. The test specimens reflect the geometry and boundary conditions of the west courtyard wall and transverse walls, with their long unsupported length (approx. 30 m) and relatively high structure as well as a lack of a slab. The specimens have similar morphologies to that of the reference structure, classified as “double-leaf wall with connection” up to medium height and “three-leaf wall” after medium height, according to the classification proposed by Binda et al. [
40] and Binda et al. [
41], as demonstrated by endoscopic examinations throughout the reference structure.
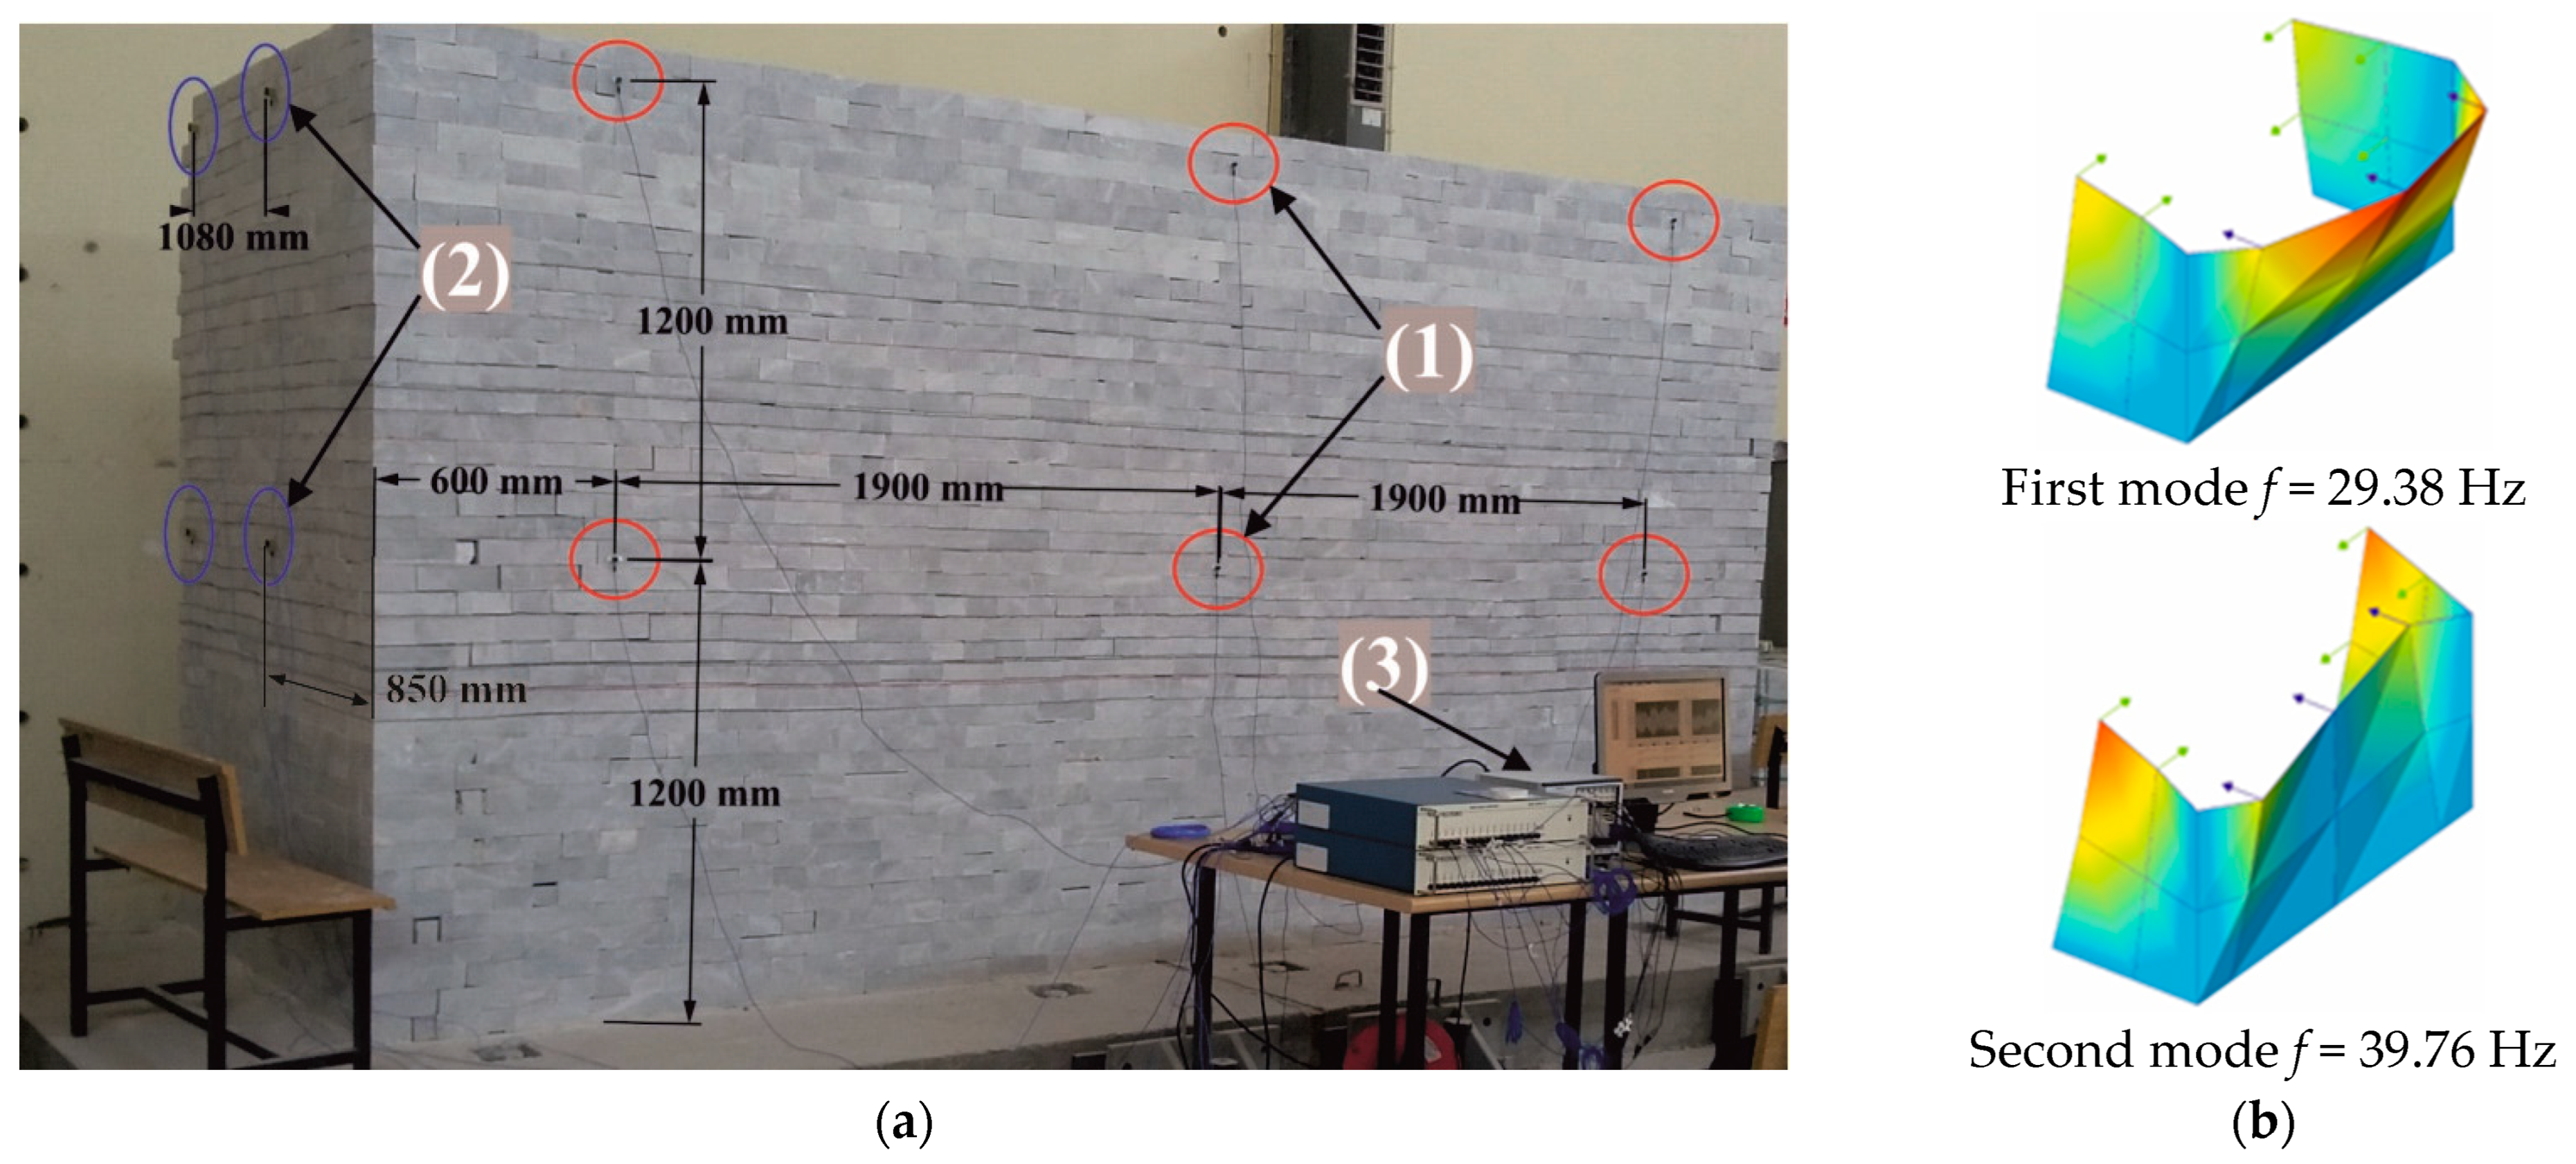
Using AVT data taken from the west and north courtyard walls of the reference structure, it was found that the dominant free vibration modes of the walls were in the OOP direction and the frequency corresponding to the first mode was 3.91 Hz [
38]. Reference specimens reflect the mean values of the modulus of elasticity and the uniaxial compressive strength of historic walls (4530 MPa and 2.30 MPa, respectively) obtained by semi-destructive flat-jack tests performed on the reference structure [
39]. The lime mortar used in the mortar jointed specimens reflects the content of the historic mortar and the mean compressive strength (2.30 MPa) of the reference structure. The initial shear strengths and the characteristic value of the internal friction angle of masonry units were f
voi = 0.35 MPa and α
k = 0.33 for 14-day-old samples, respectively. The specimens contained marble blocks with average compressive and tensile strengths of 94.2 and 14.6 MPa and an average density of 2710 kg/m
3. The results of AVT (
Figure 4) on the wall specimens were also used as reference data.
The specimens were tested under OOP loads representing the seismic inertial forces by applying the loads at four specific points on the front wall, as shown in
Figure 5a. Lateral loads generated by a hydraulic actuator were transferred to the wall at the intersection points of a 2 × 2 regular grid placed along one-third and two-thirds of the height and width of the wall. The loads were distributed on the wall with the help of a spreader beam and four semi-rigid plywood plates (each with an area of 500 × 800 mm
2). Target displacements were increased on the basis of the structural response of the specimens by a semi-cyclic procedure that resulted in the strength envelopes shown in
Figure 5b. No vertical load was applied to the top of the specimens, as in the reference structure. The vertical and horizontal axes represent, respectively, the resultant force applied to the center of the front wall and the OOP displacement measured at the top mid-span of the wall. DMW and TMW specimens behaved quite similarly regarding the strength envelopes, with a more stable damage state of DMW in higher drifts.
The wall specimens could exhibit a certain amount of bending deformation under out-of-plane displacement due to their slender structure and long unsupported spans. They also continued to carry loads up to relatively large drift ratios thanks to the cantilever behavior of the wall and quasi-static loading conditions. Both specimens showed a linear elastic branch up to the peak load and passed into a smooth softening behavior. Considering the OOP response of the specimens, DDW is far from the mortar jointed walls in terms of stiffness and strength, probably due to the lack of tensile strength that governs the whole behavior. The tests were stopped at the onset of the collapse of each specimen.
Figure 6 shows the global and local mechanisms in the wall and
Figure 7 shows the relationship between the load–drift response and the crack pattern obtained for the DMW specimen [
15]. The OOP limit states of the specimens could be identified (
Figure 7a) in terms of top drift ratio based on these observations, and proposed as 0.4%, 1.2%, and 3.2% for DMW corresponding to Damage Limitation (DL), Severe Damage (SD), and Near Collapse (NC) limit states, respectively. It should be noted that the recommended NC limit state of 3.2% [
15] is taken into account, although the maximum drift reached during the experiments shown was 3.8% in
Figure 7a.
3. Numerical Simulations
The seismic assessment of historical masonry structures, each with unique structural features, is a challenging task with complex material behavior, wall connection details, and boundary conditions. For this reason, it is necessary to adopt an adequate constitutive material model and update its properties with experimental data. Modeling masonry structures with the FE macro modeling approach is widely preferred because of its good consistency and low computational cost. Therefore, the numerical models in this paper have been set up on macro scale to be comparable with practical applications. Firstly, in this section, the adopted material model is introduced. Secondly, the numerical model was updated using the dynamic and static test data obtained in the laboratory. Then, nonlinear static pushover analyses were performed on the updated numerical models until the same ultimate top drifts were achieved in the quasi-static OOP tests. In the last section, parametric studies were conducted on the validated numerical model of DMW to examine the effect of material and geometric properties on the OOP behavior of a masonry wall. For frequency analysis, static test simulation, and parametric analysis, a total of 3, 2, and 10 simulations were run, respectively.
3.1. Adopted Material Model
Nonlinear FE analyses were performed on 3D numerical models in the ABAQUS software [
42] to simulate the OOP response of stone masonry wall specimens. The combined behavior of stone units and mortar joints in the wall specimens was represented by solid elements using the macro-scale modeling approach, which is computationally more efficient for constructing larger building models compared to micro and meso modeling [
1]. Some material model parameters have been updated and proposed for the use in practical engineering applications, based on the simulations of the OOP response and the limit states of the specimens. The Concrete Damage Plasticity model (CDP), defined in the ABAQUS material library, was used to simulate the nonlinear behavior of the specimens. This model, originally formulated to represent the behavior of quasi-brittle materials (i.e., concrete) under cyclic and dynamic loads [
43,
44], has been used in masonry modeling [
32,
33]. Under uniaxial tensile stresses, the material follows a linear branch up to tensile strength in accordance with the defined modulus of elasticity. Tensile strength corresponds to the point at which microcracks begin to form. The material follows the predefined stress–strain curve in the post-peak range. When the compressive and tensile stresses are exceeded, a reduction rule in the elastic stiffness governs the material (
Figure 8).
Uniaxial tensile and compressive stresses (
and
) are defined as follows:
where
is the initial modulus of elasticity,
and
are the scalar damage variables,
and
are total deformations, and
and
are the equivalent plastic deformations under tension and compression, respectively. The post-peak behavior under tension is defined as a function of the cracking strain, which is obtained by the following equation:
where
is the tensile elastic deformation. The equivalent tensile plastic deformation
and the elastic stiffness reduction can be obtained as follows:
where
and
are the function of stress and the elastic stiffness recovery factors, which can be calculated as follows:
In these equations,
and
are the material parameters expressing the stiffness recovery coefficients, and they remain between the values of ‘0’ denoting the absence of stiffness recovery and ‘1’ denoting the complete recovery.
is the Heaviside function defined as 0 for
and 1 for
. The default values of stiffness recovery coefficients for uniaxial cyclic behavior (tension-compression-tension) are
and
(
Figure 8c).
3.2. Construction and Calibration of Numerical Models
FE macro models of the specimens were constructed using eight-node hexahedral 3D solid elements (C3D8). FE mesh is shown with the OOP loading scheme in
Figure 9a. Fixed support was assumed at the base of the walls, as displacements were prevented at the bottom of the specimens confirmed by LVDT measurements. A mesh sensitivity analysis based on nine meshing options with different numbers of FEs was performed, and the results were compared in terms of the first mode frequencies of these models, as shown in
Figure 9b. As a result, the model was generated with 1762 FEs, resulting in a mesh size of 0.15 m (which is half the wall thickness) to achieve a fine demonstration of the strain and stress contour plots using the least number of elements for the sake of computational efficiency. By using four interconnected surfaces on the model, the displacement loading applied over four points on the front wall of the specimens could be simulated. These surfaces are connected to a reference point located at the midpoint of the front wall using a structural distribution couple following a quadratic weighting rule. This method is used to couple both the displacement and rotation of each attached point to the average displacement and rotation of the surface nodes within the influence radius [
45].
3.2.1. Linear Model Calibration
Calibration of the initial numerical model was carried out in two stages. In the first stage, the elastic material parameters of the model were manually calibrated using OMA results processed with AVT test data [
15]. The modal estimation was performed using the ARTeMIS software [
46] with the EFDD (Enhanced Frequency Domain Decomposition) analysis technique [
47]. In the calibration, the modulus of elasticity was chosen as the uncertain material parameter and was updated. Using the widely accepted expression in the literature [
48] E = [(200~1000) α fc] (where fc is the uniaxial compressive strength of the wall and a multiplier α is added to the expression to consider the scale effect), the upper limit of [1000 α fc] was taken as an initial value for the modulus of elasticity for mortar-jointed wall (DMW and TMW) models. The mean compressive strength of the mortar (2.1 MPa) for DMW and the average of the mean compressive strengths of the mortar (1.87 MPa) and rubble infill (2.96 MPa) for TMW were used as fc, and the initial value of the modulus of elasticity was calculated. For only the dry jointed wall (DDW) model, a value consistent with the static test results was assigned as the initial modulus of elasticity. The Poisson’s ratio was set to 0.25 for each specimen.
Table 1 summarizes the modulus of elasticity in both the initial and the updated numerical models, as well as the mass density. In the DMW and TMW models, the calibrated module successfully converged close to the upper limit (with 14% and 0.6% errors, respectively) of the expression above.
The first mode of vibration of each specimen was, as expected, an OOP mode. Among these specimens, the highest frequency value was for the TMW specimen. This result agrees with the greater values of initial stiffness obtained in TMW OOP test, which is detailed in
Section 3.3. The first two modes obtained by the dynamic tests and the numerical models have been compared in
Table 2. The Modal Assurance Criterion (MAC) is used to check the compliance of mode shapes obtained using OMA and FEA results. The updated models of DMW and TMW had a very low mean frequency error (<1%) in the first mode, and mean MAC values of 0.852 and 0.865 for the first and second modes compared to the tests. The small difference in the MAC values over the unit value is most likely due to the heterogeneity in the specimens, which cannot be considered in the numerical models. These highly acceptable MAC values show that the calibrated models can simulate the experimental modes quite satisfactorily and validate the models.
3.2.2. Nonlinear Model Calibration
The nonlinear behavior of the models was described by the Concrete Damaged Plasticity (CDP) material model proposed by Lubliner et al. (1989) [
43]. This material model, which was originally developed to represent concrete behavior under cyclic or dynamic loads, is also frequently used in studies that model the seismic behavior of historical masonry structures [
32,
33]. Material parameters assigned as defaults are given in
Table 3. In this table, ‘dilation angle’ is the angle that expresses the change in the volume of the element under shear stresses; ‘σbo/σco’ refers to the ratio of the initial biaxial compressive strength to the initial uniaxial compressive strength, and ‘K’ refers to the ratio between the secondary stress constants in the tension and compression regions [
45]. The mortar strengths were directly taken from the tests by Misir et al. (2022) [
15]. In the DMW specimen, the average tensile (from the two-point bending test) and compressive strengths of the mortar on the wall on test day were found to be 0.43 MPa and 2.10 MPa, respectively. For the TMW specimen, these mortar strengths were found to be 0.31 MPa and 1.87 MPa, respectively. Assigned compressive and tensile strengths are given in
Table 4. The tensile strength was taken as 5% of the compressive strength [
18], while the compressive strength was taken as the mean value of the mortar samples tested on the wall test day. The strain sequence in the table was adopted from Valente and Milani (2019) [
32] and the degrading values of strengths were calibrated by a series of nonlinear static pushover analyses detailed in the following section.
3.3. Nonlinear Static Pushover Analysis and the Comparison of Results with the OOP Tests
A series of nonlinear static pushover analyses in the OOP direction was performed on the updated wall models. Analyses were performed using the implicit solver in the ABAQUS software [
42]. Two static analysis steps were defined based on the default fully automatic time incrementation. Each analysis was conducted by first applying the self-weight of the wall, followed by applying a four-point displacement load as in the tests. The nonlinear equilibrium equations were solved by the full Newton technique. The loading surfaces shown in
Figure 9, representing the semi-rigid load distribution plates as used in the OOP testing, were defined in four corresponding areas in the model to enable the simulation of quasi-static loading over four synchronized points.
Figure 10 shows the numerical load–drift response compared to the experimental envelopes of the DMW and TMW specimens. The models showed results that were quite consistent with the experimental findings. The narrow linear rising region in the elastic range shows that both the specimens and models exhibited a rather brittle behavior. The initial stiffnesses estimated by the updating of the DMW and TMW models using dynamic data were slightly higher (16% and 4%, respectively) than the initial stiffnesses determined by the static tests for this region. Since this is related to the elastic parameters of the models, the analysis up to this stage allowed us to evaluate the compatibility of ambient vibration and the elastic part of the static test results. It was determined in the nonlinear analysis that the dominant model parameter affecting the load capacity was the tensile strength. For both structural models, the load capacity was successfully achieved with an assigned tensile strength of 5% of the compressive strength of the mortar. Numerical and experimental results agree in the post-peak interval, but there are examples in the literature that the numerical post-peak curve drops sharply than in the experiment [
49,
50]. However, the lateral forces are calculated to be slightly larger for the calibrated models in this paper. This result is appropriate since the strength degradation due to cyclic loads applied during the tests lowers the envelope curve slightly below the monotonic pushover curve. Due to quite different structural response of dry-jointed DDW specimen as shown in
Figure 5b, a comparable numerical behavior for this specimen with the use of the CDP material model could not be obtained in the inelastic range, and numerical analyses were performed only for the mortar-jointed specimens for use in comparisons.
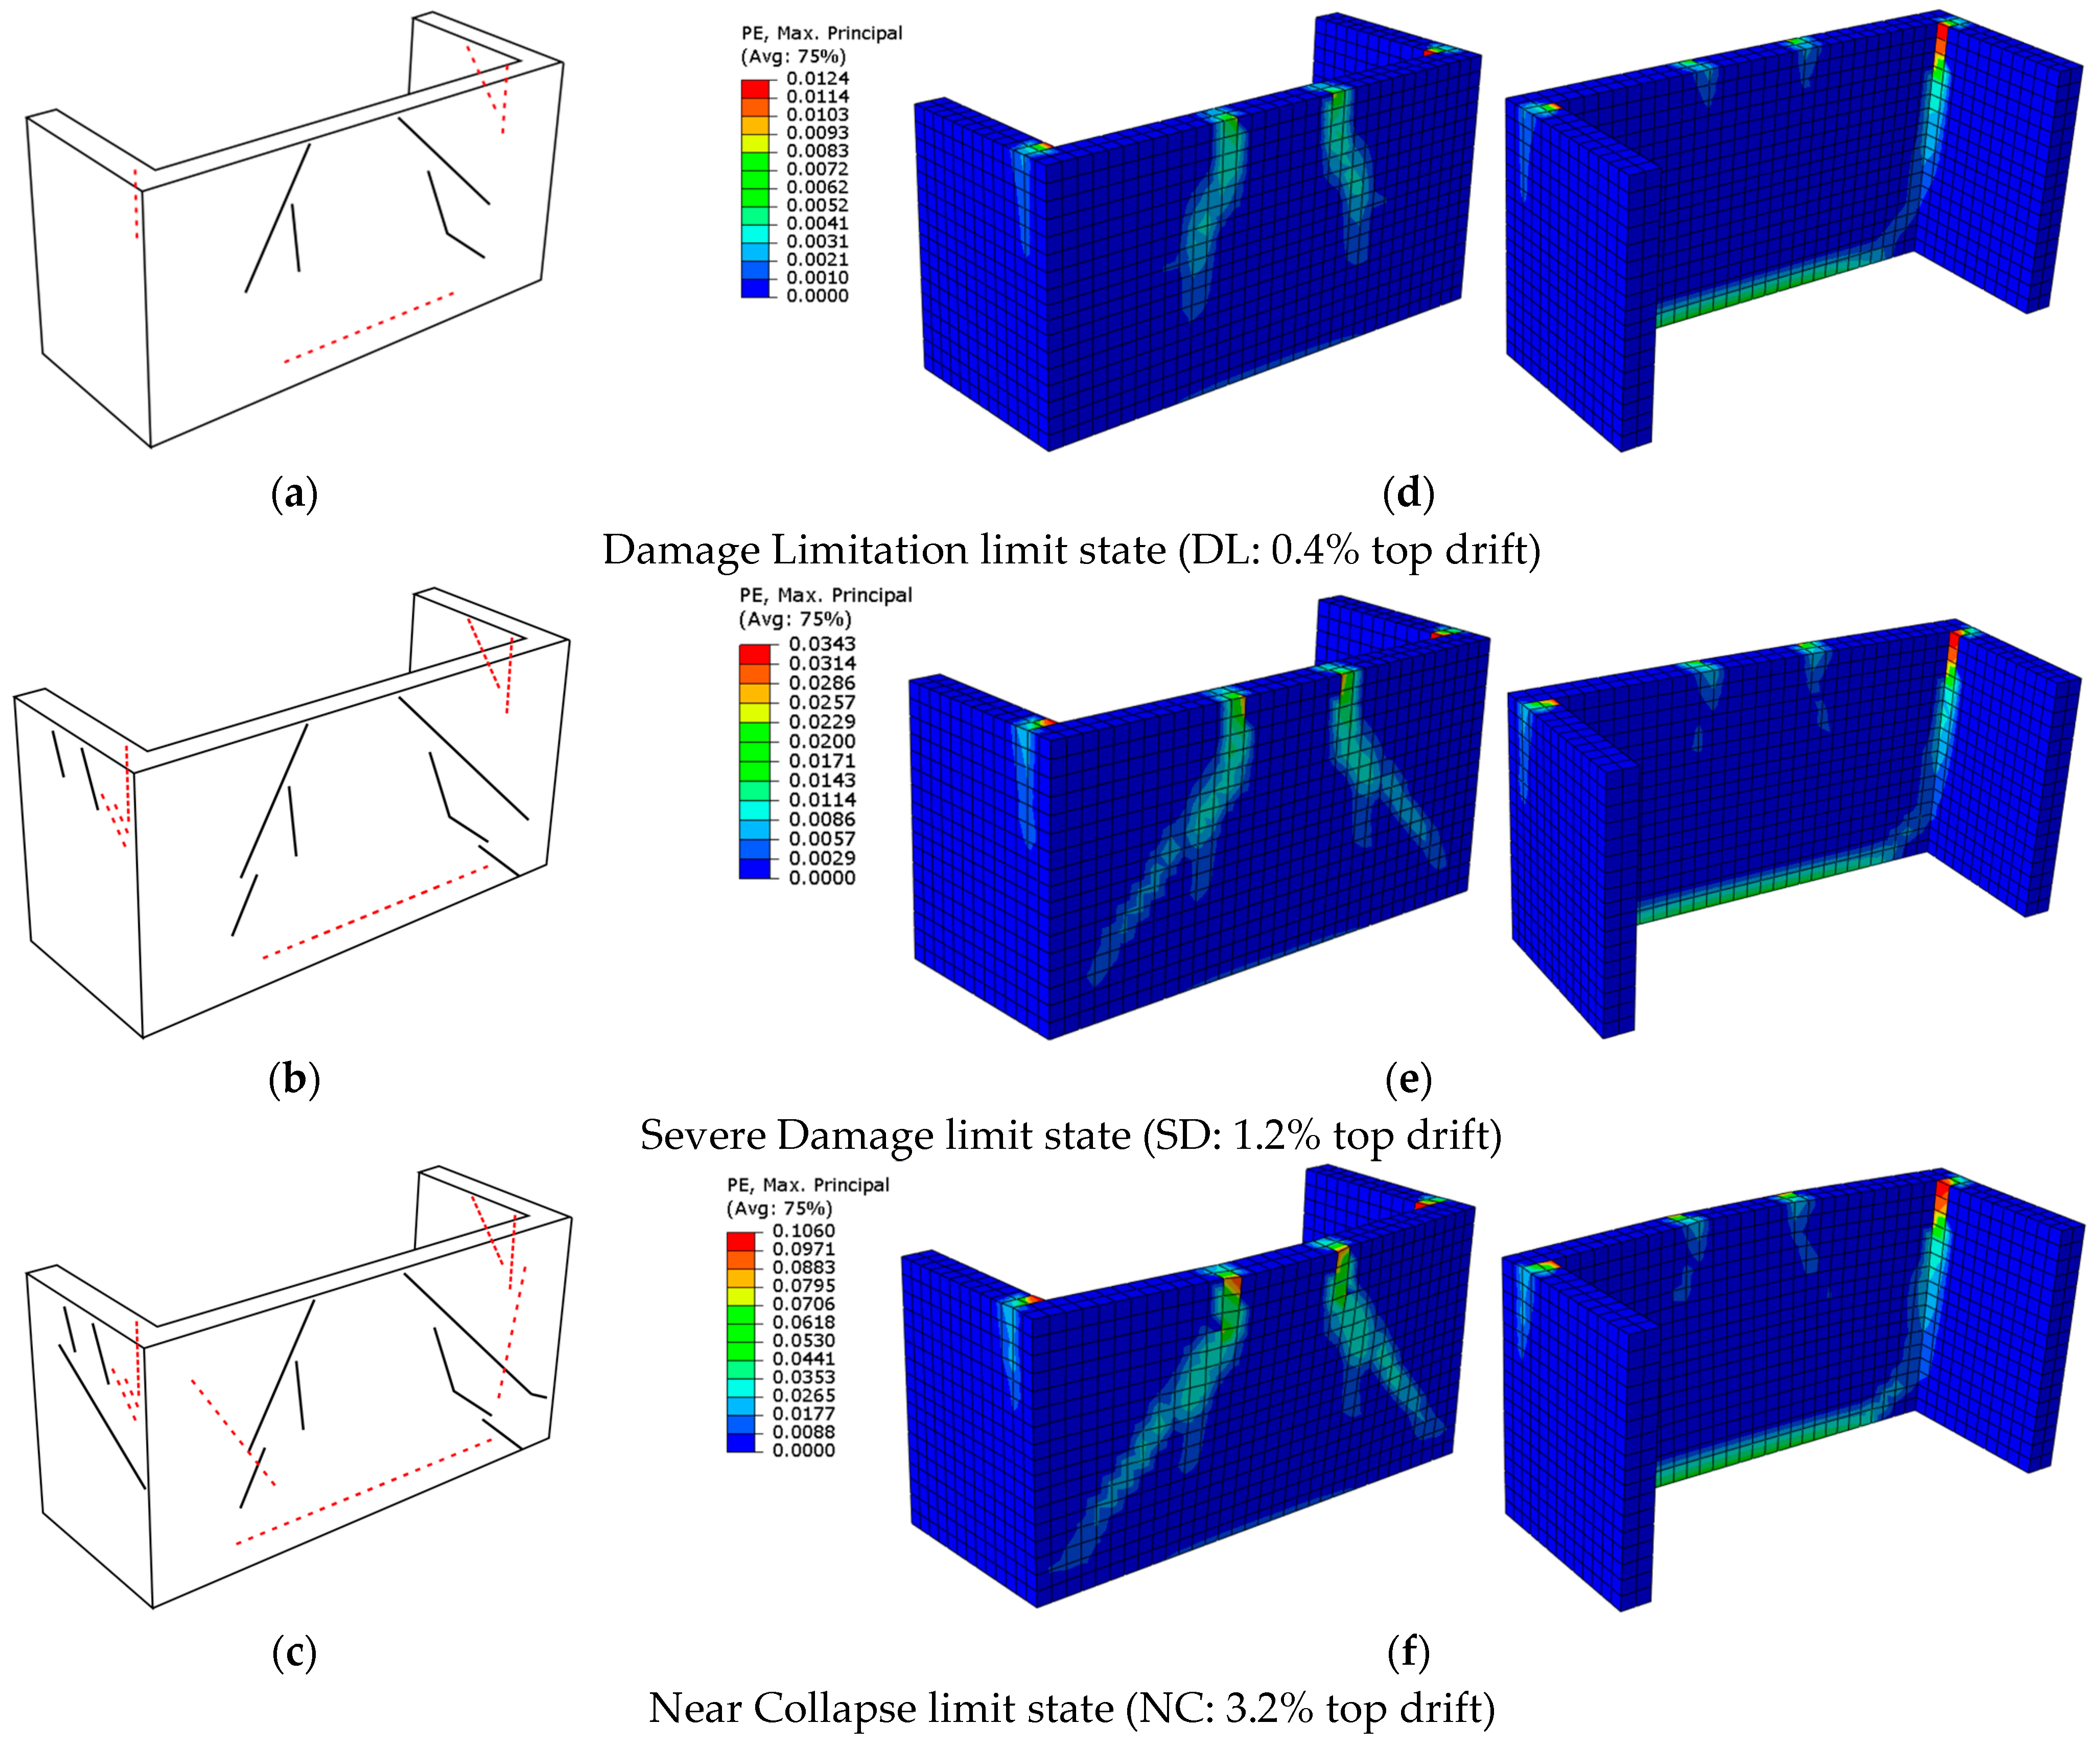
Experimental cracks and the maximum principal strains (PE) obtained by the numerical model of DMW are compared in
Figure 11. Since the models representing the mortar jointed specimens showed similar results, only the plots for the DMW model are evaluated in detail. The crack distributions of the DMW obtained in the tests are drawn for the three top drifts associated with the Damage Limitation (DL: 0.4% top drift), Severe Damage (SD: 1.2% top drift), and the Near Collapse (NC: 3.2% top drift) limit states in
Figure 11a–c. The dashed lines in the figures show the damage on the inner face of the wall. The results show that the regions with large strains, shown in
Figure 11d–f, can be associated well with the experimental crack distribution. Although the stepped cracks following the edges of the masonry units cannot be simulated by their natures with the macro modeling technique, it can be concluded that possible damaged areas can be determined using a maximum principal strains (PE) counterplot. However, there is one more problem. Although cracks and the maximum principal strains are compatible with each other, it is very difficult to make a performance-based assessment, as the current overall damage state of the wall is not clear (e.g., whether the mechanism state has occurred). With this motivation, it seems reasonable to read the numerical analysis results using the achieved max. top drift ratios and to determine the performance level using this indicator for further efforts.
Table 5 shows the numerical and experimental results, which are comparable in terms of initial stiffness and ultimate lateral load values, indicating the success of the calibration. The initial stiffness values given in the table for the experimental and numerical cases also reflect a comparison of dynamic and static tests, since the modulus of elasticity, which determines the initial stiffness of the models, was found by model calibration using OMA. An average of 6.6% difference was determined between the load capacities. Comparing the initial stiffness and the ultimate lateral force for the two cases, it can be said that the numerical models represent experimental behavior with good consistency. However, probably due to the structure of the material model used in the numerical simulations, a practical ultimate strain (leading a drift capacity for the wall model) could not be assigned to the material model that still allows the numerical models to run stable. For example, the drift capacity, which was quite different in the DMW and TMW tests, could not be reached during the analysis of the relevant models, as shown in the table. The lack of the numerical drift capacity of the FE macro models appears to be one of the major disadvantages for performance-based seismic evaluation studies, but it can be compensated for by using drift limits based on experimental observations and numerical validations.
3.4. Parametric Study
In this section, the results of a parametric analysis performed on the validated DMW model to examine the effect of different materials and geometric properties on the OOP behavior of the masonry wall are evaluated. The effects of six different aspect ratios (wall height to length; h
w/l
w: 2, 1.5, 1, 0.75, 0.5, 0.3), four different slenderness ratios (wall height to thickness; h
w/t
w: 4, 8, 12, 16), three different tensile strengths (ft: 0.05, 0.1, 0.2) and two different geometric scales (s: 1/1 (reference building wall), 1/6 (test wall)) on the global response of the wall were investigated. The aspect ratio and slenderness ratio parameters were chosen within the recommended range in Eurocode 6 Annex E [
51] and applied by keeping the wall height constant. The geometric scale parameter was defined by considering the 1/1 scale reference building wall and the 1/6 scale laboratory specimens. Static pushover analyses were performed as described in the previous section, with the only difference being uniformly distributed loading on the inner surface of the front wall instead of four-point surface loading. It was determined by preliminary analysis that this uniform loading, which represents the airbag loading, results in a load–displacement response and damage distribution quite similar to the type of loading used in the tests presented in this study. The results of the parametric analysis were evaluated over the load–displacement curves and the strain distributions.
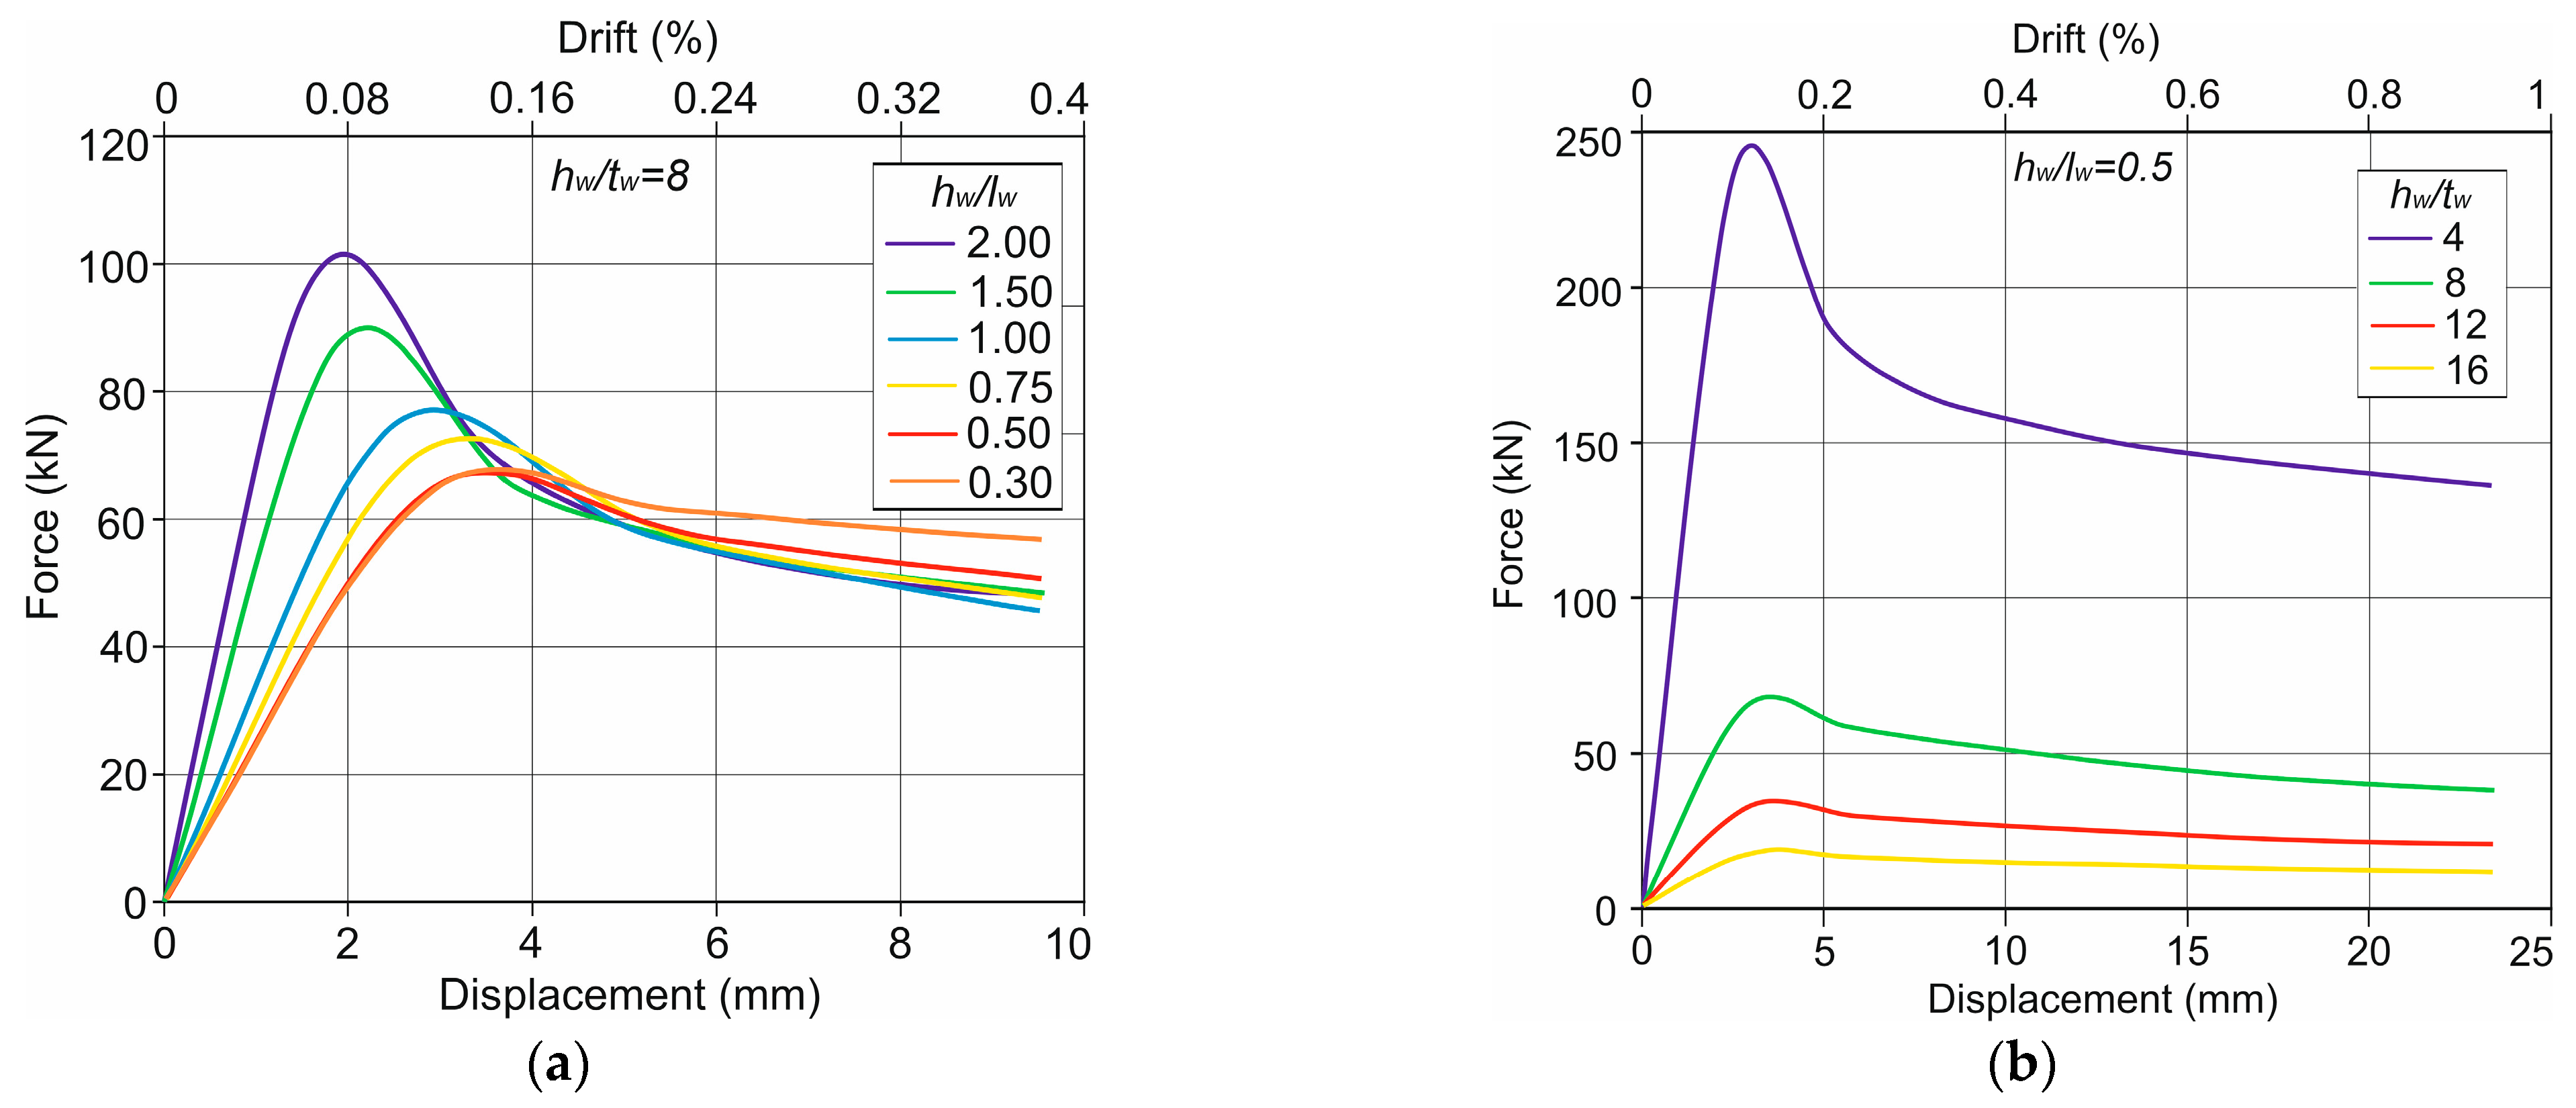
Figure 12 shows the effect of aspect and slenderness ratios on the load–drift response of the wall models. The graphs were plotted by zooming into the small displacement region to see the differences between the curves more clearly. The results primarily show that the parameters discussed here have a significant impact on OOP behavior. The initial stiffness and load capacity are directly proportional to the aspect ratio and inversely proportional to the slenderness ratio. In other words, since the wall height was kept constant, the initial stiffness and load capacity decreased as the wall length increased and the thickness decreased. Therefore, parameters that improve the behavior of the wall in stiffness and load capacity (i.e., higher aspect and lower slenderness ratios) also tend to make the wall brittle and vice versa.
For example, as can be seen from
Figure 12a, initial stiffness and load capacity of the model AR = 0.3 are determined as 22.7 kN/mm and 63.7 kN, while these parameters are determined for AR = 2.0 model as 60.1 kN/mm and 102.4 kN. A 6.67-fold increase in AR increased the stiffness and load capacity by 2.65 and 1.61 times, respectively. However, the displacement ductility (µ = 6.1 for AR = 0.3 and µ = 1.5 for AR = 2.0) decreased approx. four times, considering the ultimate capacity and a 20% decrease in this value. Additionally, it can be seen from
Figure 12a that for the range of 0.3 to 1.0 in AR, the load–displacement responses of the walls are similar, and the OOP drift limits specified in
Section 3.3 may still apply for this range of AR (further analysis is needed).
As can be seen from
Figure 12b, initial stiffness and load capacity of the model for SR = 16 are determined as 5.72 kN/mm and 16.8 kN, while these parameters of the model for SR = 4 are determined as 92.8 kN/mm and 283.3 kN. A four-fold decrease in SR increased the stiffness and the load capacity by 16.2 and 16.9 times, respectively, indicating a higher sensitivity for the slenderness ratio. However, the displacement ductility (µ = 6.7 for SR = 16 and µ = 2 for SR = 4), decreased approx. 3.35 times, indicating a lower sensitivity to changes in the slenderness ratio relative to stiffness and load capacity. In addition, since the load–displacement response of the walls is very sensitive to the change in slenderness, as can be seen from
Figure 12b, it has been evaluated that the drift limits suggested in
Section 3.3 may be suitable for walls with a slenderness ratio of around 8, as in the tests.
Principle strain distributions calculated for the wall models were compared in
Figure 13 and
Figure 14 for two different geometries and two damage states (i.e., DL limit state: 0.4% drift and NC limit state: 3.2% drift) as examples. The initiation of damage causing the separation of the front wall from the transverse walls and the horizontal bending crack at the inner toe of the front wall observed during the tests (for test specimen AR = 0.5) could be simulated accurately in the numerical models. As the aspect ratio increases, the damage on the upper cone of the front wall turns into a straight-line crack extending from the lower corners to the top middle of the wall. This indicates the change in the resisting mechanism from vertical connections to the base of the front wall. Additionally, the bending effects were increased which contributed to the top drift of the wall and caused a decrease in principal strain demands on the vertical connections (
Figure 13). At low slenderness, the damage was concentrated in the wall connections (by comparing the max principal strains), as the front wall has a more rigid overall behavior (
Figure 14). The bending effects were increased again in the more slender wall case, leading to a reduction in principal strain demands on the vertical connections.
Since the tensile damage has a dominant effect on the masonry walls, the change in tensile strength has a direct effect on the load capacity of the wall. For tensile strengths of 0.05, 0.1, and 0.2, load capacities of 42.4, 64.3, and 103.3 (kN), initial stiffnesses of 14.5, 22.7, and 37.2 (kN/mm) were obtained, respectively. These changes are approximately consistent with Cauchy’s scale factors [
18]. For the six times larger model (i.e., 1/1 reference building wall) in which the geometric scale effect was investigated, a 39 times greater load capacity agreed mostly with the Cauchy’s scale factor. In addition, the damage distributions and the maximum principal strain values obtained for the 1/1 and 1/6 scale models were similar.
4. Conclusions
Macro-scale finite element (FE) models were constructed and calibrated based on the dynamic and quasi-static test data of large-scale stone masonry wall specimens. This was conducted to better understand the possible use of displacement-based damage metrics in evaluating the OOP response of masonry walls. Damage level in the wall specimens and the drift limits were correlated in accordance with the structural assessment methodology, for use in evaluating the seismic performance of historical masonry structures. Performance limits in terms of OOP drift ratios were used as a common indicator of the damage while assessing the current state of the structural performance of numerical models representing masonry walls.
Test data have been successfully used in nonlinear simulations of two U-shaped stone masonry wall specimens with the same geometry but a different morphology (i.e., double-leaf DMW and three-leaf TMW mortared walls). AVT enabled the estimation of elastic material parameters, and quasi-static tests allowed the determination of OOP load–drift responses leading to calibration in the nonlinear range. The calibrated modulus of elasticity in the mortar-jointed wall models was estimated to be close to E = 1000 fc. The load capacity and the envelope curve in the post-peak range were successfully simulated for the mortar-jointed wall models with an assigned tensile strength equal to 5% of the average compressive strength of the mortar. The dominant model parameter affecting the peak lateral load was the tensile strength in mortar jointed specimens. As a result, the modulus of elasticity, and the tensile and compressive degrading strength parameters of masonry walls were calibrated and proposed by a series of nonlinear static pushover analyses.
Although the maximum principal strain profile in the calibrated models showed a similar damage distribution compared to experimental crack patterns, it was very difficult to make a performance-based assessment as the current overall damage state of the wall was unclear. Since a practical ultimate strain cannot be assigned to the material model, which limits the overall drift capacity of the wall models, it is proposed to use drift limits to determine the damage states in FE macro models for a performance-based seismic assessment. The experimental OOP drift limits of 0.4%, 1.2%, and 3.2% corresponding to Damage Limitation (DL), Severe Damage (SD), and Near Collapse (NC) limit states were used to assess the performance level successfully.
A parametric study was conducted on the calibrated DDW model to examine the effects of different materials and geometric properties (tensile strength, aspect ratio, slenderness ratio, and geometric scale) on the OOP behavior of masonry walls. Parameters that improve the wall behavior in terms of stiffness and load capacity (i.e., higher aspect and lower slenderness ratios) also tend to make the wall brittle. A 6.67-fold increase in the aspect ratio increased the stiffness and load capacity by 2.65 and 1.61 times but decreased the displacement ductility by 4 times. Because the load–drift response of the walls was similar for the aspect ratios in the range of 0.3 to 1.0, it was evaluated that the OOP drift limits proposed based on the tests may still apply for this range of aspect ratios (further analysis is needed). A four-fold decrease in the slenderness ratio increased the stiffness and the load capacity by 16.2 and 16.9 times, respectively, indicating a higher sensitivity for the slenderness ratio. The load capacities determined for various assigned tensile strengths were consistent with Cauchy’s scale factors. For the six times larger model (i.e., 1/1 reference building wall), which was constructed to investigate the effects of geometric scale, load capacity agreed mostly with the Cauchy’s scale law and resulted in maximum principal strains very similar for the 1/1 and 1/6 scale models, showing the potential for the use of drift limits on 1/1 scale. Note that the relatively higher deformation capacities, which were observed on a limited number of scaled wall specimen tests in laboratory conditions, should be reduced with proper safety factors even for use in preliminary structural assessments. Analysis under different conditions such as wall types, boundary conditions, and loading conditions (e.g., axial load, in-plane load, etc.) can be performed as a future work.
Author Contributions
Conceptualization, I.S.M. and G.Y.; methodology, I.S.M. and G.Y.; software, G.Y.; validation, I.S.M.; formal analysis, G.Y.; investigation, I.S.M. and G.Y.; resources, I.S.M. and G.Y.; data curation, I.S.M.; writing—original draft preparation, I.S.M. and G.Y.; writing—review and editing, I.S.M. and G.Y.; visualization, G.Y.; project administration, I.S.M.; funding acquisition, I.S.M. All authors have read and agreed to the published version of the manuscript.
Funding
This research was funded by AFAD, grant number UDAP-C-16-05.
Data Availability Statement
Some or all test data, models, or photos that support the findings of this study are available from the corresponding author upon reasonable request.
Acknowledgments
The authors thank the Disaster & Emergency Management Presidency of Tür-kiye (AFAD) National Earthquake Research Program for their financial support.
Conflicts of Interest
The authors declare no conflict of interest.
References
- Lourenço, P.B. Computational Strategies for Masonry Structures. Ph.D. Thesis, TU Delft, Delft University of Technology, Delft, The Netherlands, 1996. [Google Scholar]
- Augenti, N.; Parisi, F. Learning from Construction Failures Due to the 2009 L’Aquila, Italy, Earthquake. J. Perform. Constr. Facil. 2010, 24, 536–555. [Google Scholar] [CrossRef]
- Dizhur, D.; Ingham, J.; Moon, L.; Griffith, M.; Schultz, A.; Senaldi, I.; Magenes, G.; Dickie, J.; Lissel, S.; Centeno, J.; et al. Performance of Masonry Buildings and Churches in the 22 February 2011 Christchurch Earthquake. Bull. N. Zeal. Soc. Earthq. Eng. 2011, 44, 279–296. [Google Scholar] [CrossRef]
- Shawa, O.A.; de Felice, G.; Mauro, A.; Sorrentino, L. Out-of-Plane Seismic Behaviour of Rocking Masonry Walls. Earthq. Eng. Struct. Dyn. 2012, 5, 949–968. [Google Scholar] [CrossRef]
- Penna, A.; Morandi, P.; Rota, M.; Manzini, C.F.; da Porto, F.; Magenes, G. Performance of Masonry Buildings during the Emilia 2012 Earthquake. Bull. Earthq. Eng. 2014, 12, 2255–2273. [Google Scholar] [CrossRef]
- Milani, G.; Valente, M. Failure Analysis of Seven Masonry Churches Severely Damaged during the 2012 Emilia-Romagna (Italy) Earthquake: Non-Linear Dynamic Analyses vs Conventional Static Approaches. Eng. Fail. Anal. 2015, 54, 13–56. [Google Scholar] [CrossRef]
- Bovo, M.; Barbaresi, A.; Torreggiani, D.; Tassinari, P. Collapse and Damage to Vernacular Buildings Induced by 2012 Emilia Earthquakes. Bull. Earthq. Eng. 2020, 18, 1049–1080. [Google Scholar] [CrossRef]
- Calderoni, B.; Cordasco, E.A.; Del Zoppo, M.; Prota, A. Damage Assessment of Modern Masonry Buildings after the L’Aquila Earthquake. Bull. Earthq. Eng. 2020, 18, 2275–2301. [Google Scholar] [CrossRef]
- Stepinac, M.; Lourenço, P.B.; Atalić, J.; Kišiček, T.; Uroš, M.; Baniček, M.; Šavor Novak, M. Damage Classification of Residential Buildings in Historical Downtown after the ML5.5 Earthquake in Zagreb, Croatia in 2020. Int. J. Disaster Risk Reduct. 2021, 56, 102140. [Google Scholar] [CrossRef]
- Costa, A.A. Seismic Assessment of the Out-of-Plane Performance of Traditional Stone Masonry Walls. PhD. Thesis, University of Porto, Porto, Portugal, 2012. [Google Scholar]
- Bean Popehn, J.R.; Schultz, A.E.; Lu, M.; Stolarski, H.K.; Ojard, N.J. Influence of Transverse Loading on the Stability of Slender Unreinforced Masonry Walls. Eng. Struct. 2008, 30, 2830–2839. [Google Scholar] [CrossRef]
- Misir, I.S.; Ozcelik, O.; Girgin, S.C.; Yucel, U. The Behavior of Infill Walls in RC Frames Under Combined Bidirectional Loading. J. Earthq. Eng. 2016, 20, 559–586. [Google Scholar] [CrossRef]
- De Risi, M.T.; Di Domenico, M.; Ricci, P.; Verderame, G.M.; Manfredi, G. Experimental Investigation on the Influence of the Aspect Ratio on the In-Plane/out-of-Plane Interaction for Masonry Infills in RC Frames. Eng. Struct. 2019, 189, 523–540. [Google Scholar] [CrossRef]
- Corradi, M.; Speranzini, E.; Bisciotti, G. Out-of-Plane Reinforcement of Masonry Walls Using Joint-Embedded Steel Cables. Bull. Earthq. Eng. 2020, 18, 4755–4782. [Google Scholar] [CrossRef]
- Misir, I.S.; Yucel, G.; Kuran, F.; Eser, C.B.; Aldemir, O.; Topcu, S. Experimental Out-of-Plane Damage Limits of Historical Stone Masonry Walls. Constr. Build. Mater. 2022, 333, 127098. [Google Scholar] [CrossRef]
- Derakhshan, H.; Griffith, M.C.; Ingham, J.M. Airbag Testing of Multi-Leaf Unreinforced Masonry Walls Subjected to One-Way Bending. Eng. Struct. 2013, 57, 512–522. [Google Scholar] [CrossRef]
- Dolatshahi, K.M.; Aref, A.J. Multi-Directional Response of Unreinforced Masonry Walls: Experimental and Computational Investigations. Earthq. Eng. Struct. Dyn. 2016, 45, 1427–1449. [Google Scholar] [CrossRef]
- Maccarini, H.; Vasconcelos, G.; Rodrigues, H.; Ortega, J.; Lourenço, P.B. Out-of-Plane Behavior of Stone Masonry Walls: Experimental and Numerical Analysis. Constr. Build. Mater. 2018, 179, 430–452. [Google Scholar] [CrossRef]
- Giaretton, M.; Dizhur, D.; Ingham, J.M. Dynamic Testing of As-Built Clay Brick Unreinforced Masonry Parapets. Eng. Struct. 2016, 127, 676–685. [Google Scholar] [CrossRef]
- Graziotti, F.; Tomassetti, U.; Sharma, S.; Grottoli, L.; Magenes, G. Experimental Response of URM Single Leaf and Cavity Walls in Out-of-Plane Two-Way Bending Generated by Seismic Excitation. Constr. Build. Mater. 2019, 195, 650–670. [Google Scholar] [CrossRef]
- Senaldi, I.E.; Guerrini, G.; Comini, P.; Graziotti, F.; Penna, A.; Beyer, K.; Magenes, G. Experimental Seismic Performance of a Half-Scale Stone Masonry Building Aggregate. Bull. Earthq. Eng. 2020, 18, 609–643. [Google Scholar] [CrossRef]
- Petry, S.; Beyer, K. Testing Unreinforced Masonry Structures at Reduced Scale. In Proceedings of the 15th World Conferences on Earthquake Engineering, Lisbon, Portugal, 24–28 September 2021; p. 9. [Google Scholar]
- Sigmund, V.; Penava, D. Influence of Openings, with and without Confinement, on Cyclic Response of Infilled R-C Frames—An Experimental Study. J. Earthq. Eng. 2014, 18, 113–146. [Google Scholar] [CrossRef]
- Anić, F.; Penava, D.; Guljaš, I.; Sarhosis, V.; Abrahamczyk, L. Out-of-Plane Cyclic Response of Masonry Infilled RC Frames: An Experimental Study. Eng. Struct. 2021, 238, 112258. [Google Scholar] [CrossRef]
- Ferreira, T.M.; Costa, A.A.; Arêde, A.; Gomes, A.; Costa, A. Experimental Characterization of the Out-of-Plane Performance of Regular Stone Masonry Walls, Including Test Setups and Axial Load Influence. Bull. Earthq. Eng. 2015, 13, 2667–2692. [Google Scholar] [CrossRef]
- Vintzileou, E.; Mouzakis, C.; Adami, C.E.; Karapitta, L. Seismic Behavior of Three-Leaf Stone Masonry Buildings before and after Interventions: Shaking Table Tests on a Two-Storey Masonry Model. Bull. Earthq. Eng. 2015, 13, 3107–3133. [Google Scholar] [CrossRef]
- Candeias, P.X.; Campos Costa, A.; Mendes, N.; Costa, A.A.; Lourenço, P.B. Experimental Assessment of the Out-of-Plane Performance of Masonry Buildings through Shaking Table Tests. Int. J. Archit. Herit. 2017, 11, 31–58. [Google Scholar] [CrossRef]
- Senthivel, R.; Lourenço, P.B. Finite Element Modelling of Deformation Characteristics of Historical Stone Masonry Shear Walls. Eng. Struct. 2009, 31, 1930–1943. [Google Scholar] [CrossRef]
- Chácara, C.; Mendes, N.; Lourenço, P.B. Simulation of Shake Table Tests on Out-of-Plane Masonry Buildings. Part (IV): Macro and Micro FEM Based Approaches. Int. J. Archit. Herit. 2017, 11, 103–116. [Google Scholar] [CrossRef]
- D’Altri, A.M.; de Miranda, S.; Castellazzi, G.; Sarhosis, V. A 3D Detailed Micro-Model for the in-Plane and out-of-Plane Numerical Analysis of Masonry Panels. Comput. Struct. 2018, 206, 18–30. [Google Scholar] [CrossRef]
- Milani, G.; Lourenço, P.B. A Simplified Homogenized Limit Analysis Model for Randomly Assembled Blocks Out-of-Plane Loaded. Comput. Struct. 2010, 88, 690–717. [Google Scholar] [CrossRef]
- Valente, M.; Milani, G. Damage Assessment and Collapse Investigation of Three Historical Masonry Palaces under Seismic Actions. Eng. Fail. Anal. 2019, 98, 10–37. [Google Scholar] [CrossRef]
- Meoni, A.; D’Alessandro, A.; Cavalagli, N.; Gioffré, M.; Ubertini, F. Shaking Table Tests on a Masonry Building Monitored Using Smart Bricks: Damage Detection and Localization. Earthq. Eng. Struct. Dyn. 2019, 48, 910–928. [Google Scholar] [CrossRef]
- Murano, A.; Ortega, J.; Vasconcelos, G.; Rodrigues, H. Influence of Traditional Earthquake-Resistant Techniques on the out-of-Plane Behaviour of Stone Masonry Walls: Experimental and Numerical Assessment. Eng. Struct. 2019, 201, 109815. [Google Scholar] [CrossRef]
- Angiolilli, M.; Gregori, A. Triplet Test on Rubble Stone Masonry: Numerical Assessment of the Shear Mechanical Parameters. Buildings 2020, 10, 49. [Google Scholar] [CrossRef]
- Argiento, L.U.; Celano, T.; Ceroni, F.; Casapulla, C. Modelling Strategies for the In-Plane Behaviour of Iron-Framed Masonry Structures: Parametric Analysis on Simple Panels and a Church Façade. Int. J. Archit. Herit. 2022, 16, 1006–1031. [Google Scholar] [CrossRef]
- Viale, N.; Ventura, G.; Lourenço, P.B.; Ortega, J. Linear and Non-Linear FEM Analyses to Assess a Shear Flat-Jack Test for Masonries. J. Build. Eng. 2021, 43, 103169. [Google Scholar] [CrossRef]
- Ozcelik, O.; Misir, I.S.; Yucel, U.; Durmazgezer, E.; Yucel, G.; Amaddeo, C. Model Updating of Masonry Courtyard Walls of the Historical Isabey Mosque Using Ambient Vibration Measurements. J. Civ. Struct. Health Monit. 2022, 12, 1157–1172. [Google Scholar] [CrossRef]
- Misir, I.S.; Ozcelik, O.; Durmazgezer, E.; Yucel, U.; Amaddeo, C.; Kuran, F.; Tuna, E.; Yucel, G.; Youssouf, I.B. Determination of Damage Limits for Out-of-Plane Earthquake Effects in Existing Historic and New Masonry Buildings in Turkey; Project ID: UDAP-C-16-05; AFAD—UDAP: Izmir, Turkey, 2020. (In Turkish) [Google Scholar]
- Binda, L.; Modena, C.; Baronio, G.; Abbaneo, S. Repair and Investigation Techniques for Stone Masonry Walls. Constr. Build. Mater. 1997, 11, 133–142. [Google Scholar] [CrossRef]
- Binda, L.; Cardani, G.; Saisi, A. A Classification of Structures and Masonries for the Adequate Choice of Repair. In Proceedings of the International RILEM Workshop on Repair for Historic Masonry, Delft, The Netherlands, 26–28 January 2005; pp. 20–34. [Google Scholar]
- ABAQUS. Dassault Systemes Simulia Corp.: Jonhston, RI, USA, 2017. Available online: https://www.3ds.com/products-services/simulia/products/abaqus/ (accessed on 3 February 2023).
- Lubliner, J.; Oliver, J.; Oller, S.; Onate, E. A Plastic-Damage Model. Int. J. Solids Struct. 1989, 25, 299–326. [Google Scholar] [CrossRef]
- Jeeho, L.; Fenves, G.L. Plastic-Damage Model for Cyclic Loading of Concrete Structures. J. Eng. Mech. 1998, 124, 892–900. [Google Scholar]
- Simulia Abaqus 6.11 Theory Manual. Provid. RI, USA DS SIMULIA Corp. 2017. Available online: https://help.3ds.com/2017x/English/DSDoc/FrontmatterMap/DSDocHome.htm?contextscope=onpremise, (accessed on 3 February 2022).
- ARTeMIS. Extractor Pro, Structural Vibration Solutions. Aalborg, Denmark, 2016. Available online: https://svibs.com/ (accessed on 3 February 2022).
- Brincker, R.; Zhang, L.; Andersen, P. Modal Identification of Output-Only Systems Using Frequency Domain Decomposition. Smart Mater. Struct. 2001, 10, 441–445. [Google Scholar] [CrossRef]
- Tomazevic, M. Earthquake-Resistant Design of Masonry Buildings; World Scientific: Singapore, 1999; Volume 1, ISBN 978-1-86094-066-8. [Google Scholar]
- Karimi Ghaleh Jough, F.; Golhashem, M. Assessment of Out-of-Plane Behavior of Non-Structural Masonry Walls Using FE Simulations. Bull. Earthq. Eng. 2020, 18, 6405–6427. [Google Scholar] [CrossRef]
- Chang, L.Z.; Rots, J.G.; Esposito, R. Influence of Aspect Ratio and Pre-Compression on Force Capacity of Unreinforced Masonry Walls in out-of-Plane Two-Way Bending. Eng. Struct. 2021, 249, 113350. [Google Scholar] [CrossRef]
- Eurocode 6: Design of Masonry Structures, Part 1-1: General Rules for Reinforced and Unreinforced Masonry Structures; European Committee for Standardization: Brussels, Belgium, 2012.
Figure 1.
Recent OOP collapse mechanisms in masonry structures (
a) flexure damage [
7], (
b,
c) OOP rocking damage of unsupported walls [
8,
9].
Figure 1.
Recent OOP collapse mechanisms in masonry structures (
a) flexure damage [
7], (
b,
c) OOP rocking damage of unsupported walls [
8,
9].
Figure 2.
(
a) A general view of Isabey Mosque and (
b) the inside view of the West courtyard wall [
38].
Figure 2.
(
a) A general view of Isabey Mosque and (
b) the inside view of the West courtyard wall [
38].
Figure 3.
Stone unit layout for (a) double-leaf wall specimen (dimensions in mm) and (b) three-leaf wall specimen (the middle of the wall was filled with rubble).
Figure 3.
Stone unit layout for (a) double-leaf wall specimen (dimensions in mm) and (b) three-leaf wall specimen (the middle of the wall was filled with rubble).
Figure 4.
(a) AVT setup (1: front wall accelerometers shown inside the red circles, 2: left transversal wall accelerometers shown inside the blue circles, 3: data acquisition system), and (b) first two free vibration modes of the DMW specimen.
Figure 4.
(a) AVT setup (1: front wall accelerometers shown inside the red circles, 2: left transversal wall accelerometers shown inside the blue circles, 3: data acquisition system), and (b) first two free vibration modes of the DMW specimen.
Figure 5.
(a) OOP test setup, and (b) load–drift response of wall specimens.
Figure 5.
(a) OOP test setup, and (b) load–drift response of wall specimens.
Figure 6.
Observed damage in the DMW specimen (a) inner and outer face bending cracks on the front wall (dashed and continuous lines, respectively) and (b) tensile cracks (within the rectangle).
Figure 6.
Observed damage in the DMW specimen (a) inner and outer face bending cracks on the front wall (dashed and continuous lines, respectively) and (b) tensile cracks (within the rectangle).
Figure 7.
(
a) Load–drift response, and (
b) crack pattern in the DMW specimen [
15].
Figure 7.
(
a) Load–drift response, and (
b) crack pattern in the DMW specimen [
15].
Figure 8.
Tension (a), compression (b), and uniaxial cyclic (c) behavior of the CDP.
Figure 8.
Tension (a), compression (b), and uniaxial cyclic (c) behavior of the CDP.
Figure 9.
(a) FE mesh and the coupled surfaces (purple areas) for four-point loading in the models, (b) mesh convergence plot based on the natural frequency of the first mode.
Figure 9.
(a) FE mesh and the coupled surfaces (purple areas) for four-point loading in the models, (b) mesh convergence plot based on the natural frequency of the first mode.
Figure 10.
Experimental and numerical load–drift curves for (a) DMW and (b) TMW.
Figure 10.
Experimental and numerical load–drift curves for (a) DMW and (b) TMW.
Figure 11.
Comparison of experimental cracks (a–c) and the principal strains (d–f) corresponding to limit states determined for the DMW.
Figure 11.
Comparison of experimental cracks (a–c) and the principal strains (d–f) corresponding to limit states determined for the DMW.
Figure 12.
Influence of the (a) aspect ratio (for hw/tw = 8) and (b) slenderness ratio (for hw/lw = 0.5) on the load–drift response.
Figure 12.
Influence of the (a) aspect ratio (for hw/tw = 8) and (b) slenderness ratio (for hw/lw = 0.5) on the load–drift response.
Figure 13.
The influence of the aspect ratio (AR) on the strain distribution of the wall.
Figure 13.
The influence of the aspect ratio (AR) on the strain distribution of the wall.
Figure 14.
The influence of the slenderness ratio (SR) on the strain distribution of the wall.
Figure 14.
The influence of the slenderness ratio (SR) on the strain distribution of the wall.
Table 1.
Elastic material properties of initial FE models and the results of model updating.
Table 1.
Elastic material properties of initial FE models and the results of model updating.
| | DDW Model | DMW Model | TMW Model |
|---|
| Material Properties | Initial | Updated | Initial | Updated | Initial | Updated |
|---|
Modulus of elasticity,
E (MPa) | 200 | 233 | 12,600 | 10,873 | 14,400 | 14,485 |
Mass density
(kg/m3) | 2456 | - | 2508 | - | 2446 | - |
Table 2.
Comparison of experimental and numerical mode shapes.
Table 3.
The default parameters of CDP Material Model.
Table 3.
The default parameters of CDP Material Model.
| Dilation Angle | Eccentricity | σbo/σco | K |
|---|
| 10° | 0.1 | 1.16 | 0.666 |
Table 4.
Data points assigned for the nonlinear behavior of the CDP model.
Table 4.
Data points assigned for the nonlinear behavior of the CDP model.
| Compressive | Tensile |
|---|
Yield Stress
(MPa) | Inelastic Strain | Yield Stress
(MPa) | Inelastic Strain |
|---|
| DMW | TMW | | DMW | TMW | |
| 2.0 | 1.8 | 0 | 0.105 | 0.095 | 0 |
| 2.1 | 1.9 | 0.005 | 0.075 | 0.063 | 0.00025 |
| 1.0 | 0.9 | 0.010 | 0.040 | 0.045 | 0.00057 |
| 0.5 | 0.5 | 0.031 | 0.012 | 0.036 | 0.00121 |
Table 5.
Numerical and experimental results in terms of initial stiffness (Kini), ultimate lateral load (Fm) and drift capacities (Dm).
Table 5.
Numerical and experimental results in terms of initial stiffness (Kini), ultimate lateral load (Fm) and drift capacities (Dm).
| | Experimental Results | Numerical Results | Error (%) |
|---|
| | Kini
(kN/mm) | Fm
(kN) | Dm
(%) | Kini
(kN/mm) | Fm
(kN) | Dm
(%) | Kini | Fm | Dm |
|---|
| DMW | 46.9 | 56.8 | 3.2 | 54.7 | 60.1 | n/a | 16.6 | 5.8 | n/a |
| TMW | 50.7 | 53.7 | 2.2 | 53.0 | 57.7 | n/a | 4.5 | 7.4 | n/a |
| Disclaimer/Publisher’s Note: The statements, opinions and data contained in all publications are solely those of the individual author(s) and contributor(s) and not of MDPI and/or the editor(s). MDPI and/or the editor(s) disclaim responsibility for any injury to people or property resulting from any ideas, methods, instructions or products referred to in the content. |
© 2023 by the authors. Licensee MDPI, Basel, Switzerland. This article is an open access article distributed under the terms and conditions of the Creative Commons Attribution (CC BY) license (https://creativecommons.org/licenses/by/4.0/).


