Abstract
Scholars have examined the relationship between destination accessibility and various pedestrian-friendly environments in neighborhoods. However, there have been few studies on whether micro-scale environmental features promote access to supermarkets. This study fills these gaps by examining the accessibility of supermarkets and the meso- and micro-scale environmental features. In particular, environmental features that pedestrians can experience at the eye-level were estimated using the Naver pedestrian direction API and semantic segmentation technique. Multivariate regression models were employed to determine whether neighborhoods with high supermarket accessibility ensure walkable environments for the elderly. Our findings have shown that the walkability differs according to different levels of supermarket accessibility. Neighborhoods with high supermarket accessibility had high density and high diversity, and they provided high-quality sidewalk pavement. Conversely, elderly residents in neighborhoods with low accessibility had to pass through more pedestrian crossing facilities and steep slopes to go to do their shopping. These results can provide insight to policymakers and planners about the uneven accessibility of supermarkets and help improve neighborhood walkability for the elderly.
1. Introduction
Cities strive to build pedestrian-friendly neighborhoods and encourage walking for daily travel [1]. These policies are based on the theoretical framework that urban forms and travel behaviors are interrelated. In particular, dense, diverse, and walkable neighborhoods have a high association with walking [2,3,4]. However, even though scholars presented models for describing urban forms related to walking, it is difficult to explain due to the uncertainty of adequate spatial parameter measurements [5].
Scholars have suggested various environmental factor combinations, but they have not reached an overall agreement on what is most appropriate [6,7,8,9]. Some studies have measured theses environmental characteristics by dividing them into three scales: macro-, meso-, and micro-scale [10]. The macro-scale can be described as the regional scale, meso-scale as the neighborhood scale, and the micro-scale can be measured at street-level.
Urban residents use a variety of transportation modes to travel, but the elderly are often forced to walk because driving or using public transportation is difficult due to physical disabilities and economic limitations [7,8,9]. The general aging process involves natural changes in physical abilities [6]. These changes can put pressure on the elderly in terms of their walking behaviors, such as their ability to cross the road or climb stairs. Hence, older adults are more likely to experience poor environmental accessibility [7,10]. In addition, the pedestrian environment can be as important as the travel distance for older residents in high-density cities [11,12]; the quality of the route that a pedestrian must follow may be the most important [13].
The impact of the meso-scale built environment on a pedestrian’s walking behavior has been a point of emphasis [11]. The meso-level environment is measured by “D variables”, following the iconic concept proposed by Cevero and Kockelman [6]. These variables consist of housing density (density), land use diversity (diversity), and street network patterns (design). Urban designers have also suggested that micro-scale environmental factors can have a significant impact on pedestrian behavior. However, measuring micro-scale factors objectively and reliably takes considerable effort and time, so few studies have dealt with them [11].
Crossing facilities, one of many micro-scale environmental factors, allow pedestrians to cross the road; however, pedestrians may be unwilling to cross at these designated areas for a variety of reasons, leading to informal road crossing behavior [12]. In particular, elderly pedestrians may have a relatively strong aversion to crossing facilities due to long crossing times and fear of accidents and crime [13]. Qualitative research on this topic provided evidence for the negative impact of physical barriers on access [14]. However, few quantitative studies have explored the impact of pedestrian facilities on access [15]. Some studies have focused on another micro-scale environmental feature, represented as the eye-level streetscape, which may have correlations with walking behaviors as a satisfier or barrier [16,17]. The streetscape at eye level, including the sidewalk pavement, walls, fences, and trees on streets, can affect walkability and travel behavior [18]. Hence, along with the meso-scale environmental features that scholars have emphasized, this study further identifies the relationship between accessibility and the pedestrian environment based on specifying the micro-scale environmental characteristics at pedestrians’ eye level.
In response to the development of location-based services (LBSs) and computer vision techniques, a growing number of studies have applied new methodologies to examine micro-scale environments. Pedestrians can also be provided with an optimal route through pedestrian direction services [19]. Using a pedestrian direction service, it is possible to estimate which route a pedestrian will travel and which pedestrian facilities they will encounter. Additionally, a semantic segmentation technique relying on computer vision techniques can objectively measure street environmental characteristics in wide spatial areas; previously, this relied on labor-intensive field audits [17,20].
The supermarket is an important destination and going there is a daily nonwork travel activity for many people in Korea [21]. According to the Consumer Behavior Survey for Foods (CBSF) by the Korea Rural Economic Institute (KREI), 53.4% of the elderly in Korea buy groceries at supermarkets, and 52.9% choose supermarkets because they are the closest [22]. Additionally, unlike other younger adults, the elderly choose commercial facilities that provide more social interaction opportunities [23]. Supermarkets in Korea not only sell groceries; they also serve as the center of social interaction among the elderly in a neighborhood [21,24]. Online shopping has been popularized due to the development of distribution technology and information and communication, but 93.3% of elderly Koreans have not yet used online shopping [22]. Hence, nearby supermarkets are the most important neighborhood amenities that should be walkable for the elderly in Korea.
We empirically explore the impact of environmental factors at different scales on elderly residents’ accessibility to supermarkets. This paper focuses on the meso-scale and micro-scale environmental factors. The macro-scale, which has a significant impact on travel behavior, mainly deals with the characteristics of the entire metropolitan area, such as urban sprawl and the notion of a compact city [2]. However, local accessibility, such as supermarket accessibility, is relatively less affected by the macro factors due to its dependence on short-distance walking. Along with logic related to the meso-scale environmental features (i.e., D variables), we further examined the micro-scale environmental factors at pedestrian eye level using deep learning-based image semantic segmentation methods. Here, we analyzed supermarket accessibility using the pedestrian direction service. A spatial error regression model was used to identify the relationships between the supermarket accessibility of neighborhoods and various environmental characteristics. To the best of our knowledge, there is no study empirically exploring the association between micro-scale environmental elements and accessibility for the elderly based on the application of LBS or computer vision techniques, even though it is important to understand walkable features affecting older adults. This study comprehensively examines the environmental characteristics of neighborhoods with high and low supermarket access in consideration of both the micro-scale and meso-scale environmental characteristics.
2. Materials and Methods
2.1. Study Area
This paper adopted Seoul as our study case since it is one of the most densely populated cities in Korea. Seoul’s population density of 16,086 people per square kilometer in 2021 was higher than that of many other world cities, including London (6481/km2), Paris (3877/km2), New York City (1779/km2), and even Singapore (11,436/km2) [25]. The elderly make up 16.8% of the total population of Seoul, and this proportion has increased by 60% in the last ten years. Figure 1 shows the natural topography of Seoul. Since many large and small mountains, hills, and rivers are distributed in Seoul, the actual density within habitable land is actually much higher, and sometimes this topography affects access to various facilities. As Seoul’s population grows and its area expands, the Seoul Metropolitan Government has paved a corresponding road network for vehicles. Therefore, pedestrians can cross roads through long crosswalks, overpasses, and underpasses. However, hills and intermittent crossing facilities can make it difficult for elderly pedestrians to walk.
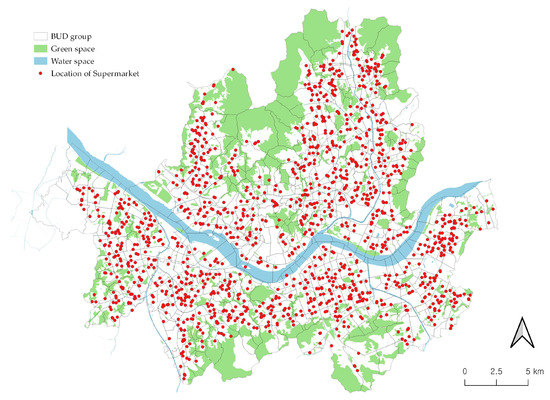
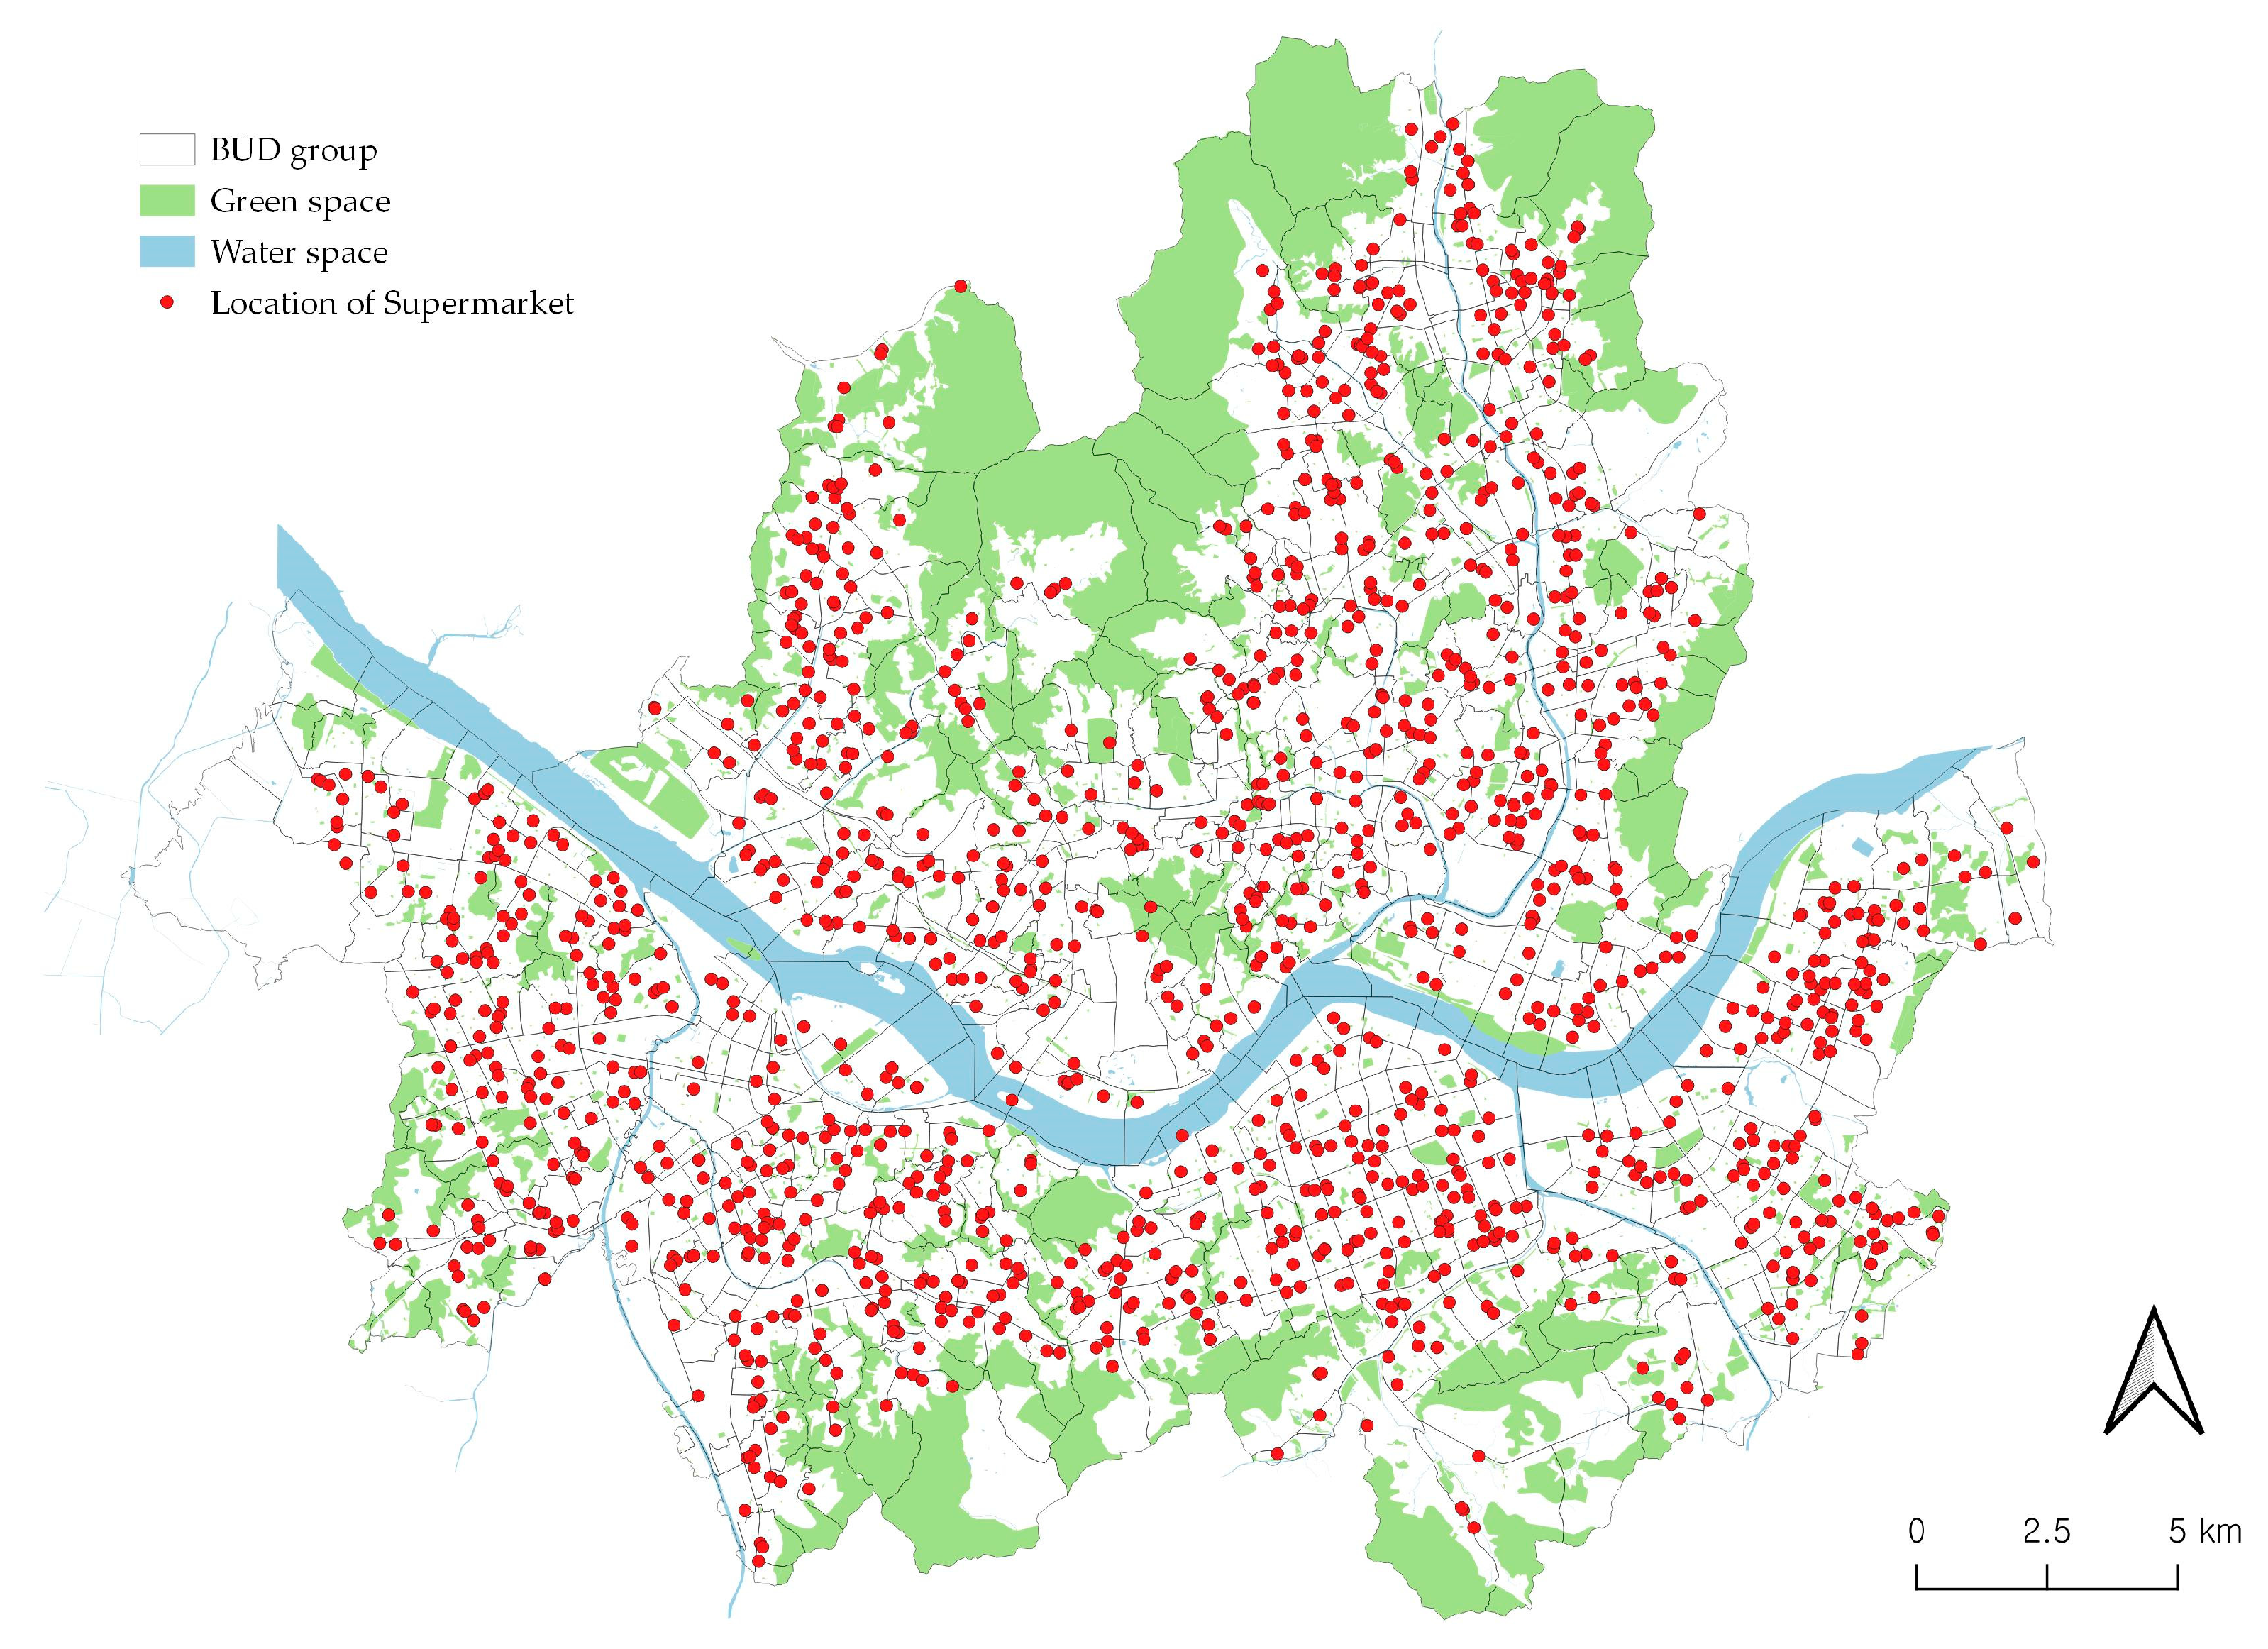
Figure 1.
Study area and locations of supermarkets.
Figure 1 also presents our spatial analysis unit. The spatial analysis unit in this study is the basic unit district (BUD) group in Korea, which is similar to the size of the US census block group. The BUD group has an average area of 0.43 square kilometers and is divided into arterial roads, rivers, and topography; thus, it can be regarded as a walking range of residents, similar to the U.S. census block group [17]. Our study only includes 756 BUD groups among a total of 1417 BUD groups, excluding areas with no elderly residents. The distribution of the elderly population within the BUD groups is taken from the 2019 Population and Housing Census.
2.2. Variables
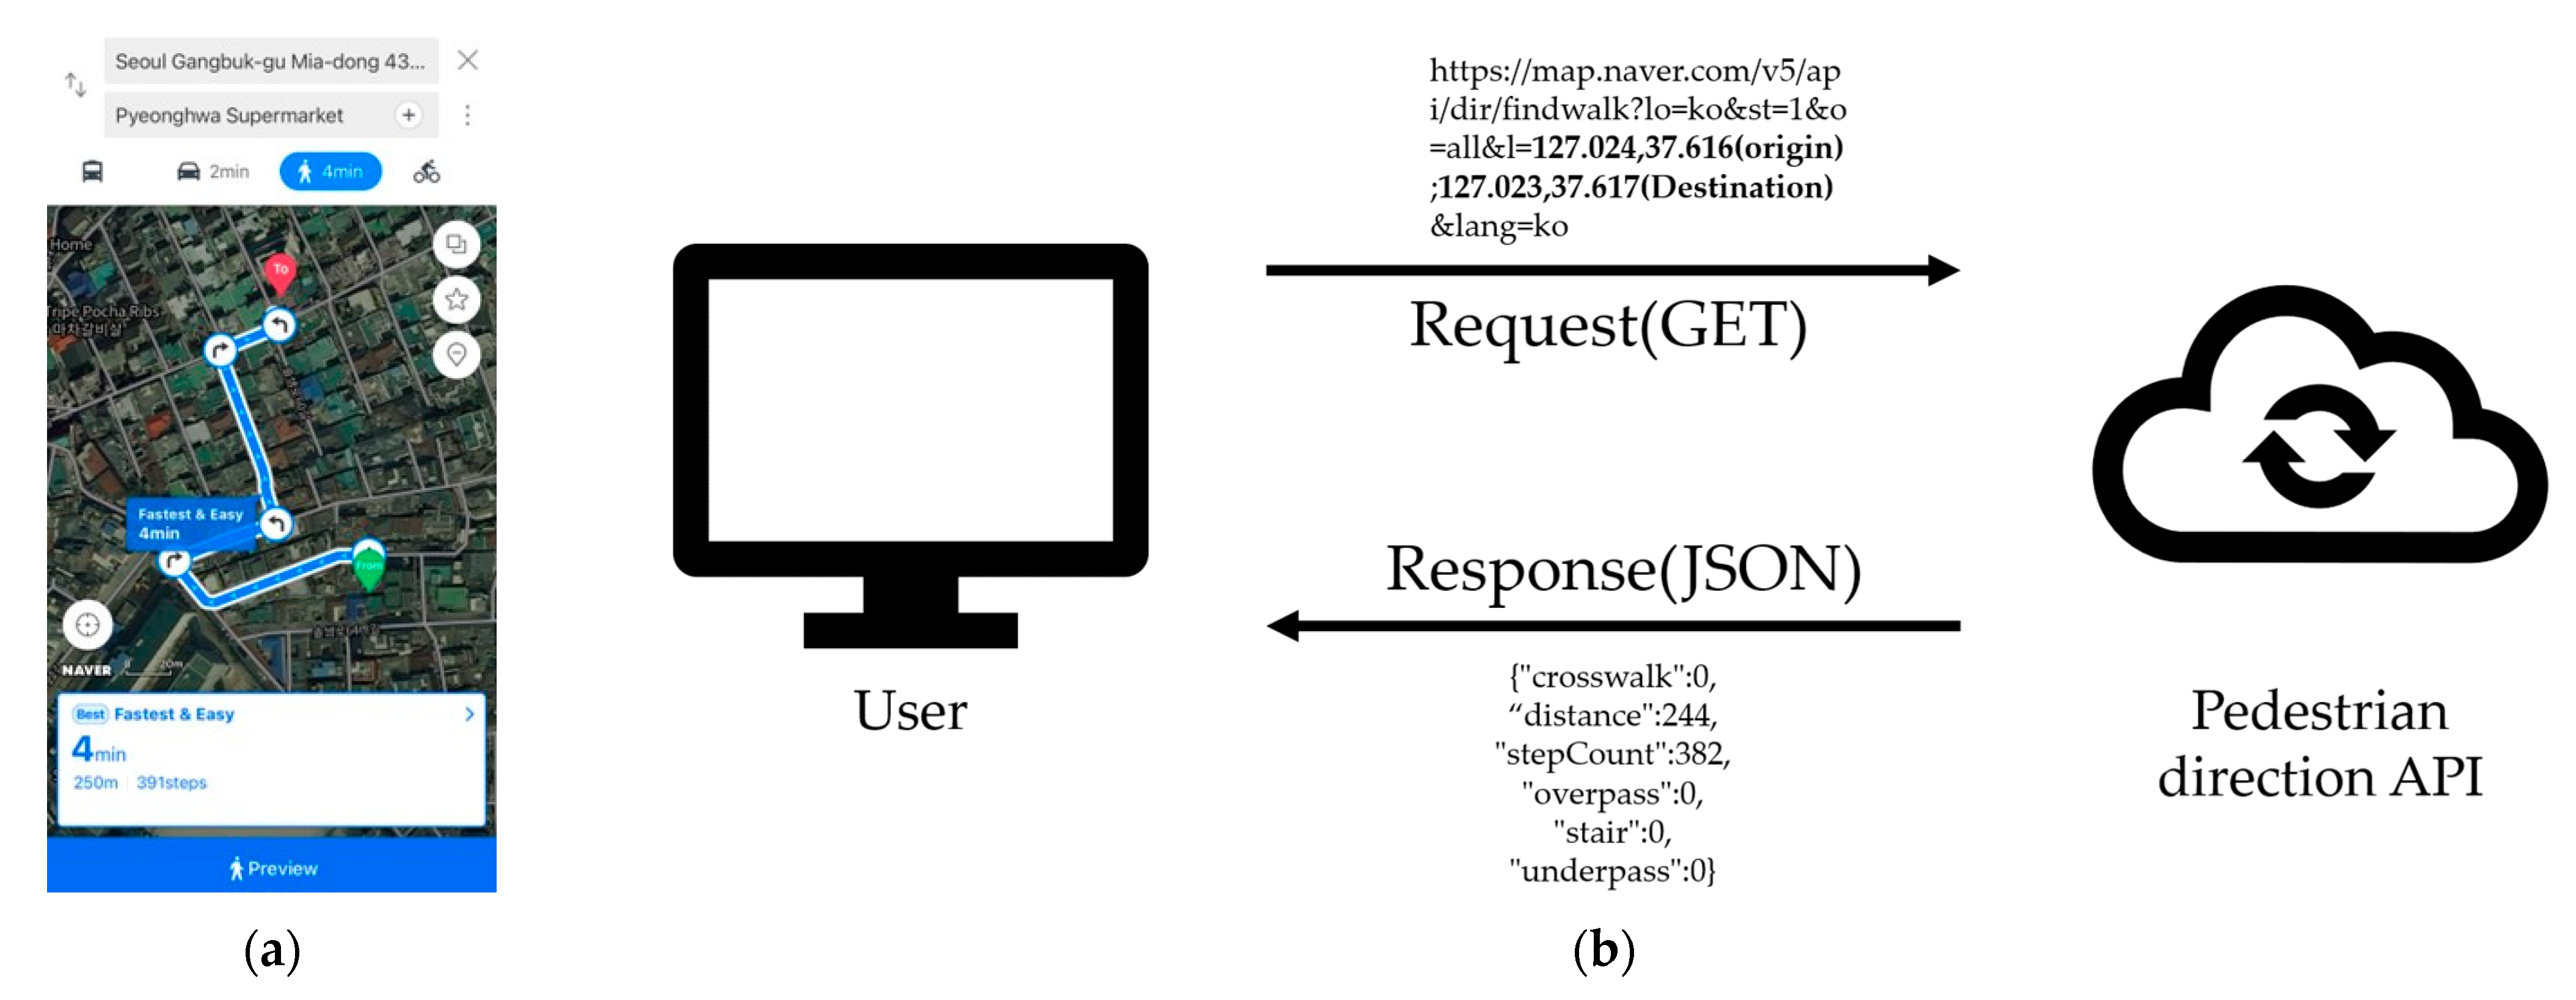
Table 1 shows measurements and descriptive statistics of variables. The dependent variable is supermarket accessibility. Scholars have used variables such as the density of destinations (container), minimum distance, and travel cost (network analysis), which are mainly analyzed by GIS to measure accessibility [25]. However, these approaches may not recognize individuals’ preferred routes since it is difficult to consider the various built environmental feature on a route [26]. We used the pedestrian direction application programming interface (API) on the Naver map to measure the walking distance of the route that pedestrians are expected to travel by walking. The Naver map application suggests a fast and easy path for pedestrians to travel along to their destination based on the map database (Figure 2a). The Naver map also provides APIs, allowing developers to use the functions and data of the map service for software development. When a user sends a request with parameters in the HTTP format to the API server, the API server sends the data in the JSON or XML format. The concrete steps to measure the supermarket accessibility of neighborhoods using the pedestrian direction API are as follows.

Table 1.
Measurements and descriptive statistics of variables.

Figure 2.
Pedestrian direction service of Naver map (a) Example of running a service in an application; and (b) process of obtaining walking information using the API.
First, we define the place of origin and destination for the request to the API. In this study, centroids of BUDs with elderly residents are selected as origins. Regarding the destination, we define 1403 supermarkets located in Seoul as destinations corresponding to 47,121 (supermarkets) in the Korean Standard Industrial Classification (KSIC). The coordinates of the supermarket locations are obtained from a dataset provided by the Seoul Credit Guarantee Foundation (SCGF). Second, we develop a Python program to obtain the walking distance and route features of the optimum route from the Naver pedestrian direction API. The program sends requests for pedestrian routes to the API server to calculate the travel distance from the origin to the nearest supermarket (Figure 2b). The API creates a response in the JSON format with the walking distance and pedestrian crossing facility information. Lastly, we employ a spatial interaction model to calculate supermarket accessibility. This approach assumes that the interaction decreases as the travel distance between the residential place and the supermarket increases. Hence, supermarket accessibility can be expressed as the relative intention of residents to travel depending on the travel distance [27]. The formula for supermarket accessibility is as follows:
where is the walking distance in meters between BUD i and the nearest supermarket j, and is the distance decay constant. In this study, we used 0.00217 to consider the distance decay effect, which was derived from empirical evidence of travels to supermarkets [27]. The calculated value ranges from 0 to 1, and the value decreases close to 0 as the distance increases according to the exponential function. It has a value of about 0.15 at 800 m (half a mile), which is considered to be a walkable distance, and if it is smaller than this, it can be very difficult for the elderly to access on foot. The average supermarket accessibility of all BUDs in BUD groups is designated as a representative value for the accessibility of BUD groups; this value is included in the analysis model.
Independent variables are micro-scale and meso-scale environmental factors. This study employs meso-scale variables related to the D-variables, i.e., density, diversity, and design. First, we use three measurements representing the density of neighborhoods. The floor area ratio measures the amount of space that contains various activities. The commercial building area represents the amount of space in which a supermarket can be located. Parks provide recreational space for residents, but large parks are one of the major barriers to accessibility.
Second, this study measures diversity by using two variables. Mixed building uses at the neighborhood level is a major factor in increasing supermarket accessibility. The Korean Building Construction Act stipulates 28 types of building uses. We reclassified these into three categories, i.e., residential, commercial, and other, taking into account the location of supermarkets and the distribution of consumers. An entropy index, which calculates the combination of three building uses, is employed to investigate the level of mixed building use [6]. We used the Gini-Simpson index, one of the entropy index calculations, and the equation is as follows [28]:
where is the proportion of the ith type and R is the total number of types. Calculated values range from 0 to 1, with 1 representing a perfectly balanced use scenario. Aged buildings facilitate the proliferation of small and diverse businesses, creating more vibrant streets and neighborhoods. Older buildings are very important for small businesses to determine their location because their relatively low price is more affordable for smaller sized enterprises [29]. The modern architecture style in Seoul has undergone major changes every decade [30]. We calculated the building age diversity as an entropy index reflecting the proportion of buildings constructed by decade (before the 1980s, 1980s, 1990s, 2000s, 2010s) using the calculation in Equation (2). The building dataset is provided from the Korea National Spatial Data Infrastructure Portal.
Lastly, design is measured by analyzing design elements, such as hilliness and intersection density, which may influence pedestrian accessibility. Digital elevation model (DEM) data with a 90 m grid interval are used to calculate the hilliness variable. We calculated the average slope value of each BUD group using the slope function of QGIS 3, which estimates the slope value in degrees from the raster data. DEM data is provided by the National Geographic Information Institute. The intersection density and four-way intersection ratio are widely used as proxies for the average block size in a neighborhood [31,32]. Whether or not a neighborhood is composed of small blocks can be determined by how high the intersection density and the four-way intersection ratio are. Smaller blocks increase the opportunity for social interaction [29]. The intersection data is provided by the Ministry of the Interior and Safety.
Micro-scale environmental factors include pedestrian crossing facilities, streets, and sidewalk features. Pedestrian crossing facilities, such as crosswalks, overpasses, underpasses, and stairs, allow pedestrians to walk on roads and steep hills, but they are not friendly to elderly pedestrians who have physical disabilities. The pedestrian direction API of the Naver map is used to measure supermarket accessibility, but it also provides information on pedestrian crossing facilities that pedestrians encounter along the route. The pedestrian crossing facility variable is calculated by dividing the total number of pedestrian crossing facilities along the route by the walking distance to the supermarket; this value can be compared between neighborhoods.
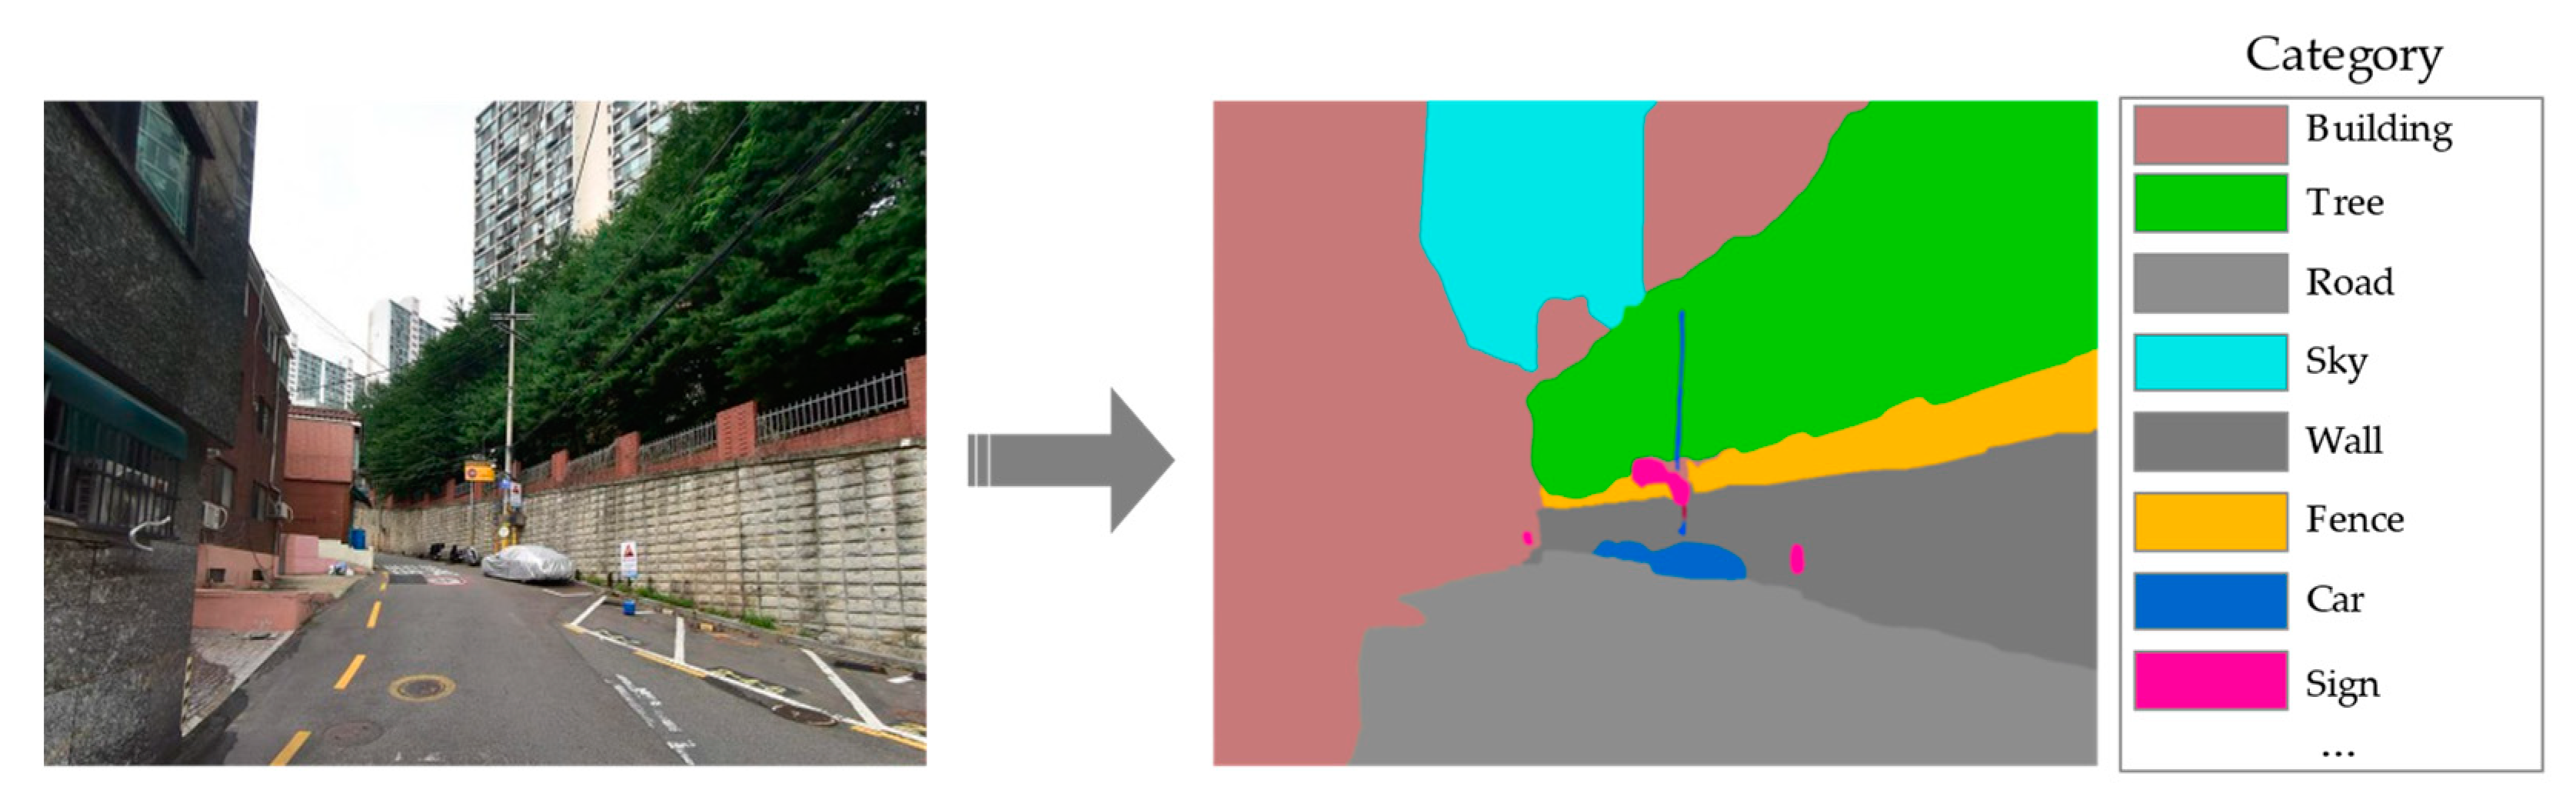
There are elements on the street that promote or block continuous pedestrian walking. We identified various street elements at eye-level using Naver Street View (NSV) panorama images and a semantic segmentation method. This study focuses on sidewalk continuity and physical barriers that can be experienced at the pedestrian eye level by generating points at 100 m intervals along the street networks. We obtained 33,303 panoramic images by requesting the NSV API for the coordinates of 33,867 generated points. The panoramic image of the NSV consists of six faces of the same size (front, rear, left, right, upper, and lower). Considering the street scene that the pedestrians may perceive while traveling, only two faces, the front and rear, were used for analysis. We measure how street elements are visually perceived by the pedestrians in the street scene of each point using semantic segmentation inference software pre-trained with a deep learning model (HRNetV2-W48). The software divides the image into 150 categories, including buildings, the sky, sidewalks, trees, walls, and fences, and then provides high-quality annotated images with a pixel accuracy of 80.77% (Figure 3) [33]. As a proxy variable for sidewalk continuity, the pixel ratio of the sidewalk is measured. The pixel ratios of walls, fences, and trees that can be perceived as physical barriers are also measured. We designate the average of the measurements at points within each BUD group as a representative value in order to include these variables in the model.

Figure 3.
Example of a semantic segmentation result.
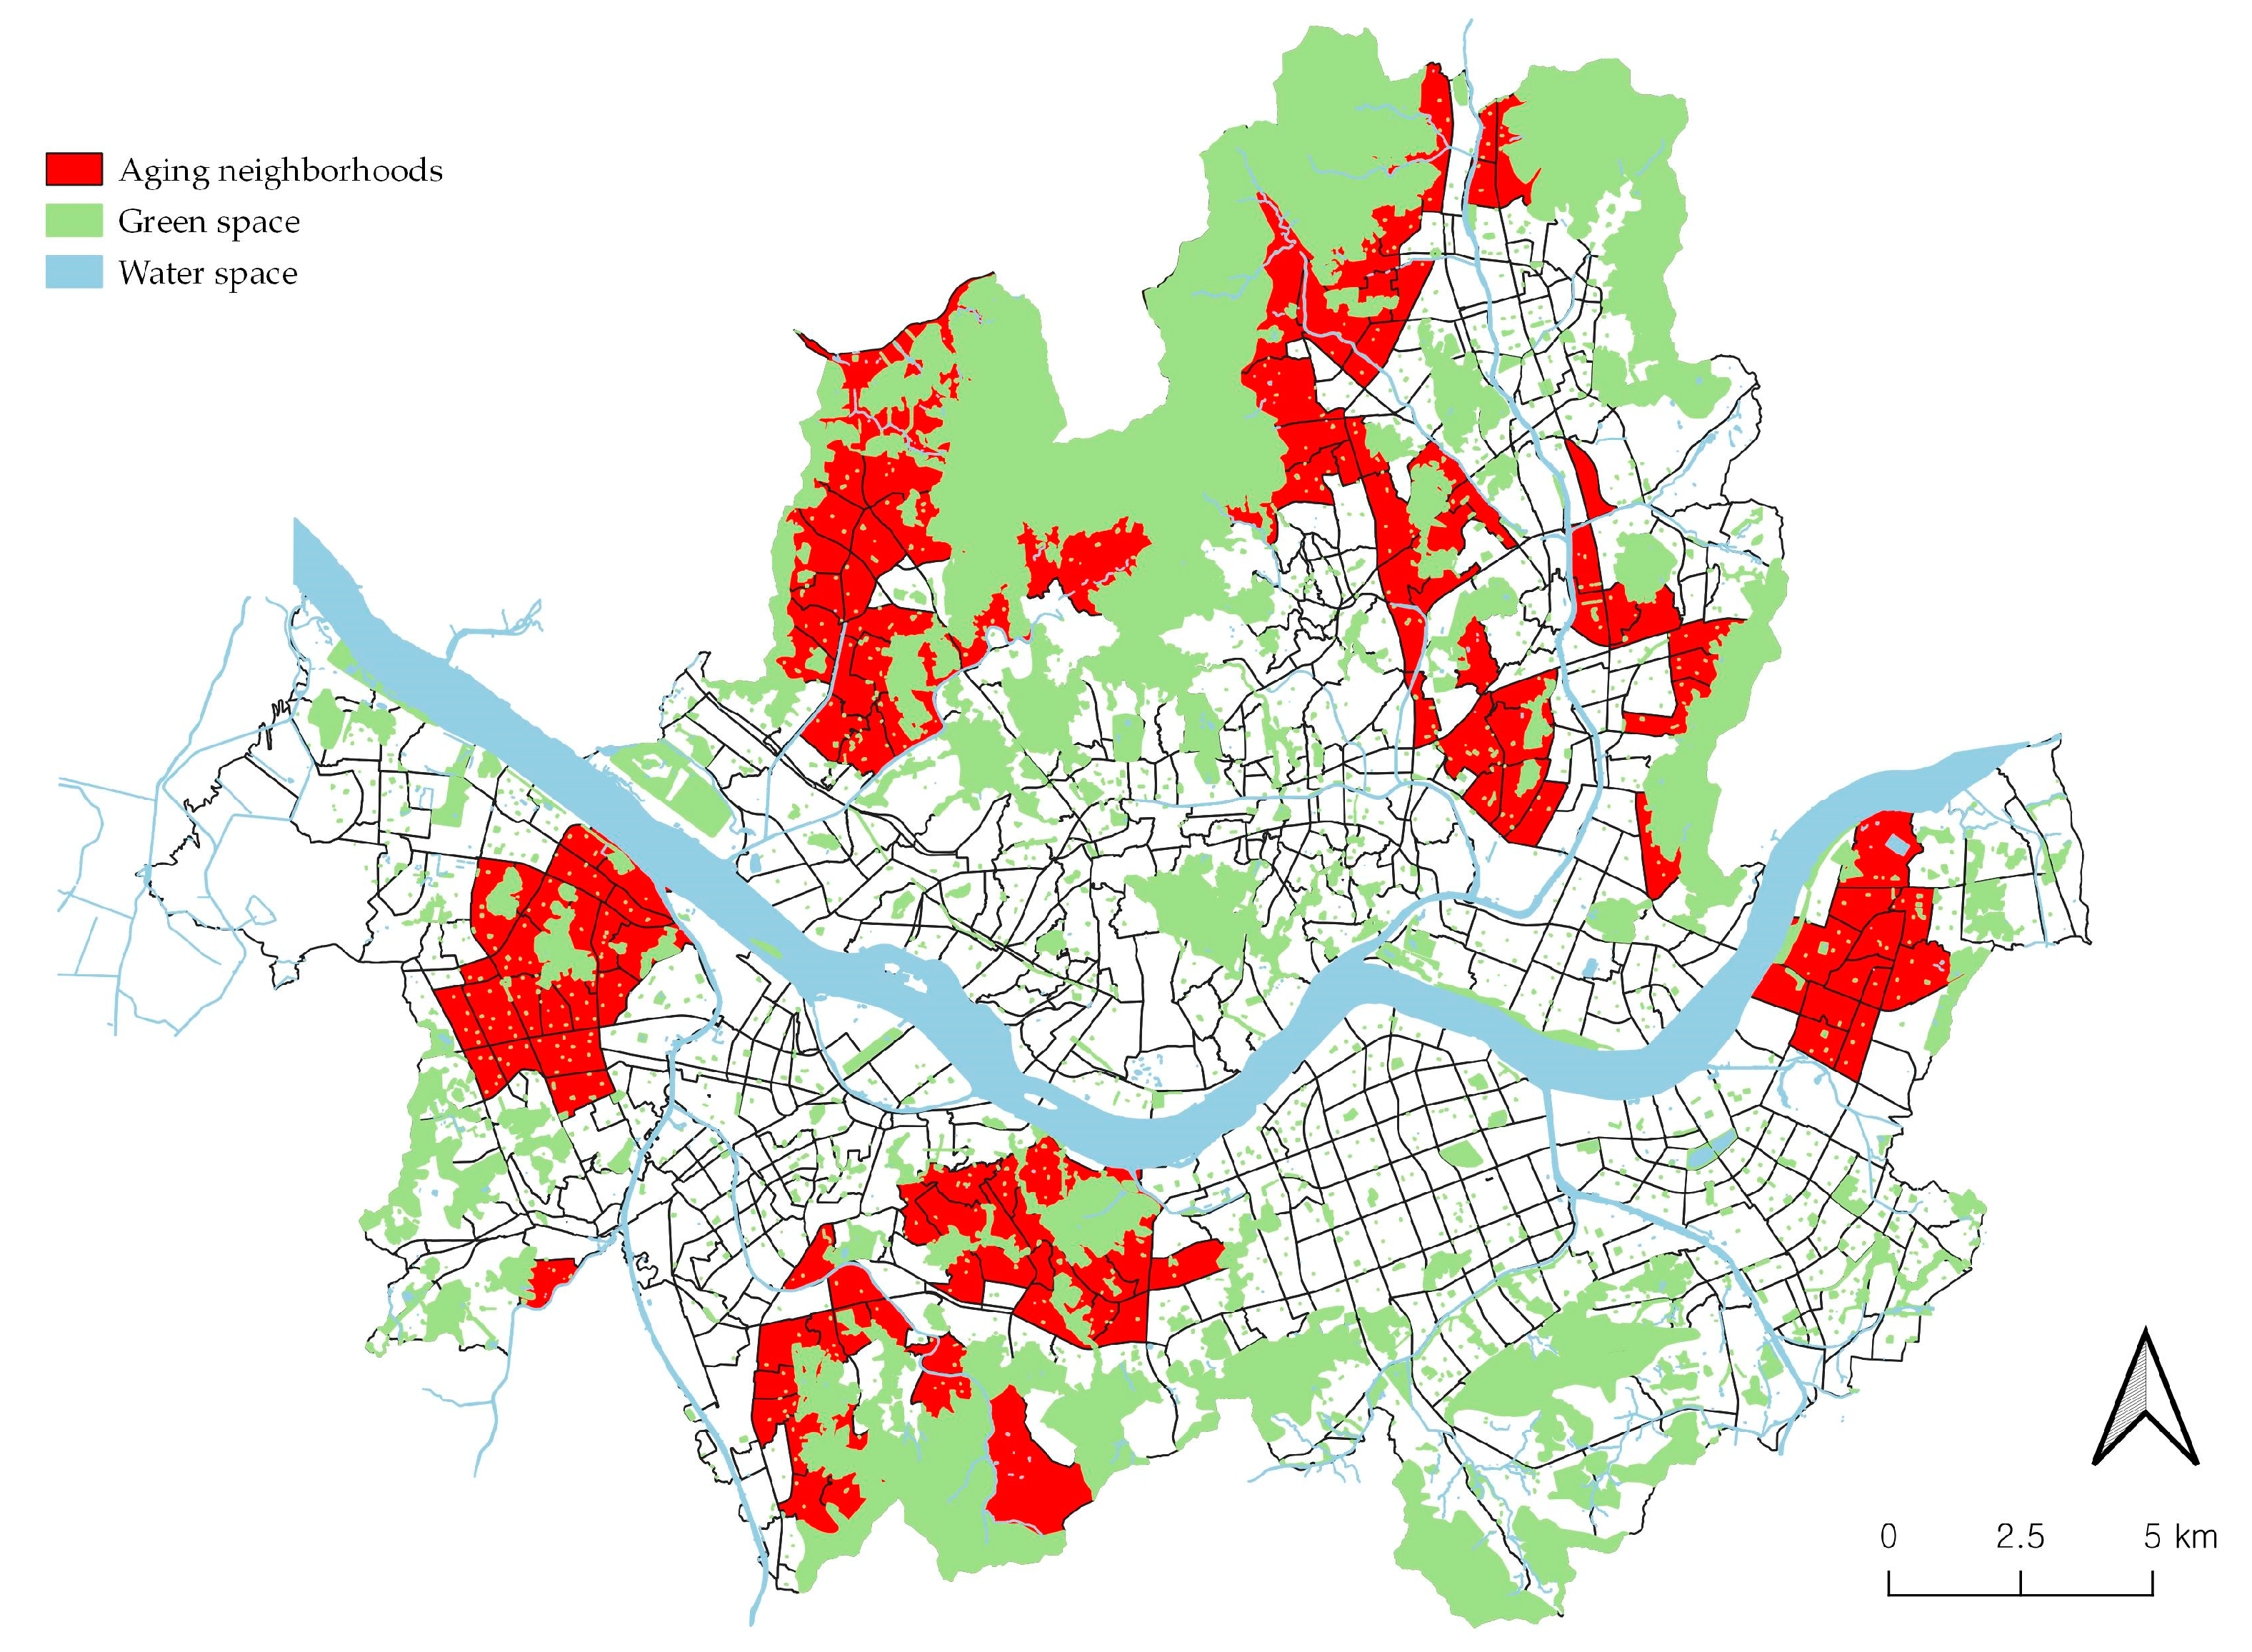
Residential self-selection is an identified confounder within environmental studies [10]. Residential self-selection theory suggests that individuals choose to live in neighborhoods that facilitate their urban activities. These residential choices of the elderly need to be controlled in the model. Hence, an aging neighborhood dummy variable is included in the model since areas where the elderly are spatially concentrated are likely to have high accessibility. We designated aging neighborhoods as areas classified as hot spots in terms of the elderly population by calculating the local Moran’s I value. Figure 4 shows the distribution of 146 aging neighborhoods derived from the local Moran’s I value. Aging neighborhoods in Seoul generally tend to be distributed near green spaces or water spaces.

Figure 4.
Distribution of aging neighborhoods.
2.3. Statistical Model
This study uses OLS, a traditional regression model, to explore which environmental factors of neighborhoods are related to supermarket accessibility in neighborhoods. In the OLS model, the dependent variable, i.e., supermarket accessibility, is represented as a combination function of a set of environmental characteristics measured at different scales. By using multiple regression analysis, we can find a regression equation consisting of highly descriptive variables that influences accessibility among environmental explanatory variables of various scales.
Traditional regression models assume that observations are independent of each other, but because our work uses spatial data, observations in nearby areas can be influenced. Parameters estimated by the OLS model can be biased if spatial autocorrelation exists [34]. Spatial autocorrelation of the OLS model can be detected by using Moran’s I statistic. Moran’s I statistic indicates the existence of spatial autocorrelation when it is statistically significant. We apply a spatial regression model to solve the spatial autocorrelation problem of the OLS model. There are two models, i.e., the spatial lag model and the spatial error model, in the spatial dependence model considering spatial autocorrelation [35]. The former assumes that spatial autocorrelation exists in the dependent variable and the latter in the error term. The Lagrange multiplier test provides a basis for determining which of the two models is suitable [34]. In this study, the Lagrange multiplier test suggests that the spatial error model is more suitable as the model. This study uses GeoDa, an open-source program, to calculate Moran’s I value and to conduct spatial dependence models and tests.
3. Results
Table 2 shows the results of the OLS model and spatial error model. Prior to running the model, we examine whether the model has problems with spatial autocorrelations using Moran’s I statistic. Moran’s I statistic value in the model is 0.157, which is statistically significant. This means that spatial autocorrelation exists in the error terms of the OLS model. Therefore, it is necessary to control spatial dependence using a spatial regression model. We apply the Lagrange multiplier test to select a more appropriate model: either the spatial lag model or the spatial error model [34]. The Lagrange multiplier (lag) and Lagrange multiplier (error) statistics are statistically significant, so we need to further compare the Robust LM (lag) and Robust LM (error). The Robust LM (error) is highly significant, while the Robust LM (lag) is not. This means that a spatial error model is more suitable than a spatial lag model in the spatial regression. The spatial error model can correct spatial autocorrelation in error and bias in variance. Controlling this spatial autocorrelation not only improves the performance of the model, but also allows us to identify underestimated or overestimated variables in OLS.
Table 2.
Results of the OLS model and spatial error model.
Table 2 lists three measures (the log likelihood, AIC, and Schwarz criterion) for performance comparisons between the spatial error model and the OLS model [34]. A model with a higher log likelihood value and a lower Schwarz criterion and AIC value is a more valid model. Table 2 shows that the spatial model has smaller AIC and Schwarz criteria values, and higher log-likelihood values than the OLS model, suggesting that the spatial model improves the model fit effectively. In addition, the Lambda coefficient is highly significant (p < 0.001), suggesting that the model controls unobserved variables with spatial autocorrelation problems. Table 2 also shows the difference between the OLS model and the spatial error model in terms of the coefficients. Land use diversity is not significant in the OLS model, but it is significant in the spatial model, meaning that the OLS model underestimated the land use diversity. In comparison, the park area and tree variables are significant in the OLS model, but not in the spatial error model, suggesting that it is overestimated in the OLS model.
In terms of meso-scale environmental characteristics, the floor area ratio (p < 0.01) was positively associated with supermarket accessibility. Land use diversity (p < 0.05) and building age diversity (p < 0.01) showed a positive correlation with accessibility. Hilliness (p < 0.1) had a negative correlation with supermarket accessibility. Regarding the micro-scale environmental features, neighborhoods with poor supermarket accessibility were expected to encounter a relatively larger number of pedestrian crossing facilities (p < 0.01). Additionally, sidewalk continuity was positively correlated with accessibility (p < 0.01). Physical barriers measured at eye level showed no statistical significance. Depending on whether the neighborhood is an aging neighborhood or not, the neighborhood has different accessibility to supermarkets. Consistent with residential self-selection theory, the aging neighborhoods, which account for only seventeen percent of the total, were more accessible to supermarkets than other neighborhoods.
4. Discussion
The correlation between the quality of the built environment and individual travel behavior is widely understood among urban planners and scholars. Urban planners and planning authorities have tried to improve the walkable environment for people who have difficulty walking. Walkable environments are essential, since walking is the mode of travel that most elderly people choose to access neighborhood amenities, including supermarkets. However, it is necessary to better understand the importance of pedestrian-friendly environments before contributing to improvements in accessibility. Hence, this study aims to demonstrate that the elderly may access supermarkets more easily in walkable environments. The results of this study show that the distribution of supermarket accessibility in Seoul has a significant correlation with the pedestrian-friendly environment for the elderly.
Regarding the meso-scale environmental features, supermarket accessibility was high in neighborhoods with high built density and high building age and land use diversity. A high density of buildings in neighborhoods suggests that there is a large amount of space in these neighborhoods where supermarkets can be located, while at the same time there may be a large population demanding access to supermarkets. However, because commercial building areas were not significant, it is not just that there is a large amount of space available; a balanced mix of land use is also important. In other words, it is important to balance supply and demand for neighborhood amenities. Furthermore, neighborhoods with high land use diversity may have shorter distances between residential spaces and retailers. Additionally, a neighborhood with buildings of various ages is more accessible to supermarkets. The higher the age diversity of buildings, the more likely old buildings are to exist in the neighborhood. Aging buildings tend to be smaller and are likely to be of low property value, making them ideal for small retail businesses [36]. Therefore, supermarkets are more likely to be located in aging buildings. The hilly area has poor supermarket access. Restrictions on road construction due to steep slopes allow residents in hilly areas to bypass longer distances. In addition, pedestrians tend to be less satisfied when walking in more hilly neighborhoods, and the elderly, in particular, feel a great physical and psychological burden walking on hills [11,37]. Planners need to develop customized policies to improve convenience for elderly pedestrians in hilly areas. Installing facilities that enable vertical travel, such as outdoor elevators, may be an effective approach.
Another significant finding was that in terms of micro-scale environmental characteristics, elderly residents of neighborhoods with poor access to supermarkets are more likely to be situated in unfavorable walkable environments. Elderly residents in areas with low accessibility may experience difficulties in encountering pedestrian crossing facilities. In particular, going up and down stairs, overpasses, and underpasses can be physically difficult for the elderly. Crosswalks may also make elderly people feel burdened with limited crossing time because they walk at a slow pace. Planners and policymakers need to improve the perceived accessibility among the elderly by installing elevators at crossing facilities that are mainly used by the elderly and increasing the time available for crossings. Neighborhoods with high supermarket accessibility provide high sidewalk continuity. The elderly may be threatened by vehicles due to poor sidewalk pavement [18]. Therefore, residents may take a relatively longer but safer route to access a well-managed sidewalk. The more pedestrian-friendly paths in a neighborhood, the more likely the elderly are to walk on a closer route to travel to neighborhood amenities, including supermarkets. Thus, planners should strive to install quality sidewalk pavement to improve accessibility.
We suggest that scholars pay attention to some of the limitations of this work. Since our analysis is a case study of Seoul, Korea, the results of this study may not be generalizable. Cases from other cities need to be collected in order to generalize our results. Scholars can approach more generalized conclusions when comparing our results with those in other cities. In addition, while objectively measured environmental characteristics have an important influence on travel behavior, so do subjective attributes. Recently, several scholars have attempted to estimate the subjective reaction of pedestrians over a wide spatial range by taking advantage of deep learning [38,39]. Hence, future models also need to include the subjective calculations of pedestrians.
Author Contributions
Conceptualization, D.K.; Data curation, J.H.; Formal analysis, D.K., J.H. and J.P.; Funding acquisition, J.P.; Methodology, D.K.; Project administration, J.P.; Software, D.K.; Supervision, J.P.; Validation, D.K., J.H. and J.P.; Visualization, D.K.; Writing—original draft, D.K. and J.H.; Writing—review & editing, D.K. and J.P. All authors have read and agreed to the published version of the manuscript.
Funding
This work was supported by a National Research Foundation of Korea (NRF) grant funded by the Korean government (MSIT) (No. NRF-2019R1A2C1088467).
Data Availability Statement
Not applicable.
Conflicts of Interest
The authors declare that they have no conflict of interest.
References
- Vojnovic, I. Urban sustainability: Research, politics, policy and practice. Cities 2014, 41, S30–S44. [Google Scholar] [CrossRef]
- Ewing, R.; Hamidi, S. Compactness versus sprawl: A review of recent evidence from the United States. J. Plan. Lit. 2015, 30, 413–432. [Google Scholar] [CrossRef]
- Frank, L.D.; Iroz-Elardo, N.; MacLeod, K.E.; Hong, A. Pathways from built environment to health: A conceptual framework linking behavior and exposure-based impacts. J. Transp. Health 2019, 12, 319–335. [Google Scholar] [CrossRef]
- Wali, B.; Frank, L.D.; Chapman, J.E.; Fox, E.H. Developing policy thresholds for objectively measured environmental features to support active travel. Transp. Res. Part D Transp. Environ. 2021, 90, 102678. [Google Scholar] [CrossRef]
- Lefebvre-Ropars, G.; Morency, C. Walkability: Which measure to choose, where to measure it, and how? Transp. Res. Rec. 2018, 2672, 139–150. [Google Scholar] [CrossRef]
- Cervero, R.; Kockelman, K. Travel demand and the 3Ds: Density, diversity, and design. Transp. Res. Part D Transp. Environ. 1997, 2, 199–219. [Google Scholar] [CrossRef]
- Ewing, R.H. Pedestrian-and Transit-Friendly Design: A Primer for Smart Growth; Smart Growth Network: Washington, DC, USA, 1999. [Google Scholar]
- Talen, E.; Shah, S. Neighborhood evaluation using GIS: An exploratory study. Environ. Behav. 2007, 39, 583–615. [Google Scholar] [CrossRef]
- Arellana, J.; Saltarín, M.; Larrañaga, A.M.; Alvarez, V.; Henao, C.A. Urban walkability considering pedestrians’ perceptions of the built environment: A 10-year review and a case study in a medium-sized city in Latin America. Transp. Rev. 2020, 40, 183–203. [Google Scholar] [CrossRef]
- Garfinkel-Castro, A.; Kim, K.; Hamidi, S.; Ewing, R. Obesity and the built environment at different urban scales: Examining the literature. Nutr. Rev. 2017, 75, 51–61. [Google Scholar] [CrossRef]
- Kim, S.; Park, S.; Lee, J.S. Meso-or micro-scale? Environmental factors influencing pedestrian satisfaction. Transp. Res. Part D Transp. Environ. 2014, 30, 10–20. [Google Scholar] [CrossRef]
- Hine, J.; Russell, J. Traffic barriers and pedestrian crossing behaviour. J. Transp. Geogr. 1993, 1, 230–239. [Google Scholar] [CrossRef]
- Anciaes, P.R.; Jones, P. Estimating preferences for different types of pedestrian crossing facilities. Transp. Res. Part F Traffic Psychol. Behav. 2018, 52, 222–237. [Google Scholar] [CrossRef]
- Coveney, J.; O’Dwyer, L.A. Effects of mobility and location on food access. Health Place 2009, 15, 45–55. [Google Scholar] [CrossRef] [PubMed]
- Schwartz, N.; Buliung, R.; Wilson, K. Disability and food access and insecurity: A scoping review of the literature. Health Place 2019, 57, 107–121. [Google Scholar] [CrossRef]
- Ewing, R.; Handy, S. Measuring the unmeasurable: Urban design qualities related to walkability. J. Urban Des. 2009, 14, 65–84. [Google Scholar] [CrossRef]
- Jeon, J.; Woo, A. Deep learning analysis of street panorama images to evaluate the streetscape walkability of neighborhoods for subsidized families in Seoul, Korea. Landsc. Urban Plan. 2023, 230, 104631. [Google Scholar] [CrossRef]
- Zhou, H.; He, S.; Cai, Y.; Wang, M.; Su, S. Social inequalities in neighborhood visual walkability: Using street view imagery and deep learning technologies to facilitate healthy city planning. Sustain. Cities Soc. 2019, 50, 101605. [Google Scholar] [CrossRef]
- Opach, T.; Navarra, C.; Rød, J.K.; Neset, T.-S. Pedestrian routing and perspectives: WayFinder’s route down the lane—Come on with the rain. ISPRS Int. J. Geo-Inf. 2021, 10, 365. [Google Scholar] [CrossRef]
- Ki, D.; Lee, S. Analyzing the effects of Green View Index of neighborhood streets on walking time using Google Street View and deep learning. Landsc. Urban Plan. 2021, 205, 103920. [Google Scholar] [CrossRef]
- Kim, D.; Park, J. Assessing Social and Spatial Equity of Neighborhood Retail and Service Access in Seoul, South Korea. Sustainability 2020, 12, 8537. [Google Scholar] [CrossRef]
- Consumer Behavior Survey for Foods for 2019. Available online: https://www.krei.re.kr/foodSurvey/selectBbsNttList.do?bbsNo=449&key=806 (accessed on 19 December 2022).
- Nathan, A.; Pereira, G.; Foster, S.; Hooper, P.; Saarloos, D.; Giles-Corti, B. Access to commercial destinations within the neighbourhood and walking among Australian older adults. Int. J. Behav. Nutr. Phys. Act. 2012, 9, 133. [Google Scholar] [CrossRef] [PubMed]
- Bae, S.-H.; Park, S.-H. Changes of Social Functions and Roles of Neighborhood Small Shops—A Case Study of Hae-bang-chon in Seoul-TT-Changes of Social Functions and Roles of Neighborhood Small Shops—A Case Study of Hae-bang-chon in Seoul. J. Urban Des. Inst. Korea Urban Des. 2015, 16, 21–36. [Google Scholar]
- La Rosa, D. Accessibility to greenspaces: GIS based indicators for sustainable planning in a dense urban context. Ecol. Indic. 2014, 42, 122–134. [Google Scholar] [CrossRef]
- Chen, Y.; Yue, W.; La Rosa, D. Which communities have better accessibility to green space? An investigation into environmental inequality using big data. Landsc. Urban Plan. 2020, 204, 103919. [Google Scholar] [CrossRef]
- Handy, S.L.; Niemeier, D.A. Measuring accessibility: An exploration of issues and alternatives. Environ. Plan. A 1997, 29, 1175–1194. [Google Scholar] [CrossRef]
- Jost, L. Entropy and diversity. Oikos 2006, 113, 363–375. [Google Scholar] [CrossRef]
- Jacobs, J. The Death and Life of Great American Cities; Random House: New York, NY, USA, 1961. [Google Scholar]
- Choi, S.; Won, J.; Kim, G.; Kim, S.; Park, C. Twenty Centuries of Seoul. 35, Urban Construction in Modern Seoul; Seoul Historiography Institute: Seoul, Republic of Korea, 2016. [Google Scholar]
- Ewing, R.; Cervero, R. Travel and the built environment: A meta-analysis. J. Am. Plan. Assoc. 2010, 76, 265–294. [Google Scholar] [CrossRef]
- Sung, H.-G.; Go, D.-H.; Choi, C.G. Evidence of Jacobs’s street life in the great Seoul city: Identifying the association of physical environment with walking activity on streets. Cities 2013, 35, 164–173. [Google Scholar] [CrossRef]
- Semantic Segmentation on MIT ADE20K Dataset in PyTorch. Available online: https://github.com/CSAILVision/semantic-segmentation-pytorch (accessed on 13 December 2022).
- Anselin, L. Spatial regression analysis in R: A workbook. Urbana 2005, 51, 61801. [Google Scholar]
- Anselin, L.; Bera, A.K. Spatial dependence in linear regression models with an introduction to spatial econometrics. Stat. Textb. Monogr. 1998, 155, 237–290. [Google Scholar]
- Sung, H.; Lee, S.; Cheon, S. Operationalizing jane jacobs’s urban design theory: Empirical verification from the great city of seoul, Korea. J. Plan. Educ. Res. 2015, 35, 117–130. [Google Scholar] [CrossRef]
- Lee, S.H.; Goo, S.H.; Chun, Y.W.; Park, Y.J. The spatial location analysis of disaster evacuation shelter for considering resistance of road slope and difference of walking speed by age-case study of Seoul, Korea. J. Korean Soc. Geospat. Inf. Sci. 2015, 23, 69–77. [Google Scholar]
- Dubey, A.; Naik, N.; Parikh, D.; Raskar, R.; Hidalgo, C.A. Deep learning the city: Quantifying urban perception at a global scale. In Proceedings of the European Conference on Computer Vision, Amsterdam, The Netherlands, 11–14 October 2016; Springer: Berlin/Heidelberg, Germany, 2016; pp. 196–212. [Google Scholar]
- Zhang, F.; Zhou, B.; Liu, L.; Liu, Y.; Fung, H.H.; Lin, H.; Ratti, C. Measuring human perceptions of a large-scale urban region using machine learning. Landsc. Urban Plan. 2018, 180, 148–160. [Google Scholar] [CrossRef]
Disclaimer/Publisher’s Note: The statements, opinions and data contained in all publications are solely those of the individual author(s) and contributor(s) and not of MDPI and/or the editor(s). MDPI and/or the editor(s) disclaim responsibility for any injury to people or property resulting from any ideas, methods, instructions or products referred to in the content. |
© 2023 by the authors. Licensee MDPI, Basel, Switzerland. This article is an open access article distributed under the terms and conditions of the Creative Commons Attribution (CC BY) license (https://creativecommons.org/licenses/by/4.0/).