Abstract
This paper addresses the gap in the scientific literature regarding construction cost estimates for the construction of underground metro stations. It provides preliminary cost estimation models using linear regression for use by the Greek underground metro public transport authority for planning future extensions to the Athens and Thessaloniki networks. At the same time, it contributes to the body of knowledge by proposing material quantity prediction models and presents a two-stage preliminary cost estimation model for the construction of civil engineering works of underground metro stations. Stage one uses the construction cost budgets of six metro stations in Greece to develop a multilinear regression equation for the prediction of the overall cost for construction of civil engineering works; stage two provides estimates of material quantities using linear regression, key quantity ratios, and artificial neural networks. The data analyzed are from the prior measurements of quantities for the construction of the Chaidari to Piraeus extension of the Athens Metro Line 3. After comparing the actual values of costs and quantities with the corresponding predictions, acceptable discrepancies are observed. All models provide estimates within ±25% discrepancies, which are acceptable at the conceptual planning phase in order to initiate project funding quests.
1. Introduction
The need to cover large urban areas, which are characterized by a low level of transport service from the existing network, but at the same time have the conditions to make such an investment economically viable, is the main reason for the construction of new metro networks in developing cities worldwide. Metro is defined as an electrically powered train operating on reserved tracks in urban areas [1]. The existence of such networks dates back to 1890 when the London metro opened. Since then, 193 countries worldwide have constructed and put into operation urban metro networks, 14 of which since 2018, including over 17,000 km track length, almost 13,000 stations and accommodating over 58 trillion riders in 2019. It is a fact that in 2020, owing to the COVID-19 pandemic, global metro ridership fell by 40% compared to 2019. Regardless, the necessary extensions of existing and the construction of new networks are still being planned or are expected to be planned in the coming years due to increasing urbanization, environmental challenges, and aspirations for a better quality of life, with the most growth expected in the Asia–Pacific region, the Middle East and North Africa (MENA) and Latin America [2].
This trend will likely continue in the near future. Therefore, the estimation of construction costs for both new networks and extension of existing ones around the world, with obviously different geotechnical conditions, structural codes of practice, project procurement frameworks, and price fluctuations, is essential for decision-makers worldwide to make educated decisions regarding funding requirements and procurement strategies. In Athens, for example, the initial three-line network was completed in January 2000 even though, historically, Line 1 opened as a conventional aboveground steam railway in 1869. The other two lines, which are mostly underground networks, were constructed in the 1990s but since have been continuously expanding, while new lines, like Line 4, are being planned [3]. With three lines having an overall length of nearly 92 km and 40 modern underground stations, the Athens Metro constitutes the most popular means of transport in the capital. Similarly, in Thessaloniki, the second largest city in Greece, the first lines and its first extension of an overall length of 14.4 km with 18 stations are currently under construction while additional extensions are already being planned [4].
The planning of a new metro network or the extension of an existing one begins with the selection of locations for the construction of new stations. This decision is based on serving as much as possible the population in the areas through which the line will pass, i.e., they should be located in central locations with sufficient space, such as squares and parks, serving important buildings and facilities, while at the same time reducing the need for expropriation of privately owned properties. After pinpointing each station’s location, the method of construction needs to be determined. Primarily, the criteria based on which the appropriate construction method is chosen for each station are the available space for the construction facilities and the accessibility of the project machinery, the possibility of finding antiquities, the bypassing of networks, the maximum depth of the station, and the expected environmental impacts. The most disruptive construction activity is the excavation and primary support of the required space for the construction of the structure of the underground station. While the construction of the tunnels is normally achieved using a tunnel-boring machine (TBM), which works underground with minimal or no disruption to ground-level activities, the options for the excavation required for the construction of the stations are the Cut and Cover (C&C) method, the Cover and Cut method, and the New Austrian Tunneling Method (NATM).
The C&C method has been widely used for a long time and is one of the most important techniques chosen for the construction of underground stations worldwide, such as in London in 1863, New York in 1900, and Canada in 1949 [5]. More recently, it has also been used in cases of construction of shallow underground road tunnels, for example, the Egnatia Motorway [6], but also for excavation of metro tunnels when poor mechanical soil characteristics are encountered, as reported by Attiko Metro S.A. [7]. Initially, the trench where the station structure will be built is excavated, including the required ground support measures (piles, shotcrete, prestressed anchors), followed by the construction of the station’s concrete structure. In the end, the structure is backfilled and the aboveground area is reconstructed. As a result, the aboveground surroundings are disrupted for the entire construction period. The C&C method is considered economically advantageous and is chosen in cases where the excavation depth is less than 30 m, while the area available for occupation of the site is sufficient and potential disturbance is considered acceptable [8].
The Cover and Cut method was originally developed for urban subway structures where the least possible disruption of traffic is required. According to this method, shallow excavation and grading are performed initially, followed by the construction of a subsoil concrete “vault”. This vault acts as a retaining structure and provides full protection to the main excavation activities below, carried out by conventional drilling and hauling equipment [6] while at the same time allowing normal activities aboveground. Similar to the C&C method, it is also not suitable or cost-efficient for very deep excavations.
In contrast, when the excavation depth is very deep (more than 30 m), problems regarding the stability of the trench slopes are usually created by the previous methods. As a result, they are considered to be economically unviable. Therefore, the underground excavation and primary support to provide the necessary safe space for the construction of the station are achieved by the NATM method, which is suitable in cases with limited surface space, among other factors [8]. The basic principle of the NATM method is to open the tunnel front by conventional mechanical means, usually in more than one phase, to reduce the surface area of the excavation front and wall convergence. Temporary wall support is provided by applying shotcrete (plain or fiber-reinforced), rock anchors (prestressed or passive), and/or the installation of umbrella-shaped fore-polling beams. The type of primary support depends on the geotechnical conditions monitored while excavating. For this reason, it is known as a “design as you monitor” approach [8]. This method is commonly used for the construction of short road or rail tunnels in rural areas as opposed to the use of TBMs for significantly longer tunnels in rural areas and all tunnels in densely populated areas. The advantages of NATM are its applicability to large cross-sections and noncircular cross-sections (such as metro stations) and little or no disturbance caused at ground level [8].
Regardless of the method of construction, the estimation of costs and required quantities of materials are the most important parameters for planning and successful completion of complex infrastructure projects that are used by both the project owner and the contractor [9]. Estimating the potential construction costs of a project at the conceptual–feasibility planning phase can help stakeholders to choose the most cost-effective solution, thus reducing the risks related to the loss of funding. Prediction of a construction project’s cost always involves risks and uncertainties due to the uniqueness of each project [10,11,12,13]. However, owing to the lack of a reliable database, data comparison studies regarding the construction costs of major infrastructure projects, such as underground metro networks, are rare internationally. In addition, each country has a unique legal framework covering project implementation in general, and specific project procurement systems [14,15,16] and contract types [17,18], and hence construction budget estimation methods.
The acceptable accuracy of such estimation methods is another issue of discussion in the literature. According to Burke [19] and Flyvbjerg et al. [20], at each phase in the project life cycle (conceptual, design, realization, and operation), different levels of cost-estimating accuracy can be achieved from the detail of available information. As stated by Fragkakis et al. [21], most feasibility and “go or no go” decisions concerning large transportation projects are made during the conceptual stages of the project. According to Burke [19], an acceptable discrepancy of predicted to actual construction cost can be taken as ±25% at the conceptual–feasibility phase. On the other hand, the Association for the Advancement of Cost Engineering reported that feasibility decisions that rely on cost estimates based on limited project design information (1–15% of total project information) can provide accuracy levels from −15% to −30% and +20% to +50% [22]. Furthermore, Hanioğlu [23] states that frequently in practice, such estimates will be an “order of magnitude” with even higher discrepancies, up to ±50–100%. Nevertheless, at least a preliminary feasibility study needs to be conducted to make the “go” decision, which, of course, requires a cost estimate. Most practitioners rely on data inferred from costs associated with past projects [24,25] and derive parametric estimates, i.e., offer a currency amount for a generalized product unit, e.g., EURO per square meter. The accuracy of parametric estimates is generally between 30–40% [23].
As the proposed models in this study utilize initial geometrical information regarding the size of the excavation and station structure to provide cost estimates during the conceptual phase, an acceptable accuracy level that can be achieved at this phase is ±25% [19,26]. Even at this level of accuracy, early cost estimates enable the comparison of different design alternatives in the predesign phase and the selection of the most economical technical solution [26].
Therefore, the basis for this proposed research project is a comprehensive material quantity and cost analysis of the contract for the extension of Line 3 from Chaidari to Piraeus, which included the construction of six underground metro stations. For this contract, the total contractual construction cost, including total civil engineering construction costs (TCECs) and mechanical and electrical (M&E) installation costs, was EURO 343,960,000, excluding contingencies, unforeseen costs, and value-added tax (VAT). Figure 1 shows the distribution of costs between the major cost categories. It is easily deduced that the TCEC for the construction of the six stations is, along with M&E, the top cost category consuming 34% of the construction budget, while the actual TCEC for the tunnel network construction is in second place, accounting for 26% of the costs. This initial observation sparked an interest in determining if the issue of obtaining safe cost estimations for the planning of the construction of underground metro stations has been adequately addressed in the literature.
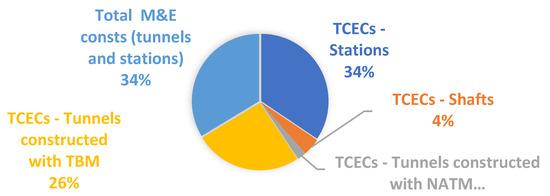
Figure 1.
Cost distribution for the construction of Athens Metro Line 3 extension from Chaidari to Piraeus.
2. Literature Review
Following a detailed but non-exhaustive literature review initiated by a search in the Scopus research database using keywords (predict* OR forecast* OR *estimate*) AND (construction AND cost*) in the title and keyword fields, 1538 documents were retrieved that propose or examine methods for providing construction cost estimates in general. Using the Scopus Analyze Search Results Tools, it was found that research in this domain began as far back as 1945 and 1953 regarding tips for estimating the cost of hospital construction. In the 1970s, single digit numbers of documents were produced yearly, with this rate increasing in the 1980s. It was not until 2005 that cost prediction models became a significant research domain, with a first peak in 2011 (82 documents) and the pinnacle of relevant publications in Scopus being achieved in 2021 with 124 documents (Figure 2).
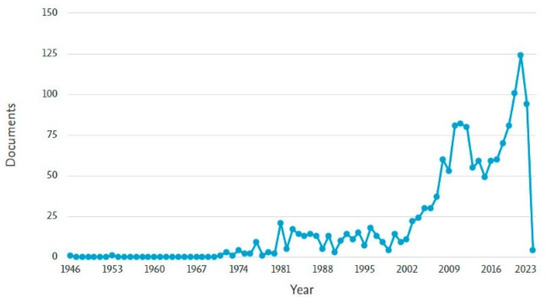
Figure 2.
Number of documents published in Scopus-indexed journals per year (Scopus, 2022).
The top four journals in terms of the overall number of documents published are shown in Figure 3, along with the frequency of their publications through time. By far, the most documents published were in the ASCE Journal of Construction Engineering and Management with 107 documents, followed by Construction Management and Economics with 44, the ASCE Journal of Management in Engineering with 26, and Engineering Construction and Architectural Management with 25. In addition, the top 10 authors involved in the investigation of construction cost estimates are shown in Figure 4, while the top 10 countries are shown in Figure 5.
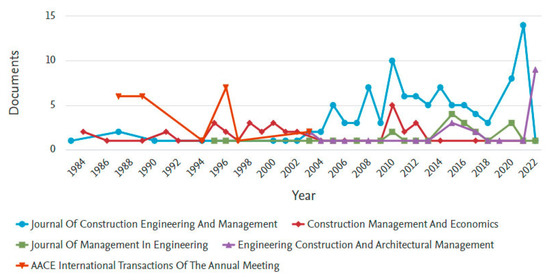
Figure 3.
Number of documents published in Scopus-indexed journals per top four journals per year (Scopus, 2022).
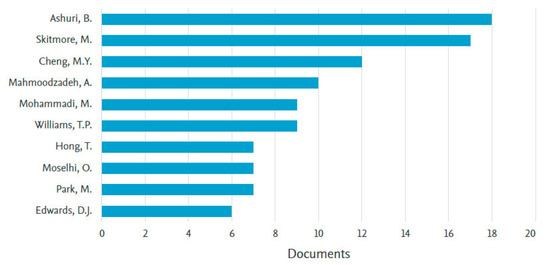
Figure 4.
Documents per top 10 authors (Scopus, 2022).
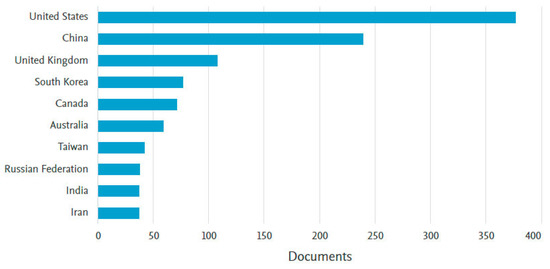
Figure 5.
Documents per top 10 countries (Scopus, 2022).
According to a recent systematic literature review and content analysis of construction cost prediction models by Tayefeh Hashemi et al. [27], it was found that up until 2020, out of 92 documents examined, 40 refer to building projects; 16 to road projects, and the rest to public projects, water-related projects, railway, and power projects. None were found that provided cost estimations for the construction of underground metro stations. To add to their work, a further content analysis of 51 relevant documents published in 2021 and 2022 was carried out. The results of this content analysis (Table 1) showed that, once again, the majority of cost prediction methods and models referred to buildings (31). Nine referred to power generation or network construction, seven to road construction, five to rail and road tunnels, one to bridges, and one to a water-related project, while the gap in the literature regarding cost prediction models for underground metro stations remains.

Table 1.
Construction cost estimation research 2021 to 2022 per project type, method, and country.
The most common approaches employed for the development of cost prediction models during the past two years include Artificial Neural Networks (ANNs), Support Vector Machines (SVM), Building Information Modeling (BIM), Gradient Boosting Machines (GBM), Gaussian Process Regression (GPR), and Linear Regression (LR). Even though ANNs and other machine learning techniques are considerably more robust and sophisticated, the proposed prediction models are based on simple LR analysis because the resulting equations are simple to understand and easily applied by underground metro public authority decision-makers, and do not require advanced mathematical knowledge and access to specialized software.
By examining Tayefeh Hashemi et al.’s [27] findings and the results of the additional review carried out herein, it was found that LR is applied to determine either major material quantities or direct cost estimates for the construction of buildings [41,68,76,77]; highways [78] (including bridges [79,80,81], culverts [82], and tunnels [83]); water supply networks [84]; hydroelectric power-plant construction [85]; and, most recently, power-line towers [63].
Alshemosi and Alsaad [76] developed a multilinear regression model based on data from 10 residential buildings for the prediction of total construction costs. The ten independent variables were taken as the estimator’s experience, market conditions, degree of economic instability, accuracy of bidding documents, site conditions, total area of the residential building, height of the residential building, project location, type of residential building, and estimation method. Using more variables relevant to the building characteristic, Alshamrani [77] proposed a user-friendly regression model to predict the initial cost of conventional and green college buildings with a maximum of three floors in North America. His model used building area, floor height, number of floors, structure type, and envelope form as input parameters, all known at the initial planning stages.
One study by Sodikov [78] was found to provide unit cost and material quantity estimation models for new highway construction using historical data from projects in Poland and Thailand. The independent variables included work duration, pavement width, shoulder width, ground rise and fall, average site clearing and grubbing, earthwork volume, surface class, and base material, all related to project characteristics. These estimates referred to projects with no major bridges or tunnels. For a comprehensive estimate of highway construction costs, researchers have proceeded to derive such equations for bridge and tunnel costs.
The following studies provide construction cost and material quantity estimation models using RA and based on data from the Egnatia Motorway, which is part of the Trans-European Network for Transport and one of the most significant projects constructed using European funding and has been fully operational since 2008. The 670 km long motorway is a high-speed motorway consisting of a dual carriageway with a width of 24.5 m for most sections and 22 m for difficult mountainous areas. Petroutsatou et al. [83] included independent variables related to the ground conditions along with overburden height and excavation face cross-section area for the prediction of road tunnel construction costs. The major bridges cost category was addressed by Fragkakis et al. [81] who, based on only two input variables, deck width and length, derived regression equations that calculated the volume of concrete, the weight of reinforcing steel, and the weight of prestressing steel, which were then multiplied with representative unit costs to provide deck construction cost estimates. Antoniou et al. analyzed the distribution of total costs and material quantities required for smaller road bridges, i.e., overpasses [79] and underpasses [9], by relating quantities to a new dimension called the theoretical volume. This is defined as the product of the dimensions of the local road that must be realigned to underpass the motorway (width multiplied by the overhead clearance height). From the appropriate data processing using the linear regression method, a linear interdependence of costs with the superstructure area and the theoretical volume was found. Finally, Fragkakis et al. [82] proceeded to create a multiple linear regression model for predicting the construction cost of the smallest but most frequent structures, culverts, i.e., conduits for the passage of surface drainage water under motorways. The independent variables in this study were the net height, the net width, and the height of the overburden.
Similarly, Marchionni et al. [84] used simple and multiple regression to provide cost functions and prediction bands for different types of assets of water supply systems based on hydraulic (i.e., flow, pump head, pump power) and physical (i.e., volume, material, diameter) characteristics of the assets. Gunduz and Sahin [85] derived a cost model for the construction of hydroelectric power-plant projects in Turkey based on estimated design discharge, design head, tunnel length, energy transmission line length, and estimated hundred-year occurrence flood discharge. Finally, most recently, LR has once again been employed to determine cost estimates for major infrastructure projects such as the tower construction for power-line distribution by Sha et al. [63]. In their study, tower type, height, and weight are implemented as independent variables in their regression analysis of data from similar projects in China.
All the above proposals for linear regression models aim to provide user-friendly methods of early cost estimation of important infrastructure projects for owners without knowledge or access to sophisticated machine learning techniques. Thus, they can make educated guesses of the costs of their projects at preliminary design stage by using simple linear equations and input variable values known at the early stages of planning.
Nevertheless, it is significant to mention that ANN analysis, like linear regression, produces mathematical models that belong to the category of empirical capacity models. Their architecture consists of hidden layers with various artificial neural cells that contain activation functions. Several studies use ANN to predict and estimate cost, duration, and even lane capacity [86,87,88,89].
This paper aims to present similar results and derive useful equations for the conceptual phase construction cost estimates of underground metro stations, which, to the best of the authors’ knowledge, have not been previously presented in the scientific literature. It is envisaged that the proposed models will allow underground metro public authorities to pre-estimate the quantities and therefore the cost of civil engineering works, especially during the initial stages of seeking funding. ANNs are also adopted to predict the material quantities or major work packages that can then be multiplied with applicable unit rates in each country of application.
3. Methodology
3.1. Research Objectives
The methodology employed follows an ”action” research style. First, it states the research questions within the context of a specific situation and collects and analyzes data with the ultimate goal of constituting the basis for the development of proposals to improve practice [90]. One unique feature of action research is that it can provide step-by-step processes for problem-solving and decision-making to improve practice [91]. Additionally, Jupp [92] notes that while its findings are not conventional in the sense of deriving a new theory, they can contribute to new practices, changing behavior patterns, or improvements in managerial processes.
Therefore, the current action research aims to investigate the gap in the literature regarding the lack of cost estimation models for the construction of underground metro stations based on early project data. It provides functions for the prediction of the total civil engineering costs (TCEC) and key material quantities and a step-by-step process for deriving increasingly more accurate estimates. This approach aims to provide underground metro public authorities with a decision-making tool for early forecasting costs of underground stations. Along with other similar work for the estimation of tunnel construction, M&E, and entire life cycle costs [75,83,93], it can provide them with a decision-making tool for detailed strategic planning, alternative scheme analysis, preliminary budget approval, and project funding requests. The chosen methods to be employed are LR and ANN using cost and material quantity data from previously constructed metro stations on the Athens Metro Line 3 extension.
3.2. Data Collection and Description
The data to be analyzed are actual project construction material quantities and costs from the construction tender documents from the Line 3 extension of the Athens Metro from Chaidari to Piraeus. It includes the construction of a 7.6 km underground tunnel, 8 ventilation shafts along the tunnel, and 6 new underground metro stations. Table 2 depicts the major technical characteristics of each station. In this section, the construction methods of the underground metro stations are briefly described to provide optimal understanding of the research and its results. For the construction of each station, the following general construction procedure was followed:
- Before the start of temporary support works, traffic and public utility bypassing works are carried out. At the same time, the site area is occupied, and the topographic network is installed to monitor the water table and the movements of the earth and adjacent structures during the excavation period. Then, the construction of the temporary retaining wall around the perimeter of the station’s ground plan is carried out, initially with the construction of concrete piles.
- Next, the station trench was excavated while taking the necessary excavation wall support measures and installing the required waterproofing materials.
- For stations S1 and S2, this was achieved by using only the C&C method whereby first, a temporary retaining wall made of concrete piles of at least 25 m length and 1.0 m diameter is constructed around the perimeter of the station, followed by the construction of a rectangular cross-section reinforced concrete that connects the pile heads. A safety parapet is placed on the pile head before excavation begins. Excavation progresses in stages, using project machinery such as excavators and loaders, at levels determined by the design. At each completed excavation level (1st, 2nd, etc.), to ensure the stability of the trench walls, prestressed anchors are installed and tensioned, and shotcrete of C20/25 grade, which is reinforced with a double structural grid (type T188), is applied to the vertical trench walls. This procedure is then repeated for each level of excavation down to the final level, where the temporary drain under the station foundation is constructed to discharge water from the excavation. This consists of a geotextile system, uniform large-sized gravel and polyester (nylon) membrane sheets applied to the floor and walls of the excavated trench.
- Stations S3, S4, and S6 were designed using a combination of the NATM and C&C methods because the space available at ground level for an open excavation was limited. First, smaller plan-area ventilation shafts are constructed using the C&C method. They ultimately constitute the ticketing and E/M facilities while providing the necessary access for the construction of the NATM tunnel section, which constitutes the station’s platform and track areas. Support of the excavated walls was provided by applying fiber-reinforced shotcrete and the using rock anchors (prestressed or passive), and placing of fore-polling beams in the shape of an umbrella.
- Station S5 foresaw the construction of a diaphragm wall surrounding the excavation perimeter and then the trench excavation using the Cover and Cut method. This was necessary due to its proximity to the sea, the resulting high groundwater level, and the need to return the ground level to traffic use as soon as possible. Therefore, following the completion of the construction of the diaphragm walls and the station roof slab, the immediate use of the ground-level area is allowed. Next, the rest of the excavation is carried out underground from top to bottom.
- After construction of both the temporary retaining wall and the temporary drainage system, with the formation of the corresponding working floor and the relevant surveying, the waterproofing of the station is installed.
- Once the installation of the waterproofing system is complete, the construction of the reinforced concrete shell of the station can begin from the bottom up, in the case of the C&C method, and from top to bottom for the Cover and Cut method. This includes forming and installing reinforcement, construction and or adjustment of the formwork, and pouring of the concrete to form all structural elements (slabs, beams, columns, perimeter walls, etc.) at each level of the station, from the foundation to the roof, following the approved design.
- Finally, surface restoration works include construction of curbs and gutters and surface drainage systems; connection of the station’s power, water, and telephone networks with the local networks; and paving of roads, lighting installations, and planting and irrigation networks. While the surface restoration works are underway, the construction of the underground station’s non-structural works are completed, including completion of construction, coating and painting of the nonbearing masonry, coating and painting of exposed concrete, installation of industrial flooring in the technical areas, laying of ceramic and granite tiles on the walls and floors, and hanging suspended ceilings and installation of windows.
Table 2.
Technical characteristics of the underground stations.
Table 2.
Technical characteristics of the underground stations.
| Station | S1 | S2 | S3 | S4 | S5 | S6 |
|---|---|---|---|---|---|---|
| Construction Method | C&C | C&C | C&C, NATM | C&C, NATM | Cover and Cut | C&C, NATM |
| NATM Length (m) | - | - | 35 | 110 | - | 43 |
| Geology | Lake Marl Deposits | Athens Schist | Athens Schist | Limestone | Marine Marl Deposits | Marine Marl Deposits |
| Theoretical Excavation Volume (V, m3) | 87.291 | 88.136 | 82.045 | 64.280 | 100.890 | 106.068 |
| Maximum Depth (d, m) | 28.90 | 26.40 | 28.00 | 27.00 | 27.00 | 28.00 |
| Average Level Area (Al, m2) | 3.020 | 3.338 | 2.930 | 2.381 | 3.737 | 3.788 |
| No. of Levels (n) | 3 | 2 | 3 | 4 | 3 | 3 |
| Total Floor Area (AT, m2) | 9.061 | 6.677 | 8.791 | 9.524 | 11.211 | 11.364 |
3.3. Material Quantity Data
The data collected were from the official construction contract tender documents and definitive designs. These refer to quantities from civil engineering works, as follows:
- Length of concrete piles by diameter category (m);
- Concrete volume for pile head construction (m3);
- Concrete volume of diaphragm walls (m3);
- Excavation volume per construction method (C&C and NATM) (m3);
- Length of prestressed anchors (m);
- Volume of shotcrete (m3);
- Surface area of waterproofing membrane (m2);
- Concrete volume for structural elements (slabs, beams, perimeter walls, columns) per excavation method (C&C and NATM) (m3);
- Steel reinforcement mass for the permanent concrete structure and the diaphragm walls (kg);
- Backfill volume (m3).
At the same time, the quantities of important architectural works were also collected. These, as budgeted in units of area measurement (m2), include the construction of nonbearing masonry (brickwork and scaffolding), coatings, painting of floors, walls, and ceilings, and the installation of suspended ceilings with the use of shaped aluminum sheets and perforated metal panels (Table 3).
Table 3.
Material quantity data.
3.4. Cost Data
According to the final design budget, the total cost for the construction of the “Chaidari–Piraeus” extension is EURO 343.96 million. This includes the construction of the six stations as described, the construction of ventilation shafts, the construction of the tunnels (using both TBM and NATM), and all the electromechanical works. The TCEC of the six underground stations amounts to EURO 118.35 million, or 34.4% of the total cost of the extension (Figure 1).
Table 4 presents cost data collected for the construction of each station. These data include only the civil engineering costs as derived from the tender budget. It is therefore based on unit gross rates and consists of all costs for construction (material, workmanship, machinery, etc.) and all indirect costs associated with the construction contract according to Greek national public works law.
Table 4.
Civil engineering cost breakdown in EURO.
4. Results and Validation
4.1. Cost Prediction Models Using Linear Regression
Figure 6 shows the distribution of the TCEC for all stations. Excavation and primary support account for 37.5% of the total cost, followed by reinforced concrete structures with 35.3% and architectural works with 14.1%.
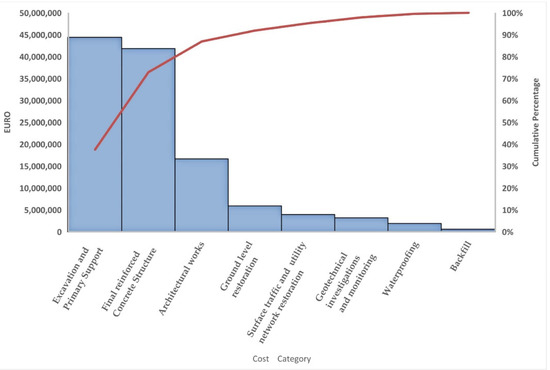
Figure 6.
Distribution of TCEC.
A series of multilinear regression analyses were carried out between costs as the dependent variable (DV) and a few general technical characteristics of the stations as the independent variables (IVs). Apart from the TCECs, the sum of the three major subcosts (excavation and support, reinforced concrete, and architectural works) was also examined as a dependent variable (MC) since, as shown in Figure 6, they account for a total of 85% of the TCE costs in close agreement with the Pareto theory.
The IVs examined were theoretical excavation volume (V), maximum depth (d), average level area (Al), number of levels (n), and total floor area (AT). Table 5 and Table 6 show the combinations examined, the resulting coefficient of determination (R2) achieved, and the resulting equation coefficients. The results indicate that the derived equation that provides the best fit, i.e., it returns the highest R2 value, is model 2.3. According to this, the sum of the major costs (MC) for excavation and support, reinforced concrete, and architectural works can be calculated when the total theoretical excavation volume (V), the total depth (d), and the total required floor area (AT) are known (Equation (1)):
MC = 41,965,771.58 + 166.72 × V − 1,778,392.95 × d + 1004.76 × AT
As shown previously, MC is approximately equal to 85% of TCEC, then the TCEC can be calculated using Equation (2):
TCEC = MC/0.85 = 49,371,495.98 + 196.14 × V − 2,092,227 × d + 1182.07 × AT
The regression analyses also provide a fairly well-fitting model (4.3) for use in the situation when the total depth (d), average floor level area (Al), and number of floors (n) are known. Then, the sum of the major costs (MC) can be calculated as follows:
MC = 12,338,312.63 − 1,037,060.47 × d + 7.816.11 × Al + 2,791,215.38 × n
As shown previously, MC is approximately equal to 85% of TCEC.Therefore, the TCEC can be calculated using Equation (4):
TCEC = MC/0.85 = 14,515,661.92 − 1,220,071.14 × d + 9,195.42 × Al + 3,283.782.80 × n
This is a useful equation, as at the preliminary design phase the required depth to which the station will be excavated is known, as it is the result of the general network alignment. In addition, the required average area per level is known and calculated according to the expected use, and the number of levels depends on the expected travelers per day.
Finally, the best-fitting equations for direct prediction of the TCEC are models 1.3 and 3.3, resulting in Equations (5) and (6):
TCEC = 49,257,993.05 + 215 × V − 2,074,444.6 × 5d + 919.03 × AT
TCEC = 16,790,221.65 − 1,189,814.04 × d + 8,833.51 × Al + 2,485,622.18 × n
Table 5.
Linear regression model results.
Table 5.
Linear regression model results.
| Model | DV | IV(s) | R2 |
|---|---|---|---|
| 1.1 | Total Cost | V | 0.560 |
| 1.2 | Total Cost | V,d | 0.660 |
| 1.3 | Total Cost | V,d, AT | 0.740 |
| 2.1 | Major Costs | V | 0.548 |
| 2.2 | Major Costs | V,d | 0.640 |
| 2.3 | Major Costs | V,d, AT | 0.775 |
| 3.1 | Total Cost | d, | 0.039 |
| 3.2 | Total Cost | d, Al | 0.668 |
| 3.3 | Total Cost | d, Al, n | 0.736 |
| 4.1 | Major Costs | d, | 0.034 |
| 4.2 | Major Costs | d, Al | 0.645 |
| 4.3 | Major Costs | d, Al, n | 0.766 |
| 5.1 | Total Cost | V | 0.560 |
| 5.2 | Total Cost | V, AT | 0.600 |
| 6.1 | Major Costs | V | 0.548 |
| 6.2 | Major Costs | V, AT | 0.629 |
Table 6.
Best-fitting regression models.
Table 6.
Best-fitting regression models.
| Model 2.3 R2 = 0.775 | (Constant) | 41,965,771.577 | Model 4.3 R2 = 0.766 | (Constant) | 12,338,312.629 | |
| Volume_m3 | 166.716 | Depth_m | −1,037,060.465 | |||
| Depth_m | −1,778,392.950 | AvFloorArea_m2 | 7816.114 | |||
| TotalFloorArea_m2 | 1004.755 | No.floors | 2,791,215.375 | |||
| Model 1.3 R2 = 0.740 | (Constant) | 49,257,993.048 | Model 3.3 R2 = 0.736 | (Constant) | 16,790,221.651 | |
| Volume_m3 | 214.998 | Depth_m | −1,189,814.042 | |||
| Depth_m | −2,074,444.650 | AvFloorArea_m2 | 8833,509 | |||
| TotalFloorArea_m2 | 919.027 | No.floors | 2,485,622,177 | |||
4.2. Material Quantity Models Based on Linear Regression, Ratios, and ANN
A series of multilinear regression analyses and production of ANN models using SPSS were carried out between various material quantity variables as the dependent variable and a few general technical characteristics of the stations as the independent variables.
A very good fit was found for the linear regression models for calculating the total required structural concrete volume (TCV) and shotcrete volume (SCV) based on the estimated theoretical excavation volume (V). Equations (7) and (8) present the proposed models with coefficients of determination (R2) equal to 0.996 and 0.665, respectively.
TCV = 0.25 × V + 300.06
SCV = 0.013 × V − 258.14
Similarly, an excellent fit was found for the linear regression model for estimating the required quantity of steel reinforcement (SR) based on the calculated TCV. Equation (7) presents the proposed model with an almost perfect coefficient of determination (R2 = 0.992).
SR = 132.80 × TCV+ 46,303.90
An important observation is the connection between the total theoretical excavation volume V and the quantity of piles, as calculated for each station. From Table 3 and Figure 7, it can be seen that for all six stations, the ratio of the volume of piles (PV) (m3) to V (m3) averages 3.6%, i.e., for every cubic meter of excavation, there is an estimated need for 0.036 m3 of concrete piles.
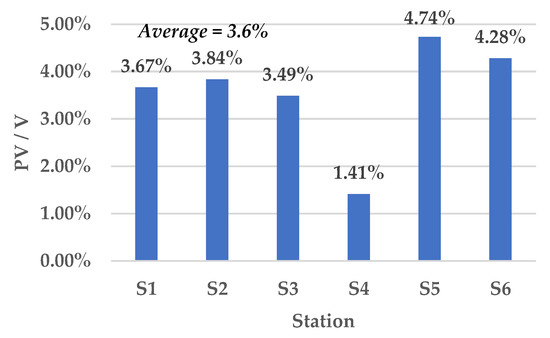
Figure 7.
Ratio of PV (m3) to V (m3) per station.
In particular, for the first three stations with identical geological conditions (Athens schist), the percentage ranges from 3.5% to 3.8%. In the case of stations with looser subsoil, such as S5 and S6 (marine marl deposits), we observe that the rate increases to 4.7% and 4.3%, respectively, which implies more cubic piles per cubic meter of excavation. In the case of station S4, the ratio of the quantity of piles to the volume of C&C excavation decreases to 1.4%, a result related to the hard ground conditions in the area (limestone). Similarly, the average ratio of shotcrete volume (SCV) per total theoretical excavation volume (V) was calculated as 0.99%, as shown in Figure 8. Finally, the average ratio of prestressed anchor length (PAL) to SCV was calculated as 22 (Figure 9).
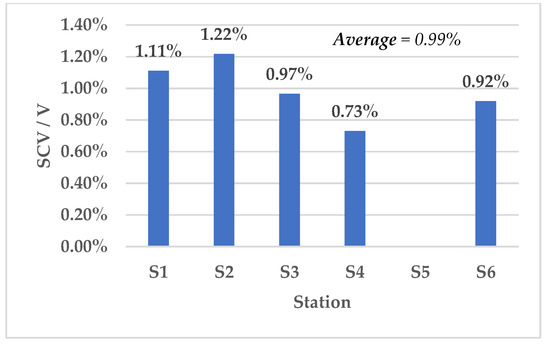
Figure 8.
Ratio of SCV (m3) to V (m3) per station.
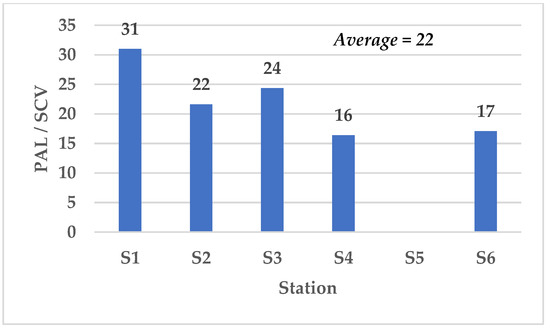
Figure 9.
Ratio of PAL (m) to SCV) (m3) per station.
Five material quantity prediction models were investigated based on ANNs created using IBM SPSS Statistics 23 statistical analysis software (SPSS). The models were based on the radial basis function in which 70% of the sample was assigned to training and 30% of the sample was assigned to testing. The number of neurons within the hidden layer is automatically computed. Table 7 presents the independent and dependent variables for each model.
Table 7.
Prediction models based on artificial neural networks.
In the case of attempting to predict TCV using V as an input variable (model 1), SPSS could not produce the model. In all other cases, the models were very efficient. The models for the predicting PV and SCV are the most successful ones (models 3 and 4).
4.3. Validation of Linear Regression Models
The predicted TCEC was calculated for each station using all four LR equations and, as shown in Table 8, all models deviated from the actual values by −13% to + 21%. This is considered acceptable considering the stage at which these estimates are made using very fundamental geometrical information, i.e., during the conceptual phase, where the accuracy of estimations usually is ±25% [85]. In Table 9, the three LR material quantity prediction models are applied to the dataset, also returning good results. More specifically, Equations (5)–(7) were applied to the dataset, and the results showed deviations from the actual values once again less than ±25% in almost all cases except for the prediction of total weight of steel reinforcement for station S5, where it was overestimated by 30%. Even this level of discrepancy is acceptable in the conceptual estimating phase [86,87].
Table 8.
Validation calculations for cost prediction models.
Table 9.
Validation calculations for material quantity prediction models.
4.4. Example Application of Models
Let us assume that a station is planned to be built on the under-design section of the Thessaloniki Metro extension toward the airport Macedonia. The estimated independent variables are given in Table 10.
Table 10.
Initial predesign technical characteristics of proposed station.
Since this station is to be built in Greece, we can use Equation (2) directly to estimate the TCEC, as follows:
TCE = 49,371,495.98 + 196.14 × V − 2,092,227 × d + 1,182.07 × AT = 49,371,495.98 + 196.14 × 90,000 − 2,092,227 × 28 + 1,182.07 × 3000 = 11.987.950€
In addition, this research work proposes quantity estimation models that can be used as an initial rule of thumb to provide early cost estimates for each underground station constructed anywhere worldwide having similar ground conditions as the Athens Metro by applying the following steps.
- Step 1: Estimate the theoretical total excavation volume (V), which can be taken as the external dimensions of the underground station itself. For example, consider that V = 90.000 m3;
- Step 2: Use Equation (8) to calculate the estimated shotcrete volume or the 1% average ratio of SCV/V to calculate SCV and then the PAL using the average ratio given in Figure 9:SCV = 0.013 × V−258.14 = 0.013 × 90,000 − 258.14 = 912 m3 (rounded up to the nearest unit).PAL = 22 × SCV = 22 × 912 = 20,064 m
- Step 3: Calculate PV by using the best-fit ratio provided in Figure 7 or using the average ratio (3.6%).PV = 3.6% × V = 3.6% × 90.000 = 3240 m3
- Step 4: Calculate TCV using Equation (7) and then SR using Equation (9):TCV = 0.25 × V + 300.06 = 0.25 × 90,000 + 300.06 = 22,800 m3SR = 132.80 × TCV + 46,303.90 = 132.80 × 22,800 + 46,303.90 = 3,074,144 kg.
- Step 5: Using the sum of V, SCV, PV, and PAL quantities multiplied by applicable unit rates in each country, an estimate of approximately 35% of TCECs is obtained corresponding to the excavation and primary support costs (Table 4). Similarly, the TCV and SR quantities can then be multiplied by the prevailing unit rates of concrete and steel relevant in each country and subsequently summed to obtain a pre-estimate of another 35% of the TCEC costs corresponding to the construction costs of the reinforced concrete structure. After adding, another 15% for architectural works and a remaining 15% for waterproofing, backfill, supplementary geotechnical investigations, monitoring, and ground-level restoration, a fairly representative cost estimate is obtained for the civil engineering works for the construction of underground metro stations.
5. Conclusions
This research contributes to the body of knowledge as the first attempt at providing total civil engineering construction cost and material quantity prediction models for underground metro stations based on data available at the conceptual design phase. It focused on analyzing civil engineering costs and material quantity data from six underground metro stations. Then, using these data, analytical equations based on linear regression analysis were proposed for obtaining early cost and material quantity pre-estimates. ANNs were constructed to develop key material quantity predictions for use by estimators in other countries. After comparison of the predicted and actual values for each metro station, it was found that the linear equations can be considered a good fit to the data, while efficient ANN models for material quantity prediction were also derived. The following conclusions can be drawn from this study:
- The MC variable consisting of the cost categories “excavation and support”, “reinforced concrete” and “architectural works” correspond to 85% of the TCE costs, in close agreement with the Pareto theory.
- The proposed formulae can be used at the preliminary phase to achieve reasonably accurate cost estimates of the civil engineering works for underground metro stations when only the theoretical excavation volume (V), total depth (d), and the average floor level area (Al) and/or the number of floors (n) are known. Using these cost equations is considered a convenient tool for achieving early estimates of the cost of underground metro stations when only limited geometrical information on the size of the stations is known, allowing allocated budgets to be spent wisely in producing safe, reliable, and sustainable transportation structures.
- The material quantity formulae and ANN models produced in this study for the estimation of key material quantities such as total concrete volume, steel reinforcement mass, pile volume, shotcrete volume, and prestressed anchor lengths can provide international decision-makers at early planning stages with major material quantity estimations. These can then be multiplied with relevant national unit rates to obtain civil engineering cost estimates for the construction of underground metro stations. In this way, the limitations in the cost estimation models due to international price fluctuations are overcome.
Limitations of this study are the small number of stations, specific ground conditions (marl deposits, Athens schist, limestone), structural codes of practice, national project procurement framework, and unit prices that affect the data employed. In addition, further research should include cost estimation models for financing not only the civil engineering construction costs, but also the operation and maintenance of such projects, which are time-dependent, thus requiring the implementation of robust models to be verified by sensitivity analyses. Nevertheless, the available data and resulting models can be considered a springboard for further research and refinement of the models for varying ground conditions and procurement procedures with collaborations and data sharing between researchers worldwide for the entire life cycle of underground metro stations.
Author Contributions
Conceptualization, D.K.; methodology, F.A., D.G. and G.A.; validation, F.A.; formal analysis, F.A., G.A. and D.G.; data curation, F.A. and D.G.; writing—original draft preparation, F.A., D.G. and D.K.; writing—review and editing, F.A., G.A. and D.K.; supervision D.K. All authors have read and agreed to the published version of the manuscript.
Funding
This research received no external funding.
Institutional Review Board Statement
Not applicable.
Informed Consent Statement
Not applicable.
Data Availability Statement
Acknowledgments
The support and provision of data by Attiko Metro S.A are gratefully acknowledged. The authors also would like to thank all reviewers for their constructive feedback that helped improve the quality of the paper.
Conflicts of Interest
The authors declare no conflict of interest.
References
- UTIP—International Association of Public Transport. The Metro: An Opportunity for Sustainable in Large Cities. Available online: https://www.uitp.org/ (accessed on 8 November 2022).
- UITP—International Association of Public Transport. World Metro Figures 2021. Available online: https://cms.uitp.org/wp/wp-content/uploads/2022/05/Statistics-Brief-Metro-Figures-2021-web.pdf (accessed on 8 November 2022).
- Benardos, A.; Sourouvali, N.; Mavrikos, A. Measuring and Benchmarking the Benefits of Athens Metro Extension Using an Ex-Post Cost Benefit Analysis. Tunn. Undergr. Space Technol. 2021, 111, 103859. [Google Scholar] [CrossRef]
- Papagiannakis, A.; Yiannakou, A. Do Citizens Understand the Benefits of Transit-Oriented Development? Exploring and Modeling Community Perceptions of a Metro Line under Construction in Thessaloniki, Greece. Sustainability 2022, 14, 7043. [Google Scholar] [CrossRef]
- Williams, H. Underground History—Cut and Cover Stations. Available online: https://underground-history.co.uk/cutncover.php (accessed on 9 November 2022).
- Mouratidis, A. The “Cut-and-Cover” and “Cover-and-Cut” Techniques in Highway Engineering. Electron. J. Geotech. Eng. 2008, 13, 1–15. [Google Scholar]
- ATTIKO METRO S.A. Transit in Athens. Available online: https://www.ametro.gr/?page_id=3984&lang=en (accessed on 8 November 2022).
- Barbole, S.S.; Ranadive, M.S.; Kharat, A.R. A Review on Application of NATM to Design of Underground Stations of Indian Metro Rail. In Recent Trends in Construction Technology and Management; Springer: Singapore, 2023; pp. 715–728. [Google Scholar]
- Antoniou, F.; Konstantinidis, D.; Aretoulis, G.; Xenidis, Y. Preliminary Construction Cost Estimates for Motorway Underpass Bridges. Int. J. Constr. Manag. 2018, 18, 321–330. [Google Scholar] [CrossRef]
- Hodgson, D.; Paton, S.; Cicmil, S. Great Expectations and Hard Times: The Paradoxical Experience of the Engineer as Project Manager. Int. J. Proj. Manag. 2011, 29, 374–382. [Google Scholar] [CrossRef]
- Antoniou, F. Delay Risk Assessment Models for Road Projects. Systems 2021, 9, 70. [Google Scholar] [CrossRef]
- Antoniou, F.; Merkouri, M. Accident Factors per Construction Type and Stage: A Synthesis of Scientific Research and Professional Experience. Int. J. Inj. Contr. Saf. Promot. 2021, 28, 439–453. [Google Scholar] [CrossRef]
- Kalogeraki, M.; Antoniou, F. Improving Risk Assessment for Transporting Dangerous Goods through European Road Tunnels: A Delphi Study. Systems 2021, 9, 80. [Google Scholar] [CrossRef]
- Marinelli, M.; Antoniou, F. Improving Public Works’ Value for Money: A New Procurement Strategy. Int. J. Manag. Proj. Bus. 2020, 13, 85–102. [Google Scholar] [CrossRef]
- Marinelli, M. Evaluation of PPP Road Projects in Greece. Built Environ. Proj. Asset Manag. 2019, 9, 186–198. [Google Scholar] [CrossRef]
- Antoniou, F.; Konstantinidis, D.; Aretoulis, G.N. Application of the Multi Attribute Utility Theory for the Selection of Project Procurement System for Greek Highway Projects. Int. J. Manag. Decis. Mak. 2016, 15, 83–112. [Google Scholar] [CrossRef]
- Antoniou, F.; Aretoulis, G.N.; Konstantinidis, D.; Papathanasiou, J. Choosing the Most Appropriate Contract Type for Compensating Major Highway Project Contractors. J. Comput. Optim. Econ. Financ. 2014, 6, 77–95. [Google Scholar]
- Antoniou, F.; Aretoulis, G.N.; Konstantinidis, D.K.; Kalfakakou, G.P. An Empirical Study of Researchers’ and Practitioners’ Views on Compensating Major Highway Project Contractors. Int. J. Manag. Decis. Mak. 2013, 12, 351–375. [Google Scholar] [CrossRef]
- Burke, R. Project Management: Planning and Control Techniques; John Wiley & Sons Ltd.: Chichester, UK, 1999. [Google Scholar]
- Flyvbjerg, B.; Holm, M.S.; Buhl, S. Underestimating Costs in Public Works Projects: Error or Lie? J. Am. Plan. Assoc. 2002, 68, 279–295. [Google Scholar] [CrossRef]
- Fragkakis, N.; Petroutsatou, K.; Marinelli, M. Preliminary Cost Estimate Model for Road Underpasses. In Proceedings of the Eighth International Conference on Construction in the 21st Century (CITC-8) “Changing the Field: Recent Developments for the Future of Engineering and Construction, Thessaloniki, Greece, 27 May 2015. [Google Scholar]
- Association for the Advancement of Cost Engineering AACE 18R-97: Cost Estimate Classification System—As Applied in Engineering, Procurement, and Construction for the Process Industries. 2005. Available online: https://www.costengineering.eu/Downloads/articles/AACE_CLASSIFICATION_SYSTEM.pdf (accessed on 8 January 2023).
- Hanioğlu, M.N. A Cost Based Approach to Project Management Planning and Controlling Construction Project Costs; Routledge: New York, NY, USA, 2023. [Google Scholar]
- Asmar, M.; Hanna, A.S.; Whited, G.C. New Approach to Developing Conceptual Cost Estimates for Highway Projects. J. Constr. Eng. Manag. 2011, 137, 942–949. [Google Scholar] [CrossRef]
- Dimitriou, L.; Marinelli, M.; Fragkakis, N. Early Bill-of-Quantities Estimation of Concrete Road Bridges: An Artificial Intelligence-Based Application. Public Works Manag. Policy 2018, 23, 127–149. [Google Scholar] [CrossRef]
- Petroutsatou, K.; Georgopoulos, E.; Lambropoulos, S.; Pantouvakis, J.P. Early Cost Estimating of Road Tunnel Construction Using Neural Networks. J. Constr. Eng. Manag. 2012, 138, 679–687. [Google Scholar] [CrossRef]
- Tayefeh Hashemi, S.; Ebadati, O.M.; Kaur, H. Cost Estimation and Prediction in Construction Projects: A Systematic Review on Machine Learning Techniques. SN Appl. Sci. 2020, 2, 1703. [Google Scholar] [CrossRef]
- Akanbi, T.; Zhang, J. Design Information Extraction from Construction Specifications to Support Cost Estimation. Autom. Constr. 2021, 131, 103835. [Google Scholar] [CrossRef]
- Alfaggi, W.; Naimi, S. An Optimal Cost Estimation Practices of Fuzzy AHP for Building Construction Projects in Libya. Civ. Eng. J. 2022, 8, 1194–1204. [Google Scholar] [CrossRef]
- Ali, Z.H.; Burhan, A.M.; Kassim, M.; Al-Khafaji, Z. Developing an Integrative Data Intelligence Model for Construction Cost Estimation. Complexity 2022, 2022, 4285328. [Google Scholar] [CrossRef]
- Alshboul, O.; Shehadeh, A.; Almasabha, G.; Almuflih, A.S. Extreme Gradient Boosting-Based Machine Learning Approach for Green Building Cost Prediction. Sustainability 2022, 14, 6651. [Google Scholar] [CrossRef]
- Alshboul, O.; Shehadeh, A.; Almasabha, G.; Al Mamlook, R.E.; Almuflih, A.S. Evaluating the Impact of External Support on Green Building Construction Cost: A Hybrid Mathematical and Machine Learning Prediction Approach. Buildings 2022, 12, 1256. [Google Scholar] [CrossRef]
- Al-Tawal, D.R.; Arafah, M.; Sweis, G.J. A Model Utilizing the Artificial Neural Network in Cost Estimation of Construction Projects in Jordan. Eng. Constr. Archit. Manag. 2021, 28, 2466–2488. [Google Scholar] [CrossRef]
- Challa, R.K.; Rao, K.S. An Effective Optimization of Time and Cost Estimation for Prefabrication Construction Management Using Artificial Neural Networks. Rev. D’intell. Artif. 2022, 36, 115–123. [Google Scholar] [CrossRef]
- Dang-Trinh, N.; Duc-Thang, P.; Nguyen-Ngoc Cuong, T.; Duc-Hoc, T. Machine Learning Models for Estimating Preliminary Factory Construction Cost: Case Study in Southern Vietnam. Int. J. Constr. Manag. 2022, 1–9. [Google Scholar] [CrossRef]
- Dobrucali, E.; Demir, I.H. A Simple Formulation for Early-Stage Cost Estimation of Building Construction Projects. J. Croat. Assoc. Civ. Eng. 2021, 73, 819–832. [Google Scholar] [CrossRef]
- Fazeli, A.; Dashti, M.S.; Jalaei, F.; Khanzadi, M. An Integrated BIM-Based Approach for Cost Estimation in Construction Projects. Eng. Constr. Archit. Manag. 2021, 28, 2828–2854. [Google Scholar] [CrossRef]
- Goel, S.; Oberoi, S.; Vats, A. Construction Cost Estimator: An Effective Approach to Estimate the Cost of Construction in Metropolitan Areas. In Proceedings of the 2021 3rd International Conference on Advances in Computing, Communication Control and Networking (ICAC3N), Greater Noida, India, 17–18 December 2021; pp. 122–127. [Google Scholar]
- Ismail, N.A.A.; Rooshdi, R.R.R.M.; Sahamir, S.R.; Ramli, H. Assessing BIM Adoption towards Reliability in QS Cost Estimates. Eng. J. 2021, 25, 155–164. [Google Scholar] [CrossRef]
- Ji, S.; Lee, B.; Yi, M.Y. Building Life-Span Prediction for Life Cycle Assessment and Life Cycle Cost Using Machine Learning: A Big Data Approach. Build. Environ. 2021, 205, 108267. [Google Scholar] [CrossRef]
- Kantianis, D.D. Design Morphology Complexity and Conceptual Building Project Cost Forecasting. J. Financ. Manag. Prop. Constr. 2022, 27, 387–414. [Google Scholar] [CrossRef]
- Le, H.T.T.; Likhitruangsilp, V.; Yabuki, N. A Bim-Database-Integrated System for Construction Cost Estimation. ASEAN Eng. J. 2021, 11, 45–59. [Google Scholar] [CrossRef]
- Nehasilová, M.; Lupíšek, A.; Coufalová, P.L.; Kupsa, T.; Veselka, J.; Vlasatá, B.; Železná, J.; Kunová, P.; Volf, M. Rapid Environmental Assessment of Buildings: Linking Environmental and Cost Estimating Databases. Sustainability 2022, 14, 10928. [Google Scholar] [CrossRef]
- Park, U.; Kang, Y.; Lee, H.; Yun, S. A Stacking Heterogeneous Ensemble Learning Method for the Prediction of Building Construction Project Costs. Appl. Sci. 2022, 12, 9729. [Google Scholar] [CrossRef]
- Rouhanizadeh, B.; Kermanshachi, S.; Ramaji, I.J.; Shakerian, S. Development of an Automated Tool for Cost Estimation of Transportation Projects. In Proceedings of the International Conference on Transportation and Development 2021, Virtually, 8–10 June 2021; American Society of Civil Engineers: Reston, VA, USA, 2021; pp. 178–190. [Google Scholar]
- Santos, M.C.F.; Costa, D.B.; de Andrade Marques Ferreira, E. Conceptual Framework for Integrating Cost Estimating and Scheduling with BIM. In International Conference on Computing in Civil and Building Engineering; Springer: Cham, Switzerland, 2021; pp. 613–625. [Google Scholar]
- Sharma, V.; Zaki, M.; Jha, K.N.; Krishnan, N.M.A. Machine Learning-Aided Cost Prediction and Optimization in Construction Operations. Engineering. Constr. Archit. Manag. 2022, 29, 1241–1257. [Google Scholar] [CrossRef]
- Tung, S.H.; Wang, K.C.; Yu, P.Y. Establish a Cost Estimation Model for Pre-Sold Home Customization Based on BIM and VR. In Proceedings of the 38th International Symposium on Automation and Robotics in Construction, Dubai, United Arab Emirates, 2–4 November 2021; International Association for Automation and Robotics in Construction (IAARC): Dubai, United Arab Emirates, 2021; pp. 243–247. [Google Scholar]
- Ujong, J.A.; Mbadike, E.M.; Alaneme, G.U. Prediction of Cost and Duration of Building Construction Using Artificial Neural Network. Asian J. Civ. Eng. 2022, 23, 1117–1139. [Google Scholar] [CrossRef]
- Wahab, A.; Wang, J. Factors-Driven Comparison between BIM-Based and Traditional 2D Quantity Takeoff in Construction Cost Estimation. Eng. Constr. Archit. Manag. 2022, 29, 702–715. [Google Scholar] [CrossRef]
- Wang, B.; Yuan, J.; Ghafoor, K.Z. Research on Construction Cost Estimation Based on Artificial Intelligence Technology. Scalable Comput. Pract. Exp. 2021, 22, 93–104. [Google Scholar] [CrossRef]
- Xu, J.; Ye, M. Construction Project Cost Estimation Model Cost Dependent on Multi-Objective Fuzzy Optimization Calculation. J. Phys. Conf. Ser. 2021, 1904, 012001. [Google Scholar] [CrossRef]
- Yang, S.-W.; Moon, S.-W.; Jang, H.; Choo, S.; Kim, S.-A. Parametric Method and Building Information Modeling-Based Cost Estimation Model for Construction Cost Prediction in Architectural Planning. Appl. Sci. 2022, 12, 9553. [Google Scholar] [CrossRef]
- Ye, D. An Algorithm for Construction Project Cost Forecast Based on Particle Swarm Optimization-Guided BP Neural Network. Sci. Program. 2021, 2021, 4309495. [Google Scholar] [CrossRef]
- Zhang, X.; Song, J.; Zha, C. A Whole Process Cost Prediction System for Construction Projects Based on Improved Support Vector Machines. Int. J. Circuits Syst. Signal Process. 2022, 16, 278–286. [Google Scholar] [CrossRef]
- Ibrahim, A.H.; Elshwadfy, L.M. Assessment of Construction Project Cost Estimating Accuracy in Egypt. Open Civ. Eng. J. 2021, 15, 290–298. [Google Scholar] [CrossRef]
- Alsharif, S.; Karatas, A. Data-Driven Approach for Improving Schedule and Cost Estimation of Nuclear Power Plant Projects. In Nuclear Power Plants Recent Progress and Future Directions; Nova Science Publishers, Inc.: Hauppauge, NY, USA, 2022; pp. 137–179. [Google Scholar]
- Choi, C.-Y.; Ryu, K.R.; Shahandashti, M. Predicting City-Level Construction Cost Index Using Linear Forecasting Models. J. Constr. Eng. Manag. 2021, 147, 04020158. [Google Scholar] [CrossRef]
- Geng, S.; Tian, Z.; Ji, Z.; Niu, D.; Guo, X. Project Cost Prediction of Overhead Line Based on Big Data Analysis of Power Grid Engineering. In Cyber Security Intelligence and Analytics; Springer: Cham, Switzerland, 2021; pp. 557–566. [Google Scholar]
- Idris, M.; Kartika, R.H.; Nugroho, A.; Sulaeman, D.R.; Visang, F.S.I.; Wiratmoko, D. Estimation of EPC Cost Index for Gas Engine Power Plant Project in Indonesia. In Proceedings of the 2021 International Conference on Technology and Policy in Energy and Electric Power (ICT-PEP), Yogyakarta, Indonesia, 29–30 September 2021; pp. 28–32. [Google Scholar]
- Ji, H.; Xu, Y.; Shi, L.; Lu, Y. Cost Prediction of Distribution Network Project Based on DART Model. In Proceedings of the 2022 IEEE 6th Information Technology and Mechatronics Engineering Conference (ITOEC), Chongqing, China, 4–6 March 2022; pp. 232–237. [Google Scholar]
- Kim, S.; Abediniangerabi, B.; Shahandashti, M. Forecasting Pipline Construction Costs Using Recurrent Neural Networks. In Proceedings of the Pipelines 2021: Planning—Proceedings of Sessions of the Pipelines 2021 Conference, Virtually, 3–6 August 2021; Volume 13. [Google Scholar]
- Sha, J.; Dong, H.; Xie, H.; Yang, B.; Shang, X.; Ling, Y. Construction Cost Prediction of Transmission Line Engineering Under the Background of Big Data. In Proceedings of the STSIoT 2021: The 2021 International Conference on Smart Technologies and Systems for Internet of Things, Virtually, 3 July 2022. [Google Scholar]
- Feng, F. Cost Prediction of Municipal Road Engineering Based on Optimization of SVM Parameters by RF-WPA Hybrid Algorithm; Springer: Cham, Switzerland, 2022; Volume 138. [Google Scholar]
- Gante, D.V.; Silva, D.L.; Leopoldo, M.P. Forecasting Construction Cost Using Artificial Neural Network for Road Projects in the Department of Public Works and Highways Region XI. In Proceedings of the Frontiers in Artificial Intelligence and Applications, Virtual, 15–18 August 2022; IOS Press BV: Amsterdam, The Netherlands; Volume 352, pp. 64–71. [Google Scholar]
- Lee, J.G.; Lee, H.-S.; Park, M.; Seo, J. Early-Stage Cost Estimation Model for Power Generation Project with Limited Historical Data. Eng. Constr. Archit. Manag. 2022, 29, 2599–2614. [Google Scholar] [CrossRef]
- Mohamed, B.; Moselhi, O. Conceptual Estimation of Construction Duration and Cost of Public Highway Projects. J. Inf. Technol. Constr. 2022, 27, 595–618. [Google Scholar] [CrossRef]
- Sharma, S.; Ahmed, S.; Naseem, M.; Alnumay, W.S.; Singh, S.; Cho, G.H. A Survey on Applications of Artificial Intelligence for Pre-Parametric Project Cost and Soil Shear-Strength Estimation in Construction and Geotechnical Engineering. Sensors 2021, 21, 463. [Google Scholar] [CrossRef]
- Warren, J.; Allen, D.; Storey, J. Systematic Cost Estimating Tool for the Mississippi Department of Transportation. In Proceedings of the IISE Annual Conference and Expo 2022, Seattle, WA, USA, 21–24 May 2022. [Google Scholar]
- Kovačević, M.; Ivanišević, N.; Petronijević, P. Construction Cost Estimation of Reinforced and Prestressed Concrete Bridges Using Machine Learning. J. Croat. Assoc. Civ. Eng. 2021, 73, 1–13. [Google Scholar] [CrossRef]
- Liu, S.; Hou, D. Construction Cost Prediction of Main Tunnel in Railway Tunnel Based on Support Vector Machine. J. Railw. Eng. Soc. 2022, 39, 108–113. [Google Scholar]
- Mahmoodzadeh, A.; Mohammadi, M.; Abdulhamid, S.N.; Ibrahim, H.H.; Ali, H.F.H.; Nejati, H.R.; Rashidi, S. Prediction of Duration and Construction Cost of Road Tunnels Using Gaussian Process Regression. Geomech. Eng. 2022, 28, 65–75. [Google Scholar] [CrossRef]
- Mahmoodzadeh, A.; Mohammadi, M.; Daraei, A.; Farid Hama Ali, H.; Ismail Abdullah, A.; Kameran Al-Salihi, N. Forecasting Tunnel Geology, Construction Time and Costs Using Machine Learning Methods. Neural Comput. Appl. 2021, 33, 321–348. [Google Scholar] [CrossRef]
- Mahmoodzadeh, A.; Nejati, H.R.; Mohammadi, M.; Hashim Ibrahim, H.; Khishe, M.; Rashidi, S.; Hussein Mohammed, A. Developing Six Hybrid Machine Learning Models Based on Gaussian Process Regression and Meta-Heuristic Optimization Algorithms for Prediction of Duration and Cost of Road Tunnels Construction. Tunn. Undergr. Space Technol. 2022, 130, 104759. [Google Scholar] [CrossRef]
- Petroutsatou, K.; Maravas, A.; Saramourtsis, A. A Life Cycle Model for Estimating Road Tunnel Cost. Tunn. Undergr. Space Technol. 2021, 111, 103858. [Google Scholar] [CrossRef]
- Alshemosi, A.M.B.; Alsaad, H.S.A. Cost Estimation Process for Construction Residential Projects by Using Multifactor Linear Regression Technique. Int. J. Sci. Res. 2015, 6, 2319–7064. [Google Scholar] [CrossRef]
- Alshamrani, O.S. Construction Cost Prediction Model for Conventional and Sustainable College Buildings in North America. J. Taibah Univ. Sci. 2017, 11, 315–323. [Google Scholar] [CrossRef]
- Sodikov, J. Cost Estimation of Highway Projects in Developing Countries: Artificaila Neural Network Approach. J. East. Asia Soc. Transp. Stud. 2005, 6, 1036–1047. [Google Scholar]
- Antoniou, F.; Konstantinidis, D.; Aretoulis, G. Analytical Formulation for Early Cost Estimation and Material Consumption of Road Overpass Bridges. Res. J. Appl. Sci. Eng. Technol. 2016, 12, 716–725. [Google Scholar] [CrossRef]
- Antoniou, F.; Marinelli, M. Proposal for the Promotion of Standardization of Precast Beams in Highway Concrete Bridges. Front. Built Environ. 2020, 6, 119. [Google Scholar] [CrossRef]
- Fragkakis, N.; Lambropoulos, S.; Pantouvakis, J.-P. A Cost Estimate Method for Bridge Superstructures Using Regression Analysis and Bootstrap. Organ. Technol. Manag. Constr. 2010, 2, 182–190. [Google Scholar]
- Fragkakis, N.; Marinelli, M.; Lambropoulos, S. Preliminary Cost Estimate Model for Culverts. Procedia Eng. 2015, 123, 153–161. [Google Scholar] [CrossRef]
- Petroutsatou, C.; Lambropoulos, S.; Pantouvakis, J.-P. Road Tunnel Early Cost Estimates Using Multiple Regression Analysis. Oper. Res. 2006, 6, 311–322. [Google Scholar] [CrossRef]
- Marchionni, V.; Cabral, M.; Amado, C.; Covas, D. Estimating Water Supply Infrastructure Cost Using Regression Techniques. J. Water Resour. Plan. Manag. 2016, 142, 04016003. [Google Scholar] [CrossRef]
- Gunduz, M.; Sahin, H.B. An Early Cost Estimation Model for Hydroelectric Power Plant Projects Using Neural Networks and Multiple Regression Analysis. J. Civ. Eng. Manag. 2015, 21, 470–477. [Google Scholar] [CrossRef]
- Aretoulis, G.N. Neural Network Models for Actual Cost Prediction in Greek Public Highway Projects. Int. J. Proj. Organ. Manag. 2019, 11, 41. [Google Scholar] [CrossRef]
- Titirla, M.; Aretoulis, G. Neural Network Models for Actual Duration of Greek Highway Projects. J. Eng. Des. Technol. 2019, 17, 1323–1339. [Google Scholar] [CrossRef]
- Titirla, M.; Larbi, W.; Aretoulis, G. Prediction Methods for the Actual Duration of Greek Highway Projects. WSEAS Trans. Bus. Econ. 2021, 18, 1389–1396. [Google Scholar] [CrossRef]
- Anagnostopoulos, A.; Kehagia, F.; Damaskou, E.; Mouratidis, A.; Aretoulis, G. Predicting Roundabout Lane Capacity Using Artificial Neural Networks. J. Eng. Sci. Technol. Rev. 2021, 14, 210–215. [Google Scholar] [CrossRef]
- Robson, C.; McCartan, K. Real World Research, 4th ed.; John Wiley & Sons: Chichester, UK, 2016. [Google Scholar]
- Koshy, V. Action Research for Improving Practice—A Practical Guide; Paul Chapman Publishing: London, UK, 2005. [Google Scholar]
- Jupp, V. The Sage Dictionary of Social Research Methods; Sage Publications Ltd.: London, UK, 2006. [Google Scholar]
- Lee, H.L.; Sung, W.S.; Song, K.L. Comparison between Various Multiple Linear Regression Model for Prediction of TBM Performance. In Proceedings of the Sustainable Civil Infrastructures, Hangzhou, China, 23–25 July 2018. [Google Scholar]


Disclaimer/Publisher’s Note: The statements, opinions and data contained in all publications are solely those of the individual author(s) and contributor(s) and not of MDPI and/or the editor(s). MDPI and/or the editor(s) disclaim responsibility for any injury to people or property resulting from any ideas, methods, instructions or products referred to in the content. |
© 2023 by the authors. Licensee MDPI, Basel, Switzerland. This article is an open access article distributed under the terms and conditions of the Creative Commons Attribution (CC BY) license (https://creativecommons.org/licenses/by/4.0/).