1. Introduction
Nowadays, energy needs for buildings account for one-third of the global total final energy consumption [
1], and they are responsible for 37% of energy-related CO
2 greenhouse gas (GHG) emissions into the atmosphere [
2]. According to the European Observatory Building Stock [
3] in Italy, non-residential buildings are characterized by energy consumption of 1.5 times higher than the European average. Industrial buildings in particular are one of the most highly consuming sectors. For instance, they account for about 22% of the total final energy consumption in Italy [
4]. Such legacy buildings are highly energy-intensive mainly because of their old age. The majority of industrial facilities were built by the end of the 1980s [
5], when both energy and environmental regulations were completely lacking or by far looser than the current ones. These facilities are characterized by similar architectural, structural and technological features as well as affected by evidently poor energy performance. Thermal insulation is often not adequately included in building envelope components, and their minimum required thermal transmittance is often not guaranteed [
6]. All of these issues, along with a low airtightness level of windows and external walls, inevitably affect internal comfort conditions and, consequently, workers’ wellbeing. Moreover, the energy supply systems are also currently obsolete and rely on fossil fuels. Considering this background, retrofitting interventions should surely address the external envelope as well as new systems for both heating and cooling while also including strategies to ensure energy production from renewables. Such integrated redevelopment measures should be also considered in the perspective of European efforts toward carbon-neutrality and sustainable cities. Within this scenario, vertical greeneries can be regarded as one of the most promising possible retrofitting alternatives. Some interesting features suggesting their great potential in refurbishment interventions can be retraced in the literature. These technological solutions show considerable impacts to ameliorate microclimate and environmental conditions in urban areas. For this reason, a growing interest on greenery interventions can be retraced in the literature because of their potential to tackle the Urban Heat Islands (UHI) effect [
7,
8], lower pollutants’ concentrations [
9] and reduce noise levels as well [
10]. At the building scale, vertical greeneries can also improve external envelope performance: the beneficial effects on energy performance in both the winter and summer seasons are highlighted by several authors [
11,
12]. At the same time, some practical aspects such as the reduced space requested for installation, their feasibility and their aesthetic results can also be pointed out as favorable aspects incentivizing their spread [
13].
Even if most of experimental studies and simulations retrieved in the literature are related to other building types and intended uses (e.g., office buildings, residential, education facilities [
14,
15], etc.), greenery installation can be considered for application on existing industrial buildings. Recurring to this solution, in fact, a multipurpose redevelopment can be achieved to address energy and environmental performance as well as enhance aesthetic value. Considering the latter, studies highlighting the beneficial effects on workers’ wellbeing and satisfaction are available in the literature [
16].
Such results can be particularly interesting because facilities for industry and manufacturing are usually located in specifically intended use districts characterized by homogeneous, anonymous and low-quality architectural tissue. These urban portions, which are densely built and totally paved, usually suffer from a total absence of green areas. Installing green walls could reduce building surfaces’ reflectivity, enhance pollutants’ depositions and provide higher aesthetic quality. Focusing on the building scale, indirect green walls were also identified as a convenient retrofitting solution thanks to quite easy installation phases and their reduced weight, especially when compared to conventional shading systems or finishing layers. Industrial buildings show some characteristics that make them particularly suitable for direct green façade installation. Being surrounded by other facilities of similar height and adequately maneuverable areas, industrial buildings’ external surfaces are usually highly sunlit. This condition could ensure effective exploitation of the shading effects provided by vegetation, especially during the hottest months; taking into account Italian latitude, its cooling potential can decrease overheating, improving comfort conditions for workers and reducing cooling energy demand. The regular geometry of all of the different typological variants retrieved on the existing building stock [
17] is another enhancing factor. Simply shaped buildings guarantee less complex and expensive procedures during the installation phase and, at the same time, results in enhanced global effectiveness of green walls. The aim of this paper is to evaluate the results achievable following the adoption of an indirect green façade as a retrofitting measure for existing industrial buildings by selecting a real facility in Tuscany as a representative case study. For completeness, different geometries, window-to-wall ratio (WWR) and percentages of vertical greenery on the façades are considered. The goal is to assess the influence of vertical greenery on building energy performance thanks to simulations carried out in the DesignBuilder environment.
The paper develops in six different sections:
Section 1 (current section) presents the topic of the research and the current knowledge gaps,
Section 2 points out the evidence retrievable from literature,
Section 3 explains the procedure adopted for this research,
Section 4 details the results,
Section 5 provides discussion of the main outputs, and
Section 6 gives conclusions as well as suggestions for some future developments.
2. Background
Several studies can be retrieved in the literature dealing with the assessment of vertical greenery’s potential. Cosola et al. [
18] demonstrated that outdoor air temperature reduction is mainly affected by the shading capacity related to the vegetation type, the evapotranspiration process and the presence of the substrate. They pointed out that green walls can be considered a climate change mitigation strategy in urban environments. El Menshawy et al. [
19], analyzing a case study in upper Egypt, stressed that green walls can reduce energy consumption, energy cost and noise pollution as well as improve the air quality and the aesthetic quality of buildings. Finally, Addo-Bankas et al. [
20] outlined that green walls can treat both greywater and wastewater for reusing scope. Moreover, they pointed out that the design of the green walls, the type of substrate used and the proper operational conditions can improve the overall performance of the system.
According to the most widespread classification adopted by researchers in some extensive reviews [
21,
22,
23], different technological solutions are nowadays available for green walls’ installation: direct green façades, indirect green façades and living walls. The first solution is characterized by the presence of vegetation rooted in the ground and growing directly over the external surfaces of buildings. The same scheme is proposed for an indirect green façade, also called a double-skin green façade or green curtains. In this case, climbing plants are grown over a dedicated frame made of modular trellises, wired or mesh sub-structures that can be self-bearing or attached to building elements [
23]. Living walls represent the most recent and advanced greenery vertical system, characterized by the presence on the vertical plane of a substratum of soil or other growing media in which the vegetation is planted [
24].
Considering the Italian scenario, several studies were performed showing comparable results confirming the general efficiency of green walls.
An experimental field measurement campaign was carried out considering three different locations in northern and central Italy and three different technological alternatives for living walls [
25]. Depending on different orientations and green façade types, the differences in external wall surface temperature ranged from 12 °C to 20 °C on sunny days and 1–2 °C on cloudy ones. According to Perini et al. [
26], living walls are the most effective solution, reducing the external temperature up to 20 °C when compared to bare walls during the day. They also suggested coupling the HVAC system with inlet air ducts extracting external air from the cavity behind the greening panels.
Keeping the focus on the Mediterranean region, the performance of green façades was also assessed in other countries, such as Greece and Spain. Climbing vegetation also proved to be an effective solution, especially on very warm days. It can be easily applied, and it shows appreciable potential in compensating existing bad passive design by reducing solar impact. Moreover, it was found that energy saving during summer is directly proportional to the % of green covering [
27]. In this regard, Perez et al. [
23] considered as a test case a retrofitted building with indirect green façades using Winsteria Sinesis. The surface temperature in bare areas was, on average, 5.5 °C higher than in green-covered ones during the hottest months. Moreover, an increase in relative humidity of about 7% was measured because of the coupled effects of evapotranspiration and shading. Similar results were also obtained in continental climate zones, as demonstrated by on-field measurements collected in Chicago by Susorova et al. [
28]. In addition, they certified a considerable decrease in air velocity close to the walls of vegetation. The combination of reduced air speed and lowered temperature can positively act on building airtightness: a decrease in air infiltration ranging from 4% (S) to 12% (W) can be obtained. The decrease of wind velocity can also be beneficial in terms of augmented thermal insulation, as analyzed in detail by Perini et al. [
26] starting from in situ measurements.
Other scientific contributions were exclusively focused on the winter performance of greenery systems and mainly dealt with temperate climates. Working on small-scale brick cuboids containing recipients filled with water at a constant temperature and covered with Hedera Helix, Cameron et al. [
29] aimed at estimating energy saving potential in the UK’s maritime climate. The data collected over two winter periods suggest significant energy-saving potential (up to −37% in water heating consumption) using direct greenery. It was particularly beneficial during extremely cold days and windy periods, ensuring higher temperatures for external surfaces and limited fluctuations. On the other hand, other authors highlighted some possible disadvantages caused by green walls during heating periods at lower latitudes due to the reduction in the amount of sunlight positively contributing to the thermal balance of the building. Starting from the results of energy simulations considering Portuguese climate conditions, Carlos et al. [
30] suggested using deciduous plant species in greeneries installed on south-facing walls.
Humid areas with subtropical climates seem to be particularly suitable for implementing green walls, and several studies related to this region can be found in the literature [
31]. The same authors, considering the same location, also provided a parametric study to evaluate the influences of building features and plant characteristics on green walls’ effectiveness and to extend the analysis to a district level [
32]. The suitability of living walls in humid areas is stated also by Karimi et al. [
33] comparing field measurements registered in an existing building covered with a direct green façade and the results of energy simulations.
Improvements in the thermal behavior of buildings connected with greening interventions can be influenced by several different parameters. Leaf Area Index (LAI) appears to be one of the most influential parameters because it is strictly related to shading and wind barrier effects. In particular, a linear dependency between LAI, the shading coefficient and greenery effectiveness can be found in the literature [
32]. Moreover, it is also important to remark that the architectonic characteristics of buildings greatly affects the general efficacy of greening interventions [
33,
34].
To conclude, it is important to stress that despite the solid scientific background in terms of experimental evidence and data collection regarding green façades, knowledge gaps and uncertainties still affect aspects of modelling their physical properties and, consequently, building energy simulations [
35]. Different promising mathematical models have been formulated over the years, but none of them are currently available within the most widely adopted energy simulation software. For instance, the performance of both deciduous and evergreen vegetation for a green wall application was simulated with a dynamic computer model using the DEROB system of programs [
36]. Kontoleon et al. [
37] investigated the thermal behavior of a building zone where greenery coverage was applied using a thermal-network model (PCW-model). Scarpa et al. [
38] used the finite volume approach to define the wall stratigraphy through a RC network, dividing the wall structure into five layers and eleven thermal nodes.
Finally, using the DesignBuilder (DB) [
39] modelling environment coupled with the EnergyPlus [
40] simulation engine, a detailed and reliable model was produced only for green roofs.
3. Method
A real case study building located in Tuscany was selected as the representative case study, and an energy model was obtained for working in the DesignBuilder environment. As already introduced, several limitations currently affect green-wall modelling; a simplified approach was adopted and proposed in this paper by following the evidence obtained by other authors in the literature [
41]. For this purpose, standard component blocks were introduced to model indirect green façades to reproduce their shading effect. The greening retrofitting intervention was adopted as corresponding to the external walls of the workshop hall, the largest department in terms of covered surface and volume. The results were evaluated by comparing them with the ones certified by experimental campaigns available in the literature and with the findings provided by previous similar research using other simulation software. The energy analyses carried out were refined in relation to different buildings’ geometry configurations and their external walls’ characteristics. In this way, it was possible to evaluate the dependance of green façade installation on a building’s distinguishing factors (such as dimension, form factor S/V m
−1 and, thus, the ratio between the dispersing surface and the conditioning volume, WWR). After analyzing the real case study building (3N_2W), assumptions were made to modify its geometry and WWR in order to meet the most recurrent features of this building type. These assumptions were considered because of the evidence collected from a statistical analysis [
17] and other evidence found in the literature.
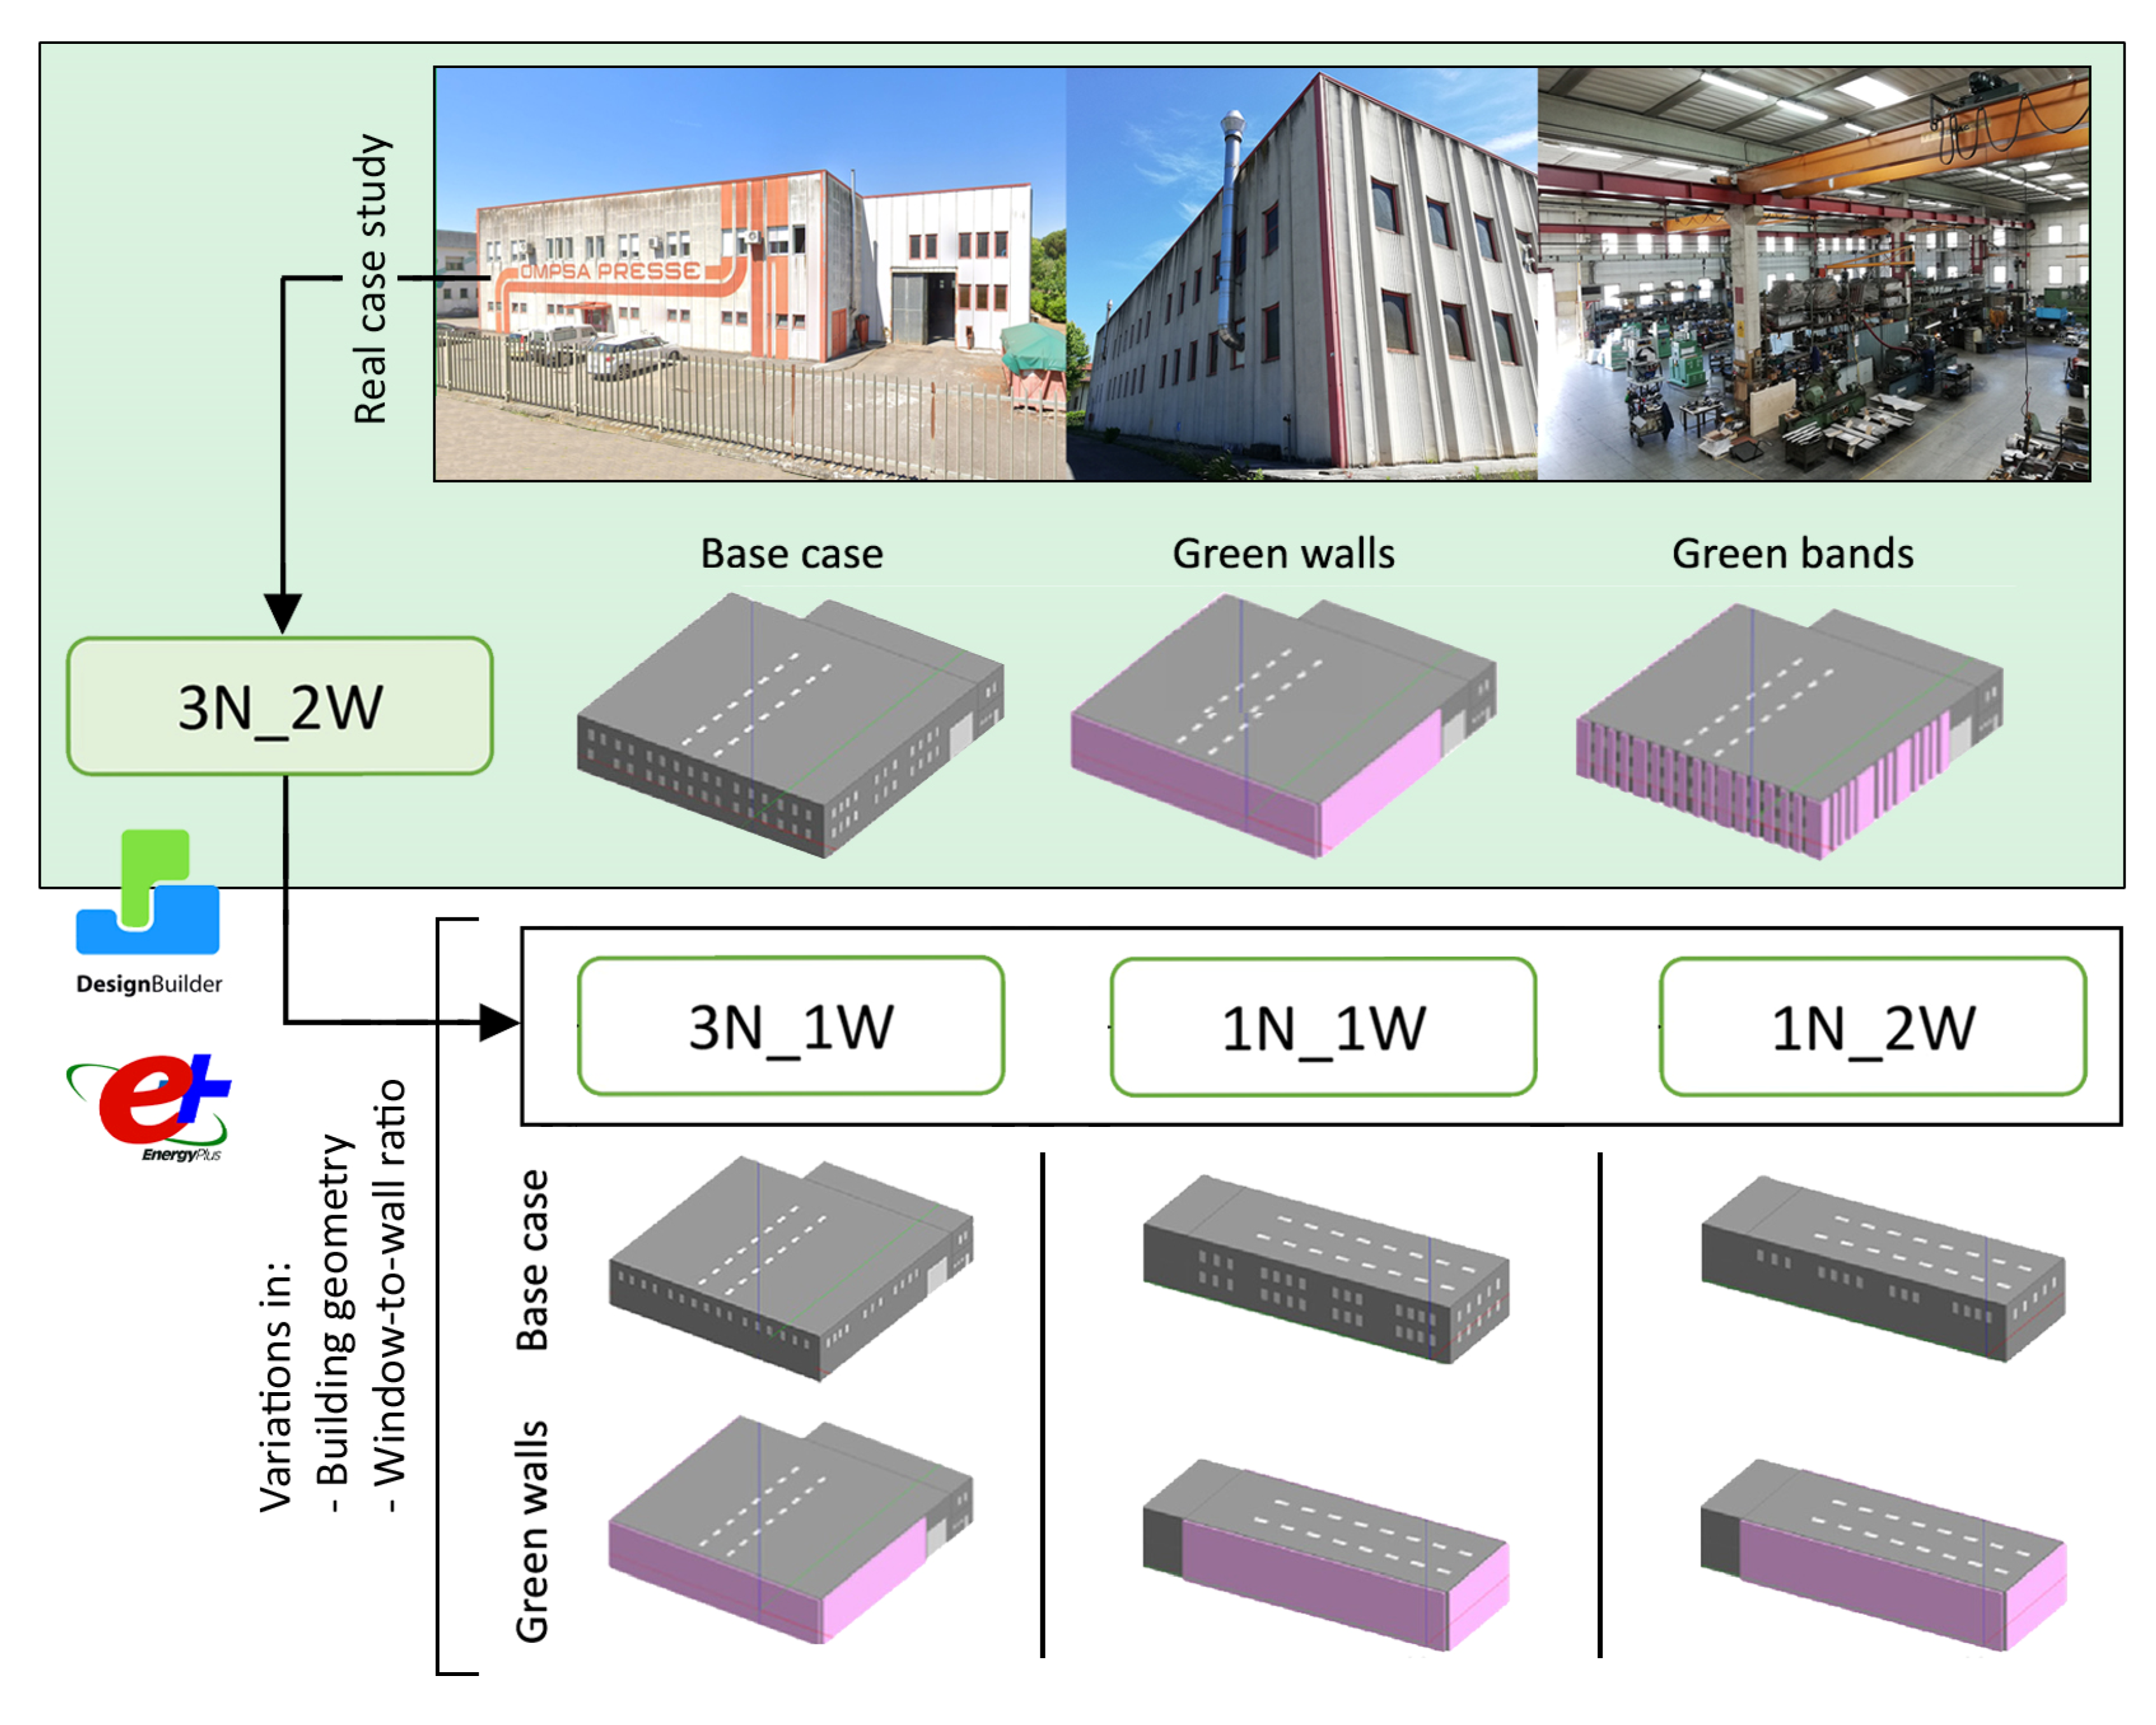
Figure 1 summarizes the workflow adopted for this research, highlighting the various models produced to describe the different configurations.
The models will be referred to in the text as 3N_2W (reference of the real case study building), 3N_1W, 1N_2W and 1N_1W. The first two models are representative of buildings with 3 naves with 2 (3N_2W) or 1 (3N_1W) rows of windows in the external walls. With the same approach, smaller buildings characterized by a single nave were analyzed. The naves’ width were considered equal to 14 m, with a total length of 36 m (4 spans of 9 m each) in the production hall. For the office and services block, a single span of 6 m was considered, whereas the width varied according to the number of naves. All of the other characteristics, both in terms of system and construction stratigraphy settings, were assumed to be invariant. With exclusive reference to the 3N_2W model, different geometries for greenery portions were also tested. For this purpose, vertical greening bands excluding windows were simulated, leaving all of the other properties unchanged. The eastern face was not included in the analyses. Because it represents the façade of the office department, detailed simulations should be carried out to assess visual comfort for the workers, and a different formal retrofit solution could be considered to emphasize its representative function from an architectural point of view.
Table 1 collects the main characteristics of the various configurations considered.
In all of the simulations performed, climate and environmental data were chosen from reference temperate and sub-coastal climate conditions registered in Florence, whose main related characteristics are reported in
Table 2.
3.1. Case Study Description
The selected building dates back to 1982, and it is currently occupied by a company operating in the field of light-weight mechanics. Specifically, the building hosts an office department, storage areas, changing rooms and a workshop hall. The latter occupies 90% of the whole covered surface (about 1600 m2), and it has a double-height volume with a total internal height equal to 8 m. As for the envelope components, the roof is comprises vaulted fiber-cement elements arranged over Y-shaped precast beams, whereas concrete prefabricated vertical panels were used for the external walls. It is worth noting that the irregular and concave-shaped profile of the external panels installed in the workshop department represents a highly limiting factor when formulating retrofitting intervention proposals capable of enhancing both thermal properties and the aesthetic value of the building. Plain surface panels, still affected by the same low-level performance, are instead installed in the other portions of the facility. Focusing on the production department, 2 rows of windows (0.7 m × 1.5 m each) are installed in each external panel for a total average percentage of glazed area of about 10% on every wall. As for the air conditioning systems installed, in the offices, heating is provided using radiators and a traditional gas boiler, whereas in the workshop, single-standing gas fan heaters are installed. Cooling is not ensured in this area of the building contrary to the offices, where heat pumps and splits are adopted.
3.2. DesignBuilder: Modelling Settings
3.2.1. Base Case Model
The case study building was modelled in the DesignBuilder environment in order to provide energy simulations with the Energy Plus engine. The geometry of the facility and the internal distribution were reproduced based on the original design drawings, whereas the different thermal zones were set according to the evidence collected during on-site surveys.
As for the building components set in the DesignBuilder model, the exact stratigraphy of the roof (U = 0.53 W/m
2K) and walls (U = 0.77 W/m
2K) is reported in
Table 3 and
Table 4. Focusing on the insulation layer in Expanded Sintered Polystyrene (EPS) internal to prefabricated panels, only half of its real thickness (0.10 m) was considered. In this way, it is possible to consider feasible decays and degradation phenomena that will occur over time. For the windows, a thermal transmittance of 5.70 W/m
2K, a solar heat gain coefficient (SHGC) equal to 0.6 and a light transmittance value of 0.4 were adopted.
Natural ventilation and infiltration were set with reference to regulation UNI 11300-1:2014 [
42]. These parameters highly affect energy simulations, but, at the same time, they are very difficult to quantify for industrial facilities [
43]. Adopting the formula proposed by the cited regulation for industrial facilities, natural ventilation flow rates of 0.76 m
3/s and 0.27 m
3/s were set for 3N and 1N models, respectively. According to the same regulation, infiltration rates were also set. For the case under consideration, as well as for most facilities with the same intended use, the envelope was assumed to ensure low airtightness (8 h
−1) with a sheltering coefficient equal to 0.07.
Systems were modelled in accordance with the one currently installed in the offices and the workshop. The results of the energy simulations on the building’s current conditions were compared with the heating consumption reported in real bills; an average difference of about 5% was assessed over the entire winter period, showing the model was valid. Once the reliability of the energy model was assessed, the research was developed focusing on the workshop hall department, where indirect green façades were assumed to be adopted. The current gas-fueled heaters with a COP (Coefficient of Performance) equal to 0.8 were modelled in this zone, operating with a heating setpoint temperature equal to 17 °C and according to the schedule (always on from 7:30 am to 5 pm on working days) provided by the company. Even if currently not installed, an air-cooling system was also introduced in the model in order to estimate the reduction in cooling consumption guaranteed by the green façades. An air-to-air heat pump with an EER (Energy Efficiency Ratio) equal to 3.4 was assumed in this case to comply with the current minimum regulatory level in Italy [
3]. The cooling setpoint and operating hours were set up to reduce discomfort hours for workers [
44]; 24 °C was chosen as the cooling setpoint, with the system operating during the summer 8 am–4 pm, depending on the internal temperature.
Following [
45], metabolic gains were calculated by assigning 158.30 W/pp for workshop workers; internal loads related to the manufacturing machinery were not included because only low-emission instruments were used.
3.2.2. Indirect Green Façades Modelling
As already reported, DesignBuilder provides a dedicated module only for simulations including green roofs. To overcome this issue and to try to simulate the shading effect provided by the indirect green walls, 3 block components were introduced in the model in front of the south, north and west walls covering the entire surface of the façades and detached by 0.20 m. The thickness of the block components (0.25 m) was set to represent the vegetation layer once it would be fully rooted and flourishing. The thermophysical and visible properties were assigned to the block component by defining a new material in the DB internal database. Emissivity was set equal to 0.95, solar absorptance equal to 0.5 and visible absorptance equal to 0.85. The chosen settings were retrieved from analysis of the literature considering average values for the most adopted climbing vegetation species and comparing them with the indications provided by publications specifically addressing this topic [
35]. The vapor resistance of indirect green façade was assumed to be negligible. In order to account for the global shading effect produced by the green walls introduced, the general settings of simulation were modified in DesignBuilder in order to also include radiation reflected from the ground.
4. Results
To evaluate the impact of vertical greenery adoption on the existing industrial building selected, the following parameters were addressed: external surface temperature (°C) for each orientation, surface heat gains and losses (kW) and incident solar radiation (W/m2) with reference to the western wall, internal air temperature and energy needs. The cited parameters were analyzed for both the winter and summer seasons. For the calculation of energy needs, reference weeks (20–27 January and 6–13 July) were considered to perform hourly simulations. Then, for completeness, the yearly energy consumption was also calculated to estimate the savings achievable on an annual basis.
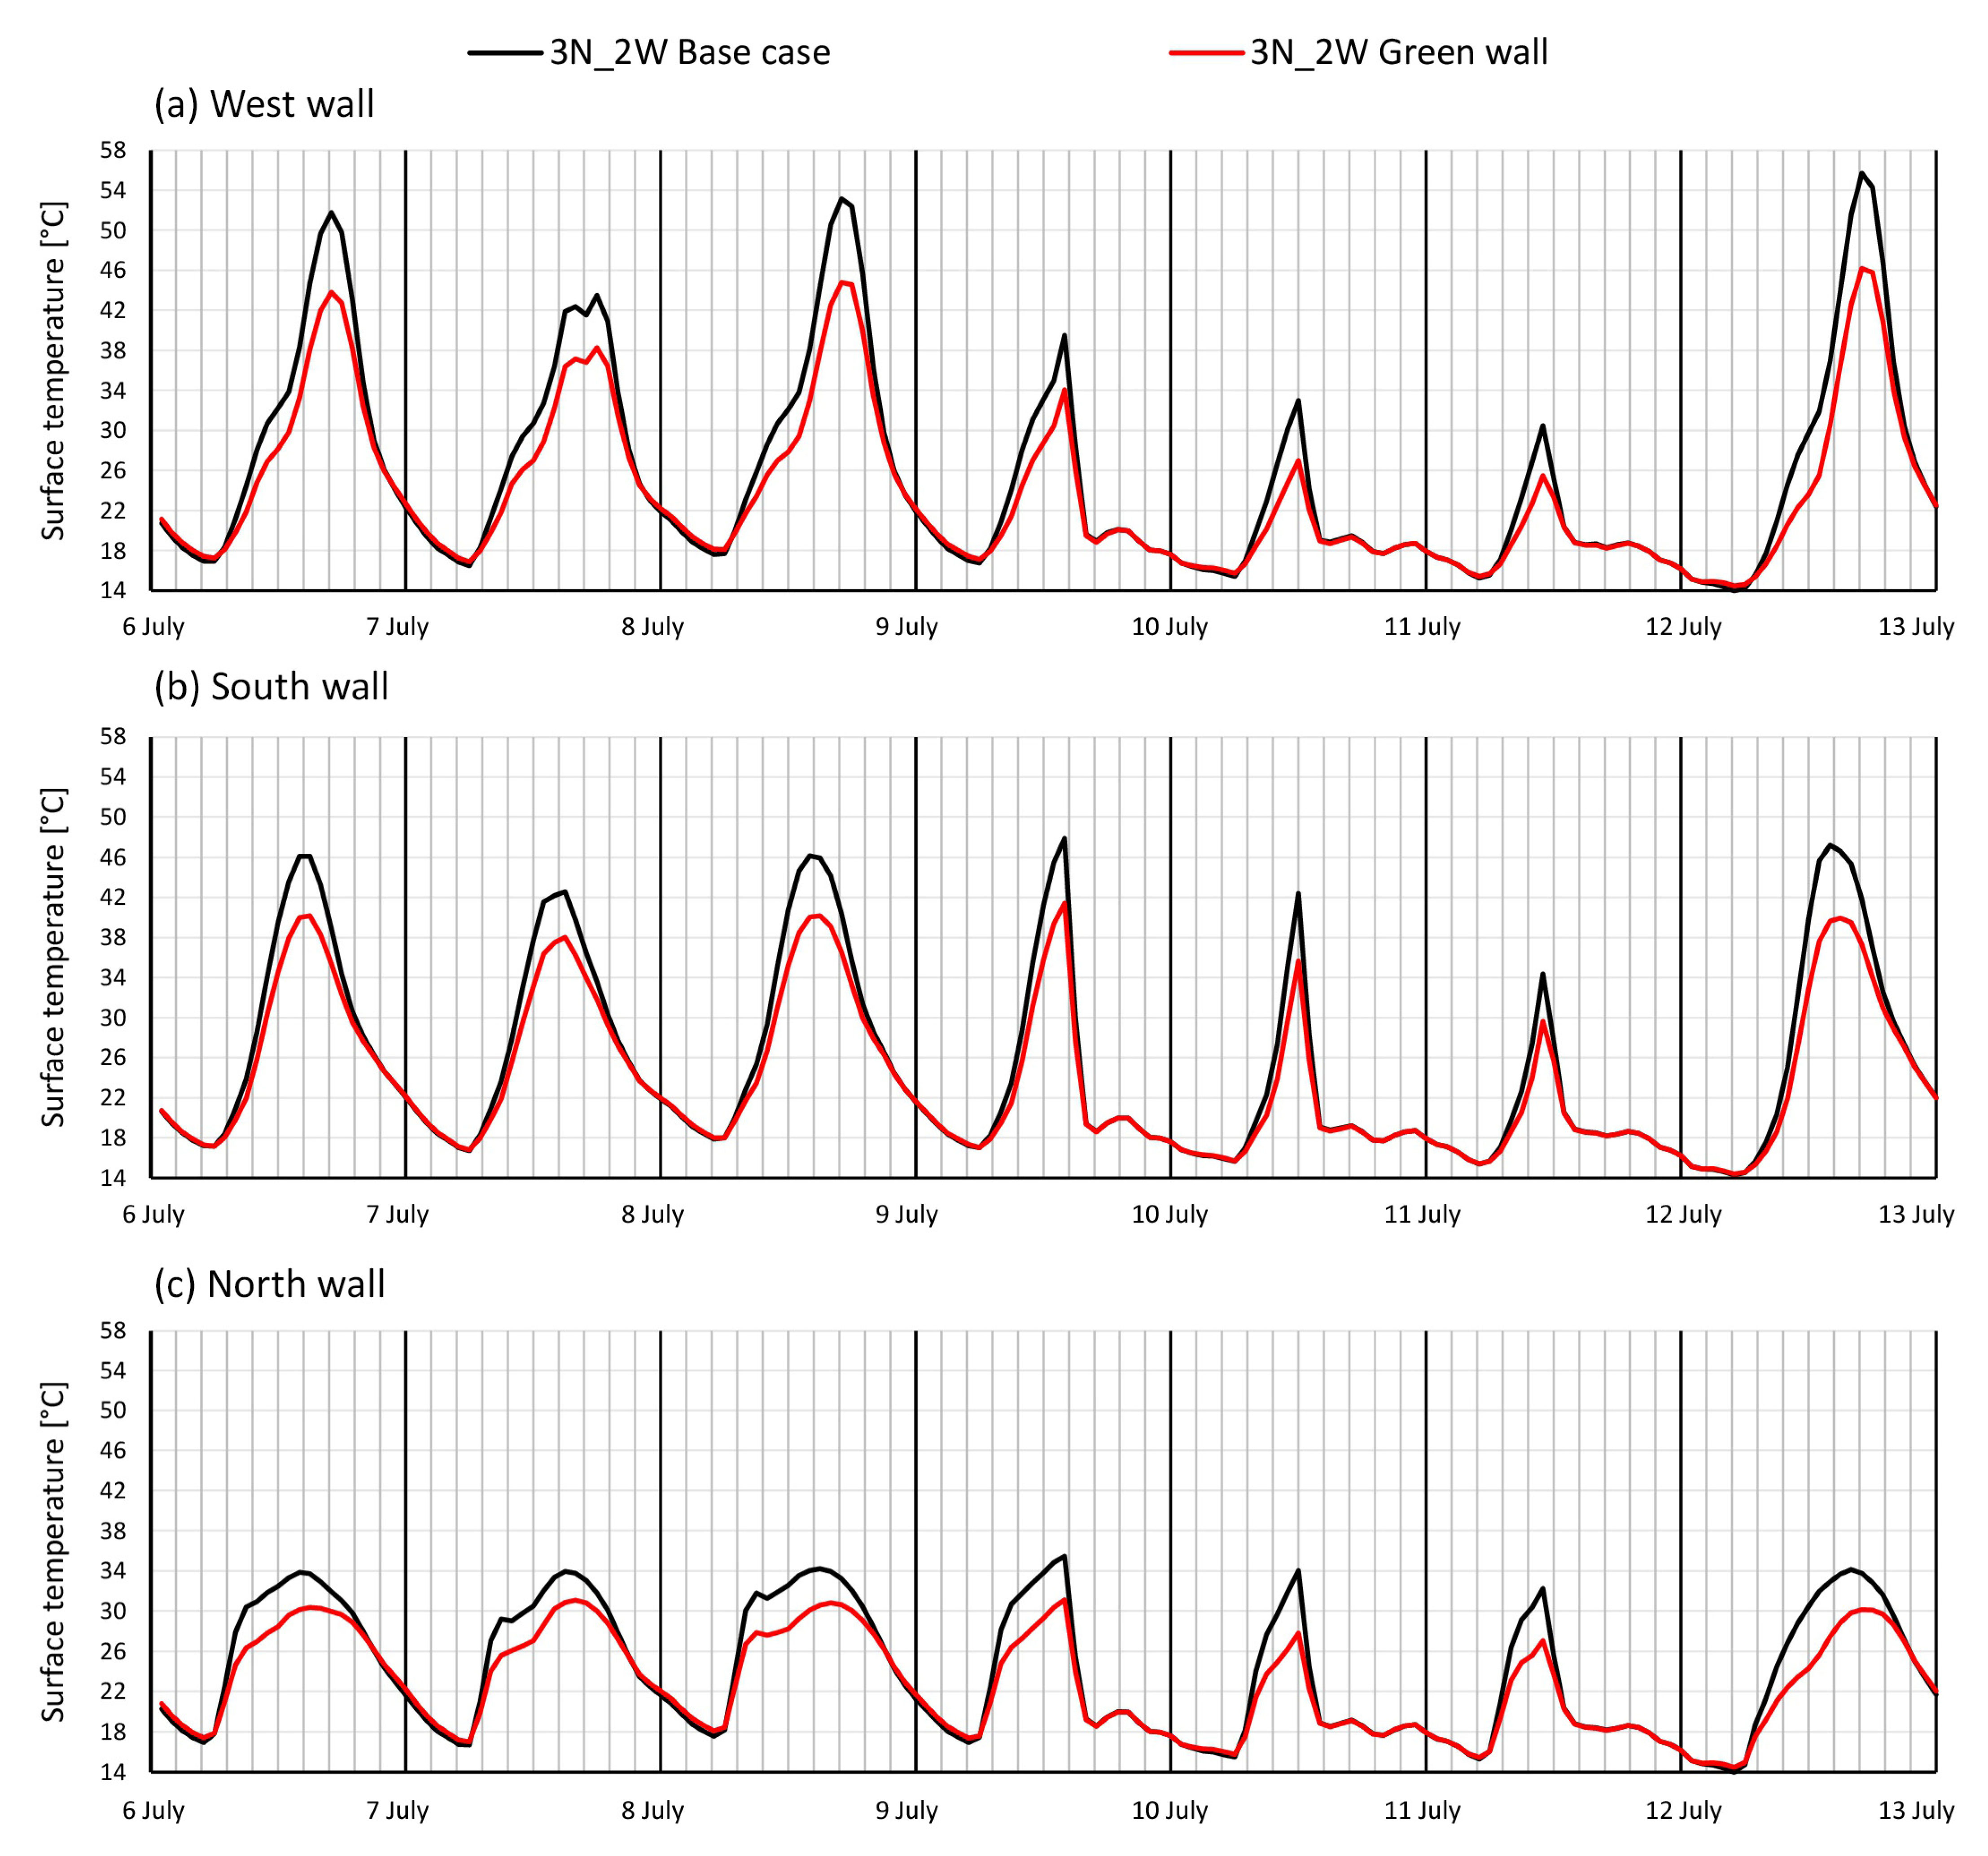
Considering the reference building’s actual configuration (3N_2W), the graph in
Figure 2 shows the trend of the external surface temperature for the western, southern and northern walls; a comparison between the green retrofit layout and the base case is provided considering the summer reference week. As clearly shown in the results, the green wall installed on the west-oriented façade led to the most significant reduction of external surface temperature. Even if the latter was influenced by natural fluctuations of external air temperature and solar radiation, a maximum decrease of about 8 °C was assessed. On the other days, temperature reduction was less evident but still appreciable with an average value of about 6 °C. Regarding the southern and northern walls, the reduction was less significant and equal to an average of 5 °C and 4 °C, respectively. This remarkable decrease in external surface temperature is related to the green walls’ ability to shade the building from incident solar radiation during the day.
Conversely, during nighttime, the surface temperature of the walls in both configurations tended to have almost the same trend with a slight maximum increase (0.8 °C) for greening adoption.
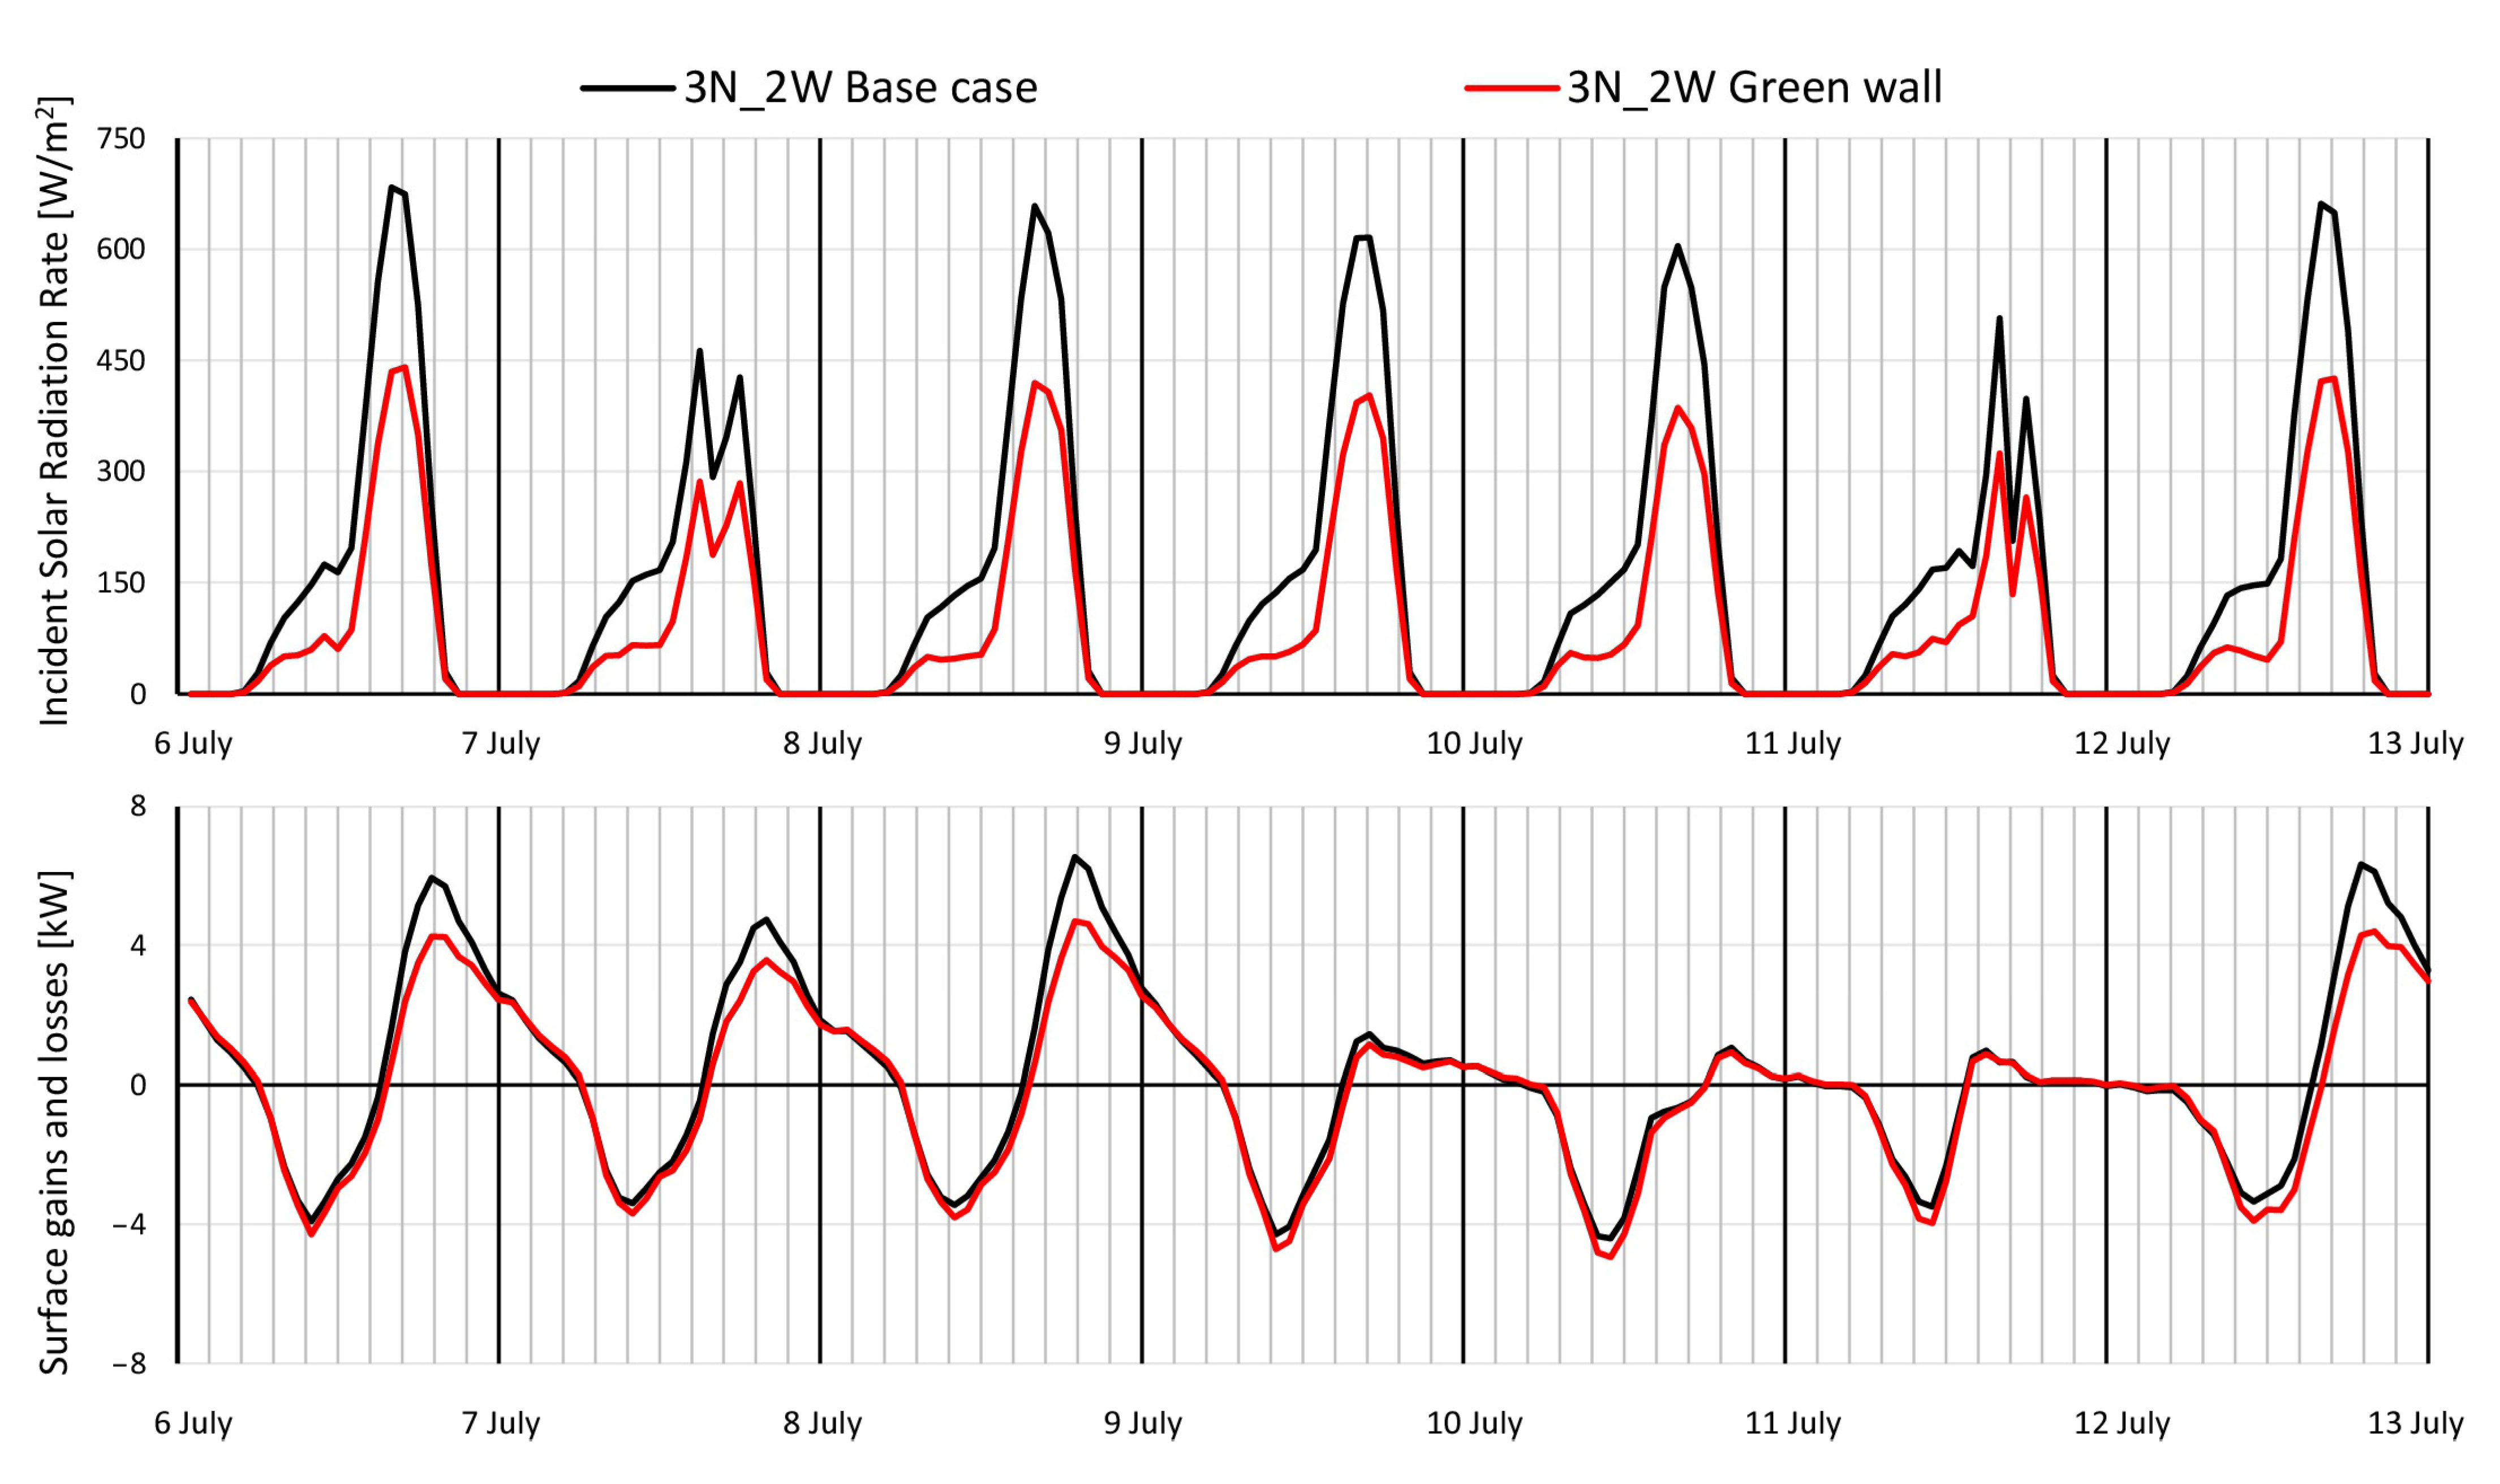
The shading effect is furthermore highlighted by the graphs in
Figure 3, which concern the energy balance of the western wall in terms of surface heat gains, losses and incident solar radiation for the summer reference week. A noticeable reduction in the latter (~200 W/m
2) was registered when peak solar gain occurred, and consequently, this affected the overall energy balance of the wall. Regarding surface gains during the day, preventing direct solar radiation causes an average reduction of about 2 kW when comparing the base case and the vertical greenery case. As for energy losses during night, the two configurations were characterized by comparable performance. It is worth noting that the heat losses at early morning hours were slightly higher in the case of green retrofitting implementation.
Still considering the western façade, the energy balance of the glazed portions was also investigated. In this case, the same trends already highlighted for external walls were retraced. In this case as well, the use of vertical greenery in front of the windows resulted in an average decrease in the amount of heat gains of 4 kW during the summer reference week. By contrast, the green wall influenced the heat losses to a lesser extent, with an average reduction during the day of about 0.2 kW. With respect to external surface temperature, when comparing these results with those related to the external wall, there was instead a lower reduction. For windows shadowed with vertical greenery, the maximum decrease in external surface temperature was about 5 °C. Such discrepancies are mainly related to the different thermo-physical properties of the materials involved.
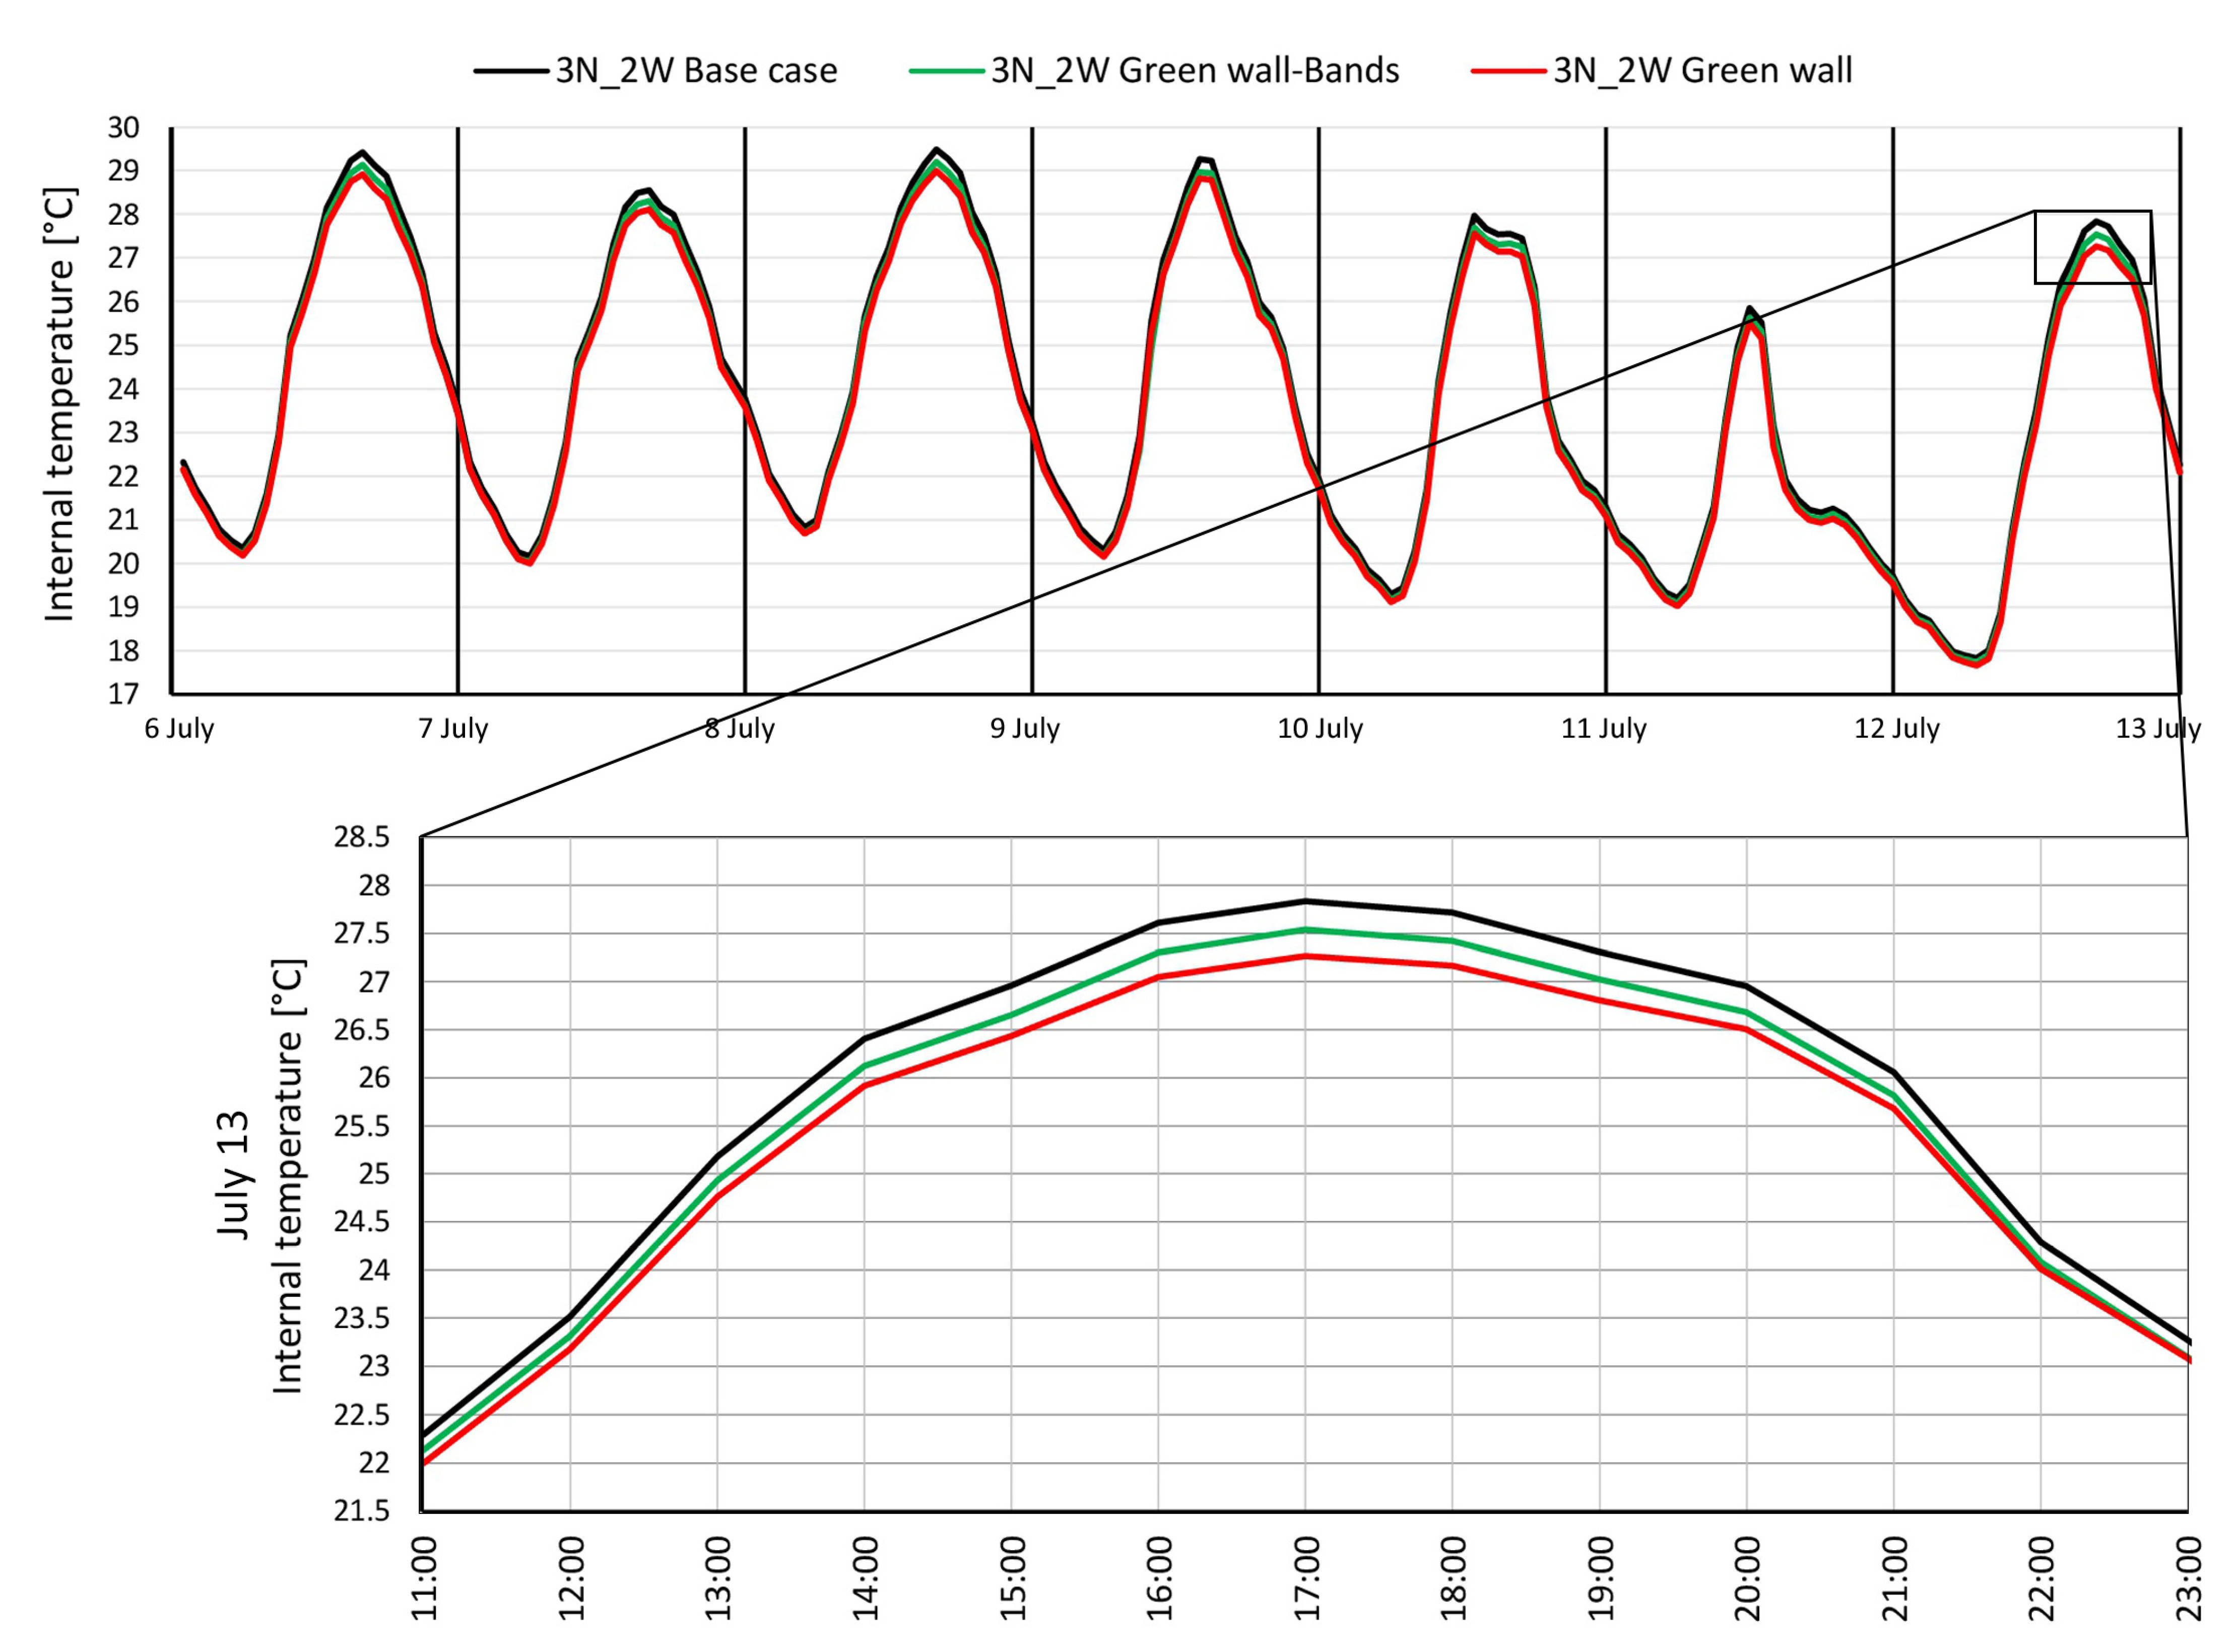
Focusing on indoor conditions,
Figure 4 shows the variation of indoor air temperature still considering the summer design week. In this case, the graph illustrates a comparison between the base case and the vertical greenery adoption configurations, considering two different tested layouts for the latter: total green coverage, and green vertical bands excluding windows. The layout with the highest greenery surface produced the most sensible reduction of internal air temperature. As reported in the highlighted section of the graph, a reduction of about 0.6 °C during the daytime was achieved in this case (3N_2W Green wall). The alternative configuration (3N_2W Green wall-Bands) ensured a decrease of roughly half that value. Such a difference is symptomatic of the relevance of the heat gains provided by the windows: the effectiveness of installing green walls was highly affected, excluding glazed portions.
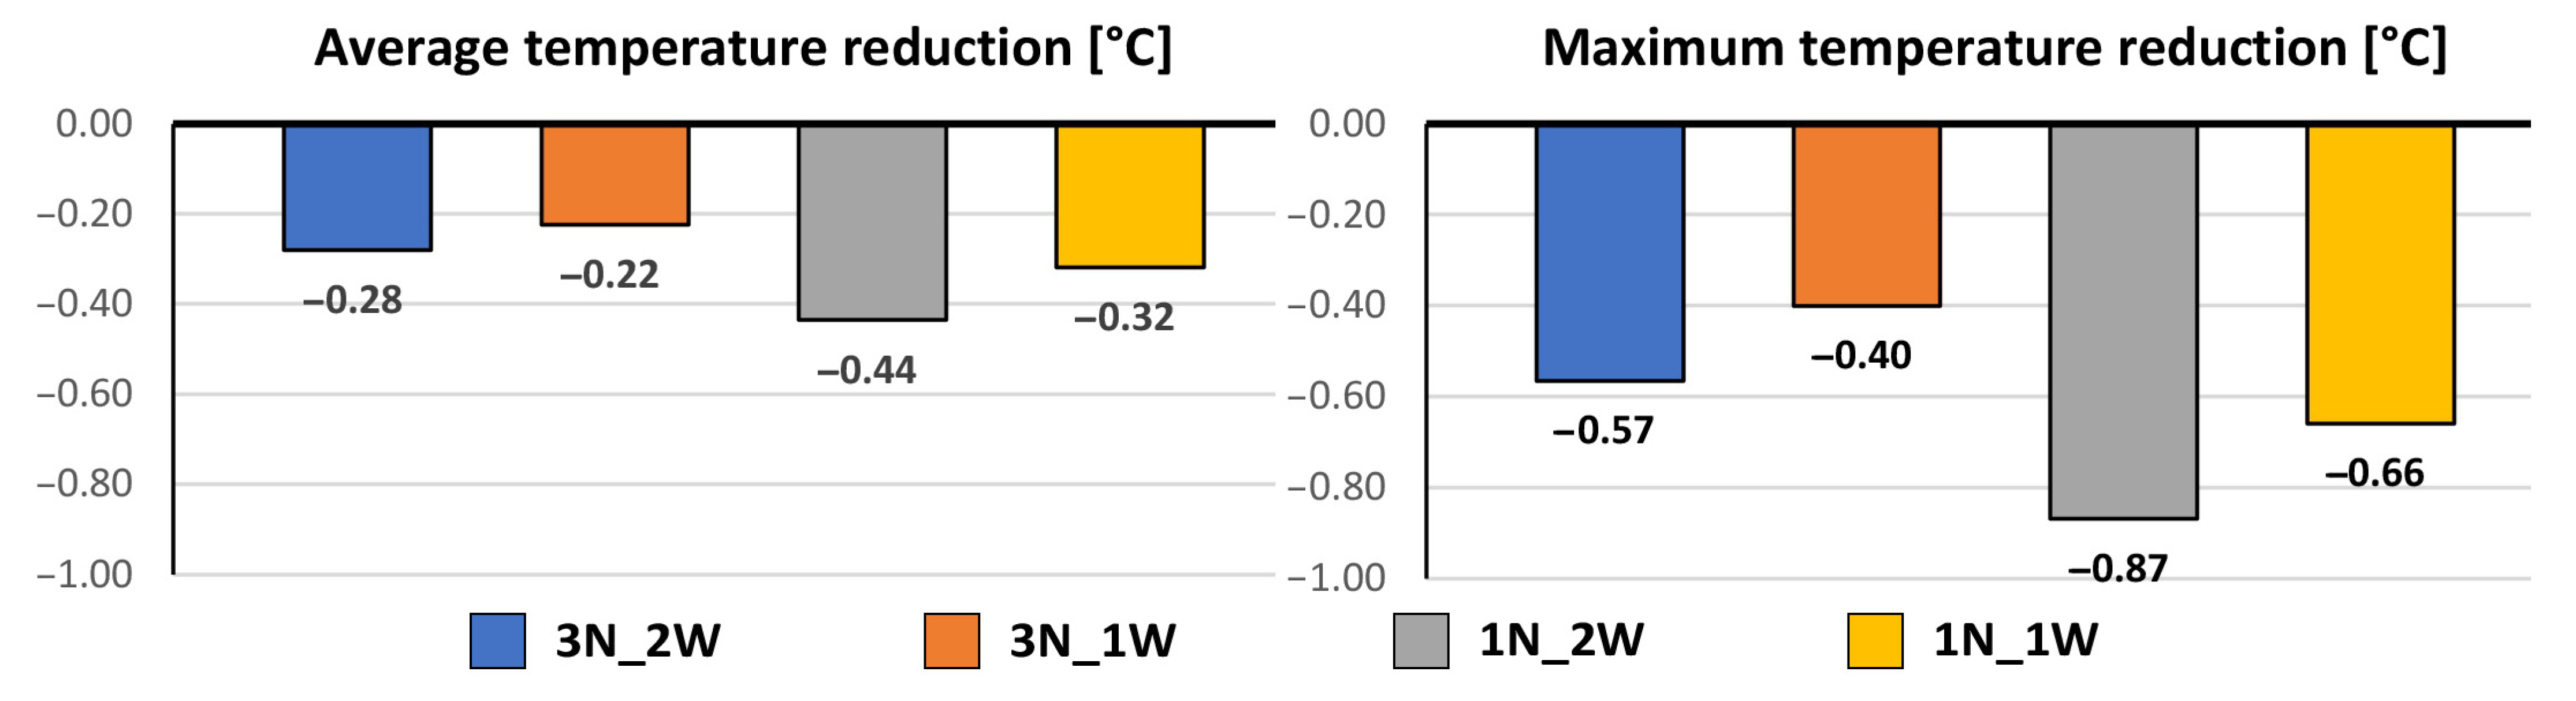
Considering the configuration with vertical greenery installed on the whole external wall surface, the analysis of the indoor air temperature was refined with reference to variations in building layout and numbers of windows. The results are reported in
Figure 5. The maximum decrease registered was equal to 0.87 °C for the 1N_2W configuration. Even if both building geometry and percentage of windows were influential factors, the second one affected the analysis to a lesser extent, producing variations of about 0.2 °C.
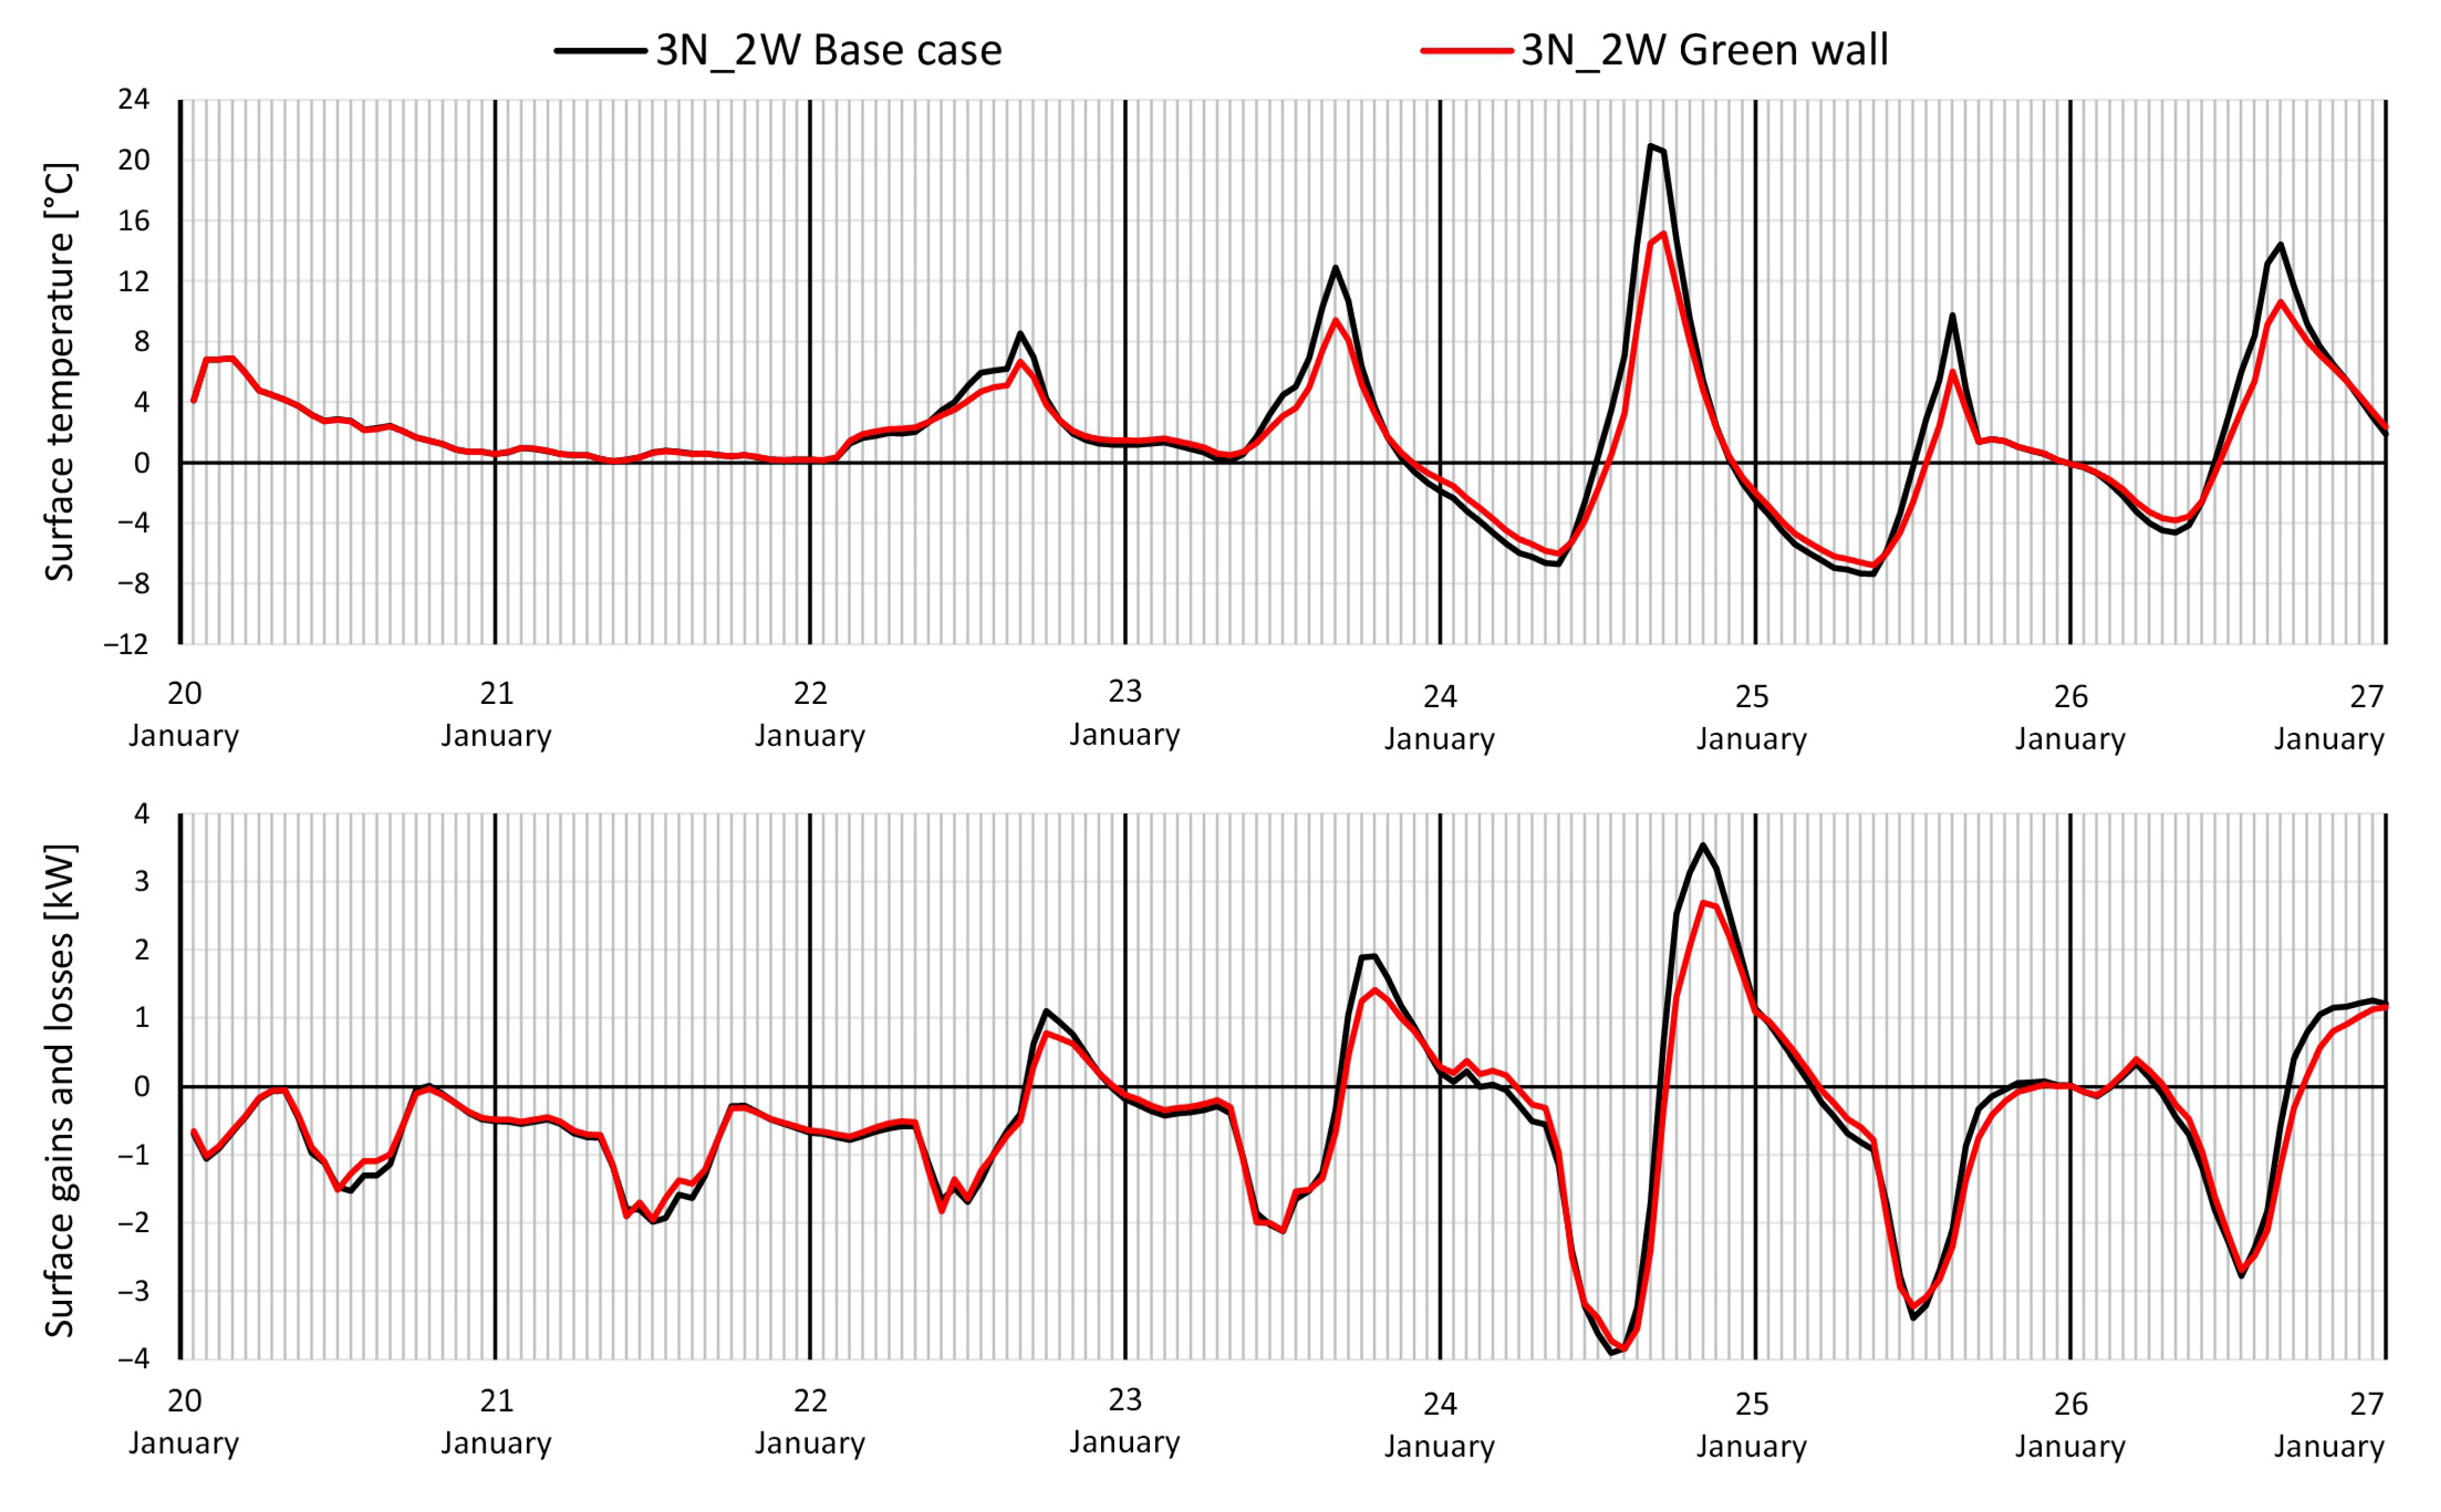
Simulations were also performed to investigate winter performance considering the winter reference week already indicated. The main results are summarized in
Figure 6, where the trend of the external surface temperature and surface heat gains and losses are shown. A reduction of the wall’s external surface temperature in a range between 4 °C and 6 °C with the installation of the indirect green wall occurred during days characterized by higher external temperatures and incoming sun radiation. In addition, it is interesting to note that during nighttime, an increase in the external surface temperature with vertical greenery of about 0.5 °C was registered with positive effects in terms of heat loss reduction.
After analyzing the impact of vertical greenery on external surfaces and indoor air temperature, energy consumption simulations were carried out to assess how the previous parameters affected the global energy performance of the building, considering both hourly and yearly energy simulations.
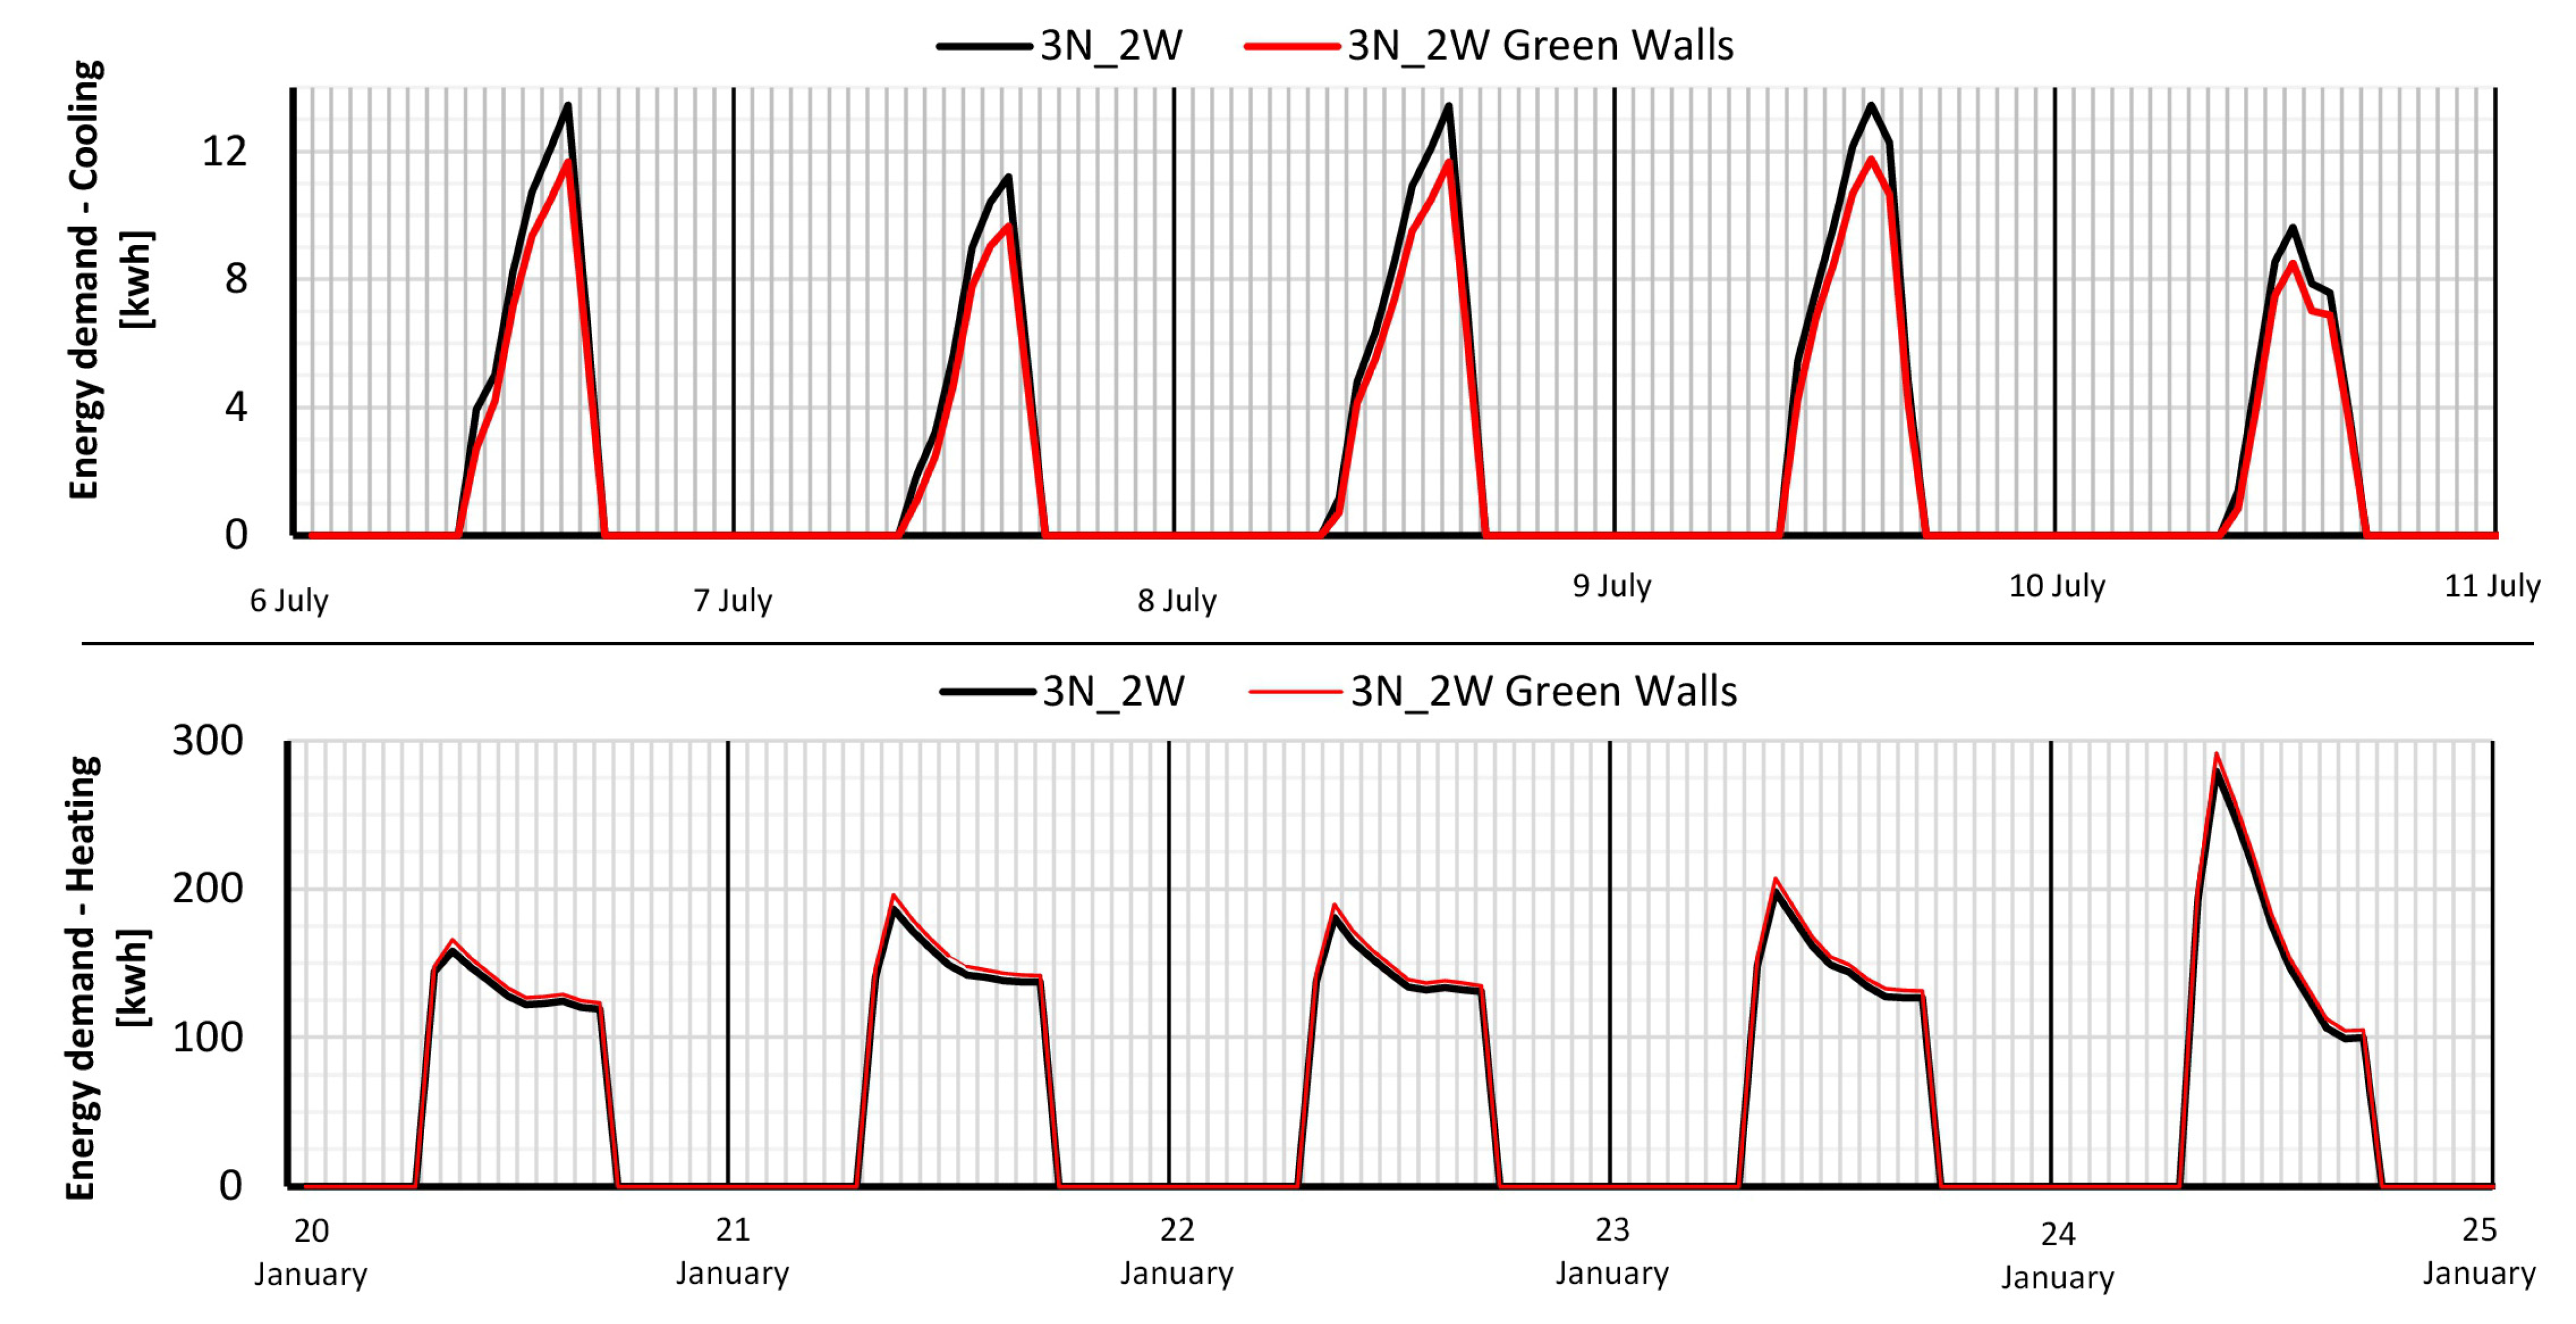
Figure 7 illustrates the hourly energy demand for both cooling and heating calculated for the summer and winter reference weeks, respectively. For brevity, only the base case compared with the layout with vertical greenery introduction was illustrated and commented upon here. For this simulation, only working days were included because HVAC systems are not activated during weekends.
As
Figure 7 shows, the trend of energy consumption for both configurations (3N_2W and 3N_2W Green Walls) was the same for both the summer and winter reference weeks. It is worth noting that the reduction in cooling consumption due to the installation of vertical greenery was more appreciable, accounting for an average of 2 kWh during the considered week and for the vertical greenery layout. Moreover, during the winter reference week, the use of green walls resulted in a slight increase in heating energy demand (~4%), which is mainly due to the shadowing effect of vegetation.
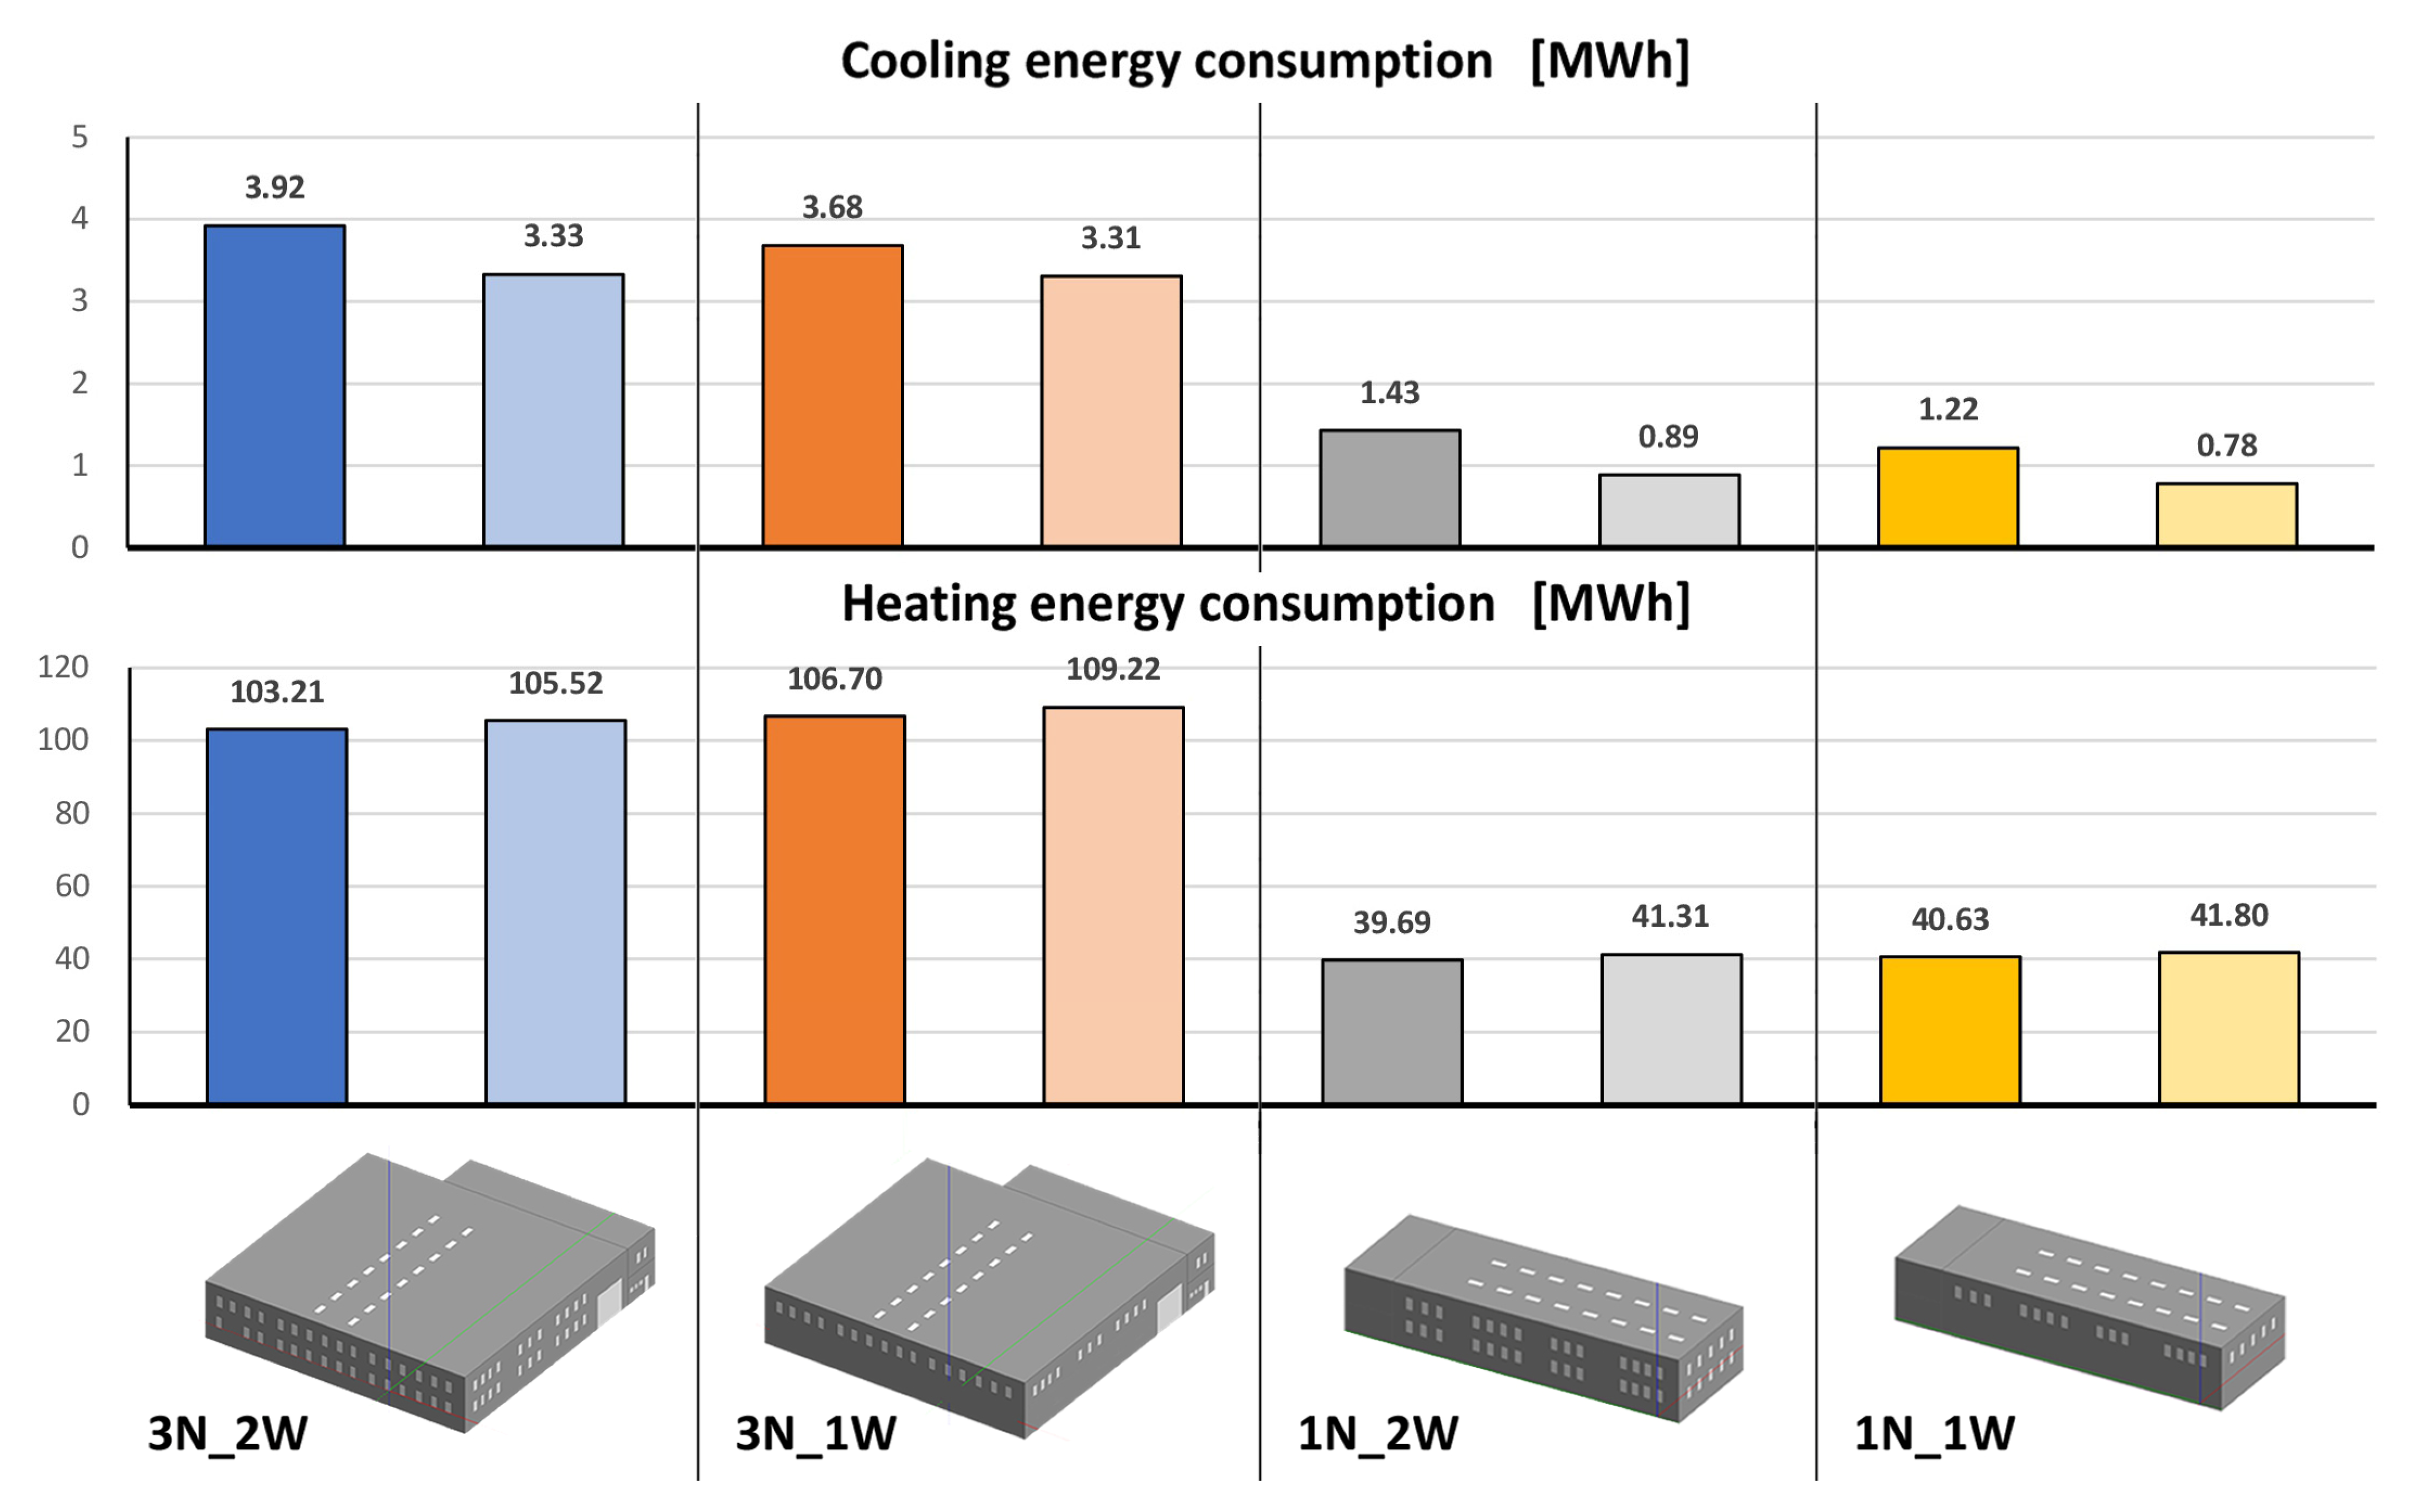
Figure 8 illustrates the yearly energy consumption for the case study for both cooling and heating. Vertical greenery installation mostly influenced energy performance during the summer months; a considerable reduction of about 600 kWh occurred for both analyzed geometries (3N and 1N) during the summer. In this regard, it is worth noting that for smaller buildings, higher energy savings were achieved. The assessed decrease was about 38%, compared with decreases of 14% and 9% registered for the 3N_2W and 3N_1W configurations, respectively. During the winter season, green walls had a detrimental effect, leading to a slight rise (2%) in building energy needs, even if to a lesser extent with respect to the energy savings over the summer season.
5. Discussion
Some considerations about the impact of vertical greenery solutions on existing industrial buildings’ energy performance can be outlined. The results obtained here can be a useful reference when evaluating the implementation of this kind of intervention as a retrofitting measure, providing a series of preliminary estimations of the possible performance achievable.
The simulations carried out provided outputs comparable with the ones obtained in previous studies using different simulation tools. ENVI-met software was tested in the literature to model real industrial districts and evaluate the impact of different retrofitting strategies [
46]. Green walls proved to ensure promising results on urban microclimate external surface temperature reductions in line with the ones registered in the simulations performed using DesignBuilder. The latter simulations showed that the most appreciable effects were obtained installing vertical greenery on western-oriented façades. Such outputs can be validated by referring to experimental campaigns carried out by other authors in the literature. In this regard, the studies of Perez et al. [
23] and Susorova et al. [
28] can be pointed out.
A general reduction in wall temperature daily fluctuation was also registered as one of the main outputs of this research, showing interesting potential in improving the durability of the building components. Similar considerations were also discussed by Cameron et al. [
29] and Mazzali et al. [
25] following their research.
The decrease in external surface temperature was mainly due to the shading effect provided by foliage as pointed out in the literature [
31] and as confirmed by the evidence obtained through the simulations performed. Heat gains during the day were reduced following the same trend of incoming solar radiation. By contrast, during summer days, heat losses tended to slightly increase at the early morning hours when considering the western façade. This can be explained by considering the increased temperature difference between the indoor environment and walls’ external surfaces, which was reached by lower radiation because of the shadow provided by the vertical greenery. Such behavior occurs in the different walls according to their specific orientations and, consequently, varying amounts of incoming solar gains.
It is worth noting that greening retrofitting is less effective in extremely hot climates, where radiative heat transfer does not play a key role in terms of energy fluctuations. This can be an interesting point to be studied considering the ongoing climate changes tested by other authors in the literature [
47].
Considering internal conditions, internal air temperature can be decreased up to 1 °C, which is in line with other findings retrieved in the literature [
27].
In this regard, considering the different layouts for greening interventions, vegetation coverage emerged from the simulations as a key factor for the global effectiveness of these kinds of measures. The same conclusion was obtained by Wong et al. [
32] after analyzing the shading coefficients of different vegetation species for greening interventions. Moreover, the same authors assessed potential savings in cooling energy demand of up to 32%, which is in line with the range of reductions estimated in the research illustrated in this paper. Window-to-wall ratio was also recognized as a crucial factor, as shown by the evidence provided, because glazed portions proved to be a detrimental element contributing to summer overheating. As a matter of fact, building configurations characterized by greater numbers of windows showed more sensible decreases in cooling energy demand when these were shaded by indirect green walls. The adoption of indirect green façades allows overcoming issues noted by other authors when adopting living wall solutions [
34]. In that case, in fact, shadowing devices should be carefully considered to avoid heavily reducing the effectiveness of greening interventions, especially for wide glazed surfaces.
Keeping the focus on buildings’ characteristics, the analyses point out that the installation of indirect green walls can ensure better results for smaller facilities with higher form factor (S/V m−1) indices. For these buildings, a reduction in both internal air temperature and, consequently, in cooling energy demand is more evident. This consideration can be justified by the higher percentage of external walls involved in greenery installation directly in contact with the internal environment and with a more significant role of window contribution in the energy balance of these buildings.
Similar remarks were also stressed by Karimi et al. [
33], even if related to different climate conditions.
During the winter season, the installation of vertical greenery on buildings’ façades can negatively affect the energy performance of the buildings, as demonstrated by the slight rise assessed in heating energy demand during our study.
Based on this, it is possible to suggest the adoption of deciduous vegetation to guarantee sun-shading during the hottest days and ensure more consistent solar gains during the coldest ones. The same conclusions can be retraced in other research found in the literature, such as the work by Carlos et al. referring to Portuguese latitudes [
30]. By contrast, following indications of other authors, the wind shielding effects and the incrementation of airtightness in colder climates can also provide beneficial effects during winter [
29].
6. Conclusions
In conclusion, the research allowed assessment of the possible results achievable by installing indirect green façades on existing industrial buildings. These kinds of facilities show a series of characteristics that make them particularly suitable for the installation of vertical greenery systems. Indirect green façades in particular were pointed out as promising solutions to be implemented on existing legacy industrial building because of their lightweight components, the lack of a substrate layer, the low complexity level of installation procedures and the reduced amount of space needed.
The effectiveness of this kind of retrofitting measure was tested with reference to an existing facility hosting a manufacturer’s company in Tuscany. This facility was chosen as a representative case study because of its architectural and construction peculiarities.
Energy models and simulations were performed using DesignBuilder, adopting a simplified approach in the green wall modelling phase due to the substantial lack of any predefined settings currently available in energy analysis software. For this purpose, shading elements were introduced in front of the existing external walls, given that the evidence in the literature highlighted the role of this kind of technological solution in reducing direct incoming solar radiation.
According to the results obtained, greening layers can positively contribute to improving the energy performance of buildings during the hottest periods. More in detail, the sensible reduction in solar incident radiation caused a decrease in external surface temperatures. The western orientation was the most suitable to install green walls. The maximum temperature reduction achievable was, in fact, equal to 8 °C, compared to about 6 °C and 4 °C obtained in case of the southern and northern walls, respectively.
In terms of indoor air temperature, the adoption of green walls covering the whole surface of the façades led to a maximum reduction of 0.6 °C, consequently ensuring lower energy demand for cooling (14%).
Starting from the case study’s building configuration, different geometrical arrangements were simulated to highlight the influence of architectural features on the effectiveness of vertical greenery installation. Following the evidence, building with a lower surface, a more compact shape and a higher window-to-wall ratio showed a higher decrease in internal air temperature (−0.87 °C) and energy needs (−34%).
By contrast, during winter periods, green walls shaded solar radiation, causing a slight increase in the energy demand required for heating. Deciduous species should be considered to ensure positive effects during summer months and avoid detrimental ones during the winter months.
This research aims to contribute to the general effort of research from academic institutions toward energy efficiency and sustainability for the built environment. The findings obtained show promising results to be considered when defining measures to be included in general retrofitting action plans.
However, the limitations of the presented research should be detailed. More detailed green wall modelling procedures should be tested to consider, for instance, other phenomena (e.g., evapotranspiration) not included in the simplified simulations. Furthermore, the method proposed in the paper was applied considering only one Italian climate zone; the implementation of this methodology to the other ones should be addressed. Finally, the research at this stage only dealt with the analysis of the energy results achievable, but it should be improved to include a detailed analysis of possible technological limitations in green wall installation in this type of building.
In any case, the implementation of different vegetation species should be evaluated to refine the analysis both in the Mediterranean climate and in relation to different climatic conditions. Other future developments could involve an accurate evaluation of the impact of green walls on workers’ wellbeing and comfort conditions. The latter should also be assessed considering the office departments of industrial buildings, with particular attention paid to visual comfort issues. The reduction of incoming solar radiation could produce excessive shade for workers, causing an increase in energy demand for artificial lighting. To conclude, further considerations could be performed to address the global cost of such retrofitting measures and their environmental impact within a life cycle perspective.


