Article

Study on the Performance of Personal Heating in Extremely Cold Environments Using a Thermal Manikin

1
Department of Building Science, School of Architecture, Tsinghua University, Beijing 100084, China
2
Key Laboratory of Eco Planning & Green Building, Ministry of Education (Tsinghua University), Beijing 100084, China
*
Author to whom correspondence should be addressed.
Buildings 2023, 13(2), 362; https://doi.org/10.3390/buildings13020362
Submission received: 20 November 2022 / Revised: 8 January 2023 / Accepted: 18 January 2023 / Published: 28 January 2023
(This article belongs to the Special Issue Indoor Environment and Thermal Comfort Performance of Buildings)

Abstract

:
Cold protection for outdoor workers is crucial for their health and thermal safety in winter. Personal heating is considered an effective measure to solve the problem, which can significantly improve thermal comfort. However, according to the present studies, a uniform assessment of different personal heating measures is hard to obtain. This study explored four typical types of personal heating measures (electrically heated garment, electrically heated garment with an aerogel layer, electrically heated seat, and chemically heated insole) in different cold environments. Clothing insulation, effective heating power (Peff), and heating efficiency ( η ) were measured by a thermal manikin with a constant temperature in nine environmental conditions. Three levels of two critical environmental factors (air temperature (Ta): −5 °C, −10 °C, and −15 °C; air velocity (Va): <0.1 m/s, 0.5 m/s, and 1.0 m/s) were crossed orthogonally to form the nine environmental conditions. The results indicated that Ta had no significant effect on clothing insulation, while elevated Va significantly decreased clothing insulation. When Va increased from 0 m/s to 1 m/s, the air layer inside the garment was squeezed, causing a 0.6–0.9 clo decrease in total clothing insulation. Decreased Ta and elevated Va reduced the Peff and η of electrical heating measures while they improved the Peff and η of chemical heating insoles. The Peff and η of the garment dropped to 8.2 W and 21%, respectively, at −15 °C and 1.0 m/s. In addition, the aerogel layer could effectively improve the Peff and η of the garment. The improvement was weakened by decreased Ta and elevated Va. The corrective power values of personal heating measures in different environments were calculated to guide the design and application of personal heating.

1. Introduction

1.1. Background

Extreme cold weather has frequently occurred worldwide in the past few years, increasing the risk of cold exposure [1,2]. Many outdoor occupational activities, such as emergency rescue and electrical maintenance, are performed outdoors. Those workers would experience cold exposure in winter, decreasing work performance [3,4,5], and increasing health risks [6,7,8]. However, it is unrealistic to achieve cold protection by increasing the ambient temperature when it is outdoors. Effective measures are needed to protect outdoor workers from cold exposure.

1.2. Personal Heating Measures for Cold Protection in Cold Environments

To avoid the risk of disease and physical injury, enhance thermal comfort, and reduce the restriction on body movement caused by multi-layer garments, various personal heating measures, which provide heat to garments through integrated heating units, have been developed, such as heated gloves, heated insoles, heated socks, and heated garments. Personal heating measures for the hands and feet can improve finger dexterity and work efficiency during prolonged cold exposure [9,10,11,12]. Ma et al. [9] tested the heating performance (HP) of electrically heated gloves at Va of 0.17 m/s and 0.5 m/s and Ta of 2.5 °C. The results indicated that electrically heated gloves enhanced the hand’s thermal sensation and skin temperature (Tskin) at both Va. In different studies, the heating power required for the electrically heated gloves varied due to the thermal insulation of the gloves and the environmental parameters. Brajkovic [11] reported that a heating power of 14 W could maintain the Tskin of hand at 34.1 °C by wearing the arctic gloves at −25 °C. Streets [12] suggested that conductive polymer gloves with a heating power of 15 W were able to maintain Tskin of hand at 35 °C, and knitted gloves with a heating power of 19 W were able to maintain Tskin of hand at 27 °C in a cold environment of −32 °C. In addition, subjects wearing heated insoles with a power of 6 W experienced a drop in toes’ Tskin to 20 °C after three hours of cold exposure. Without the heated insoles, the subjects withdrew from the experiment early at the 75th min because of the intolerable cold.
Moreover, various forms of heated garments, such as air-heated and electrically heated garments (EHG), have been developed for different scenarios. In a study by Rapaport et al. [13], subjects were exposed to a −34 °C environment wearing a full-body air-heated garment. Tskin of the exposed hand could be maintained above 21 °C for one hour. Brajkovic et al. [11] used an electrically heated vest (EHV) to heat the subject’s trunk. Tskin of fingers and toes were maintained in a comfortable range (22–25 °C.) during three-hour cold exposure at −15 °C. Ducharme et al. [14,15] similarly demonstrated the effectiveness of an EHV in maintaining Tskin and finger dexterity of human extremities in a −25 °C environment. The power of the EHVs was 108–111 W, and the heating temperature was maintained at 42 °C in the above studies.
Some heating systems have been applied in military and civilian, based on long-term experimental studies. However, previous studies can only provide limited references due to the specific research subjects and application scenarios. In addition, it is not easy to make a uniform assessment of the effectiveness of personal heating measures from various studies due to the differences in environmental conditions and clothing. In a similar condition, the corrective power (CP) proposed by Zhang et al. [16] could reflect the performance of heating measures on the improvement of the thermal environment around the human body and has been widely used to assess the performance of various types of personal thermal comfort devices.

1.3. Influence of Environmental Parameters on the Cold Protective Performance of Garments

Clothing is essential to protect the human body from cold exposure. Multi-layer garments squeeze the internal air layer and reduce the thickness, significantly decreasing the clothing insulation of the garments [17]. In addition, environmental parameters have significant effects on the cold protective performance (CPP) of the garment. G. Havenith et al. [18] found that Va (or walking speed of the thermal manikin) significantly affected clothing insulation. The clothing insulation decreased by about 20% at Va within 0.15–0.7 m/s, compared to windless conditions. Oliveira et al. [19] studied the effect of the temperature difference between Tskin of the thermal manikin and Ta on clothing insulation. They found that the value of clothing insulation may decrease when the temperature difference is too small. However, as the temperature difference exceeded a specific value, it no longer affected the clothing insulation value.
Environmental parameters also influence the HP of actively heated garments. For heating measures, η and Peff are generally used to evaluate HP. Wang and Lee [20] tested the HP of an EHV at 0 °C and −10 °C using a thermal manikin, indicating that decreased Ta significantly reduced the η of the vest. Wang et al. [21] studied the effect of Va on the η of EHV and reported that elevated Va significantly reduced the η . The closer the EHV was to the body in the same garment system, the higher the η was. However, in the study by Song et al. [22], elevating Va from 0.4 m/s to 1.0 m/s significantly decreased the total clothing insulation of the EHV, while elevated Va had a minor effect on the Peff and η .
The conclusions of the studies are different due to the differences in environmental condition settings, garment combinations, and electrical heating unit performance in different studies. Therefore, strict restrictions on environmental parameters and applicable conditions are required when testing garments’ CPP and HP. The weakening effect of the most adverse environmental condition on performance should be considered when designing the garments to achieve better performance in the actual scenario. In addition, the effect should be quantified to leave the corresponding design parameters margin.

1.4. Objectives

This study studied the following four typical types of personal heating measures: EHG, EHG with an aerogel layer, electrically heated seat (EHS), and chemically heated insole (CHI). Total clothing insulation related to CPP and the following two critical parameters related to HP: Peff and η were measured by a thermal manikin operated in the constant temperature mode in nine environmental conditions. Three levels of two critical environmental factors (Ta: −5 °C, −10 °C, and −15 °C; Va: <0.1 m/s, 0.5 m/s, and 1.0 m/s) were crossed orthogonally to form the nine environmental conditions. The objectives of this study are as follows:
  • To investigate and quantify the effects of Ta and Va on CPP and HP;
  • To analyze the effect of the new material aerogel on the CPP and HP of EHG;
  • To calculate and explore the CP of different personal heating measures.

2. Methods

2.1. Thermal Manikin

Human subject experiments or thermal manikin tests are usually used to evaluate the thermal performance of personal heating measures because they can reproduce the way the personal heating measures are used correctly. Considering the repeatability of experimental procedures and avoiding individual differences, the thermal manikin is the most common tool used by most researchers to evaluate different personal heating measures and measure clothing insulation [20,21,22,23,24]. American and international standards have addressed the measurement specifications of clothing insulation by thermal manikin [25,26]. Therefore, the measurement method of the thermal manikin was used in this study.
A 22-segment thermal manikin (PT TEKNIK, Esbjerg, Denmark) was used in this experiment. As shown in Figure 1a, the physical characteristics of the thermal manikin are similar to those of a medium-sized male, with a height of 171 cm and a surface area of 1.67 m2. The flexible joints enable it to simulate various body postures, such as sitting and standing. The shell of the thermal manikin is made of glass fiber-reinforced resin, the joints are connected by aluminum, and the pure nickel heating wires distributed under the shell are uniformly wound on the body surface. According to the physiological structure of the human body, the thermal manikin is divided into 22 segments (i) with defined surface areas Aj (m2) (Figure 1b). The surface area of each body segment is listed in Table 1. The heating flux and skin surface temperature of 22 body segments can be controlled and detected independently. The accuracy of Tskin control is ±0.1 °C in the range of 25–45 °C, and the accuracy of measuring heat flux is ±1% in the range of 0–300 W/m2. The body segment and the precision of the Tskin and heat flux of the thermal manikin meet the requirements of ASTM F1291 [26] for measuring clothing insulation.
The thermal manikin has the following three operation modes: proportional-integral (PI) control mode, locked power mode, and comfort mode. In this study, the thermal manikin operated in the PI control mode, in which the skin temperature of each segment (Tskin, i) was controlled, and the heating power (Pi) was recorded. Considering the cold exposure effects on Tskin of the human body [27,28] and the testing requirement, the Tskin, i of 22 segments was set to a constant value of 32 °C according to ISO 9920 [25]. In addition, the PI control was applied to Pi as Equation (1). Considering the heating rate and stability of the heating system, the proportional constant K was set to 100, and the integral constant τ was set to 50.
P i = K Δ T i + 1 τ Δ T i dt ,   P i     0 ,   i = 1 22
where the Δ T i was the difference between the setting value and Tskin, i of the skin surface temperature at segment i.

2.2. Experimental Site and Test Conditions

The experiment was conducted in a 3.62 m × 2.67 m × 2.29 m cryogenic chamber (Figure 2). Thermal manikin remained sedentary during the experiment. In addition, a wind deflector was set between the fan and thermal manikin to ensure the uniform transition of cold air. The three Ta conditions involved in the experiment included −5 °C, −10 °C, and −15 °C, and the three Va conditions included 0 m/s, 0.5 m/s, and 1.0 m/s. The two variables, Ta and Va, were cross-combined into nine environmental conditions.

2.3. Development of Personal Heating Devices

(a)
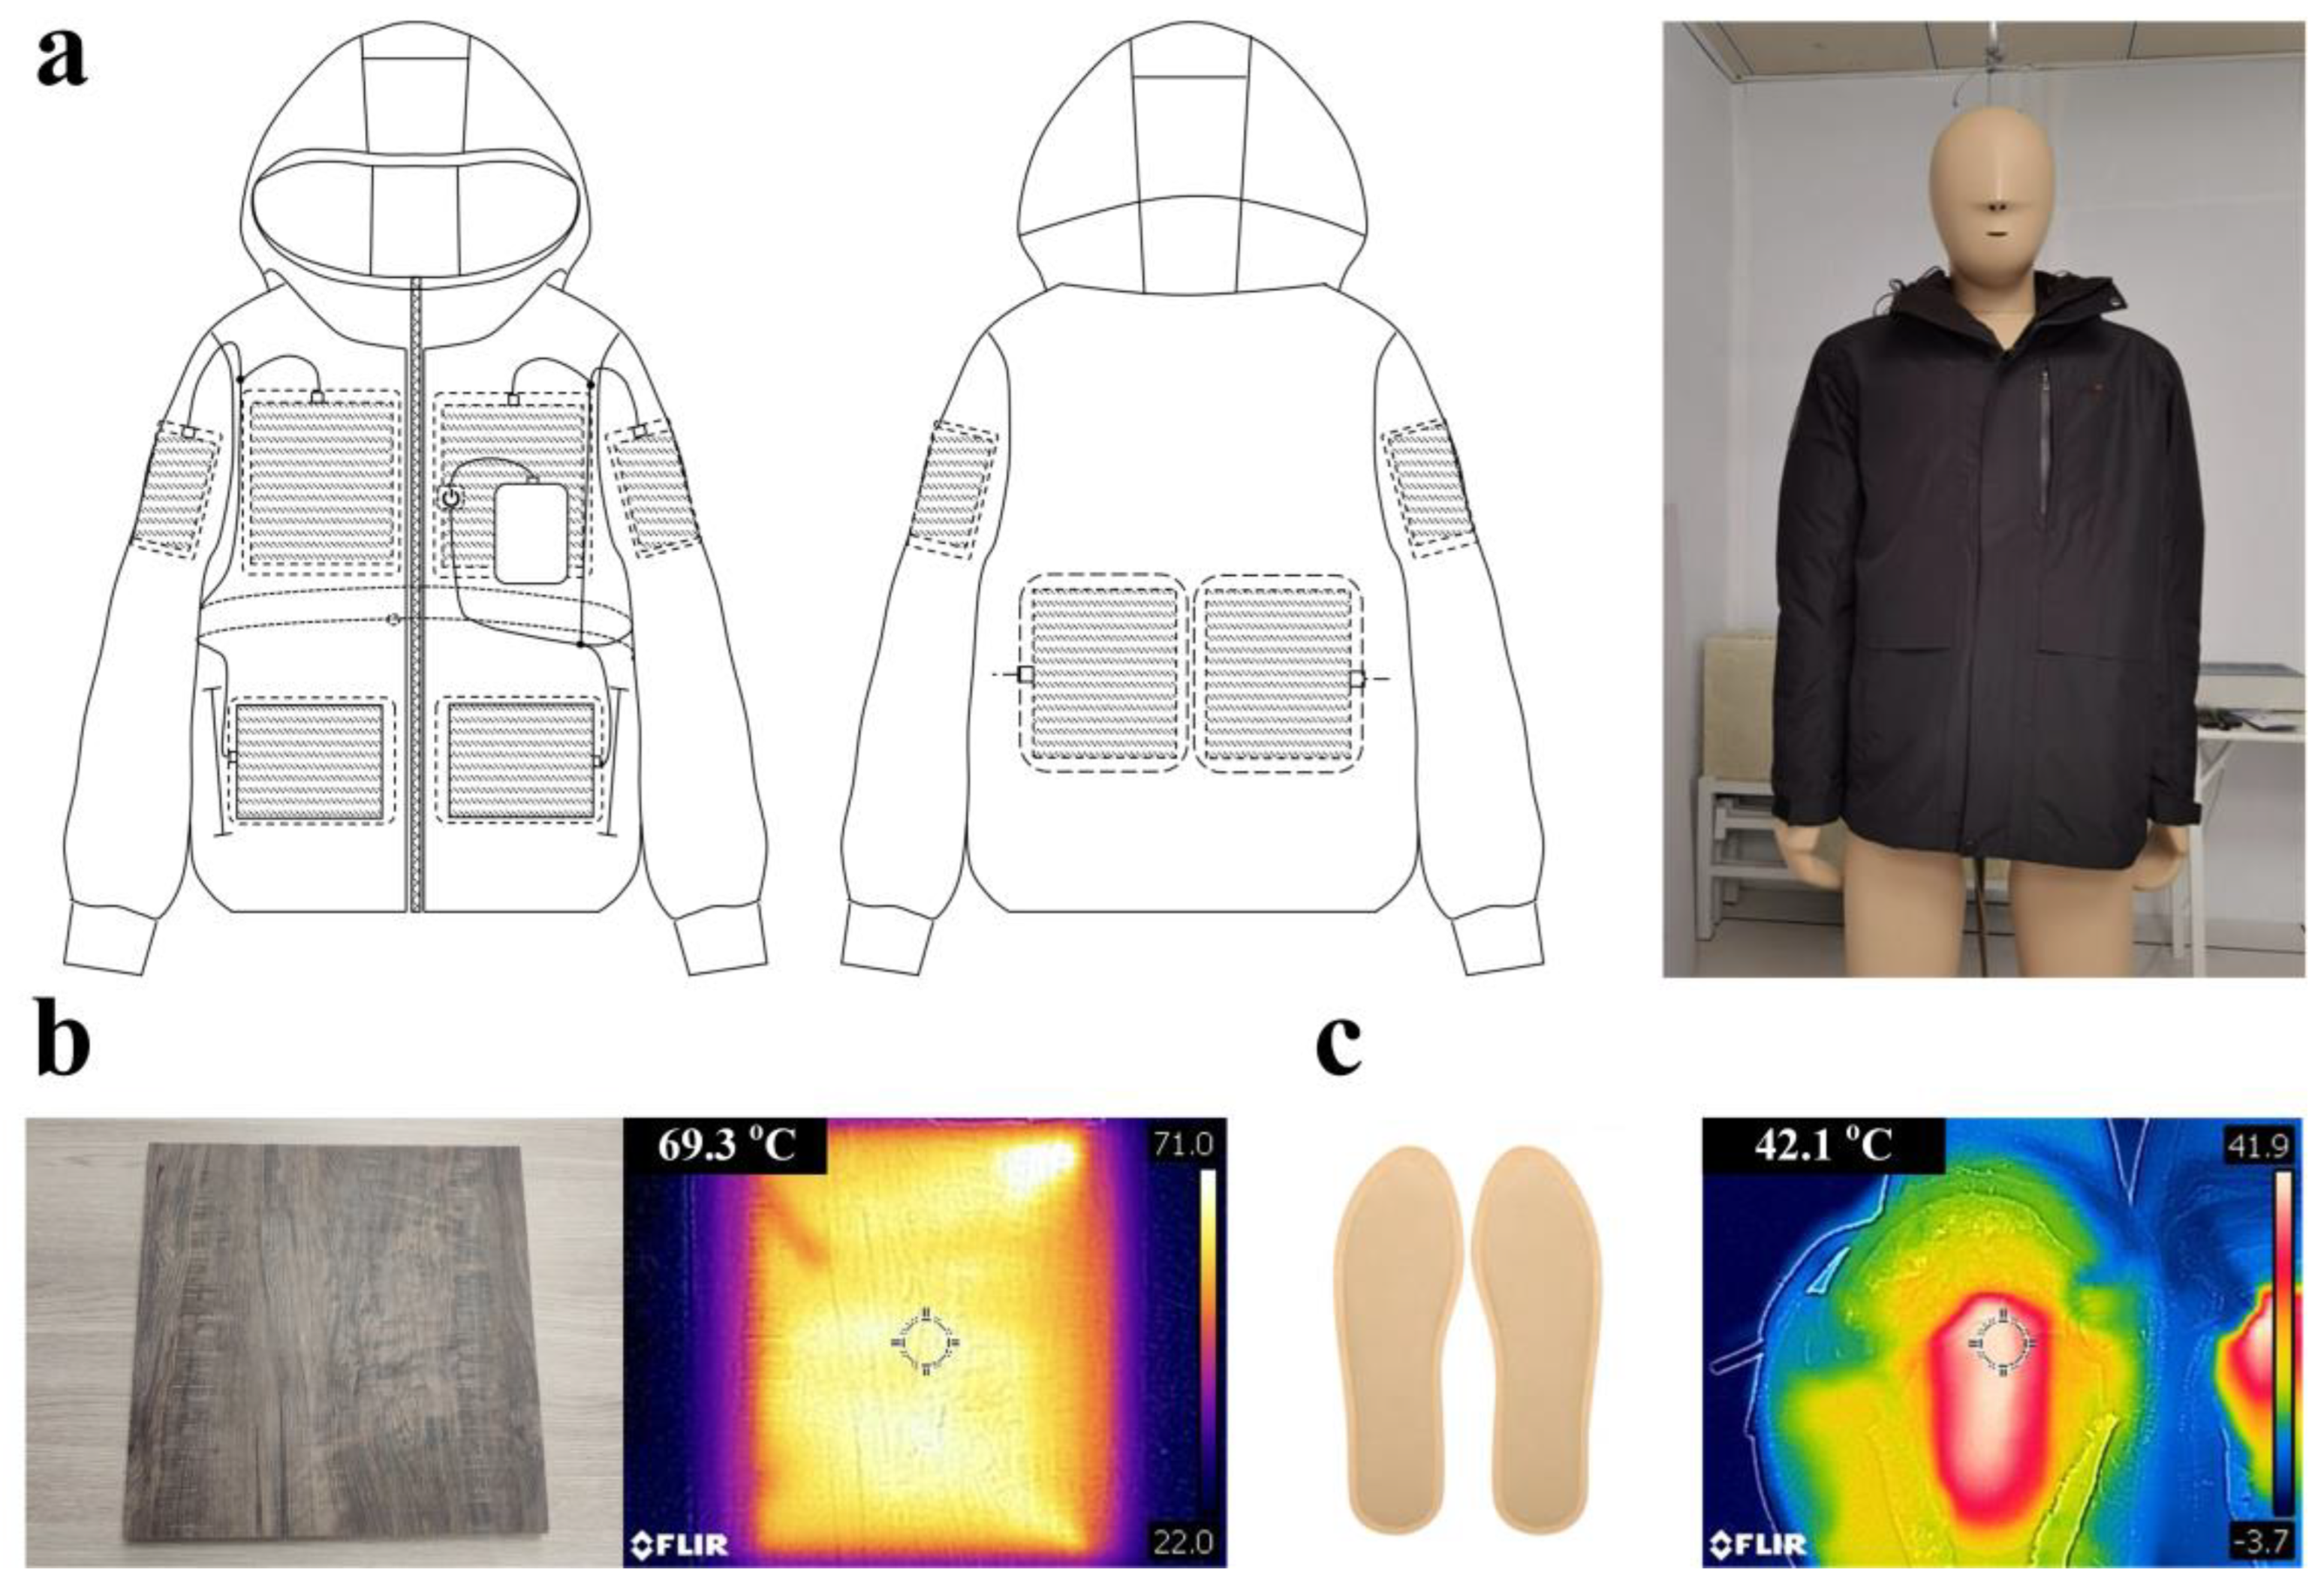
The EHG (Figure 3a) was developed for this experiment, which included a jacket with aerogel insulation and graphene heating. The jacket was made up of four layers of materials, namely, windproof and waterproof materials, an aerogel insulation layer, a graphene flexible heating layer, and a fleece fabric inner layer. It well combines passive insulation and active heating in the material arrangement. The eight flexible graphene sheets were distributed in the position of the chest, abdomen, back, and upper arms for local heating. The size of each piece of graphene sheet was 10 × 15 cm for the chest and abdomen and 10 × 20 cm for the back and upper arms. The heating power of graphene sheets could be adjusted in three gears through the control button in the pocket to meet the dynamic individual heating demands. In low, medium, and high gear, the surface temperatures of graphene sheets were 35–40 °C, 40–45 °C, and 45–50 °C, respectively (measured at Ta of 20 °C), while the heating powers were 90 W/m2, 135 W/m2, 180 W/m2 correspondingly. In this experiment, the high gear was used to heat the thermal manikin locally, and the heating power was 25.2 W. The aerogel insulation layer has excellent thermal insulation properties;
(b)
The EHS (Figure 3b) provided heating to the buttocks of sedentary people. The heating seat was characterized by heating rapidly and uniformly. The maximum heating power was 50 W, and the maximum surface temperature could reach about 70 °C (measured at an ambient temperature of 20 °C). The other surface of the heating seat was well insulated to ensure one-way heat transmission and reduce heat loss to the environment;
(c)
The chemically heated insole (CHI) (Figure 3c) was similarly designed to offset fast cooling of the feet, a major both locally and whole-body in cold environments. The insole used the heat generated by the oxidation reaction between the iron powder filled inside and the air to warm the foot. The surface temperature of the heated insole can reach 42 °C, and adequate operating time was fully ensured for a single experiment.

2.4. Experiment Conditions

Under the nine environmental conditions, the CPP and HP of six clothing combinations or improvement measures in Table 2 were discussed, respectively. Among them, Condition 1 was regarded as the control group.
The basic clothing of thermal manikin was the typical winter outdoor suit, including a long-sleeved sweater and jacket on the upper body, warm pants and windproof trousers on the lower body, socks and cotton-padded shoes on the feet, and some warm-keeping accessories such as hat, scarf, mask, and gloves. The specific clothing information is shown in Table 3. All the clothes selected for the experiment were well-fitting for the thermal manikin.

2.5. Environmental Parameters Measurement

Ta, Va, relative humidity (RH), and globe temperature (Tg) were measured using calibrated quick-response instruments during the experiment. The instruments are shown in Table 4 and Figure 4. Ta and RH were measured at 0.1 m, 0.6 m, and 1.1 m from the ground using the WSZY-1 thermometer (Figure 4a). Va was measured at 0.6 m from the ground by the Swema-03 universal micro-wind speed probe (Figure 4b) during the experiment. Tg was measured 0.6 m above the ground using an HQZY-1 globe thermometer (Figure 4c). Ta, RH, and Tg were recorded at intervals of 10 s, and Va was recorded at intervals of 1 s to meet the measurement requirement and investigate their variance.

2.6. Evaluation Indicators for Cold Protection and Heating Performance
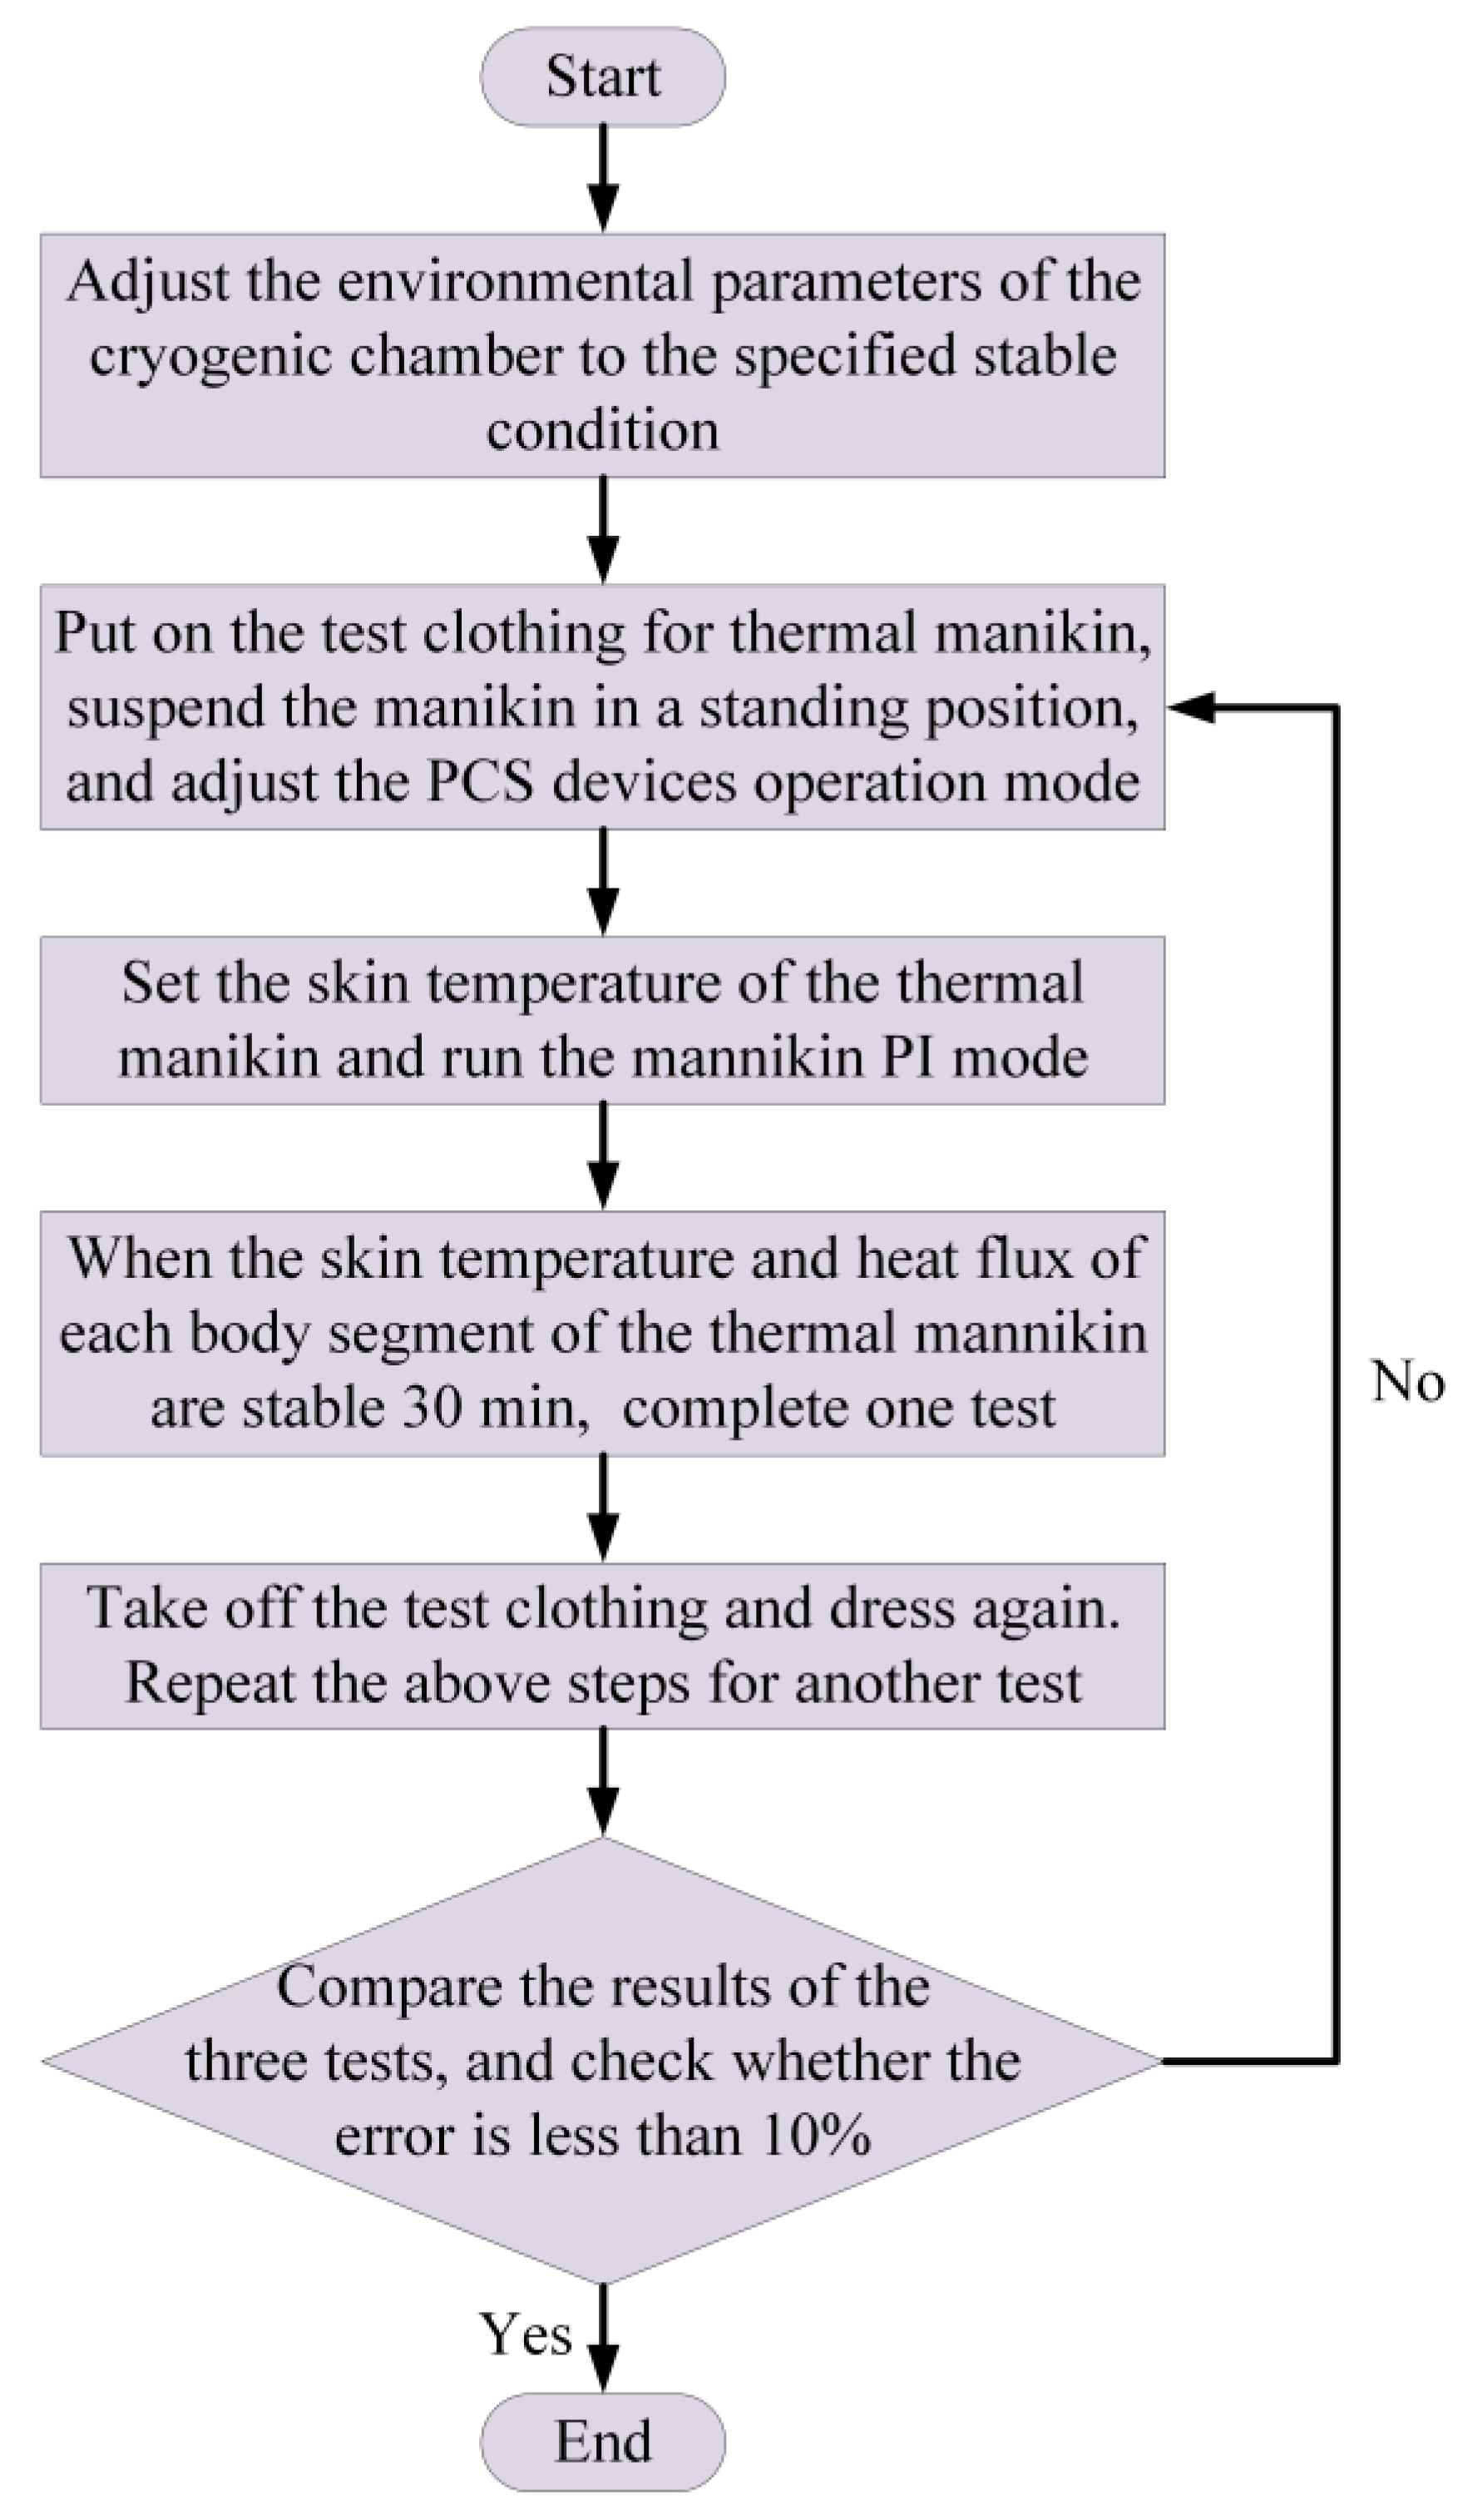
The clothing insulation was used to evaluate the cold protection of clothing. Clothing insulation can be divided into total insulation (It), effective insulation (Iclu), and intrinsic insulation (Icl). The total insulation is defined as the thermal resistance from the skin surface to the environment, which includes the Iclu and the thermal insulation of the air layer around the skin surface when nude (Ia). Icl is defined as the thermal resistance of the clothing over a nude thermal manikin when the outer air layer is removed, taking into account the variation in external surface area. The local It of each body part is calculated by Equation (2), using Tsk, i, heat flux of the body part (Hi), and Ta. The unit of clothing insulation is clo (1 clo = 0.155 (m2 °C)/W). The parallel method was used to calculate the whole-body It via Equation (3). Then, Icl is calculated using Equations (4) and (5). [25] Ia is corrected by the area factor (fcl) related to the Icl, according to ISO-9920.
I t , i = T s k , i T a 0.155 × H i
I t = i = 1 22 f i · T s k , i T a 0.155 × i = 1 22 f i · H i
I t = I cl + I a f cl
f cl = 1 + 0.25 I cl
where fi is the proportion of the surface of body segment i to the total surface area.
The actual performance of the heating devices is assessed using Peff and η [22]. Peff is the reduction in power output of the thermal manikin to maintain a constant skin temperature after using personal heating devices. Peff is calculated by Equation (6), using the difference between Hi with and without heating ( Δ H i ) weighted by corresponding Ai. η is defined as the ratio of Peff to the actual output power of the personal heating devices, which is calculated via Equation (7). In addition, the heating effect provided by personal heating devices can be characterized by equivalent homogenous temperature (EHT), which quantifies local human body heat loss in any non-uniform condition by comparing it against exposure to an equivalent homogenous still-air ambient environment [16]. The overall EHT was used to calculate the corrective power (CP) to compare different personal heating devices’ effects on the whole body. The CP values quantify the ability of personal heating devices to improve the thermal environment around the human body. The overall EHT and CP are calculated by Equations (8) and (9), respectively [23].
P eff = i = 1 22 Δ H i A i
η = P eff λ P in
E H T = T sk H × I cl × 0.155
C P = E H T * E H T ref
where λ is the heat conversion efficiency equal to 0.95; Pin is the input power of the personal heating devices; EHT* is the EHT with personal heating devices; EHTref is the EHT without personal heating devices.

2.7. Test Procedure

Each experimental condition was tested under the nine environmental conditions. When the Tsk, i (I = 1–22) fluctuation was lower than 0.1 °C, the thermal manikin was considered stable. According to the recommended procedure in ASTM F1291 [26], the test flow is shown in Figure 5. In the test, each experimental condition was tested at least three times, and each test lasted 90 min to ensure that the manikin reached a stable state. The test results are reliable when the difference between the tested clothing insulation results and the mean is less than 10%.

2.8. Data Analysis

Data were presented as mean ± standard deviation (SD). A two-way analysis of variance for repeated measures (RM ANOVA) (with Ta and Va as the independent variables) was performed to determine if there was any significant difference in the clothing insulation, Peff, and η between different clothing scenarios. The statistical significance of the RM ANOVA was considered at p < 0.05 (indicated by “*”) and highly significant at p < 0.01 (indicated by “**”). When a Ta × Va interaction demonstrated statistical significance, the simple effects of each factor were analyzed individually. If the interaction had no statistical significance, the effects of the two factors were considered independently, and the main effect of each factor was analyzed.

3. Results

3.1. Environmental Parameters

As shown in Table 5, the measured Ta and Va were consistent with the expected settings. RH was maintained within 70 ± 3%. In addition, the environmental parameters control accuracy met the test requirement.

3.2. The Cold Protection and Heating Performance of Garments at Different Ta

Figure 6 shows the Icl of CG, WANH, NAWH, and WAWH conditions at three Ta (all v < 0.1 m/s). The mean and SD of the Icl of the same garments are marked in red. The difference in the Icl of the same garments at different Ta is marked as a percentage. Compared with the CG, the Icl of WANH increased to 2.13 clo, indicating that the aerogel layer provided good thermal insulation. The Icl of NAWH was 2.10 clo, slightly lower than that of WANH. In addition, the Icl of WAWH significantly increased to 2.46 clo. The Icl increase due to local heating increased from 0.14 clo (the difference between CG and NAWH) to 0.33 clo (the difference between WANH and WAWH), indicating that good insulation can significantly improve the effectiveness of local heating. Moreover, the difference in Icl of the same garment at different Ta did not exceed 10%, suggesting that Ta did not cause significant differences in the Icl of the same garment.
Figure 7 depicts the variations in Peff of NAWH and WAWH conditions at three Ta. The Peff of the heated garments significantly decreased as Ta dropped. Additionally, Peff of WAWH was always higher than NAWH, but the difference between the two conditions narrowed as the Ta dropped. Table 6 presents η of NAWH and WAWH conditions at three Ta. η of the EHGs significantly reduced with Ta decreased. A comparison of the η of NAWH and WAWH indicated that the aerogel insulation significantly improved η . However, the improvement was weakened by decreased Ta, with the most significant improvement occurring at −5 °C, where the η increased from 42% to 95%.

3.3. The Cold Protection and Heating Performance of Garments at Different Va

Figure 8 illustrates It of CG, WANH, NAWH, and WAWH conditions at three Va. Since the ambient temperature changes in the experiments had little effect on the thermal resistance of the garments, each bar in Figure 7 represents the mean value of the It under the three Ta. As shown in Figure 7, the It of all four garment combinations significantly decreased (p < 0.01) with the Va increase. When Va increased from 0 m/s to 1 m/s, the air layer inside the garment was squeezed, which caused a 0.6–0.9 clo decrease in It. Furthermore, the It of the garment did not show a linear variation with Va. When Va increased from 0 m/s to 0.5 m/s, the decrease in It was more significant than that when Va increased from 0.5 m/s to 1.0 m/s.
Figure 9 and Table 7 show Peff and η of the heated garments with and without aerogel insulation under nine environmental conditions, respectively. When the Ta was −5 °C, the Peff and η of the garment significantly decreased as Va increased. The Peff and η of the garment no longer changed significantly with increasing Va at −10 °C and −15 °C, indicating that the effect of Va on the Peff and η of the garment gradually diminished as the Ta decreased. The Peff and η of the heated garments with aerogel insulation were higher than those without aerogel insulation, indicating that aerogel insulation can effectively enhance the HP of the heated garments. However, the enhancement effect of aerogel insulation decreased with decreasing Ta and increasing Va.

3.4. Evaluation of the Heating Performance of the Heated Seat under Different Environmental Conditions

Overall, It was challenging to reflect the variation in the performance of the heated seat under different environmental conditions owing to a small surface area directly heated. Therefore, the local It of the back thigh (It, back thigh) was chosen as the indicator for comparison. Figure 10 shows the effect of the heated seat on It, back thigh, under different environmental conditions. The heated seat significantly increased It, back thigh by 1.2 clo in windless conditions and by 0.7 clo at a Va of 1 m/s. The improvement at the same Va was almost independent of the Ta change.
The phenomenon that the thermal insulation value decreased with elevated Va may be directly attributed to the following two reasons: one was the reduction of intrinsic clothing insulation caused by Va with the heating off; the other was the weakened improvement in the thermal insulation of the local heating with elevated Va. Therefore, the influence of elevated Va on It, back thigh should be excluded when calculating Peff and η of the heated seat. Figure 11 and Table 8 show the calculated Peff and η of the heated seat under different environmental parameters. As shown in Figure 11, the Peff of the heated seat had no significant difference at various Ta and Va. However, the η can only reach about 25% because of the significant heat loss caused by direct exposure to low-temperature environments of a partial area of the heated seat.

3.5. Evaluation of Insole Heating Performance under Different Environmental Conditions

Figure 12 shows the effect of heated insoles on the local It of the foot (It, foot) under different environmental conditions. Because of the small ratio of the foot area directly heated, it is difficult to reflect variations in the HP with It under different environments. The It, foot is chosen for comparison. As shown in Figure 11, the heated insoles increased It, foot from 0.6 to 0.7 clo, and offset the effect of decreasing It, foot produced by increasing Va (when Va increased from 0 m/s to 1 m/s, It, foot had no significant difference).
Variations in Peff of the heated insoles under different environmental conditions are shown in Figure 13. Peff of the heated insoles increased with decreasing Ta and elevated Va. This was attributed to a sufficient oxidation reaction of the internal iron powder owing to the higher oxygen permeability of insoles caused by elevated Va. It is consistent with the findings of Song et al. [22] in the study of a chemically heated garment, which indicated that the Peff of the chemically heated garment had a slight improvement as Va increased from 0.4 m/s to 1.0 m/s.

4. Discussion

4.1. Influence of Environmental Parameters on Local Heating Performance

Ta had no significant effects on the garments’ intrinsic insulation and the additional thermal insulation of the seat, which is consistent with the findings of Wang and Lee [20]. The effects of Ta on the HP of different types of personal heating measures differed. For the EHG, there was no significant change in the Icl of EHGs (NAWH and WAWH) as Ta decreased, indicating that EHG was able to maintain its enhancement of Icl as Ta decreased. However, η of EHGs decreased significantly with Ta decreased, indicating that the HP of reducing heat loss from the human body was weakened. This could be explained by the study of Wang and Lee [20] on the temperature distribution inside EHG at 0 °C and −10 °C. They reported that the decrease in Ta would change the temperature distribution in the microenvironment of the garments. The decreased temperature of the heating layer increased the heat transfer temperature difference from the human body to the garment, resulting in increased heat loss. In addition, η decreased significantly with Ta. The decrease in Ta further increased the temperature difference between Ta and the heating layer, which was significantly greater than that between the heating layer and Tskin. Therefore, the heat dissipation from the heating layer to the external environment increased. This is consistent with the results of Wang and Lee [20]. They evaluated the η of the electrically heated vest (EHV) in cold environments at different Ta. Adding an insulation layer (aerogel) between the heating layer and the external environment reduced the heat dissipation, significantly improving the Peff and η of the EHG. The Peff and η of WAWH were more than twice that of NAWH in a −5 °C windless environment. η of WAWH was as high as 95%. For the EHS, the drop in Ta has no significant effect on the Peff and η . This may be attributed to the following two factors: part of the surface of the EHS was directly exposed to the cold environment, resulting in large heat loss; the thermal resistance between the skin and EHS was large, resulting in its poor HP. As for the CHIs, the Peff and η rose with decreased temperature, which may be related to the variation in chemical reaction rate.
Elevated Va significantly reduced the garments’ intrinsic insulation and the additional thermal insulation of the seat. The effect of Va on the HP of different types of personal heating measures varied. Due to the position of EHS, its HP was worse than that of EHG and CHI integrated into the winter clothing system. Moreover, the pressure from body weight made EHS and trouser surfaces close together. Therefore, the Peff and η of EHS did not change significantly with elevated Va. It decreased exponentially with elevated Va. In addition, elevated Va weakened the improvement of heating on the It of EHG. The effects of Va on Peff and η were closely related to Ta. Song et al. [22] evaluated the CPP of EHG in a cold environment at 2 °C, indicating that Va had a minor effect on Peff and η . However, elevated Va reduced the Peff and η of EHG in a cold environment at −5 °C in our study, consistent with the findings of Wang et al. [21]. at 4.5 °C. The Peff and η of EHG had no significant variation with elevated Va in the cold environment at −10 °C and −15 °C. According to the above results, the effect of Va and Ta combination on the Peff and η is difficult to clarify, and further studies on this need to be conducted in the future.

4.2. Corrective Power of Personal Heating Measures

A comparison of the corrective power (CP) for the four personal heating measures under different environmental conditions is shown in Figure 14. the CP values for the personal heating measures did not change significantly with Ta. For the three forms of electrical heating with constant power in the experiments (the heated garments without and with an insulation layer and the heated seat), elevated Va led to significant decreases in CP values. The CP of chemical heating insoles appeared to increase slightly with elevated Va. the CP of heated garments with an insulation layer can reach up to 8 K or more. The following four heating measures were ranked from highest to lowest according to CP values: EHG (WAWH), EHG (NAWH), EHS, and CHI. The CP values of EHGs were higher owing to the larger surface area covering the human body compared to the other two heating measures. In addition, the aerogel insulation layer effectively improved the CP value of EHG. According to the study of Deng et al. [29,30], CHI can significantly improve local and overall thermal comfort in practical applications. Therefore, the energy efficiency ratio of thermal comfort of CHI (the improvement of thermal comfort/energy consumption) is substantial, although the CP value of CHI was the lowest.

4.3. Limitations and Future Work

Thermal manikin maintained a stable Tsk during the test to quantify the HP of personal heating measures. However, due to human physiological regulation [7], local thermal sensitivity differences [31], and blood flow distribution characteristics [32,33], the actual local skin temperatures are not uniformly stable [27,34], affecting the actual heating performance of personal heating measures. In addition, subjective thermal perception is equally critical for evaluating the operational effectiveness of heating measures. Therefore, the actual application effect of personal heating measures requires further study by human subject experiments.
Moreover, latent heat loss is neglected since sensible heat loss from the skin will be the main component of heat loss from the body surface due to the large temperature difference between the skin and the ambient in extremely cold weather. In addition, people would not sweat at low activity intensities, so the latent heat dissipation from the skin would be the diffuse heat dissipation of the skin, and its value would be negligible. However, the moisture permeability of clothing is essential for outdoor workers with higher activity intensities. The latent heat loss from the skin is a concern and is influenced by intrinsic clothing insulation and materials. Further study should be conducted on this point.

5. Conclusions

This study quantified and evaluated the “weakening effect” of cold and windy environments on the CPP of clothing and the enhancement brought by personal heating measures through thermal manikin tests in a cryogenic chamber. The effects of environmental parameters on the HP of personal heating measures were discussed. The main conclusions are as follows:
(1)
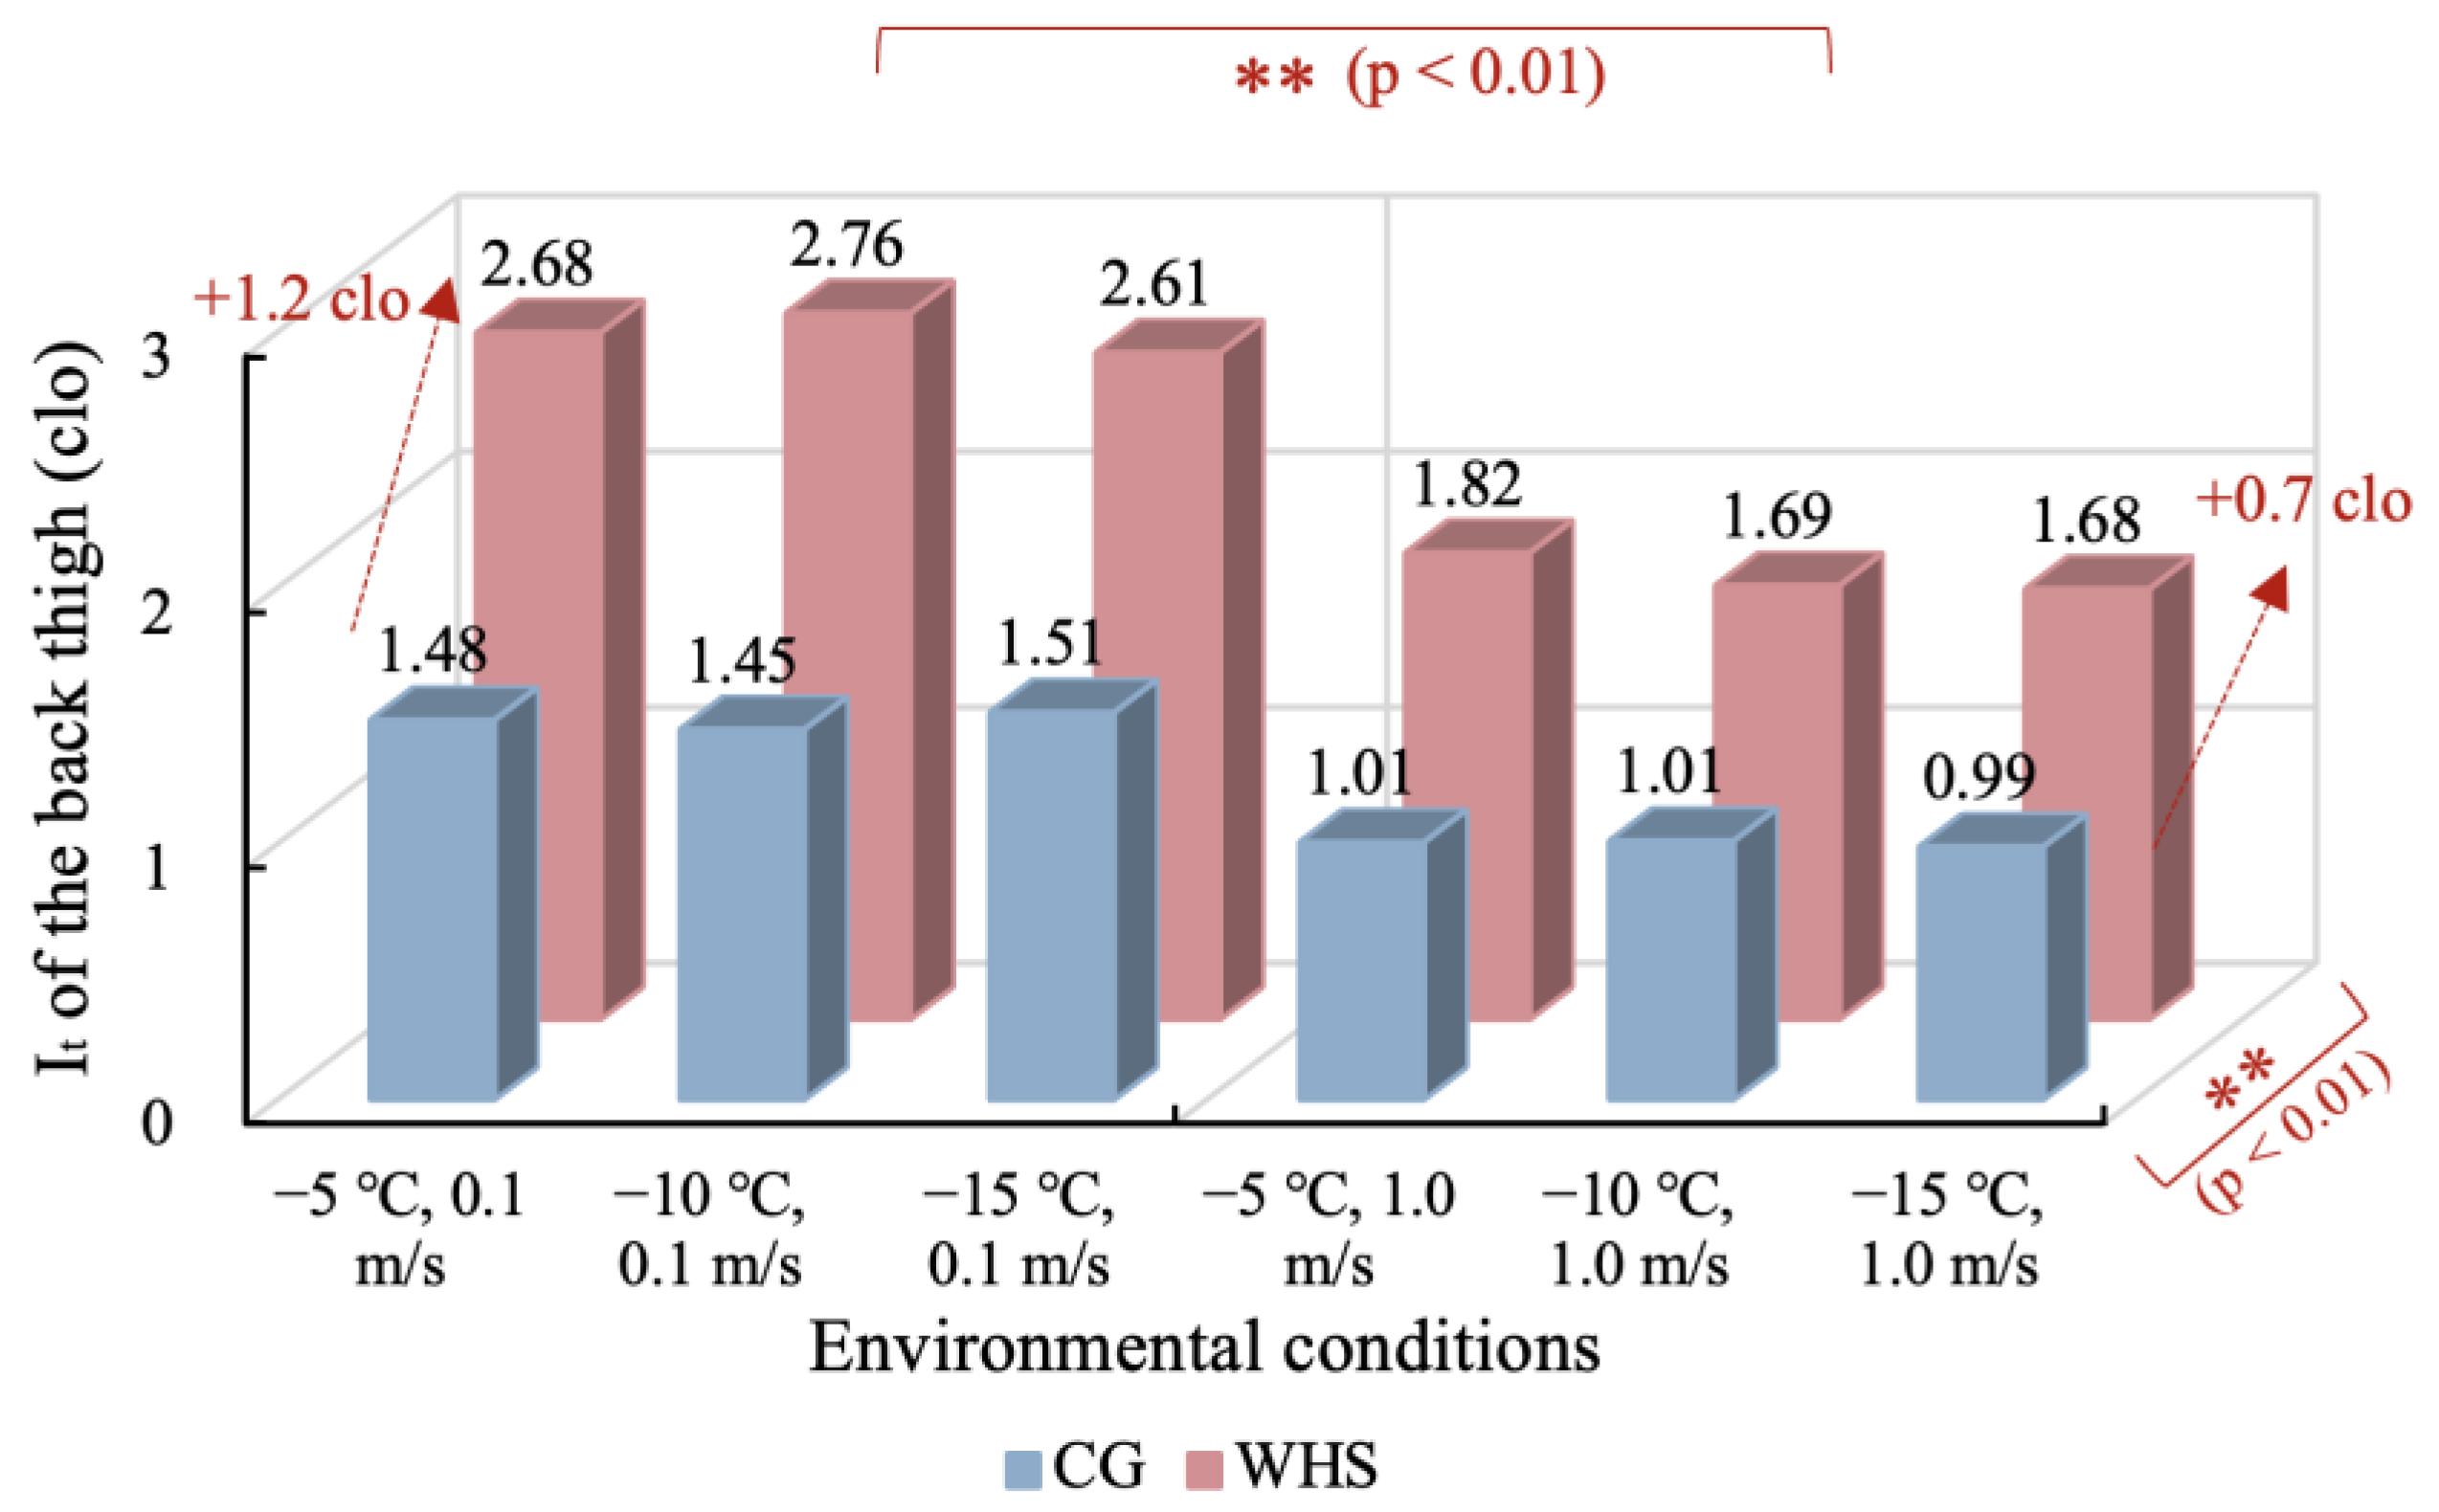
The effects of environmental parameters on basic CPP were analyzed. Ta had no significant effect on clothing insulation. However, elevated Va significantly decreased the clothing insulation. When Va was elevated from 0 m/s to 1 m/s, the clothing insulation of typical winter garments worn by the thermal manikin decreased from 0.6 to 0.9 clo;
(2)
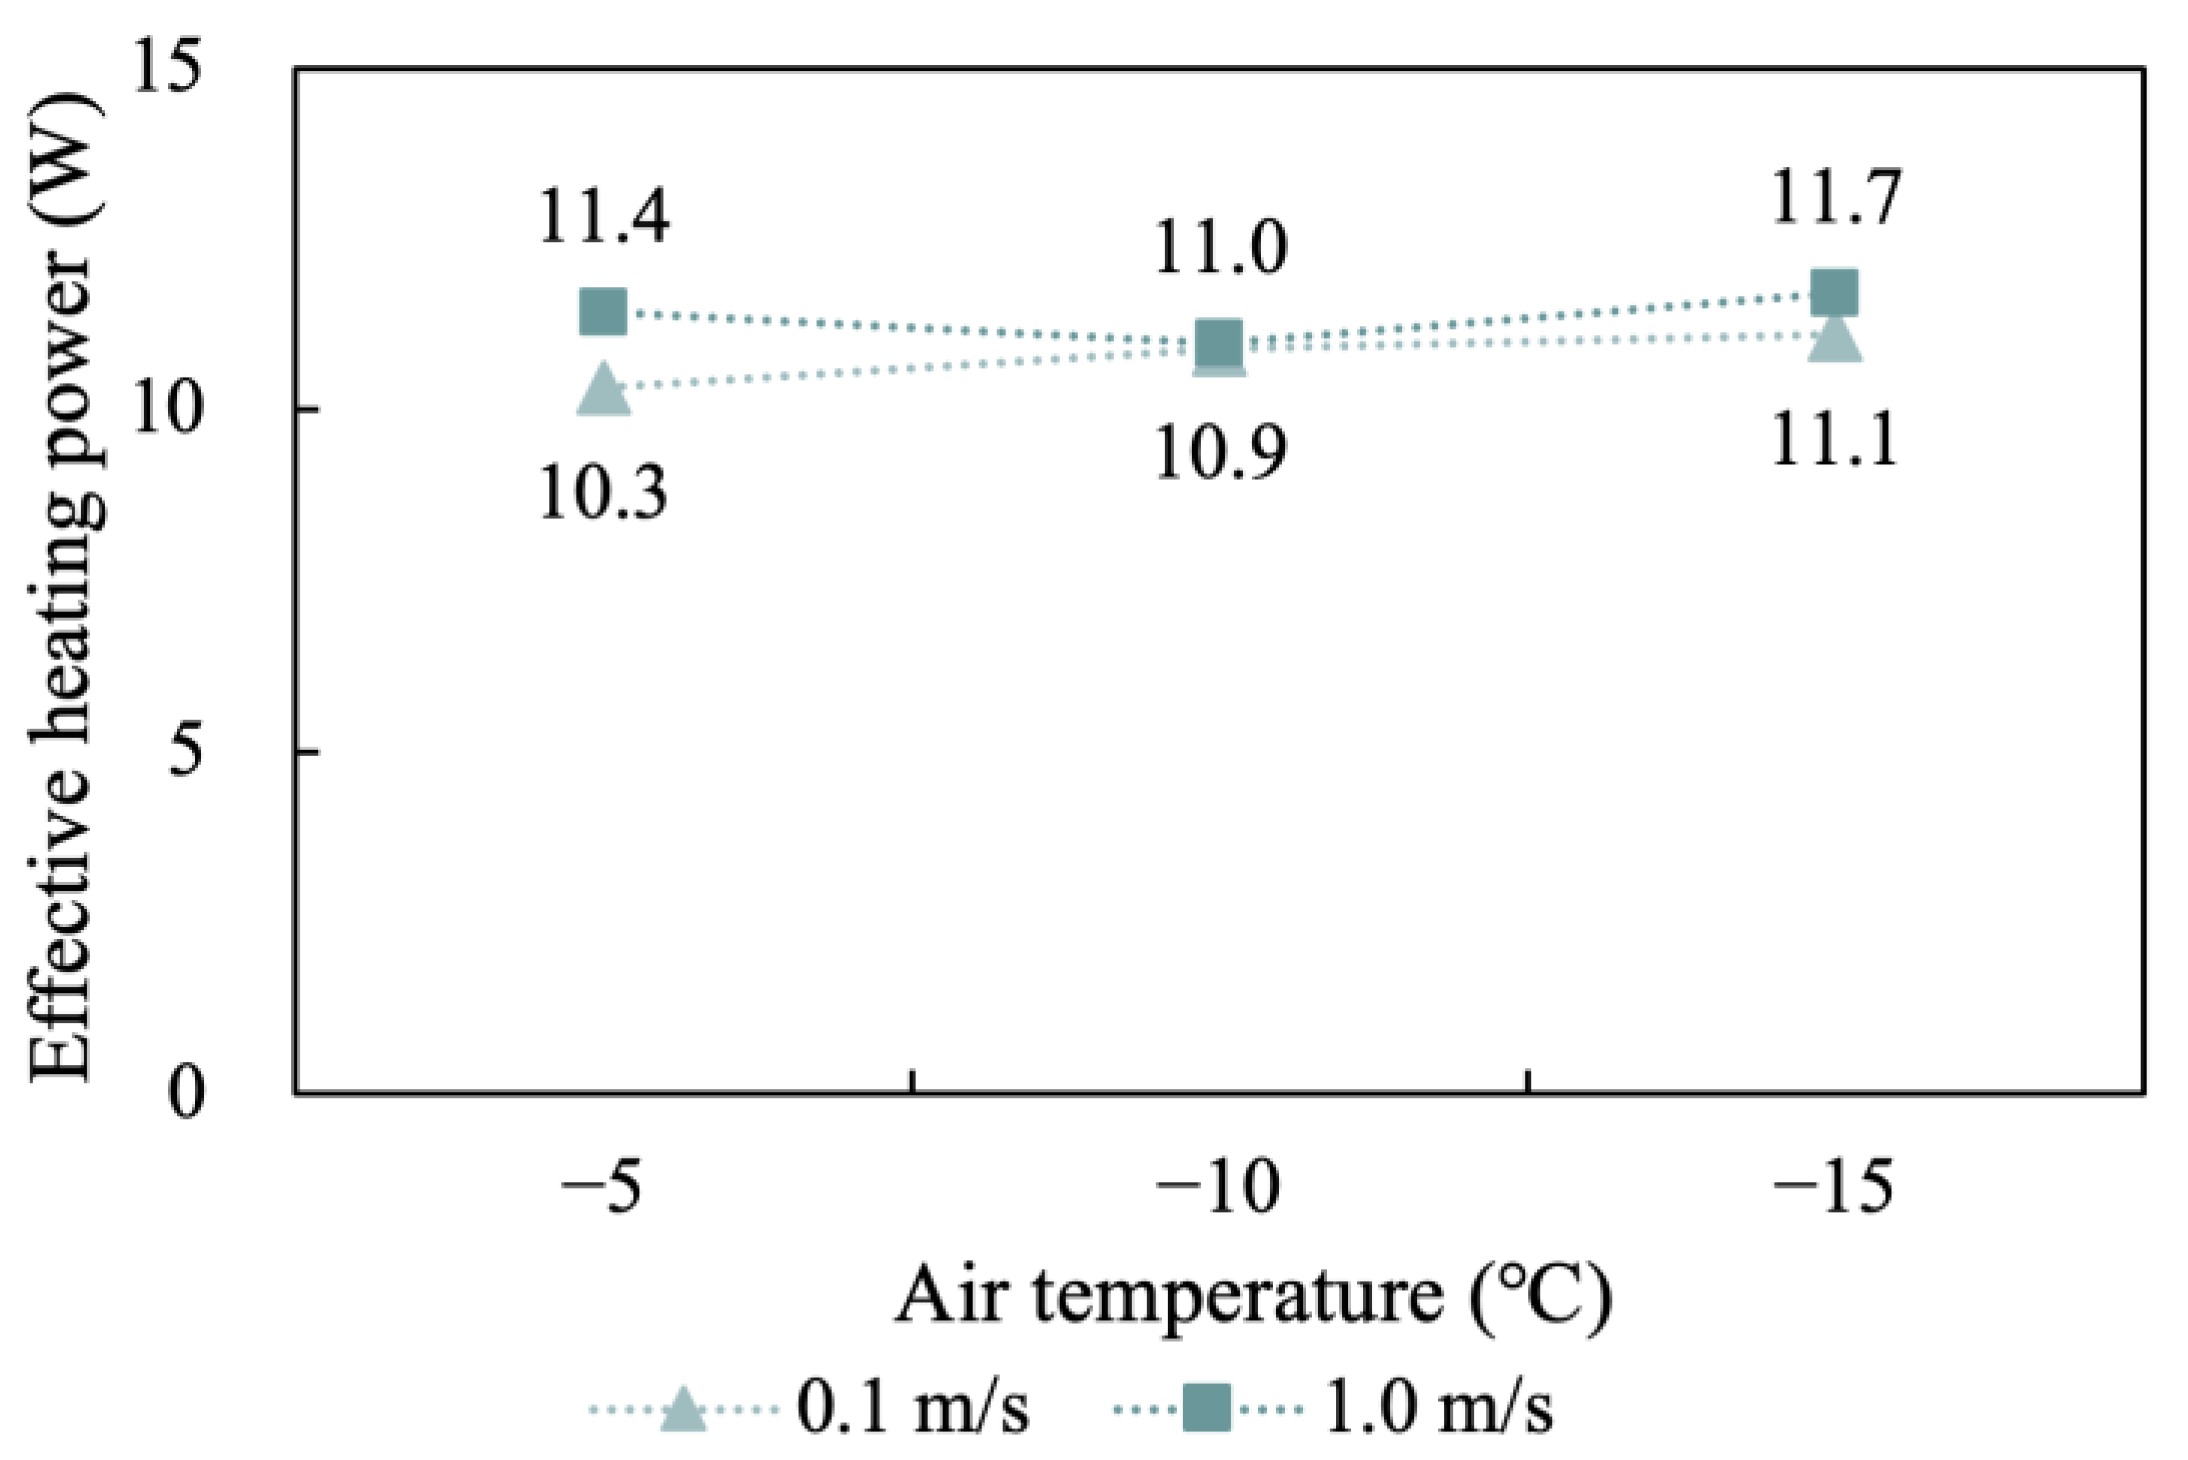
The effects of environmental parameters on the HP of different personal heating measures were analyzed. Decreased Ta and elevated Va reduced the Peff and η of electrical heating measures. η was no longer affected by variations in Ta and Va when η dropped to a certain level (EHS: about 25%). In addition, the effect of Va is related to Ta. However, the effect of Va and Ta combination on the Peff and η is challenging to clarify, and further studies on this need to be conducted in the future. For the chemical heating measure, HP instead increased with the decreased Ta and elevated Va;
(3)
The improvement of the new material aerogel on the CPP and HP of EHG was obtained. Icl of WANH increased by 0.2 clo, equal to the improvement of NAWH, indicating the aerogel layer provided good thermal insulation. In addition, the aerogel layer significantly improved the HP of EHG. The Peff and η of WAWH were more than twice that of NAWH in a −5 °C windless environment. η of WAWH was as high as 95%. However, the enhancement effect of aerogel insulation decreased with decreased Ta and elevated Va;
(4)
The CP values of different personal heating measures were calculated and investigated. In the nine environmental conditions in this study, the CP of EHG (WAWH), EHG (NAWH), EHS, and CHI could reach 5.8–8.4 K, 3.2–4.3 K, 1.9–3.9 K, and 0.3–1.1 K, respectively. However, the energy efficiency ratio of thermal comfort of CHI (the improvement of thermal comfort/energy consumption) is substantial, although the CP value of CHI was the lowest. Therefore, the actual application effect of personal heating measures should be further studied by human subject experiments.

Author Contributions

Conceptualization, B.C.; data curation, S.L. and Y.D.; formal analysis, S.L.; funding acquisition, B.C.; methodology, S.L. and Y.D.; supervision, B.C.; visualization, S.L. and Y.D.; writing—original draft, S.L. and Y.D.; writing—review and editing, B.C. All authors have read and agreed to the published version of the manuscript.

Funding

This study was sponsored by the Beijing Nova Program (No. Z191100001119051) and the National Natural Science Foundation of China (No. 52078270 and No. 52130803).

Institutional Review Board Statement

Not applicable.

Informed Consent Statement

Not applicable.

Data Availability Statement

The data presented in this study are available on request from the corresponding author. The data are not publicly available due to privacy.

Conflicts of Interest

The authors declare no conflict of interest.

Nomenclature

AiSurface area of segment i (m2)
CHIChemically heated insole
CPCorrective power (K)
CPPCold protective performance
EHGElectrically heated garment
EHSElectrically heated seat
EHTEquivalent homogenous temperature (°C)
EHVElectrically heated vest
fclArea factor
fiRatio of the surface area of segment i to the total surface area
HPHeating performance
HiHeat flow of segment i (W/m2)
HinInput heating power (W/m2)
IaBoundary insulation (clo)
ItTotal insulation (clo)
It, iLocal total insulation of segment i (clo)
IclEffective clothing insulation (clo)
KProportional constant
PiHeating power of segment i (W/m2)
PeffEffective heating power (W/m2)
tTime (s)
TaAir temperature (°C)
TgGlobe temperature (°C)
TmrMean radiant temperature (°C)
TinInternal temperature (°C)
TskinSkin temperature (°C)
Tskin, iSkin temperature of segment i (°C)
TsetSetting skin temperature (°C)
VaAir velocity (m/s)
λ Heat conversion efficiency
η Heating efficiency
τ Integral constant

References

  1. Pinkerton, K.E.; Felt, E.; Riden, H.E. Extreme Weather Resulting from Global Warming is an Emerging Threat to Farmworker Health and Safety. J. Agric. Saf. Health 2019, 25, 189–190. [Google Scholar] [CrossRef] [PubMed]
  2. Pörtner, H.-O.; Roberts, D.C. Climate Change 2022: Impacts, Adaptation and Vulnerability; IPCC: Geneva, Switzerland, 2022.
  3. Patil, P. Effects of a cold-water stressor on psychomotor and cognitive functioning in humans. Physiol. Behav. 1995, 58, 1281–1286. [Google Scholar] [CrossRef]
  4. Anttonen, H.; Virokannas, H. Assessment of cold stress in outdoor work. Arct. Med. Res. 1994, 53, 40–48. [Google Scholar]
  5. Taylor, L.; Watkins, S.L.; Marshall, H.; Dascombe, B.J.; Foster, J. The Impact of Different Environmental Conditions on Cognitive Function: A Focused Review. Front. Physiol. 2016, 6, 372. [Google Scholar] [CrossRef] [PubMed] [Green Version]
  6. Van Marken Lichtenbelt, W.D.; Schrauwen, P. Implications of nonshivering thermogenesis for energy balance regulation in humans. Am. J. Physiol. Regul. Integr. Comp. Physiol. 2011, 301, R285–R296. [Google Scholar] [CrossRef] [Green Version]
  7. Tansey, E.A.; Johnson, C.D. Recent advances in thermoregulation. Adv. Physiol. Educ. 2015, 39, 139–148. [Google Scholar] [CrossRef] [Green Version]
  8. Deschênes, O.; Moretti, E. Extreme Weather Events, Mortality, and Migration. Rev. Econ. Stat. 2009, 91, 659–681. [Google Scholar] [CrossRef]
  9. Ma, N.; Lu, Y.; Xu, F.; Dai, H. Development and performance assessment of electrically heated gloves with smart temperature control function. Int. J. Occup. Saf. Ergon. 2020, 26, 46–54. [Google Scholar] [CrossRef]
  10. Iserson, K.V. Glove and mitten protection in extreme cold weather: An Antarctic study. Int. J. Circumpolar Health 2016, 75, 33564. [Google Scholar] [CrossRef] [Green Version]
  11. Brajkovic, D.; Ducharme, M.B.; Frim, J. Influence of localized auxiliary heating on hand comfort during cold exposure. J. Appl. Physiol. 1998, 85, 2054–2065. [Google Scholar] [CrossRef]
  12. Streets, D.F. Cold Chamber Trial of Electrically Heated Gloves, Mitts and Insoles for Rapier Operators and AFV Crewmen; Report APRE 18/74; Army Personnel Research Establishment: Farnborough, UK, 1974.
  13. Rapaport, S.I.; Fetcher, E.S.; Shaub, H.G.; Hall, J.F. Control of Blood Flow to the Extremities at Low Ambient Temperatures. J. Appl. Physiol. 1949, 2, 61–71. [Google Scholar] [CrossRef]
  14. Ducharme, M.B.; Brajkovic, D.; Frim, J. The effect of direct and indirect hand heating on finger blood flow and dexterity during cold exposure. J. Therm. Biol. 1999, 24, 391–396. [Google Scholar] [CrossRef]
  15. Brajkovic, D.; Ducharme, M.B. Finger dexterity, skin temperature, and blood flow during auxiliary heating in the cold. J. Appl. Physiol. 2003, 95, 758–770. [Google Scholar] [CrossRef]
  16. Zhang, H.; Arens, E.; Zhai, Y. A review of the corrective power of personal comfort systems in non-neutral ambient environments. Build. Environ. 2015, 91, 15–41. [Google Scholar] [CrossRef] [Green Version]
  17. Li, D. The relationship between thermal insulation value of clothing and assembled clothing. J. Text. Res. 1997, 18, 23–25. [Google Scholar] [CrossRef]
  18. Havenith, G.; Nilsson, H.O. Correction of clothing insulation for movement and wind effects, a meta-analysis. Eur. J. Appl. Physiol. 2004, 92, 636–640. [Google Scholar] [CrossRef] [PubMed]
  19. Oliveira, A.V.M.; Gaspar, A.R.; Francisco, S.C.; Quintela, D.A. Convective heat transfer from a nude body under calm conditions: Assessment of the effects of walking with a thermal manikin. Int. J. Biometeorol. 2012, 56, 319–332. [Google Scholar] [CrossRef] [PubMed]
  20. Wang, F.; Lee, H. Evaluation of an Electrically Heated Vest (EHV) Using a Thermal Manikin in Cold Environments. Ann. Occup. Hyg. 2009, 54, 117–124. [Google Scholar] [CrossRef] [PubMed] [Green Version]
  21. Wang, F.; Gao, C.; Holmér, I. Effects of Air Velocity and Clothing Combination on Heating Efficiency of an Electrically Heated Vest (EHV): A Pilot Study. J. Occup. Environ. Hyg. 2010, 7, 501–505. [Google Scholar] [CrossRef]
  22. Song, W.; Lai, D.; Wang, F. Evaluating the cold protective performance (CPP) of an electrically heated garment (EHG) and a chemically heated garment (CHG) in cold environments. Fibers Polym. 2015, 16, 2689–2697. [Google Scholar] [CrossRef]
  23. Luo, M.; Arens, E.; Zhang, H.; Ghahramani, A.; Wang, Z. Thermal comfort evaluated for combinations of energy-efficient personal heating and cooling devices. Build. Environ. 2018, 143, 206–216. [Google Scholar] [CrossRef]
  24. Tang, Y.; Su, Z.; Yu, H.; Zhang, K.; Li, C.; Ye, H. A database of clothing overall and local insulation and prediction models for estimating ensembles’ insulation. Build. Environ. 2022, 207, 108418. [Google Scholar] [CrossRef]
  25. ISO 9920:2007; Ergonomics of the Thermal Environment—Estimation of the Thermal Insulation and Evaporation Resistance of a Clothing Ensemble. International Organization for Standardization: Geneva, Switzerland, 2007.
  26. ASTM F1291-16; Standard Test Method for Measuring the Thermal Insulation of Clothing Using Heated Manikin. ASTM International: West Conshohocken, PA, USA, 2016.
  27. Xiong, J.; Lian, Z.; Zhang, H. Physiological response to typical temperature step-changes in winter of China. Energy Build. 2017, 138, 687–694. [Google Scholar] [CrossRef]
  28. Sullivan-Kwantes, W.; Haman, F.; Kingma, B.R.M.; Martini, S.; Gautier-Wong, E.; Chen, K.Y.; Friedl, K.E. Human performance research for military operations in extreme cold environments. J. Sci. Med. Sport 2021, 24, 954–962. [Google Scholar] [CrossRef]
  29. Deng, Y.; Cao, B.; Yang, H.; Liu, B. Effects of local body heating on thermal comfort for audiences in open-air venues in 2022 Winter Olympics. Build. Environ. 2019, 165, 106363. [Google Scholar] [CrossRef]
  30. Deng, Y.; Cao, B.; Liu, B.; Zhu, Y. Effects of local heating on thermal comfort of standing people in extremely cold environments. Build. Environ. 2020, 185, 107256. [Google Scholar] [CrossRef]
  31. Luo, M.; Wang, Z.; Zhang, H.; Arens, E.; Filingeri, D.; Jin, L.; Ghahramani, A.; Chen, W.; He, Y.; Si, B. High-density thermal sensitivity maps of the human body. Build. Environ. 2020, 167, 106435. [Google Scholar] [CrossRef]
  32. Tanabe, S.; Kobayashi, K.; Nakano, J.; Ozeki, Y.; Konishi, M. Evaluation of thermal comfort using combined multi-node thermoregulation (65MN) and radiation models and computational fluid dynamics (CFD). Energy Build. 2002, 34, 637–646. [Google Scholar] [CrossRef] [Green Version]
  33. Shitzer, A.; Arens, E.; Zhang, H. Compilation of basal metabolic and blood perfusion rates in various multi-compartment, whole-body thermoregulation models. Int. J. Biometeorol. 2016, 60, 1051–1064. [Google Scholar] [CrossRef] [Green Version]
  34. Wu, J.; Sun, B.; Hu, Z.; Li, L.; Zhu, H. Physiological responses and thermal sensation during extremely cold exposure (−20 °C). Build. Environ. 2021, 206, 108338. [Google Scholar] [CrossRef]
Figure 1. Thermal manikin: (a) thermal manikin in standing; (b) structure of thermal manikin and block division.
Buildings 13 00362 g001
Figure 2. Schematic of the cryogenic chamber (m).
Buildings 13 00362 g002
Figure 3. Personal heating devices: (a) EHG, (b) EHS, and (c) CHI.
Buildings 13 00362 g003
Figure 4. (a) WSZY-1 thermometer, (b) Swema-03 Omnidirectional anemometer, and (c) HQZY-1 globe thermometer.
Buildings 13 00362 g004
Figure 5. Test procedure.
Buildings 13 00362 g005
Figure 6. Icl of four garments at different Ta.
Buildings 13 00362 g006
Figure 7. Peff of EHGs at different Ta.
Buildings 13 00362 g007
Figure 8. It of four garments at different Va.
Buildings 13 00362 g008
Figure 9. Peff of EHGs at different Va: (a) NAWH, (b) WAWH.
Buildings 13 00362 g009
Figure 10. It, back thigh of CG and WHS in different environmental conditions.
Buildings 13 00362 g010
Figure 11. Peff of EHS in different experimental conditions.
Buildings 13 00362 g011
Figure 12. It, foot of CG and WHI in different environmental conditions.
Buildings 13 00362 g012
Figure 13. Peff of CHI in different experimental conditions.
Buildings 13 00362 g013
Figure 14. CP values of four personal heating measures in different environmental conditions.
Buildings 13 00362 g014
Table 1. Body segments and corresponding areas of the thermal manikin.
Body SegmentArea (m2)Body SegmentArea (m2)
Left/Right (L/R). Foot0.053Scull0.054
L/R. Foreleg0.115L/R. Hand0.0457
L/R. front Thigh0.0957L/R. Forearm0.042
L/R. back Thigh0.0957L/R. Upper arm0.083
Pelvis0.046L/R. Side Chest0.0894
Back side0.076L/R. Side Back0.0894
Head0.08Total1.6738
Table 2. Experimental conditions.
Condition NumberClothing Combination/Improvement Measure
1Without aerogel layer, without local heating (CG)
2With aerogel layer, without local heating (WANH)
3Without aerogel layer, with local heating (NAWH)
4With aerogel layer, with local heating (WAWH)
5With heated seat (WHS)
6With heated insoles (WHI)
Table 3. Clothing used in the experiments.
Garment DescriptionMaterialsSizeWeight (g)
HatAcrylic fiber98
ScarfAcrylic fiber156
MaskCotton12
Long-sleeved sweaterFabric: cotton
Lining: polyester fiber
XL440
JacketFabric: polyester fiber
Lining: fleece
Filler: aerogel
XL1800
GlovesFabric: poly urethane leather
Lining: long fuzz
202
Warm pantsFabric: cotton
Lining: short fuzz
XL418
Windproof trousersFabric: polyester fiber
Lining: fleece
XL364
SocksCotton32
Cotton-padded shoesFabric: suede
Lining: short fuzz
42 (Europe)682
Table 4. Information on the instruments.
Measured ParameterInstrumentSpecificationManufacturer
Ta and RHWSZY-1 thermometerAccuracy: ±0.3 °C and ±3%
Range: −40–100 °C and 0–100%
TianJianhuayi Co., Ltd., Beijing, China
TgHQZY-1 globe thermometerAccuracy: ±0.3 °C
Range: −20–80 °C
TianJianhuayi Co., Ltd., Beijing, China
vSwema-03 Omnidirectional anemometerAccuracy: ±0.04 m/s
Range: 0.05–3.00 m/s
Swema AB Co., Ltd., Farsta, Sweden
Table 5. Measured environmental parameters during the experiment (Mean ± SD).
PlannedMeasured
Ta (°C)Va (m/s)Ta (°C)Va (m/s)RH (%)Tmr (°C)
−50.1−4.9 ± 0.2<0.1070 ± 3−4.3 ± 0.2
−100.5−10.1 ± 0.10.51 ± 0.05−9.4 ± 0.3
−151.0−14.6 ± 0.21.10 ± 0.10−14.3 ± 0.2
Table 6. η of EHGs at different Ta.
Ta (°C)NAWHWAWH
−542%95%
−1035%52%
−1522%33%
Table 7. η of EHGs at different Va.
Va (m/s)−5 °C−10 °C−15 °C
NAWHWAWHNAWHWAWHNAWHWAWH
042%95%35%52%22%33%
0.533%68%32%50%21%33%
130%59%30%49%21%33%
Table 8. η of EHS in different experimental conditions.
Ta (°C)Va (m/s)
01
−523%25%
−1024%24%
−1525%26%
Disclaimer/Publisher’s Note: The statements, opinions and data contained in all publications are solely those of the individual author(s) and contributor(s) and not of MDPI and/or the editor(s). MDPI and/or the editor(s) disclaim responsibility for any injury to people or property resulting from any ideas, methods, instructions or products referred to in the content.

