Abstract
The need for efficient buildings to contribute to sustainable development has led to the proposal of goals and regulations in different countries linked to net zero energy objectives, following approaches specific to their regions. Such regulations are not yet developed in a developing country such as Panama. Thus, this study develops the first framework for Zero Energy Districts (ZED) in Panama based on passive and active solutions through dynamic simulation. For this, an existing urbanization area consisting of 34 residential buildings, called the existing case (EC), was studied. After undergoing a design based on the bioclimatic methodology, a redesigned case (RC) is proposed to maintain thermal comfort and reduce energy consumption. Key redesign factors are the buildings’ shape, orientation, glazing, the use of shadows, material of the walls, and the air conditioning configuration. Results showed energy consumption decreases by 37.5% when considering all buildings with natural ventilation, reaching ranges of positive net energy (+356.50 kWh/m2y). In the case of nearly ZED in Panama, the ranges could be considered between 14 and 180 kWh/m2y. This balance indicates that there is potential on site to develop zero energy districts.
Keywords:
bioclimatic; simulation; tropical climate; ZED; zero energy building; zero energy district 1. Introduction
Energy efficiency in buildings, globally, has become very important due to the contribution of the building sector to climate change, its high energy consumption, and carbon dioxide emissions. The current situation increases the pressure to adopt the measures set out in the Paris Agreement, which aims to limit greenhouse gas emissions by keeping the global average temperature increase below 1.5 °C. Improving the performance of buildings contributes to achieving the Sustainable Development Goals (SDG 3—good health and well-being; SDG 7—affordable and clean energy; SDG 11—sustainable cities and communities; SDG 12—responsible consumption and production; and SDG 13—climate action) [1].
In Panama, approximately 70% of electricity consumption is concentrated in the capital city, linking the effects with urban environments. Based on this and other energy problems, Panama’s National Energy Secretariat has designed the National Energy Plan 2015–2050 (PEN), having among its axes the improvement of urban environments built in a disorderly and inefficient manner [2]. Likewise, in 2019, the Sustainable Buildings Regulation (RES) of the Technical Council of Engineering and Architecture implied the mandatory application of mechanisms that result in savings percentages between 15% and 20% in various types of buildings through compliance paths with passive and active strategies [3]. Moreover, in Chapter IV of Law 69 of 2012 (UREE), minimum energy efficiency indices have been established to distribute equipment in the country, such as air conditioning units, refrigerators, and luminaires [4].
These initiatives have given rise to research of the application of passive and active solutions to improve energy efficiency in the country; however, they can have greater ambitions to achieve high energy efficiency buildings, such as a Nearly Zero Energy Buildings (nZEBs). For example, in Europe, the Energy Performance of Buildings Directive (EPBD) makes it mandatory for the European Member States to comply with nZEB specifications from 2018 with respect to public use, and by the end of 2020, for all buildings, including those for private use [5]. The definition of nZEB is based on a building that requires a meager amount of energy to operate and uses renewable sources of generation, to the greatest extent possible, on site. The most used indicator for classifying buildings is the primary energy in kWh/m2y. However, it is common to use parameters such as thermal transmittance values (U-value) of the envelope, net and final energy for heating and cooling, or CO2 emissions. Each country in the European Union is responsible for setting its limits (considering climatic conditions, level of ambition, calculation methods, and building traditions). For residential buildings, the primary energy ranges from 20 kWh/m2y to 180 kWh/m2y [6].
Zero Energy Building (ZEB) philosophy has been extrapolated to the community and district level, even though zero-consumption technologies at the individual building scale promise favorable results. By considering the mutual influence between the urban context and buildings, it becomes possible to achieve better accuracy in evaluating energy performance based on the same principles and goals set at the individual level [7,8]. For example, the Green Building Council (GBC) implemented evaluations at the urban level with the LEED for Cities and Communities Certification (v4.1), focused on the following categories: natural systems and ecology, transportation and land use, water efficiency, materials and resources, and quality of life [9]. In Panama, the City of Knowledge obtained a pre-certification for communities, that being the first pre-certified pilot project in this category in Latin America.
Along these lines, the Energy in Buildings and Communities Program of the International Energy Agency (IEA-EBC) and the Solar Heating and Cooling Program (SHC) have also involved among their long-term projects the development of a common methodology for the study of net-zero energy districts. With the SHC Task 40/EBC Annex 52 project [10,11], progress was made in documenting modeling strategies and necessary technologies. IEA-EBC is also developing Annex 83, with the main objective of creating a shared definition of positive energy districts (PEDs) and providing guidance on the solutions needed for the implementation of this type of urbanization [12].
The nZEB concept has been adapted to define a Nearly Zero Energy District (nZED) and a Net Zero Energy District (NZED) as a bounded part of a very energy efficient city with a quantity of energy generated from renewable sources produced on site or nearby [7,13] that includes an iteration between buildings, residents, streets, sidewalks, and vegetation. Zero energy districts are not limited to individual buildings, but comprise several buildings and optimize energy efficiency, thermal energy, and renewable energy generation between those buildings to offset demand [14,15].
From the above and considering the momentum of the energy transition in Panama, this research seeks to have a reference framework for Zero Energy Districts (ZEDs) in the country based on energy performance simulations and bioclimatic design methodology. The study applied bioclimatic strategies and the multi-objective optimization of active and passive strategies through dynamic simulation, evaluating the reductions in energy consumption of the urbanization. In addition, given the lack of well-defined criteria regarding the concept of “zero energy” at the scale of urbanization, the bioclimatic methodology applied is systematized to serve as a basis for future research in the field of study in climatic regions similar to Panama. Moreover, with the results obtained, it is expected to contribute to future local energy plans to contemplate the scope of ZED in their goals.
2. Literature Review: Key Criteria for the Concept of Zero Energy Developments
The philosophy to achieve zero energy constructions is fundamentally based on first increasing energy efficiency and then applying generation techniques based on renewable energies. A literature review was conducted on studies focused on using passive and active strategies to reduce energy use both at the building scale and at the urban or district scale, at the residential level. In addition, research focused on describing the key criteria for the concept of zero energy buildings and developments were reviewed, including the most widely used renewable energy generation technologies for these purposes. The period between 2015 and 2022 was used as a search reference, using Google Scholar as a search engine, finding through these documents from different databases such as Scopus, Web of Science, and Springer Link. The main search terms used were: “ZED,” “nZED,” “zero energy building,” “zero energy district,” and “positive energy district.”
Despite not having a specific methodology and common definition, it is known that to achieve zero or nearly zero energy environments, bioclimatic architecture, energy efficiency, and Internet of Things guidelines must be implemented [16]. “Zero energy” seeks, in a first approach, to reduce energy use. This can be reached by applying passive and active strategies, that is, implementing bioclimatic architecture and using equipment with higher energy efficiency rates. In Panama, there is a zero-energy house whose design sought to reduce the annual load by cooling through a lightweight envelope, taking advantage of natural ventilation, using high-efficiency glazing, controlled shading, natural lighting, and dehumidification since the climatic conditions of the site lead to dependence on mechanical cooling [17]. Other research in different climates has been based on dynamic simulations to study the application of strategies for energy reduction by mechanical cooling; for example, in [18], a saving of 32% was found by combining a bioclimatic scenario that involves the use of ecological materials with a high-performance HVAC system. In [19], the impact of cooling on energy consumption is evident by demonstrating how reductions are achieved by increasing the cooling temperature by one degree (26 °C to 27 °C) with savings between 23% and 35% for both a traditional home and nZEB. At the district level, projects have also been found that use dynamic simulation, such as the REMOURBAN project, in the city of Valladolid, Spain, which involved modifications to the façades and ceilings, renovation of the lighting system using LED technology, integral renovation of a thermal power plant, using two biomass boilers, rehabilitation of the distribution network, and the integration of sanitary water heating in a district network; with active and passive strategies, consumption is reduced by 45.4% [20]. Another perspective of interest was evaluated in [21], where a microclimate analysis was performed to evaluate the results of a Near-Zero Energy Project Building in the Settlement (nZES), adjusting scenarios with increased percentages of vegetation and solar reflectance of roofs and pavements, which implemented technologies such as extruded polystyrene insulation, low-e double-glazed windows with PVC frames, an LED lighting system, a high-efficiency air-to-water heat pump in the HVAC system for heating and cooling, and mechanical ventilation with heat recovery. The results indicated that in addition to mitigating outdoor air temperatures up to 1.5 °C comparing the scenarios, the difference in energy consumption between the traditional building and the low-consumption building is 70%.
Cabeza and Chàfer [16] describe the importance of bioclimatic architecture in increasing interior comfort and reducing heating, cooling, lighting, and ventilation requirements based on strategies such as using windows, ideal glazing, passive shading, and vegetation on roofs and balconies. The study also emphasizes that Building Integrated Photovoltaics (BIPV) is a key solution for producing clean electricity and reducing material and labor costs, compared to traditional panels (BAPV). On the other hand, in Colombia (tropical climate), the characteristics and definitions of Net Zero Energy Building (NZEB) in a house were studied, basing interest on high-efficiency appliances due to their importance and level of use in tropical regions, which suggests greater relevance to active systems, since the influence of thermal levels on the energy consumption of electrical appliances used in the home has a great impact on the increase or decrease in demand; it also indicates that in terms of energy production, solar energy (photovoltaic and thermal) is the most convenient option compared to wind energy or biomass [22]. In Quito, Ecuador, a roadmap was developed to highlight the possibility of achieving NZEB, taking technical and policy aspects as criteria. The roadmap targets at different stages the following: in the short term, a shared vision, indoor air quality research, vernacular architecture research, and prototyping; in the medium term, low-tech industrial infrastructure, modeling tools, standardization, and NZEB policies; finally, in the long term, it focuses on the development of databases, high-tech industrial infrastructure, and smart and decarbonized grids. Before proposing the roadmap, the study compared four typologies of houses with two different types each: traditional construction and construction with insulation system with double leaf façade, 4 cm insulation, double glazing, natural ventilation, and PV panels per roof area, using EnergyPlus and Python, obtaining that with these changes it was possible to have houses independent of mechanical heating or cooling and to achieve a zero or positive balance [23]. As for Net Zero Energy Buildings (NZEDs), no compliance routes were found, but the proposed stratification in [7] regarding the analysis of energy demand provides a starting point and divides the balance of the district into the following determinants:
- Buildings (passive design, active systems, urban climate, and urban morphology).
- Public spaces (lighting, infrastructure, landscape, and public uses).
- Energy production at the district scale (consumption patterns, energy production, and distribution), as shown in Figure 1.
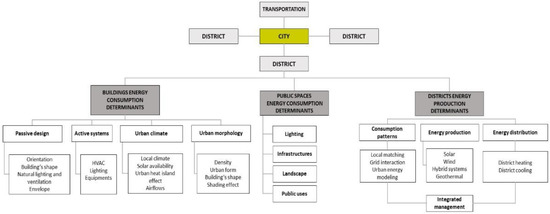 Figure 1. Energy determinants implied in each scale, focusing on the district balance towards an NZED. Reproduced with permission from [7], Elsevier, 2018.
To quantify the energy savings, in [24], by means of dynamic simulation in TRYNSYS software, a single-family house built in the 1970s was replaced with two houses of equal area on the same lot. Both active and passive strategies were used, and the houses were equipped with BIPV systems on the roof. Overall, the two houses resulted in 30% less energy consumption. On an annual basis, 44% of the consumption can be generated with the PV integration system, demonstrating that there is also an opportunity to retrofit aging buildings and convert existing developments into PED. In a case study [25] composed of 29 residential buildings with low energy performance, both envelope and systems, strategies were implemented to achieve nZED and ZED objectives, including roof-wide PV systems, reversible and efficient heat pumps, renovation of the building envelope and energy storage systems such as batteries and compressed air, sharing energy between buildings. EnergyPlus and MATLAB® found that energy sharing enables a more significant reduction in the environmental footprint of buildings compared to standard retrofit approaches.
Another important aspect is the analysis of occupant behavior at the building and district levels, taking advantage of valuable tools for capturing data from urban dynamics, such as sensors, the Internet of Things, and data intelligence. The use of physics-based energy models of urban buildings to simulate heat fluxes in buildings and thus estimate energy use is indicated. The insufficient consideration of the behavior of the occupants is one of the leading causes of the discrepancy between the actual energy consumption and that obtained through simulations because these parameters have high sensitivity concerning energy consumption, one of the most influential being the adjustment temperature of equipment for cooling and space heating [26,27].
The factors found in the literature have been shown to have an important influence both in obtaining decreases in energy consumption and achieving zero energy balance and goals. Table 1 summarizes the information described from the selected investigations. Based on this bibliography, a map was made in VOSViewer software v1.6.18.0 to illustrate the co-occurrences of terms in the title and abstract from the text data [28]. The complete count method was used, and due to the low number of references, a minimum number of two-term occurrences was selected. Figure 2 illustrates the results by the average publication year, where the most relevant terms are “data,” “house,” “climate,” “nzeb,” and “simulation,” which are repeated more than seven times. It is also noted that the most recent research has a focus more closely linked to ZED, as terms such as “community” and “energy storage system” are found.

Table 1.
Summary of key criteria for the concept of buildings and urbanizations at zero energy, based on passive and active strategies.
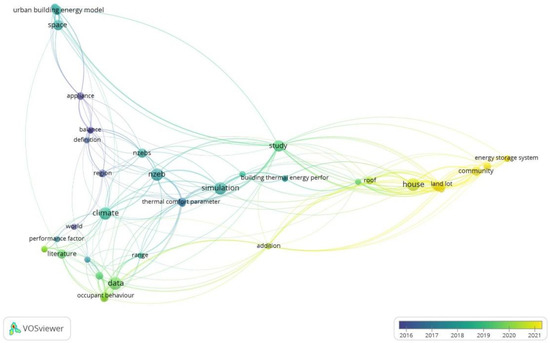
Figure 2.
Overlay visualization by the average publication year of main terms in the literature review. Own elaboration in VOSViewer software version 1.6.18.0.
3. Materials and Methods
The research is summarized in the methodology in Figure 3. For an existing building and urbanization (hereinafter referred to as EC, “existing case”), the main characteristics of the case study are analyzed: climatic conditions, envelope composition, occupancy profiles, use of equipment, and energy consumption. Subsequently, a proposal is made to redesign the individual building and distribution on an urban scale (called RC from “redesigned case”), systematizing and applying a set of solutions found through a bioclimatic methodology and the application of parametric analysis. DesignBuilder software v6.1.6.011 [29] was used to realize dynamic simulations based on the EnergyPlus tool. The result obtained using passive and active strategies is analyzed. This allows for quantifying the energy balance and proposing a roadmap that results in the first ZED reference framework in Panama.
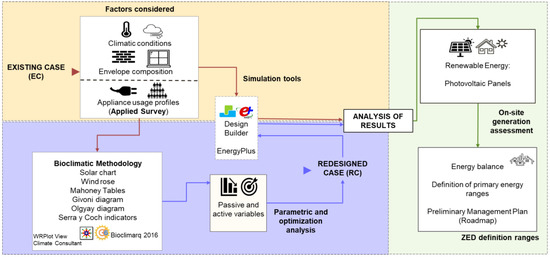
Figure 3.
Methodology used for the research. Own elaboration.
Figure 4 shows the location of EC, which is a residential urbanization in the district of Chitré, province of Herrera, in the Republic of Panama (7°58′51′′ N 80°26′31′′ W), under the climatic classification Awi (tropical savannah with low thermal oscillation).
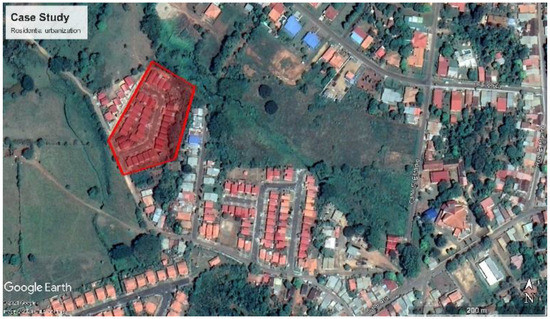
Figure 4.
Location of the residential urbanization under study (within the red polygon).
The urbanization is bounded by a lot of 1.13 hectares of extension and consists of 34 houses of 55 m2 of surface each and similar architectural construction. Since it was constructed between 2016 and 2019, the design does not consider the criteria of the RES [3]. The individual building comprises one floor and is divided into different architectural areas (entrance hall, living room, two bedrooms, and kitchen). The characteristics of the construction systems are summarized in Table 2.
Table 2.
Thermal properties of the enclosures that make up the building.
The windows are 1.20 meters wide by 1.00 meter high and are simple glazing with a clear glass of 3 mm. The thermal properties of this glass are a U-value of 3.835 W/m2K, a conductivity of 0.90 W/mK, a solar gain coefficient (SGHC) of 0.768, and a direct solar transmission (g-value) of 0.741.
Occupancy and energy use profiles were determined through a resident survey, a method widely used for its adaptability. The survey was divided into five parts considering [30]: (1) general characteristics of occupation and housing, (2) cooling mechanisms, (3) ventilation, (4) use of equipment, lighting, and appliances, and finally (5) the use of liquefied petroleum gas (LPG) for cooking. Table A1 in Appendix A shows in more detail the questions asked.
Although the survey was intended for all 34 residences, the response rate was 44%, equivalent to 15 houses. It is noteworthy that residents tend to use split air conditioning with temperatures between 16 °C and 25 °C. The ventilation schedules obtained per residence were applied to all areas except the bathroom and the portal, where 24/7 ventilation is considered. All respondents evidenced the use of fabric curtains for sun protection. In the gas section, it was obtained that cylinders of a capacity of 25 pounds and an average duration of one and a half months were used.
For residences that did not respond to the survey, a typical single-family occupancy of four inhabitants per dwelling was used [31]; for equipment usage profiles, standard schedules provided by DesignBuilder software for residential spaces were used. However, the use or not of air conditioning equipment was verified by on-site inspection, obtaining that 18 residences have this equipment. In addition, the use of energy by public lighting was evaluated, which consists of five high-pressure luminaires of 100 W each.
3.1. Thermo-Energy Evaluation by Parametric Analysis
The 3D model of EC was subjected to a parametric analysis in the DesignBuilder software, considering the data for March (the month with the highest temperatures according to climate data) to select adjustments in the design variables that allow a greater performance of the urbanization (temperature and schedule) of air conditioning use, orientation, and glass materials, walls, and roofs) and combine it with the results obtained when applying the bioclimatic methodology. The analysis evaluates multiple design options and their influence on the variables of interest, allowing for observation of the behavior of the different design combinations; in this way, the best options are detected and selected for subsequent application in RC.
The variables of interest selected for this study were electricity consumption by cooling (air conditioning) and hours of non-comfort with 80% acceptability (ASHRAE 55) [32]. Both temperature options and air conditioning usage schedules were selected based on survey results, while building materials were selected based on local market layout [33]. The design variables with the selected options to be evaluated are shown in Table 3.
Table 3.
Variables of interest, design variables, and options evaluated in the parametric study.
3.2. Systematization of Bioclimatic Methodology
Based on EC, the first re-design proposal for the building and its distribution (RC) considers a bioclimatic methodology and the application of the results obtained through a parametric analysis. Figure 5 presents the systematization of bioclimatic design. The input data and variables are visualized for each of the steps in the analysis: start, site location, climate analysis, sunlight analysis, wind analysis, façade analysis, bioclimatic strategy analysis, shading calculation, and design verification in terms of comfort and completion of the process. For the analysis, meteorological data provided by Solargis© (temperature, relative humidity (RH), radiation, wind, and precipitation) were used for the area specified in Figure 4.
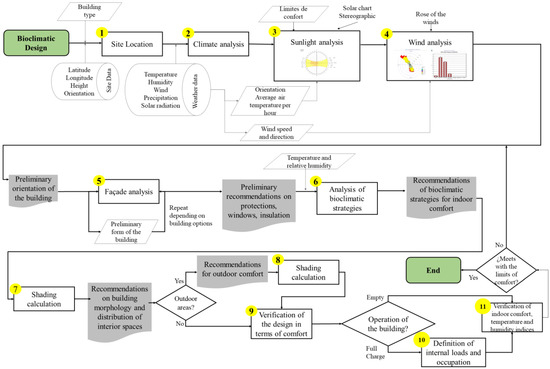
Figure 5.
Flowchart of bioclimatic methodology. Own elaboration.
Step 1. Site Location (Figure 4)
- Type: Residential
- Geographical coordinates: 7°58′51′′ N 80°26′31′′ W
- Height: 20 mbsl
- Orientation: 20°
Step 2. Climate analysis
- Minimum annual temperature: 20.6 °C
- Average annual temperature: 27.2 °C
- Maximum annual temperature: 35.6°C
- Minimum annual RH: 33%
- Average annual RH: 78%
- Maximum annual RH: 100%
- Average annual wind speed: 2.5 m/s
- Annual rainfall: 580 kg/m2
- Average annual global radiation: 4.96 kWh/m2day
Step 3. Sunlight analysis
- For Panama, the Sustainable Construction Guide for Energy Saving in Buildings suggests thermal comfort temperatures be obtained through the Szokolay equation [34]. The thermal comfort range is set from 23.5 °C to 28.5 °C. This range is represented in yellow on the sun chart. Temperatures below 23.5 °C are shown in light blue (cold), while temperatures above 28.5 °C are represented in orange (heat).
Step 4. Wind analysis
- WRPLOT ViewTM software [35] was used to produce the wind rose and a frequency distribution graph. The prevailing wind direction is north, with speeds greater than 11.10 m/s, and the most frequent speed range (37.6%) is 0.50 m/s to 2.10 m/s.
Step 5. Façade analysis
- Figure 6 represents the analysis of sunlight for the first months of the year (January to June). The solid lines represent the façades of the lot (A: 110°, B: 20°, C: 60°, D: 150° and E: 20°), and the dashed lines the azimuth for each of the façades (A’: 20°, B’: 110°, C’: 150°, D’: 240° and E’: 290°) and correspond to the angles formed by the horizontal projection of the solar ray in relation to the north. The season from July to December is also considered for the observations and recommendations.


Figure 6.
Façades (solid lines) and azimuth (dashed lines) of the lot represented in the solar chart for January to June: (a) Façade A, (b) Façade B, (c) Façade C, (d) Façade D, and (e) Façade E.


From the evaluation of the solar chart and the wind rose, the following recommendations for the lot’s façade are concluded: On façade A’, it is suggested to place windows to take advantage of ventilation and natural light in the morning hours. Use sun protection such as curtains and eaves. On façade B’, use windows to take advantage of natural light. On façade C’, it is convenient to use windows with eaves. It is not suitable to use windows on façade D’ and use thermal insulation on the walls. Finally, it is recommended to place windows on façade E’ if sun protection and thermal insulation are used on walls and glass.
Step 6. Analysis of bioclimatic strategies
- Climate Consultant 6.0 software [36] was used to help users design more efficient buildings. The Givoni Psychrometric chart was extracted from this software, which calculates the best strategies based on the annual comfort hours that can be added to the design. The Bioclimarq 2016 spreadsheet developed by Gómez-Azpeitia was also used [37]. The input data of the spreadsheet were the location of the site, climate data (maximum, minimum, and average monthly and hourly temperatures and humidities, precipitation, radiation, and wind speed), the clothing habits of the inhabitants (very light, light, moderate, warm, and very warm), and the use of natural ventilation and artificial air conditioning. This tool extracted Olgyay’s bioclimatic chart, Mahoney’s recommendations, and Serra and Coch’s skin form and treatment indicators.
- Givoni’s chart proposes building design measures as a function of temperatures and humidity. The results indicate that the buildings under the climatic conditions studied only achieve 14 hours of comfort per year. To increase comfort hours, the software suggests using window sun protection (an additional 2379 h), dehumidification (an additional 3178 h), and cooling and dehumidification (an additional 5566 h). The set of strategies extracted is shown in Figure 7.
Step 7. Shading calculation
- Due to the results of the previous analysis in the solar chart and façades, the use of eaves on the south and west façades is considered for the redesign proposal RC. The calculation of the dimensions of the eaves was carried out considering an angle of solar height alpha (α) of 45° for both façades. Therefore, for the south façade, solar protection is achieved from 09:30 to 15:30, and for the west façade from 12:00 to 15:00 at the summer solstice and until 14:30 in the winter solstice. The dimensions of the eaves were calculated with the tangent trigonometric function, having as input data the alpha angle (α) and the dimensions of the windows. The windows have lengths of 0.75 m and 1.00 m, so when calculating the size of the eaves with an angle of 45°, results of 0.75 m and 1.00 m are obtained.

Figure 7.
Recommended bioclimatic strategies: (a) Windows with operable overhangs or sunshades, (b) Minimization or elimination of glazing on west-facing façades, (c) High-performance glazing (insulated frames and low emissivity), (d) Use of plants and trees in the west orientation to minimize heat gain, (e) Orient most glazing to the north (using vertical fins) (f) Elevating the building above the ground to minimize humidity and maximize natural ventilation under the floor and roof with openings for ventilation (g) Shaded windows facing the prevailing breeze to promote natural ventilation, (h) Use of materials with light colors and ceilings with high emissivity (i) Increase in thermostat setting temperature.

3.2.1. Recommendations on Building Morphology
In order to select the shape of the building, the dimensions and characteristics of EC were first taken as the initial value. The indicators and coefficients of Serra and Coch were calculated from this; the adjustment of the shape and dimensions was iterated until an acceptable compactness value was reached to be considered in the proposed building for RC. Due to the high compactness of the EC buildings and the ventilation needs indicated, it was decided to iterate the compactness coefficient for the climatic incidence of this factor. Higher compactness leads to lower possibilities for radiation capture and energy loss but also complicates ventilation [38]. The results are shown in Table 4 and Table 5 below:
Table 4.
Main differences between the indicators of buildings EC and RC.
Table 5.
Results obtained from the Serra and Coch coefficients for the EC and RC building.
3.2.2. Recommendations of Bioclimatic Strategies for Outdoor Comfort
The data distribution in the Olgyay diagram was analyzed using the Bioclimarq spreadsheet, in which different zones are distinguished: comfort, need for solar radiation, need for ventilation, need for humidification, and need for shading. The behavior of the temperatures and humidity of the study site indicates that it is necessary to favor shading and natural ventilation with winds of 0.5 m/s to 2.5 m/s in outdoor areas, considering the presence of free areas in the redesign.
3.3. Inclusion of Energy Generation Solutions
The reduced energy needs of buildings must be met with on-site renewable energy to achieve nearly zero energy targets. Once the proposed urbanization is obtained, the generation of electricity is evaluated. The use of PV technology was chosen for the following reasons: (1) The literature showed that using PV panels is the most widely employed energy solution to achieve zero or nearly zero energy objectives in residential buildings. (2) In Panama, there is a higher solar potential than wind in most countries [39]; the average radiation of the site is 4.96 kWh/m2day. (3) Simplicity and precision in energy modeling in available tools and in future applications when studies are carried out at a constructive scale. In addition, this technology’s availability in the local market facilitates its application.
DesignBuilder software allows the modeling of PV panels, considering the effect of shadows, reflections of solar radiation, and the type of performance. The analysis considered using BAPV in roofs and BIPV in the most exposed glazing.
3.4. Nearly Zero Energy District and Energy Balance
Case studies with zero energy targets require the definition of a boundary, determined by building systems, energy needs, the energy produced, system losses, and energy delivered and exported, as shown in the diagram in Figure 8. The dashed lines represent energy transfer within the boundary, and solid lines represent energy transfer in and out [40]. Another approach to establishing site boundaries is the definition of “district.” From the description given in [41], it is established that a “district” refers to an urban block. For the present study, a district is an interrelated system that includes buildings, residents, streets, sidewalks, and vegetation in its parameters.
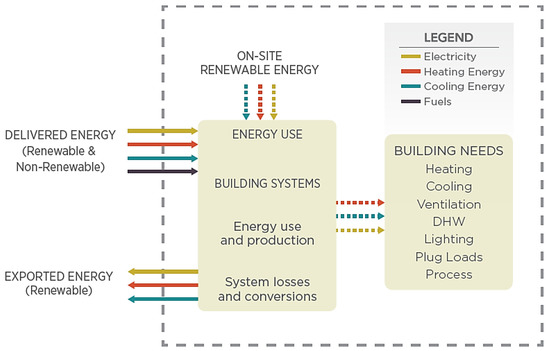
Figure 8.
On-site energy transfer limit for zero energy balance [40]. Note: “The dashed lines represent energy transfer within the boundary, and the solid lines represent energy transfer entering/leaving the boundary used for zero energy accounting.”
The indicator to be used for site classification is primary energy, which refers to the energy contained in natural materials or processes that have not undergone any transformation [40,42]. The conversion factors to obtain the values in terms of primary energy are obtained from ASHRAE 105 presented in Table 6, for each type of energy.
Table 6.
Factors for conversion to primary energy. Data obtained from ASHRAE 105 [43].
The energy balance (EB) is calculated from the energy delivered to the building (consumed) and exported (generated) for each type of energy source [40,44]. This indicator summarizes all power supplied and exported in a single value using Equation (1):
where Edel,i is the energy delivered to the site by energy type “i” in kWh/m2y; Eexp,i is the energy exported from the site by energy type “i” in kWh/m2y; fdel,i is the factor to convert to primary energy the energy delivered for the type of energy “i”; fexp,i is the factor to convert to primary energy the energy exported for the type of energy “I”; and Anet is the net area used in m2.
4. Results
4.1. Results of Parametric Analysis and Bioclimatic Methodology
Among the most relevant parametric analysis results, the optimal glazing option was Dbl Bronze (emissivity = 0.1) Clr 3 mm/6 mm air. The performance of air conditioning consumption with respect to walls and roofs was better when using super-insulated blocks/bricks and roofs with high thermal mass. However, contrary results were observed regarding the hours of non-comfort since it indicates that the best option is to use the original wall and super-insulated ceiling. The best-performing schedule turned out to be 18:00 to 9:00 only on weekdays at 23 °C. From this parametric study, a sensitivity analysis was performed. For electricity consumption for cooling, it was obtained that the buildings are more sensitive to the schedules of use compared to the selected temperature point and that, in the same way, it responds less to the types of glass and more to the orientation in which they are placed. Likewise, the results indicate that buildings have greater sensitivity to the types of walls than to the roofs and that even for the original roof, clay roofs (25 mm), and uninsulated roofs with intermediate and high thermal mass, there is no change in electricity consumption for all types of walls evaluated; the same behavior was obtained for the hours of non-comfort. In addition, for hours of non-comfort, the type of glazing and orientation were evaluated, but no relevance was found for either of these two variables.
Regarding the bioclimatic methodology, following Mahoney’s recommendations and calculations made on the indicators and coefficients of Serra and Coch, the shape of the proposed building in RC was defined. It has an extended spatial and volumetric configuration, low compactness (acceptable), and low slenderness. Figure 9a shows the design of the proposed building through a rendered image. The proposed residential building consists of two floors: the first occupies three times the dimensions of the original building, while the second floor is made up of a closed surface identical to the original building and an open surface (balcony). In this way, an acceptable compactness coefficient is met, thus obtaining more natural ventilation possibilities and ease of heat dissipation. In addition, this configuration provides self-shading, which is usable in hot climates. The new building covers an area of 495 m2, indicating that implementing these bioclimatic techniques demands greater use of land and construction materials.
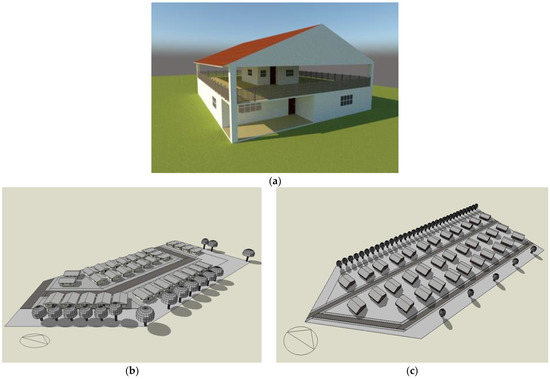
Figure 9.
(a) Shape of the proposed building in SketchUp, (b) 3D model of the EC urbanization, and (c) 3D model of the RC urbanization in DesignBuilder software.
The distribution of the windows is similar to that of the individual building, but most of the glazing was oriented with the prevailing wind direction (north) and minimized on the façades on the west side, thus maximizing the use of morning daylight and natural ventilation. Eaves were placed on the south- and west-facing windows. The new distribution of the 34 houses implied a greater need for land. A similar form of the land was considered, but with an extension of 10.2 hectares. All houses have a north–south orientation, an elongated east–west axis divided into three rows, and a separation of the houses of between 10 and 16 meters. A greater distance between the houses facilitates some passive design measures, such as natural ventilation and usable solar gain. The presence of trees on the west side was considered to minimize heat gains.
Because the bioclimatic methodology does not contemplate the specification of the materials to be used, these were selected from the parametric analysis, improving interior comfort conditions and electricity consumption. In addition, Dbl Bronze (emissivity = 0.1) Clr 3 mm/6 mm air with a U-value = 2.47 W/m2K and super-insulated brick/block walls with U-value = 0.156 W/m2K were chosen. Three-dimensional models and dynamic simulation were performed in DesignBuilder software for EC and RC. Figure 9b,c illustrate the axonometric view of both scenarios.
4.2. Verification of Thermal Comfort and Energy Consumption
As a final step of the bioclimatic methodology, the design’s thermal performance and the energy consumption results at the urbanization level were verified.
4.2.1. Thermal Comfort
Figure 10 shows the average air temperature (AT), radiant temperature (RT), and operating temperature (OT) results inside the building for EC and RC. In general, temperatures are highest in March and April and lowest in November. For EC, OT ranges between 26.2 °C and 27.2 °C, presenting an annual average of 26.7 °C, while, for RC at full load, average operating temperatures of 23.2 °C were obtained. In this case, the internal load and occupancy of the individual building are the same applied to the existing urbanization, without considering the air conditioning equipment (natural ventilation).
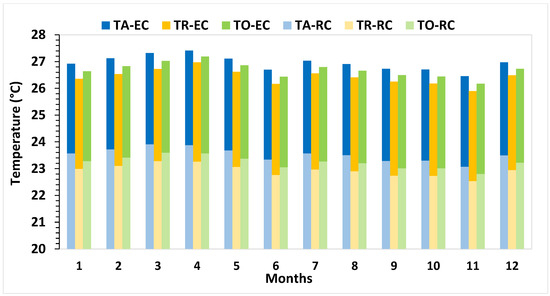
Figure 10.
Monthly air temperature (AT), radiant temperature (RT), and operating temperature (OT) results for EC and RC.
Compared to EC, the RC obtained lower temperatures in all months, with an average reduction of 3.2 °C OT and reaching within the acceptable ranges for the site and even below (23.5 °C to 28.5 °C).
Other comfort indicators were also verified (Figure 11): percentage of relative humidity (%RH), predicted percentage of dissatisfaction (%PPD), and the value of predicted mean vote (PMV). %RH increased compared to EC (average from 86% to 94.6%). The %PPD also increased, reaching 66.4%, well above the value recommended by ASHRAE 55 (10%). On the other hand, PMV decreases, remaining in ranges between −1.10 and 0.14; that is, between slightly cool and neutral, according to the ASHRAE 55 wind chill scale between +3 and −3, although it is not recommended to use the PMV for non-mechanically conditioned areas.
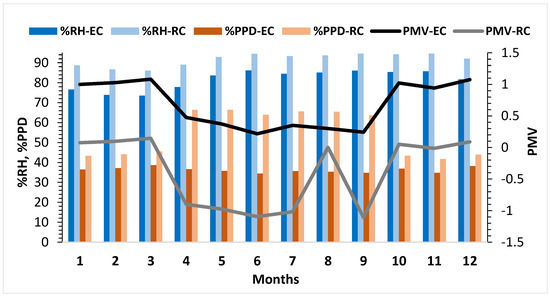
Figure 11.
Relative humidity (%RH) predicted percentage of dissatisfied (%PPD) and predicted mean vote (PMV) monthly averages for EC and RC.
In summary, with the application of the selected strategies, a significant decrease in indoor temperatures and the reach of more favorable ranges of the PMV is achieved without mechanical air conditioning. Still, a high percentage of dissatisfaction and extremely high humidity is reflected, which must be improved.
Consequently, the buildings (per floor) were reviewed individually to verify the thermal comfort of each house, given that the results presented above are monthly averages in the urbanization. With this, it was found that 10 residences (which are located on the east façade of the lot) exceeded the maximum temperature limit within the comfort zone between 0.8 °C and 1.30 °C above, considering the adaptive model of Auliciems and Szokolay, in natural ventilation. Given this, we sought to compare the thermal performance (average temperature and monthly hours of non-comfort) of the areas found using three types of walls: super-insulation, project wall, and brick/block wall without insulation, because the literature indicates that it is counterproductive to use super-insulation in a tropical climate. It was found that the super-insulated brick/block wall maintains higher temperatures on the upper floors of each residence, and the original wall produces better thermal performance in these areas. However, the super-insulated brick/block wall on the ground floors produces slightly lower temperatures. For all three cases, all zones remain above 29.1 °C. Additionally, the hours of non-comfort in these three types of walls were compared, concluding that regardless of the type of wall, the residences present similar hours of non-comfort. These results lead to the need for a deeper analysis, carried out by area of the building or daily, to know the critical points and hours for comfort. In addition, it provides evidence that the use of the super-insulated wall is not the main cause of non-comfort in the buildings evaluated.
4.2.2. Energy Consumption
The electrical requirements for EC and RC equipment and luminaires were defined from the surveys. For EC, the energy requirements for the use of air conditioning for cooling were also defined from the surveys; however, for RC, the 10 houses with temperatures above 28.5 °C were evaluated and configuration of the air conditioning was carried out, taking as reference the results obtained in the parametric analysis as an active solution. Figure 12 shows the consumption of both scenarios broken down by month. EC resulted in a consumption of 92.0 MWh/y at the urbanization level, considering the use of equipment, air conditioning, and luminaires. The highest demand is represented by equipment (EQ-ER) with a value of 52.3 MWh/y, followed using electricity by air conditioning with 35.3 MWh/y (AC-EC), and luminaires consume 4.41 MWh/y (LF-EC). In percentage, these data represent 56.8%, 38.3%, and 4.80% of total consumption, respectively, which is close to the data of the survey of the final use of electrical energy in households presented in PEN 2015-2050 [2]. For equipment (EQ-RC) and lighting (LF-RC), similar consumptions to those of existing urbanization were obtained, both in natural ventilation and with mechanical cooling, as expected. The consumption for cooling equipment evaluating only the 10 houses outside the comfort zone increased compared to the existing urbanization, obtaining a total expenditure of 133 MWh/y.
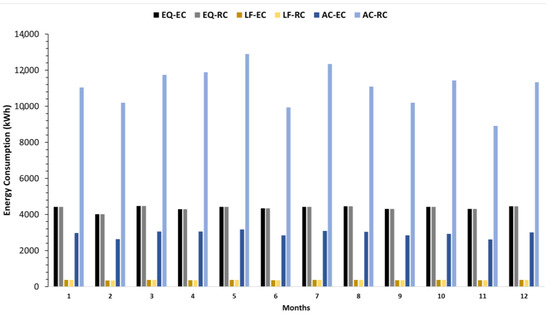
Figure 12.
Comparison of electrical consumption by equipment (EQ), lighting (LF) and air conditioning (AC) in kWh between EC and RC.
The increase in cooling consumption is due to the reduction in the compactness of the zones since the equipment must cool and dehumidify greater volumes of air. Considering the upper limit of comfort temperature by adding +3.5 for 80% acceptability, 29.7 °C is obtained. In this way, only the temperatures of the ground floors of C29 and C34 are above the maximum limit. Consequently, for this investigation, the operation of the urbanization was considered entirely in natural ventilation so that the total energy consumption of the urbanization would not contemplate the cost of cooling for the energy balance. In this way, the RC design has a total consumption of 58.9 MWh/y, which, compared to EC (94.2 MWh/y, including public lighting), is reduced by 37.5%. In addition, the annual expenditure for public lighting is considered, which is 2.19 MWh.
4.3. Evaluation of Energy Generation
For BAPV, the criteria used to determine the application of solar panels on the roof was based on the total area available on the south side of the gable roof (200 m2 with an inclination of 30°). Because economic factors are not considered in the analysis, the selection of the number of modules is based on the highest generation that can be obtained with an optimal orientation for Panama (southward in regions of the northern hemisphere) [45], implementing a total of 120 modules connected in series, in each residence, adding a total of 4080 modules (dimensions 1.96 m × 0.99 m) on site. The panel model was chosen based on the market availability of the region, as in [46]. The main technical specifications are listed below [46]: (1) active area: 1.68 m2; (2) maximum rated power: 320 W; (3) number of cells: 72; (4) cell type: polycrystalline silicon; and (5) panel efficiency: 15%. These and the other electrical specifications required for the simulation were configured in the software, as in [46].
For BIPV, glazing was selected for the application of integrated panels. For its configuration, the same composition of the glazing layers applied to the bioclimatic design was chosen, chosen through parametric analysis, but adding a layer corresponding to the photovoltaic panel associated with the outer layer of the glazing. The type of performance chosen was “simple”; as the name implies, it represents a simplified model. This type of performance provides direct access to the efficiency with which photovoltaic panels convert incident solar radiation into electricity, this being 15%, and does not require specific module arrays to be defined.
The configuration of the applied and integrated panels gave way to the energy simulation in DesignBuilder. The implementation of rooftop photovoltaic modules (T-PV) turned out to have a high-generation performance. The most favorable months for production were January and December, while June had the lowest production. An average production of 159.4 MWh/month and a total production of 1912.8 MWh/y were obtained. The panels integrated into the windows (W-BIPV) have a lower generation compared to BAPV, as expected for this study, due to the low amount of surface selected for integration. These produce an average of 4.23 MWh/month and have an almost constant production throughout the year (50.8 MWh/y). In addition, the individual production of each residence (I-PV + BIPV) was analyzed, and it was found that, with the application of both systems, the generation is 4.83 MWh/month per residence. These results are presented in Figure 13 below.
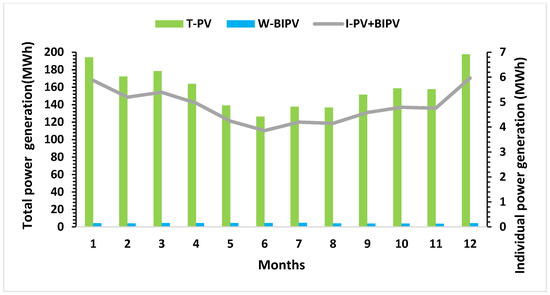
Figure 13.
Average monthly photovoltaic generation for rooftop solar panels (T-PV), for panels integrated in window glazing (W-BIPV), and for both systems per individual residence (I-PV+BIPV).
5. Discussion
The results obtained from the bioclimatic methodology and the parametric analysis were the determining factors for the redesign of the urbanization. The diagram in Figure 14 shows a flow chart of the main results obtained.
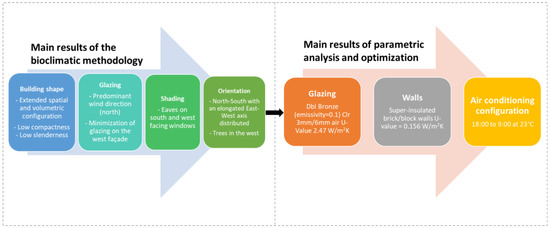
Figure 14.
Main results compiled from the bioclimatic methodology and the parametric and optimization analyses.
As can be seen, bioclimatic tools are useful for recommendations on building shape, orientation, and other aspects such as shading; however, they can be complemented with parametric and optimization analysis for specific solutions in terms of passive solutions (such as envelope materials) and active solutions (in the case of the study, air conditioning configuration). Although dynamic simulation is the most used method of analysis so far in zero energy studies, as supported in the literature review section, some limitations have been found for thermal analysis. A simulation per building zone is suggested to obtain more accurate results on comfort since the results presented were performed per floor. However, this would require more time and high-capacity computers to process the data. As a reference, a computer with 8.00 Gb RAM at 2.00 GHz frequency was used for the simulations in this study.
First ZED Reference Framework in Panama
This section discusses the main results for the definition of ZED in Panama as a first reference. Power supplied to a system refers to energy coming through the power grid, heating and cooling districts, and fuels [44]. Energy flows are analyzed for RC and are limited to the electrical energy demanded using occupants’ equipment and fuels (LPG). The energy needs for urbanization are summarized using electrical equipment, lighting, and cooking. The use of energy for building systems also considers the energy that is used for conversion in the systems. On the other hand, on-site renewable energy refers to the energy delivered by means of renewable technologies installed within system boundaries. The energy flows within the system are described below for the case study:
Electricity: Electricity energy needs have been calculated based on the simulation of the proposed RC model. The results indicate a consumption of 52.3 MWh/y for equipment, 6.6 MWh/y for lighting (including public lighting), and the demand for air conditioning equipment for cooling is considered null. Taking the methodology used in [47], the energy needs demanded by the refrigerator are not considered in the energy balance for renewable energy supply because it needs constant power from the network. According to the National Population and Housing Census for household electricity consumption in Panama, refrigerator represents 26%. This way, the consumption breakdown equals 13.6 MWh/y for the refrigerator and 38.7 MWh/y for other equipment.
Fuel: According to the survey of residents, dwellings use a 25-pound LPG cylinder with an average duration of 1.6 months, intended for use in kitchens. The PEN indicates that the average residential use of LPG is 1.26 cylinders/month. However, the consumption obtained through the survey will be considered in this study, equivalent to 0.625 cylinders/month. Considering the caloric value of LPG (45.67 GJ/kg), the conversion factor of energy units (3.6 GJ/MWh), and the mass of each cylinder (11.34 kg), one cylinder equals 143.86 kWh/month [2]. Therefore, 0.625 cylinders are equivalent to 89.9 kWh/month. However, the monthly energy demand will also depend on the efficiency ratio of LPG cookers and induction for domestic use, which is close to 0.47. With this, it is obtained that the consumption per residence is equivalent to 42.25 kWh/month, and for the urbanization the total consumption is 1436.5 kWh/month, equivalent to 17.2 MWh/y.
On-site renewable energy: With the production obtained by the PV panels on the roof of all the residences of the urbanization (1912.8 MWh/y) and the integration of photovoltaic glass in the windows (50.8 MWh/y) on the site, a total of 1963.6 MWh/y is produced. This amount of energy is considered in the energy balance as the input of energy generated from renewable sources on site.
Conversion to primary energy: The primary energy conversion values are documented in Table 6. A factor of 3.15 and 1.15 is considered for electricity delivered and LPG, respectively. For the renewable energy produced, a factor of 3.15 is also used. The normalized value in units of kWh/m2y is obtained by dividing the energy in terms of primary energy by the occupied area, which is 1870 m2 for the reference urbanization (34 buildings of 55 m2) and 16,830 m2 for the proposed urbanization (34 buildings of 495 m2).
Table 7 summarizes the disaggregated energy demand of the different needs and presents the respective normalized values in terms of primary energy for the EC and RC. The conversion of on-site PV generation for renewable energy production is not presented in this table but results in 367.50 kWh/m2y.
Table 7.
Conversion of energy consumption and generation values into primary energy terms.
Energy Balance: The energy balance is obtained from the subtraction of the energy delivered minus the energy generated. From Equation (1), a result of −356.50 kWh/m2y is obtained. A negative balance indicates that generation is greater than energy demand. According to the results obtained, Figure 15 graphically represents the values for the models of the case study. Three regions characterize the graph: the nZED region when the energy demanded is greater than the energy supplied, the NZED region when the energy demanded equals that supplied, and the PED region when the energy demanded is less than the energy supplied. In summary, EC resulted in energy consumption of 181.19 kWh/m2y (red diamond), including LPG demand. After applying passive and active strategies, RC has a reduced energy requirement of 13.52 kWh/m2y by not using air conditioning equipment (yellow triangle). Finally, with the application of PV panels, the energy balance (EB) reaches a value of 356.50 kWh/m2y (green square), which indicates that the energy supplied exceeds the demand, defining urbanization within the ranges of positive net energy.
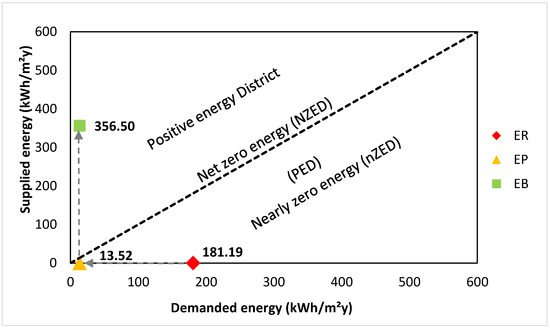
Figure 15.
Graphical representation of ZED values for case study models in terms of primary energy, adapted from [48].
Figure 16 represents the system boundaries for the case study. Solid lines represent the incoming or outgoing energy of the system, and the dashed lines represent the energy transferred within the system. The energy delivered corresponds to the LPG (2.50) and the electricity through the network, in this case, the demand for the refrigerator (2.55). Of the photovoltaic generation (367.50), the demand for equipment (without considering the refrigerator) and luminaires (8.48) is used in the building. The demand for electricity in the building is 11.03 and a total of 12.20. With this numerical analysis, it is obtained that 359.02 can be exported, corresponding to the subtraction of the photovoltaic generation minus the total use of energy by equipment and luminaires.
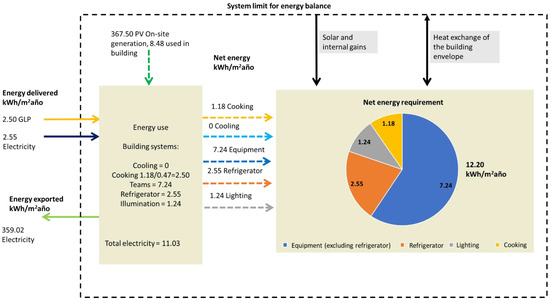
Figure 16.
System limit for energy balance (in terms of primary energy), adapted from [40].
One of the research objectives was to define the range of primary energy to consider urbanizations as almost zero energy. It was intended to obtain an nZED definition threshold, improving energy efficiency in buildings. Including in the study the use of energy for cooling, kitchens, lighting, and equipment, great potential is shown to achieve urbanizations at almost zero energy and even net positive energy. It should be noted that the reduction of the energy demanded is based solely on consumption by air conditioning and not on equipment and lighting due to the consideration of equipment that meets the efficiency required in the region. The numerical analysis performed indicates positive net energy results; that is, you can have ambitions in Panama to develop urbanizations that export energy to the grid or nearby buildings. Without photovoltaic generation, the reference urbanization has an expenditure of 181.19 kWh/m2y, very close to the maximum range presented at the threshold at almost zero energy (20 kWh/m2y to 180 kWh/m2y) for a single building [49]. With the independence of air conditioning, the RC achieves a range of 13.52 kWh/m2y, which is relatively low, even lower than the minimum range for residential buildings, which could indicate as a preliminary conclusion that an nZED range of 14 kWh/m2y to 180 kWh/m2y is acceptable for Panama, given the low energy requirements of homes when there is no need for mechanical cooling. However, it should be considered that this value is normalized with the total surface of the residences, which may be one of the limitations to reaching more real and achievable conclusions with fewer resources since the RC, presenting a reduced compactness value, requires a greater need for land. With the increase in surface area per building, the inclusion of more equipment per household or changes in the number and behavior of the occupants was not considered since the original conditions were maintained.
6. Conclusions
This study takes as a reference an existing residential development to apply a bioclimatic methodology and parametric analysis to evaluate the reduction in energy consumption through dynamic simulations. The scope of this work consisted of assessing the potential of the site to be defined under near-zero energy limits in the context of Panama and, at the same time, documenting and systematizing the passive and active solutions applied to obtain a reference plan for the development of future research and full-scale applications in a developing country such as Panama or with similar climatic conditions.
The application of bioclimatic tools is promising with respect to achieving the objectives and combined with dynamic simulation; guidelines on materials and configurations for active strategies can be obtained. For the case study, energy savings of 37.5% were achieved. On the other hand, the application of photovoltaic modules on the roof and glazing was sufficient to cover and exceed the on-site energy demand; however, the integration in glazing was not significant in terms of performance for the type of buildings studied.
Through the energy balance performed, it is obtained that the development can reach positive net energy ranges (356.50 kWh/m2y); i.e., energy could be exported to the grid. The results show that the initiative to apply regulations and standards of this type is feasible under the climatic conditions of Panama and that they can be oriented towards a smart city market.
Among the limitations presented in this study are accurate knowledge and data set up on the software regarding occupancy and energy use profiles, as such information is subjected to the occupants’ behavior and comfort demand. Likewise, the bioclimatic methodology leaves the choice of materials with a significant degree of ambiguity. This limitation was overcome by using parametric analysis.
It is recommended for future studies to consider economic factors in construction materials, land requirements, and generation technologies to have a cost–benefit relationship, since the site has the potential to achieve its objectives. On the other hand, future work could raise awareness of the effect of form indicators on design and implement other options or active low-energy solutions to improve comfort conditions. This could be used to define, for example, a percentage or fraction limit for photovoltaic generation.
Author Contributions
Original concept, formal analysis, and editing by L.D.L., D.M., C.C. and M.C.A. Introduction, figures and writing of most of the manuscript by L.D.L. and D.M. Supervision and funding by M.C.A., C.C. and N.A. All authors have read and agreed to the published version of the manuscript.
Funding
This research was funded by the Panamanian Institution Secretaría Nacional de Ciencia, Tecnología e Innovación SENACYT (https://www.senacyt.gob.pa/, accessed on 25 December 2022), under the project code FID18-056 and IDDS22-30, as well as supported by the Sistema Nacional de Investigación (SNI).
Data Availability Statement
Data supporting the findings is available upon request.
Acknowledgments
The authors would like to thank the Technological University of Panama and the Faculty of Mechanical Engineering (https://fim.utp.ac.pa/, accessed on 25 December 2022) for their collaboration, together with the Research Group ECEB (https://eceb.utp.ac.pa/, accessed on 25 December 2022). Besides, a special thanks to the Department of Mechanical, Energy and Management Engineering (DIMEG, https://www2.unical.it/portale/strutture/dipartimenti_240/dimeg/, accessed on December 2022), University of Calabria (UNICAL, https://www2.unical.it/portale/, accessed on 25 December 2022).
Conflicts of Interest
The funders had no role in the design of the study; in the collection, analyses, or interpretation of data; in the writing of the manuscript, or in the decision to publish the results.
Nomenclature
| ASHRAE | American Society of Heating, Refrigerating and Air-Conditioning Engineers |
| AT | Air temperature |
| BAPV | Building applied photovoltaics |
| BIPV | Building integrated photovoltaics |
| EB | Energy balance |
| EC | Existing Case |
| EPBD | Energy Performance of Buildings Directive |
| GBC | Green Building Council |
| IEA-EBC | Energy in Buildings and Communities Program of the International Energy Agency |
| I-PV + BIPV | Individual power generation per house |
| HVAC | Heating, ventilation, and air conditioning |
| LED | Light-emitting diode |
| LEED | Leadership in Energy & Environmental Design |
| LPG | Liquefied petroleum gas |
| nZEB | Nearly zero energy building |
| NZEB | Net zero energy building |
| nZED | Nearly zero energy district |
| NZED | Net zero energy district |
| nZES | Near-zero energy Project Building in the settlement |
| OP | Operating temperature |
| PED | Positive energy district |
| PEN | National Energy Plan |
| PMV | Predicted mean vote |
| %PPD | Predicted percentage of dissatisfied |
| PV | Photovoltaic |
| PVC | Polyvinyl chloride |
| RES | Sustainable Buildings Regulation |
| RC | Redesign Case |
| %RH | Relative humidity |
| RT | Radiant temperature |
| SDG | Sustainable Development Goal |
| SHC | Solar Heating and Cooling Program |
| SGHC | Solar gain coefficient |
| T-PV | Rooftop photovoltaic modules |
| U-value | Thermal transmittance values |
| W-BIPV | Photvoltaic integrated to the windows |
| ZEB | Zero Energy Building |
| ZED | Zero Energy District |
Appendix A
Table A1.
Survey questions applied to housing residents.
References
- Parra Cortes, R. The 2030 Agenda and its Sustainable Development Goals: Background and perspectives to promote sustainable consumption and production in Chile. Environ. Law Mag. 2018, 10, 99–121. [Google Scholar] [CrossRef]
- Secretaría Nacional de Energía. Plan Energético Nacional (PEN) 2015–2050 Panamá El Futuro Que Queremos; Secretaría Nacional de Energía: No. 28003. 2016, pp. 6–348. Available online: http://www.energia.gob.pa/energia/wp-content/uploads/sites/2/2017/06/Plan-Energetico-Nacional-2015-2050.pdf (accessed on 15 December 2022). (In Spanish).
- Junta Técnica de Ingeniería y Arquitectura. Reglamento de Edificaciones Sostenibles (RES); Gobierno de Panamá: Panama City, Panama, 2019. (In Spanish) [Google Scholar]
- Gaceta Oficial. Ley No. 69 del 12 de Octubre de 2012; No. 27145; Gobierno de Panamá: Panama City, Panama, 2012; pp. 1–44. (In Spanish) [Google Scholar]
- European Commission. Guidelines for the Promotion of Nearly Zero-Energy Buildings and Best Practices to Ensure That-Commision Recommendation (EU) 2016/1318. Official Journal of the European Union. 2016. Available online: http://data.europa.eu/eli/reco/2016/1318/oj (accessed on 23 November 2022).
- Piderit, M.B.; Vivanco, F.; van Moeseke, G.; Attia, S. Net zero buildings. A framework for an integrated policy in Chile. Sustainability 2019, 11, 1494. [Google Scholar] [CrossRef]
- Amaral, A.R.; Rodrigues, E.; Gaspar, A.R.; Gomes, Á. Review on performance aspects of nearly zero-energy districts. Sustain. Cities Soc. 2018, 43, 406–420. [Google Scholar] [CrossRef]
- Marique, A.-F.; Reiter, S. A simplified framework to assess the feasibility of zero-energy at the neighbourhood/community scale. Energy Build. 2014, 82, 114–122. [Google Scholar] [CrossRef]
- Green Building Council. LEED for Cities and Communities|U.S. Green Building Council. Available online: https://www.usgbc.org/leed/rating-systems/leed-for-cities (accessed on 6 March 2022).
- International Energy Agency Energy in Buildings and Communities (IEA EBC) Programme. Towards Net Zero Energy Solar Buildings IEA EBC. Available online: https://www.iea-ebc.org/projects/project?AnnexID=52 (accessed on 14 March 2022).
- Athienitis, A.K.; O’Brien, W. Modeling, Design and Optimization of Net-Zero Energy Buildings; Ernst & Sohn: Berlin, Germany, 2019; Volume 53, pp. 1689–1699. [Google Scholar] [CrossRef]
- IEA Energy in Buildings and Communities. Positive Energy Districts (PED). EBC ANEXO 83. 2021. Available online: https://jpi-urbaneurope.eu/ped (accessed on 20 December 2022).
- Baer, D.; Loewen, B.; Cheng, C.; Thomsen, J.; Wyckmans, A.; Temeljotov-Salaj, A.; Ahlers, D. Approaches to Social Innovation in Positive Energy Districts (PEDs)—A Comparison of Norwegian Projects. Sustainability 2021, 13, 7362. [Google Scholar] [CrossRef]
- Pless, S.; Polly, B. Communities of the Future: Accelerating Zero Energy District Master Planning Preprint; National Renewable Energy Lab: Golden, CO, USA, 2018. [Google Scholar]
- Polly, B.; Kutscher, C.; Macumber, D.; Schott, M. From Zero Energy Buildings to Zero Energy Districts. In Proceedings of the 2016 ACEEE Summer Study on Energy Efficiency in Buildings, Pacific Grove, CA, USA, 21–26 August 2016; pp. 1–16. Available online: https://www.researchgate.net/publication/307955877_From_Zero_Energy_Buildings_to_Zero_Energy_Districts/figures?lo=1 (accessed on 15 December 2022).
- Cabeza, L.F.; Chàfer, M. Technological options and strategies towards zero energy buildings contributing to climate change mitigation: A systematic review. Energy Build. 2020, 219, 110009. [Google Scholar] [CrossRef]
- Hoque, S.; Iqbal, N. Building to net zero in the developing world. Buildings 2015, 5, 56–68. [Google Scholar] [CrossRef]
- Stasi, R.; Liuzzi, S.; Paterno, S.; Ruggiero, F.; Stefanizzi, P.; Stragapede, A. Combining bioclimatic strategies with efficient HVAC plants to reach nearly-zero energy building goals in Mediterranean climate. Sustain. Cities Soc. 2020, 63, 102479. [Google Scholar] [CrossRef]
- Guillén-Lambea, S.; Rodríguez-Soria, B.; Marín, J.M. Comfort settings and energy demand for residential nZEB in warm climates. Appl. Energy 2017, 202, 471–486. [Google Scholar] [CrossRef]
- García-Fuentes, M.; González, I.; Gordaliza, A.; de Torre, C. Retrofitting of a Residential District under Near Zero Energy Buildings Criteria. Proceedings 2017, 1, 686. [Google Scholar] [CrossRef]
- Castaldo, V.L.; Pisello, A.L.; Piselli, C.; Fabiani, C.; Cotana, F.; Santamouris, M. How outdoor microclimate mitigation affects building thermal-energy performance: A new design-stage method for energy saving in residential near-zero energy settlements in Italy. Renew. Energy 2018, 127, 920–935. [Google Scholar] [CrossRef]
- Pinto, G.A.O.; Nova, D.A.S.; Calderón, N.C.B.; Plata, G.O. Energy considerations of social dwellings in Colombia accotding to NZEB concept. Dyna 2015, 82, 120–130. [Google Scholar] [CrossRef]
- Ordoñez, E.; Mora, D.; Gaudry, K. Roadmap Toward NZEBs in Quito. IOP Conf. Ser. Mater. Sci. Eng. 2019, 609, 072040. [Google Scholar] [CrossRef]
- Bambara, J.; Athienitis, A.K.; Eicker, U. Residential Densification for Positive Energy Districts. Front. Sustain. Cities 2021, 3, 1–16. [Google Scholar] [CrossRef]
- Aruta, G.; Ascione, F.; Bianco, N.; Mastellone, M.; Mauro, G.M. Optimization of Envelopes, Systems and Storage for Transition of Building Stocks to Zero Energy Districts. Chem. Eng. Trans. 2022, 94, 841–846. [Google Scholar] [CrossRef]
- Salim, F.D.; Dong, B.; Ouf, M.; Wang, Q.; Pigliautile, I.; Kang, X.; Hong, T.; Wu, W.; Liu, Y.; Rumi, S.K.; et al. Modelling urban-scale occupant behaviour, mobility, and energy in buildings: A survey. Build Env. 2020, 183, 106964. [Google Scholar] [CrossRef]
- Happle, G.; Fonseca, J.A.; Schlueter, A. A review on occupant behavior in urban building energy models. Energy Build. 2018, 174, 276–292. [Google Scholar] [CrossRef]
- van Eck, N.J.; Waltman, L. Manual for VOSviewer Version 1.6.18.0; Univeristeit Leiden: Leiden, The Netherlands, 2022; Available online: http://www.vosviewer.com/documentation/Manual_VOSviewer_1.6.1.pdf (accessed on 23 November 2022).
- DesignBuilder Software Ltd.-About Us. Available online: https://designbuilder.co.uk/about-us (accessed on 23 November 2022).
- Austin, M.C.; Arnedo, L.; Yuil, O.; Mora, D. Energy consumption influenced by occupant behavior: A study in residential buildings in Panama. In Proceedings of the LACCEI International Multi-Conference for Engineering, Education and Technology, Boca Raton, FL, USA, 19–23 July 2021; pp. 1–9. [Google Scholar] [CrossRef]
- Instituto Nacional de Estadística y Censo. Habitantes Promedio por Vivienda Particular en la República de Panamá, Según Provincia y Comarca Indígena; Instituto Nacional de Estadística y Censo: Panama City, Panama, 2010; (In Spanish).
- American Society of Heating, Refrigerating and Air-Conditioning Engineers. Standard ASHRAE 55. 2021. Available online: https://www.seiscubos.com/conocimiento/estandar-ashrae-55 (accessed on 20 December 2022).
- Araúz, J.; Mora, D.; Austin, M.C. Assessment of Different Envelope Configurations via Optimization Analysis and Thermal Performance Indicators: A Case Study in a Tropical Climate. Sustainability 2022, 14, 2013. [Google Scholar] [CrossRef]
- Secretaría Nacional de Energía. Guia de Construccion Sostenible Para el Ahorro de Energia en Edificaciones; Secretaría Nacional de Energía: Panama City, Panama, 2016; pp. 1–53. (In Spanish) [Google Scholar]
- Lakes Environmental. Lakes Environmental|WRPLOT View [Free]-Wind Rose Plots for Meteorological Data. 2018. Available online: https://www.weblakes.com/products/wrplot/index.html (accessed on 4 February 2022).
- Climate Consultant 6. 2016. Available online: http://www2.aud.ucla.edu/energy-design-tools/ (accessed on 4 February 2022).
- Gómez-Azpeitia, G. Bioclimarq 2016. 2016. [Google Scholar]
- Serra Florensa, R.; Coch Roura, H. Arquitectura y Energía Natural; Universitat Politècnica de Catalunya: Barcelona, Spain, 1995. [Google Scholar]
- International Renewable Energy Agency. Evaluación del Estado de Preparación de las Energías Renovables: Panamá; IRENA: Abu Dhabi, United Arab Emirates, 2018. (In Spanish) [Google Scholar]
- (DOE) US Department of Energy. A Common Definition for Zero Energy Buildings; U.S. Departament of Energy: Washington, DC, USA, 2015; p. 22.
- Koutra, S.; Pagnoule, C.; Galatoulas, N.-F.; Bagheri, A.; Waroux, T.; Becue, V.; Ioakimidis, C.S. The zero-energy idea in districts: Application of a methodological approach to a case study of epinlieu (Mons). Sustainability 2019, 11, 4814. [Google Scholar] [CrossRef]
- Medved, S.; Domjan, S.; Arkar, C. Sustainable Technologies for Nearly Zero Energy Buildings; Springer: Cham, Switzerland, 2019; ISBN 978-3-030-02821-3. [Google Scholar] [CrossRef]
- Emerson, K.I.; Conover, D.R.; Deru, M.P.; Heizer, M.P. ASHRAE Stand 105-2014; Standard methods of determining, expressing, and comparing building energy performance and greenhouse gas emissions. ASHRAE: Peachtree Corners, GA, USA.
- Kurnitski, J.; Allard, F.; Braham, D.; Goeders, G.; Heiselberg, P.; Jagemar, L.; Kosonen, R.; Lebrun, J.; Mazarella, L.; Railio, J.; et al. How to define nearly net zero energy buildings Nzeb. REHVA J. 2011, 48, 6–12. [Google Scholar]
- Asea Brown Boveri, S.A. Cuaderno de Aplicaciones Técnicas no. 10: Plantas Fotovoltaicas; ABB: Zúrich, Suiza, 2011; p. 116. Available online: https://library.e.abb.com/public/e703d99268365a43c125791f002ce826/1TXA007109G0701_CT10.pdf (accessed on 23 November 2022). (In Spanish)
- Chacón, L.; Austin, M.C.; Castaño, C. A Multiobjective Optimization Approach for Retrofitting Decision-Making towards Achieving Net-Zero Energy Districts: A Numerical Case Study in a Tropical Climate. Smart Cities 2022, 5, 405–432. [Google Scholar] [CrossRef]
- Austin, M.C.; Chung-Camargo, K.; Mora, D. Review of zero energy building concept-definition and developments in latin america: A framework definition for application in Panama. Energies 2021, 14, 5647. [Google Scholar] [CrossRef]
- Alonso, M.J.; Stene, J.; Ronneseth, O.; Georges, L. State of the Art Analysis of Nearly Zero Energy Buildings-Norway. Country Report IEA HPT Annex 49: Norway. 2013. 978-82-536-1584-4. Available online: http://www.zeb.no/index.php/reports/item/406-state-of-the-art-analysis-of-nearly-zero-energy-buildings-country-report-iea-hpp-annex-40-task-1-norway (accessed on 20 December 2022).
- Attia, S. Net Zero Energy Buildings (NZEB), Frameworks and Roadmap for Project Analysis and Implementation; Elsevier: Amsterdan, The Netherlands, 2018; ISBN 978-0-12-812461-1. [Google Scholar]


Disclaimer/Publisher’s Note: The statements, opinions and data contained in all publications are solely those of the individual author(s) and contributor(s) and not of MDPI and/or the editor(s). MDPI and/or the editor(s) disclaim responsibility for any injury to people or property resulting from any ideas, methods, instructions or products referred to in the content. |
© 2023 by the authors. Licensee MDPI, Basel, Switzerland. This article is an open access article distributed under the terms and conditions of the Creative Commons Attribution (CC BY) license (https://creativecommons.org/licenses/by/4.0/).