Article

Evaluating Earthquake Stability of Solar Module Soundproofing Structure by 3D Numerical Analysis

1
Environmental Assessment Group, Korea Environment Institute, 370 Sicheong-daero, Sejong-si 30147, Republic of Korea
2
Department of Geotechnical Engineering Research, Korea Institute of Civil Engineering and Building Technology, 283 Goyang-dearo, Ilsan-seogu, Goyang-si 10223, Republic of Korea
3
Department of Civil & Environmental Engineering, Gachon University, 1342 Seongnam-daero, Sujeong-gu, Seongnam-si 13120, Republic of Korea
*
Authors to whom correspondence should be addressed.
Buildings 2023, 13(12), 3075; https://doi.org/10.3390/buildings13123075
Submission received: 14 November 2023 / Revised: 7 December 2023 / Accepted: 7 December 2023 / Published: 10 December 2023
(This article belongs to the Section Building Energy, Physics, Environment, and Systems)

Abstract

:
In this study, dynamic numerical analysis was conducted on the existing sound barrier wall structure and the recently developed double-sided solar-module-integrated sound barrier wall structure using the finite-difference method for numerical modeling. A seismic safety evaluation was performed based on a series of numerical analysis results. Both structures were modeled using a 3D modeling technique with FLAC 3D to account for differences in lateral stiffness. For seismic considerations, the Pohang seismic wave was selected to represent short-period earthquakes in line with Korea’s seismic characteristics. Additionally, the Hachinohe seismic wave was chosen to simulate long-period earthquakes and consider the effects of the seismic period. To calculate the input seismic waves based on the ground response, a site response analysis was conducted for a site designated for demonstrating a double-sided solar module-integrated sound barrier wall structure in Korea. The analysis reveals that the existing structure maintains overall structural integrity and ensures the safety of solar modules even in an earthquake with a return period of 2400 years. However, for a solar module-integrated sound barrier wall structure, stresses exceeding the compressive strength of the solar module occur in earthquakes with a return period exceeding 1000 years, necessitating additional design and reinforcement for preparation.

1. Introduction

To align with the objectives of the Renewable Energy 2030 [1] initiative, the Green New Deal [2], and carbon neutrality goals, the need for renewable energy installations that leverage existing infrastructure rather than requiring new land is escalating. This increase is accompanied by a surge in research focused on augmenting energy output by enhancing existing structures like sound barriers. Sound barriers, particularly those designed to mitigate railway noise, have emerged as a promising research domain. These barriers offer advantages such as minimal interference from adjacent structures and sustained exposure to sunlight. In the Netherlands, the Solar Highways initiative, funded by the EU LIFE+ program, was conducted between 2014 and 2021. This project demonstrated the feasibility of a 450 m-long solar-integrated highway sound barrier. Furthermore, an initiative to integrate solar modules into a 4-km stretch of the A37 highway has been unveiled, under the umbrella of the “Renewable Energy Pilot Projects on State Land.” This project aims to deploy renewable energy solutions in government-owned structures and locations [3]. For the JR East Takasaki station platform in Japan, solar power installation and electricity production were already underway in 2001 and 2004 [4].
In South Korea, extensive research has been undertaken to engineer solar modules that both attenuate noise and are compatible with railway facilities [5]. Further, a standardized model for bifacial solar module-integrated sound barriers has been developed to achieve carbon neutrality and economic viability by retrofitting existing installations. However, these emerging bifacial solar module-integrated sound barriers present challenges in terms of their susceptibility to natural hazards like high winds and earthquakes. This vulnerability arises from the expansive surface area of the photovoltaic (PV) panels, which exhibit a lower stiffness than traditional sound barriers. As per guidelines from the Ministry of Land, Infrastructure, and Transport [6], there is a pressing need to attain a robust seismic performance and to formulate reinforcement and performance evaluation standards for railway infrastructures with high slenderness ratios, such as existing catenary and utility poles, which are not classified as major civil engineering structures. Moreover, the Korea National Railway’s design standards for mainline and safety facilities [7] explicitly state the imperative to ensure the seismic resilience of railway sound barrier walls. Consequently, the focus on seismic performance and acoustic effectiveness of sound barrier walls is intensifying.
Few systematic studies, however, have been conducted on the seismic performance of sound barrier wall structures. Studies on the analysis of the dynamic behavior of sound barrier wall structures and the evaluation of their seismic performance based on dynamic analysis are highly insufficient. Sound-barrier-related studies are primarily focused on the noise-blocking capability based on the wave characteristics of noise, as well as the material and design characteristics of sound barrier wall structures [8,9,10,11,12,13]. Even if the scope is extended to research related to the stability of sound barriers, the related studies are insignificant. The Colorado Department of Transportation (CDOT) analyzed the behavior of the sound barriers and traffic signs supported by drilled shafts against the lateral loads caused by the wind to enable more efficient foundation design [14]. In this research, existing analysis methods for both capacity estimates and load-deflection predictions of drilled shafts supporting sound barrier walls, signs, and signals, and typical soil and rock formations in Colorado are presented in a comprehensive manner. And the accuracy of selected design methods for the lateral and torsional responses of drilled shafts was evaluated by comparing predictions from these methods with the measured “true” capacity and deflections from lateral and torsional load tests reported in the literature, performed in Ohio, and two new lateral load tests performed in this study as a part of the CDOT construction project along I-225 where noise barriers walls were constructed. However, this study was limited to a foundation design approach based on wind load resistance and did not include an analysis of behavior under seismic loading. Kim and Jung [15] evaluated the performance of soundproofing walls based on the strong wind fragility by means of numerical analysis, and the strong wind fragility was determined by considering the influence factors of the wind exposure category, soundproof wall’s installation position, and shape of the aluminum frame section. This study also analyzed the behavior of soundproof walls against lateral loads using numerical analysis techniques but was limited to the behavior against wind loads.
Ali et al. [16] proposed a machine-learning framework to evaluate and classify the seismic stability of the sound barrier wall structures designed against wind loads. They, however, offered a machine-learning framework rather than specific behavior evaluation based on actual structure modeling, and it is difficult to predict the seismic behavior of facilities that have different structural characteristics from existing sound barriers, such as solar-module-integrated sound barriers.
Although few studies have been conducted on the seismic stability of sound barriers, there is no study on the seismic safety of newly developed double-sided solar-module-integrated sound barriers, even though they are new structures. Therefore, research needs to be conducted on their safety before demonstration site installation.
The seismic stability of structures is evaluated mainly using experimental and analytical approaches. For the practical approach, it is challenging to simulate earthquakes at actual sites. The shaking table test and centrifugal model test to overcome this shortcoming have limitations regarding the procedural and temporal aspects of model tests. The analytical approach, conversely, can derive results relatively conveniently when the specifications of the target structure are clear. It can also efficiently analyze parameters for various cases. In particular, the combination of numerical analysis techniques, seismic vulnerability, and material strength calculation techniques makes it possible to intuitively evaluate the seismic risk level of the target facility under certain conditions. Tursunkululy et al. [17] studied the frequencies and vibration modes of a vertical steel tank with a variable wall thickness in the ANSYS software suite using a finite-element model of vibrations of a tank with a volume of 3000 m3 for oil and petroleum products, hardened by a prestressed winding. Also, Tursunkululy et al. [18] proposed the effect of a plain composite wrapping on the stress–strain state of the wall of a steel cylindrical tank without taking into account the liquid. The stress assessment in the tank wall was carried out based on finite-element modeling of the structure’s three-dimensional model deformation. In these studies, a numerical analysis technique based on the finite-element method was applied to analyze the dynamic behavior and deformation of the structure, but it is different from the analysis of the seismic behavior of a soundproof wall structure installed on the ground.
Kwon et al. [19] conducted seismic analysis of underground railway station facilities under various conditions by applying two-dimensional (2D) finite-element analysis and performed earthquake risk assessment based on the results and vulnerability function. Yoo et al. [20] conducted seismic analysis of deep underground structures with various depths, fixed ends, and ground conditions using the same approach. They presented the seismic risk level according to the soft ground depth and the return period of input seismic waves through earthquake risk assessment. Kwon and Yoo [21] conducted seismic analysis of the vertical shaft of the tunnel facility installed in the liquefiable ground through three-dimensional (3D) finite-difference analysis. They presented the seismic risk level based on the length of the vertical shaft (tunnel depth), the thickness of the soft ground, and the return period of the input earthquake. Ji et al. [22] conducted an assessment of the potential risk of liquefaction caused by the Pohang earthquake, Yun and Han [23] analyzed the seismic dynamic behavior of a pier supported by piles, and Nguyen et al. [24] conducted a study on the seismic dynamic behavior of a retaining wall structure through numerical analysis. These previous studies showed the analytical approach to be highly effective and simple in assessing the seismic stability of facilities located in or connected to the ground. The reliability of the results can be verified as well. In particular, the application of 3D analysis techniques will make it possible to evaluate the seismic behavior of sound barriers more clearly by reflecting their structural characteristics.
This study undertook a dynamic numerical analysis of a recently engineered bifacial solar module-integrated sound barrier wall. To scrutinize the targeted structure, the finite-difference method was employed as the numerical modeling technique. The structure’s dynamic behavior was then evaluated in line with the earthquake magnitude specifications outlined in the Korean seismic design standards (MOLIT, [25]). As for the ground conditions for analysis, the demonstration site of the target structure was applied. Based on the analysis results, the seismic safety of the target structure was assessed. For seismic safety assessment, the seismic safety of the entire structure and each module were evaluated through a comparison with the material strength. Based on this, significant results were derived.

2. Analysis Model Development for Examining Dynamic Behavior of the Sound Barrier Wall Structure

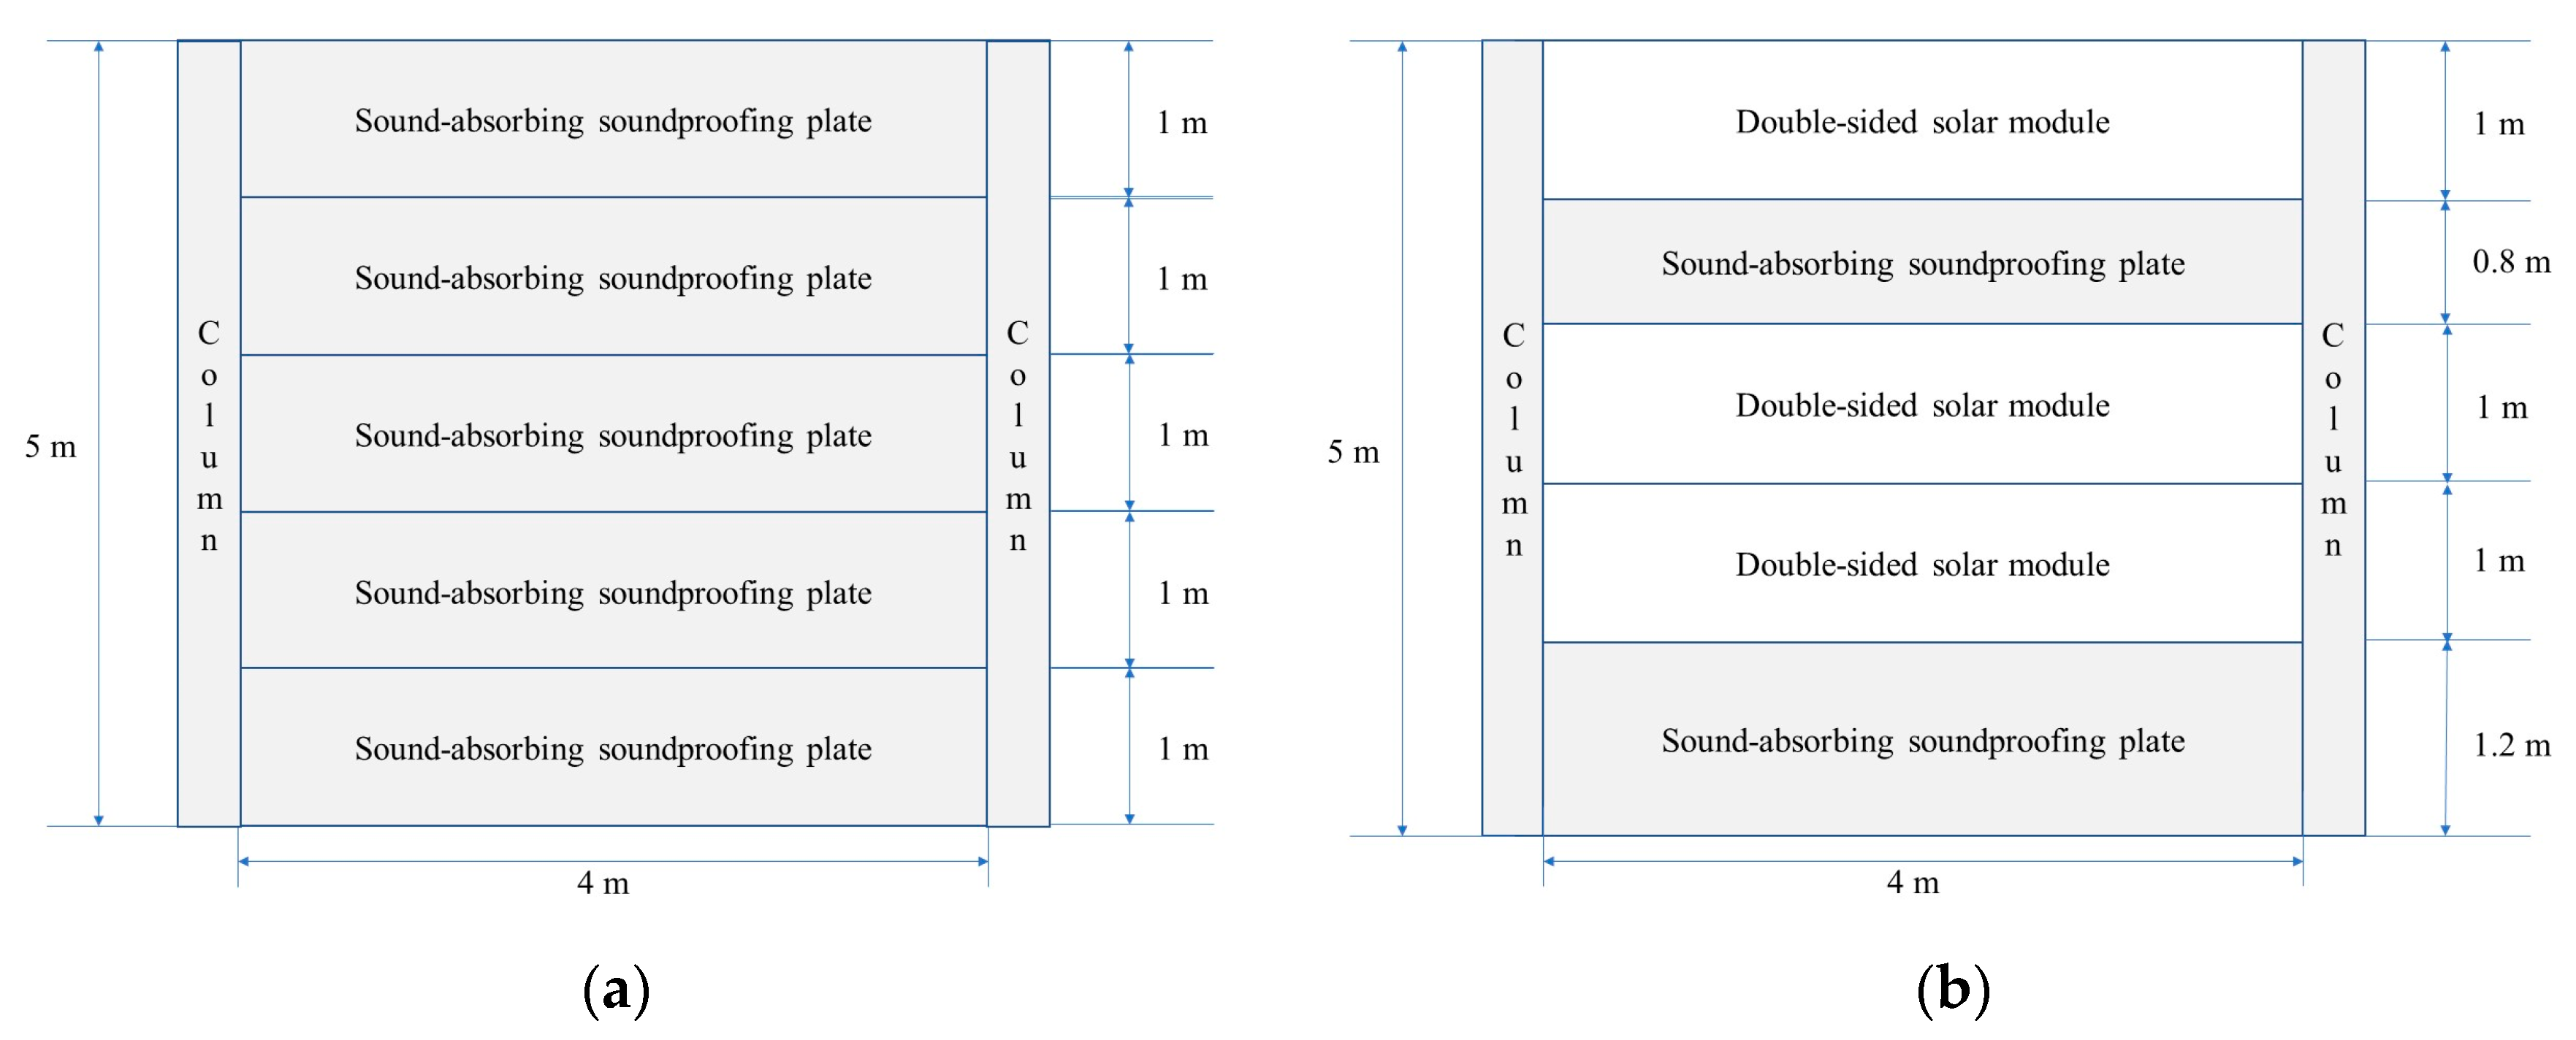
2.1. Structural Analysis for the Existing and Target Sound Barrier Wall Structures

The target sound barrier wall structure under development replaces some sound-absorbing and reflective soundproofing plates in the existing sound barrier wall structure with double-sided solar modules. For the standardized model, the height of the sound barrier wall is 5 m. A sound-absorbing soundproofing plate with a 1.2 m height is installed on the bottom floor and double-sided solar modules with a 1 m height on the second and third floors. A 0.8 m-high sound-absorbing soundproofing plate is installed on the fourth floor and a 1 m-high double-sided solar module on the fifth floor. The sound barrier wall columns and sound-absorbing soundproofing plates, except for the double-sided solar modules, are the same as the existing sound barrier wall structure. The supporting columns are H-beam structures with dimensions of 200 mm × 200 mm × 8 m × 12 mm. The sound-absorbing soundproof plate comprise a core made of sound-absorbing polyester material, encased between galvanized steel plates of 1.6 T and 0.5 T thicknesses. The solar module assembly includes solar cells and is covered by a 2 mm layer of tempered glass. Figure 1a illustrates the cross-sectional view of the standard bifacial solar module-integrated sound barrier wall configuration. For a comparison with this target structure, the existing sound barrier wall structure was also analyzed. For the existing sound barrier wall structure, the same height of 5 m was also applied, and the structure with sound-absorbing soundproofing plates instead of solar modules was selected (Figure 1b).

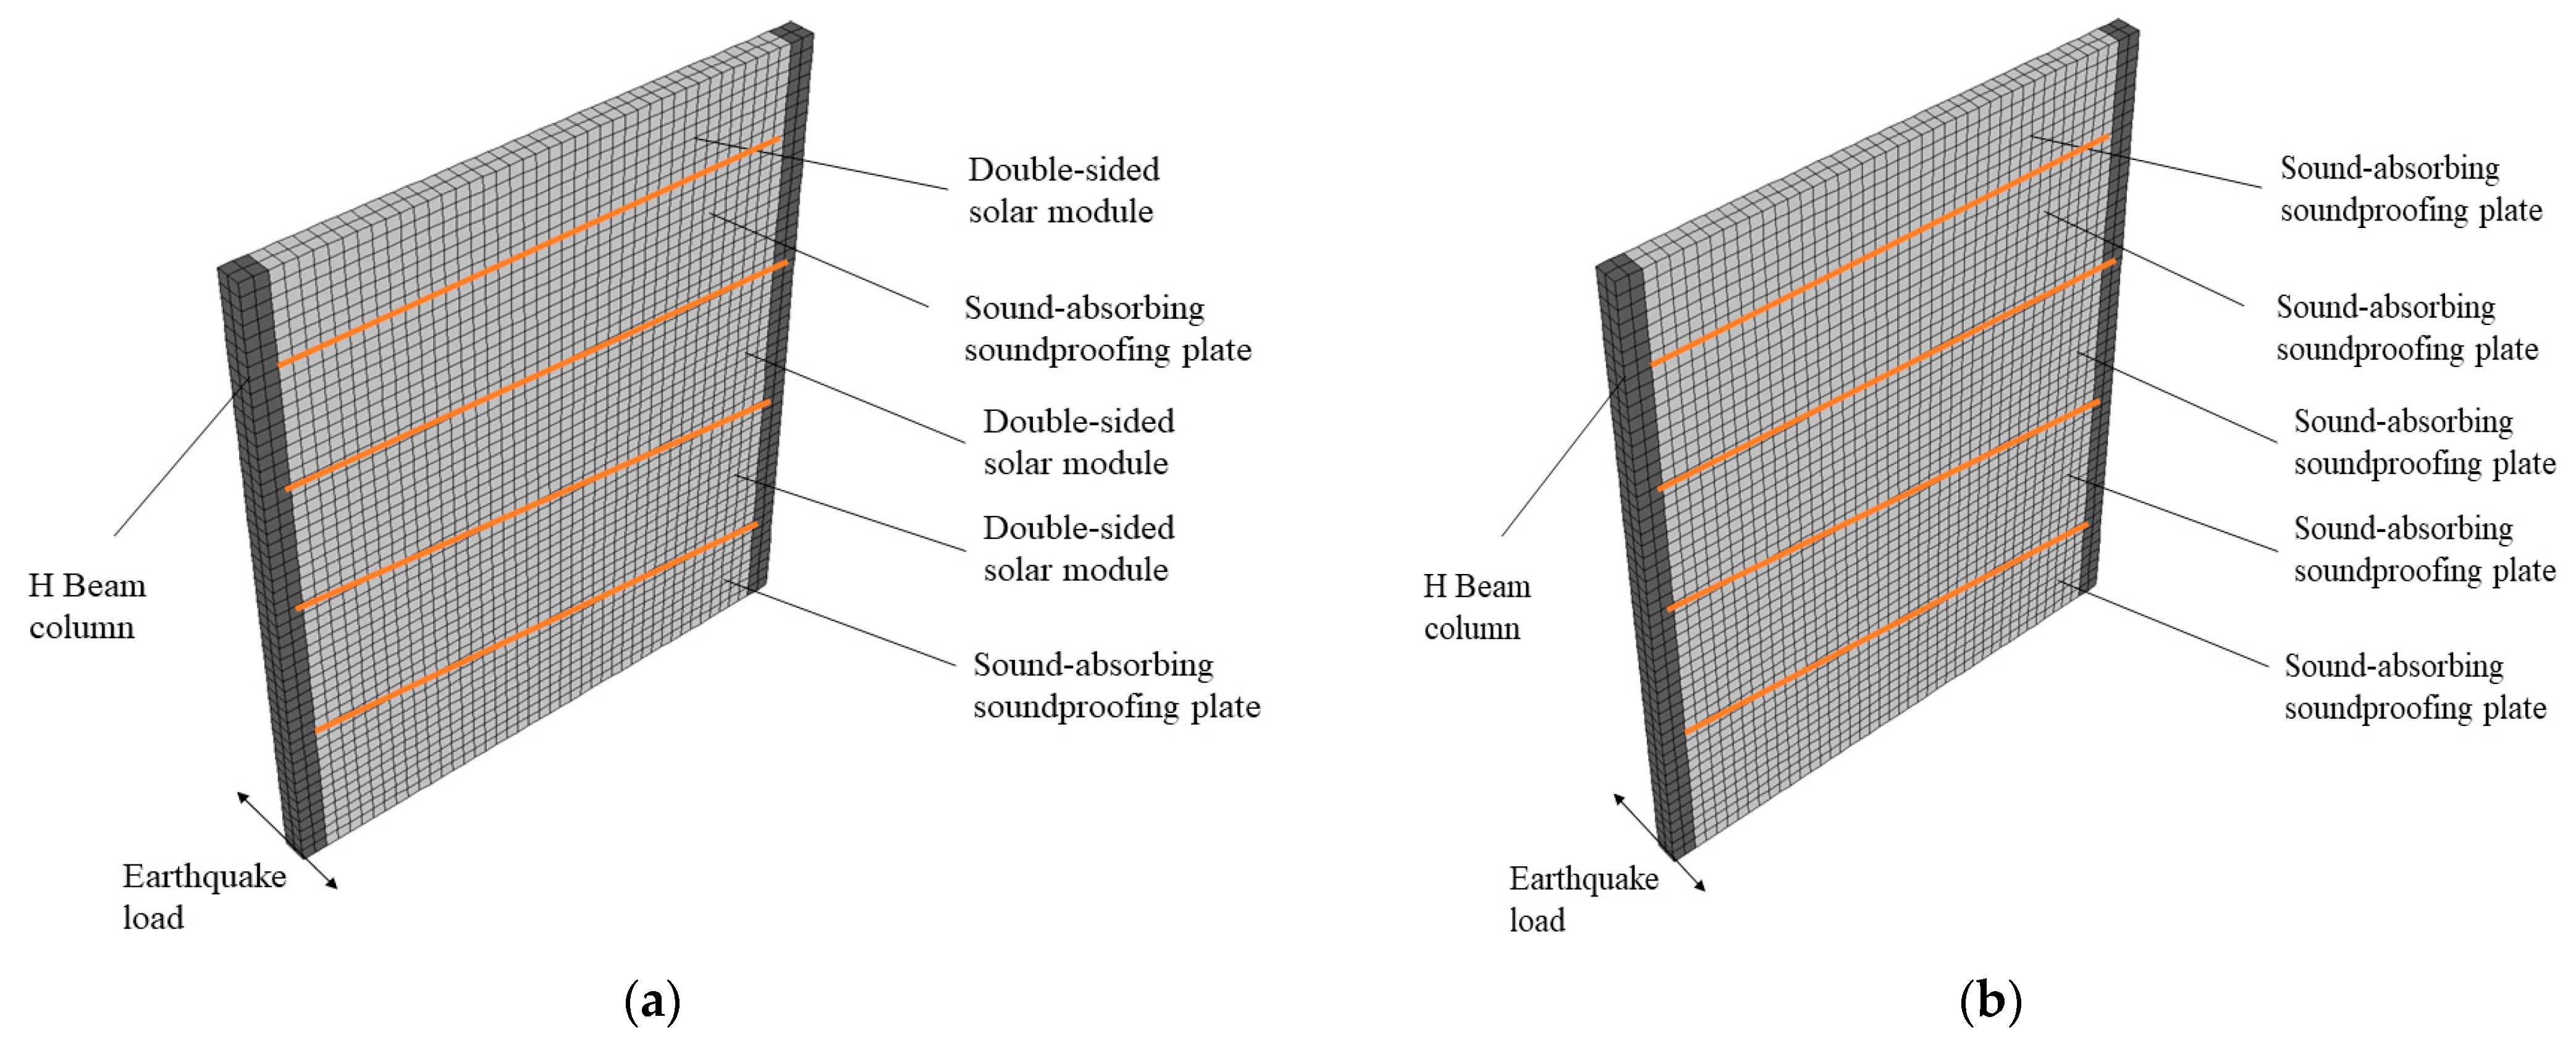
2.2. Analysis Model Development

The subject structure under investigation comprises supporting columns, acoustic insulation panels, and bifacial solar modules. Therefore, its lateral stiffness exhibits heterogeneity. Consequently, modeling and analyzing this structure under 2D plane deformation conditions cannot capture the full complexity of its actual stiffness variations. Therefore, in this study, modeling was performed using FLAC3D 7.0 [26], a 3D commercial finite-difference analysis software program, to reflect the behavior of the actual structure. The 3D continuum model of the target structure consists of double-sided solar module integrated sound barrier wall columns, sound-absorbing soundproofing plates, and solar modules. For the columns, H-beam columns were simulated in the geometry of 200 × 200 mm rectangular columns for the convenience of modeling. The corrected elastic modulus and density values were entered so that the lateral EI value and mass, which have a dominant effect on seismic behavior, could be identical to the actual H-beam. For the sound-absorbing soundproofing plate, the structure surrounded by 1.6 and 0.5 mm galvanized steel plates with empty space in the middle was simulated as a wide rectangular column, and the polyester material with soundproofing performance was assumed to have no lateral stiffness. To accurately assess the seismic performance of the acoustic insulation panels, the elastic modulus was adjusted to ensure that the lateral stiffness mirrored that of the actual structure. For the solar module, a framework enclosed by a 2 mm layer of tempered glass and containing a central void was modeled as a rectangular column of equivalent width to the acoustic insulation panels. In this simulation, it was posited that the module exhibited no lateral stiffness. The weight of the solar module was determined to be 254.8 kN/m2 by reflecting the standardized model under research, and the elastic modulus value was corrected to ensure that the lateral stiffness could be identical to that of the actual structure for seismic behavior evaluation. The heterogeneity of material stiffness due to the replacement of several soundproof wall modules with solar modules was reflected in the model as an input of the material stiffness values for lateral loads for each module structure as Table 1, and each panel was modeled under the condition of being rigid with each other. Therefore, through time-history analysis of the 3D continuum model constructed in this study, the seismic performance according to the difference in stiffness of the entire soundproof wall module and solar replacement module is naturally considered.
The 3D continuum model of the structure under scrutiny, derived through a series of computational processes, is depicted in Figure 2. The input parameters for this numerical analysis are collated in Table 1. The moment of inertia (I), which is one of the most important parameters in the dynamic analysis of structures, was calculated using Formula (1), and the flexural rigidity (EI) value was kept the same by applying the E value by considering changes in the moment of inertia (I).
I = b h 3 12
The model was developed using the brick element feature in FLAC3D, and an elastic constitutive model was employed. The overall dimensions of the complete model, which includes both the support columns and the acoustic insulation panels (as well as the solar modules), are (L) 4400 × (B) 200 × (H) 5000 mm. Regarding the model’s boundary conditions, the base of the structure was anchored to the ground along the X and Z axes, enabling the evaluation of seismic behavior along the Y axis. The seismic wave, as defined in the subsequent section, was introduced at the structure’s base to account for the amplification effects of the bedrock’s upper layer on the input seismic wave. Measurements of both y-axis acceleration and displacement were recorded at the structure’s apex to facilitate a comparative analysis of seismic performance under diverse conditions.
On the other hand, the seismic behavior of superstructures with shallow foundations can be reduced or increased because stiffness of the entire soil-structure system can be decreased due to the flexibility of the ground, which causes the natural frequency of the system to decrease by soil-structure interaction effect. Meanwhile, because soundproof walls generally installed along railroad facilities are located on the ground surface whose rigidity has been secured through ground improvement, etc., the effects due to SSI are expected to be reduced. In addition, because the rigidity and weight of the soundproof wall facility itself are not large and it was modeled under fixed-end conditions, judging from the general form of response spectrum, it can be demonstrated that changes in the natural period and seismic response of the entire system due to ground flexibility are negligible. Therefore, in this study, the impact of the seismic response of the structure due to the ground was analyzed at the level of considering the change in the magnitude of input acceleration due to ground amplification.

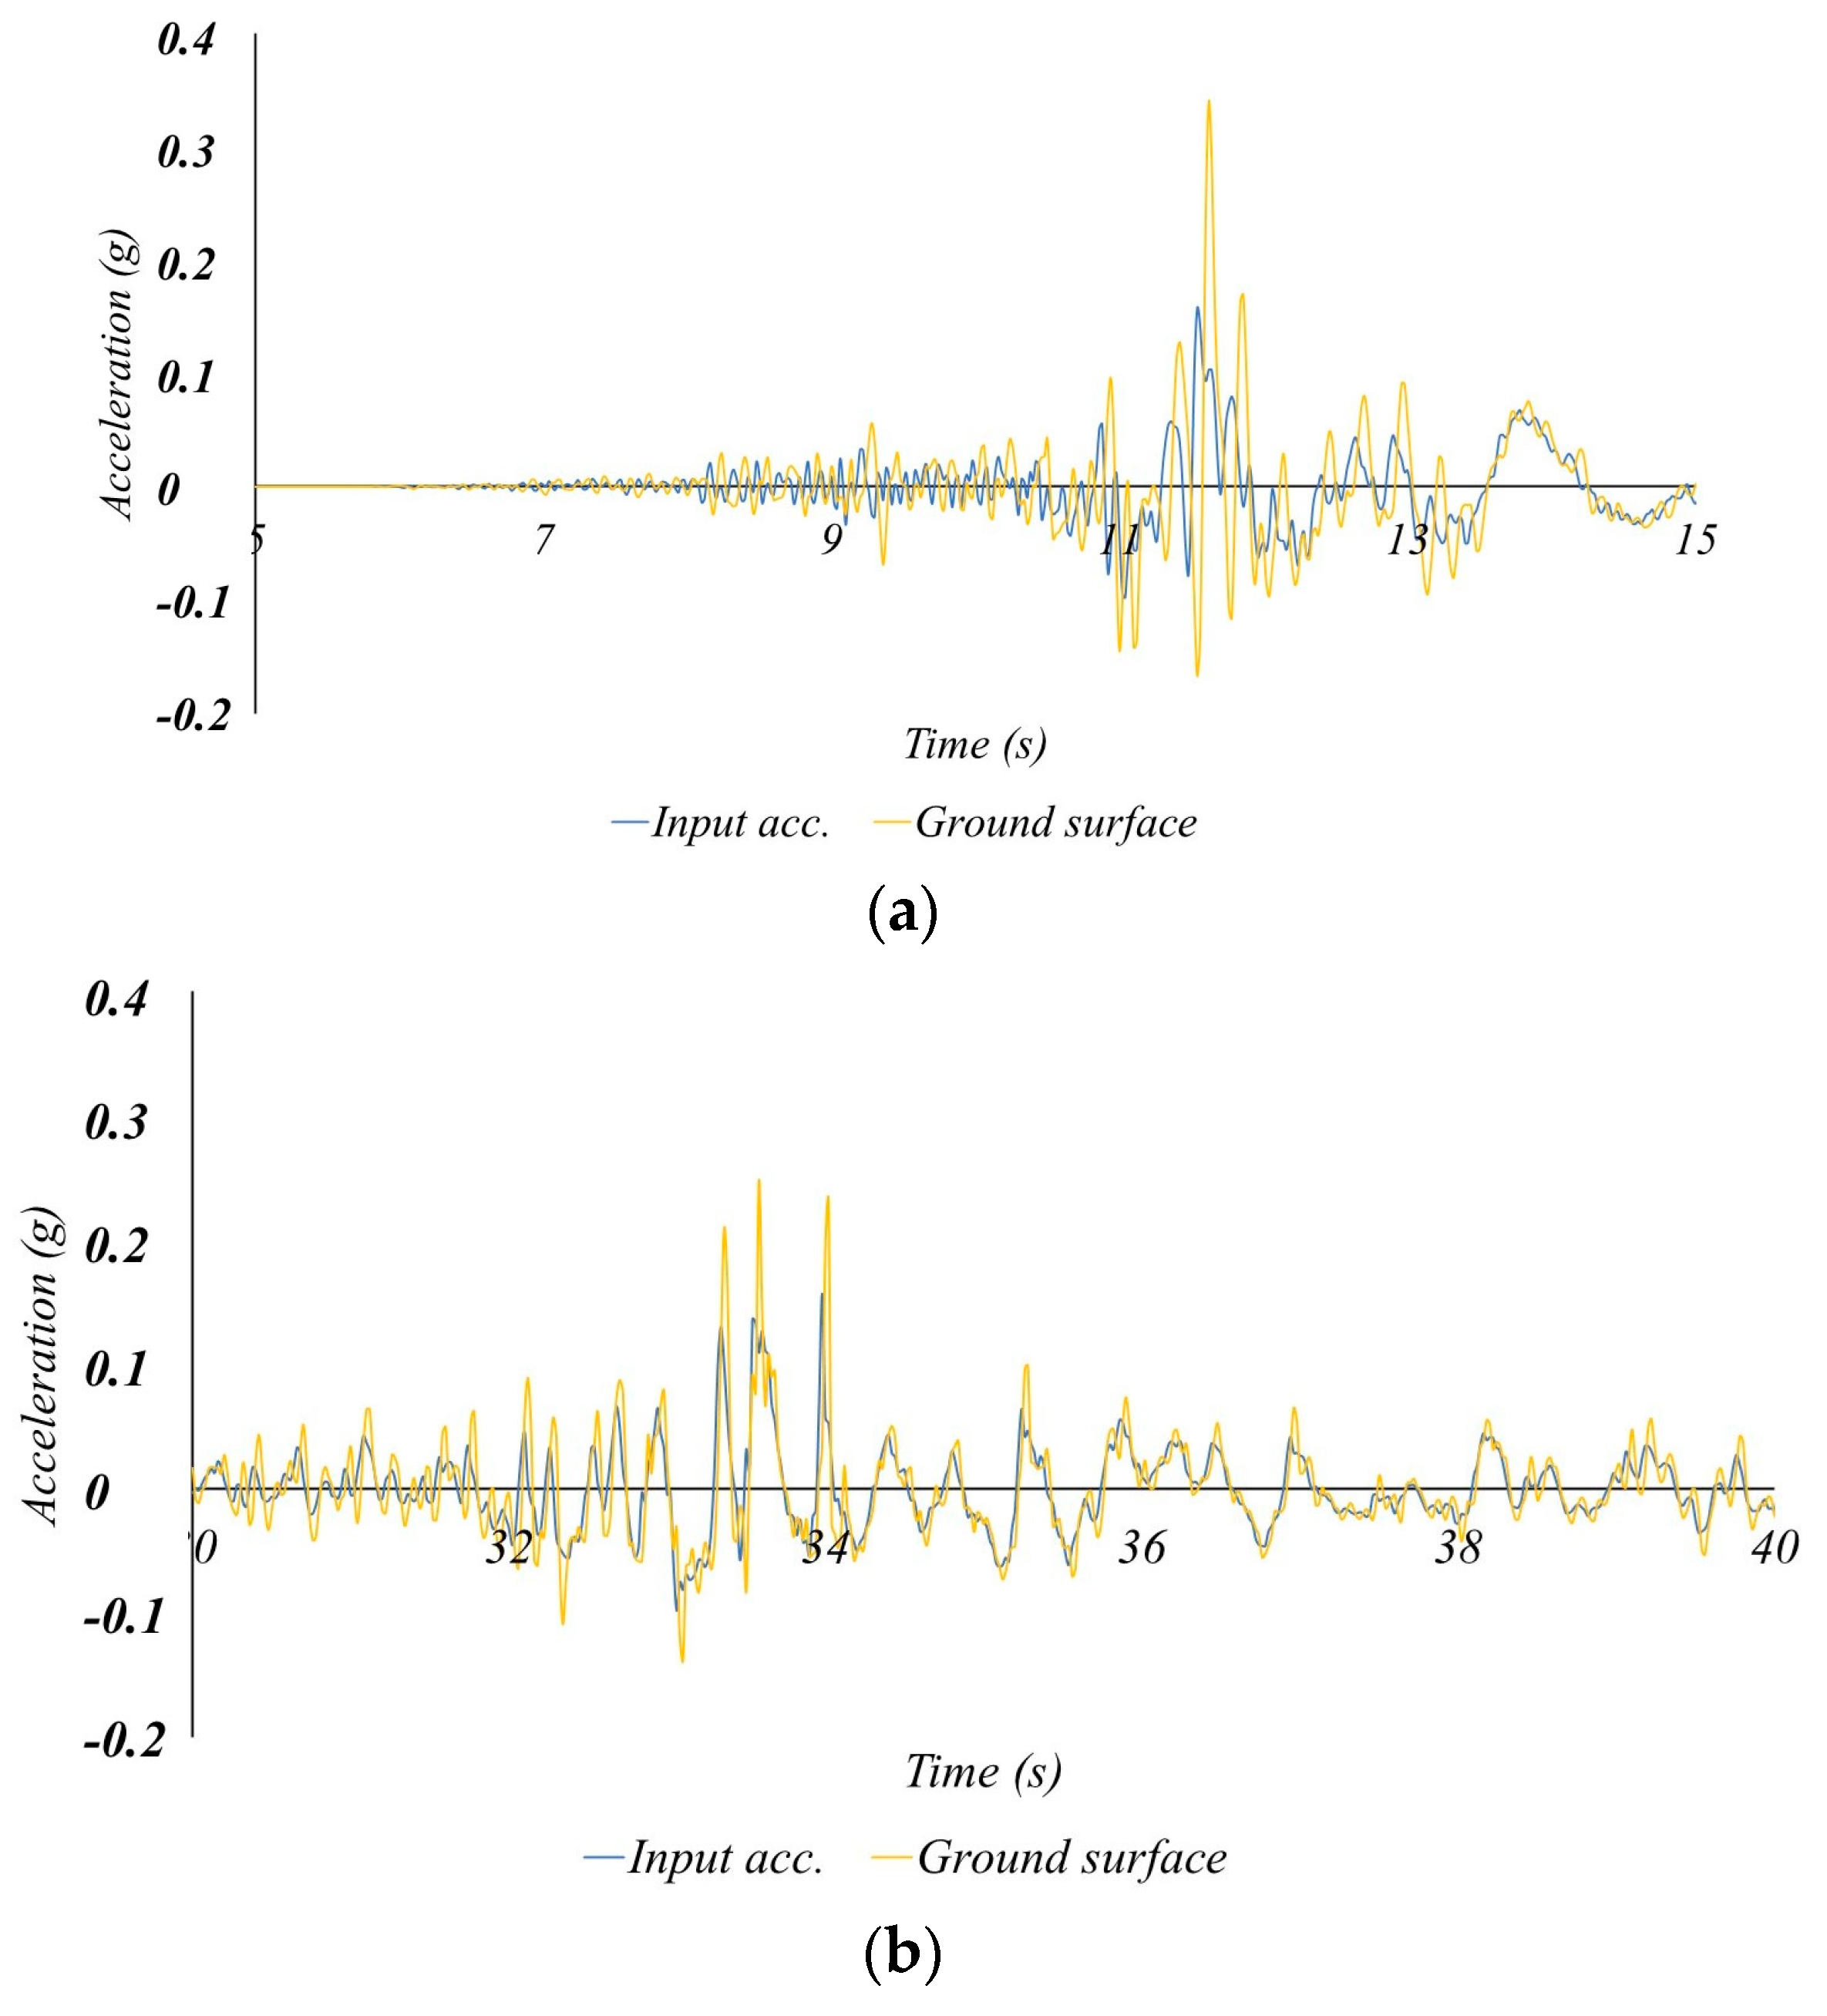
2.3. Input Seismic Load Determination

The intensity of an earthquake impacting a real-world structure is contingent upon local soil conditions and the amplification effects of seismic waves (MOLIT, [25]). Therefore, a preliminary ground response analysis is imperative prior to undertaking any structural seismic assessment. In this study, site-specific ground conditions at the demonstration test location for the structure under scrutiny were analyzed, followed by a comprehensive ground response evaluation. Upon securing the boring log proximate to the demonstration site and analyzing the ground conditions, the soil was identified as S1 type, featuring a layer of soft ground with an approximate thickness of 2.5 m (Figure 3). After this discovery, a ground response analysis was executed. For the input seismic waves, two distinct types were employed: the Hachinohe seismic wave, characterized as a long-period wave, and the Pohang seismic wave, a domestic short-period wave. These choices facilitated the evaluation of structural behavior in relation to varying seismic wave characteristics.
A one-dimensional equivalent linear ground response analysis was conducted using the Proshake 2.0 software. As for the magnitude of the input ground motion, the Pohang seismic wave, whose maximum ground acceleration was corrected to 0.11 g (return period: 500 years), 0.154 g (return period: 1000 years), and 0.22 g (return period: 2400 years), was applied to the top of the rock layer according to the return periods of the domestic seismic design standards. The shear wave velocity and moist unit density, which are ground properties required for analysis, were determined using correlations with the standard penetration resistance. The shear wave velocity was determined using the correlation proposed by Sun et al. [27] for domestic weathered soil. For the moist unit density, the average moist unit density according to the relative density of sandy soil proposed by Bowles [28] was applied. For the ground nonlinear curve for equivalent linear analysis, the Seed and Idriss [29] model of sand ground and the Schnabel et al. [30] model of rock, which are models embedded in Proshake, were applied. The ground properties applied in the site response analysis are summarized in Table 2. The convergence criterion to end the analysis was set to a maximum shear elastic modulus change rate of less than 1%. The analysis results showed that the number of repeated calculations ranged from 5 to 16.
The input earthquake for this study utilizes the ground motion defined in the Korean Seismic Design Standards (MOLIT, [25]). The input earthquake for each return period in the Korean seismic design criteria is calculated by the multiplying the seismic zone factor (Z) and the hazard factor (I) for each return period, and this study applied the zone factor of Zone 1, which includes most of Korea. The seismic zone factor (Z) and hazard factor (I) for each return period are shown in Table 3. Figure 4 shows the ground seismic response acceleration time history of the demonstration site for the 1000-year return period earthquake. When the ground response of the site to the Pohang and Hachinohe earthquakes was analyzed, the maximum accelerations were found to be 0.340 and 0.247 g, resulting in approximately 140 and 58% amplifications. Table 4 shows the maximum acceleration for 0.11 g (return period: 500 years), 0.154 g (return period: 1000 years), and 0.22 g (return period: 2400 years) earthquakes. For the Pohang earthquake, an amplification of 98 to 130% compared to the input ground acceleration occurred. For the Hachinohe earthquake, an amplification of 60 to 68% compared to the input ground acceleration occurred. In addition, the amplification increased as the input ground acceleration decreased.

2.4. Determination of Analysis Case

To evaluate the seismic safety of the target structure, analysis cases were determined. The seismic time history derived from the site response analysis in Section 2.3 is applied to the dynamic analysis of the double-sided solar-module-integrated sound barrier wall structure. Analysis was performed on the existing sound barrier wall structure and the double-sided solar-module-integrated sound barrier wall structure applying Pohang seismic waves (Case No. 1 and 2), and analysis was performed on the double-sided solar-module-integrated sound barrier wall structure using Hachinohe seismic waves (Case No. 3). The analysis cases are summarized in Table 5. To benchmark the seismic resilience of the structure under investigation against traditional sound barrier walls, cross-sectional analyses were conducted for both types of structures using the Pohang earthquake as a test case. To further probe variances contingent on the type of seismic load applied, additional analyses were executed for the structure using the Hachinohe earthquake.

3. Seismic Safety Evaluation for Sound Barrier Wall Structures

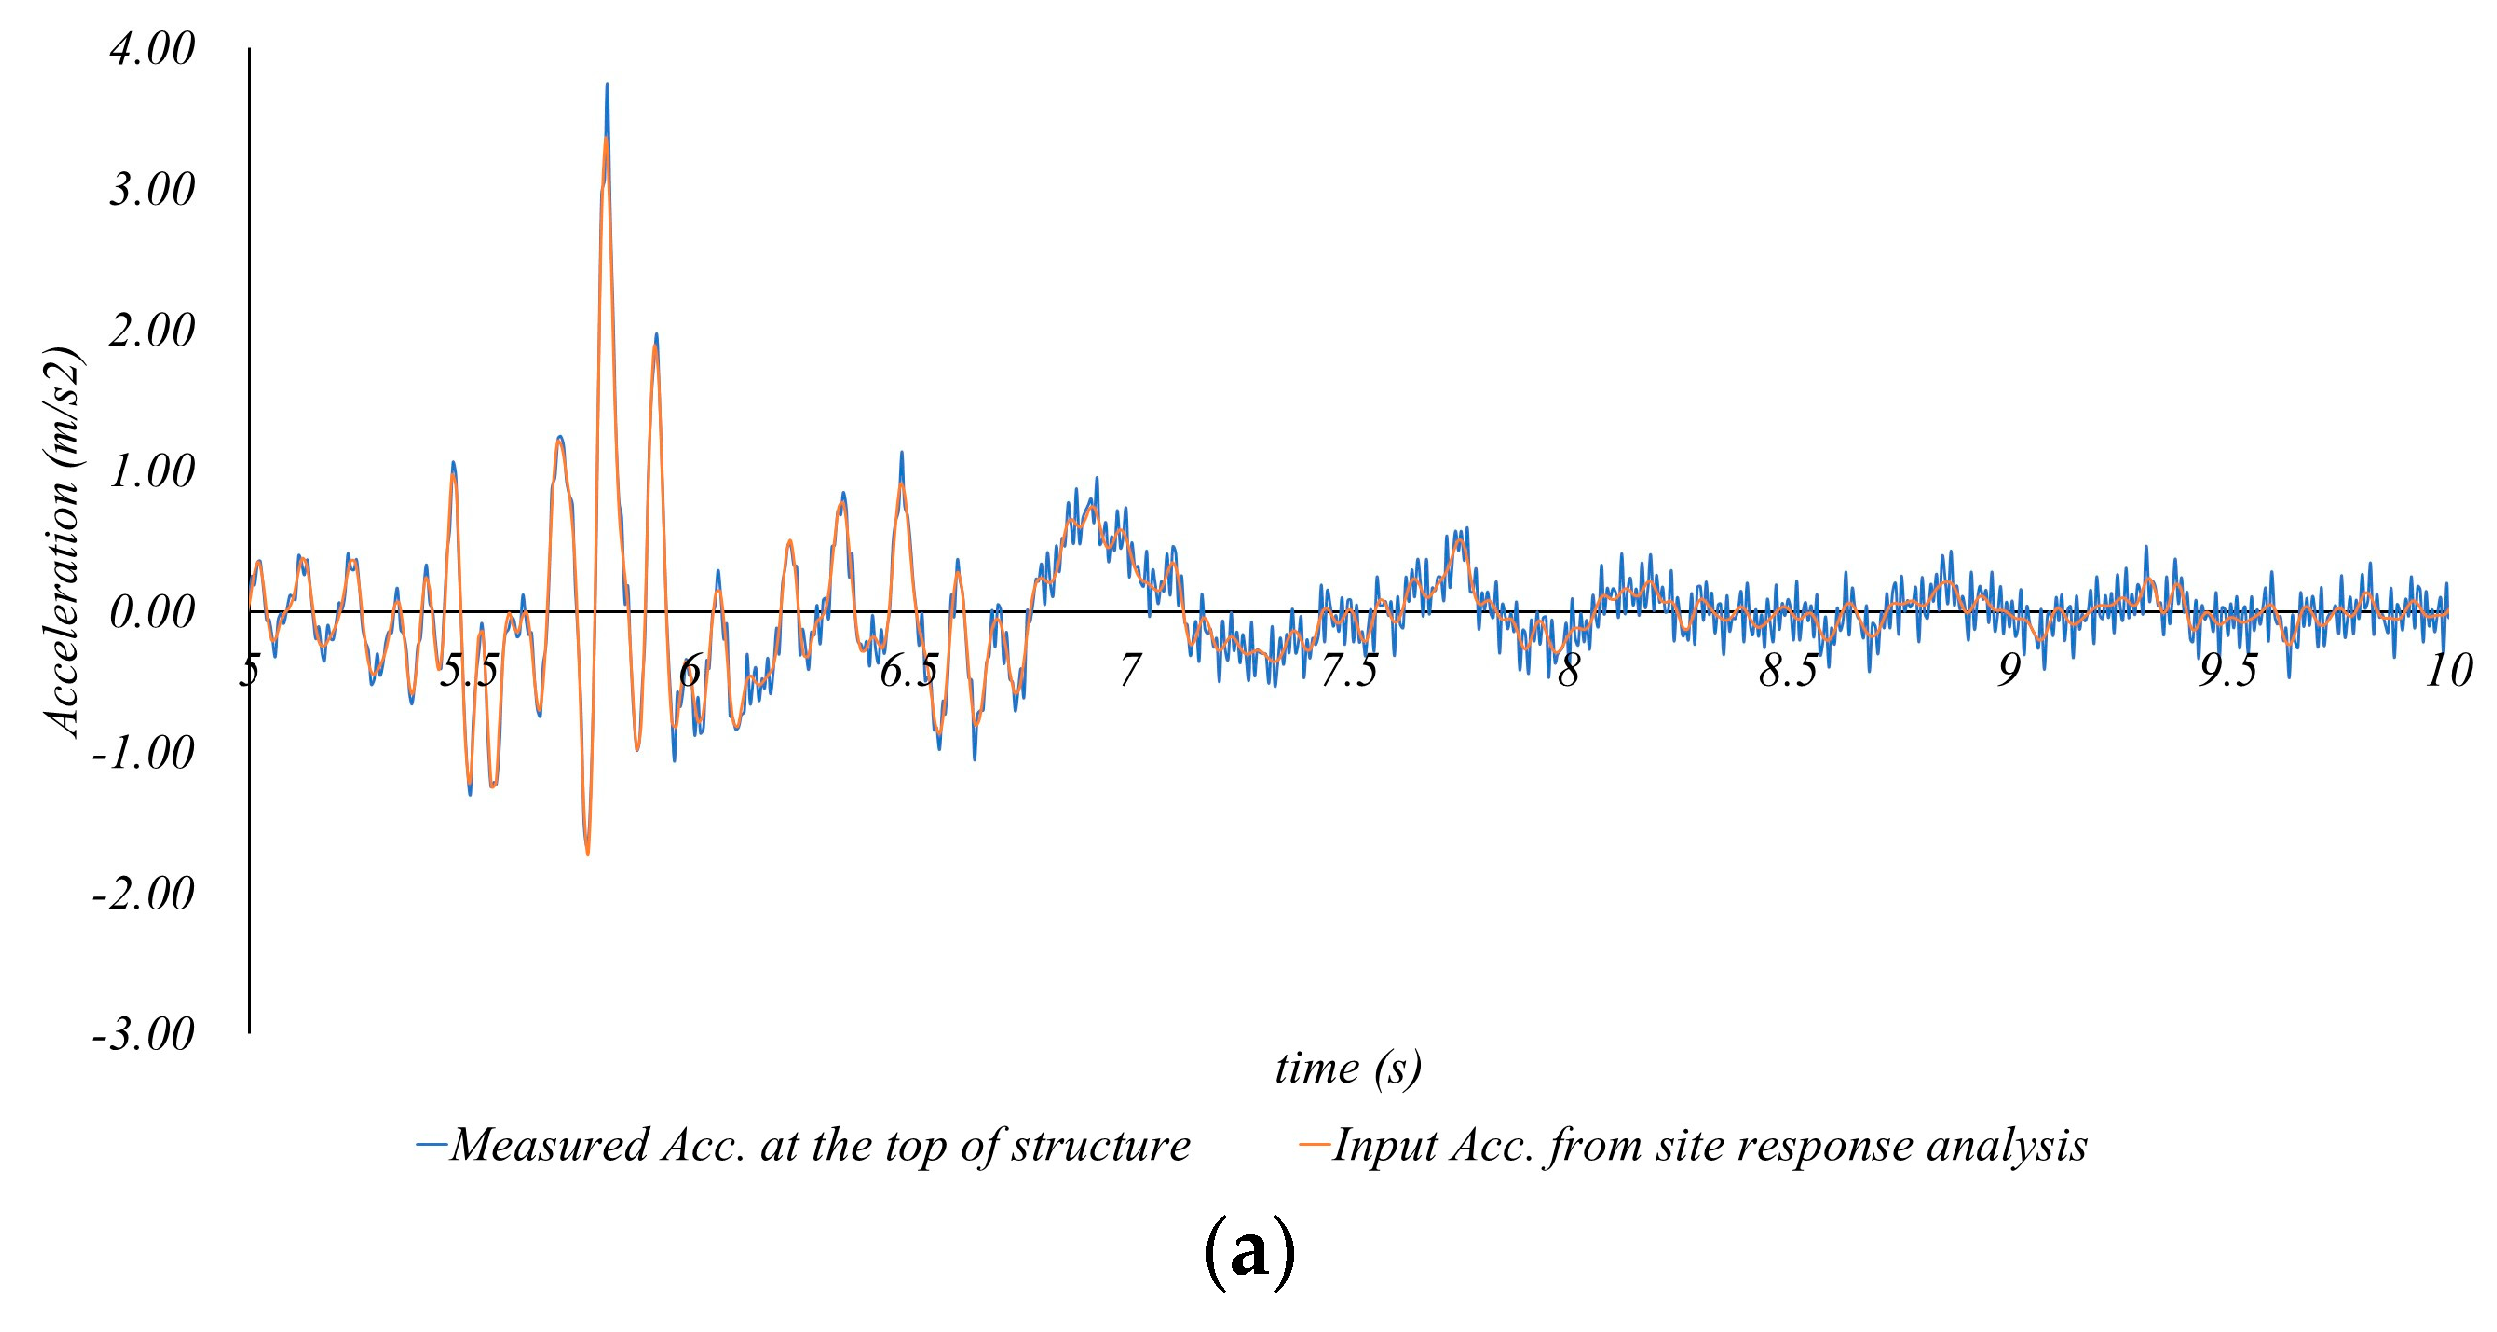
3.1. Seismic Safety Evaluation for Sound Barrier Wall Structures

Operating under the premise that the structure under scrutiny would be installed at the designated demonstration site, its dynamic behavior was rigorously analyzed. The results of Case No. 1 described in this section are the dynamic analysis results for the existing sound barrier structure, and the results of Case No. 2 and No. 3 are the dynamic analysis results for the double-sided solar-module-integrated sound barrier wall structure. The input seismic waves were informed by the ground acceleration time-history data garnered from the site response analysis presented in Section 2.3. Figure 5 delineates both the input ground acceleration and the corresponding acceleration time history at the apex of the sound barrier wall structures for a 1000-year return period earthquake in each scenario. The observed seismic behavior closely paralleled the phase of the input earthquake, revealing an acceleration amplification ranging from approximately 6% to 9%. Table 6 presents the acceleration metrics recorded at the top of the sound barrier structure for each scenario, compared to the input ground acceleration. Across all scenarios, the acceleration values at the structure’s apex remained largely in phase with the input earthquake, exhibiting an acceleration amplification in the range of 4% to 10%. Additionally, a discernible trend indicated a marginal decrease in the amplification ratio as the input ground acceleration escalated.
Figure 6 shows the graphs summarizing the lateral displacement at the top of the sound barrier structure for each case. The graphs show the displacement time history that occurs when the amplified earthquake, caused by the earthquake of each return period at the demonstration site as in the site response analysis results, is applied to the structure. The maximum seismic displacement ranged from 10.08 to 70.17 mm, depending on the structure type and input seismic load type. The difference in displacement depending on the structure type was not significant. This is because the columns are composed of H-beams with a relatively high stiffness, and the inertial force, which is essential in an earthquake, is low due to the small weight of the sound-absorbing soundproofing plates and double-sided solar modules. The difference depending on the input seismic wave type, however, was significant. This is because the displacement caused by the long-period seismic wave was large for the sound barrier structure with a relatively high slenderness ratio.
To ascertain the seismic safety and stability of the sound barrier structure across various return periods, the maximum displacement corresponding to each input earthquake was determined. Subsequently, the maximum stress experienced by the sound barrier’s supporting column was calculated. These outcomes are consolidated in Table 7. This estimated maximum stress was juxtaposed with the yield stress of the H-beam, leveraging data from a previous study [31] for the latter. Specifically, the maximum stress was calculated at the extremity of the H-beam furthest from the neutral axis of the rectangular grid and was based on the column’s maximal displacement. According to the analysis, the peak stress in the H-beam column is projected to remain below 18% of its yield stress, substantiating that the column is adequately constructed to withstand seismic-induced displacements.
When the inertial force acting on the structure is computed—by multiplying the peak acceleration value, as derived from the acceleration time-history analysis, with the combined mass of the acoustic insulation panels and bifacial solar modules—the results are tabulated in Table 8. The calculated inertial force ranged between 0.45 and 0.76 kN/m2, amounting to at most 66% of the design wind speed corresponding to the lowest load capacity rating (No. 5) for inland areas (referenced in Table 8 [32]). This can be attributed to the H-beam columns, which offer a relatively high stiffness, and the lower weight of the acoustic insulation panels and bifacial solar modules, resulting in reduced inertial forces during seismic events. Based on these analytical outcomes, the structure under scrutiny is deemed to possess robust seismic resilience. It can withstand earthquakes with a return period of 2400 years, aligning with the collapse prevention criteria for special-grade structures in domestic seismic design standards, as well as earthquakes with a 1000-year return period, which corresponds to the first-grade collapse prevention level, namely the seismic design standard for high-speed railways.

3.2. Evaluation of the Dynamic Safety of Solar Modules in the Target Structure

For the structure under investigation, which features modular components, the stiffness of the horizontally installed solar modules is markedly lower than that of the supporting columns. Therefore, despite the overall seismic resilience of the structure, the solar modules and acoustic insulation panels are susceptible to damage from seismic-induced displacements and stress. Consequently, a supplemental seismic safety assessment was executed specifically for the solar modules. The peak lateral displacement experienced by the modular bifacial solar units was calculated based on the displacements triggered by earthquakes of varying return periods. These data enabled the determination of the maximum stress experienced by both the solar modules and the acoustic insulation panels. The calculated peak bending stress values for the modules, corresponding to different earthquake magnitudes, were juxtaposed with the compressive strength benchmarks for tempered glass and galvanized steel plates, which constitute the modules. In this study, standard values from ASTM [33]—45 MPa for tempered glass and 450 MPa for galvanized steel plates—were utilized as the compressive strength parameters. Table 9 shows the observed maximum stress and tensile stress metrics.
Figure 7 presents the findings from the evaluation of module safety for the conventional sound barrier structure. This existing structure maintained its integrity, not surpassing the compressive strength limits, even when subjected to a seismic acceleration of 0.22 g corresponding to a 2400-year return period earthquake. This implies robust seismic resilience against the Pohang earthquake, a short-period event that surpasses the designated design earthquake criteria. Conversely, Figure 8 delineates the results from the seismic safety analysis conducted for the solar modules within the structure under scrutiny. The solar modules endured stress levels exceeding their compressive strength at the structure’s apex, where the most significant displacement transpired—this was true for all scenarios except the 500-year return period Pohang earthquake. This indicates that the solar module can be damaged by seismic displacement.
Considering the aforementioned findings, the columns in the targeted structure, comprised of H-beams, are assessed to possess robust seismic resilience. This stability is attributed to the structure’s relatively low mass and its phase alignment with the input earthquake. However, while the comprehensive seismic safety of the structure is deemed secure, the solar modules present a vulnerability, particularly during earthquakes meeting the first-grade collapse prevention criteria, which align with the domestic seismic design standards for high-speed railways. This susceptibility stems from the solar module’s intrinsically low tensile strength, owing to its construction from tempered glass. Given that damage from seismic-induced displacements is anticipated, remedial measures are necessitated. These could include reinforcement strategies aimed at either reducing the neutral axis distance or augmenting the structure’s overall stiffness. For example, when the thickness of tempered glass in the solar module increases by 6 mm, which can incase the inertial modulus (I) of solar module, making it more resilient to earthquake with a return period of 2400 years. In addition, when the distance to the neutral axis is halved, the stress generated is reduced by half, making the design more resilient to stronger earthquakes.
This study focused on the standard cross-section of solar module soundproofing structure being conducted in Korea, and the earthquake return period was also analyzed according to the return period of the Korean seismic design code [22]. For further study, it is necessary to additionally analyze various types of input earthquakes and input magnitudes to evaluate the applicability in other countries. For example, in the Japanese specifications for highway bridges [34], the design response spectrum is divided into Level 1 and Level 2 earthquakes, and depending on the type of ground, an input earthquake with a peak ground acceleration of 0.2~0.25 g for Level 1 earthquakes and 0.5~1 g for Level 2 earthquakes should be used. In addition, The Eurocode 8 [35] presents a response spectrum for seismic design divided into Type 1 (M5.5 or more) and Type 2 (M5.5 or less), and the maximum acceleration is applied differently depending on the geological conditions of each country, and the reference maximum acceleration (0.04~0.08 g) is multiplied by the soil factor.
A Level 1 earthquake is an earthquake with a high probability of occurring during the lifetime of the target structure, and a Level 2 earthquake is an earthquake with a very low probability of occurring in the target structure.

4. Conclusions

In this study, a dynamic numerical analysis was executed on a standardized, bifacial solar module-integrated sound barrier wall structure. This analysis employed a numerical modeling technique founded on the finite-difference method. The seismic safety assessment yielded the following key findings based on the outcomes of the numerical analysis:
  • The structure under examination incorporates bifacial solar modules as replacements for some of the acoustic insulation and reflective panels present in the conventional sound barrier setup. Utilizing FLAC3D—a commercial three-dimensional (3D) finite-difference analysis software—the dynamic behavior of this modified structure was rigorously assessed under seismic conditions. Before this analysis, property adjustments were made for the key components of the target structure—the sound barrier columns, acoustic insulation panels, and solar modules. These adjustments ensured that the mass and lateral stiffness, critical parameters affecting dynamic behavior during seismic events, closely mirrored those of the actual structure.
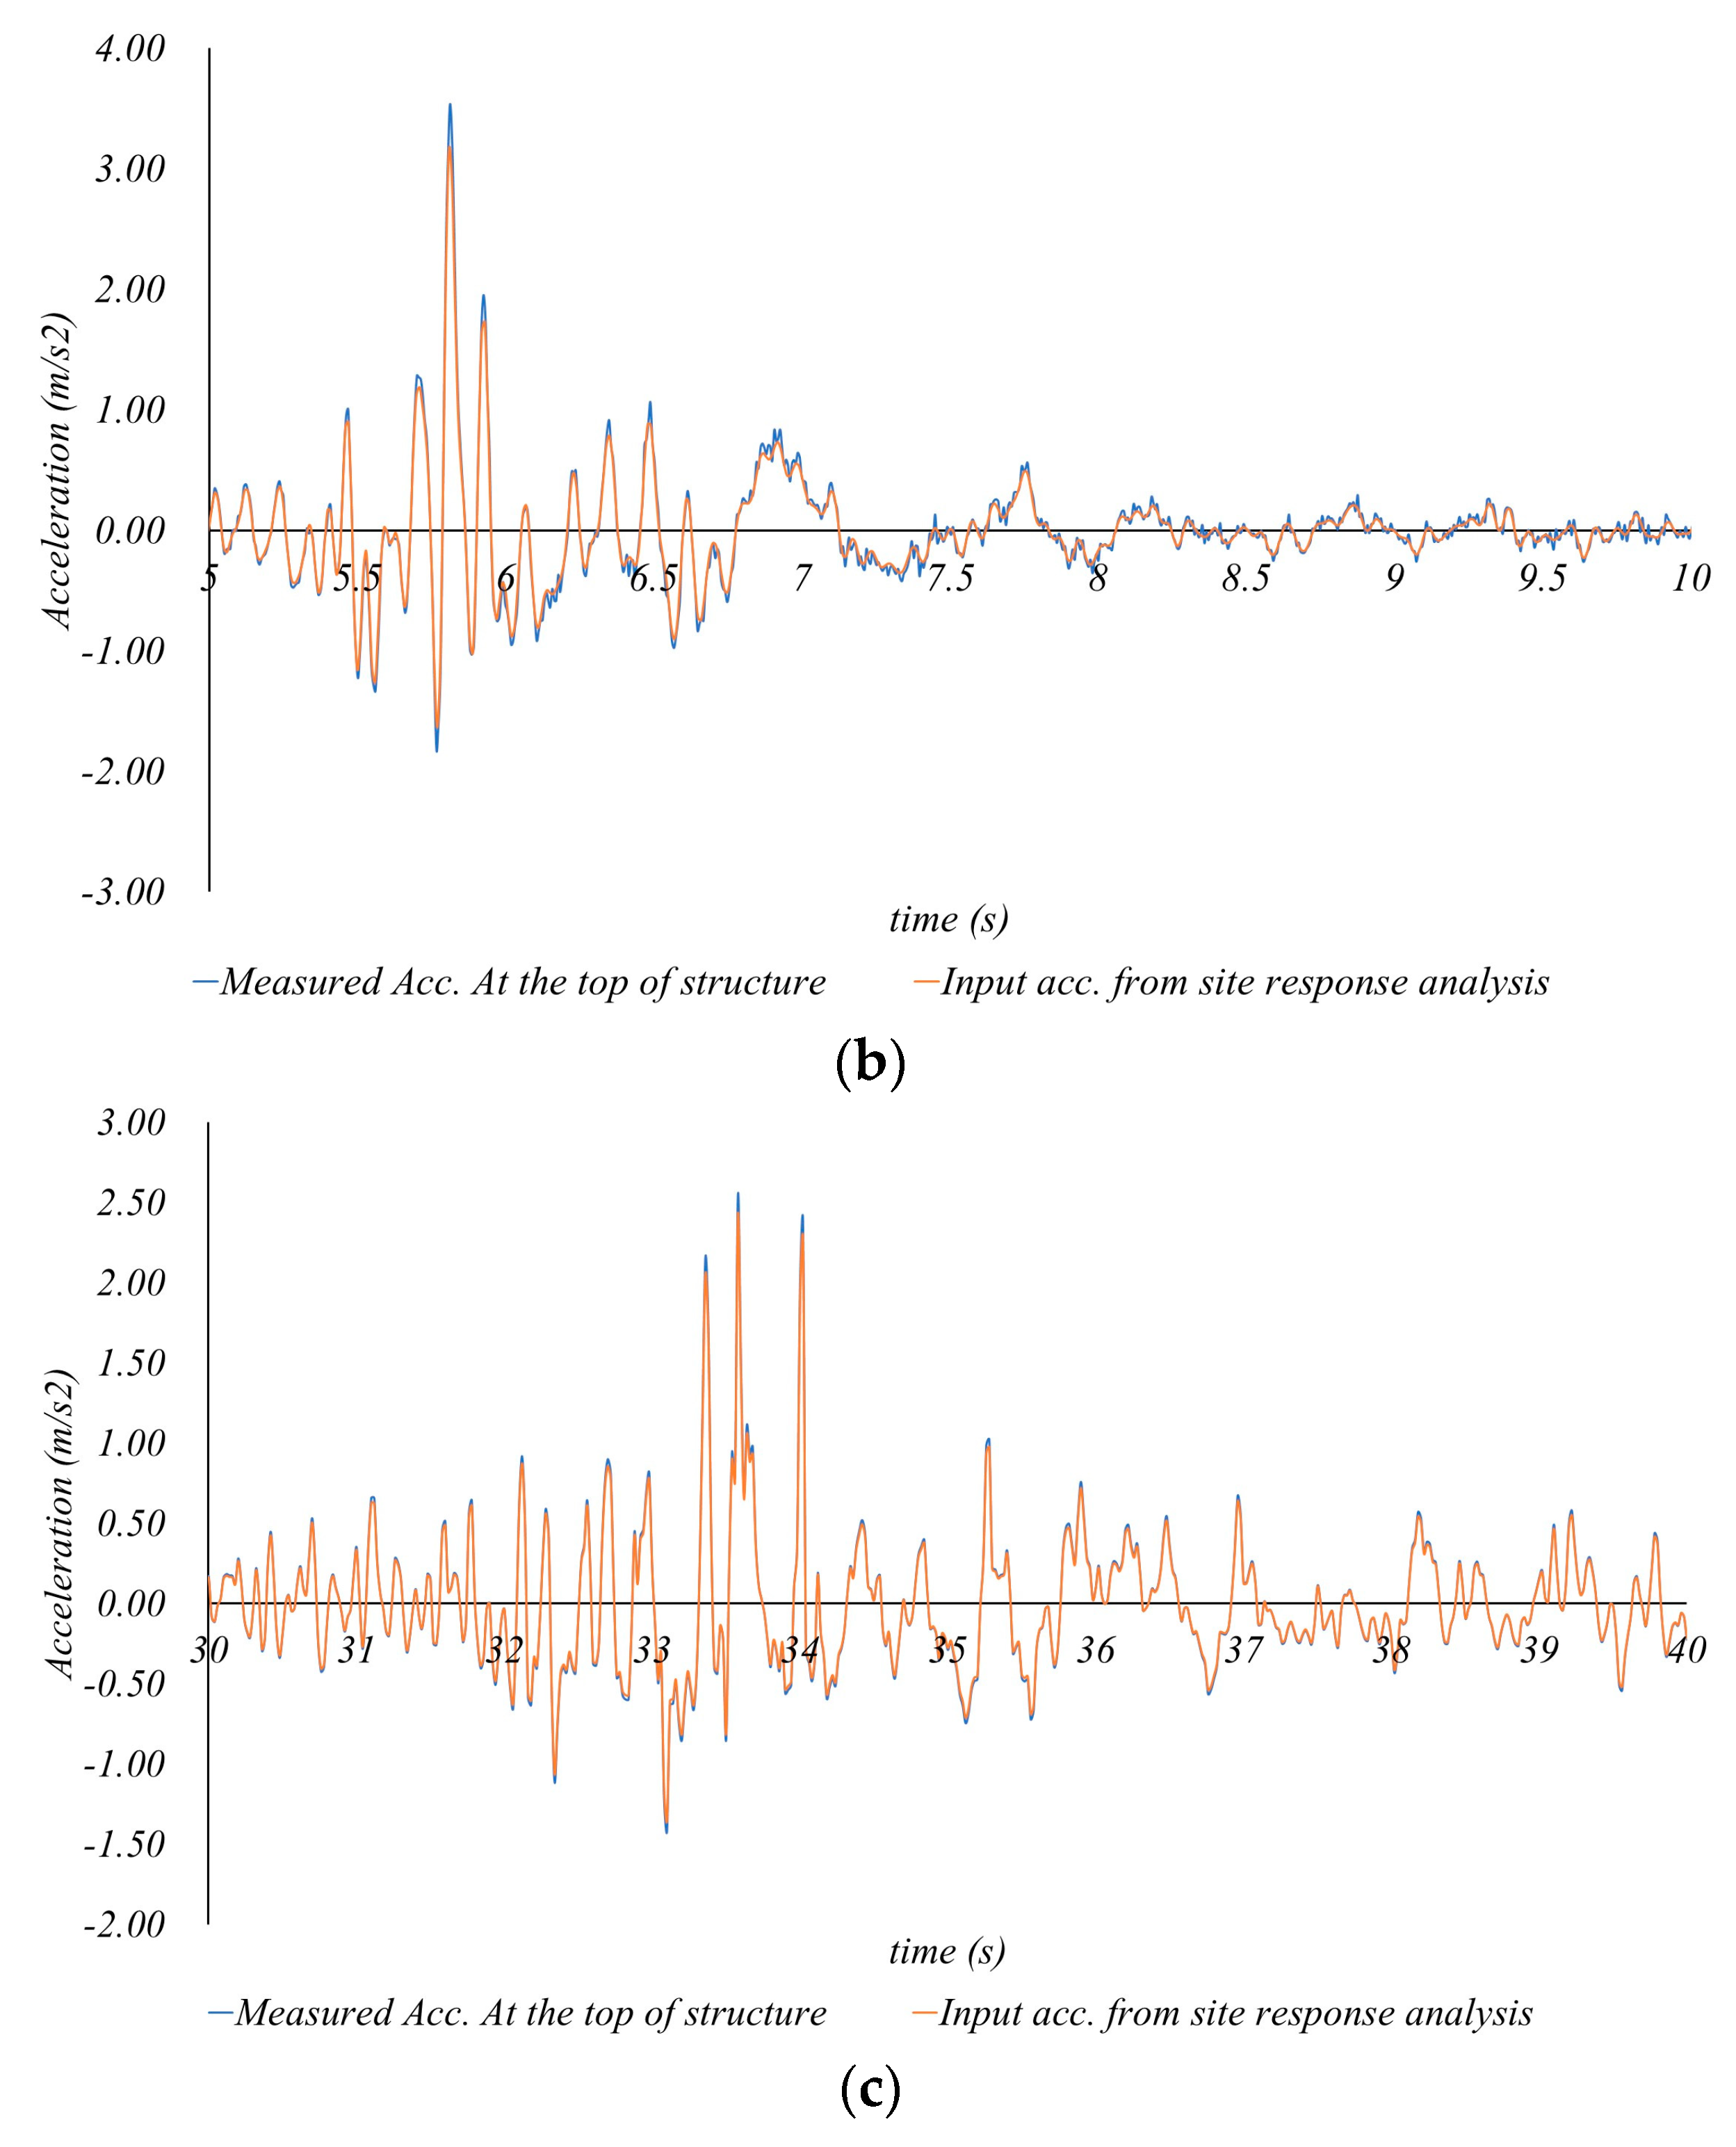
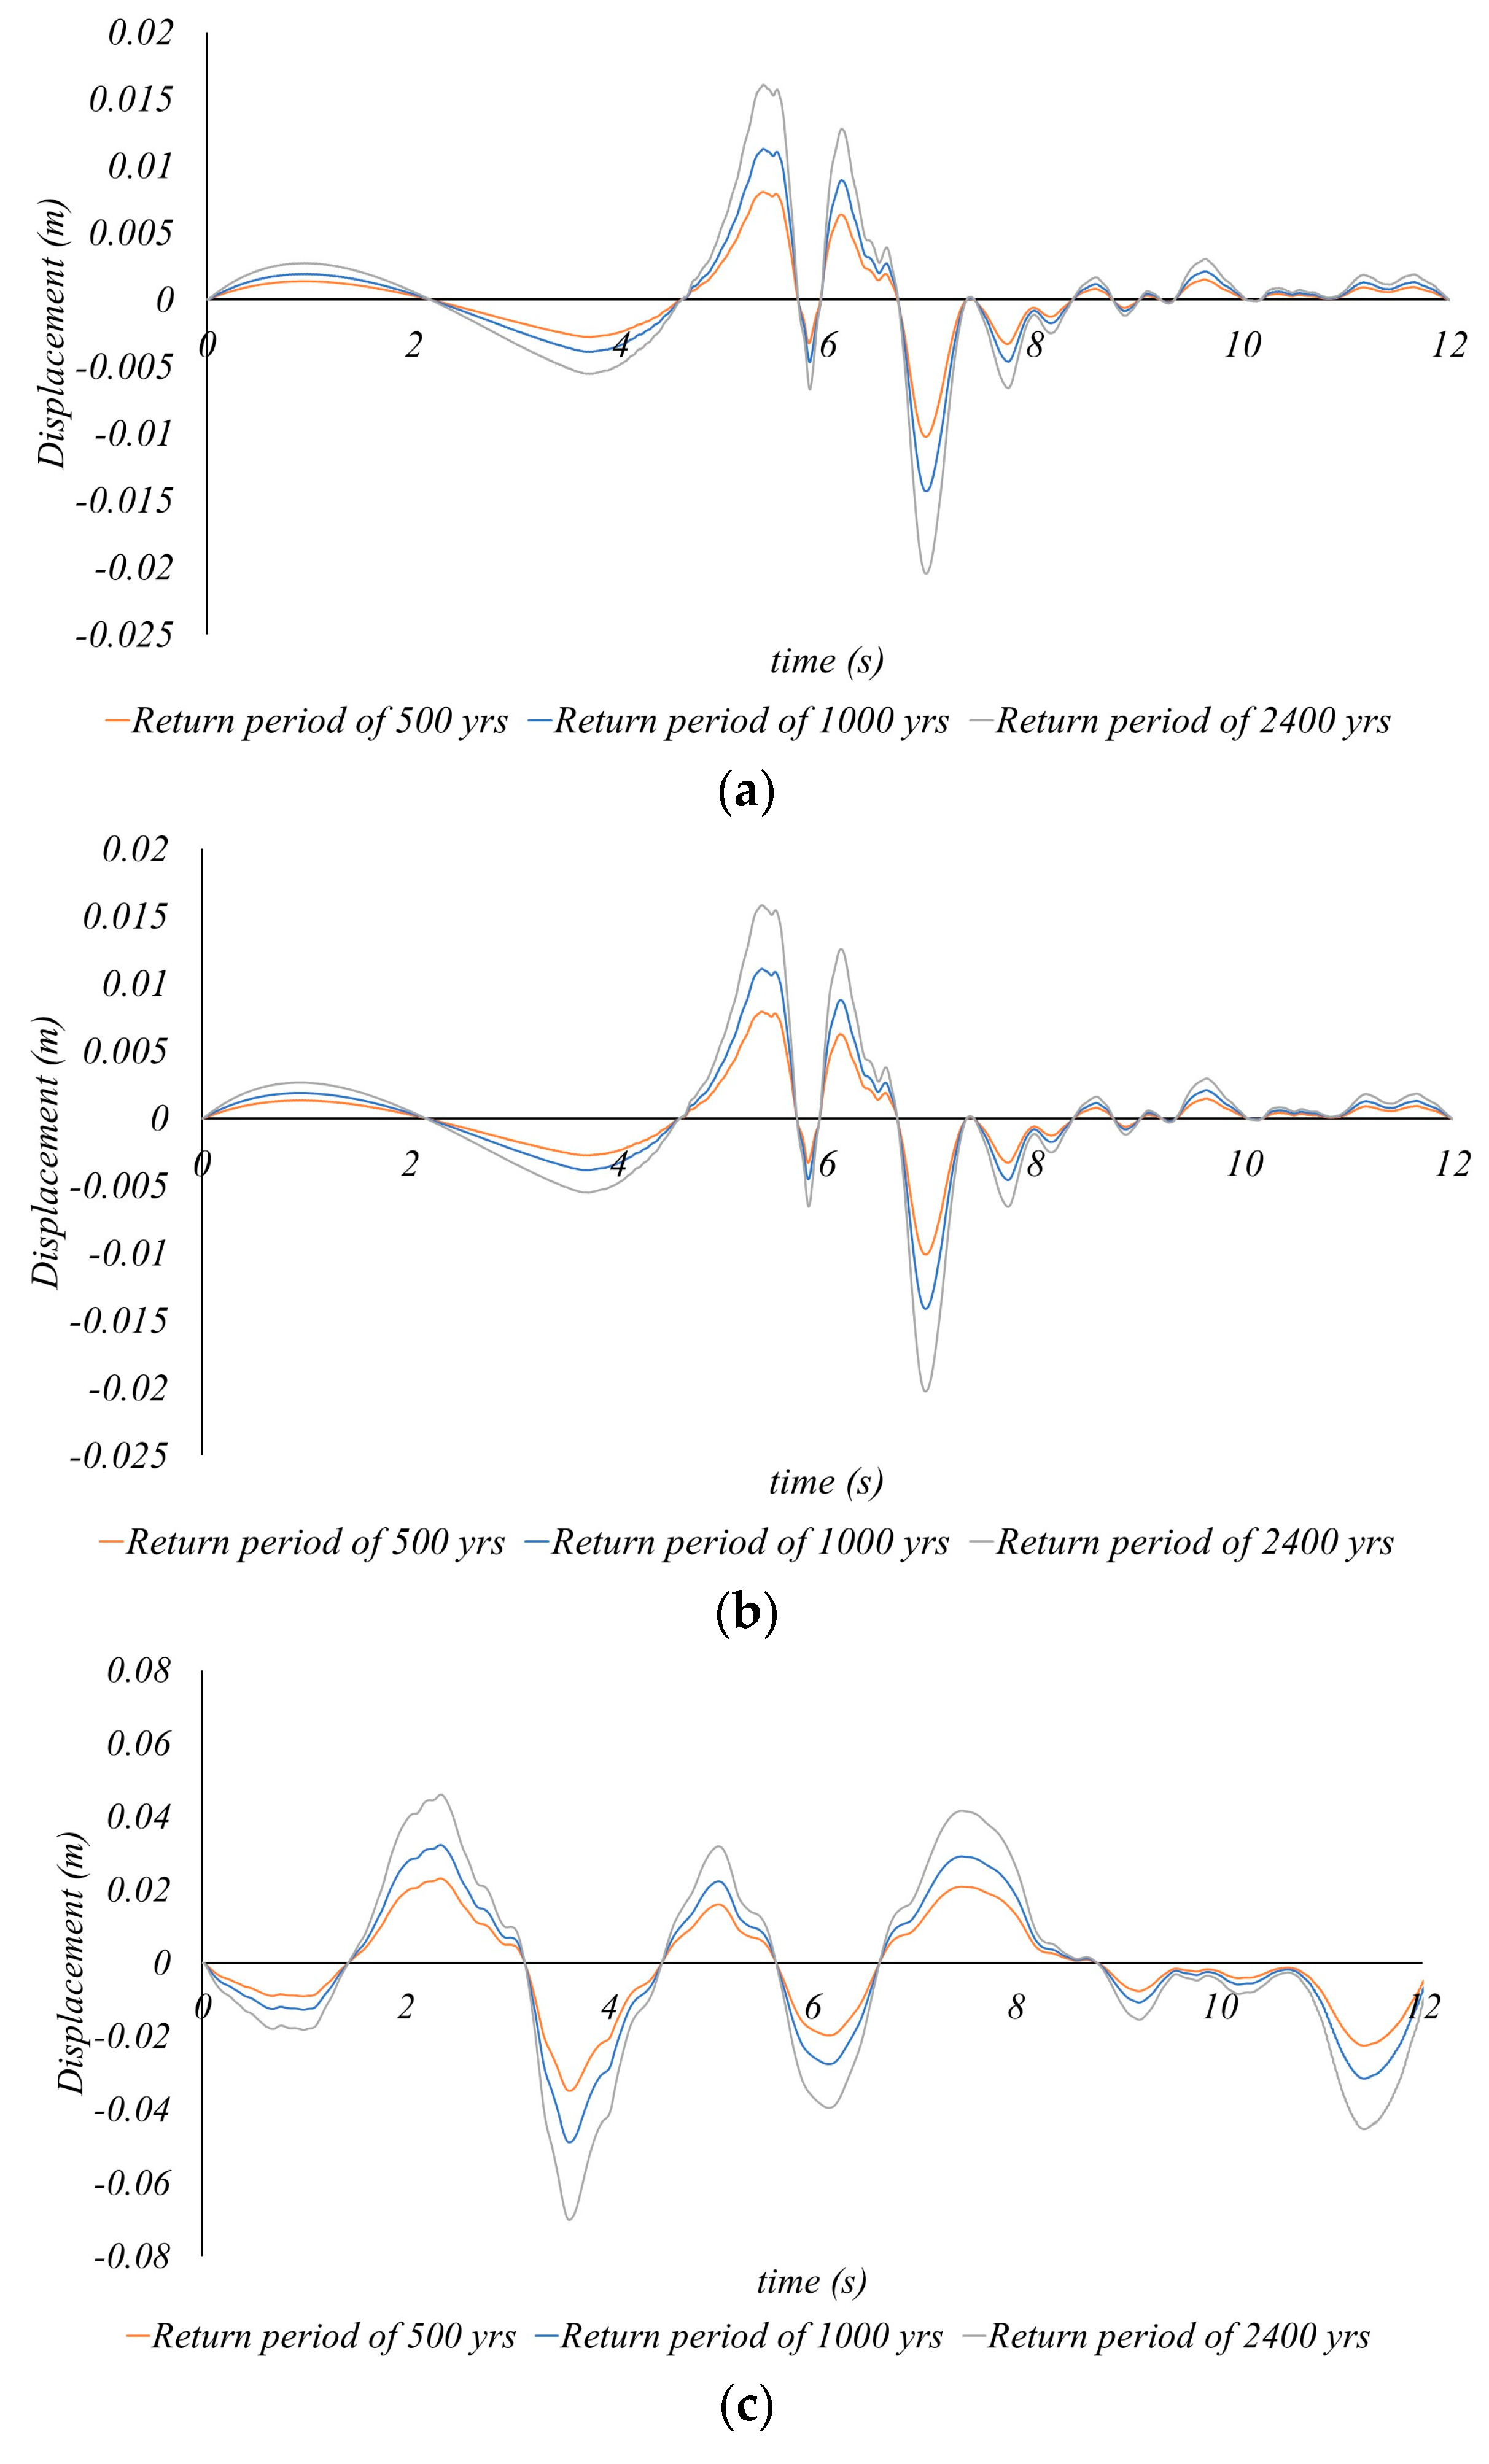
  • For the designated demonstration site of the structure under scrutiny, ground conditions were meticulously analyzed, and a subsequent ground response analysis was conducted. This was executed to procure the input earthquake time history essential for assessing the structure’s dynamic behavior during seismic events. For the site response analysis, two distinct types of seismic waves were employed: the Hachinohe seismic wave, characterized as a long-period wave, and the Pohang seismic wave, a domestic short-period wave. These selections were made to consider varying characteristics of input seismic waves. Earthquakes with return periods of 500 years, 1000 years, and 2400 years were incorporated as input ground accelerations, aligning with the collapse-prevention thresholds defined in domestic seismic design standards.
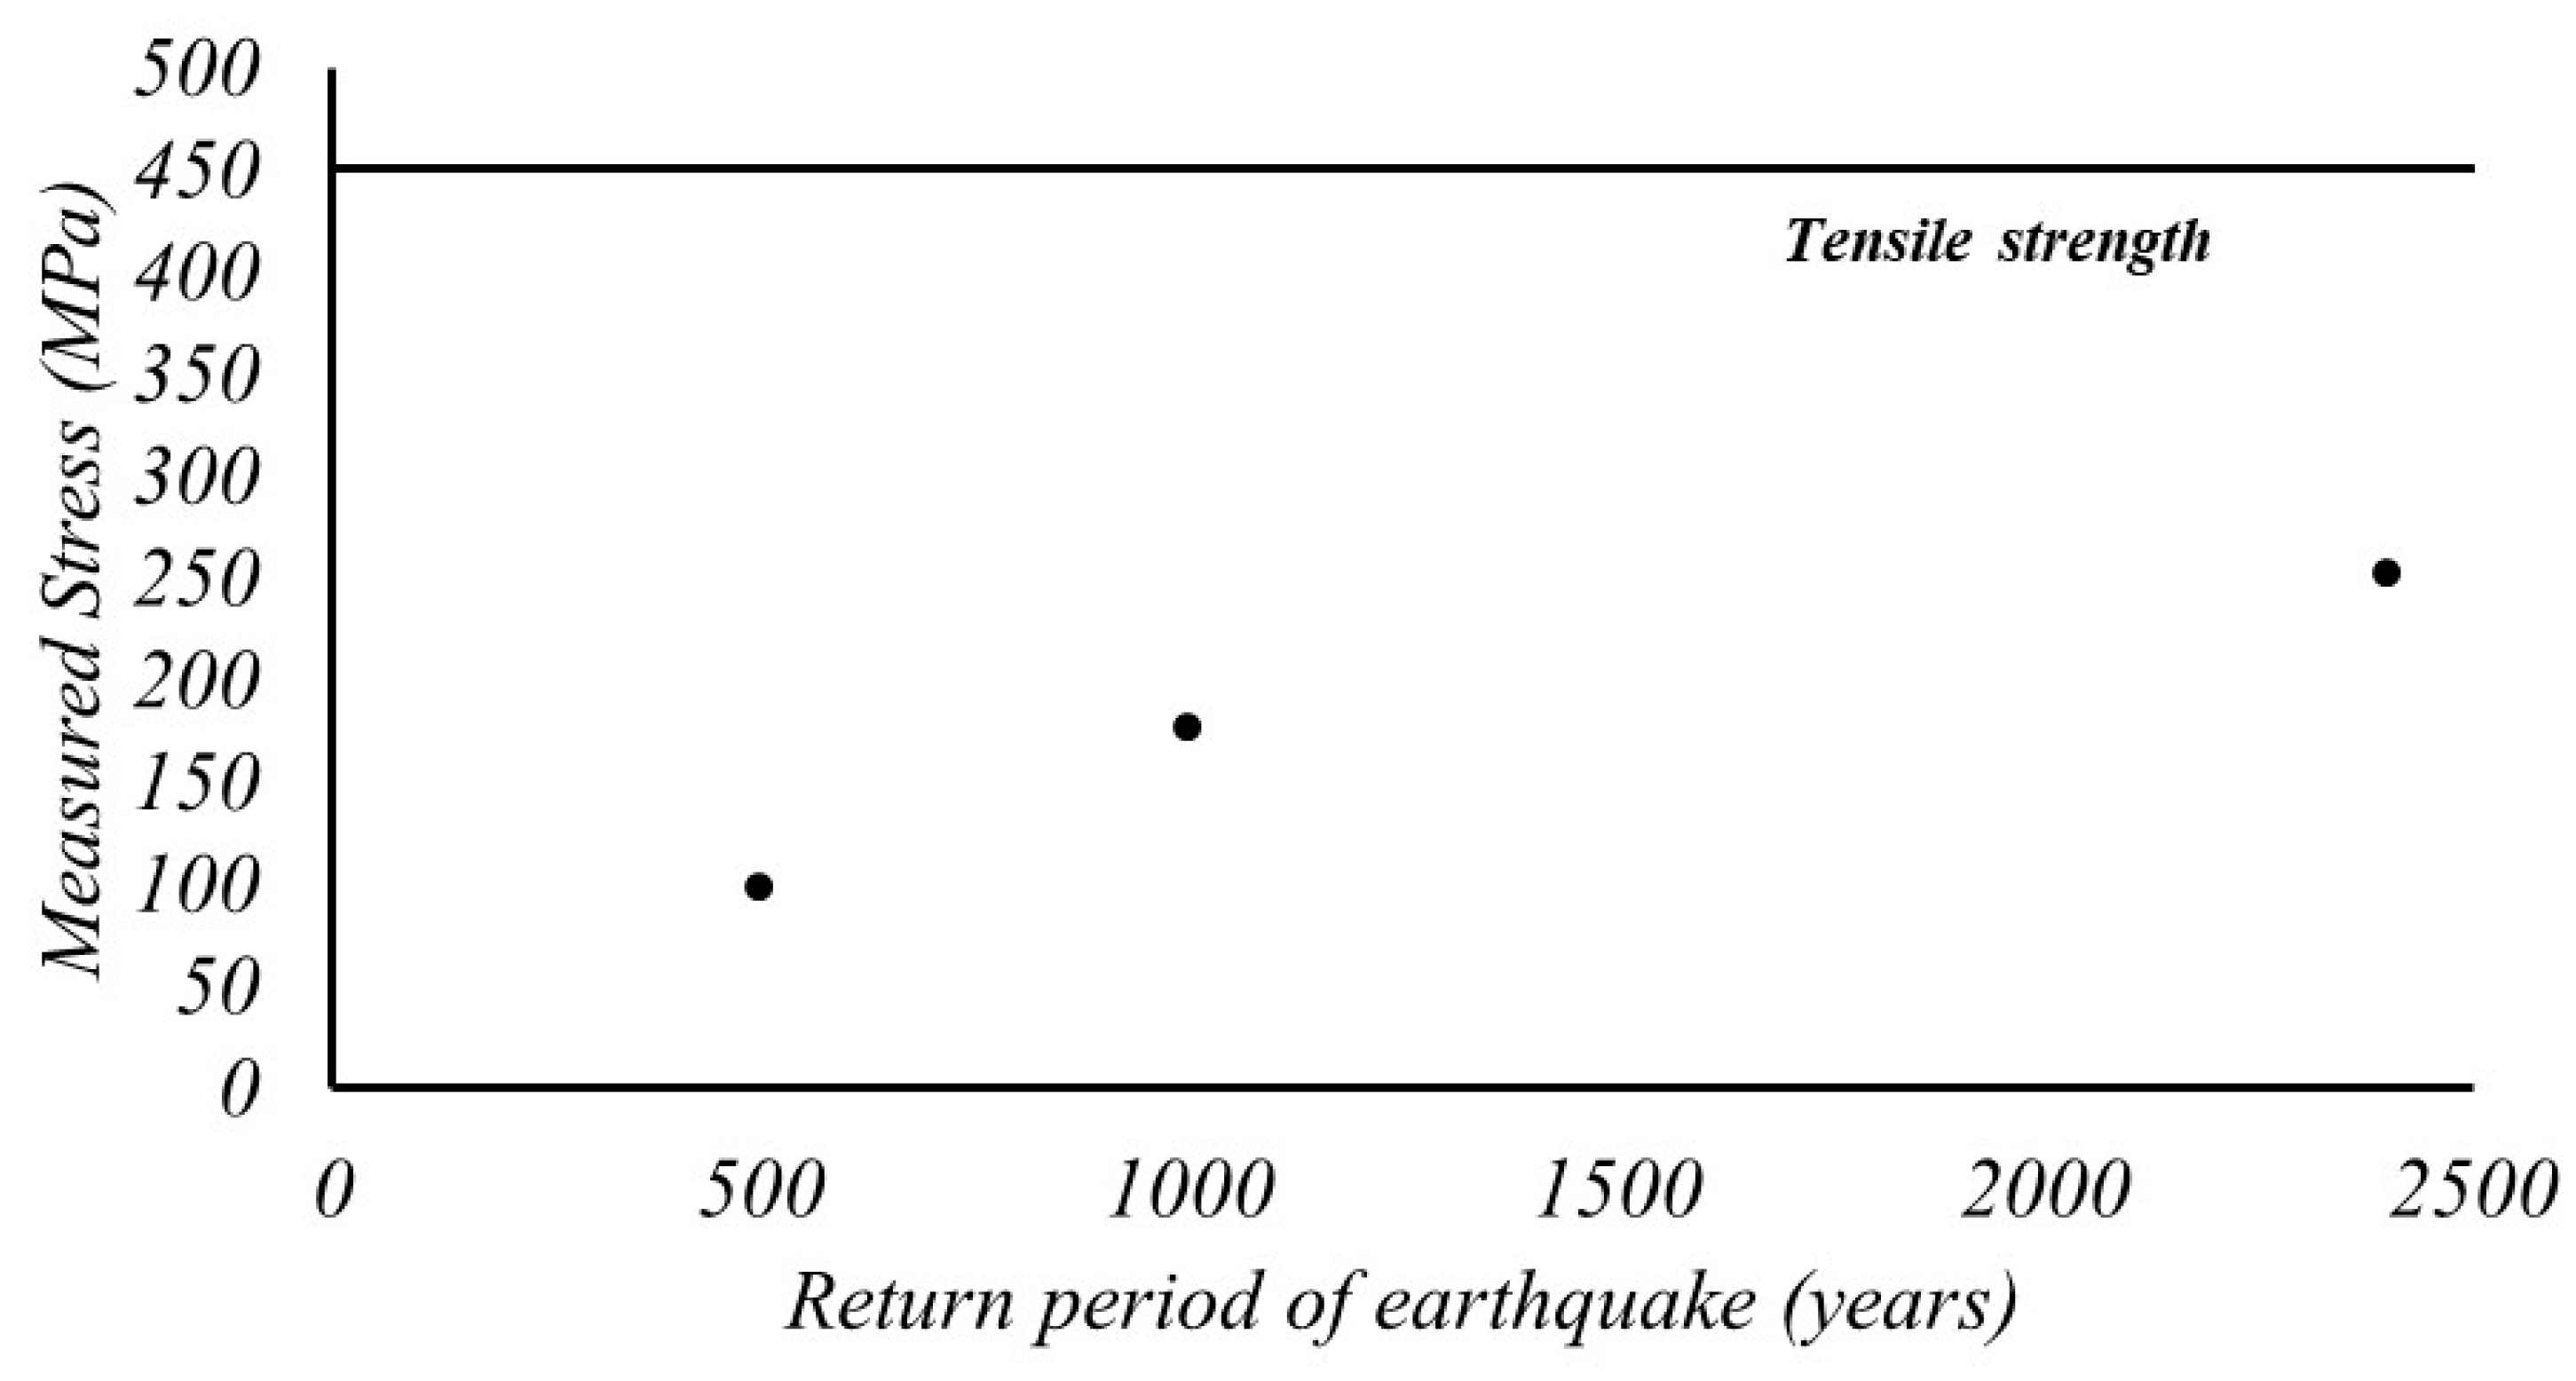
  • In seismic scenarios, the peak displacement and stress experienced by the structure under consideration were 70 mm and 140 MPa, respectively, or lower. These levels are well within the supportive capabilities of the structure’s columns, which are constructed from H-beams known for their relatively high stiffness. Additionally, the inertial forces—critical factors in seismic behavior—are minimized due to the lightweight nature of the acoustic insulation panels and bifacial solar modules. Based on these analytical outcomes, the structure is adjudged to possess adequate seismic resilience, capable of withstanding both the 2400-year and 1000-year return period earthquakes. The latter aligns with the first-grade collapse prevention criteria in domestic seismic design standards.
  • Although the overall structure showed adequate seismic resilience, the bifacial solar modules emerged as potential weak points, vulnerable to damage from seismic-induced displacement and stress. Subsequent specialized seismic safety evaluations for these solar modules revealed that stress levels exceeding their compressive strength were observed at the apex of the structure, which is the locus of maximal displacement. Consequently, these findings imply that the solar modules within the target structure are at risk of damage during earthquakes that meet or exceed the first-grade collapse prevention criteria, consistent with the seismic design standards for high-speed railways in Korea.
  • The solar modules’ vulnerability stems from their intrinsically low tensile strength, attributable to their construction from tempered glass. Given the anticipated damage arising from seismic-induced displacements, remedial engineering measures are warranted. These could encompass strategies such as reducing the distance to the neutral axis or enhancing the overall structural stiffness to mitigate the risk of damage.
  • In the case of the newly developed double-sided solar sound barrier structure, the power required by the railway structure is generated in the immediate vicinity of the railway facility, which is an economically and environmentally efficient structure with high energy saving efficiency. It also has the advantage of utilizing the existing sound barrier site and not requiring additional space. If complementary measures are taken to ensure seismic safety, it is judged that it will be highly utilized as an eco-friendly and economical structure.

Author Contributions

Conceptualization, M.Y. and J.K.; methodology, S.Y.K.; software, S.Y.K.; writing—original draft preparation, S.Y.K. and J.K.; writing—review and editing, M.Y.; supervision, M.Y. All authors have read and agreed to the published version of the manuscript.

Funding

This research is based on the findings of the research work “Review of Environmental Impact Assessment”(RE2023-19) funded by Korea Environment Institute (KEI) and the KICT Research Program (Project No. 20230405-001, Development of earthquake risk management model by utilizing performance based maintenance technology based on asset management).

Data Availability Statement

Data is contained within the article.

Conflicts of Interest

The authors declare no conflict of interest.

References

  1. Directorate—General for Energy. Technical Assistance in Realisation of the 4th Report on Progress of Renewable Energy in the EU; ECOFYS: Utrecht, The Netherlands, 2019. [Google Scholar]
  2. Kang, M. Green New Deal: Korea; BOOKK: Seoul, Republic of Korea, 2020. [Google Scholar]
  3. Choi, J. Proposal on future domestic use of solar roads. J. Korean Asph. Inst. 2021, 11, 323–330. [Google Scholar]
  4. Japan for Sustainability. Japanese Railway Company to Build a Mega Solar Power Plant in Rail Yard; Japan for Sustainability: Tokyo, Japan, 2013. [Google Scholar]
  5. Lim, H. Demonstration of solar power suitable for railway for noise reduction and carbon neutrality. J. Korean Soc. Urban Adm. 2022, 1, 20–25. [Google Scholar]
  6. MOLIT. Planning and Research on Establishing a System to Advance Earthquake-Resistant Technology for Railway Infrastructure; Ministry of Land, Infrastructure and Transport: Sejong, Republic of Korea, 2012.
  7. KR C-02060; Mainline Units and Safety Facilities. Korea Rail Network Authority: Daejeon, Republic of Korea, 2017.
  8. Jin, J.; Zhu, C.; Wu, R.; Liu, Y.; Li, M. Comparative noise reduction effect of sound barrier based on statistical energy analysis. J. Comput. Methods Sci. Eng. 2021, 21, 737–745. [Google Scholar] [CrossRef]
  9. Liu, G.; Wang, R.; Liu, X.; Li, S.; Tong, C. Simulation Analysis on Noise Reduction Effect of Sound Barriers with Different Geometric Shapes for High-Speed Train. IOP Conf. Ser. Mater. Sci. Eng. 2019, 612, 052038. [Google Scholar] [CrossRef]
  10. Liu, Y.; Yang, B.; Zhang, X.P.; Zhong, Z.F.; Dong, H.X.; Sun, H.Y. Test and Analysis of Noise Reduction Effect for Different Heights and Distances of Sound Barrier. Adv. Mater. Res. 2011, 243–249, 4447–4450. [Google Scholar] [CrossRef]
  11. Reiter, P.; Wehr, R.; Ziegelwanger, H. Simulation and measurement of noise barrier sound-reflection properties. Appl. Acoust. 2017, 123, 133–142. [Google Scholar] [CrossRef]
  12. Sousa, L.; Pereira, L.; Montes-González, D.; Ramos, D.; Amado-Mendes, P.; Barrigón-Morillas, J.M.; Godinho, L. Experimental Analysis and Simulation of a Porous Absorbing Layer for Noise Barriers. Appl. Sci. 2023, 13, 2638. [Google Scholar] [CrossRef]
  13. Zhang, X.; Liu, R.; Cao, Z.; Wang, X.; Li, X. Acoustic performance of a semi-closed noise barrier installed on a high-speed railway bridge: Measurement and analysis considering actual service conditions. Measurement 2019, 138, 386–399. [Google Scholar] [CrossRef]
  14. Nusairat, J.; Liang, R.Y.; Engel, R.; Hanneman, D.; Abu-Hejleh, N.; Yang, K. Drilled Shaft Design for Sound Barrier Walls, Signs, and Signals; Report. No. CDOT-DTD-R-2004; Colorado Department of Transportation: Denver, CO, USA, 2004; Volume 8.
  15. Do Kim, S.; Jung, W.Y. Wind Fragility for Soundproof Wall with the Variation of Section Shape of Frame. Int. J. Civ. Environ. Eng. 2017, 11, 1551–1557. [Google Scholar] [CrossRef]
  16. Ali, T.; Lee, J.; Kim, R.E. Machine learning tool to assess the earthquake structural safety of systems designed for wind: In application of noise barriers. Earthq. Struct. 2022, 23, 315–328. [Google Scholar]
  17. Tursunkululy, T.; Zhangabay, N.; Avramov, K.; Chernobryvko, M.; Kambarov, M.; Abildabekov, A.; Narikov, K.; Azatkulov, O. Oscillation frequencies of the reinforced wall of a steel vertical cylindrical tank for petroleum products depending on winding pretension. East.-Eur. J. Enterp. Technol. 2023, 3, 14–25. [Google Scholar] [CrossRef]
  18. Tursunkululy, T.; Zhangabay, N.; Suleimenov, U.; Abshenov, K.; Utelbayeva, A.; Moldagaliyev, A.; Kolesnikov, A.; Turashova, Z.; Karshyga, G.; Kozlov, P. Analysis of strength and eigenfrequencies of a steel vertical cylindrical tank without liquid, reinforced by a plain composite thread. Case Stud. Constr. Mater. 2023, 18, e02019. [Google Scholar] [CrossRef]
  19. Kwon, S.Y.; Yoo, M.; Hong, S. Earthquake Risk Assessment of Underground Railway Station by Fragility Analysis Based on Numerical Simulation. Geomech. Eng. 2020, 21, 143–152. [Google Scholar] [CrossRef]
  20. Yoo, M.; Kwon, S.Y.; Hong, S. Dynamic Response Evaluation of Deep Underground Structures Based on Numerical Simulation. Geomech. Eng. 2022, 29, 269–279. [Google Scholar] [CrossRef]
  21. Kwon, S.Y.; Yoo, M. A Study on the Dynamic Behavior of a Vertical Tunnel Shaft Embedded in Liquefiable Ground during Earthquakes. Appl. Sci. 2021, 11, 1560. [Google Scholar] [CrossRef]
  22. Ji, Y.; Kim, B.; Kim, K. Evaluation of liquefaction potentials based on shear wave velocities in Pohang City, South Korea. Int. J. Geo-Eng. 2021, 12, 1–10. [Google Scholar] [CrossRef]
  23. Yun, J.-W.; Han, J.-T. Dynamic behavior of pile-supported wharves by slope failure during earthquake via centrifuge tests. Int. J. Geo-Eng. 2021, 12, 1–11. [Google Scholar] [CrossRef]
  24. Nguyen, A.-D.; Nguyen, V.-T.; Kim, Y.-S. Finite element analysis on dynamic behavior of sheet pile quay wall dredged and improved seaside subsoil using cement deep mixing. Int. J. Geo-Eng. 2023, 14, 1–18. [Google Scholar] [CrossRef]
  25. MOLIT. Korea Seismic Design, General; KDS 17 00 00:2018; Ministry of Land, Infrastructure and Transport: Sejong, Republic of Korea, 2018.
  26. Itasca Consulting Group. FLAC3D (Fast Lagrangian Analysis of Continua in 3Dimensions) User’s Guide; Itasca Consulting Group: Minnesota, MN, USA, 2006. [Google Scholar]
  27. Sun, C.-G.; Cho, C.-S.; Son, M.; Shin, J.S. Correlations Between Shear Wave Velocity and In-Situ Penetration Test Results for Korean Soil Deposits. Pure Appl. Geophys. 2013, 170, 271–281. [Google Scholar] [CrossRef]
  28. Bowles, E.B. Foundation Analysis and Design, 2nd ed.; McGraw-Hill Book Company: New York, NY, USA, 1977. [Google Scholar]
  29. Seed, H.B.; Idriss, I.M. Soil Moduli and Damping Factors for Dynamic Response Analysis; Report No. EERC 70-10; Earthquake Engineering Research Center, University of California: Berkeley, CA, USA, 1970. [Google Scholar]
  30. Schnabel, P.B.; Lysmer, J.; Seed, H.B. SHAKE: A Computer Program for Earthquake Response Analysis of Horizontally Layered Sites; Report No. EERC 72-12; Earthquake Engineering Research Center, University of California: Berkeley, CA, USA, 1972. [Google Scholar]
  31. Qiao, Q.; Li, J.; Mou, B. Compressive behavior of bolted built-up H-section column using high-strength steel. Thin-Walled Struct. 2022, 171, 108818. [Google Scholar] [CrossRef]
  32. Ministry of Land, Infrastructure and Transport. Soundproof Wall; KCS 44 80 05; Ministry of Land, Infrastructure and Transport: Sejong, Republic of Korea, 2023.
  33. ASTM C1048-12; Standard Specification for Heat-Strengthened and Fully Tempered Flat Glass. ASTM International: West Conshohocken, PA, USA, 2012.
  34. Japan Road Association. Specifications for Highway Bridges, V Seismic Design; Japan Road Association: Tokyo, Japan, 2012. [Google Scholar]
  35. European Commision. Eurocode 8: Design for Structures for Earthquake Resistance; European Commission: Brussels, Belgium, 1998. [Google Scholar]
Figure 1. Schematic drawing of sound barrier wall structure: (a) Existing sound barrier wall structure; (b) Double-sided solar-module-integrated sound barrier wall structure.
Buildings 13 03075 g001
Figure 2. Numerical analysis model for double-sided solar-module-integrated sound barrier wall structure: (a) Double-sided solar-module-integrated sound barrier wall structure; (b) Existing sound barrier wall structure.
Buildings 13 03075 g002
Figure 3. Boring log of site response analysis.
Buildings 13 03075 g003
Figure 4. Site response analysis results: (a) Pohang Earthquake, (b) Hachinohe Earthquake.
Buildings 13 03075 g004
Figure 5. Acceleration time history at the top of the sound barrier wall structures: (a) Case 1, (b) Case 2, (c) Case 3.
Buildings 13 03075 g005aBuildings 13 03075 g005b
Figure 6. Displacement time history at the top of the sound barrier wall structure: (a) Case 1, (b) Case 2, (c) Case 3.
Buildings 13 03075 g006
Figure 7. Comparison between measured stress and compression tensile stress for the existing sound barrier structure.
Buildings 13 03075 g007
Figure 8. Comparison between measured stress and tensile strength for the double-sided solar-module-integrated sound barrier wall structure.
Buildings 13 03075 g008
Table 1. Input properties for numerical modeling.
H Beam ColumnSound-Absorbing Soundproofing PlateDouble-Sided Solar Module
Actual PropertiesModeling PropertiesActual PropertiesModeling PropertiesActual PropertiesModeling Properties
I (mm4)4.6 × 1071.3 × 1083.2 × 1072.7 × 1096.8 × 1052.7 × 109
E (kPa)210,000,00072,615,218200,000,0002,419,82570,000,00017,885
Density (kg/m3)7850595150130
Table 2. Input properties for site response analysis.
Depth (m)SPT-NUnit Weight (kN/m3)Vs (m/s)
0.5012.0016.2181.2
1.008.0014.7159.2
1.506.0014.0145.2
2.008.0014.7159.2
2.5036.0019.0257.2
3.0040.0019.4266.0
Table 3. Ground motion in the Korean seismic design code [25].
Seismic Zone Factor I (Z)hazard Factor (I) for Each Return Period
500 Years1000 Years2400 Years
0.1111.42.0
Table 4. Site response analysis results.
Return Period of Earthquake (Year)Input Acc. (g)Site Response Analysis Results
Pohang Earthquake (1)Hachinohe Earthquake (2)
5000.110.2530.185
10000.1540.3360.242
24000.220.4350.356
(1) Pohang earthquake utilized for Case No. 1 and 2 in Section 2.4; (2) Hachinohe earthquake utilized for Case No. 3 in Section 2.4.
Table 5. Dynamic analysis cases.
Case No.StructureInput EarthquakeInput Acceleration
1Existing sound barrier structurePohang Earthquake (1)0.253 g, 0.336 g, 0.435 g
2Double-sided solar-module-integrated sound barrier wall structurePohang Earthquake (1)0.253 g, 0.336 g, 0.435 g
3Double-sided solar-module-integrated sound barrier wall structureHachinohe earthquake (2)0.185 g, 0.242 g, 0.356 g
(1) Site response analysis results for Pohang earthquake in Table 4. (2) Site response analysis results for Hachinohe earthquake in Table 4.
Table 6. Acceleration results from numerical analysis.
Case No.Return Period of Earthquake (Year)Input Acc. from Site Response Analysis (g)Measured Acc. at the Top of Sound Barrier Structure (g)Amplification Ratio
15000.2530.2791.102
10000.3400.3701.088
24000.4350.4701.080
25000.2530.2751.087
10000.3400.3671.079
24000.4350.4651.069
35000.1850.1981.070
10000.2420.2571.062
24000.3560.3711.042
Table 7. Displacement and maximum stress from numerical analysis.
Case No.Return Period of Earthquake (Year)Maximum Displacement (mm)Maximum Stress (MPa)Yield Stress of H-beam (MPa) [31]
Case 150010.2620.68773
100014.3328.89
240020.4641.25
Case 250010.0820.32
100014.1328.49
240020.0240.80
Case 350034.9370.42
100048.9898.74
240070.17141.46
Table 8. Load capacity rating according to wind speed by region (KCS 44 80 05: Soundproof wall, 2023, Ministry of Land, Infrastructure, and Transport).
AreaWind Speed
(m/s)
Design Load
(kPa)
Test Load
(kPa)
Load Capacity Rating
Inland301.21.6No. 5
West Coast351.72.2No. 4
West-South coast
South Coast
East-South coast
402.22.9No. 3
East coast
Jeju Area
Special Area
452.83.6No. 2
Other areas503.44.4No. 1
Table 9. Measured maximum stress and tensile stress at the module for the sound barrier wall structure.
Case No.Return Period of Earthquake (Year)Maximum Displacement (mm)Maximum Stress (MPa)Tensile Strength of Double-Sided Solar Module (MPa) [33]
Case 150010.2698.496450
100014.33137.568
240020.46196.416
Case 250010.0833.8745
100014.1347.48
240020.0268.01
Case 350034.93117.3648
100048.98164.5728
240070.17235.7712
Disclaimer/Publisher’s Note: The statements, opinions and data contained in all publications are solely those of the individual author(s) and contributor(s) and not of MDPI and/or the editor(s). MDPI and/or the editor(s) disclaim responsibility for any injury to people or property resulting from any ideas, methods, instructions or products referred to in the content.

