Article

Study on the Modification Effect and Mechanism of a Compound Mineral Additive and Basalt Fiber on Coal Gangue Concrete

1
School of Architecture and Civil Engineering, Xi’an University of Science and Technology, No. 58 Yanta Rd., Xi’an 710054, China
2
Power China Northwest Engineering Corporation Limited, No. 18 East Zhangba Rd., Xi’an 710065, China
*
Author to whom correspondence should be addressed.
Buildings 2023, 13(11), 2756; https://doi.org/10.3390/buildings13112756
Submission received: 25 September 2023 / Revised: 26 October 2023 / Accepted: 27 October 2023 / Published: 31 October 2023

Abstract

:
Compared with ordinary concrete, coal gangue concrete (CGC) is limited by its poor mechanical properties and frost resistance, which seriously restricts its wide application in cold regions. In order to improve the resource utilization rate of coal gangue, this paper takes advantage of the ‘overlapping effect’, ‘micro-aggregate filling effect’ and ‘volcanic ash effect’ of fly ash (FA) and silica fume (SF) and the anti-cracking effect of basalt fiber (BF) to study their effects on the macro performance of CGC and the micro modification mechanism. Modified CGC was prepared by replacing cement with 20% total mineral additives and adding BF. Taking different fly ash and silica fume incorporation ratios (F/S) and the BF content as variables, the research was carried out from two scales of macro performance and microstructure. The results show that the mechanical properties and frost resistance of CGC can be significantly improved by adding mineral additives and BF, and the modification effect is better with a decrease in F/S. When F/S = 1, the compressive strength, splitting tensile strength and flexural strength of the specimens increased by 13.73%, 8.37% and 4.27%, respectively. After 300 freeze–thaw cycles, the specimen was still not damaged by freezing and thawing. At the same time, keeping F/S = 3 unchanged and changing the BF content, it was found that the optimal content of BF was 0.15 vol% under the combined action of BF, FA and SF. In terms of microstructure, the addition of mineral additives and BF segregates and fills the macropores in the structure, greatly reducing the harmful pores and turning them into harmless and less harmful pores. When F/S = 1, the number of multi-harmful pores decreased by 16.89%, and the number of harmless pores and less harmful pores increased by 9.19%, which greatly optimized the pore structure and pore gradation.

1. Introduction

Coal gangue is a sedimentary rock material associated with coal seams in the process of coal mining and coal washing. Because of its low carbon content and poor strength, it has become one of the largest industrial solid wastes in China [1], and the annual output is as high as more than 700 million tons [2]. Heavy metal elements such as Pb, Sn and As released by large accumulations of it have seriously polluted the water and soil. At present, the preparation of CGC by replacing coarse aggregate with coal gangue is an effective way to utilize this resource. FA is the main solid waste discharged from thermal power plants. As early as 2020, China’s FA emissions exceeded 600 million tons [3], and it has become one of the largest industrial waste residues in China. SF is a ball-shaped dust produced by the condensation and precipitation of highly volatile SiO2 and Si gas discharged from electric furnaces during the smelting of ferrosilicon, and it is a PM2.5 pollutant. In terms of ecological and economic benefits, the wide application of cement has played a vital role in the development of China’s construction industry, but its production is a process of high energy consumption and high pollution. Both FA and SF have volcanic ash activity and can be used as concrete additives, turning waste into treasure, reducing the amount of cement needed and improving concrete performance [4,5]. In contrast, BF is made of natural basalt after high temperature melting and pulled by platinum rhodium alloy. Because of its production process waste less and its own waste can be directly degraded, so it is known as a real “green industrial materials”, but also China’s current production of the largest inor-ganic high-performance fibres. Therefore, the inclusion of FA, SF and BF in the preparation process of CGC can not only maximize the utilization of solid waste resources, reduce the amount of cement and natural stone and make concrete green, but can also meet performance requirements, broaden the application market of CGC and promote the implementation of China’s ‘Carbon Peaking and Carbon Neutrality’ strategy.
At present, due to the large crushing index of coal gangue and the loose aggregate structure, the application of CGC has certain limitations [6,7,8,9]. The research results of many scholars such as Guan, Su and so on [10,11,12,13] show that with the increase in coal gangue content, the compressive strength of CGC gradually decreases. When the content reaches 50–60%, the compressive strength decreases rapidly. Therefore, many scholars have turned to study methods to improve the performance of CGC. At present, there are two main modification methods for concrete: one is to add fiber to play a crack resistance role, and the second is to add mineral additives and use their inherent active ingredients to modify the cement base [14,15]. For example, Jiao et al. [16] found that a content of BF not higher than 1% can significantly improve the mechanical properties of recycled aggregate concrete. Yao et al. [17] also carried out similar research based on recycled concrete. The results show that fiber can significantly improve the flexural and tensile strength of recycled concrete, but has little effect on compressive strength. At the same time, the related literature [18,19,20,21] shows that the addition of fiber also results in a certain improvement in the strength of CGC, and that there is an optimal content of fiber. Qiu et al. [22,23] found that the incorporation of 30% FA could optimize the ITZ and mechanical properties of CGC, and the compressive strength, splitting tensile strength and bending strength increased by 5.77%, 1.04% and 2.62%, respectively. Yun et al. [24] prepared high-performance CGC by replacing cement with mineral additives. The results showed that 10% coal gangue, 15% slag, 15% FA and 10% SF had excellent strength. In addition, some scholars have also studied the effect of two modification methods on the mechanical strength of concrete under the combined action of two modification methods. For example, Zhang et al. [25] used the orthogonal test method to test the strength of steel fiber fly ash recycled concrete. The results showed that the influence of the FA substitution rate on the compressive and flexural strength of recycled concrete was consistent, and the substitution rate of fly ash had the greatest influence on the compressive strength. Xin et al. [26] also made a similar test, and suggested that on the basis of 85% recycled concrete aggregate and 15% red brick aggregate, the combination of 10% fly ash content and 6 kg/m3 polypropylene fiber was the optimal mix ratio. Li [27] explored the influence of factors such as fly ash content, coal gangue content and glass fiber content on the performance of CGC. Yang et al. [28] found that there was an optimal dosage of fiber by adding different fibers with different dosages, and then adding mineral additives. The results showed that when the ratio of fly ash and mineral powder was 1:2, the CGC had the best mechanical properties.
It can be found that the above research was based on a single modification method or a combination of multiple fibers and multiple mineral additives. There are few studies on the simultaneous action of various modification methods on CGC, and the research methods and research objects are novel. In addition, most of the previous studies have focused on the macroscopic mechanical properties of modified CGC, but there are few studies on the analysis of frost resistance and the exploration of microscopic mechanisms. The research results are novel. Therefore, based on the previous research, this paper will introduce the principle of the ‘overlapping effect’ of composite materials proposed by the academician Wu [29] into CGC. The mechanical strength test and freeze–thaw cycle test were carried out to analyze the modification effect of CGC with different S/F and BF contents. Nuclear magnetic resonance (NMR) and scanning electron microscopy (SEM-EDS) were used to explore its internal modification mechanism. This can provide a theoretical basis for the use of CGC in cold regions of northern China and has engineering application value.

2. Materials and Methods

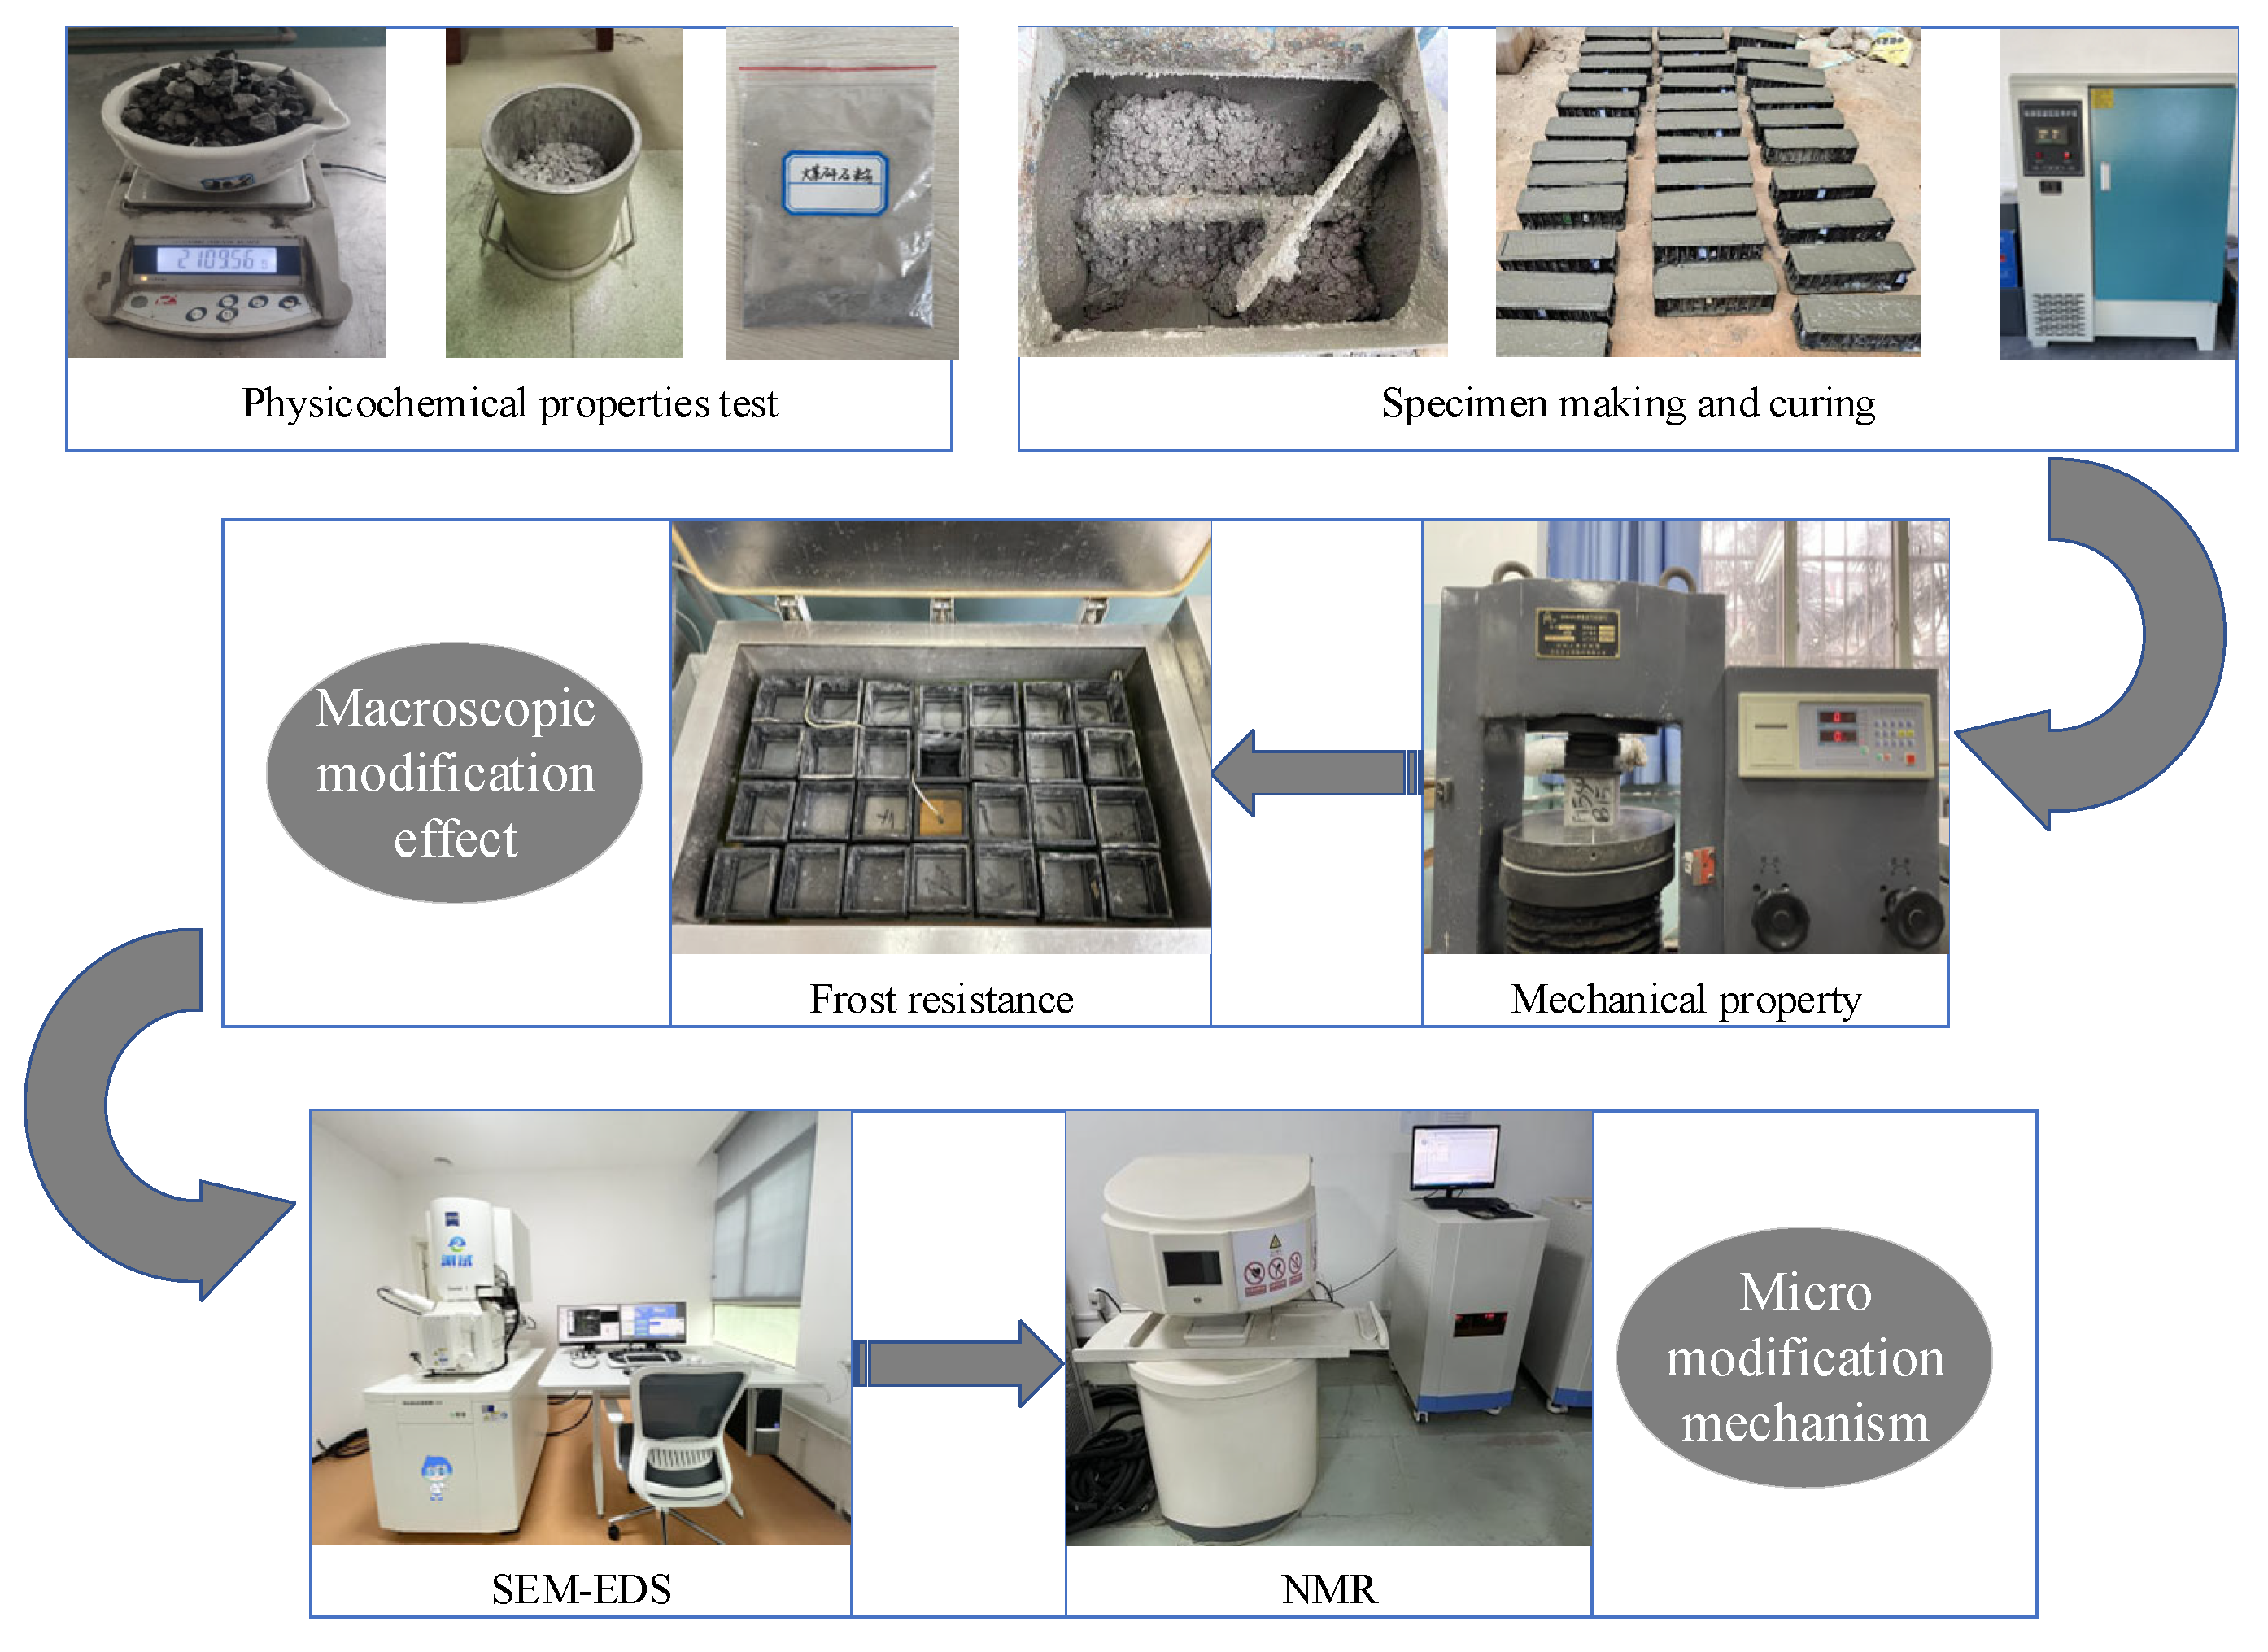
2.1. Experimental Research Plan
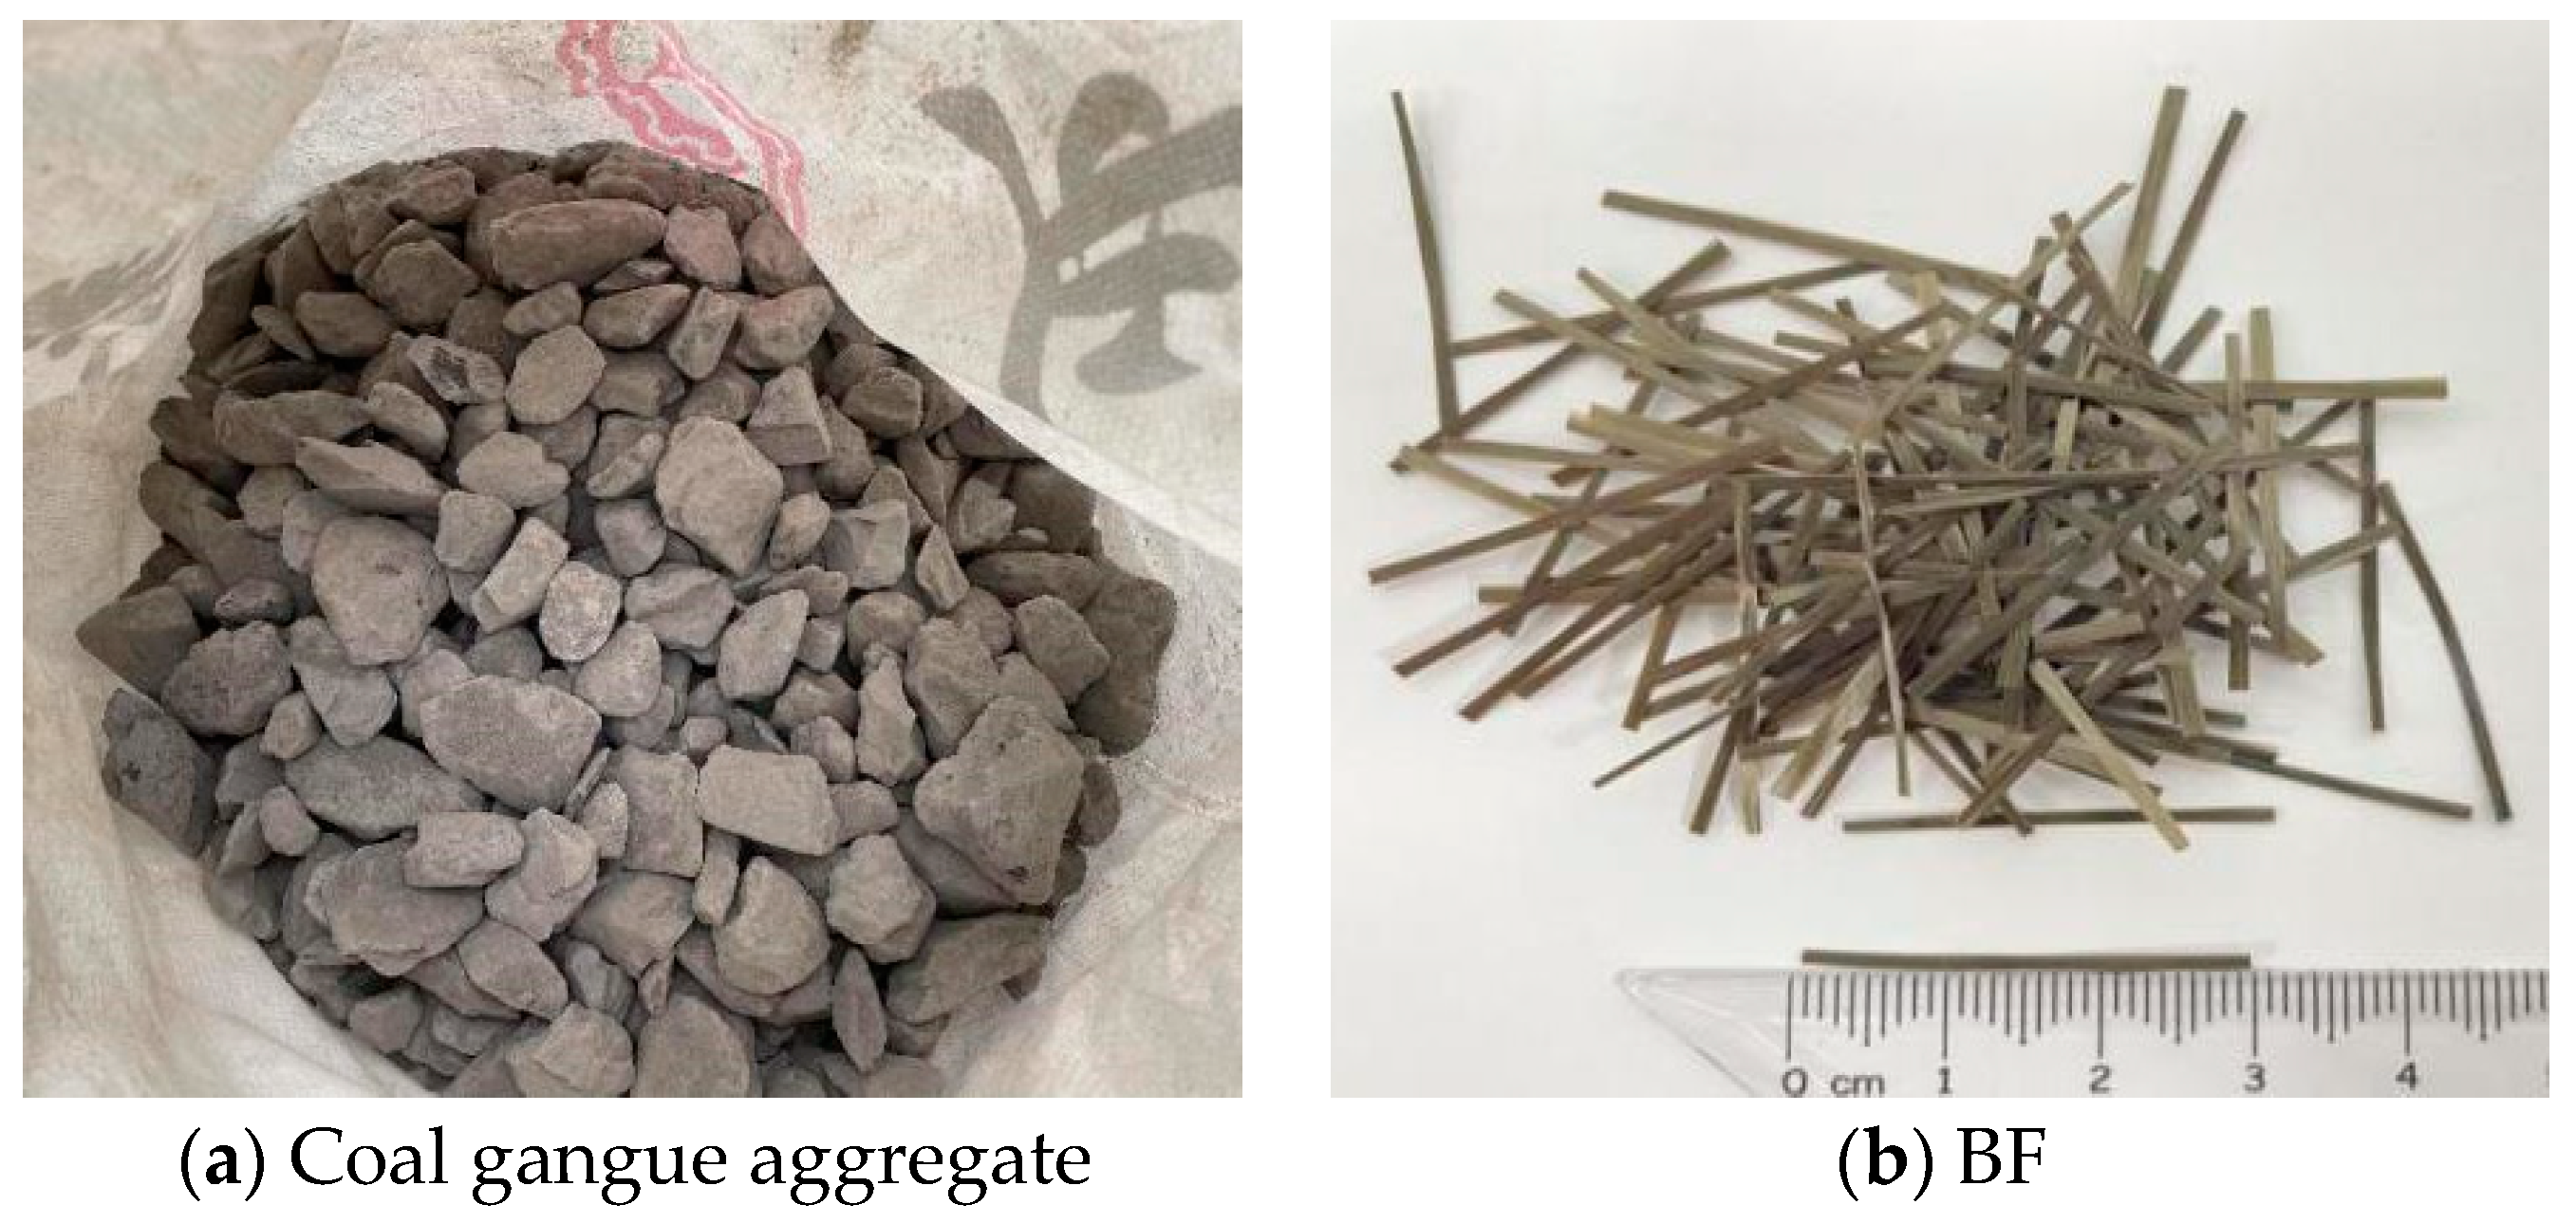
In this paper, according to the experimental research plan shown in Figure 1, the macro and micro material properties of modified CGC under the combined action of mineral additives and BF were studied and analyzed. The research idea is mainly based on the combination of macro–micro experiments, supplemented by a variety of test methods and research methods. It mainly includes three kinds of mechanical properties, rapid freeze–thaw, NMR, SEM-EDS, XRD and other tests.

2.2. Raw Materials

The P·O 42.5 ordinary Portland cement produced by Shaanxi Xianyang Liquan Hailuo Cement Co., Ltd., (Xianyang, China), was used. The initial setting time was 85 min, the final setting time was 260 min, the density was 3.08 g/m3 and the specific surface area was 337 m2/kg. The fly ash was produced by Hebei Lingshou County Chuangwei Mineral Products Processing Company (Lingshou, China), with a specific surface area of 362 m2/kg. The silica fume was produced by Hebei Lingshou County Ruida Mining Co., Ltd., (Lingshou, China), with a specific surface area of 2510 m2/kg. The chemical compositions of the cement and mineral additives are shown in Table 1. The fine aggregate was Ba River medium sand, with a fineness modulus of 2.7 and an apparent density of 2670 kg/m3. The coal gangue came from the Daliuta mining area in Yulin, Shaanxi Province. The coal gangue aggregate that was used was broken, washed, screened and produced by Xingliu Industrial Co., Ltd., (Shenmu, China) The gravel was natural gravel. The particle size range of the coarse aggregate used in the test was 5–25 mm, the maximum aggregate grain size was 25 mm, and it had a continuous gradation. The coal coarse aggregate used in the test is shown in Figure 2a, and the aggregate technical indicators are shown in Table 2. The water was tap water. The air-entraining agent was an AOS air-entraining agent. The water reducing agent was a PCA-type carboxylic acid water reducing agent, and the water reducing rate was 25%. The fiber was 30 mm chopped BF produced by Anjie Composite Co., Ltd., (Jiaxing, China). Figure 2b shows the appearance of the fiber, and the performance indicators and chemical composition are shown in Table 3 and Table 4, respectively.

2.3. Mix Proportion

The test mix according to the ‘Ordinary Concrete Mix Design Specification’ (JGJ/55-2011) [30] is shown in Table 5 below. The research results of the research group and relevant scholars show that [31,32,33] the optimal replacement rate of coal gangue is 40%, which has good ecological, social and economic benefits. Secondly, by adding 0.15 vol% BF with a length of 30 mm, the prepared CGC had better macroscopic mechanical properties [18]. Therefore, this paper studies the modification of CGC on this basis. The ‘overlapping effect’ of the composite material was used to explore the modification effect and mechanism of CGC under the combined action of FA, SF and BF. Among them, A is the basic control group, the variable of the BC1, B2 and B3 groups was F/S (F/S = 3, F/S = 2, F/S = 1), and the variable of the BC1, C2 and C3 groups was the content of BF (0.12 vol%, 0.15 vol%, 0.18 vol%).

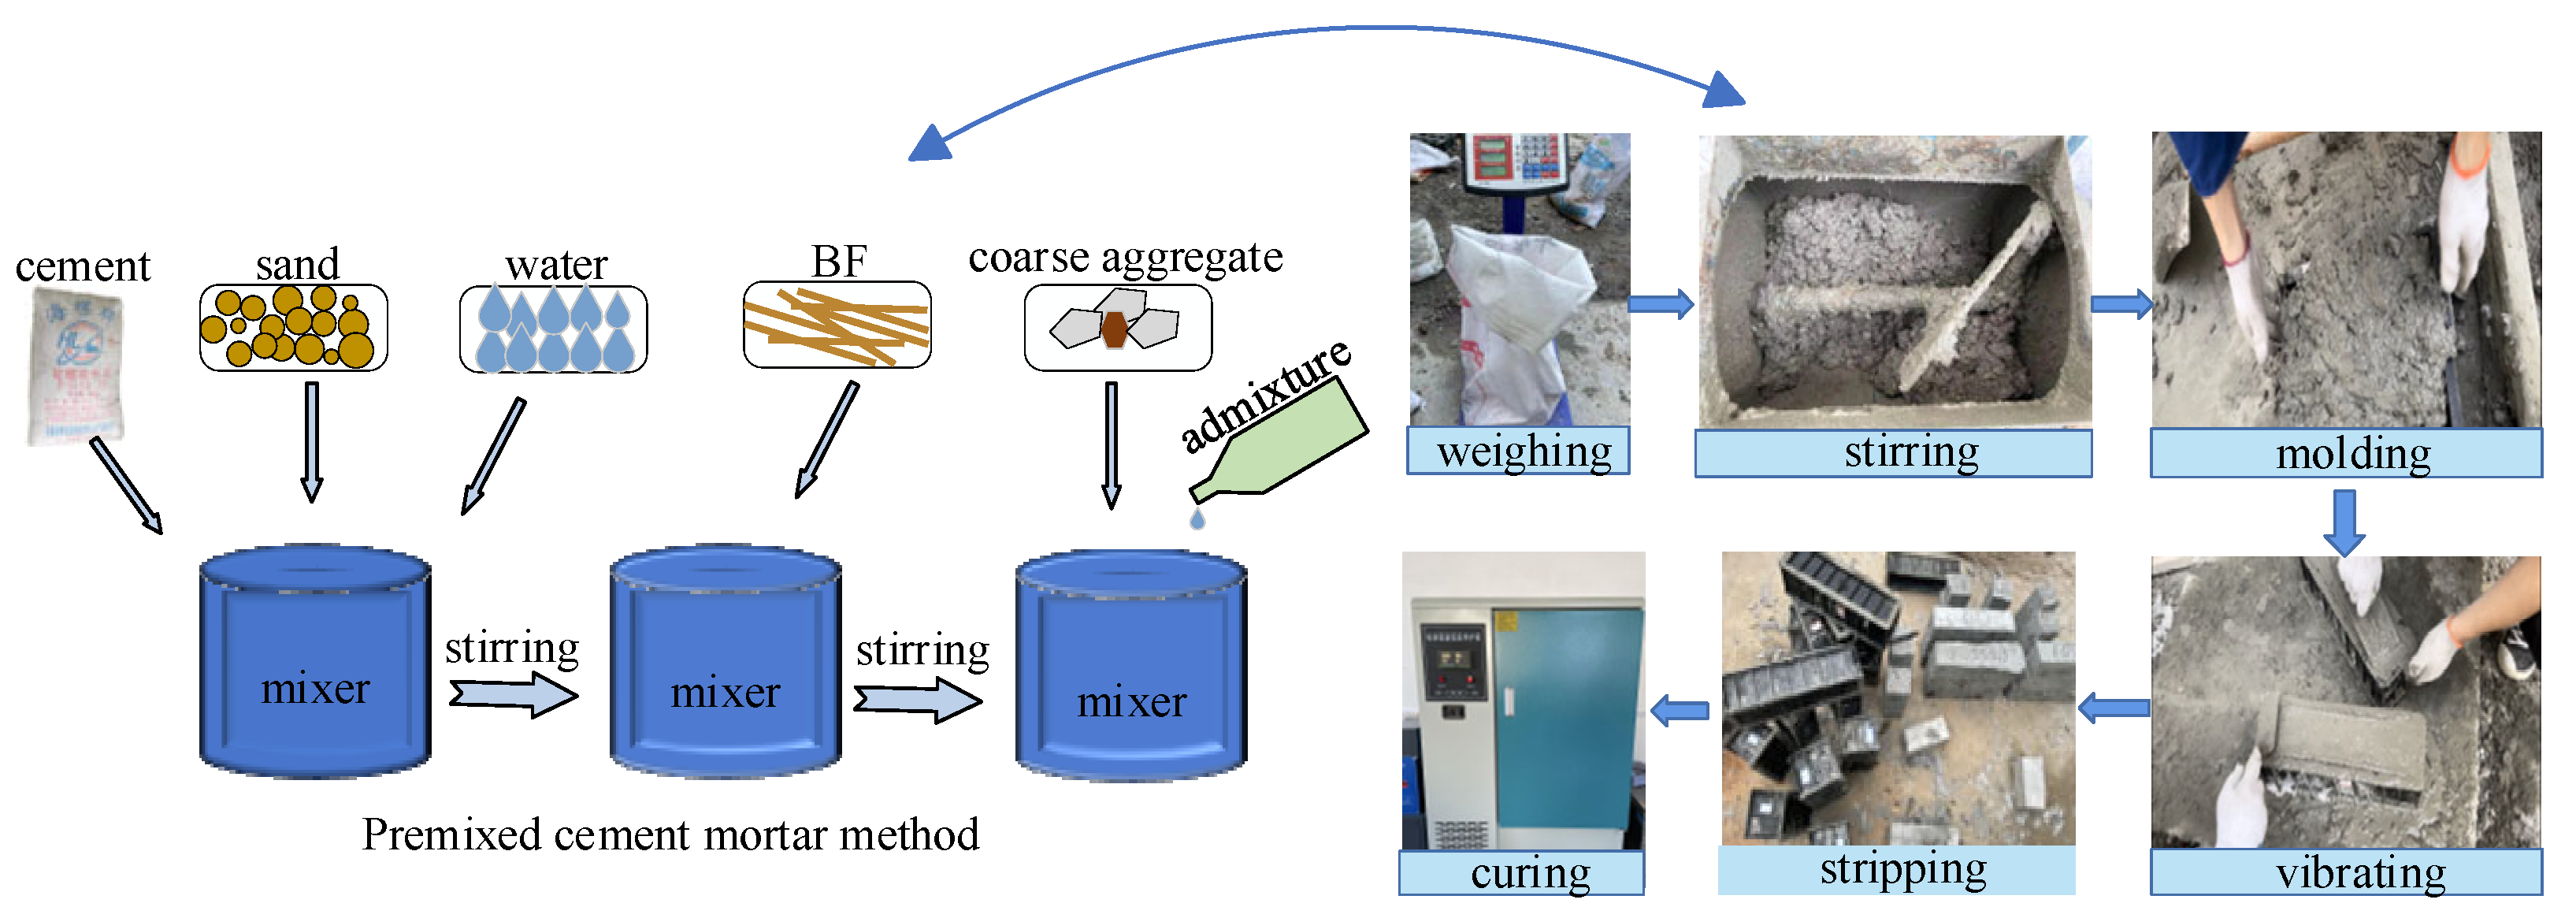
2.4. Specimen Preparation

According to the provisions of the ‘Standard for Performance Test Method of Ordinary Concrete Mixture’ (GB/T50080-2002) [34], the CGC specimens were made using the premixed cement mortar method (mortar wrapped stone method), following the principle of dry mixing first and then wet mixing. Figure 3 is the flow chart of the specimen preparation and the premixed cement mortar method. In addition, the curing temperature of the specimen was 20 °C and the relative humidity was 97%, which met the requirements of the specification (temperature: 20 ± 2 °C; humidity: >95%).

2.5. Main Test Instruments and Methods

2.5.1. Mechanical Properties Test

According to the test method specified in the ‘Standard for Physical and Mechanical Properties of Ordinary Concrete’ (GB/T50081-2019) [35], the compressive strength test was carried out using a TYA-2000 digital display press. The device and test diagram are shown in Figure 4. The loading rate of the compressive strength test was 0.5 MPa/s~0.8 MPa/s. The loading speed of the splitting tensile strength test and flexural strength test was maintained at 0.05 MPa/s~0.08 MPa/s.

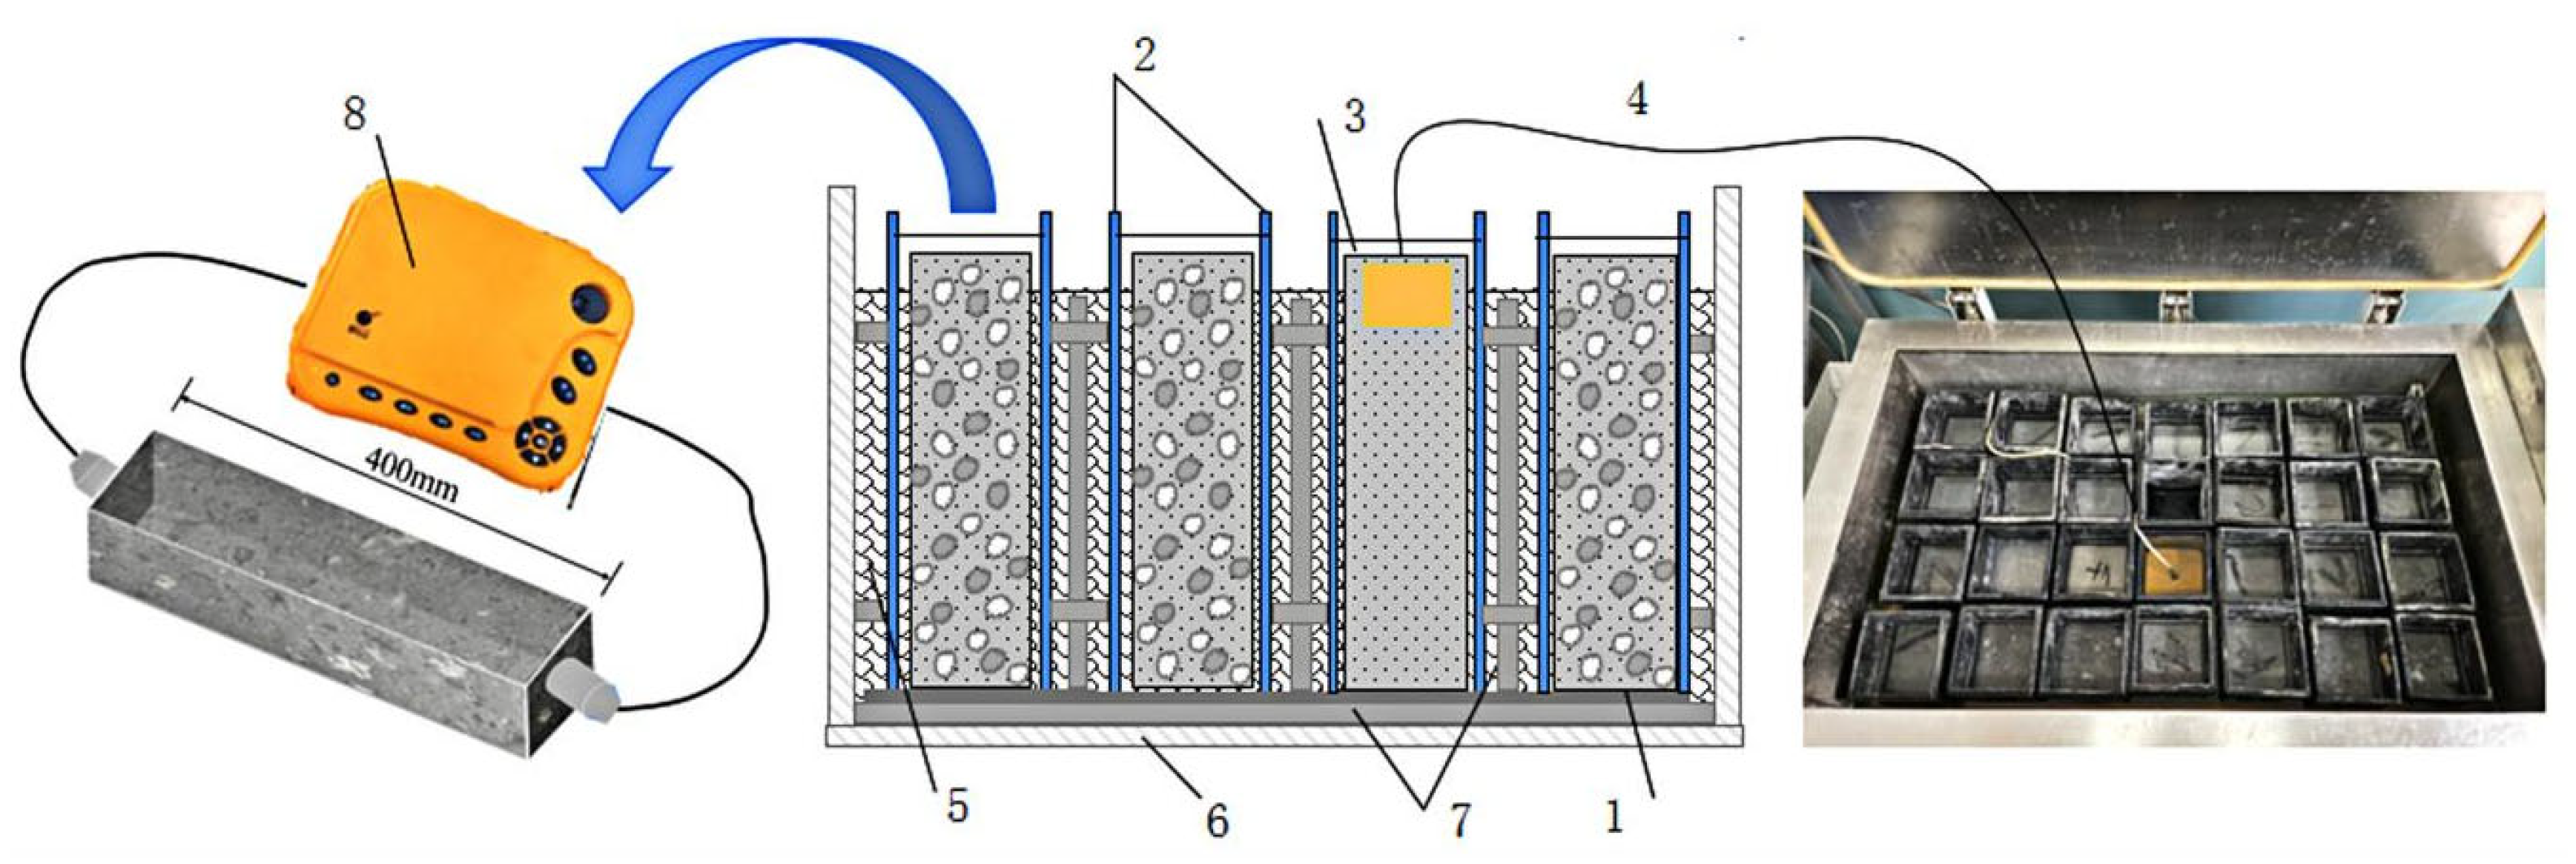
2.5.2. Freeze–Thaw Cycle Test

According to the ‘Ordinary Concrete Long-term Performance and Durability Test Method Standard’ GB/T50082-2009 [36] requirements, the specimen was subject to standard curing for 24 d, immersed in 20 ± 2 °C water for 4 days to make it water saturated, and then subjected to the KDR-V9-type rapid freeze–thaw test machine for the freeze–thaw cycle test. The center temperature of the specimen during freezing and heating was about −18 ± 2 ℃ and 5 ± 2 °C, respectively, and every 25 freeze–thaw cycles constituted a period. When the relative dynamic elastic modulus was less than 60%, the mass loss was more than 5% or the freeze–thaw cycle reached 300 times, the test was stopped. As shown in Figure 5, the relevant test instruments and dynamic elastic modulus detection methods are shown.

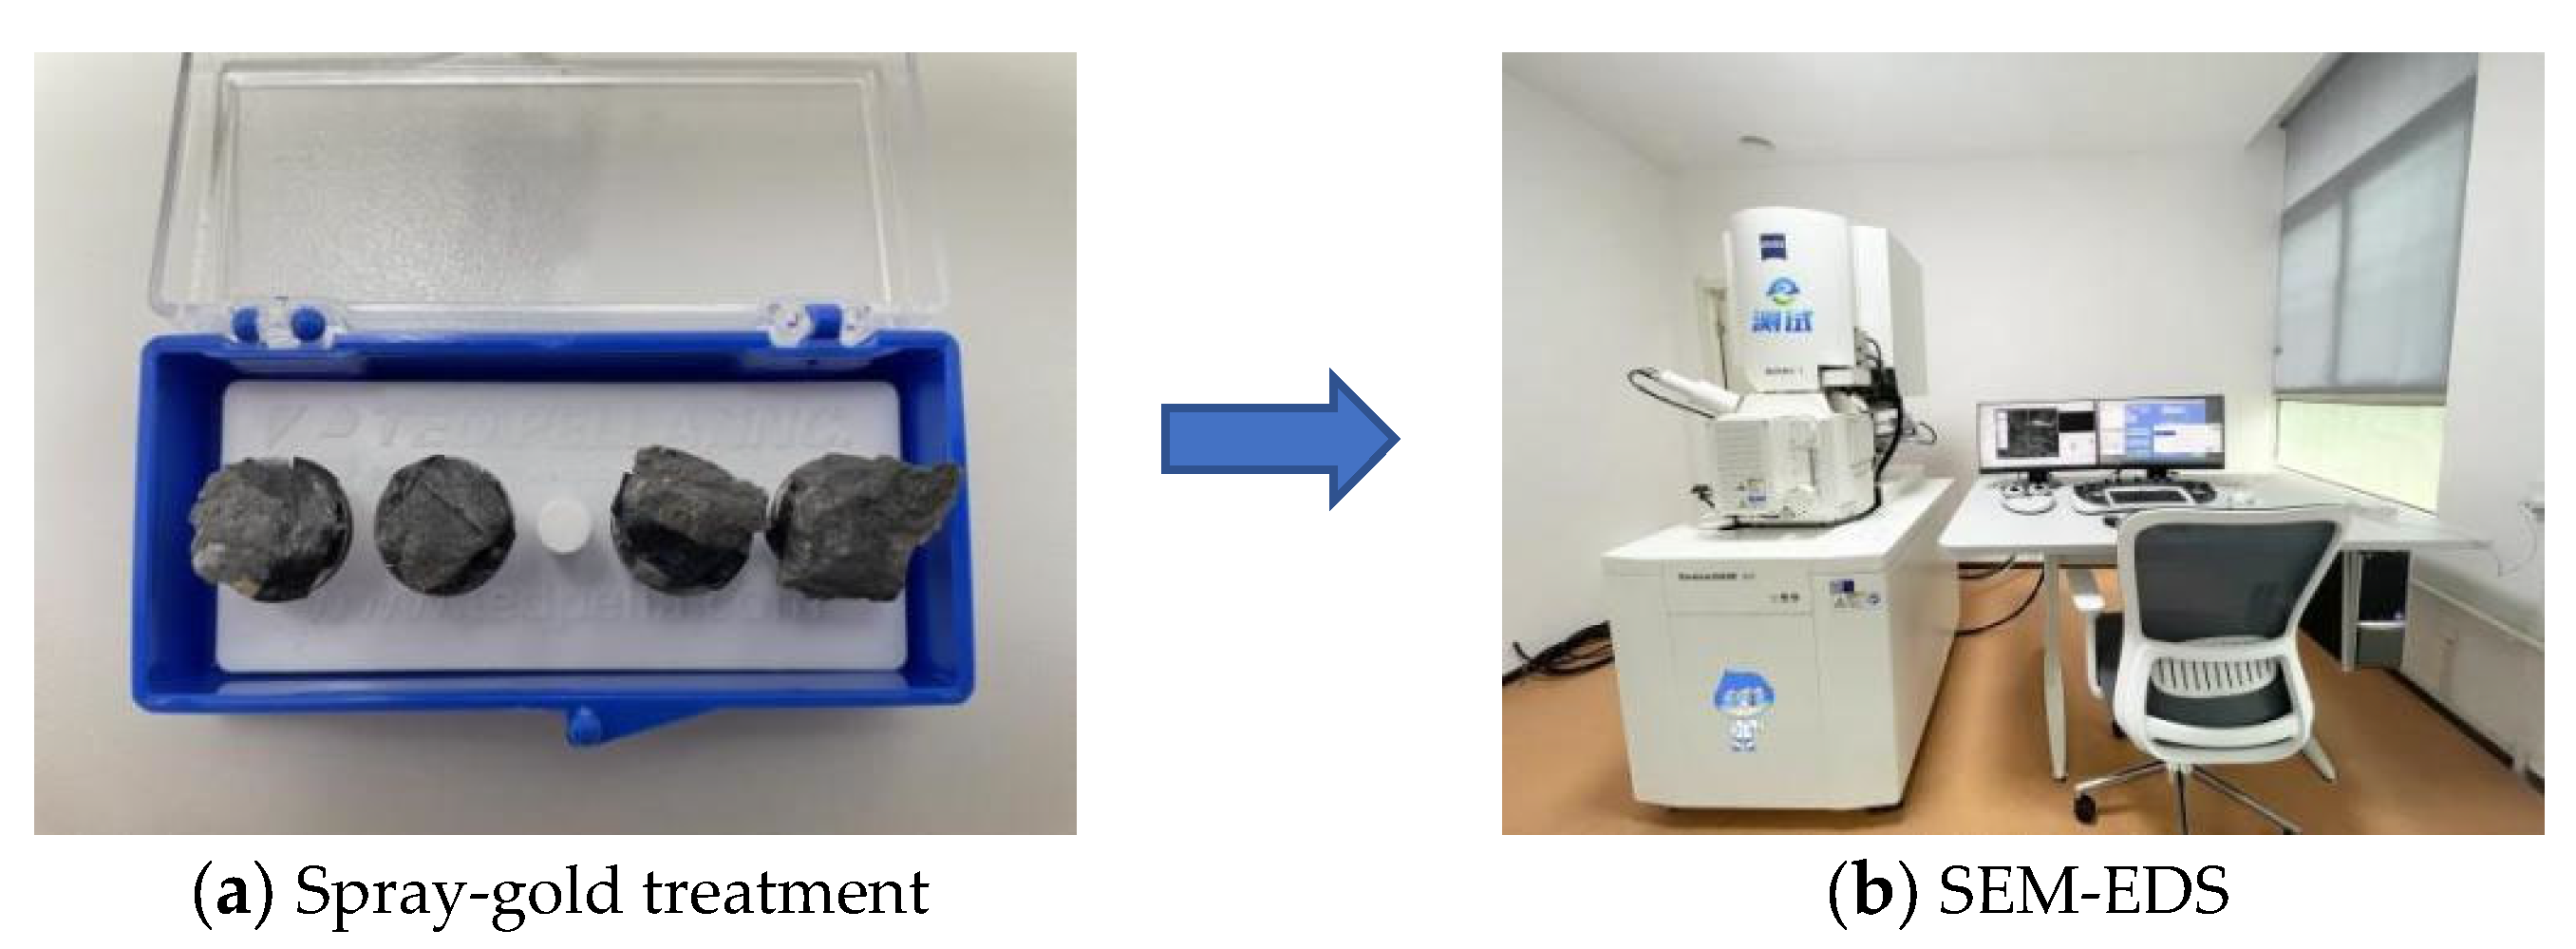
2.5.3. Microscopic Test

The SEM-EDS test instrument was a Zeiss Gemini SEM360 scanning electron microscope. The acceleration voltage was 15 KV and the probe acceleration current was 13 nA. After the compressive strength test was completed, thin sheets with a diameter of 5–10 mm and a thickness of 1–2 mm were selected as the samples. First, they were immersed in an anhydrous ethanol solution to terminate hydration; then they were taken out from the solution and dried in a vacuum blast drying oven at 60 °C for 12 h. Finally, the samples were sprayed with gold (Figure 6a). The elemental compositions of the hydration products of the samples were analyzed by EDS at the same time as SEM detection (Figure 6b).
A MacroMR12-150H-I nuclear magnetic resonance spectrometer was used in the NMR experiment. This test uses a non-destructive testing method; that is, after the specimen is treated with water retention, it can be directly tested with ordinary cubic concrete specimens. The attenuation signal of the CPMG sequence was collected, and the inversion was carried out by using the software of the instrument. After processing, the T2 relaxation time was obtained. Finally, the internal pore structure characteristics of the CGC was characterized.

3. Test Results and Analysis

3.1. The Mechanical Properties and Fracture Surface Analysis

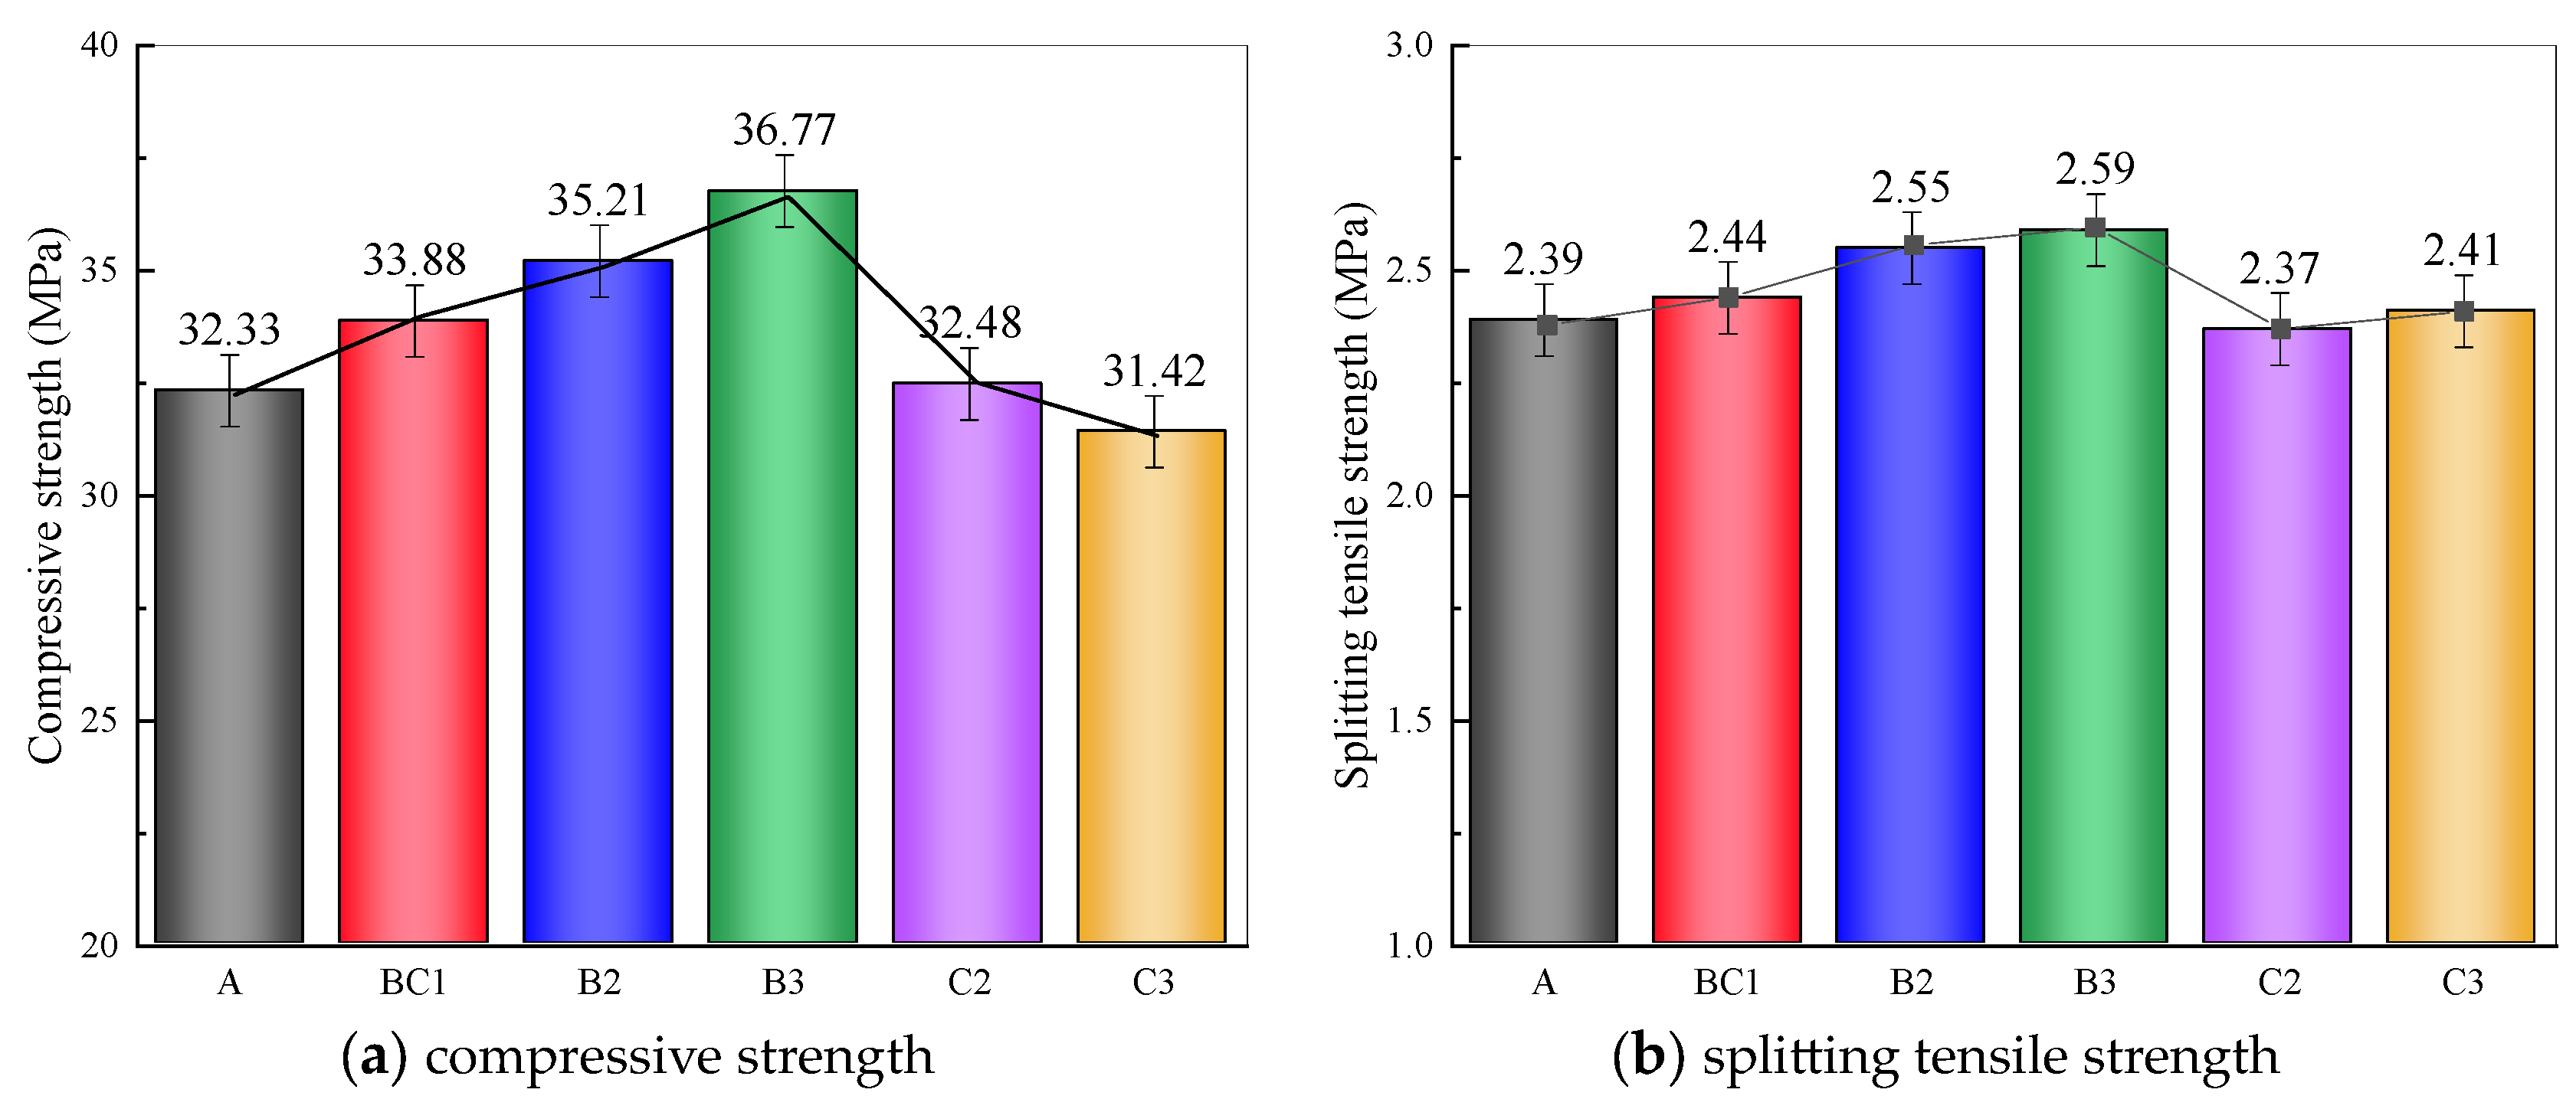
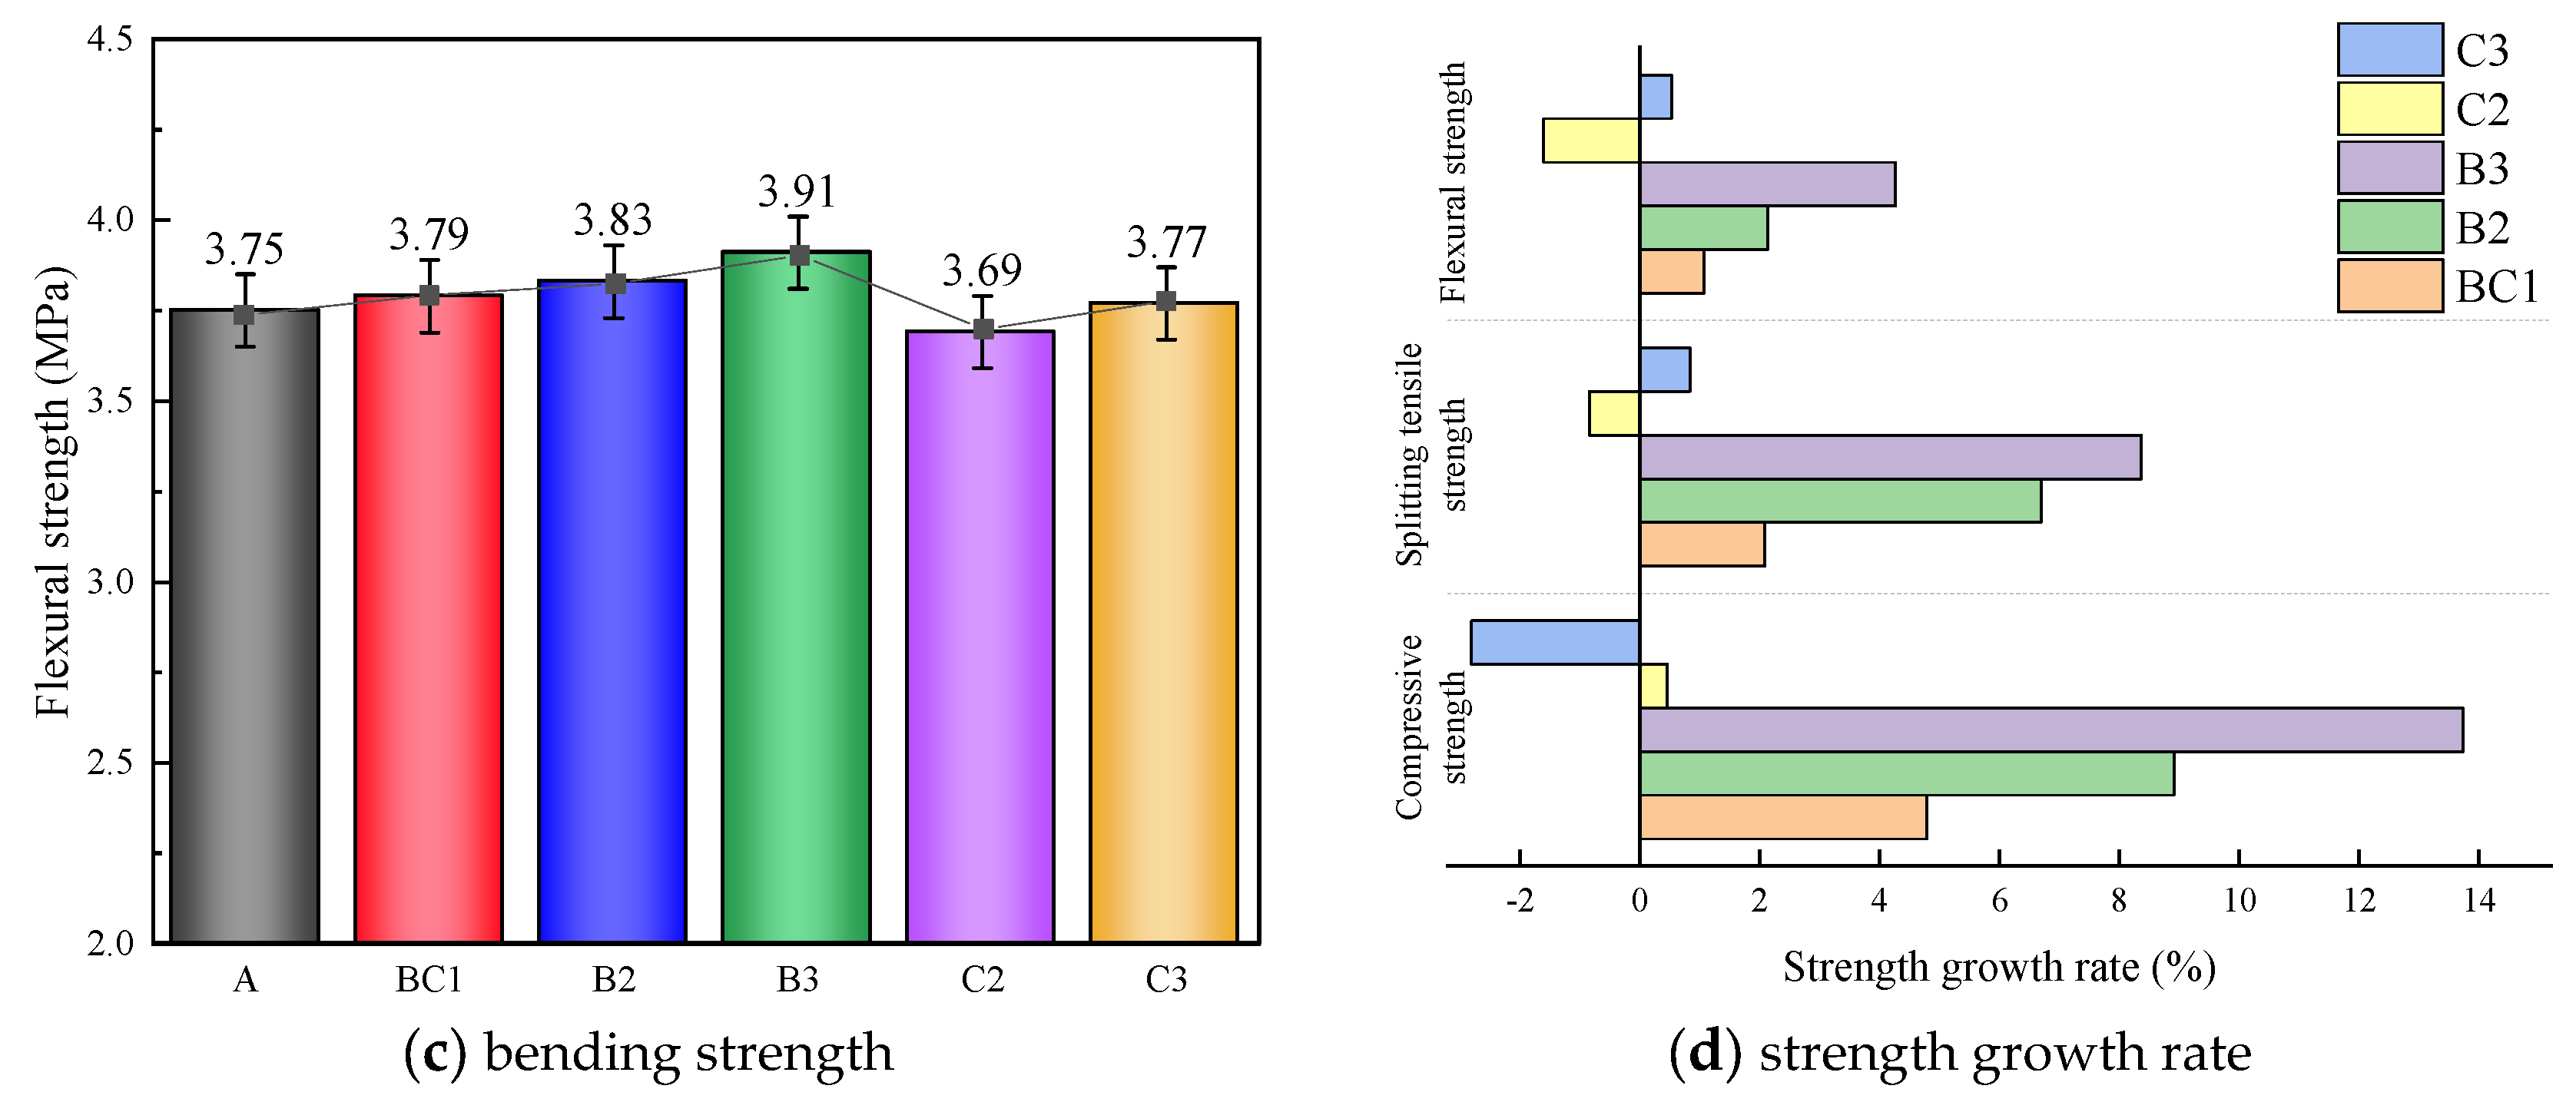
3.1.1. Mechanical Properties

In this section, the 28d mechanical properties of the CGC with 20% total mineral additives under different F/S (F/S = 3, F/S = 2, F/S = 1) and different BF contents (0.12 vol%, 0.15 vol%, 0.18 vol%) are presented. Figure 7a–c show the compressive strength, splitting tensile strength and bending strength of each group of CGC. It can be seen that with the addition of FA and SF, the three mechanical strengths of each group of specimens are greater than those of the control group A.
With the gradual decrease in F/S, the mechanical properties of the CGC specimens in each group were further improved, among which the compressive strength increased most significantly. The compressive strength of BC1, B2 and B3 increased by 4.79%, 8.91% and 13.73%, respectively, compared with the control group A. When F/S = 1, the mechanical strength of group B3 was the best. Compared with the control group A, the compressive strength, splitting tensile strength and flexural strength of B3 increased by 13.73%, 8.37% and 4.27%, respectively.
When keeping F/S = 3 unchanged and taking the content of BF as the research variable, it can be seen that with the increase in BF content, the three mechanical strengths all increase initially and then decrease. When the BF content was 0.15 vol%, the three mechanical strengths of BC1 were the best, and were increased by 4.79%, 2.09% and 1.07%, respectively, compared with group A. And the compressive strength of BC1 increased by 4.31% and 7.83% compared with C2 and C3, respectively. This shows that the addition of FA and SF can improve the mechanical properties of CGC, and BF has an optimal dosage under the combined action of SF and FA.
Figure 7d shows the change trend of the mechanical properties of each group of specimens. It can be seen that when SF gradually increases in the mixed proportion, the growth trend of compressive strength is the most significant. When F/S = 1, the compressive strength, splitting tensile strength and bending strength of B3 increased by 13.73%, 8.37% and 4.27%, respectively, compared with group A. When the content of BF gradually increases, for the splitting tensile and bending strength, BC1 > C3 > C2. Compared with C2, the splitting tensile strength and bending strength of BC1 increased by 2.95% and 2.71%, respectively. It can be seen that when F/S = 3, the change in BF content had no significant effect on CGC strength.

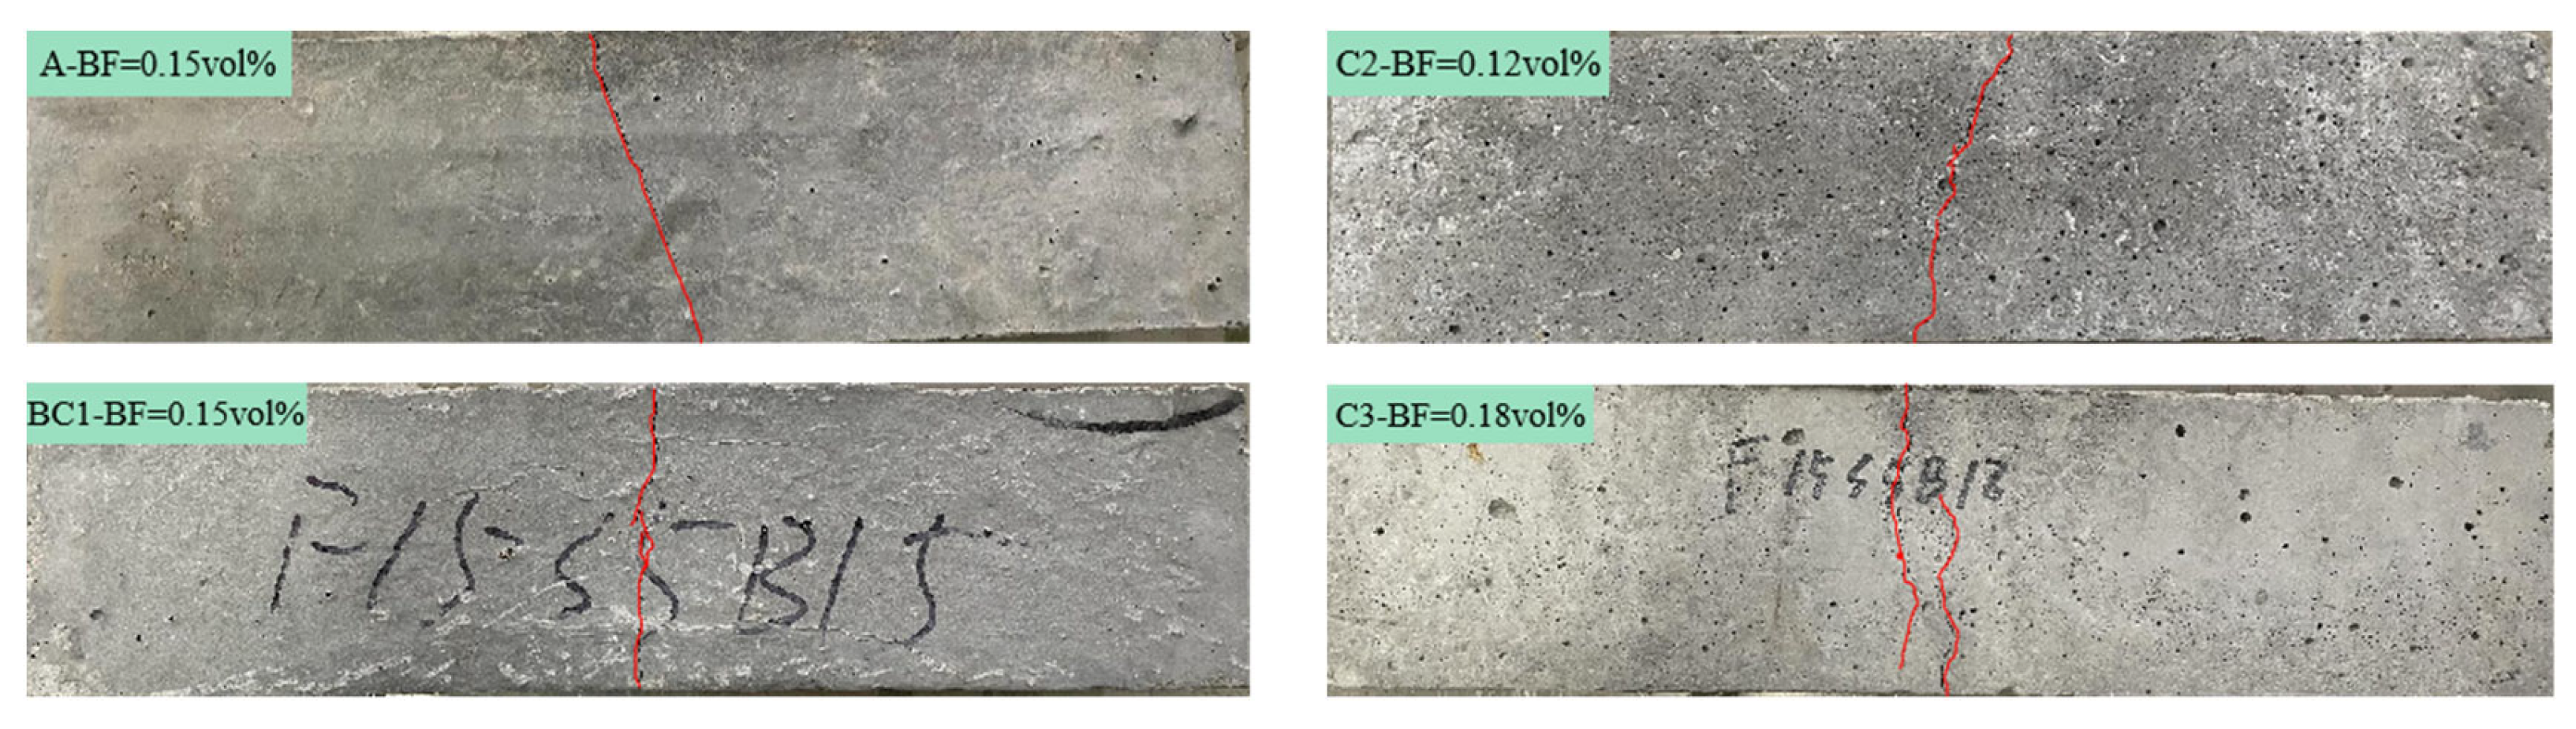
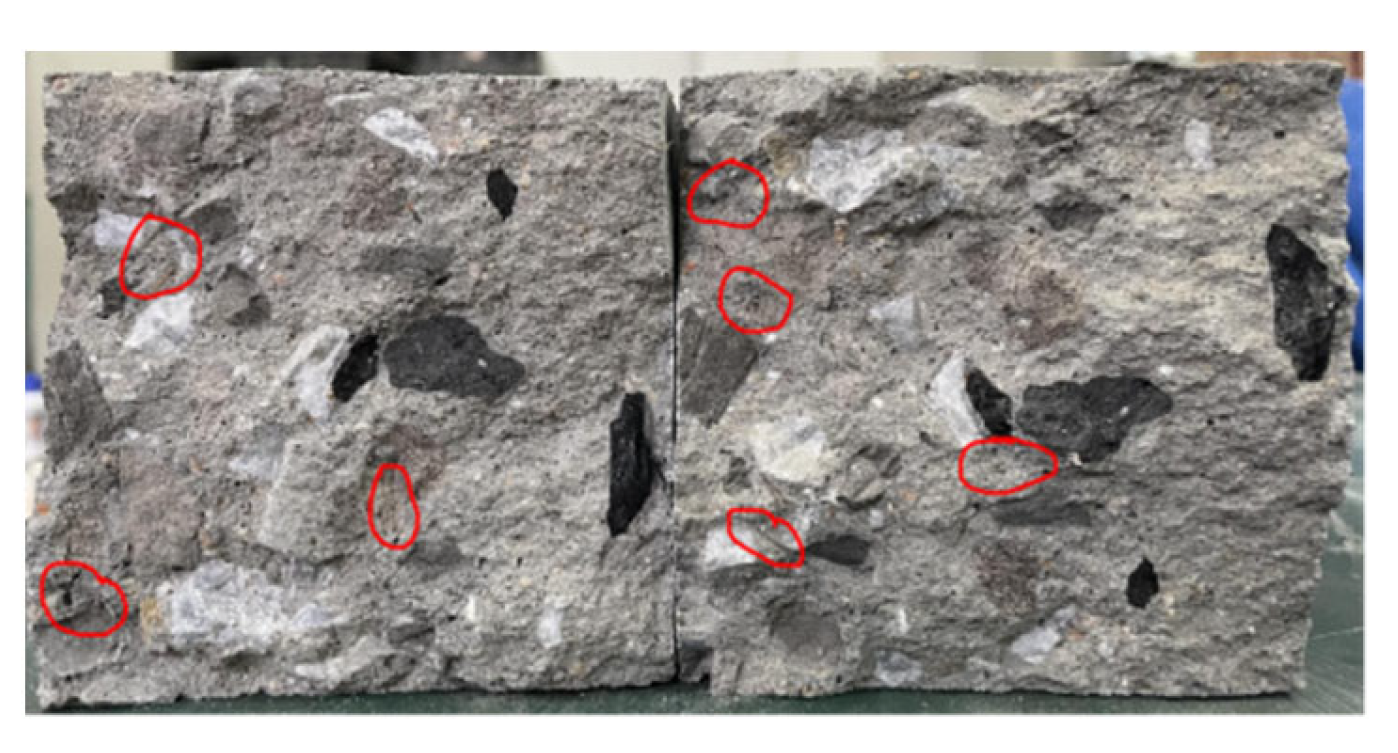
3.1.2. Fracture Surface Analysis

Figure 8 is the fracture surface morphology of each group after the CGC splitting tensile test. It can be seen that there are two different forms of failure: 1. The ITZ of coarse aggregate fail. The green circle is the failure surface of the coarse aggregate and cement base. It can be seen that the interface between the aggregate and mortar is separated, and its own strength cannot be fully exerted. 2. Aggregate destruction. The blue circle and the red circle are the natural stone fracture surface and the coal gangue aggregate failure surface, respectively. It can be seen that in this kind of failure, the aggregate is pulled off because it breaks through its own strength limit. In the control group A, there are many 1-type failure forms. With the addition of the mineral additives, the 1-type failure forms gradually decrease, and with the decrease in F/S, the 2-type failure forms gradually increase. When F/S = 1, it can be seen from Figure 8d that the number of blue circles is the largest, which is consistent with the test results of the optimal splitting tensile strength of B3 in the previous article.
As shown in Figure 9, the bending failure mode of CGC was changed to some extent with the change in BF content. With the increase in fiber content in CGC, the flexural toughness of CGC is improved, and the number and lengths of micro cracks near the main crack are obviously increased. When BF = 0.18 vol%, the agglomerated fibers affect the direction of the bending crack, and the main fracture crack is a ‘double S’ shape. However, the BF content of C3 is too high, and there are many holes in the structure due to the aggregation effect of the fiber (as shown in Figure 10, the red circles have been marked). Eventually, the actual bending strength of C3 was lower than that of BC1. At the same time, compared with BC1 and A, under the same fiber content, the control group A had no mineral additives, and its main cracks were relatively straight and the fracture brittleness was large.

3.2. Analysis of Frost Resistance

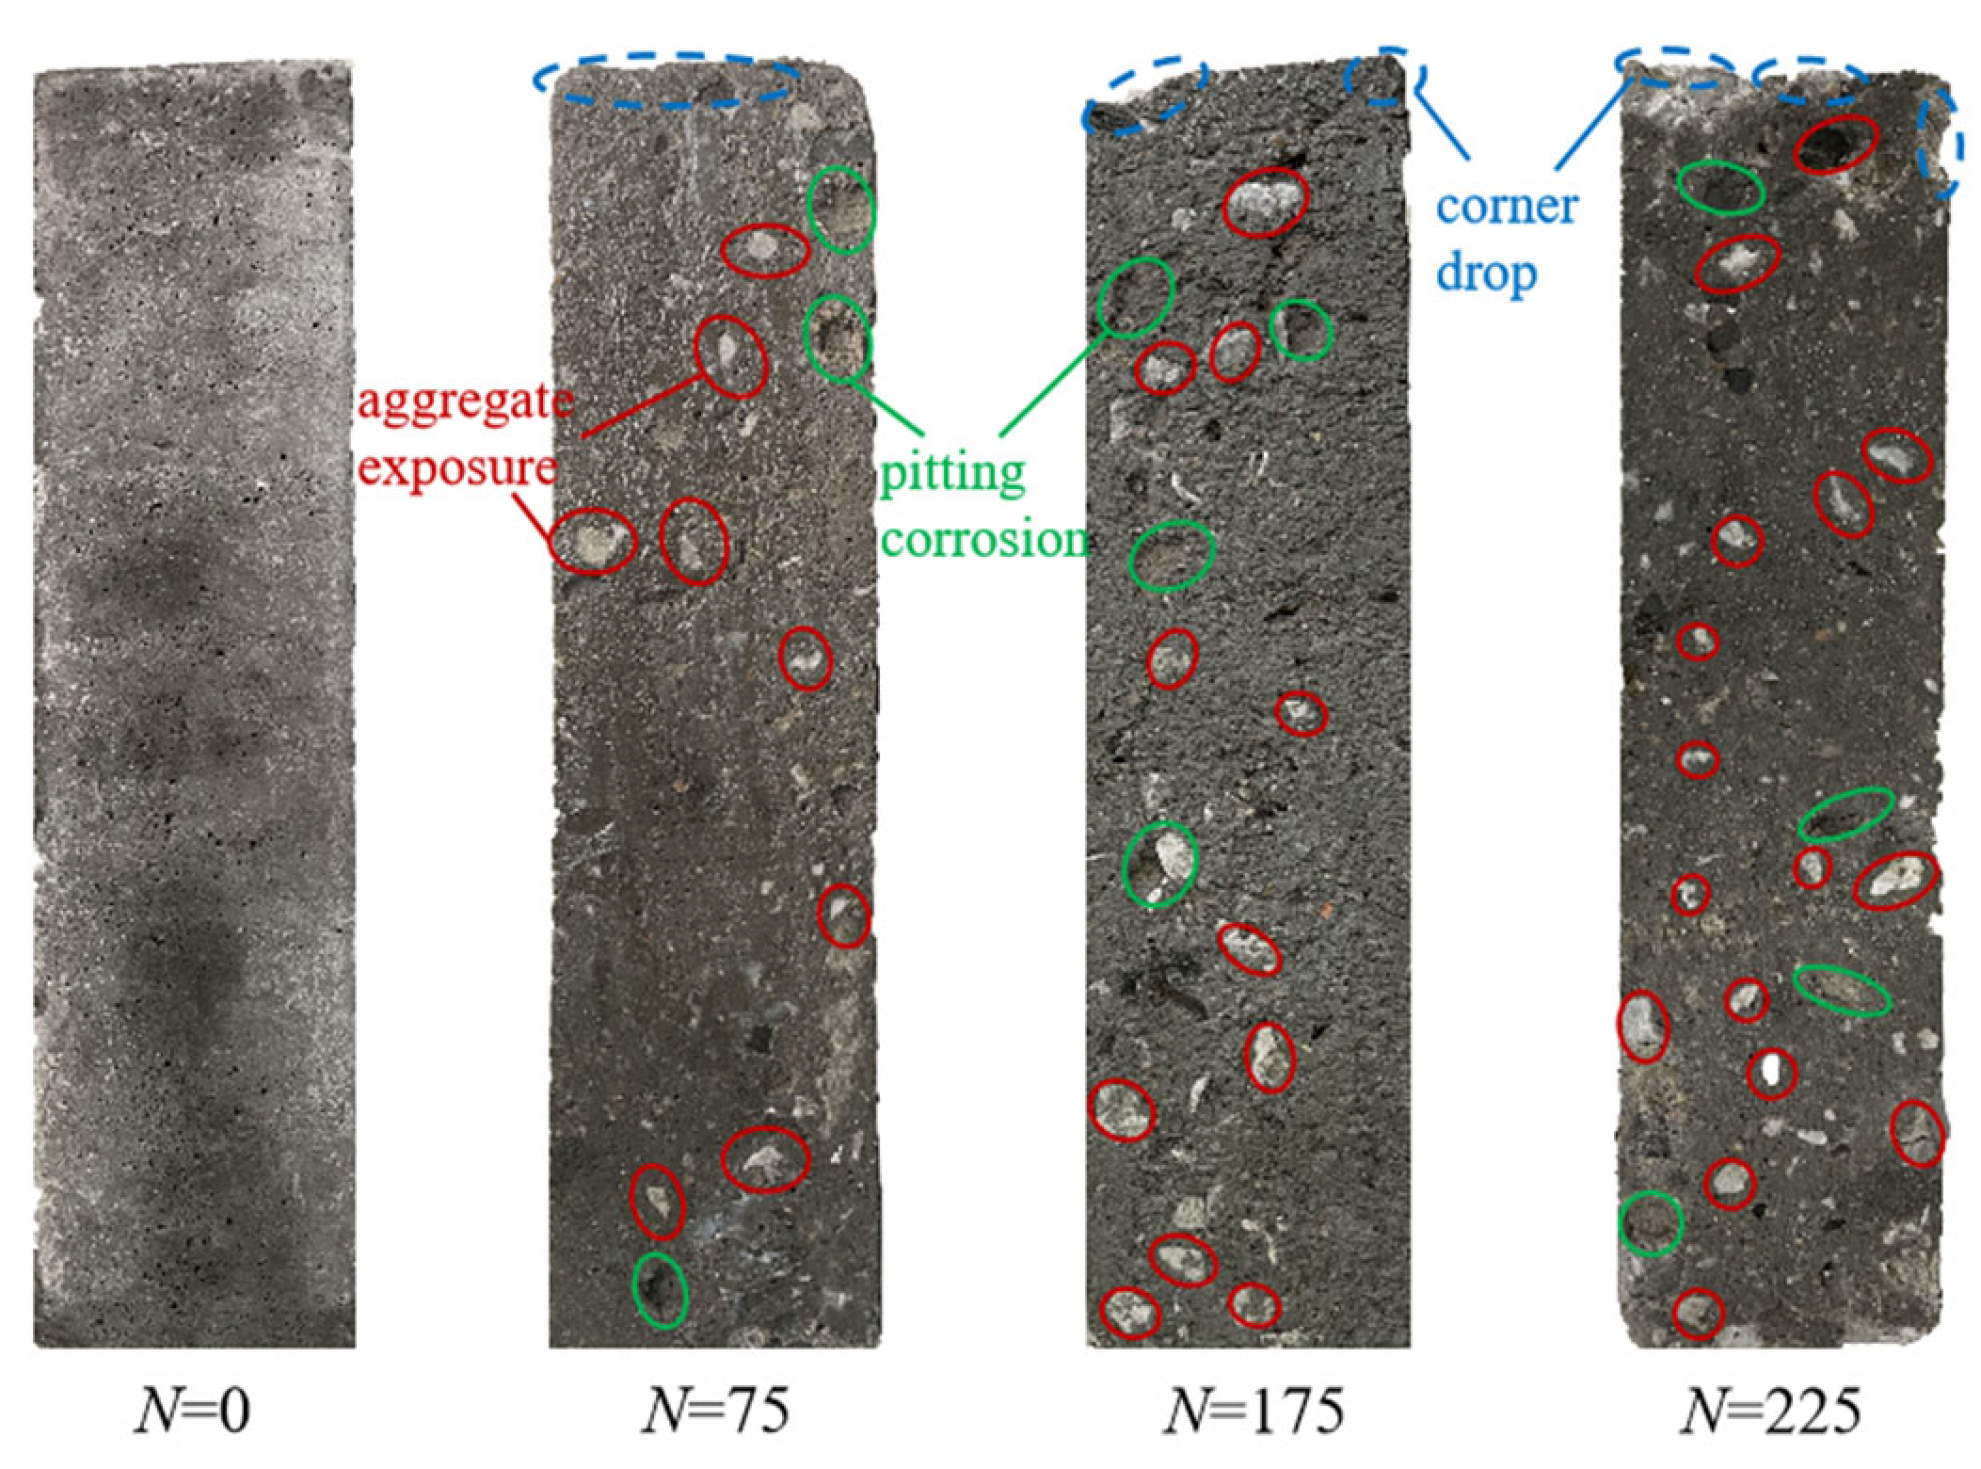
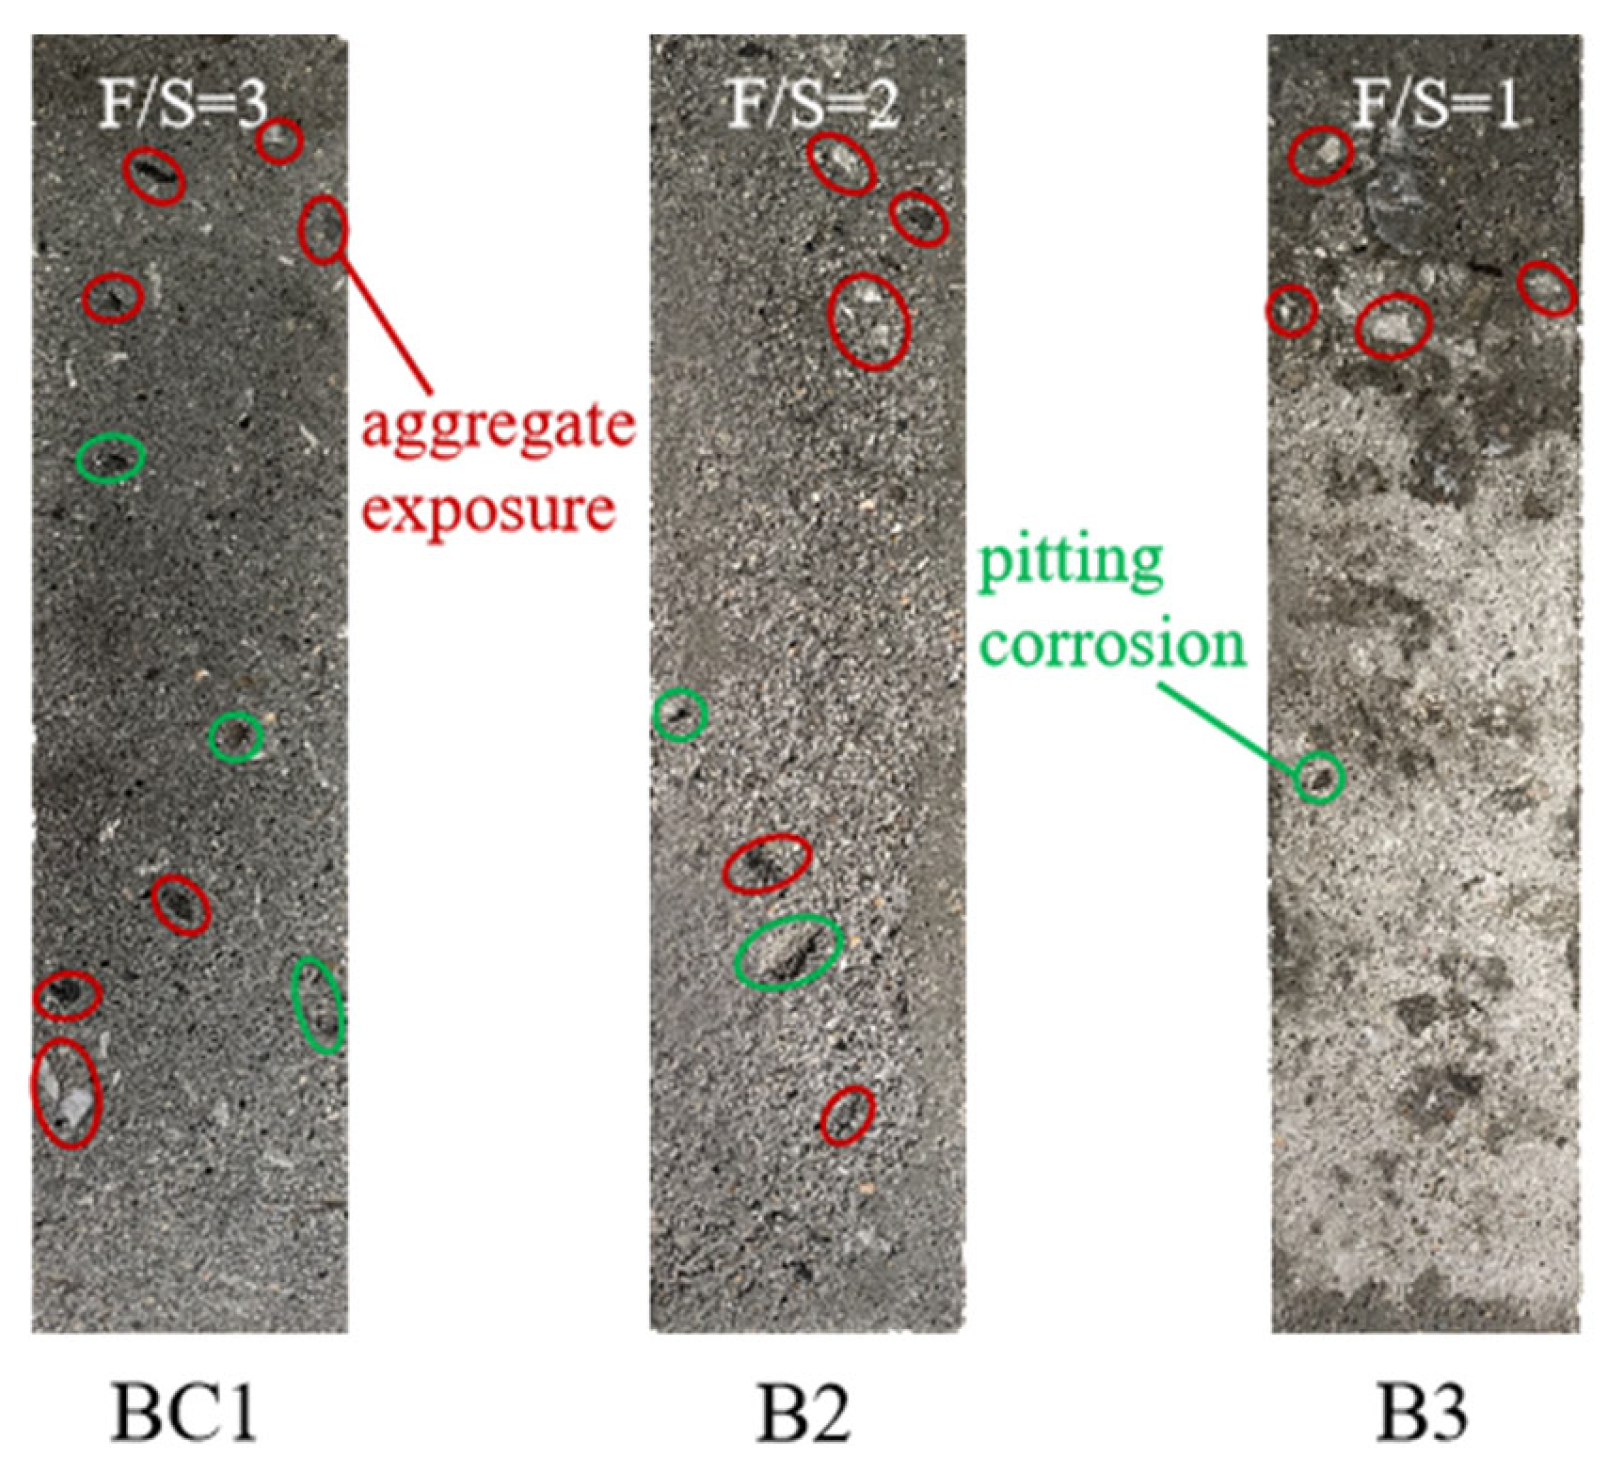
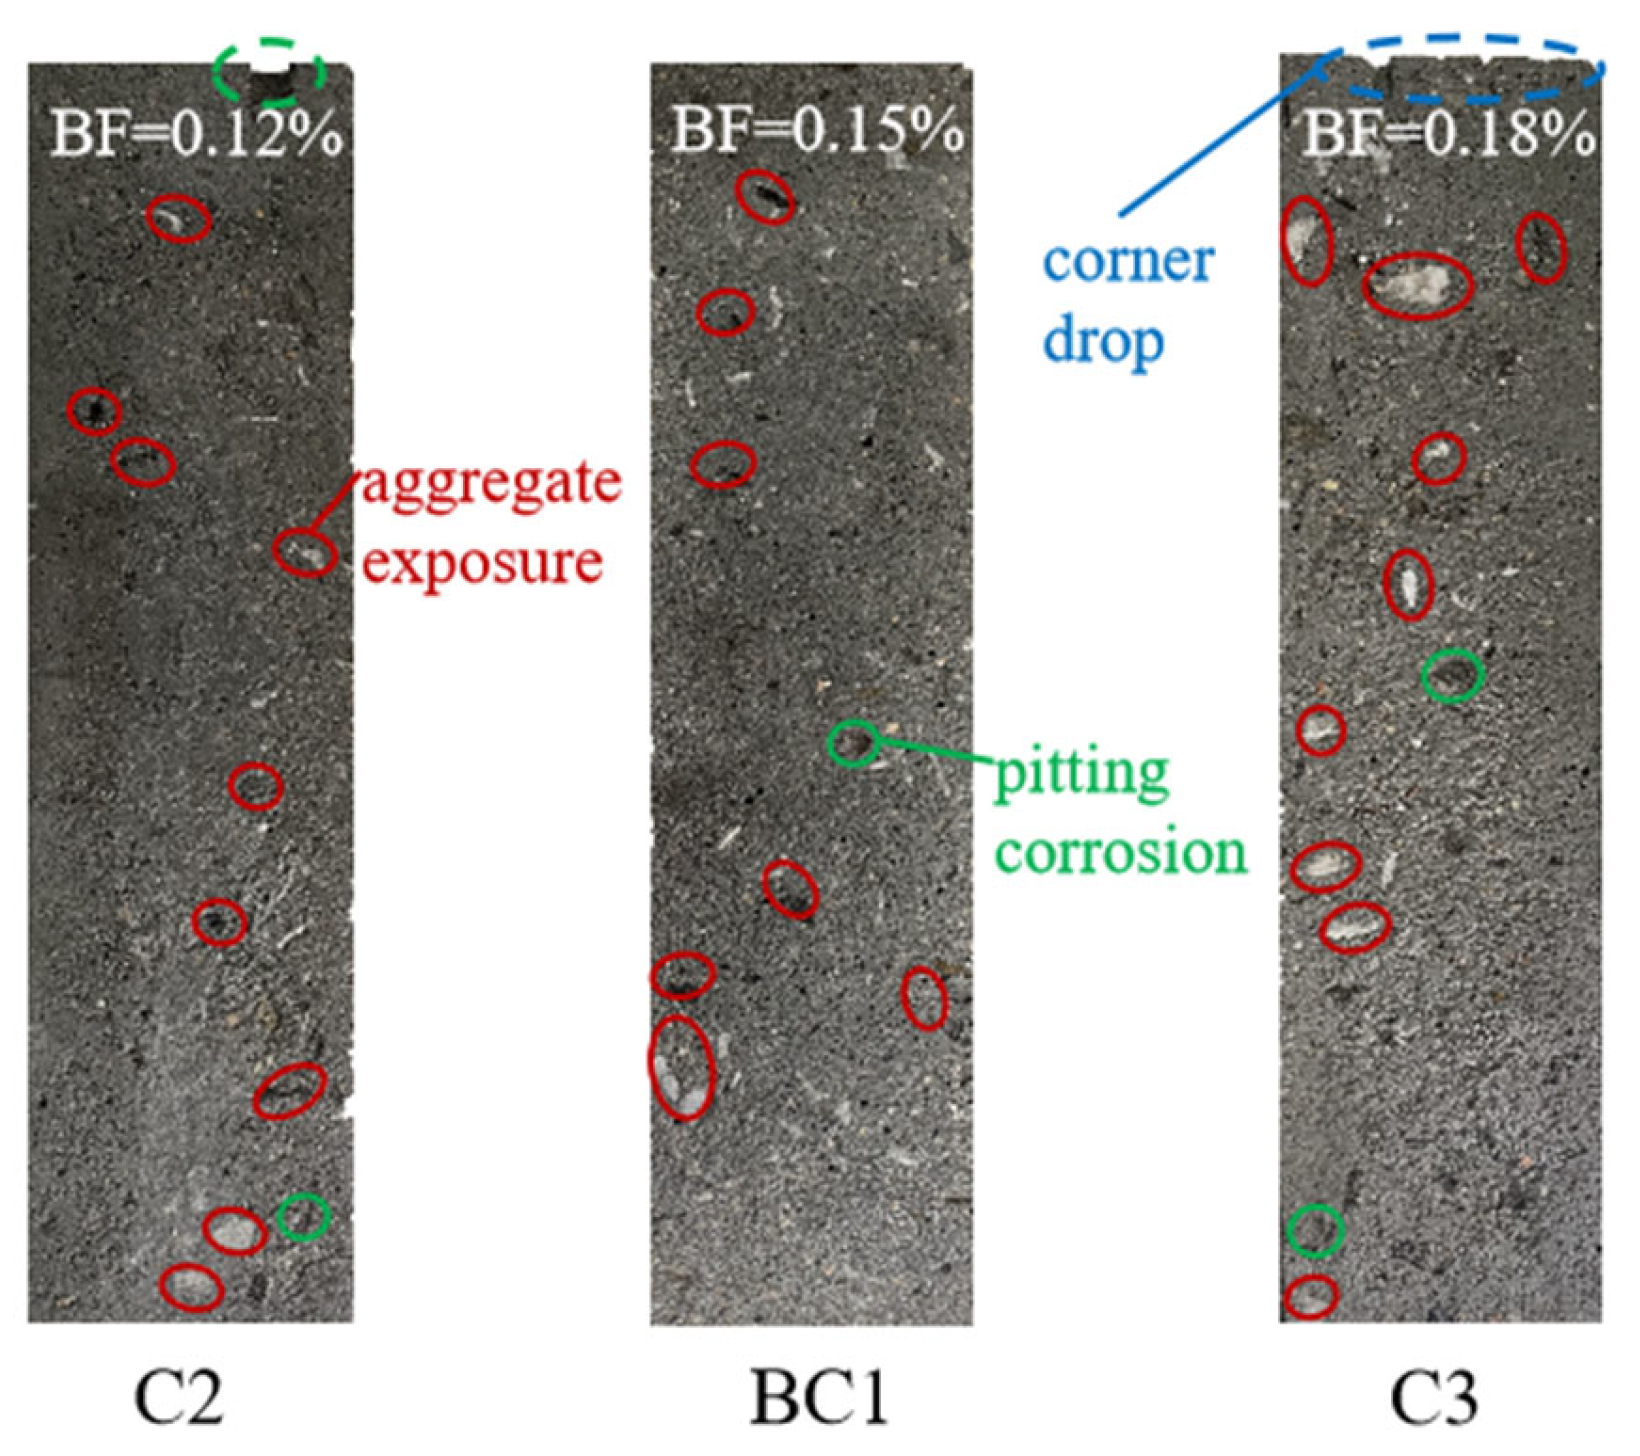
3.2.1. Apparent Morphology

The apparent morphology can simply and clearly reveal the overall freeze–thaw damage of CGC. In Figure 11, the apparent morphology of the control group A under different freeze–thaw cycles (N) is shown. The red circles in the figure mark the damage locations. It can be seen that when N = 0, the surface of the specimen was smooth, the edges and corners were clear, and the mortar was dense. When N = 75, the mortar on the surface of the specimen began to become loose and partially peeled off, resulting in the exposure of a large amount of fine aggregate and a small amount of coarse aggregate, and the surface of the specimen began to become rough. When N = 175, the surface cement mortar was further peeled off, and a large amount of aggregate was exposed and partially shed, resulting in pitting corrosion on the surface of the specimen. Finally, when N = 225, the mortar at the sharp corner of the specimen was almost completely peeled off, and a large number of damage phenomena such as pitting corrosion and corner drop appear. The relative dynamic elastic modulus data of the same period show that the specimen has been damaged at this time.
Figure 12 is the apparent morphology of CGC under different F/S, when N = 100. With the decrease in F/S, the damage degree of the specimen surface decreases gradually. When F/S = 1, the surface cement mortar was peeled off, and some aggregates were exposed, but there was no shedding phenomenon. The surface of the specimen was still relatively flat and smooth. However, after BC1 and B2 experienced the same number of freeze–thaw cycles, the surface mortar became obviously loose and pit corrosion occurred. In addition, compared with Figure 11, it was found that the apparent morphology of CGC after incorporation of mineral additives was better than that of group A.
Figure 13 is the apparent morphology of CGC under different BF content when N = 100. It can be seen that there is an optimal value of fiber content. It can be seen that after 100 freeze–thaw cycles, there were many pits and micro cracks on the surface of BC1 due to the spalling of cement mortar, but there was no corner drop, which is obviously better than C2 and C3. At the same time, compared with C2 and C3, although there was more serious damage after experiencing the same N, the pit corrosion and aggregate exposure on the surface of C2 were significantly less than those of C3. This is because too much BF was added to C3, and the aggregation effect of the fiber caused the specimens to contain more pores. Under the aggravation of the freeze–thaw damage, these small pores are connected one by one, resulting in greater overall damage.

3.2.2. Mass Loss

Figure 14a shows the mass loss rate of each group of CGC under different N. The overall trend is decreasing and then increasing. This is because the mass of water absorbed by the specimens was greater than the mass of mortar spalling at the beginning of the freeze–thaw period. Then with the increase in N, the mortar gradually showed damage such as aggregate shedding and even corner drop. This greatly reduced the mass of the specimens, resulting from the mass of mortar peeled off being greater than the mass of water absorbed by the specimen. When N = 175, the mass loss rate of Group A reached 1%, and the response is shown in Figure 11, where a large amount of pitting corrosion and angular damage has appeared on the surface of the specimen. Compared to A, the rate of mass loss was reduced in all the remaining groups and the number of freeze–thaw cycles before destruction was significantly higher. This indicates that the addition of mineral additives enhances the frost resistance of CGC.
Comparing the mass loss rate curves of BC1, B2 and B3, it can be found that the difference in the mass loss rate of each group in the early freeze–thaw stage is not obvious. As the freeze–thaw cycle progressed, the BC1, B2 and B3 groups had inflection points at N = 125, N = 175 and N = 200, respectively, and the quality loss began to intensify. With the gradual decrease in F/S, the mass loss rate curve gradually becomes flat, and the inflection point of freeze–thaw damage appears later. When N = 300, the mass loss rates of B2 and B3 decreased by 21.23% and 36.87%, respectively, compared with BC1. This shows that the reduction in F/S improves the frost resistance of CGC.
Comparing the curves of the mass loss rate for BC1, C2 and C3, we can find that the difference in the mass loss rate is not obvious, but the number of freeze–thaw cycles is different. When N = 225, the mass loss rate of C3 was 1.69%. The data for the relative dynamic elastic modulus at this time show that the specimen had been destroyed. But C2 and BC1 were destroyed when N = 250 and N = 300, respectively. This shows that a proper BF content is helpful in reducing the mass loss of the specimen and improving the frost resistance.

3.2.3. Relative Dynamic Elastic Modulus

Figure 14b shows the relative dynamic elastic moduli of CGC at different N. After the freeze–thaw cycles, the internal pores and cracks increased, the pore structure deteriorated, and the overall structure became loose, resulting in a downward trend in the relative dynamic elastic modulus. Among the different groups, group A had the fastest decline rate and the earliest inflection point. When N = 225, the relative dynamic elastic modulus had dropped to 58%, which meets the failure requirements specified in the code (in which the relative dynamic elastic modulus drops below 60%). However, the relative dynamic elastic modulus of BC1 group was 73%, which indicates that adding an appropriate mineral additive improves the frost resistance of CGC.
Comparing the relative dynamic elastic modulus of each group of specimens under different F/S, it is found that the relative dynamic elastic modulus of B3 (F/S = 1) decreased most slowly, while that of BC1 (F/S = 3) decreased most rapidly. With the freeze–thaw cycles, the inflection point of BC1 appeared at N = 200, and the inflection point of B2 and B3 appeared at N = 225. When N = 300, the test was stopped, and the relative dynamic elastic moduli of BC1, B2 and B3 were 56%, 61% and 65%, respectively. The relative dynamic elastic modulus of B3 was 16.07% higher than that of BC1. It can be seen that with the increase in F/S, the frost resistance of CGC becomes better and better. Comparing the relative dynamic elastic modulus of each group of specimens with different BF contents, it is found that there is little difference between C2 (BF = 0.12 vol%) and C3 (BF = 0.18 vol%), but there is a big difference between them and BC1 (BF = 0.15 vol%). When N = 250, the relative dynamic elastic moduli of C2 and C3 were 55% and 51%, respectively, both of which meet the freeze–thaw damage standard, while the relative dynamic elastic modulus of BC1 was 68%. It can be seen that with increasing BF content, the frost resistance of CGC increases at first and then decreases.

3.3. Microstructure Analysis

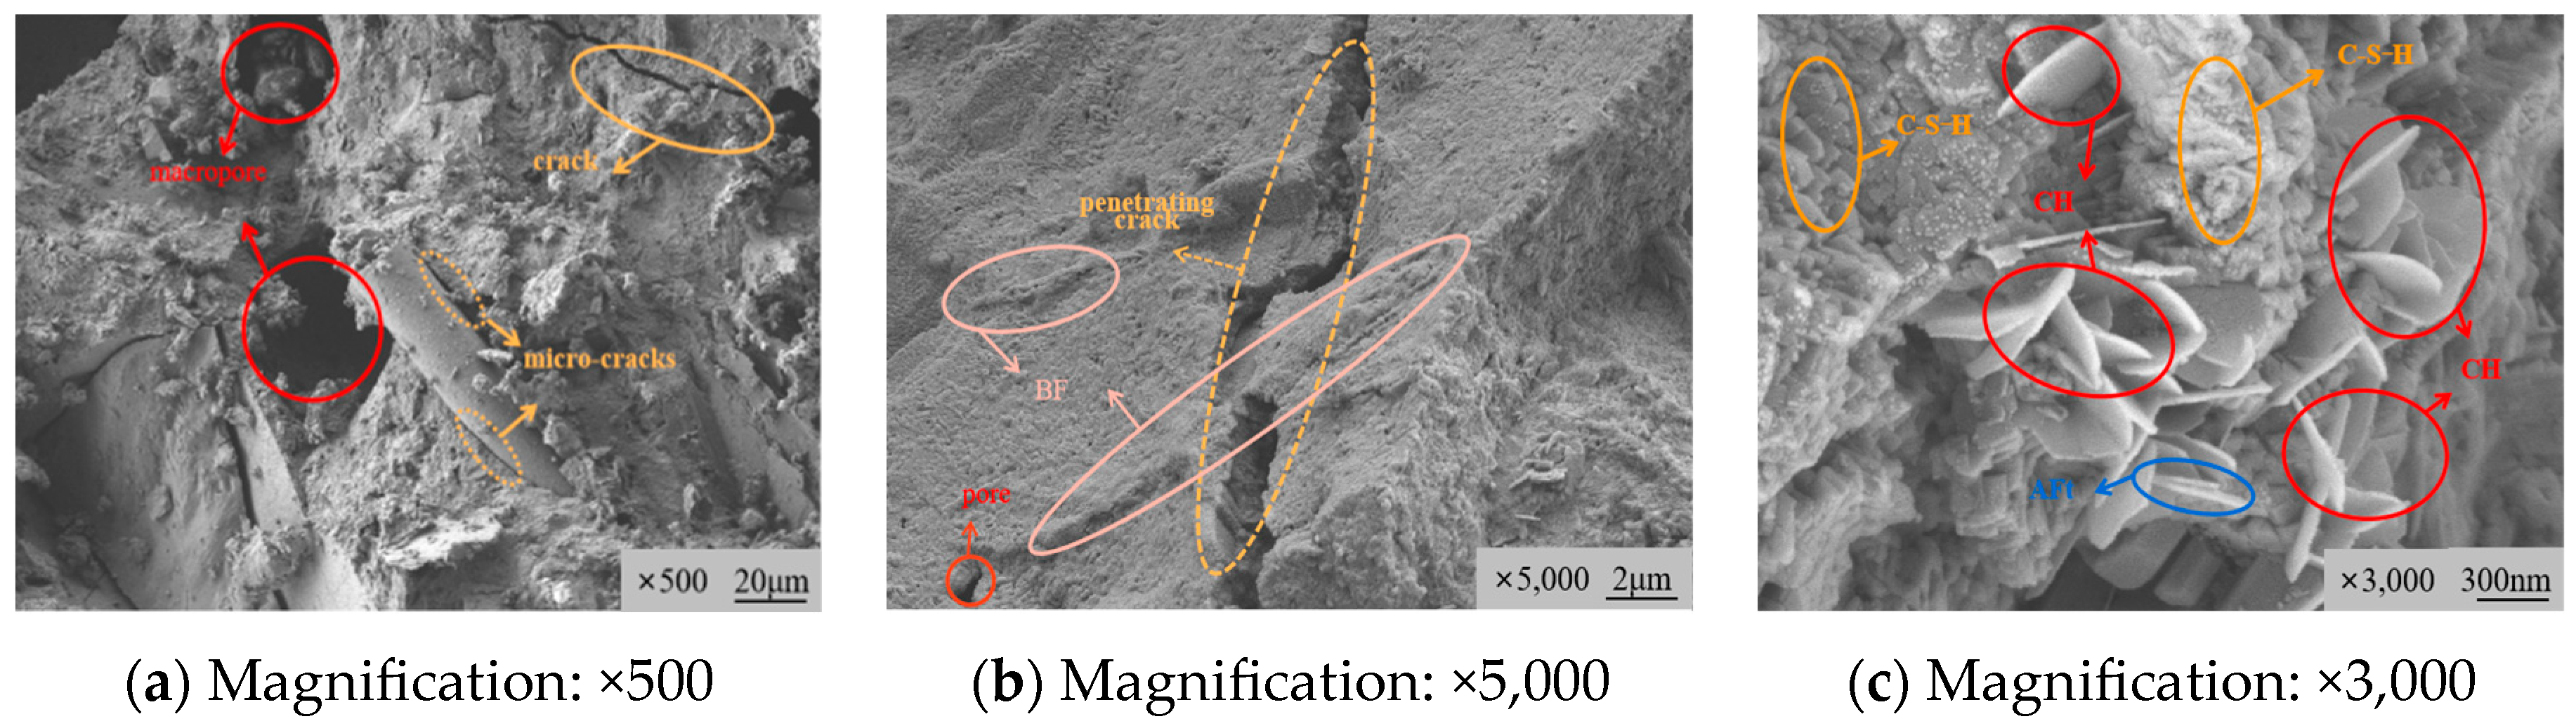
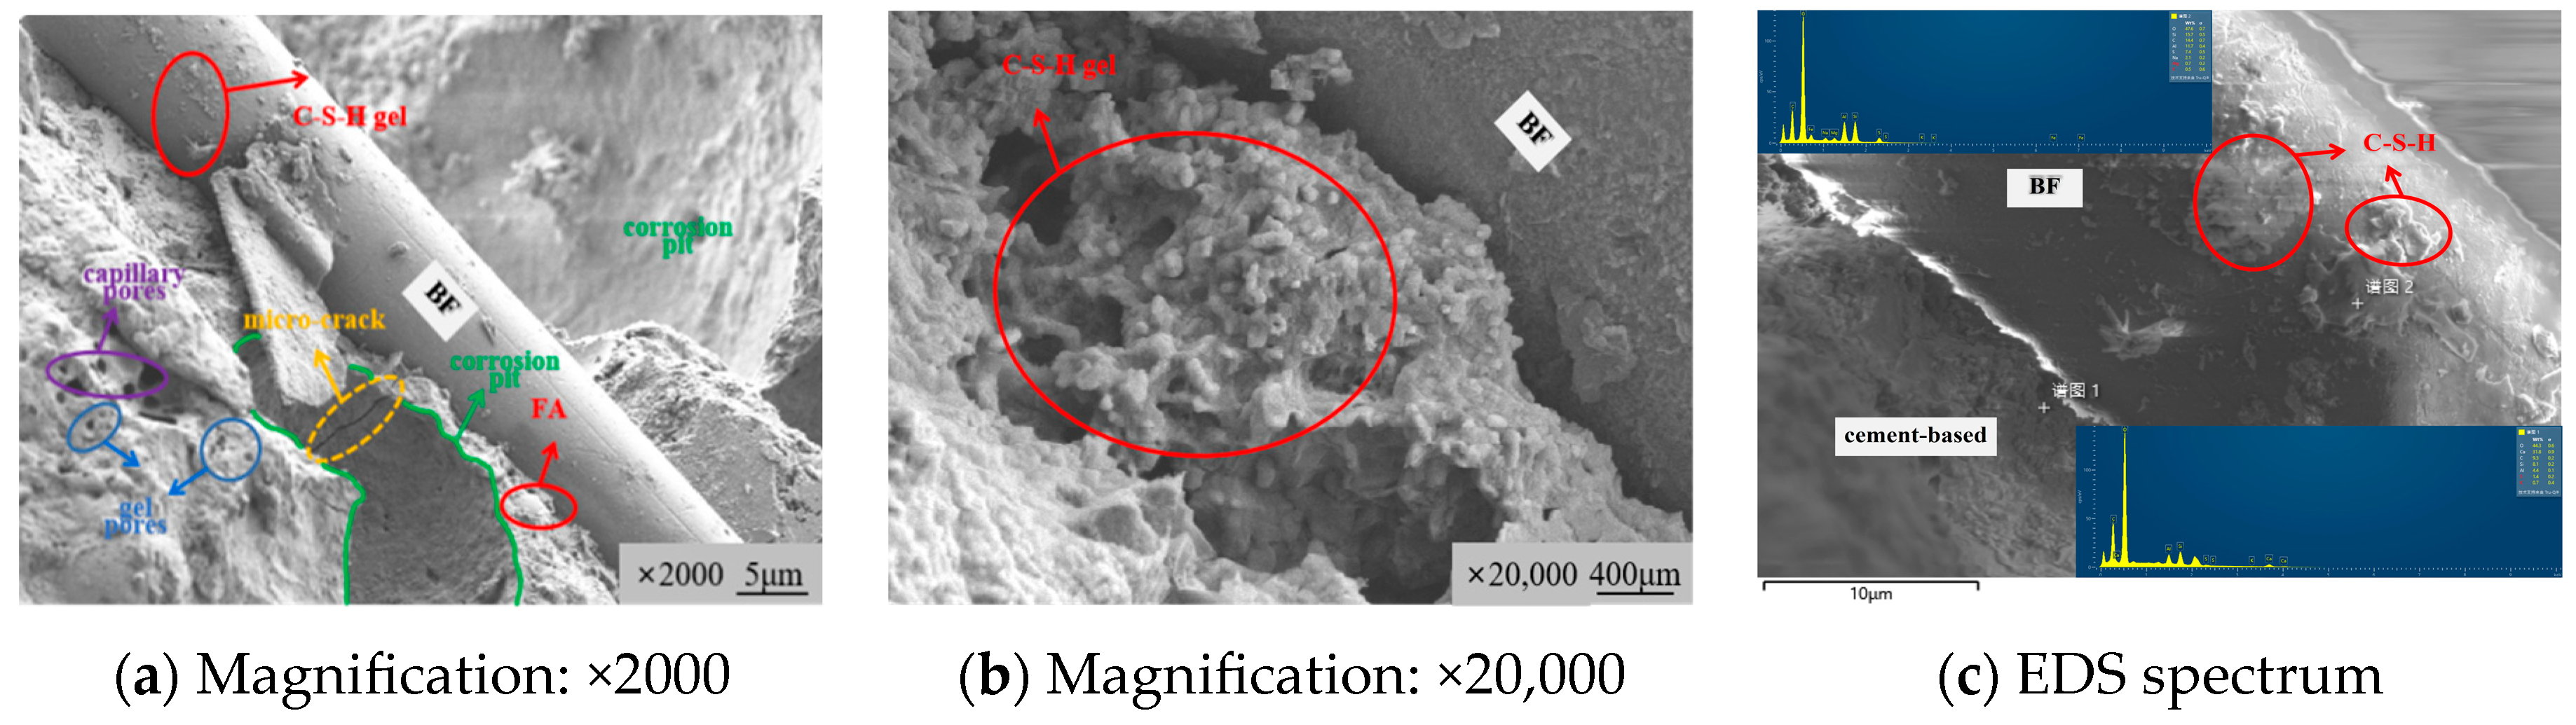
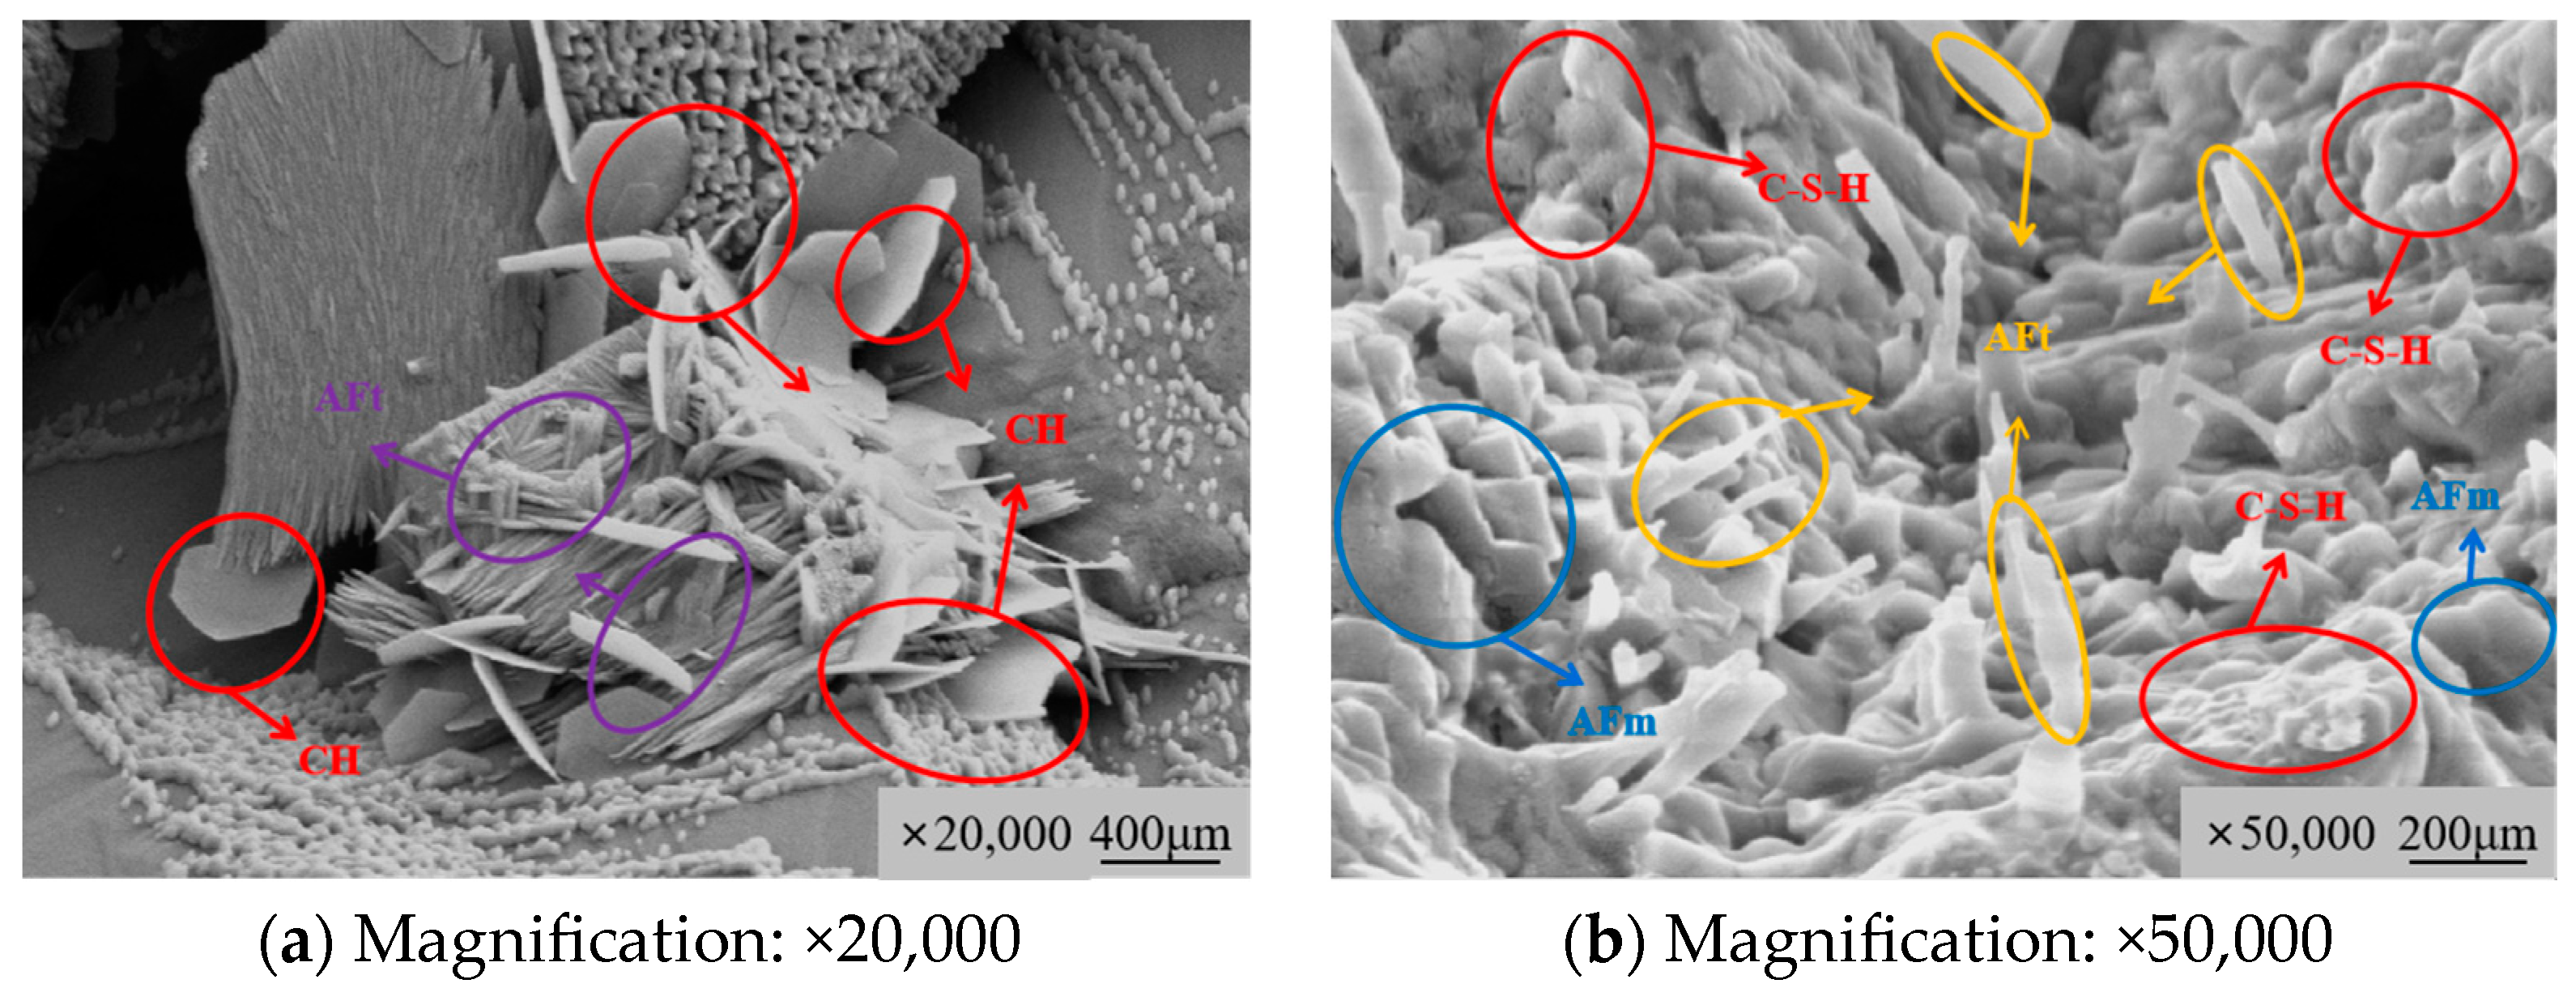
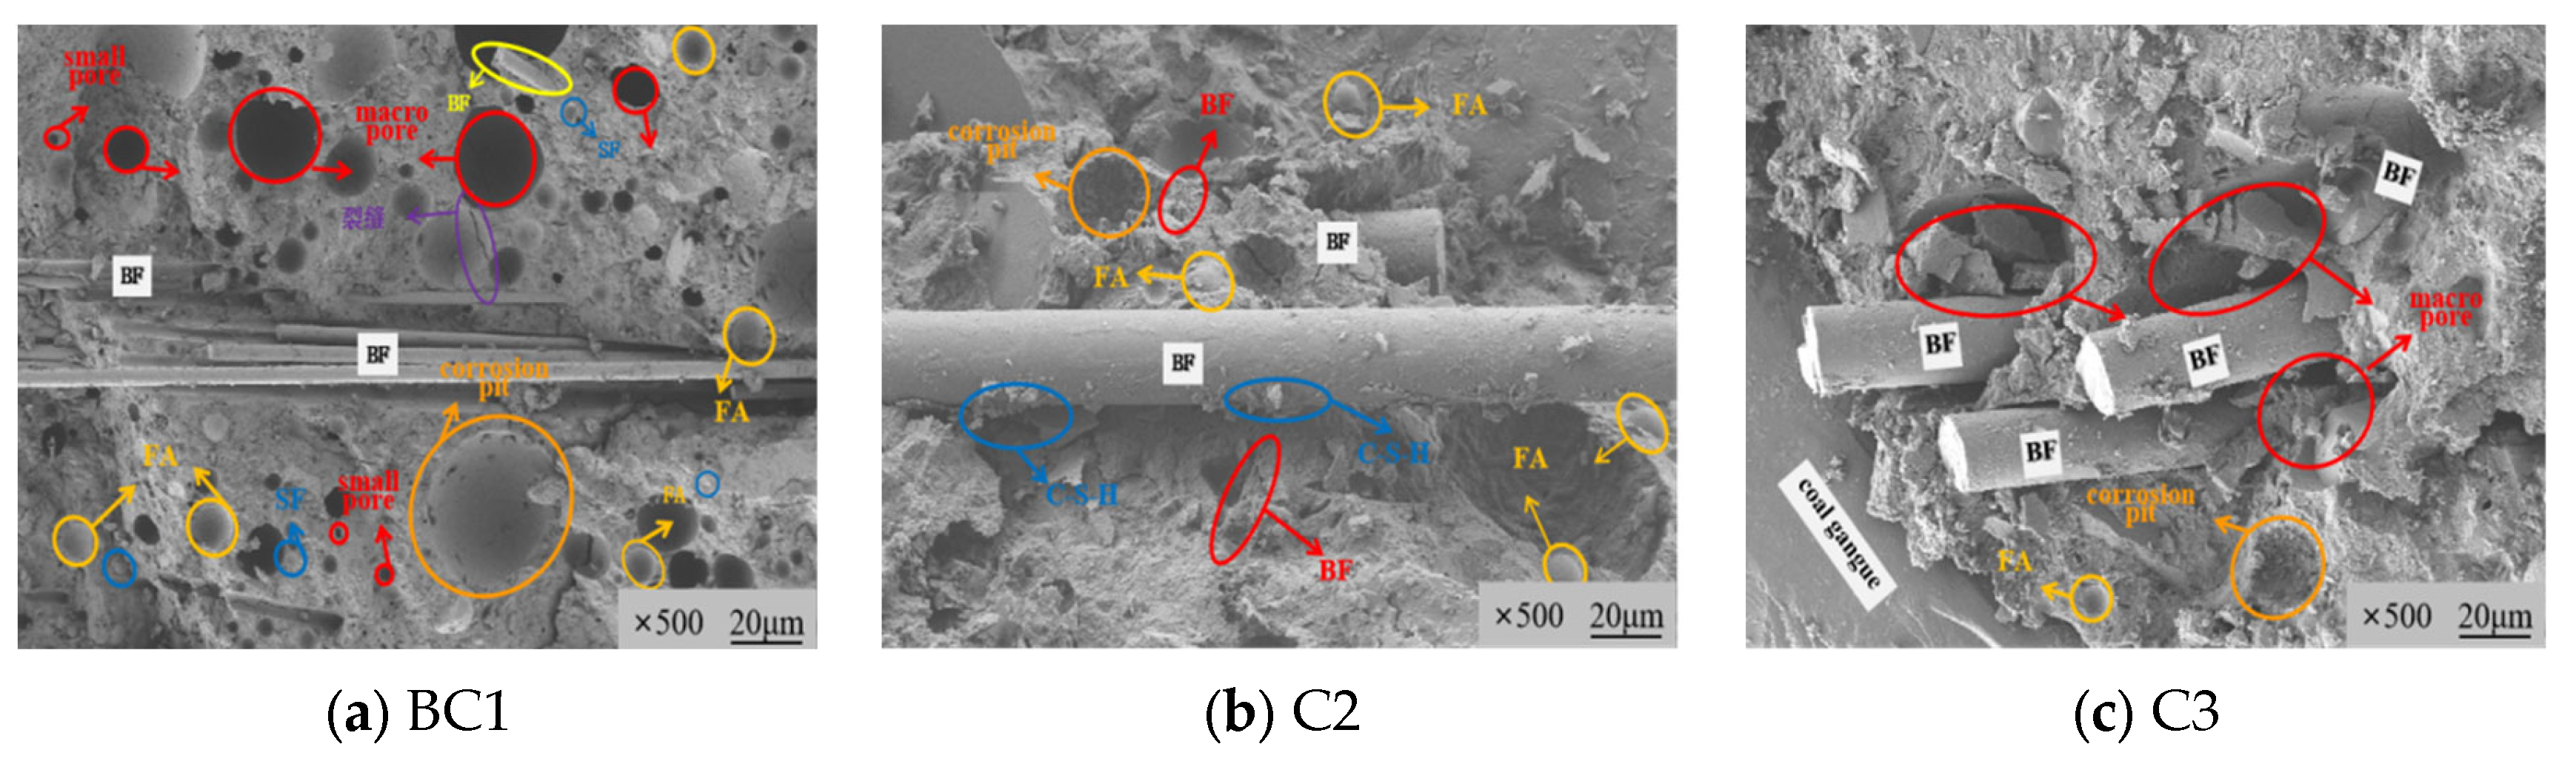
3.3.1. Microstructure Morphology Characteristics

Figure 15 is the microstructure of the control group A mortar area. It can be seen that the mortar area without mineral additives contained more micro cracks and pores, and the overall morphology of the mortar was loose. There were micro cracks and gaps at the interface between the BF and mortar due to the hydration shrinkage of cement (as shown in Figure 15a). Although there were fibers in the pores, there were still penetrating cracks (as shown in Figure 15b). This is because in the process of the cement hydration reaction, a large number of flake Ca(OH)2 crystals (CH) are generated. However, the adhesion of CH is poor. A large amount of CH led to a loose structure of the hydration products between the aggregate and cement base, and the density of the mortar was low (as shown in Figure 15c).
As shown in Figure 16, when the FA and SF were incorporated, many semi-circular pits appeared on the surface of the mortar, which is due to the dissolution of the spherical particles of FA and SF, indicating that the mineral additives had completely participated in the hydration reaction. The hydration products generated by the secondary hydration of FA and SF densify the mortar, and the macropores in the structure are obviously reduced. And with the decrease in F/S, the pore structure of the mortar was further refined. At this point, most of the pores were gel pores, and a small number were capillary pores [37]. The reasons are as follows: Firstly, both FA and SF are spherical particles with different particle sizes, which can exert both a ‘micro-aggregate filling effect’ and ‘overlapping effect’ at the same time and complement the pores in the structure, thereby improving the compactness of the mortar. Secondly, the active substances in FA and SF can react with CH crystals generated by cement hydration to form a volcanic ash reaction (secondary hydration reaction), which consumes the CH crystals, reduces the concentration of alkaline ions in the structure and promotes the hydration reaction of cement [38]. In addition, a large amount of flocculent hydrated calcium silicate gel (C-S-H) is generated at the interface between the BF and cement base, which fills the gap between the BF and mortar base, making the interface structure more firm (as shown in Figure 16b). As shown in Figure 16c, after further analysis of this layer of gel by EDS, it was found that the calcium-silicon ratio (C/S) at point 1 was higher than that at point 2, and the proportion of Si increased from 8.1% to 15.7%. According to existing research results [39], the degree of polymerization of the silicon–oxygen tetrahedron in the C-S-H gel is inversely proportional to the C/S. When the C/S is low, it has better performance. Therefore, this layer of gel firmly bonds BF with the cement base and the BF also exerts its excellent tensile properties.
Figure 17 is the micromorphology of mortar pores of the B3 group at ultra-high magnification. It can be seen that when F/S = 3, with the aggravation of the secondary hydration reaction, only a small amount of CH crystals were contained in the pores. In contrast, the pores were filled with a large number of needle-like ettringite crystals (AFt) and hydration products such as C-S-H, which together formed a dense space grid structure filling in the pores. Part of the AFt keeps growing and filling in the secondary hydration with mineral additive particles, and finally a desulfurization reaction occurs to generate filamentous or flaky monosulfoaluminate hydrate (AFm), which further improves the compactness of pores. This is also consistent with the result that the macro mechanical strength of B3 is better than that of BC1.
Figure 18 is the microstructure of CGC with different BF contents in each group under the condition of F/S = 3. It can be seen that with the increase in BF content, the original large pores in the structure were divided and filled by a part of the tiny BF, which densifies the cement base to a certain extent and refines the pore structure. In addition, the spherical FA and SF particles also fill some of the pores in the mortar. When BF = 0.18 vol%, too much fiber produces the aggregation effect, which affects the hydration reaction of cement, and then leads to a decrease in the interface adhesion between the BF and mortar, resulting in gaps. This indicates that under the combined action of FA, SF and BF, an appropriate amount of BF is beneficial to the improvement of the internal structure of CGC.

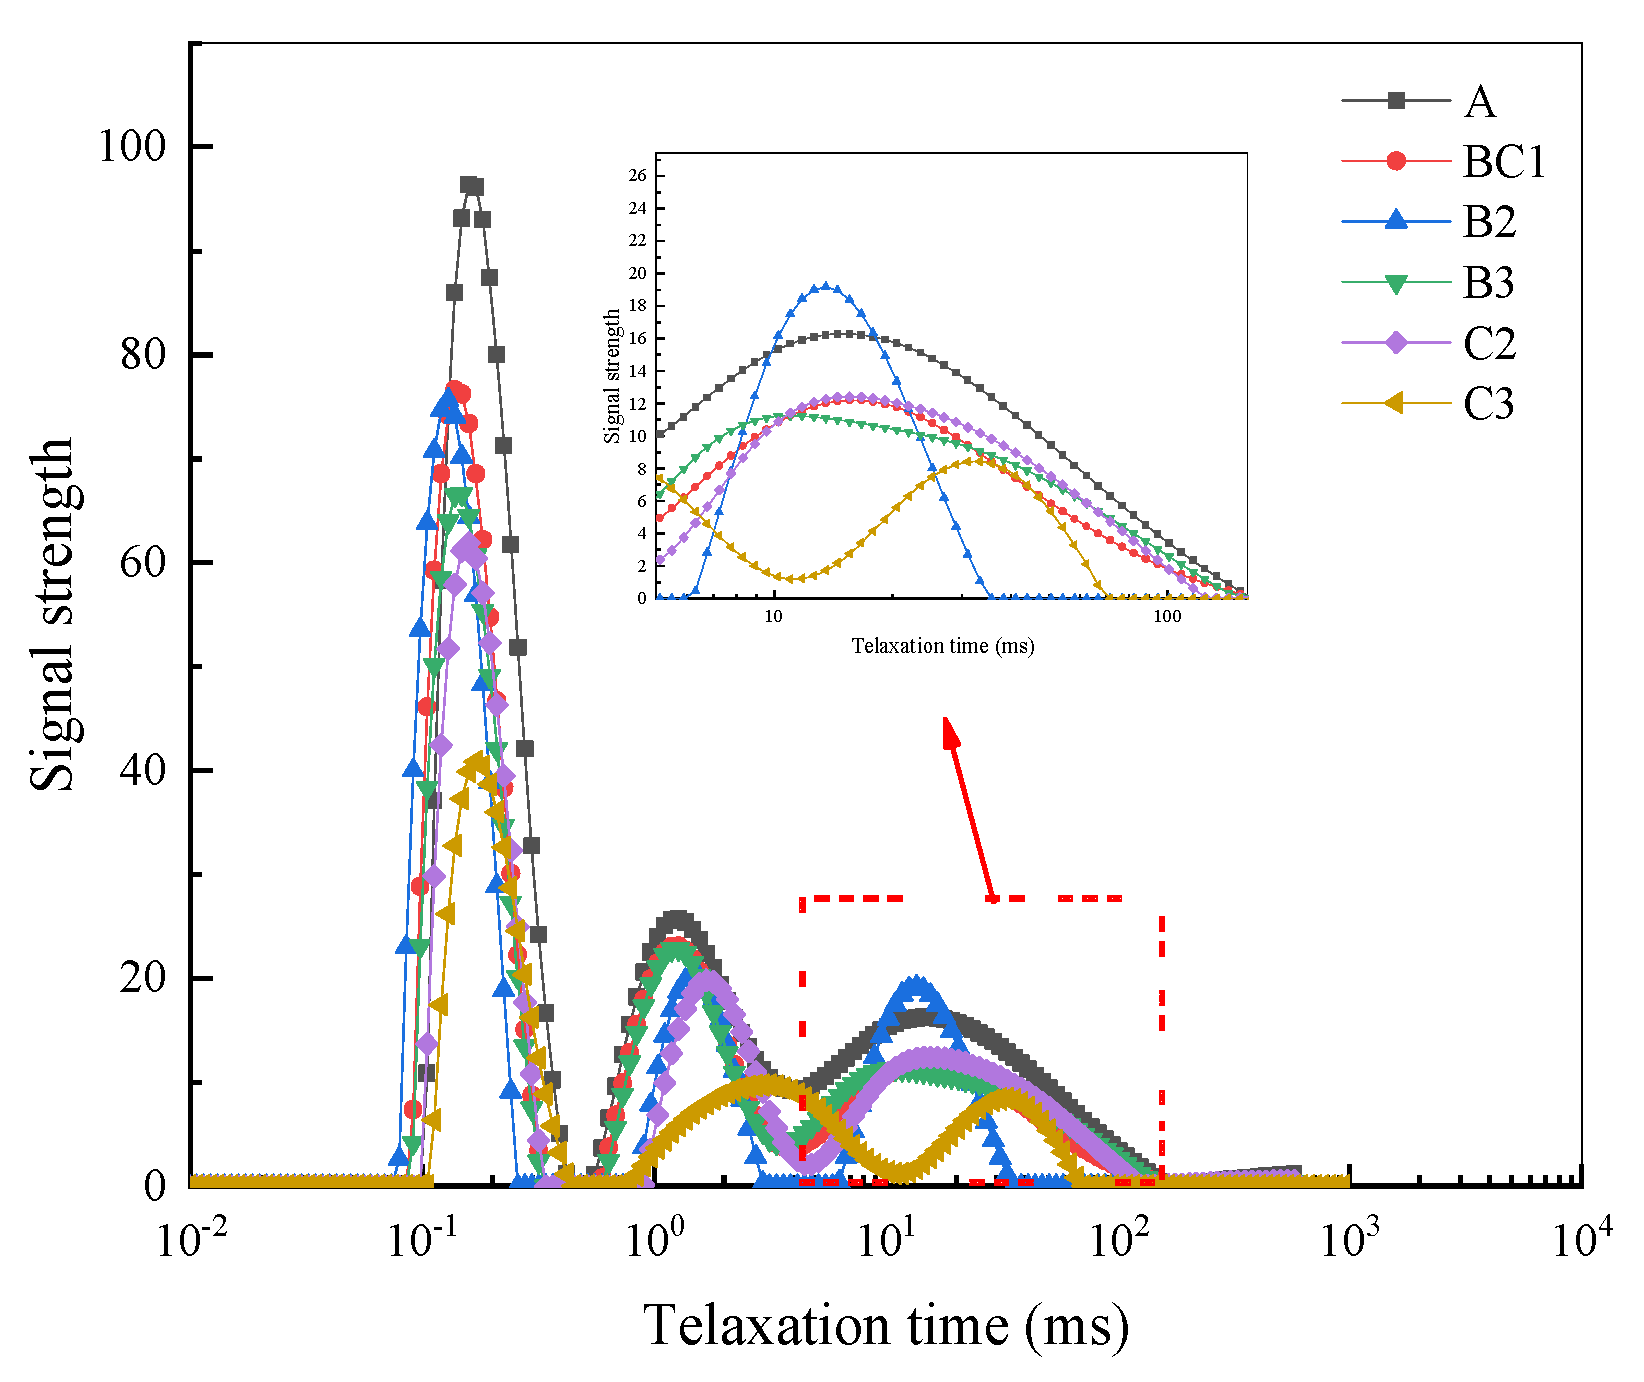
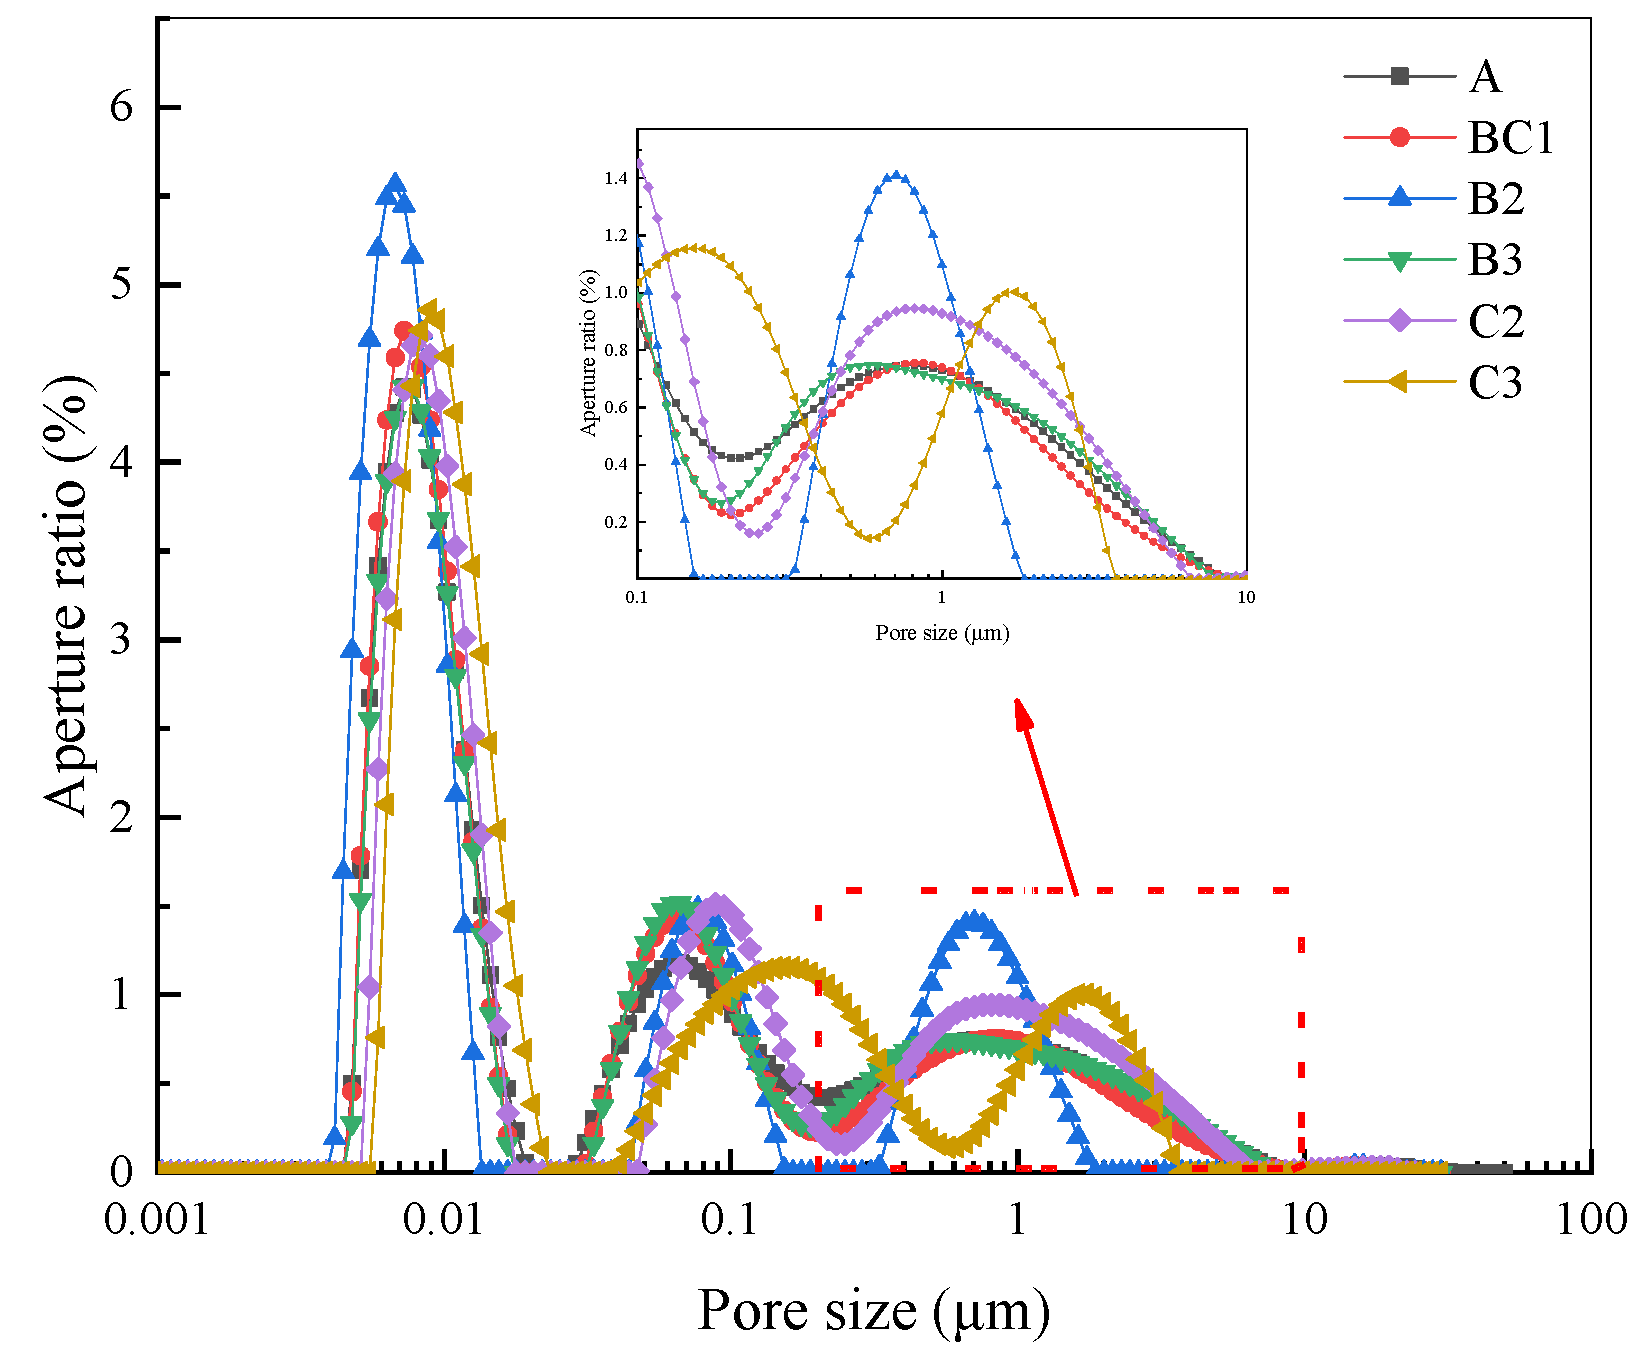
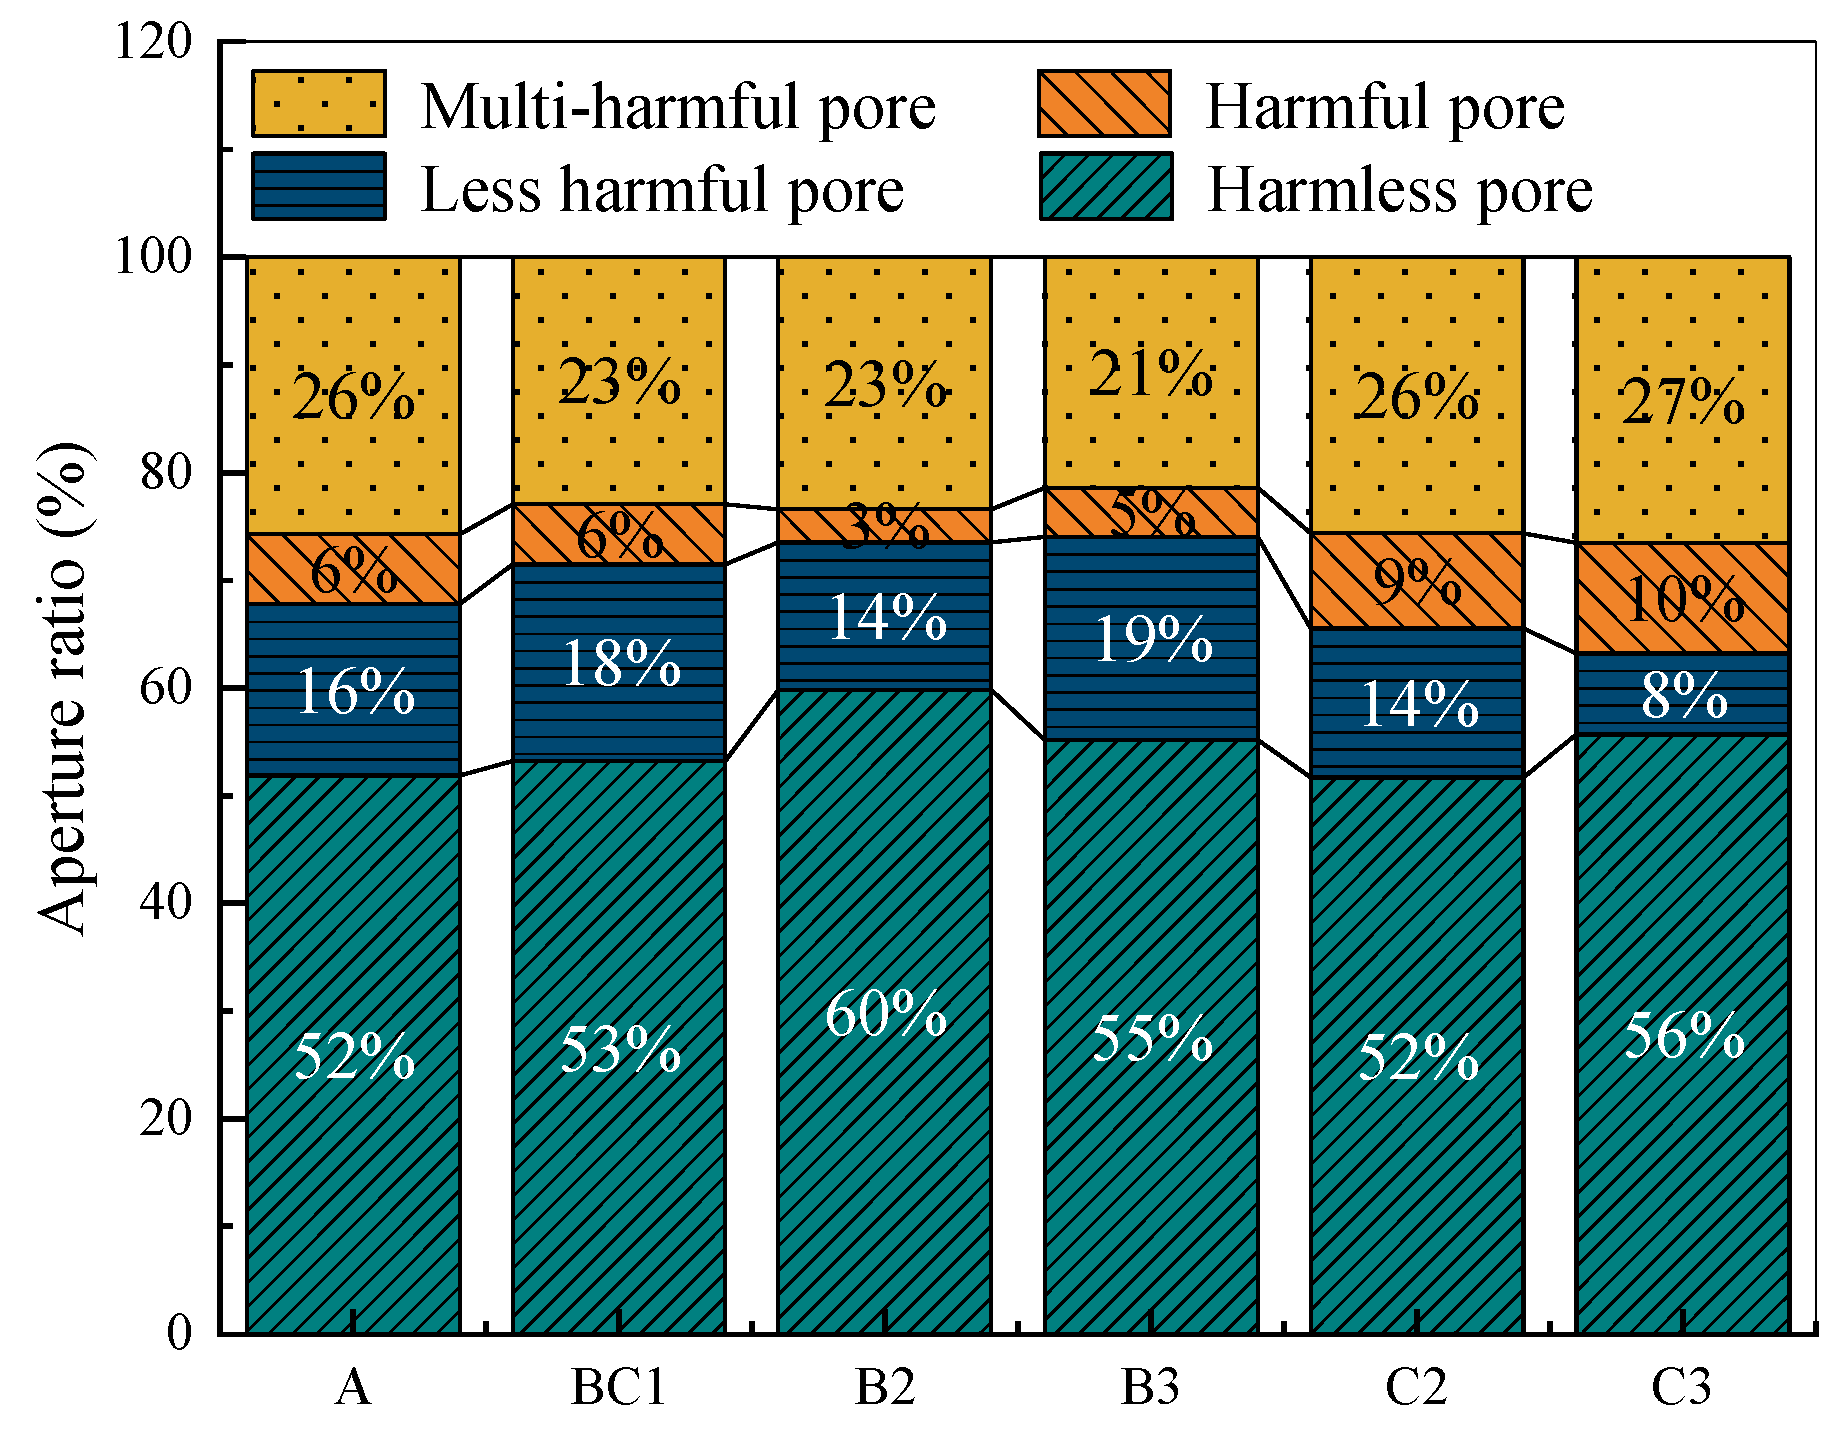
3.3.2. Pore Structure Characteristics

NMR is used to measure the time taken by 1H ions in water in changing from a disordered to ordered state by using an external magnetic field after the water retention treatment of a specimen, that is, the T2 transverse relaxation time [40,41,42]. Since the total signal intensity of T2 is related to the number of 1H contained in the sample, and the number of 1H contained is related to the amount of water molecules in the sample, it is related to the porosity of the sample. Therefore, the internal pore structure of the sample can be characterized by the T2 relaxation time and signal intensity. In addition, an AOS air-entraining agent was added in this experiment, which introduced a large number of pores with a pore size of 0.1~100μm and which also affected the pore structure distribution to a certain extent.
Figure 19 is the T2 relaxation time spectrum of each group of CGC specimens. It can be seen that the first peak accounts for the largest proportion of each group. Compared with the control group A, the signal intensity of the other groups decreased at different relaxation times, and the third peak was the most significant. It can be seen that the pore structure of the other groups was better than that of group A. With the addition of mineral additives, it can be seen that the whole has a tendency to move to the left. The initial relaxation time increased from 0.104 ms to 0.073 ms, the relaxation time became shorter and the relaxation speed accelerated, indicating that with the addition of mineral additives, the internal structures of the specimens were mainly small pores, and the internal structure gradually became denser. Comparing BC1, C2 and C3, it was found that the pore structure of BC1 was more optimized, and the T2 spectrum curves of C2 and C3 showed a tendency to shift to the right, indicating that the relaxation time became longer, the relaxation speed slowed down, and the internal pores began to become larger. Among these curves, the second and third peak shifts of C3 are the most significant. This is because when the BF content reached 0.18 vol%, the fiber content became too much, resulting in an ‘aggregation effect’. As a result, the pore structure deteriorated, the proportion of small pores decreased, and the pores gradually connected and penetrated, shifting to large pores, and resulting in a rapid increase in the proportion of large pores. Corresponding to Table 6, that is, the proportion of the first peak of the T2 relaxation spectrum area of the C3 group decreased, and the proportion of the second and third peaks increased rapidly. This also corresponds to the change rule of the micromorphology in the previous section.
The T2 map is transformed into the pore size distribution map shown in Figure 20 below. According to the results of Mehta PK, the pores can be divided into the following four types: gel pores (<0.01 μm); transition pores (0.01~0.1 μm); capillary pores (0.1~1 μm) and macropores (>1 μm) [43]. Compared with group A, with the addition of mineral additives, the proportion of the first peak of CGC in each group increased significantly, and the first peak shifted to the left, indicating that the pores became smaller, the pore structure was refined, and the mortar was denser. When F/S = 3, it can be seen that the second peak of B3 has shifted significantly to the left, and the waveform diagram has become a ‘thin and high type’. For the third peak, that is, the proportion of capillary pores and macropores, the peak of the B3 group is lower, but the span is still large. The waveform diagram is a ‘short and fat type’, which does not have a significant optimization effect as in the second peak, indicating that the increase in SF content is more significant for the optimization of gel pores and transition pores. Since the price of SF is higher than that of FA, in practical engineering applications, if the economic benefits and modification effect are comprehensively considered, it is recommended to use the ratio of F/S = 2 for compounding.
The pore size distribution curves of BC1, C2 and C3 were observed. It was found that the three peaks of BC1 moved to the left compared with C2 and C3, and the second and third peaks were more significant. In the range of 0.5 μm~1 μm, the peak area of C3 was the smallest, but the third peak appears when the pore size is greater than 1 μm, indicating that the pore gradation of C3 was dominated by macropores and lacked some capillary pores. This is because the BF content was too large, and the three-dimensional grid structure formed by the fiber had a large number of pores in the interior of the fiber agglomeration. Secondly, too much fiber also affected the hydration of the cement on the fiber surface, which eventually led to a large gap at the interface between the BF and mortar (as shown in Figure 18c).
At the same time, the academician Wu Zhongwei [44] proposed a classification of concrete pore sizes comprising: harmless pores (<20 nm), less harmful pores (20~100 nm), harmful pores (100~200 nm) and multi-harmful pores (>200 nm). The calculation results of the pore size distribution of the CGC in each group are shown in Table 7 below.
Figure 21 shows the proportion of pore size distribution. Group A had fewer harmless holes and harmful holes. When the mineral additive was added, the pore size distribution was optimized, and with the increase in F/S, the pore size structure optimization effect was better. Compared with A and B2, the number of multi-harmful pores in B3 decreased by 16.89% and 8.58%, respectively. For engineering composite materials such as concrete, the proportion of multi-harmful pores has a more significant effect on the overall strength. Therefore, even if the proportion of harmless holes in B2 was higher than that in B3, the overall macroscopic mechanical strength is lower than that in B3. With the increase in BF content, the fiber has a certain improvement effect on the pore structure of concrete. Compared with C2, the proportion of harmless pores and less harmful pores in BC1 increased by 9.05%. However, when the content of BF is too much, the effect on macropores is significant. When BF = 0.18 vol%, the harmful pores and multi-harmful pores in C3 increased by 28.91%, resulting in the poor pore structure of C3.

3.4. Modification Mechanism

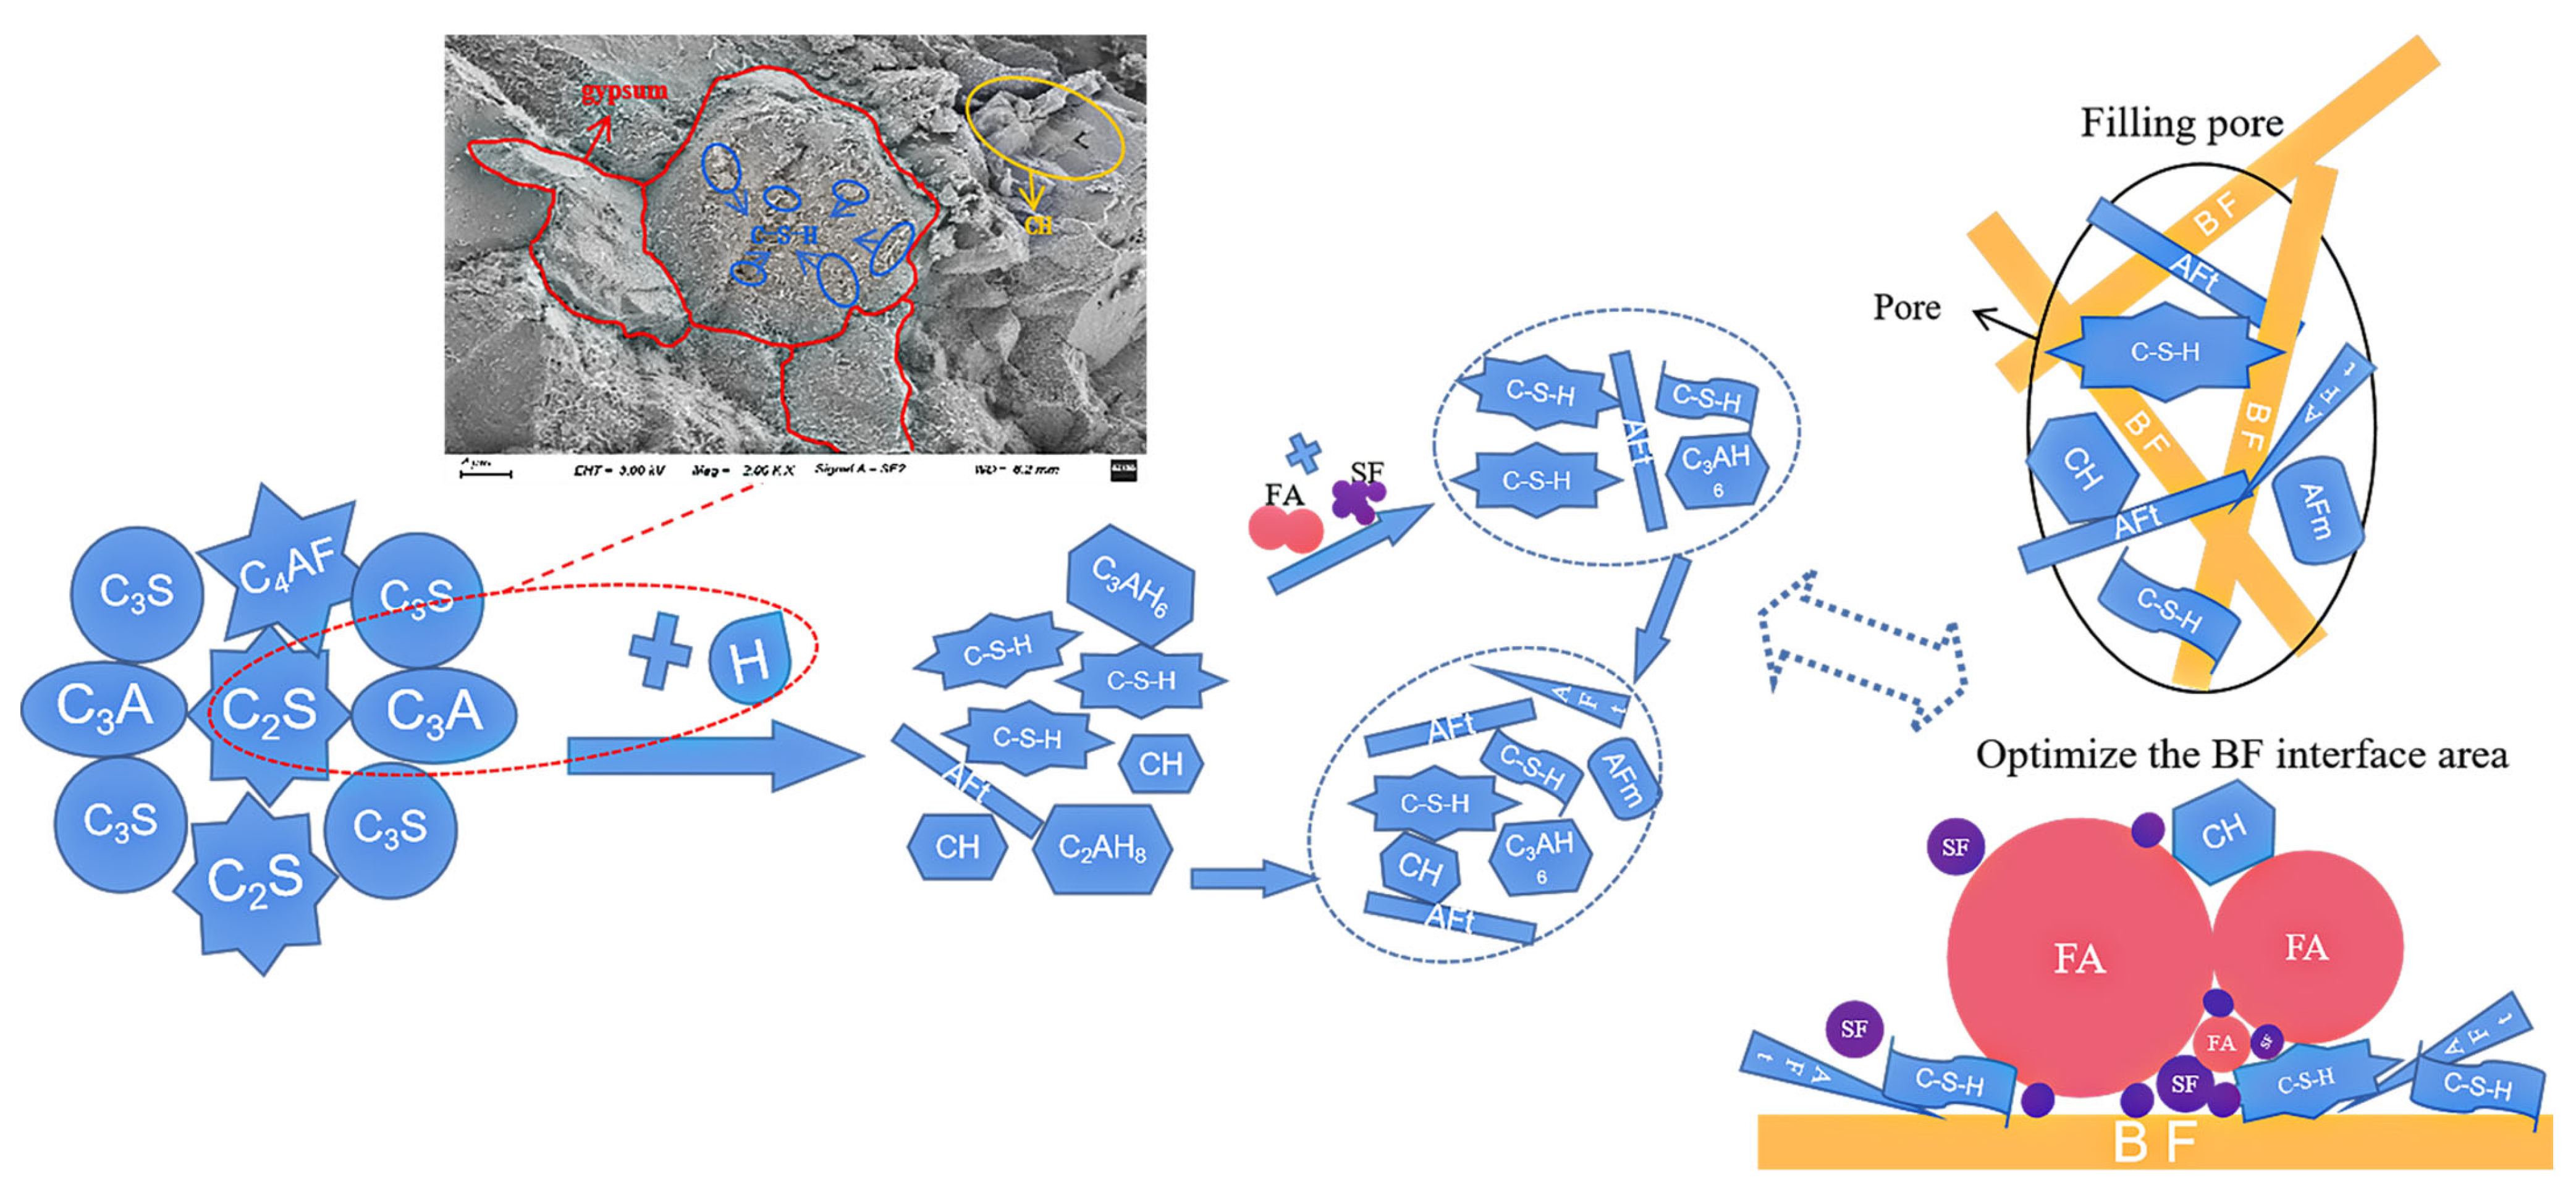
3.4.1. Chemical Modification Mechanism

From the results of the NMR and SEM, it can be seen that when the mineral additives were not added, although a part of the tiny BF could divide and fill the pores, the sample was still mainly composed of capillary pores and macropores with a pore size of about 1 μm, and the gel pores and transition pores did not play a significant optimization effect. At the same time, the interface between the BF and cement base was weak, and the fiber had difficulty in fully exerting its excellent performance. As shown in Figure 22, cement hydration is a process of dissolution and precipitation [45,46,47,48]. The main mineral components in cement clinker include tricalcium silicate (C3S), dicalcium silicate (C2S), tricalcium aluminate (C3A) and tetracalcium ferrite (C4AF). After adding FA and SF, the basic chemical reaction mainly includes the following processes:
(1)
2C3S + 6H→C-S-H + 3CH
(2)
2C2S + 4H→C-S-H + CH
(3)
SiO2 + Al2O3 + nCH + mH→nC-S-H
(4)
xCa(OH)2 + ySiO2 + zH2O→xCaO·ySiO2·(x + z)H2O
(5)
(Secondary hydration reaction)
In the initial stage, C3S and C2S react rapidly with water to form C-S-H gel and a large amount of CH, which also causes the cement paste to contain a large amount of OH, showing an alkaline environment. The network composed of SiO2 and Al2O3 in FA and SF is eroded by the OH, resulting in the fracture of the tetrahedral network of Si-O-Si, and the Al in Al-O is replaced by Si. At the same time, a large amount of CH with a small specific surface area and poor cohesion is consumed to form C-S-H gel and AFt, which are embedded in the pores of mortar and the BF surface, making the interface area more compact and enhancing the interface adhesion. And this layer of gel has a low C/S, so it firmly bonds BF to the cement base, ensuring that the excellent performance of BF can be exerted. At the same time, this paper also gives a more accurate chemical equation of the volcanic ash reaction (secondary hydration reaction), in which Ca1.5SiO3.5·xH2O is a crystal form of C-S-H formed by the system. Relevant studies have found that with an increase in curing time [49], the crystallinity and polymerization degree of C-S-H formed by the reaction increase. In addition, the ‘micropump effect’ of coal gangue aggregate [50] absorbs some water molecules into the micropores on the surface of coal gangue aggregate during cement hydration, resulting in an increase in OH- concentration, which in turn promotes the secondary hydration reaction of FA and SF.
(1)
C3A + 18H→C2AH8 + C4AH13→C3AH6
(2)
C4AF + 13H→C4(A,F)H13
C2AH8 and C4AH13 are hexagonal plate-like crystals formed by the reaction of C3A with water. However, since the hexagonal hydrate is metastable, it is converted into stable cubic C3AH6 crystal particles. At the same time, C3A also reacts with gypsum to form AFt. If the gypsum is exhausted, the C3A continues to react with AFt to form AFm, which forms a dense space grid and fills in the pores of the mortar (Figure 17b). The hydration of C4AF is similar to that of C3A, and it eventually becomes a solid solution containing ferrum and aluminum. From the SEM diagram in Figure 22, it can be seen that there was still a certain amount of gypsum in CGC, and a layer of flocculent C-S-H was wrapped on the surface of the gypsum to form a continuous dense structure, indicating that the reaction between C3A and gypsum is more sufficient. The hydration of C3A generates a large amount of AFt and the C-S-H generated by the hydration of calcium silicate further densifies the interface between mortar and fiber.

3.4.2. Physical Modification Mechanism

The physical modification of CGC by FA and SF is mainly reflected in the early stage of cement hydration, which acts on the hydration and hardening process of composite cementitious materials in the form of physical filling. On the one hand, SF and FA particles are spherical beads, their compressive strength can reach 700 MPa, and their particle sizes are different. As shown in Figure 23, these unreacted spherical microspheres produce an overlapping effect while exerting the micro-aggregate filling effect. FA particles fill the gap between cement particles, and SF particles fill the gap between FA particles, which in turn complement the pores in the structure, complementing each other and reducing shrinkage. In particular, they fill the channels of capillary pores and macropores in the slurry, and refine the pore gradation, thereby improving the mechanical properties and frost resistance of CGC. On the other hand, FA has a morphological effect, which is mainly reflected in the fact that the glass beads in FA can play a role in lubrication and rolling in the process of cement mixing. At the same time, the electric double layer structure on the surface of FA particles also enhances the lubrication effect, which improves the poor fluidity of CGC due to the ‘micropump effect’ and large water absorption of coal gangue. For example, the BC1 group had good fluidity and workability, and the slump reached 165 mm. With the increase in the SF incorporation ratio, the slump of each group of specimens gradually decreased, but they still had good fluidity. The slump test results of each group of CGC are shown in Figure 24.

3.4.3. The Influence Mechanism of Excess BF on the Performance of CGC

In terms of the influence on the mechanical properties, when excessive BF was mixed in, first in the early stage of concrete mixing, there was a need for more cement paste to wrap, making the early stage of the cement hydration reaction insufficient and the resulting cement mortar was not dense. Then, in the initial setting period of the concrete, due to the agglomeration of fibers, many pores were formed inside and around the agglomeration. These pores cause a loss of water molecules during the hydration reaction, resulting in a decrease in the CH generated by the hydration reaction of calcium silicate. However, excessive BF requires more CH, resulting in no dense C-S-H gel being formed on the BF surface. Finally, due to the lack of dense filling of hydration products, the pores formed in the initial setting period condensed in the final setting period of concrete, causing damage to the structure. Therefore, the mechanical properties and microstructure of the C3 group were significantly deteriorated. At the same time, excessive fiber also produces more friction resistance in the process of concrete mixing, like the concrete skeleton, which makes the shape of the fresh concrete difficult to change and inhibits the fluidity of CGC (as shown in Figure 24).
For the influence on frost resistance, on the one hand, with the incorporation of BF, a part of the tiny BF divides and fills the larger pores in the structure, which plays a role in optimizing the pore structure. On the other hand, BF has excellent natural tensile properties. In the process of freeze–thaw cycles, frost heaving force will be generated due to water freezing. But the three-dimensional grid structure formed by BF will play the role of a ‘mortar skeleton’ and offset part of the frost heaving force, so that the mortar does not fall off so easily. However, excessive BF will produce more pores, resulting in a stress concentration and increasing the frost heaving force. This is also reflected in the frost resistance of C3 group being worse than that of C2 and BC1.

4. Conclusions

In this paper, the effects of different F/S and BF contents on the mechanical properties and frost resistance of CGC are introduced. The modification mechanism of FA and SF on CGC and the influence mechanism of excessive BF on CGC performance are discussed in combination with the microstructure characteristics and pore gradation. The main conclusions are as follows:
(1)
The addition of mineral additives can improve the mechanical properties and frost resistance of CGC, and with the decrease in F/S, the improvement effect is better. When F/S = 1 and BF = 0.15 vol%, the performance is the best.
(2)
The modification mechanism of FA and SF on CGC is mainly reflected in the improvement of pore structure and pore gradation. Chemically, the hydration products generated by the volcanic ash reaction can compact the cement mortar and improve the adhesion between BF and mortar interface. Physically, FA and SF particles exert a filling effect and overlapping effect, which can complement each other, reduce shrinkage and improve performance.
(3)
The appropriate amount of BF can split and fill the large pores, optimize the pore structure, and reduce the frost heaving force during the freeze–thaw cycle. However, excessive BF will not only produce an agglomeration effect, but also hinder the hydration of cement.
(4)
Considering the economic benefits and modification effects, it is recommended to use the ratio of F/S = 2 in practical engineering applications.

Author Contributions

J.Q. and Y.H.: Conceptualization, Investigation, Data analysis, Writing—review and editing, Methodology. Z.F., L.L. and J.W.: Data collection, Formal analysis. Y.Z. and X.G.: Writing—review and editing. All authors have read and agreed to the published version of the manuscript.

Funding

This research was funded by the National Natural Science Fund for Young Scholars (51808443), the General Project of Shaanxi Natural Science Basic Research Program (2018JM5167) and the Postdoctoral Science Fund of China (2017M613166).

Data Availability Statement

Data underlying the results presented in this paper are not publicly available at this time but may be obtained from the corresponding author upon reasonable request.

Conflicts of Interest

The authors declare no conflict of interest.

References

  1. Tian, Y.; Liu, X.; Zhang, M. Research Status and Prospect of Microbial Promotion of Coal Gangue Reclamation and Utilization. Silic. Notif. 2015, 34, 2529–2533. [Google Scholar] [CrossRef]
  2. Zhang, B.; Tong, H.; Long, X.; Su, P.; He, X.; Zhang, Y. Research Status and Progress of High Value Utilization of Coal Gangue Solid Waste [J/OL]. Clean Coal Technology: 1–15. Available online: http://kns.cnki.net/kcms/detail/11.3676.td.20230524.1257.002.html (accessed on 17 September 2023).
  3. Jin, X.; Wang, S.; Xiao, Y.; Guo, Y.; Song, H. Research on resource characteristics and synergistic utilization of red mud and fly ash. J. Guizhou Univ. (Nat. Sci. Ed.) 2022, 39, 18–26. [Google Scholar]
  4. Yi, L.; Wang, H.; Wang, X. Research progress of resource utilization of fly ash building materials. Silic. Bull. 2012, 31, 88–91. [Google Scholar] [CrossRef]
  5. Sun, D.; Gu, Z.; Sun, S.; Gong, X.; Tian, Q. Performance and characterization of alkali-activated fly ash-silica fume based geopolymer. Silic. Bull. 2020, 39, 1533–1539. [Google Scholar] [CrossRef]
  6. Feng, Y.; Shi, L.; Ma, D.; Chai, X.; Lin, C.; Zhang, F. Road Performance Evaluation of Unburned Coal Gangue in Cold Regions. Sustainability 2023, 15, 13915. [Google Scholar] [CrossRef]
  7. Bai, G.; Liu, H.; Wang, J.; Zhu, K.; Dai, M. Drying shrinkage model of coal gangue concrete based on the difference of aggregate characteristics. J. Civ. Eng. 2023. [Google Scholar] [CrossRef]
  8. Li, Y.; Xing, Y.; Zhang, X.; Yan, X. Experimental Study on Durability of Coal Gangue Aggregate Concrete. Coal J. 2013, 38, 1215–1219. [Google Scholar] [CrossRef]
  9. Ge, J.; Zhu, H.; Li, Z.; Li, W.; Shen, Z.; Hou, J.; Yang, S. Study on the mechanical and durability properties of coal gangue coarse aggregate-geopolymer concrete. Mater. Bull. 2021, 35, 218–223. [Google Scholar]
  10. Guan, X.; Qiu, J.; Song, H.; Qin, Q.; Zhang, C. Stress-strain behaviour and acoustic emission characteristic of gangue concrete under axial compression in frost environment. Constr. Build. Mater. 2019, 220, 476–488. [Google Scholar] [CrossRef]
  11. Su, L. Experimental Study on Basic Mechanical Properties of Coal Gangue Concrete; Xi’an University of Architecture and Technology: Xi’an, China, 2022. [Google Scholar] [CrossRef]
  12. Zhang, J.; Chen, W.; Jin, S.; Chen, C.; Yang, R. Study on the durability of coal gangue aggregate concrete. J. Beijing Univ. Technol. 2011, 37, 116–125. [Google Scholar]
  13. Guan, X.; Qiu, J.; Dai, J.; Xiao, Q.; Zhang, C. Study on acoustic emission characteristics and damage model of coal gangue concrete under axial compression. J. Build. Mater. 2019, 22, 459–466. [Google Scholar]
  14. Huang, H.; Zhu, L.; Huang, M.; Wang, Y.; Ding, Z. Performance research and current situation analysis of modified concrete with different materials. Silic. Bull. 2018, 37, 1887–1896. [Google Scholar]
  15. Li, W.; Long, C.; Luo, Z.; Huang, Z.; Long, B.; Ren, J. Review on failure mechanism and modification of recycled aggregate concrete. J. Build. Sci. Eng. 2016, 33, 60–72. [Google Scholar]
  16. Jiao, C.; Zhang, X.; Chen, W.; Chen, X. Mechanical Property and Dimensional Stability of Chopped Basalt Fiber-Reinforced Recycled Concrete and Modeling with Fuzzy Inference System. Buildings 2022, 13, 97. [Google Scholar] [CrossRef]
  17. Yao, X.; Pei, Z.; Zheng, H.; Guan, Q.; Wang, F.; Wang, S.; Ji, Y. Review of Mechanical and Temperature Properties of Fiber Reinforced Recycled Aggregate Concrete. Buildings 2022, 12, 1224. [Google Scholar] [CrossRef]
  18. Zhu, M.; Qiu, J.; Chen, J. Effect and mechanism of coal gangue concrete modification by basalt fiber. Constr. Build. Mater. 2022, 328, 126601. [Google Scholar] [CrossRef]
  19. Guo, W.; Wen, H. Experimental Study on the Strength of Coal Gangue Aggregate Concrete with Basalt Fiber. J. Phys. Conf. Ser. 2022, 2185, 012059. [Google Scholar]
  20. Yao, X.; Guo, X.; Han, R.; Guan, J.; Li, H. Effect of nano-SiO2 and polypropylene fiber on mechanical properties and microstructure of coal gangue aggregate concrete. J. Compos. Materials. 2023. [Google Scholar] [CrossRef]
  21. Cai, B.; Bai, B.; Duan, W.; Wang, L.; Wang, S. Study on the Eccentric Compressive Performance of Steel Fibre Reinforced Coal Gangue Concrete Columns. Buildings 2023, 13, 1290. [Google Scholar] [CrossRef]
  22. Qiu, J.; Zhu, M.; Zhou, Y.; Guan, X. Effect and mechanism of coal gangue concrete modification by fly ash. Constr. Build. Mater. 2021, 294, 123563. [Google Scholar] [CrossRef]
  23. Qiu, J.; Zhou, Y.; Guan, X.; Zhu, M. The influence of fly ash content on ITZ microstructure of coal gangue concrete. Constr. Build. Mater. 2021, 298, 123562. [Google Scholar] [CrossRef]
  24. Meng, Y.; Tan, Y.; Li, R. Strength Studies of High Performance Concrete with Fly-Ash and Gangue. Adv. Mater. Res. 2012, 1615, 3544–3553. [Google Scholar] [CrossRef]
  25. Zhang, X.; Kuang, C.; Fang, Z.; Liu, X.; Wang, G.; Lai, S. Orthogonal experimental study on strength of steel fiber fly ash recycled concrete. J. Build. Mater. 2014, 17, 677–684 + 694. [Google Scholar]
  26. Xin, Z.; Zhu, Y.; Xu, P.; Ren, Y.; Zhang, Q. Effect of fly ash and polypropylene fiber on the performance of recycled pervious concrete. Concrete 2023, 73–77 + 81. [Google Scholar]
  27. Li, W. Experimental Study on Strength and Crack Resistance of Glass Fiber Fly Ash Coal Gangue Aggregate Concrete. Build. Struct. 2020, 50, 49–53. [Google Scholar] [CrossRef]
  28. Yang, Q.; Jing, Y.; Zhang, D. Study on the modification of mechanical properties of coal gangue concrete by fiber and mineral admixtures. Funct. Mater. 2022, 53, 7150–7156. [Google Scholar]
  29. Wu, Z. High performance concrete and its fine mineral admixture. Build. Technol. 1999, 30, 160–163. [Google Scholar]
  30. JGJ/55-2011; Specification for Mix Proportion Design of Ordinary Concrete. China Academy of Building Research: Beijing, China, 1 December 2011.
  31. Qiu, J.; Zhu, M.; Zhou, Y.; Gao, X.; Li, L. Modification effect of fly ash on interfacial transition zone of coal gangue concrete. Mater. Introd. 2023, 37, 75–81. [Google Scholar]
  32. Qiu, J.; Zhou, Y.; Nikolay, I.; Gao, X.; Shukhrat, S.; Khon, K. Damage constitutive model of coal gangue concrete under freeze-thaw cycles. Constr. Build. Mater. 2023, 264, 120720. [Google Scholar] [CrossRef]
  33. Li, J.; Chen, L.; Luo, J.; Zhu, W.; Fan, X.; Zhu, Y.; Zhang, Z. Mechanical properties and microscopic characteristics of steel fiber coal gangue concrete. Front. Mater. 2023, 10. [Google Scholar] [CrossRef]
  34. GB/T50080-2002; Standard for Performance Test Method of Ordinary Concrete Mixture. China Academy of Building Research: Beijing, China, 2007.
  35. GB/T50081-2019; Standard for Test Methods of Mechanical Properties of Ordinary Concrete. China Academy of Building Research: Beijing, China, 2019.
  36. GB/T 50082-2009; Standard for Test Methods of Long-Term Performance and Durability of Ordinary Concrete. China Academy of Building Research: Beijing, China, 2007.
  37. Guan, X.; Shi, H.; Chen, L.; Warren, A.D. Alkali-activated complex binders from class C fly ash and Ca-containing admixtures. J. Hazard. Mater. 2010, 173, 480–486. [Google Scholar]
  38. Zhao, X. Synthesis, Composition, Structure and Morphology of Calcium Silicate Hydrate; Wuhan University of Technology: Wuhan, China, 2010. [Google Scholar]
  39. Dadsetan, S.; Bai, J. Mechanical and microstructural properties of self-compacting concrete blended with metakaolin, ground granulated blast-furnace slag and fly ash. Constr. Build. Mater. 2017, 146, 658–667. [Google Scholar] [CrossRef]
  40. Heijden DV, G.; Pel, L.; Adan, O. Fire spalling of concrete, as studied by NMR. Cem. Concr. Res. 2012, 42, 265–271. [Google Scholar] [CrossRef]
  41. Pop, A.; Badea, C.; Ardelean, I. The Effects of Different Superplasticizers and Water-to-Cement Ratios on the Hydration of Gray Cement Using T_2-NMR. Appl. Magn. Reson. 2013, 44, 1223–1234. [Google Scholar] [CrossRef]
  42. Shen, Y.; Wang, Y.; Wei, X.; Jia, H.; Yan, R. Investigation on meso-debonding process of the sandstone–concrete interface induced by freeze–thaw cycles using NMR technology. Constr. Build. Mater. 2020, 252, 118962. [Google Scholar] [CrossRef]
  43. Mehta, P.K.; Monteiro, P.J.M. Concrete: Microstructure, Properties, and Materials; McGraw-Hill Professional: New York, NY, USA, 2014. [Google Scholar]
  44. Wu, Z. Discussion on the recent development direction of concrete science and technology. J. Silic. 1979, 3, 262–270. [Google Scholar]
  45. Cheng, H.; Wu, A.; Wang, Y.; Wang, H.; Wang, S. Fractal characterization and dynamic characteristics of microstructure of fly ash-cement paste. J. Rock Mech. Eng. 2016, 35, 4241–4248. [Google Scholar] [CrossRef]
  46. Zhang, Q. The Mechanism of Fly Ash in the Hydration Process of Composite Cementitious Materials; Tsinghua University: Beijing, China, 2007. [Google Scholar]
  47. Taylor, H.F.W. Cement Chemistry, 2nd ed.; Thomas Telford Edition Published: London, UK, 1997. [Google Scholar]
  48. Win, T.T.; Panwisawas, C.; Jongvivatsakul, P.; Pansuk, W.; Prasittisopin, L. Effects of Fly Ash Composition to Mitigate Conversion of Calcium Aluminate Cement Composites. Buildings 2023, 13, 2453. [Google Scholar] [CrossRef]
  49. Wu, J.; Liao, H.; Ma, Z.; Song, H. Effect of different initial CaO/SiO2 molar ratios and curing times on the preparation and formation mechanism of calcium silicate hydrate. Materials 2023, 16, 717. [Google Scholar] [CrossRef]
  50. Qiu, J.; Yang, Z.; Guan, X.; Xing, M.; Zhang, C.; Qin, Q. Microscopic pore structure characteristics and compressive strength of coal gangue ceramsite concrete. J. Xi’an Univ. Sci. Technol. 2020, 40, 110–117. [Google Scholar] [CrossRef]
Figure 1. Experimental study plan.
Buildings 13 02756 g001
Figure 2. The apparent morphology of coal gangue aggregate and BF.
Buildings 13 02756 g002
Figure 3. Flow chart of specimen making and premixed cement mortar method.
Buildings 13 02756 g003
Figure 4. Mechanical properties test and schematic diagram.
Buildings 13 02756 g004
Figure 5. Fast freeze–thaw test and dynamic elastic modulus detection method. Note: 1—CGC specimen; 2—rubber sleeve; 3—water; 4—temperature sensor; 5—antifreeze solution; 6—shell; 7—fixed support; 8—non-metallic detector.
Buildings 13 02756 g005
Figure 6. SEM-EDS test.
Buildings 13 02756 g006
Figure 7. Mechanical properties of modified CGC.
Buildings 13 02756 g007aBuildings 13 02756 g007b
Figure 8. Modified CGC splitting tensile failure interface.
Buildings 13 02756 g008
Figure 9. Bending failure form.
Buildings 13 02756 g009
Figure 10. The flexural failure section of group C3(The red circles represent holes in the structure).
Buildings 13 02756 g010
Figure 11. The apparent morphology of group A under different N.
Buildings 13 02756 g011
Figure 12. The apparent morphology of CGC under different F/S.
Buildings 13 02756 g012
Figure 13. The apparent morphology of CGC with different BF content.
Buildings 13 02756 g013
Figure 14. Mass loss rate and relative dynamic elastic modulus of each group of specimens under different N.
Buildings 13 02756 g014
Figure 15. The microstructure of the group A mortar area.
Buildings 13 02756 g015
Figure 16. Microstructure of CGC after incorporation of mineral additives.
Buildings 13 02756 g016
Figure 17. Microstructure of group B3 specimens.
Buildings 13 02756 g017
Figure 18. The microstructure of the specimens with different BF contents.
Buildings 13 02756 g018
Figure 19. T2 map of CGC in each group.
Buildings 13 02756 g019
Figure 20. Pore size distribution of CGC in each group.
Buildings 13 02756 g020
Figure 21. Proportion of pore size gradation.
Buildings 13 02756 g021
Figure 22. FA and SF participation in the secondary hydration process.
Buildings 13 02756 g022
Figure 23. Micro-aggregate effect and morphological effect.
Buildings 13 02756 g023
Figure 24. The slump test results of CGC in each group.
Buildings 13 02756 g024
Table 1. Mass fraction of chemical composition of cement and mineral additives (%).
MaterialSiO2Al2O3Fe2O3CaOMgOSO3LOI
Cement18.30–21.54.80–5.152.90–5.1564.73–68.050.8–1.160.00–1.252.13–3.22
FA53.46–69.8723.08–28.062.39–3.780.10–2.770.78–1.870.81–1.382.30–2.48
SF94.05–97.920.00–0.450.05–1.090.29–1.170.13–0.890.03–2.361.28–2.50
Table 2. Physical properties of coarse aggregate.
Coarse AggregateApparent Density
(kg/m3)
Packing Density
(kg/m3)
Water Absorption
(%)
Crushing Index
(%)
Natural aggregate2870–28801469–15500.5–0.66.3–7.0
Coal gangue 2247–22911350–13977.14–7.3817.7–18.9
Table 3. Main performance indexes of BF.
Length (mm)Diameter
(μm)
Linear Density (Tex)Tensile Strength (MPa)Elastic Modulus
(GPa)
Fracture Strength
(N/Tex)
30102392–23993000–480062–910.69–0.71
Table 4. Chemical composition of BF (%).
CompositionSiO2MgOCaOAl2O3Fe4O3+FeON2O+K2OOthers
Content51.6–58.92.9–5.25.8–9.215.1–18.99.1–13.53.4–5.30.08–0.12
Table 5. Mix proportion (kg/m3).
GroupWaterCementSandStoneCoal GangueFASFBFPCAAOS
A176440 624696 363000.15%2.200.13
BC1176352624696 36366220.15%2.200.13
B2176352624696 36357310.15%2.200.13
B3176352624696 36344440.15%2.200.13
C2176352624696 36366220.12%2.200.13
C3176352624696 36366220.18%2.200.13
Table 6. The area of T2 relaxation spectra of CGC in each group.
GroupPeak AreaProportion of Peak%
First PeakSecond PeakThird Peak
A2179.95052.37422.08225.544
BC11617.74854.13922.69823.162
B21460.46055.83628.22215.942
B31504.65462.12421.76116.115
C21413.40451.13024.65924.211
C31228.55050.17424.14225.684
Table 7. Proportion of pore gradation of each group of specimens (%).
ClassificationABC1B2B3C2C3
Harmless pores51.8453.2259.8255.1751.6955.70
Less harmful pores15.9518.2413.7018.8513.847.51
Harmful pores6.455.613.064.578.8110.25
Multi-harmful pores25.7622.9323.4221.4125.6626.54
Disclaimer/Publisher’s Note: The statements, opinions and data contained in all publications are solely those of the individual author(s) and contributor(s) and not of MDPI and/or the editor(s). MDPI and/or the editor(s) disclaim responsibility for any injury to people or property resulting from any ideas, methods, instructions or products referred to in the content.

