Article

Evaluation of Biogas and Solar Energy Coupling on Phase-Change Energy-Storage Heating Systems: Optimization of Supply and Demand Coordination

1
College of Animal Science, Shanxi Agricultural University, Taiyuan 030031, China
2
Institute of the Building Environment & Sustainability Technology, School of Human Settlements and Civil Engineering, Xi’an Jiaotong University, Xi’an 710049, China
3
Department of Civil, Environmental & Geomatic Engineering, University College London, London WC1E 6BT, UK
*
Authors to whom correspondence should be addressed.
Buildings 2023, 13(11), 2712; https://doi.org/10.3390/buildings13112712
Submission received: 1 September 2023 / Revised: 14 October 2023 / Accepted: 25 October 2023 / Published: 27 October 2023
(This article belongs to the Section Building Energy, Physics, Environment, and Systems)

Abstract

:
Biogas heating plays a crucial role in the transition to clean energy and the mitigation of agricultural pollution. To address the issue of low biogas production during winter, the implementation of a multi-energy complementary system has become essential for ensuring heating stability. To guarantee the economy, stability, and energy-saving operation of the heating system, this study proposes coupling biogas and solar energy with a phase-change energy-storage heating system. The mathematical model of the heating system was developed, taking an office building in Xilin Hot, Inner Mongolia (43.96000° N, 116.03000° E) as a case study. Additionally, the Sparrow Search Algorithm (SSA) was employed to determine equipment selection and optimize the dynamic operation strategy, considering the minimum cost and the balance between the supply and demand of the building load. The operating economy was evaluated using metrics such as payback period, load ratio, and daily rate of return. The results demonstrate that the multi-energy complementary heating system, with a balanced supply and demand, yields significant economic benefits compared to the central heating system, with a payback period of 4.15 years and a daily return rate of 32.97% under the most unfavorable working conditions. Moreover, the development of a daily optimization strategy holds practical engineering significance, and the optimal scheduling of the multi-energy complementary system, with a balance of supply and demand, is realized.

1. Introduction

With the advancement of society, there is a growing demand for energy, leading to the continuous transformation of the energy structure. Currently, fossil energy constitutes the largest proportion of the overall energy structure [1]. However, due to the non-renewable nature of fossil energy and its detrimental impact on the environment, it has become a bottleneck for economic and social development [2,3,4]. As a major energy consumer, the building sector urgently requires the coordinated development of energy, the economy, and environmental protection. In this context, sustainable energy development becomes an inevitable choice, with renewable energy being the only path towards achieving sustainability in the building sector.
Winter heating is of great importance to residents in northern China [5]. The utilization of clean and efficient renewable energy heating technology not only contributes to the energy transformation of buildings, but also plays a crucial role in creating a healthy and comfortable living environment [6]. As China is a country with a significant agricultural sector, the application of biomass energy in building heating is a valuable approach to realizing the transformation and upgrading of the energy system [7,8]. In recent years, the breeding industry has witnessed large-scale and concentrated operations, and the utilization of farm manure as a raw material for biogas production has effectively improved the efficiency of biomass energy utilization while addressing agricultural pollution [9,10]. Picardo et al. [11] integrated a sewage treatment plant with a district heating system, demonstrating an annual reduction potential of 1.8 MtCO2e through the operation of the sewage–biogas heating system. Xu et al. [12] designed a biogas building energy supply system, considering variations in outdoor temperature and humidity. This research revealed that lower outdoor temperatures resulted in better energy conservation, with an energy conservation rate of 37% during winter.
However, due to the low outdoor temperatures in winter, biogas production is insufficient to meet the thermal demands of individual users. Therefore, the integration of other renewable energy systems for auxiliary heating becomes necessary [13,14,15]. Alkhamis et al. [16] coupled solar energy with biogas reactors to provide the necessary heat for biogas production, achieving an internal rate of return (IRR) of 32.7% on the investment in the solar system. Tiwari et al. [17] conducted research on photovoltaic thermal integration systems for biogas heating, demonstrating that the addition of solar energy increased biogas production. Xue et al. [18] integrated a biogas power generation system with an energy-storage system, resulting in a payback time of 4.35 years, which is a reduction compared to traditional systems. In this context, the design of a multi-energy complementary system coupled with biogas and incorporating a heat-storage device becomes a promising approach to ensure system stability.
Given the complex structure and various operating conditions of heating systems, optimizing the configuration and scheduling strategy is crucial to ensuring system economy and stability [19,20]. Cao et al. [21] developed a novel biogas-cogeneration system and utilized genetic algorithms to optimize significant design parameters, achieving a win-win situation in terms of economy and energy efficiency. Arslan et al. [22] modeled a combined heat, electricity, and gas supply system for a biogas power plant, analyzing the distribution of electricity, heating, and cooling load at optimal cost. The results presented a 39.5% increase in the overall energy efficiency of the plant. Castley et al. [23] proposed an integrated energy-supply system consisting of an anaerobic tank and a biogas boiler, optimizing the scheduling of eight working conditions and reducing system emissions by as much as 93.7%. However, many studies have neglected the dynamic performance of the relationship between supply and demand, as modeling each component of the system poses significant challenges [24,25,26]. Therefore, achieving a balance between supply and demand scheduling under all working conditions is crucial for a multi-energy coupled phase-change heat-storage heating system.
In summary, to address the research challenges related to low biogas production in winter, the imbalance between supply and demand in heating systems, and the dynamic coordination of a multi-energy complementary system, we propose a comprehensive heating system that couples biogas and solar energy. We dynamically simulate the user-side demand load and establish a mathematical model for all working conditions of the heating system. The SSA algorithm is employed to optimize the cost and operation scheduling of the multi-energy complementary heat-storage system, enhancing the balance between supply and demand while improving the system’s economy and the energy-supply distribution of solar energy and biogas. This approach facilitates the green transformation of building heating, achieves high economic efficiency and zero energy waste, and guides practical projects.

2. Building and Energy System

2.1. Case Study

In this study, we selected an office building in Xilin Hot, Inner Mongolia (43.96000° N, 116.03000° E) as the research subject. The building consists of three stories with floor heights of 3.9 m. The total heating area of the building is 6836 m2, with a physical coefficient of 0.40 and a ratio of transparent area with respect to the total of 0.28. The architectural model is depicted in Figure 1. The parameters of the envelope structure are presented in Table 1. Furthermore, the three-dimensional measurements of the building model are summarized in Table 2.

2.2. Paramerters Setting
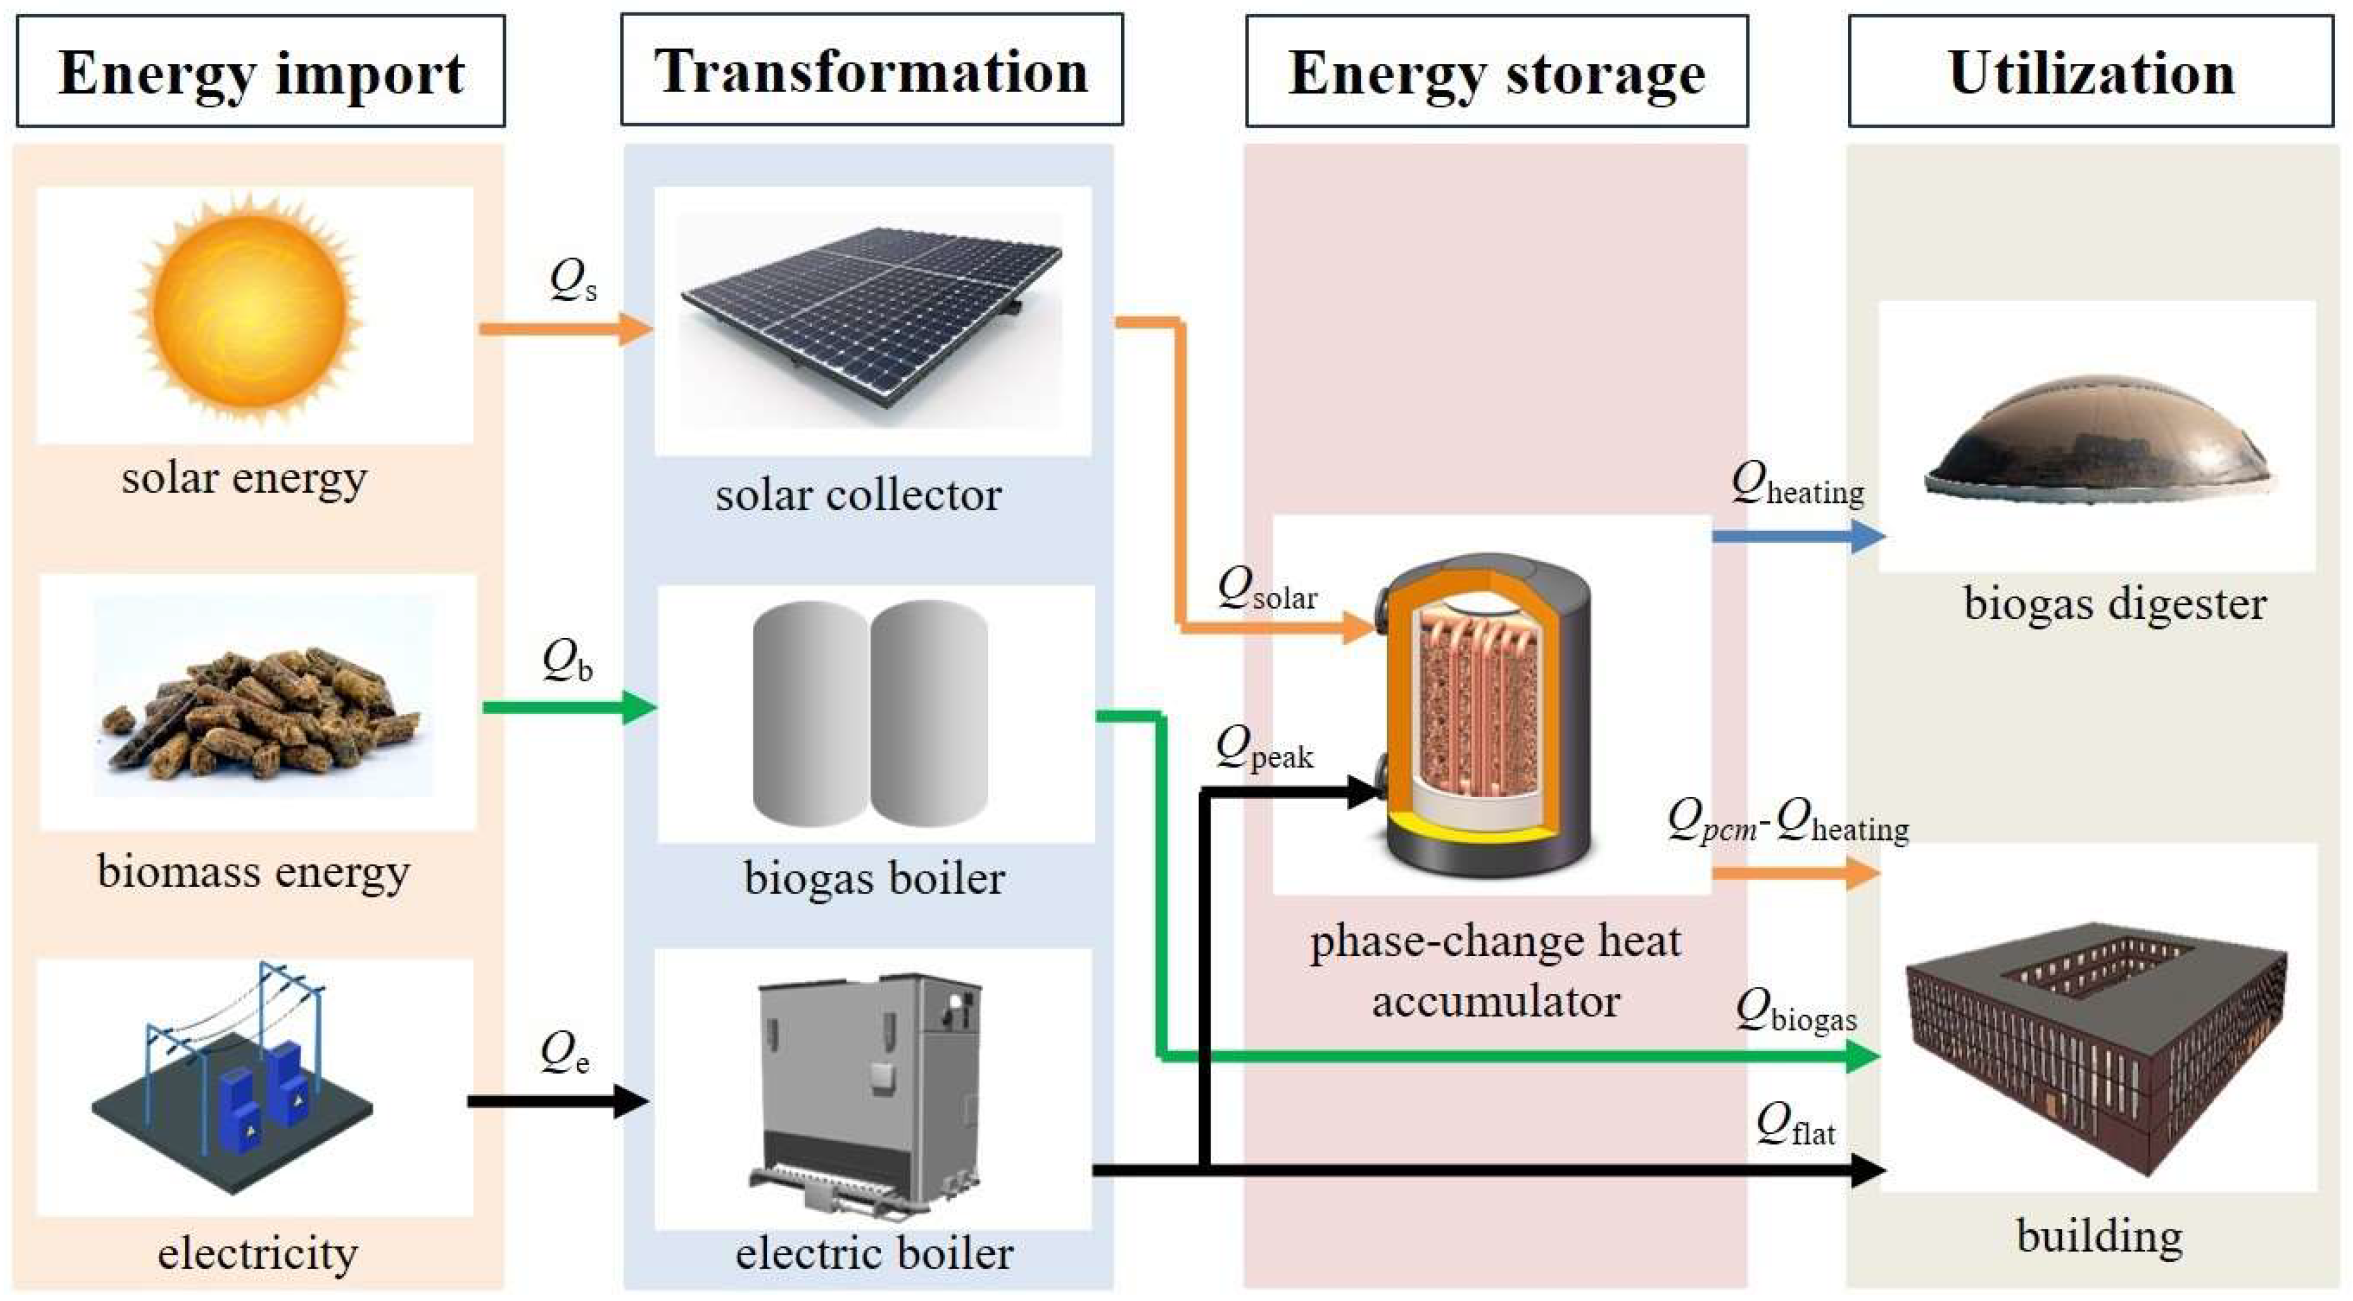
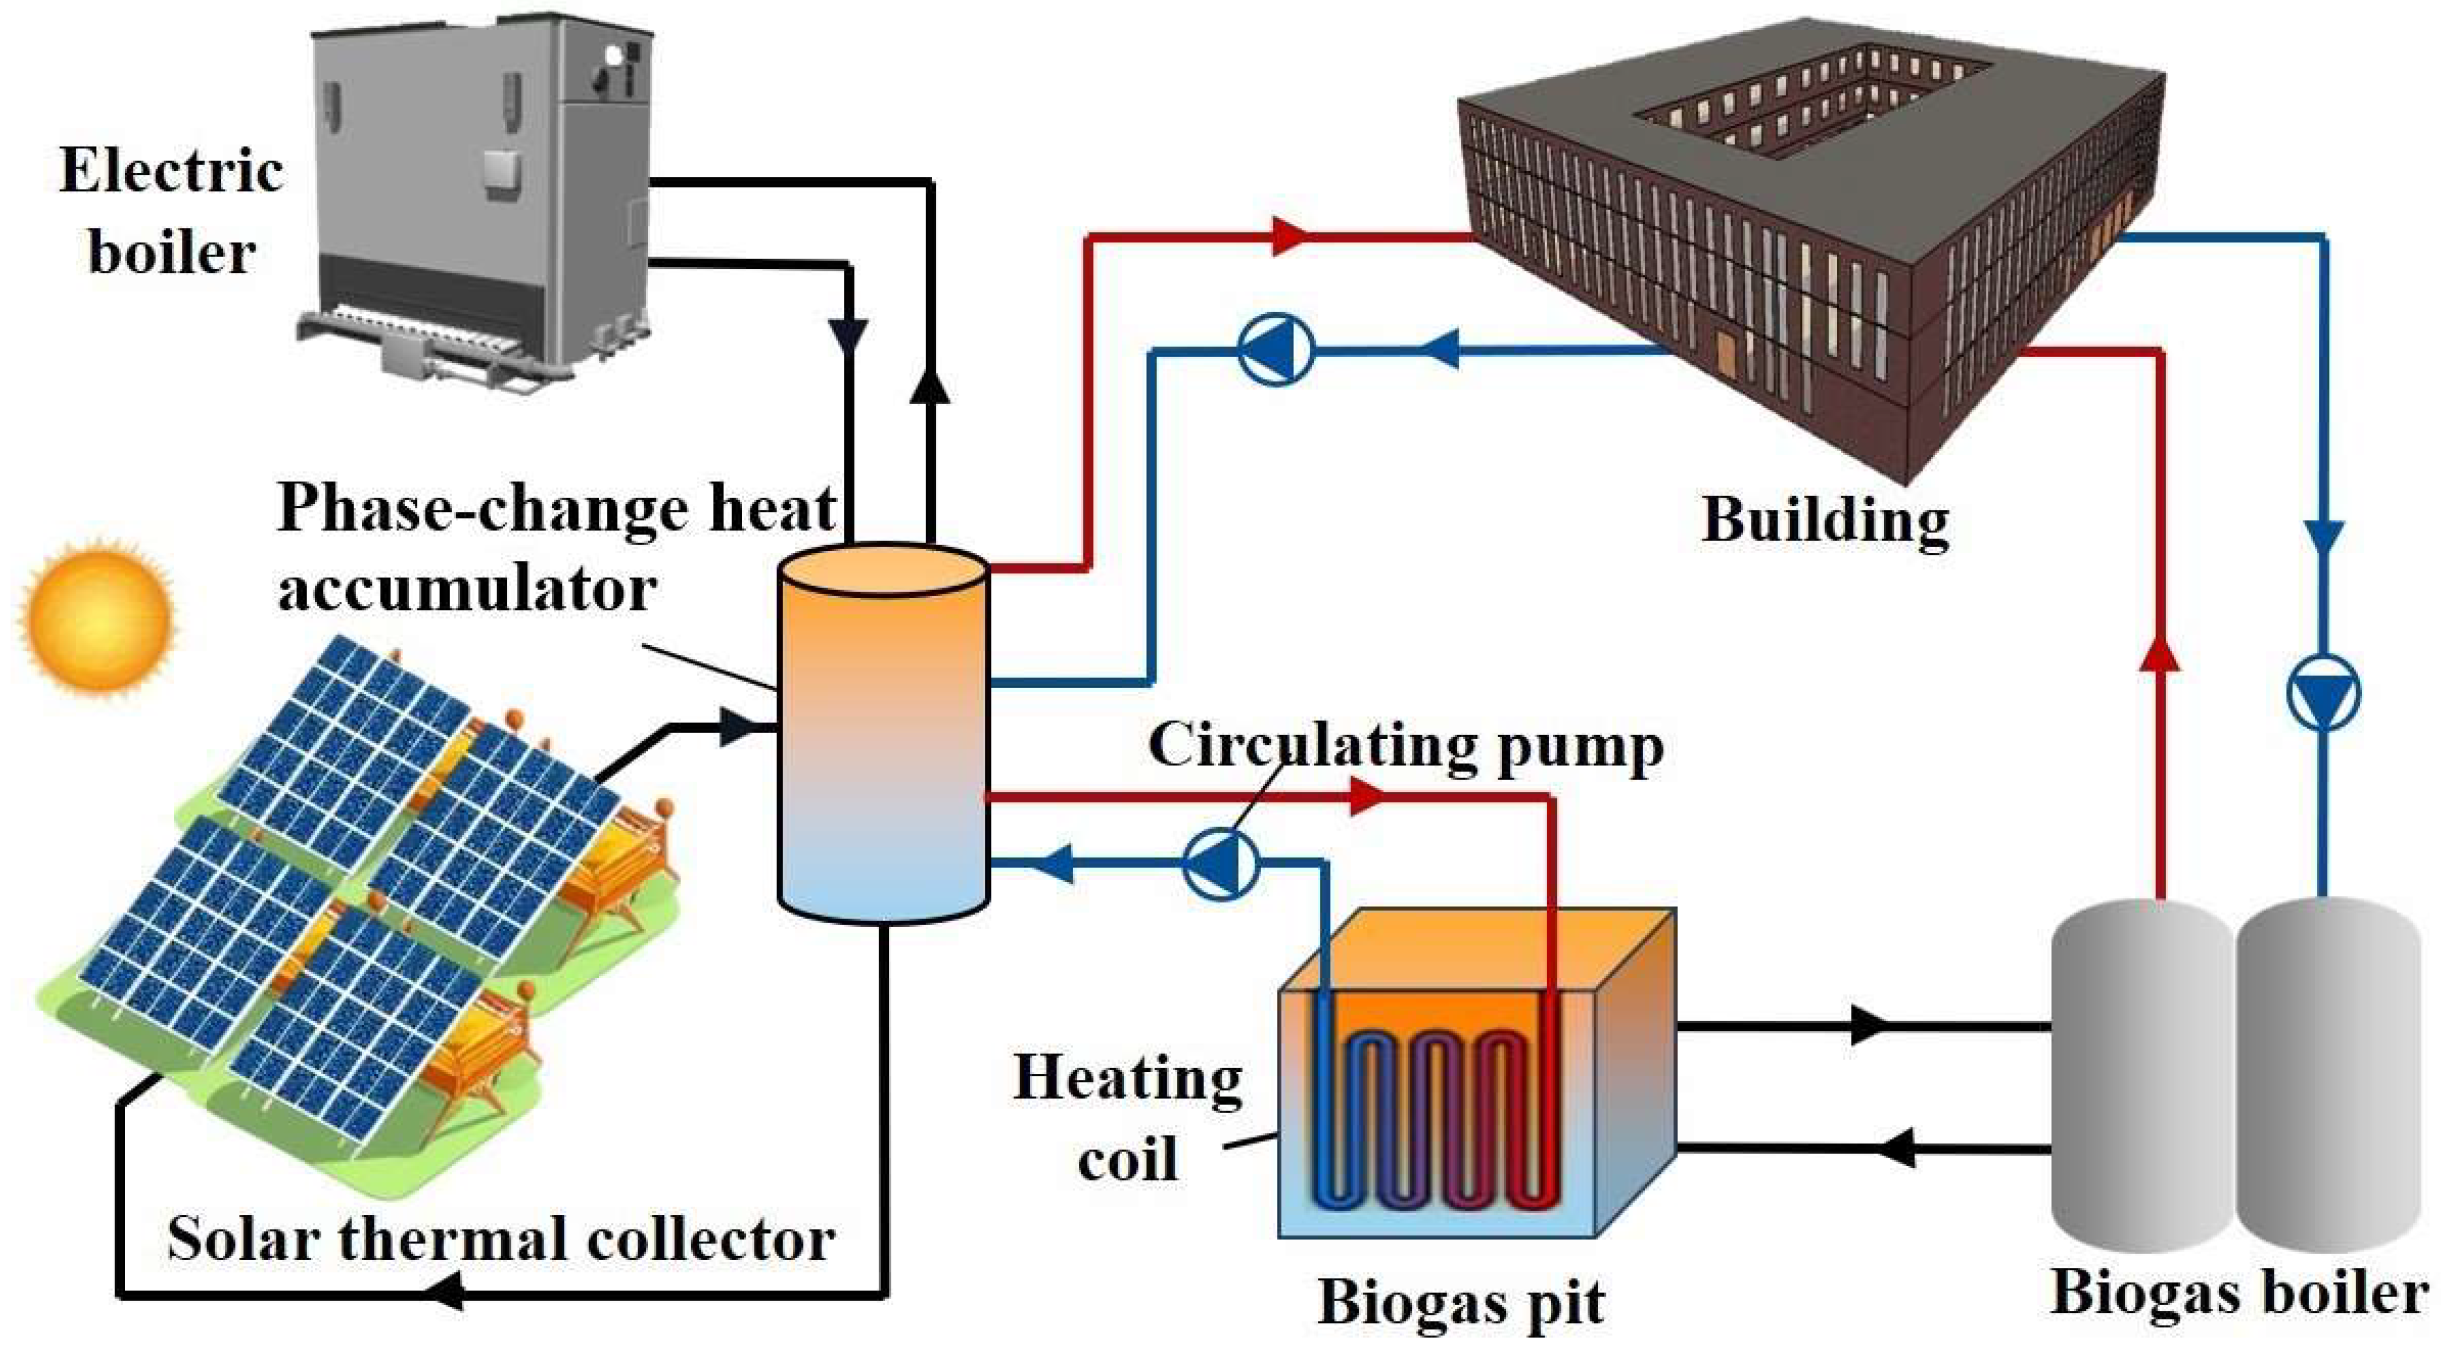
The design parameters were determined based on the design specifications and heating drawings. The design temperature for the Xilin Hot heating building is −27 °C outside and 18 °C inside. Additionally, the parameters for personnel, electrical equipment, lighting equipment, and other factors are provided in Table 3, which is from the public building energy-saving design standards and the actual situation of the office building. The per capita office area and the power density of the electrical and lighting equipment are 12 m2, 14 W·m−2, and 220 lx, respectively. The building ventilation frequency was set at 0.5 ac·h−1. To simulate the hourly heating load, we used EnergyPlus 9.3.0 software.

2.3. Heating System

In this study, a phase-change energy-storage heating system coupled with biogas and solar energy is proposed, and the municipal central heating system is taken as the benchmark against which to compare the cost and energy saving. During the biogas production process, the fermentation temperature is significantly affected by the cold winter environment, which poses challenges to the stability of the biogas system. However, Xilin Hot benefits from abundant solar-energy resources, and coupling with the solar-energy system optimizes the efficiency of biogas production. Moreover, solar energy is subject to time and weather limitations, necessitating the use of phase-change heat-storage devices to address intermittency and discontinuity issues. Additionally, electricity is employed as an auxiliary heat source to cope with extreme weather conditions. Therefore, this study proposes a biogas and solar energy coupling and complementary phase-change energy-storage heating system, as illustrated in Figure 2. A portion of the solar energy and electricity is distributed to the building, while another portion is used to heat the biogas digester to enhance biogas production. Simultaneously, the phase-change heat-storage system ensures the stability of renewable energy and the utilization of off-peak electricity. The generated biogas is converted into heat energy through biogas boilers to provide thermal energy to users, thereby increasing the proportion of renewable energy in heating the building. The main components of the system include a solar collector, electric boiler, phase-change accumulator, heat collecting water tank, biogas digester, heating coil, biogas boiler, biogas purification device, water pump, and other accessories.
The energy flow process of the system is depicted in Figure 3, which is divided into four layers: energy input, transformation, storage, and utilization. The energy input layer comprises solar energy, biomass energy, and electric energy, which are converted into heat energy by the solar collector, biogas boiler, and electric boiler, respectively. The thermal energy generated by the biogas boiler is directly transmitted to the thermal users, while the solar and electric boilers convert a portion of the thermal energy to provide building heating. The remaining thermal energy is stored in a phase-change accumulator to heat the biogas coils.

3. Mathematical Model

3.1. System Model

Based on the biogas and solar coupled heating system, we established a mathematical model consisting of the biogas production, solar collector, biogas boiler, electric boiler and phase-change heat accumulator models [27].
Biogas production model:
Biogas production is influenced by various factors, including feed amount, fermentation temperature, and external environmental temperature. Fei et al. investigated the gas production process of biogas in livestock farms and found a significant linear relationship between biogas production and feed volume [28], which can be represented as follows:
V m = a m + b
where Vm represents the biogas output, a and b are the fitting coefficients (14.24 and 772.42, respectively), and m represents the feed amount.
To ensure biogas production, a spiral coil is used to heat the biogas slurry. The heat (Qheating) required by the biogas project includes the heat needed for heating the feed (Q1), the heat dissipated by the fermentation tank (Q2), the heat carried away by the discharged water vapor (Q3), and the heat carried away by the discharged biogas (Q4):
Q h e a t i n g = Q 1 + Q 2 + Q 3 + Q 4
Q 1 = c m ( T m T s ) c = 4.17 × ( 1 0.00812 × V s )
where c represents the specific heat capacity of the biogas slurry, Tm represents the production temperature (35 °C), and Ts represents the feed temperature (10 °C).
Q 2 = Q t + Q m + Q b = K i S i ( T m T e )
Here, K represents the heat-transfer coefficient, S represents the area, and Te is the ambient temperature.
The heat dissipated by the fermentation tank includes the bottom, wall, and top of the tank, taking the expressions as follows:
Q 3 = W w [ H w + c w ( T m T w ) ] W w = 0.804 ( V V m ) X w f ( 1 X w ) X w = 1.27 × 10 6 exp 5520 / ( T w + 273 )
where Ww represents the mass flow of water vapor carried by biogas flow, calculated using Equation (6); Hw represents the latent heat value of the vaporization of water vapor at fermentation temperature (2.42 MJ/kg at 35 °C); cw is the specific heat capacity of water vapor (1.886 kJ/(kg·°C)); ta represents the outside air temperature; V represents the effective volume of the fermenter; and f represents the proportion of biogas volume relative to the volume of discharged biogas (65% in this case).
Q 4 = ( 1676 + 1772 1 f f ) ( V V m ) ( T m T w ) 10 6
Biogas boiler model:
Q b i o g a s = ( 1 x H 2 O x H 2 S ) V m q m η b
where Qbiogas represents the amount of biogas provided for building heating, ( 1 x H 2 O x H 2 S ) V m represents the amount of biogas after purification, qm represents the calorific value of biogas (20,514 kJ/m3), and η b represents the efficiency of the biogas boiler (90% in this case).
Electric boiler model:
Q v a l l e y = E v a l l e y η e η w Q f l a t = E f l a t η e
where Qvalley and Qflat represent the amount of valley and flat electricity provided for building heating and biogas production, Evalley and Eflat are the consumption of valley electricity and flat electricity, and η e   and   η w represent the energy efficiency of the electric boiler and heat-storage device (92% and 90%, respectively).
Solar energy collector model:
Q s o l a r = η s η w A I s t s
where Qsolar presents the amount of solar energy provided for building heating and biogas production, η s represents the comprehensive operating efficiency of the solar collector heating season (49.8%), A is the area of the solar collector, Is represents the solar radiation intensity, and ts represents the direct solar time. According to the geographical location of Xilin Hot, the tilt angle of the solar collector installation is 35° and the azimuth is 0° (due south).
Phase-change accumulator model:
Q p c m = Q s e n s i b l e + Q l a t e n t = c P m Δ T p + m Δ H f
Paraffin is utilized as PCM and heat transfer is enhanced by heat pipes, where Qpcm represents the heat-storage capacity of the phase-change accumulator, Qsensible represents the sensible heat, Qlatent represents the latent heat, c P , m , Δ T p , Δ H   and   f represent the specific heat, mass, variation temperature, unit mass latent heat, and liquid phase rate of the paraffin, respectively.
The thermal balance of the building:
Q b u l i d i n g = Q b i o g a s + ( Q p c m Q h e a t i n g ) + Q p e a k
where Qbuilding represents the heat load of the building.

3.2. Minimum Cost Optimization

The objective of system optimization is to efficiently allocate daily energy distribution to minimize heating system costs. The objective function, denoted as Fmin, is the sum of the initial investment (Finvest) and operating cost (Foperation), and the optimal design parameter of the system is determined by minimizing this objective function.
F min = F i n v e s t n + F o p e r a t i o n
where n represents the number of operating days, calculated as the product of heating days and operating years (183 × 15).
The initial investment for the system includes the costs of the biogas boiler (Fbiogas), electric boiler (Felectric), solar collector (Fsolar), phase-change heat accumulator (Fpcm), and other attachments (Fat). Considering the heating demand in rainy weather, the biogas boiler and electric boiler need to meet the most unfavorable heating conditions, and the size and capacity of the fixed cost of each component are determined accordingly. The operating cost of the system includes the cost of biogas purification (Fb), peak and valley electricity costs, maintenance cost (Fmain), and labor cost (Flabor), as shown in Table 4. In summary, the objective function Fmin can be expressed as a function of the variable Qsolar, Qpcm, Qbiomas, Qvalley, and Qflat:
F min = F b i o m a s   +   F e l e c t r i c   +   F s o l a r   +   F p c m   +   F a t n + F o p e r a t i o n + F b + F e + F l a b o r + F m a i n = F b i o m a s   +   F e l e c t r i c   +   Q s o l a r η s η w I s t s   ×   N s   +   Q p c m c P Δ T p   +   Δ H f   ×   N t   +   F a t n + Q b i o m a s ( 1     x H 2 O     x H 2 S ) q m η b N c + Q v a l l e y q e η e N v + Q f l a t q e η e N f + F l a b o r + F m a i n
Additionally, the following constraints apply:
Building thermal balance constraint:
Q b u l i d i n g = Q b i o g a s + ( Q p c m Q h e a t i n g ) + Q f l a t
Solar heat collection area constraint:
Q s o l a r η s η w I s t s 1000
Phase-change heat-storage constraint:
Q p c m = Q s o l a r + Q v a l l e y
Biogas production constraint:
Q s o l a r + Q v a l l e y Q h e a t i n g
Once the equipment selection and initial investment are determined, the minimum daily costs of biogas heat production, solar heat production, and peak–valley electricity for heat production are given by the following:
F min = F o p e r a t i o n + F b + F e + F l a b o r + F m a i n = Q b i o m a s ( 1     x H 2 O     x H 2 S ) q m η b N c + Q v a l l e y q e η e N v + Q f l a t q e η e N f + F l a b o r + F m a i n
Subject to the following constraint conditions:
Q b u l i d i n g = Q b i o g a s + ( Q p c m Q h e a t i n g ) + Q f l a t Q p c m = Q s o l a r + Q v a l l e y Q s o l a r + Q v a l l e y Q h e a t i n g

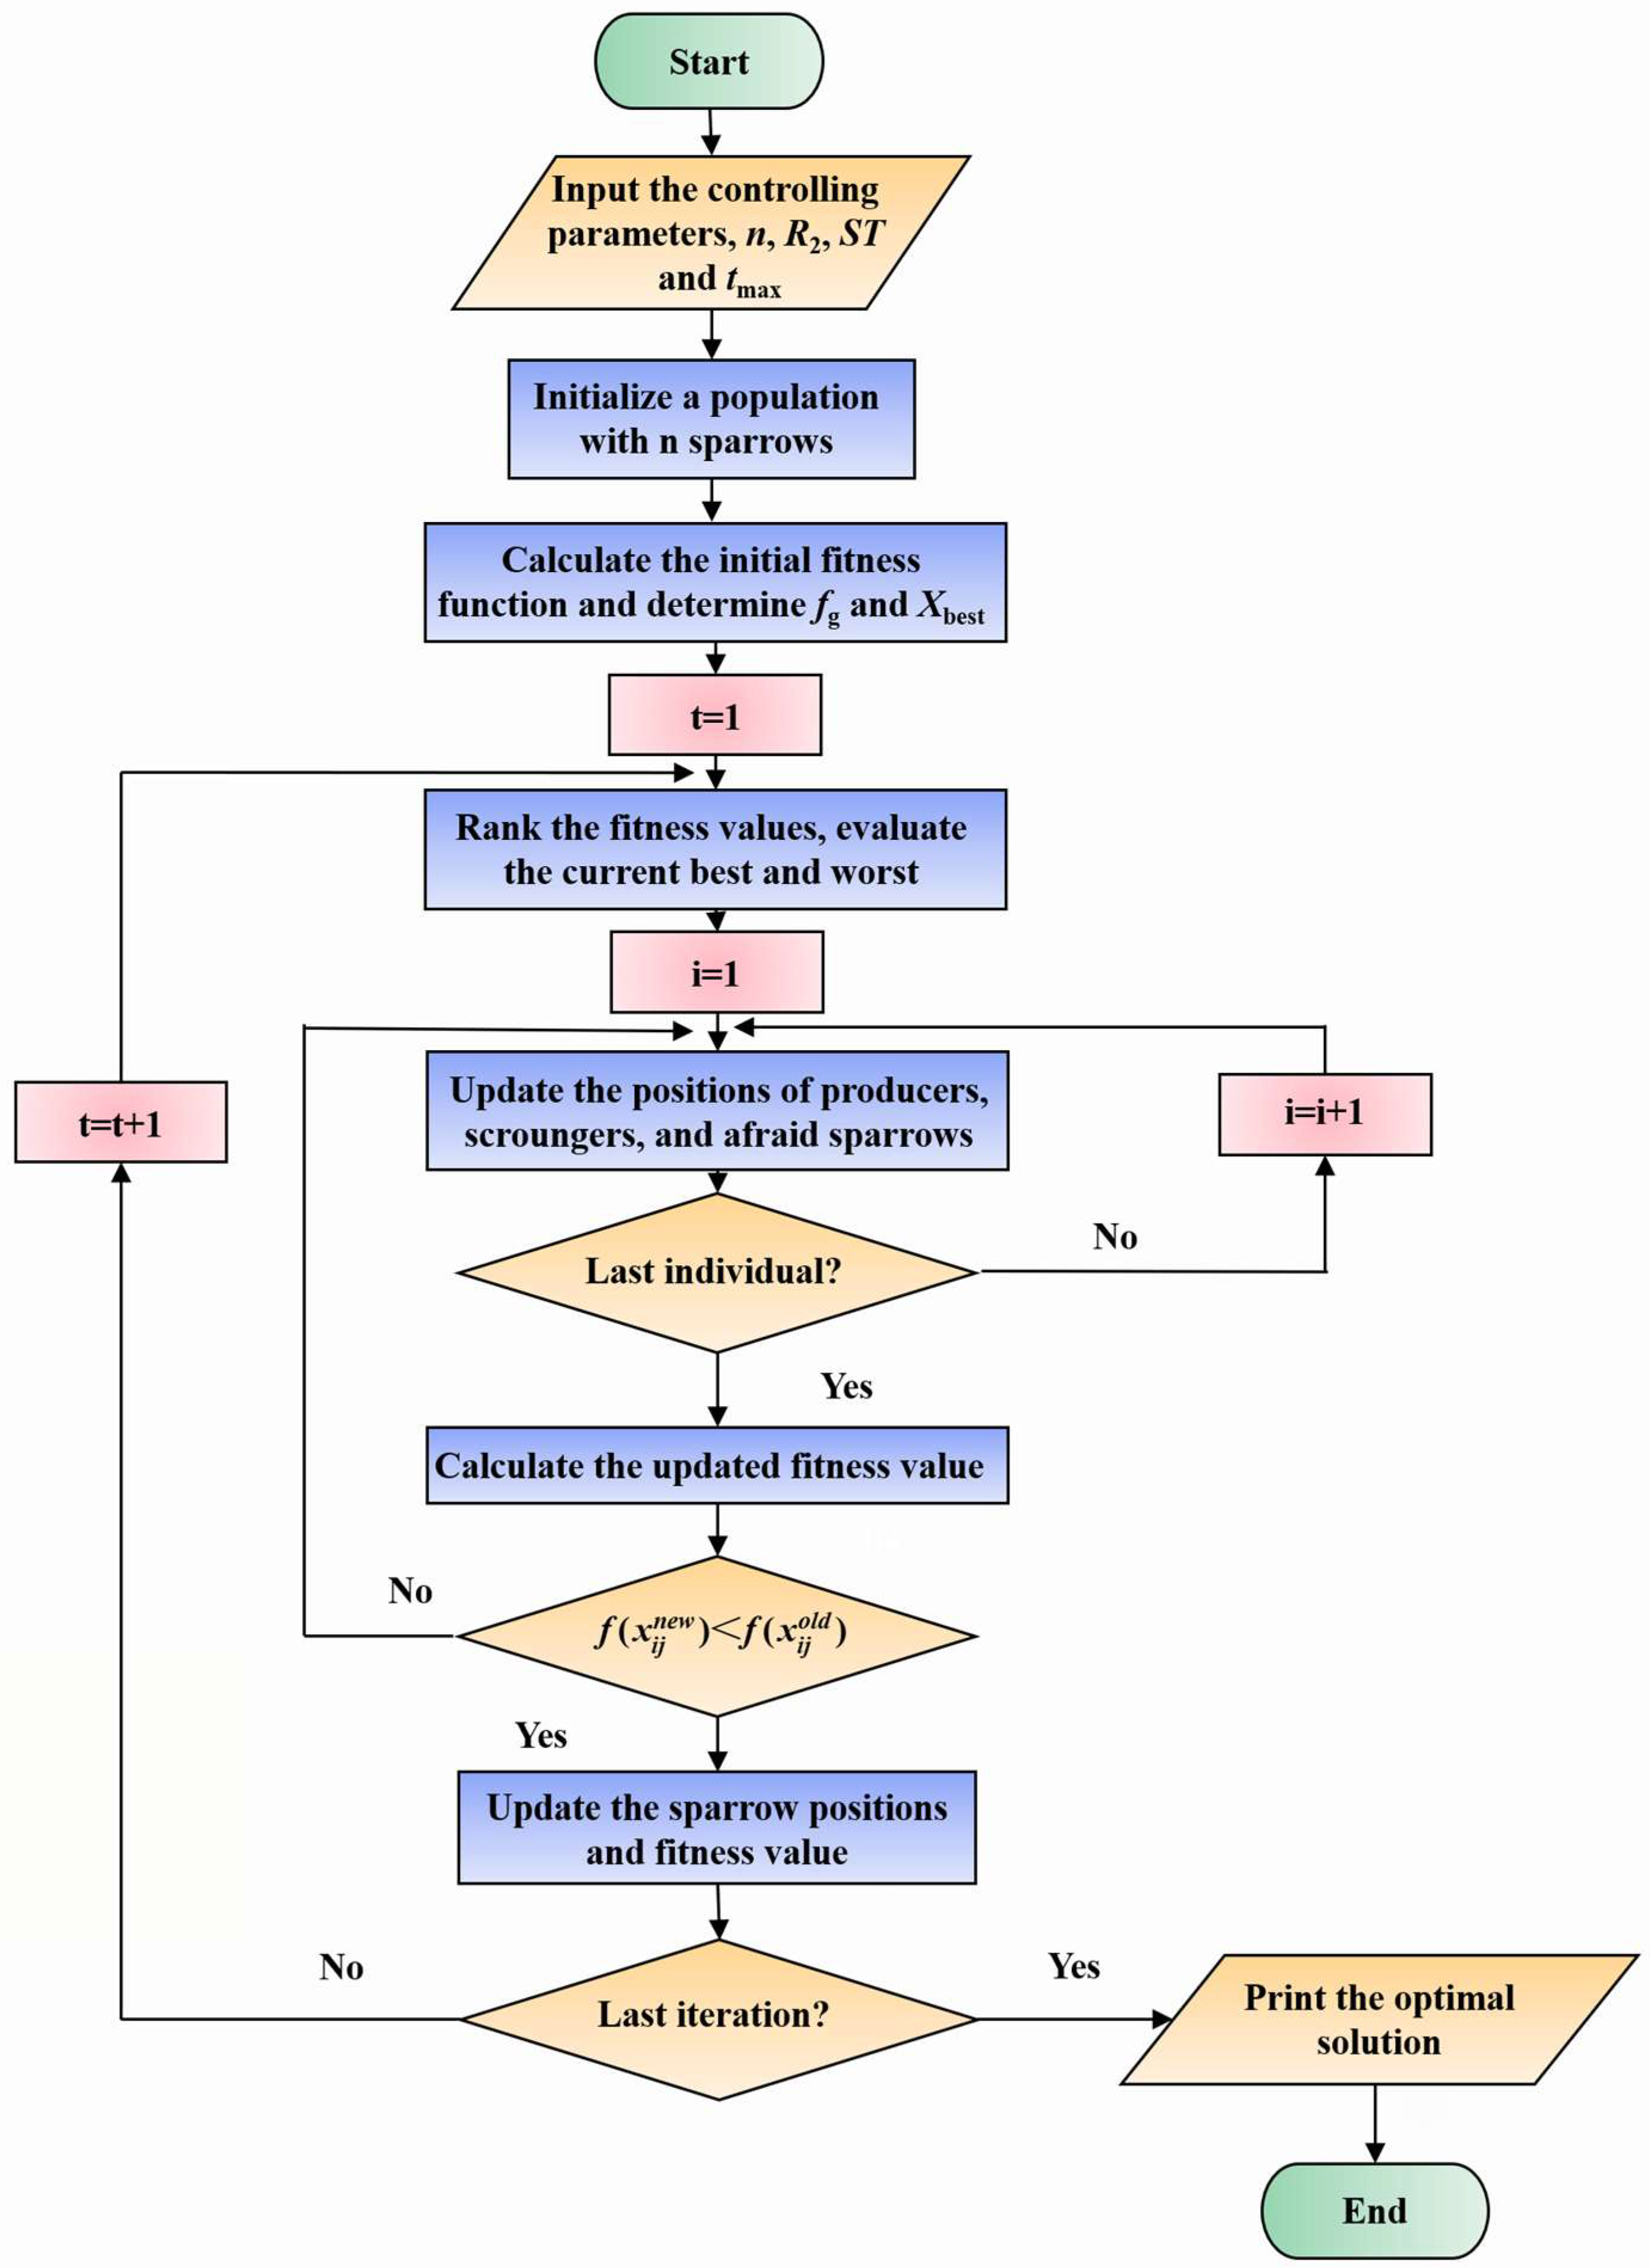
3.3. Optimization Algorithm

The sparrow search algorithm (SSA) is a swarm optimization method [29]. It simulates the foraging and anti-predation behaviors of sparrow groups. The population consists of three types of sparrows: producers, scroungers, and afraid sparrows. Producers provide food sources and foraging directions, accounting for approximately 10–20% of the population. Scroungers, comprising about 80–90% of the population, compete for food resources and have a high feed intake. During foraging, producers and scroungers remain vigilant against predators. When danger arises, 10–20% of sparrows become afraid sparrows, sounding the alarm, and quickly move to safe areas to secure better positions.
To begin, a sparrow matrix is established:
X = x 1 , 1 x 1 , 2 x 1 , d x 2 , 1 x 2 , 2 x 2 , d x n , 1 x n , 2 x n , d
where d represents the issue dimension and n represents the number of sparrows.
Meanwhile, population fitness is determined using Equation (21):
F X = f ( x 1 , 1 x 1 , 2 x 1 , d ) f ( x 2 , 1 x 2 , 2 x 2 , d ) f ( x n , 1 x n , 2 x n , d )
In SSA, priority is given to the best individuals within the group during the search process. As producers, they have access to a larger foraging search area compared to scroungers. During each iteration, the position of the producer is updated as follows:
X i , j t + 1 = X i , j t exp ( i α i t e r max ) if   R 2 < S T X i , j t + Q L if   R 2 > S T
where X i , j t represents the position of the i-th sparrow; α represents a random number distributed in range ( 0 , 1 ] ; R 2 represents an alarm value in range [ 0 , 1 ] ; ST is the care threshold within a smaller range of [ 0.5 , 1 ] ; Q is a random number from a normal distribution; and L is a 1 × d matrix of size d with entries of 1. If the alarm value exceeds the safety threshold, all sparrows move to a safe area. Scroungers keep an eye on the producers and immediately leave their current positions to compete for better food when producers find it. The rules for updating scroungers are as follows:
X i , j t + 1 = X b e s t t + β X i , j t X b e s t t if   f i > f g X i , j t + K X i , j t X worst t f i f w + ε if   f i = f g
where β represents the step size; K represents a random number between [ 1 , 1 ] ; f i ,   f g   and   f w represent the fitness value of the present individual, the present optimum fitness value, and the worst globally observed fitness value, respectively; and ε is a constant that approaches 0. The flowchart for SSA is shown in Figure 4.

4. Results and Discussion

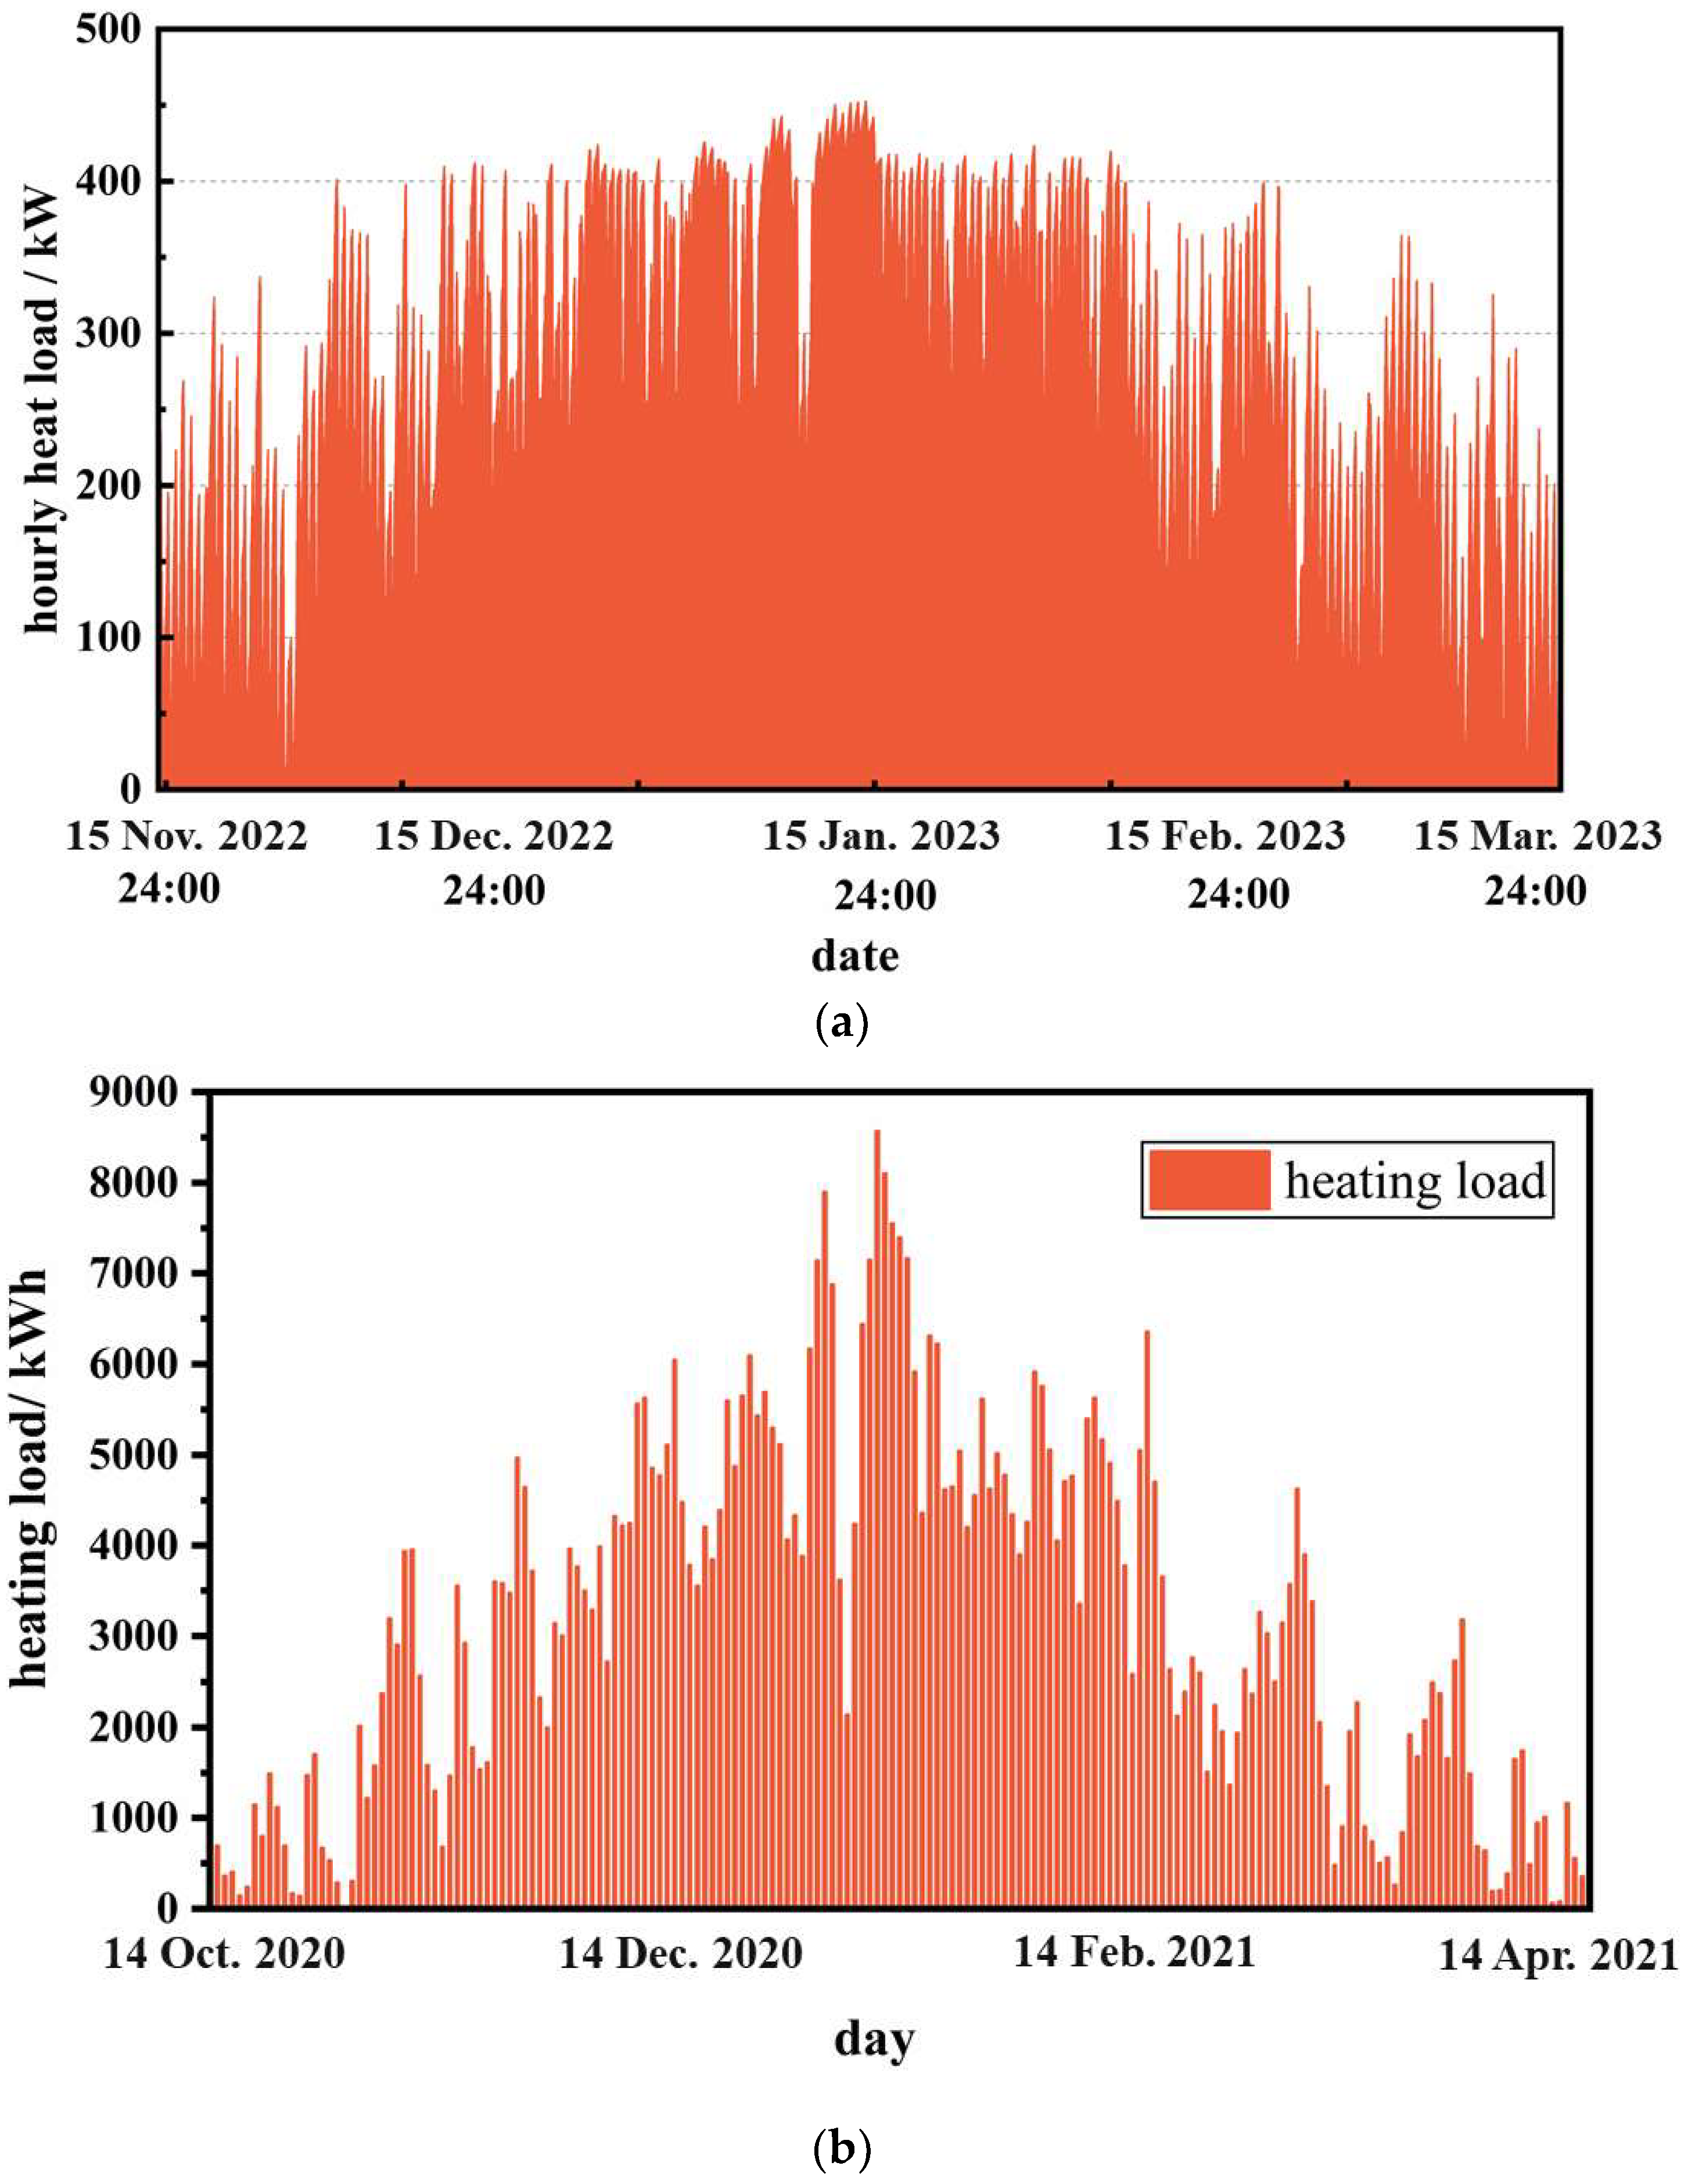
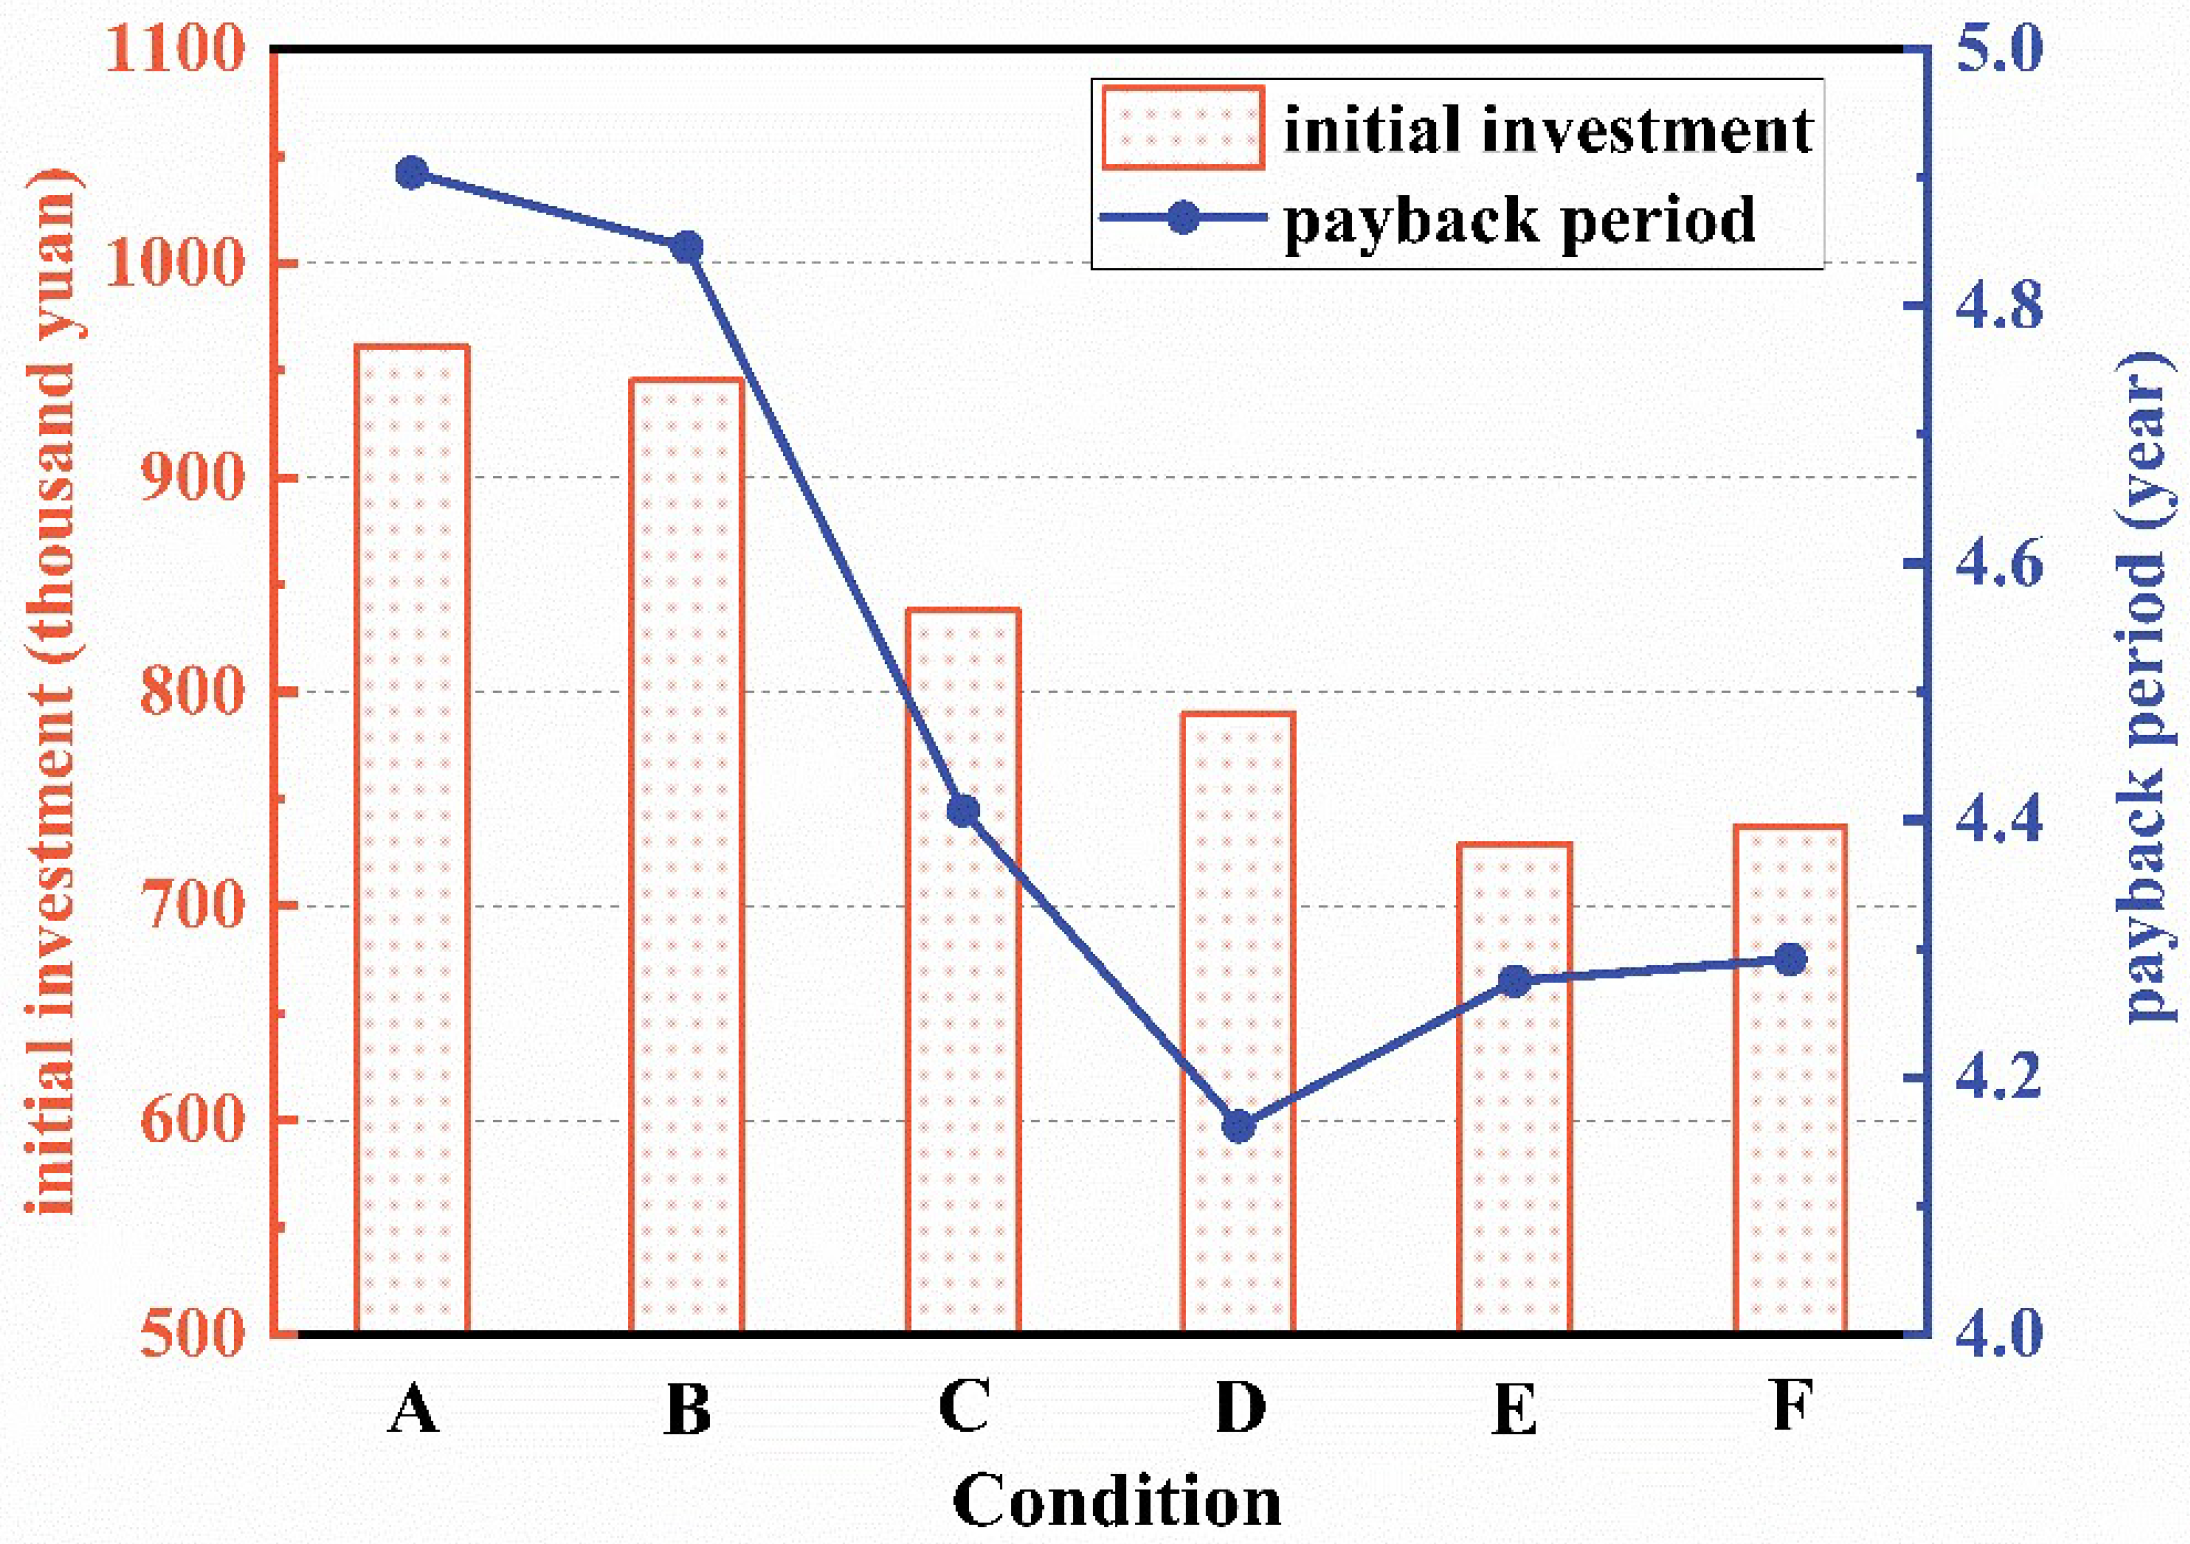
4.1. Building Heat Load and Initial Investment

Figure 5 illustrates the hourly and daily heat load during the 2022–2023 heating season in Xilin Hot. The heating period in Xilin Hot spans from October 15th to April 15th, totaling 183 days. The data demonstrate that the overall heat load exhibits a peak over time, with the highest load occurring in January, reaching a maximum of 8567.37 kWh on January 11th. Additionally, the load during the initial and final heating periods is significantly smaller. The simulation results reveal that there are 15 days with a heat load exceeding 6000 kWh, 105 days with a load ranging between 2000 kWh and 6000 kWh, and 60 days with a load below 2000 kWh. This highlights the potential of the load distribution in a multi-energy complementary system with coordinated supply and demand to meet building heat-load requirements and reduce heating energy consumption. To meet the design requirement of at least 70% biogas heating for the building under the most unfavorable working conditions, the initial investment is considered in the selection of minimum daily operating costs, as summarized in Table 5.
Based on the heating cost of public buildings in Xilin Hot, which is CNY 5.5/m2 per month, the estimated annual heating cost of the office building amounts to approximately CNY 22,588. The equipment selection was carried out based on the optimization algorithm for solar-energy heating and phase-change heat storage, in order to obtain the initial investment under various working conditions. Subsequently, the annual operating cost of optimal scheduling for the balance of supply and demand was calculated under each working condition selection, and the investment payback periods are presented in Figure 6. The results indicate that the initial investment gradually decreases with the considered daily thermal load, while the operating cost decreases due to the utilization of solar-energy collectors and phase-change devices. The payback period of the six working conditions exhibits a tendency of initially declining and then rising. Notably, under working condition D, the investment recovery period is the shortest. In this case, the solar-heating panel covers an area of 677 m2, the investment in the phase-change heat accumulator amounts to CNY 352.64 thousand, and the cost is recovered in just 4.15 years. These results strongly demonstrate the crucial role of considering the balance between supply and demand in reducing initial investment and operating costs.

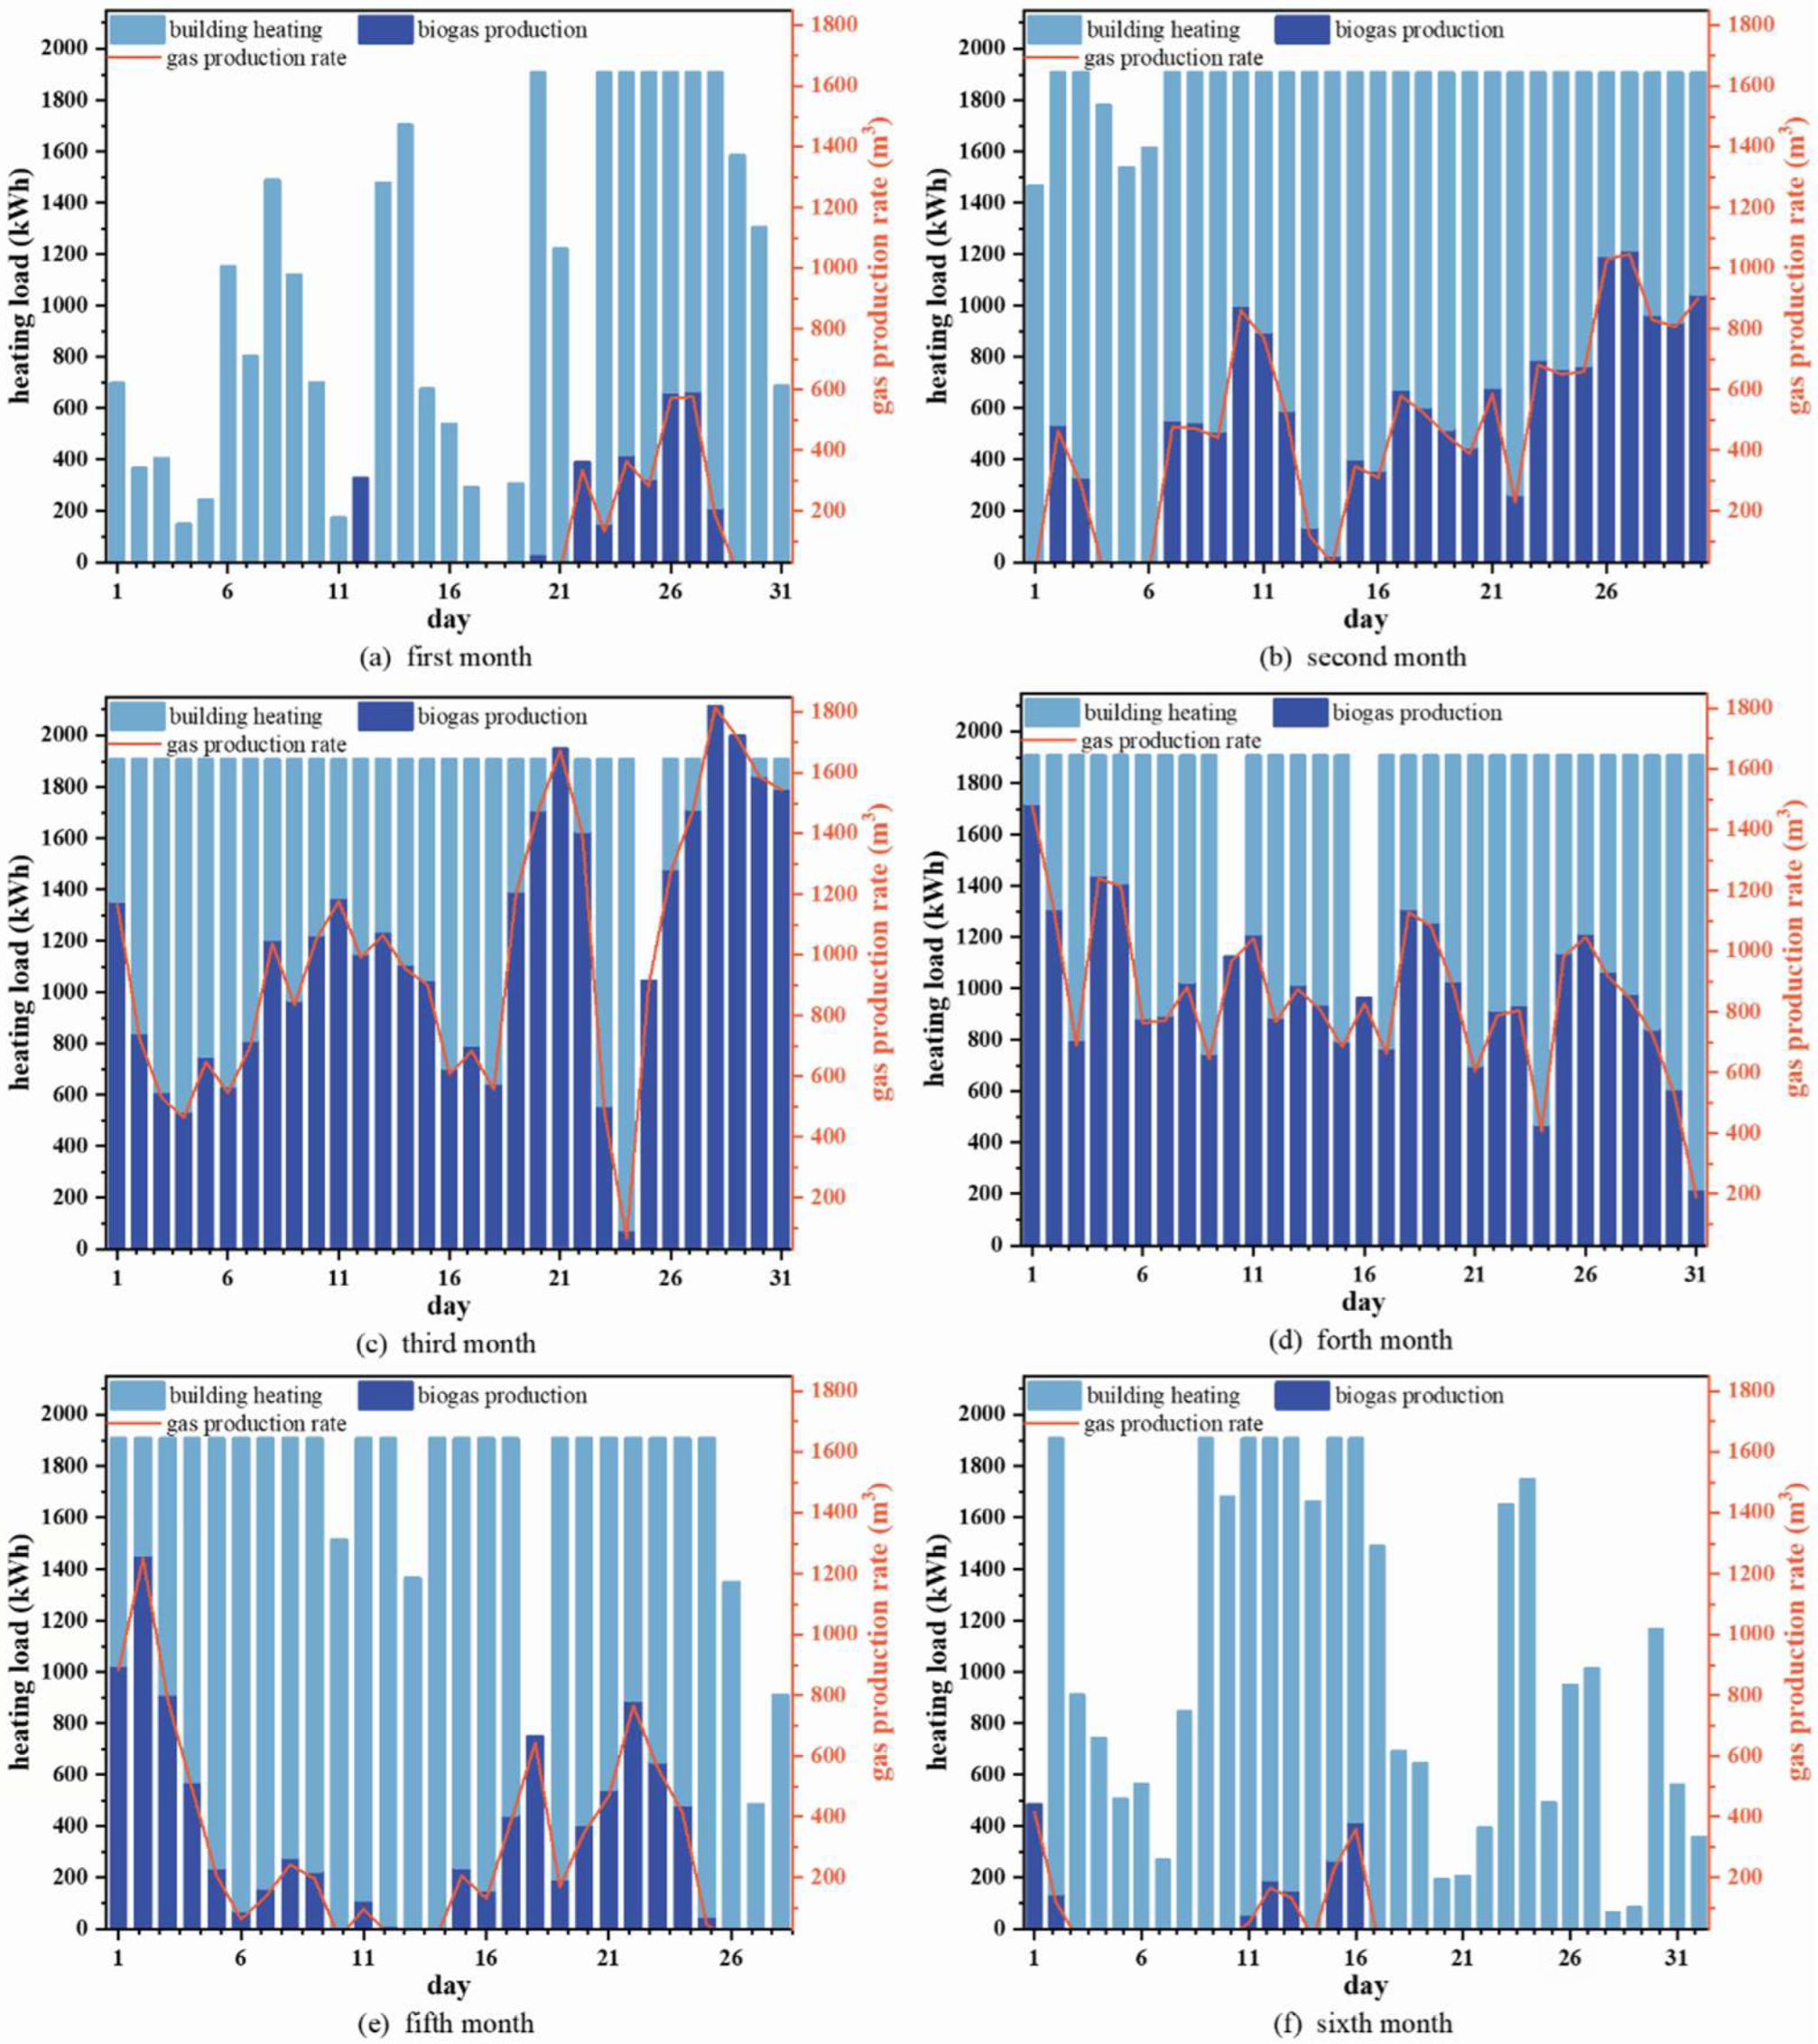
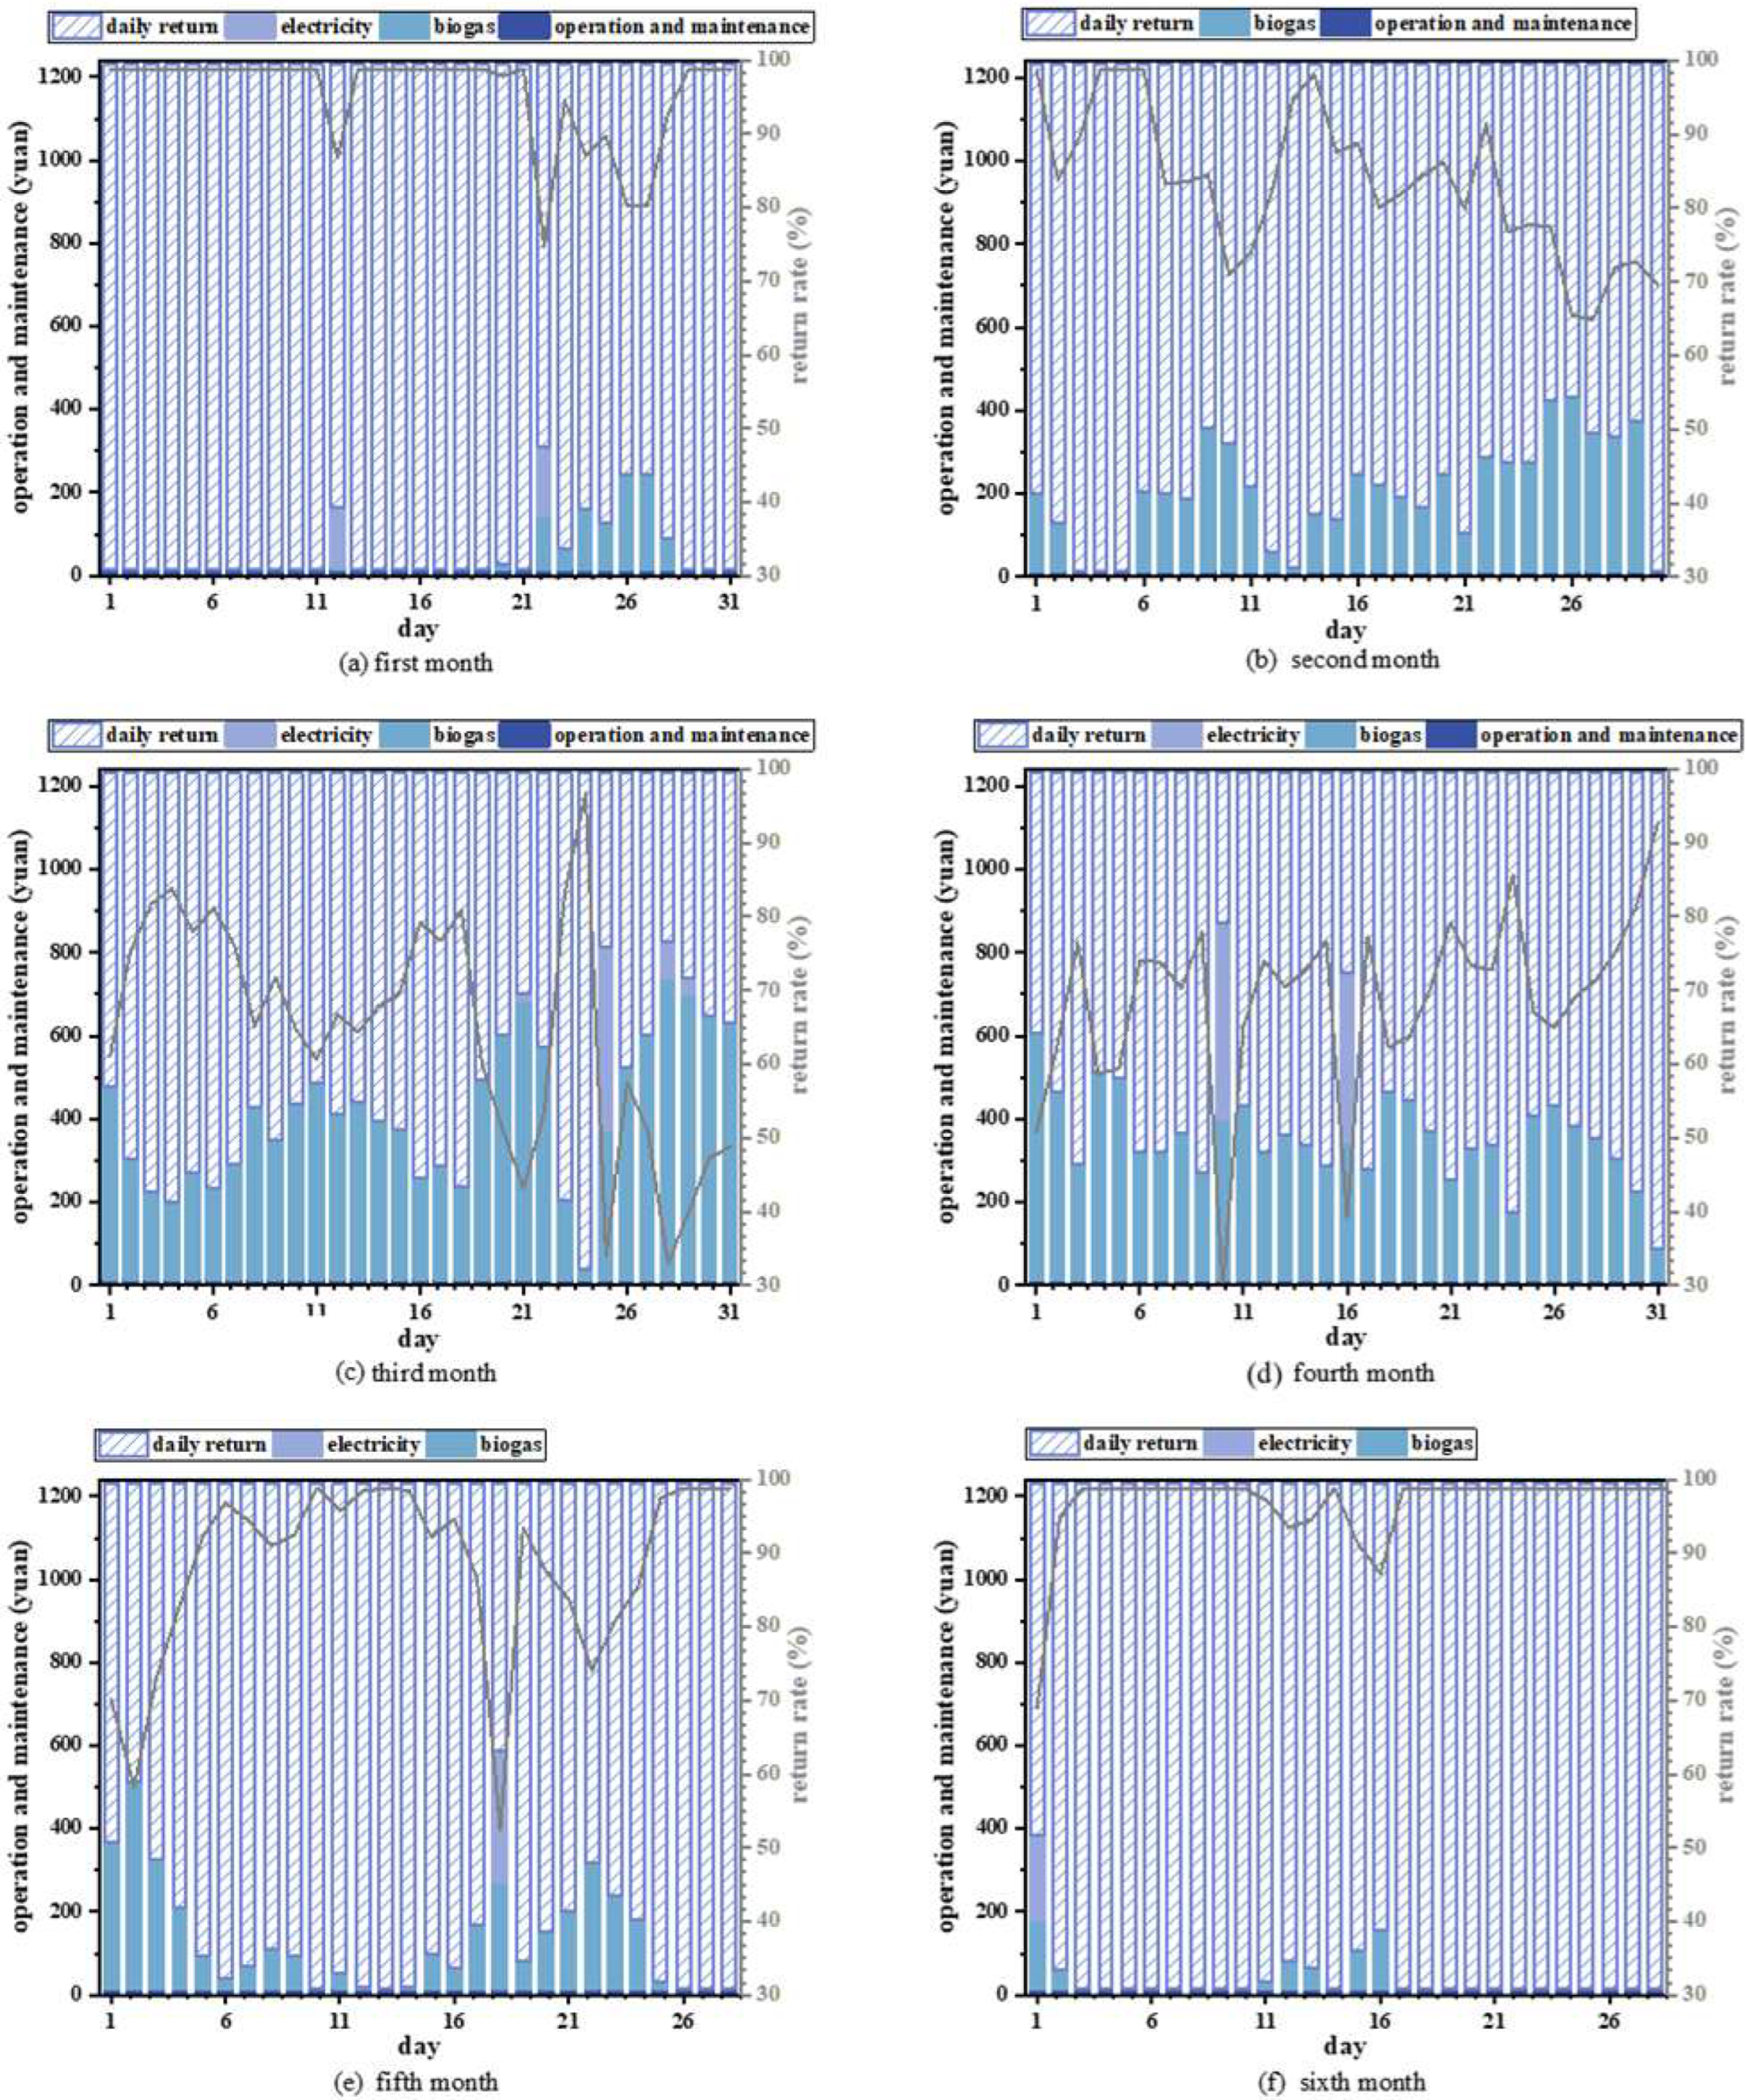
4.2. Energy Distribution under the Coordination of Supply and Demand

To visualize the energy distribution of a multi-energy complementary heating system, Figure 7 displays the daily amounts of biogas, solar, and electricity used in heating. Additionally, the thermal production above the heat-load curve represents the heat used for biogas production. During the first and last heating months, when there is less heat-load demand, solar energy predominantly provides the heat. This is due to the combination of solar energy and phase-change heat-storage devices, which can meet the building’s heat load throughout the day. In the remaining four heating months, with a thermal load ranging between 2000 kWh and 7000 kWh, most of the solar energy is utilized for biogas production, with a small portion used for building heating. The optimization algorithm is employed to achieve the minimum cost of energy consumption ratio. Under working conditions exceeding 7000 kWh, the amount of biogas heated using solar energy needs to be combined with valley power heat storage and peak power direct supply to meet the requirements of biogas heating and building heat load. In rainy weather, when the work of solar collectors is not considered, valley electric heat storage is used for heating biogas. By considering the coordination of supply and demand, the heat-supply system achieves a rational distribution and optimal operation under multiple working conditions.
Figure 8 further illustrates the distribution of solar energy and electricity between biogas production and building heating. From the first heating month to the third heating month, the heat utilized for biogas production continues to increase. This is because the heating demand of the building increases as the weather gets colder, and solar energy alone cannot meet the heat demand of thermal users. The use of direct electricity for heating supply is not conducive to economical operation. From the fourth month until the end of the heating period, the amount of solar energy used for building heating gradually increases as the temperature rises. Moreover, in rainy weather, the highest benefit is achieved when electricity is used to fully heat the biogas without providing building heating. The coordinated operation of solar energy and electric power facilitates the formulation of daily operation strategies and improves the energy efficiency and economy of the heating system.

4.3. System Benefit Analysis

Figure 9 presents the operation and maintenance costs and daily returns of the supply and demand coordination system. In general, the daily return rates exceed 30%, with the biogas purification cost being the main expense, accounting for 93.68% of the annual operating cost. Additionally, electricity consumption occurs when the load exceeds 7000 kWh. The cost of electricity is also taken into account during rainy weather. When the solar load meets the heating demand, the daily cost consists solely of the maintenance cost, resulting in a daily income of CNY 1219.06 and a return rate as high as 98.89%. As the temperature continues to decrease, the operating cost increases, reaching its highest point of CNY 826.28 on January 11th, with a return rate of 32.97%. In summary, the demand for heating directly determines the daily return, and the rational distribution of heating energy is crucial for improving the return rate.

5. Conclusions

Based on an office building in Xilin Hot, this paper presents the establishment of a biogas and solar energy coupling and complementary phase-change energy-storage heating system and proposes operation optimization strategies based on balancing supply and demand. The main conclusions are as follows:
(1)
Utilizing the SSA algorithm, the minimum cost under six working conditions is determined. Combined with the annual operating cost of the heating season under different working conditions, it is found that, when the solar collector area is 677 m2 and the capacity of the phase-change heat accumulator is 1900 kWh, the shortest payback period is 4.15 years. This system achieves remarkable economic benefits and zero waste of system energy at the same time.
(2)
The daily return rate of the multi-energy complementary heating system exceeds 30%, with biogas purification accounting for 93.68% of the operating cost. When solar energy fully meets the heating demand, the daily return reaches as high as 98.89%. In addition, it can be seen that the optimal dispatch, under the coordination of supply and demand, has significant economic and energy benefits compared with the benchmark municipal heating system.
(3)
The energy distribution strategy, which is based on the balance of supply and demand, ensures the production of biogas and the economic operation of the system. Meanwhile, the flexible scheduling of the system brings a large cost recovery rate for the building. This provides valuable guidance for practical projects.

Author Contributions

Conceptualization, X.Y. and Y.H.; Methodology, Z.L. (Zemin Liu), X.G., Z.L. (Ze Li) and X.Y.; Software, Z.L. (Zemin Liu); Formal analysis, Z.L. (Zemin Liu); Investigation, X.G.; Resources, X.Y.; Data curation, Z.L. (Zemin Liu), Z.L. (Ze Li) and Y.H.; Writing—original draft, Z.L. (Zemin Liu); Writing—review & editing, X.Y. and Y.H.; Visualization, Z.L. (Zemin Liu); Supervision, X.Y. All authors have read and agreed to the published version of the manuscript.

Funding

This work was supported by the Shanxi Federation of Social Science special research project: Study on the value implication and practice path of constructing agricultural green circulation system (SSKLZXKT2022052); Shanxi Province Philosophy and Social Science planning research project: Research on the path and policy system of comprehensive development and utilization of biogas in Jinzhong trusteed agriculture model under the goal of “dual carbon” (2022YD055); Royal Society of the UK (IES\R3\213189).

Data Availability Statement

No data were used in this study.

Conflicts of Interest

The authors declare no conflict of interest.

References

  1. Li, Y.; Niu, Z.; Gao, X.; Guo, J.; Yang, X.; He, Y.-L. Effect of filling height of metal foam on improving energy storage for a thermal storage tank. Appl. Therm. Eng. 2023, 229, 120584. [Google Scholar]
  2. Shen, Y.; Pan, Y. BIM-supported automatic energy performance analysis for green building design using explainable machine learning and multi-objective optimization. Appl. Energy 2023, 333, 120575. [Google Scholar] [CrossRef]
  3. Awan, M.B.; Ma, Z.; Lin, W.; Pandey, A.; Tyagi, V. A characteristic-oriented strategy for ranking and near-optimal selection of phase change materials for thermal energy storage in building applications. J. Energy Storage 2023, 57, 106301. [Google Scholar] [CrossRef]
  4. Yadollahi, M.; Saryazdi, S.M.E.; Shafaat, A.; Hafezi, M. Life cycle cost analysis of near zero energy buildings benefited from earth-sheltering. Int. J. Constr. Manag. 2022, 23, 2670–2682. [Google Scholar] [CrossRef]
  5. Zhang, Y.; Vand, B.; Baldi, S. A Review of Mathematical Models of Building Physics and Energy Technologies for Environmentally Friendly Integrated Energy Management Systems. Buildings 2022, 12, 238. [Google Scholar] [CrossRef]
  6. Tyagi, V.V.; Chopra, K.; Kalidasan, B.; Chauhan, A.; Stritih, U.; Anand, S.; Pandey, A.K.; Sari, A.; Kothari, R. Phase change material based advance solar thermal energy storage systems for building heating and cooling applications: A prospective research approach. Sustain. Energy Technol. Assess. 2021, 47, 101318. [Google Scholar]
  7. Karimi, M.; Alibak, A.H.; Alizadeh, S.M.S.; Sharif, M.; Vaferi, B. Intelligent modeling for considering the effect of bio-source type and appearance shape on the biomass heat capacity. Measurement 2022, 189, 110529. [Google Scholar] [CrossRef]
  8. Sadi, M.; Behzadi, A.M.; Alsagri, A.S.; Chakravarty, K.H.; Arabkoohsar, A. An innovative green multi-generation system centering around concentrating PVTs and biomass heaters, design and multi-objective optimization. J. Clean. Prod. 2022, 340, 130625. [Google Scholar] [CrossRef]
  9. Scarlat, N.; Dallemand, J.-F.; Fahl, F. Biogas: Developments and perspectives in Europe. Renew. Energy 2018, 129, 457–472. [Google Scholar] [CrossRef]
  10. Egemose, C.W.; Bastien, D.; Fretté, X.; Birkved, M.; Sohn, J.L. Human Toxicological Impacts in Life Cycle Assessment of Circular Economy of the Built Environment: A Case Study of Denmark. Buildings 2022, 12, 130. [Google Scholar] [CrossRef]
  11. Picardo, A.; Soltero, V.M.; Peralta, M.E.; Chacartegui, R. District heating based on biogas from wastewater treatment plant. Energy 2019, 180, 649–664. [Google Scholar]
  12. Xu, Z.; Wu, H.; Wu, M. Energy performance and consumption for biogas heat pump air conditioner. Energy 2010, 35, 5497–5502. [Google Scholar]
  13. Hua, Z.; Li, J.; Zhou, B.; Or, S.W.; Chan, K.W.; Meng, Y. Game-theoretic multi-energy trading framework for strategic biogas-solar renewable energy provider with heterogeneous consumers. Energy 2022, 260, 125018. [Google Scholar]
  14. Bambokela, J.E.; Belaid, M.; Muzenda, E.; Nhubu, T. Developing a Pilot Biogas-Solar PV System for Farming Communities in Botswana: Case of Palapye. Procedia Comput. Sci. 2022, 200, 1593–1604. [Google Scholar] [CrossRef]
  15. Gul, E.; Baldinelli, G.; Bartocci, P.; Shamim, T.; Domenighini, P.; Cotana, F.; Wang, J.; Fantozzi, F.; Bianchi, F. Transition toward net zero emissions—Integration and optimization of renewable energy sources: Solar, hydro, and biomass with the local grid station in central Italy. Renew. Energy 2023, 207, 672–686. [Google Scholar]
  16. Alkhamis, T.; El-Khazali, R.; Kablan, M.; Alhusein, M. Heating of a biogas reactor using a solar energy system with temperature control unit. Sol. Energy 2000, 69, 239–247. [Google Scholar]
  17. Tiwari, S.; Bhatti, J.; Tiwari, G.; Al-Helal, I. Thermal modelling of photovoltaic thermal (PVT) integrated greenhouse system for biogas heating. Sol. Energy 2016, 136, 639–649. [Google Scholar]
  18. Xue, X.; Lv, J.; Chen, H.; Xu, G.; Li, Q. Thermodynamic and economic analyses of a new compressed air energy storage system incorporated with a waste-to-energy plant and a biogas power plant. Energy 2022, 261, 125367. [Google Scholar]
  19. Wang, G.; Song, Y.; Cao, S.; Duan, J. Novel adaptive power distribution master–slave control strategy for a biogas–solar–wind battery islanded microgrid based on a microturbine. Electr. Power Syst. Res. 2023, 224, 109743. [Google Scholar]
  20. Su, X.; Shao, X.; Geng, Y.; Tian, S.; Huang, Y. Optimization of feedstock and insulating strategies to enhance biogas production of solar-assisted biodigester system. Renew. Energy 2022, 197, 59–68. [Google Scholar]
  21. Cao, Y.; Dhahad, H.A.; Togun, H.; Haghghi, M.A.; Anqi, A.E.; Farouk, N.; Rosen, M.A. Seasonal design and multi-objective optimization of a novel biogas-fueled cogeneration application. Int. J. Hydrogen Energy 2021, 46, 21822–21843. [Google Scholar]
  22. Arslan, M.; Yılmaz, C. Design and optimization of multigeneration biogas power plant using waste heat recovery System: A case study with Energy, Exergy, and thermoeconomic approach of Power, cooling and heating. Fuel 2022, 324, 124779. [Google Scholar] [CrossRef]
  23. Castley, J.; Azimov, U.; Combrinck, M.; Xing, L. Modeling and optimization of combined cooling, heating and power systems with integrated biogas upgrading. Appl. Therm. Eng. 2022, 210, 118329. [Google Scholar]
  24. Mousavi, S.A.; Toopshekan, A.; Mehrpooya, M.; Delpisheh, M. Comprehensive exergetic performance assessment and tech-no-financial optimization of off-grid hybrid renewable configurations with various dispatch strategies and solar tracking systems. Renew Energy 2023, 210, 40–63. [Google Scholar] [CrossRef]
  25. Chen, Y.; Guo, M.; Liu, Y.; Wang, D.; Zhuang, Z.; Quan, M. Energy, exergy, and economic analysis of a centralized solar and biogas hybrid heating system for rural areas. Energy Convers. Manag. 2023, 276, 116591. [Google Scholar]
  26. Vassalle, L.; Passos, F.; Rosa-Machado, A.T.; Moreira, C.; Reis, M.; de Freitas, M.P.; Ferrer, I.; Mota, C.R. The use of solar pre-treatment as a strategy to improve the anaerobic biodegradability of microalgal biomass in co-digestion with sewage. Chemosphere 2022, 286, 131929. [Google Scholar]
  27. Wang, J.; Liu, J.; Li, C.; Zhou, Y.; Wu, J. Optimal scheduling of gas and electricity consumption in a smart home with a hybrid gas boiler and electric heating system. Energy 2020, 204, 117951. [Google Scholar]
  28. Fei, F.; Gao, L.; Zhang, R.; Zhou, J.; Weng, P.; Huo, L. Research on optimization of biogas cogeneration system for farms based on characteristics of supply and demand coordination. Acta Energiae Solaris Sin. 2023, 44, 231–237. [Google Scholar]
  29. Xue, J.; Shen, B. A novel swarm intelligence optimization approach: Sparrow search algorithm. Syst. Sci. Control Eng. 2020, 8, 22–34. [Google Scholar] [CrossRef]
Figure 1. Building model.
Buildings 13 02712 g001
Figure 2. Biogas and solar energy coupling and complementary phase-change energy-storage heating system.
Buildings 13 02712 g002
Figure 3. System energy flow diagram.
Buildings 13 02712 g003
Figure 4. The flow diagram of SSA.
Buildings 13 02712 g004
Figure 5. Building heat load: (a) hourly; (b) daily.
Buildings 13 02712 g005
Figure 6. Initial investment and payback period under different working conditions.
Buildings 13 02712 g006
Figure 7. Heat production of different energy sources under coordinated supply and demand scheduling.
Buildings 13 02712 g007
Figure 8. Distribution of solar energy and electricity for biogas production and building heating.
Buildings 13 02712 g008
Figure 9. Operation and maintenance cost and daily return of supply and demand coordination system.
Buildings 13 02712 g009
Table 1. Building envelope parameters.
B u i d i n g   E n v e l o p e E x t e r n a l   W a l l E x t e r n a l   W i n d o w Partition R o o f F l o o r E x t e r n a l   D o o r
heat   transfer   coefficient
/ W m 2 K 1
0.492.800.920.240.321.80
Table 2. Three-dimensional measurements of the building model.
Three DimensionsLWH
size (m)57.957.011.7
Table 3. Hourly parameters.
I d e x R o o m   O c c u p a n c y   R a t e U t i l i z a t i o n   R a t e   o f E l e c t r i c a l   E q u i p m e n t U t i l i z a t i o n   R a t e   o f L i g h t i n g   E q u i p m e n t
T i m e W o r k d a y H o l i d a y W o r k d a y H o l i d a y W o r k d a y H o l i d a y
0101010101010
1101010101010
2101010101010
3101010101010
4101010101010
5101010101010
6101010101010
7101010101010
8501050105010
9951095109510
10951095109510
11951095109510
12801080108010
13801080108010
14951095109510
15951095109510
16951095109510
17951095109510
18301030103010
19301030103010
20101010101010
21101010101010
22101010101010
23101010101010
Table 4. Initial investment and operating cost.
Initial InvestmentOperation
ItemCostItemCost
solar collector (Ns)400 CNY/m2biogas purification (Nc)0.4 CNY/m3
composite PCM (Nt)185 CNY/kgflat electricity (Nf)0.4267 CNY/kWh
biogas pit (Fbiogas)
(size: 5 m × 5 m × 10 m; numbers: 12)
20,000 CNYvalley electricity (Nv)0.3604 CNY/kWh
biogas boiler (Fbiogas)65,000 CNY/600 kWmaintenance (Fmain)1500 CNY/year
electric boiler (Felectric)30,000 CNY/300 kWlabor cost (Flabor)1000 CNY/year
attachments (Fat)15,000 CNY
Table 5. Six conditions.
ConditionABCDEF
date11 January 202312 January 202313 January 20233 January 20239 January 202315 December 2022
heat load/kWh8567.378104.667550.877144.286440.616049.40
Disclaimer/Publisher’s Note: The statements, opinions and data contained in all publications are solely those of the individual author(s) and contributor(s) and not of MDPI and/or the editor(s). MDPI and/or the editor(s) disclaim responsibility for any injury to people or property resulting from any ideas, methods, instructions or products referred to in the content.

