Abstract
The energy consumption of existing buildings is not only affected by their physical features but also by their business activities (e.g., operating hours, number of workers, and climate). Energy Star’s energy efficiency ratio (EER) is a key energy performance indicator that has been used for more than 20 years. This method normalizes operation characteristics by calculating the estimated energy consumption of business activities using regression models and comparing it with the actual energy consumption. However, EER-based assessment is limited by the lack of information regarding the reasons for the evaluation results. This study proposes a balanced method for explaining the reasons underlying energy efficiency levels while maintaining the existing EER assessment system. The method constitutes data collection, EPI derivation, and energy performance assessment, utilizing the parameters of the change-point linear model (CPM) as an additional EPI to provide descriptive information. The results are summarized to provide a checklist guide for retrofitting, and additional energy saving potential for buildings with low and high scores can be identified by comparing the EER scores and CPM parameters. The proposed method shows that it is possible to interpret the energy efficiency assessment results by comparing CPM parameters, while maintaining the EER score.
1. Introduction
1.1. Background
With the growing importance of reducing energy consumption and energy consumption assessment in the building sector worldwide [1,2], appropriate energy performance indicators (EPIs) have been discussed in numerous studies [3,4,5,6]. Among the various indicators, energy use intensity (EUI) is the most frequently used indicator in the research and policy areas. Borgstein et al. introduced the use of EUI to normalize whole-building energy consumption indicator as a traditional way to perform large-scale building assessments [3]. Geraldi and Ghisi explained that among the various methods for assessing building energy performance, evaluation through simple normalization is the most commonly used [4]. Chung, Mathew, also mentioned the simple normalization approach, explaining that EUI is the most generally used method for energy performance assessment [5,6].
The EUI is an indicator normalized by dividing the total energy consumption of a building with the gross floor area (GFA) [3,4]. EUI is widely used as the major performance indicator because of its practicality and cost-effectiveness [7].
However, EUI is not useful in determining the need for renovation [6,7], as it encompasses business activities (e.g., climate and operating hours) and occupant behavior, as well as the physical characteristics of the building [8,9,10,11]. Hong et al. and O’Brien et al. emphasized that occupant characteristics play a significant role in influencing a building’s energy usage [8,9]. Hsu highlighted the essential need for establishing and disclosing data to consider various influencing factors beyond merely floor area [10]. Kim et al. also explained that achieving an objective energy performance evaluation is only possible by utilizing indicators that account for the operational characteristics of building use [11]. Nevertheless, EUI does not consider normalization for these influences.
To overcome the limitations of EUI, the Energy Star was introduced to normalize business activities [12,13]. Energy Star is widely used for commercial buildings in the USA and Canada. Energy Star system normalizes building’s energy use for differences in building operations by fitting linear regression models between building attributes and energy use. The regression model is established based on building activity, using a nationally representative Commercial Building Energy Consumption Survey (CBECS) data set [14].
For energy performance assessment, different benchmarks are derived for each building as information on the business activities of individual buildings is entered into equations. Business activities are normalized by comparing these values with that of the actual EUI, and the Energy Efficiency Ratio (EER) is calculated. EER is replaced with a score between 1 and 100 points according to the percentile ranking and used as EPI to provide evaluation results. In many cities, including New York, Chicago, and Philadelphia, an energy performance assessment is mandatory for residential and commercial buildings above a certain scale, and the Energy Star assessment results are applied to them. Many countries other than the United States have also used the Energy Star method or statistical analysis to normalize energy used by business activities [15,16,17,18,19,20,21,22,23].
Although the Energy Star is highly useful to identify the building energy efficiency level, based on EER evaluation, the cause of high or low energy efficiency cannot be determined [24]. Consequently, this lack of information is an obstacle to renovation for green remodeling [25,26,27].
Therefore, a method providing explanations for buildings with inefficient energy consumption is required, in addition to the Energy Star score. In numerous studies [28,29], new evaluation model calculation methods using machine learning (ML) were developed to overcome the inherent limitations. However, considering that EER has been used for more than 20 years, there is a need to develop a method that can overcome the aforementioned limitations, while maintaining EER-based EPI.
1.2. Aims and Scope
This study presents a method for supplementing the EER-based assessment method by providing descriptive information, along with the energy efficiency assessment results. The parameters of the theoretically established change-point linear model (CPM) are used as supplementary EPIs to provide additional analysis information while maintaining the EER method. The CPM is a widely used method [30] that enables change-point linear inverse models, based on the energy data and outdoor temperature of the target building to estimate the parameters related to heating, cooling, and baseload energy [31]. The model derives two to five parameters, depending on the type of cooling or heating used.
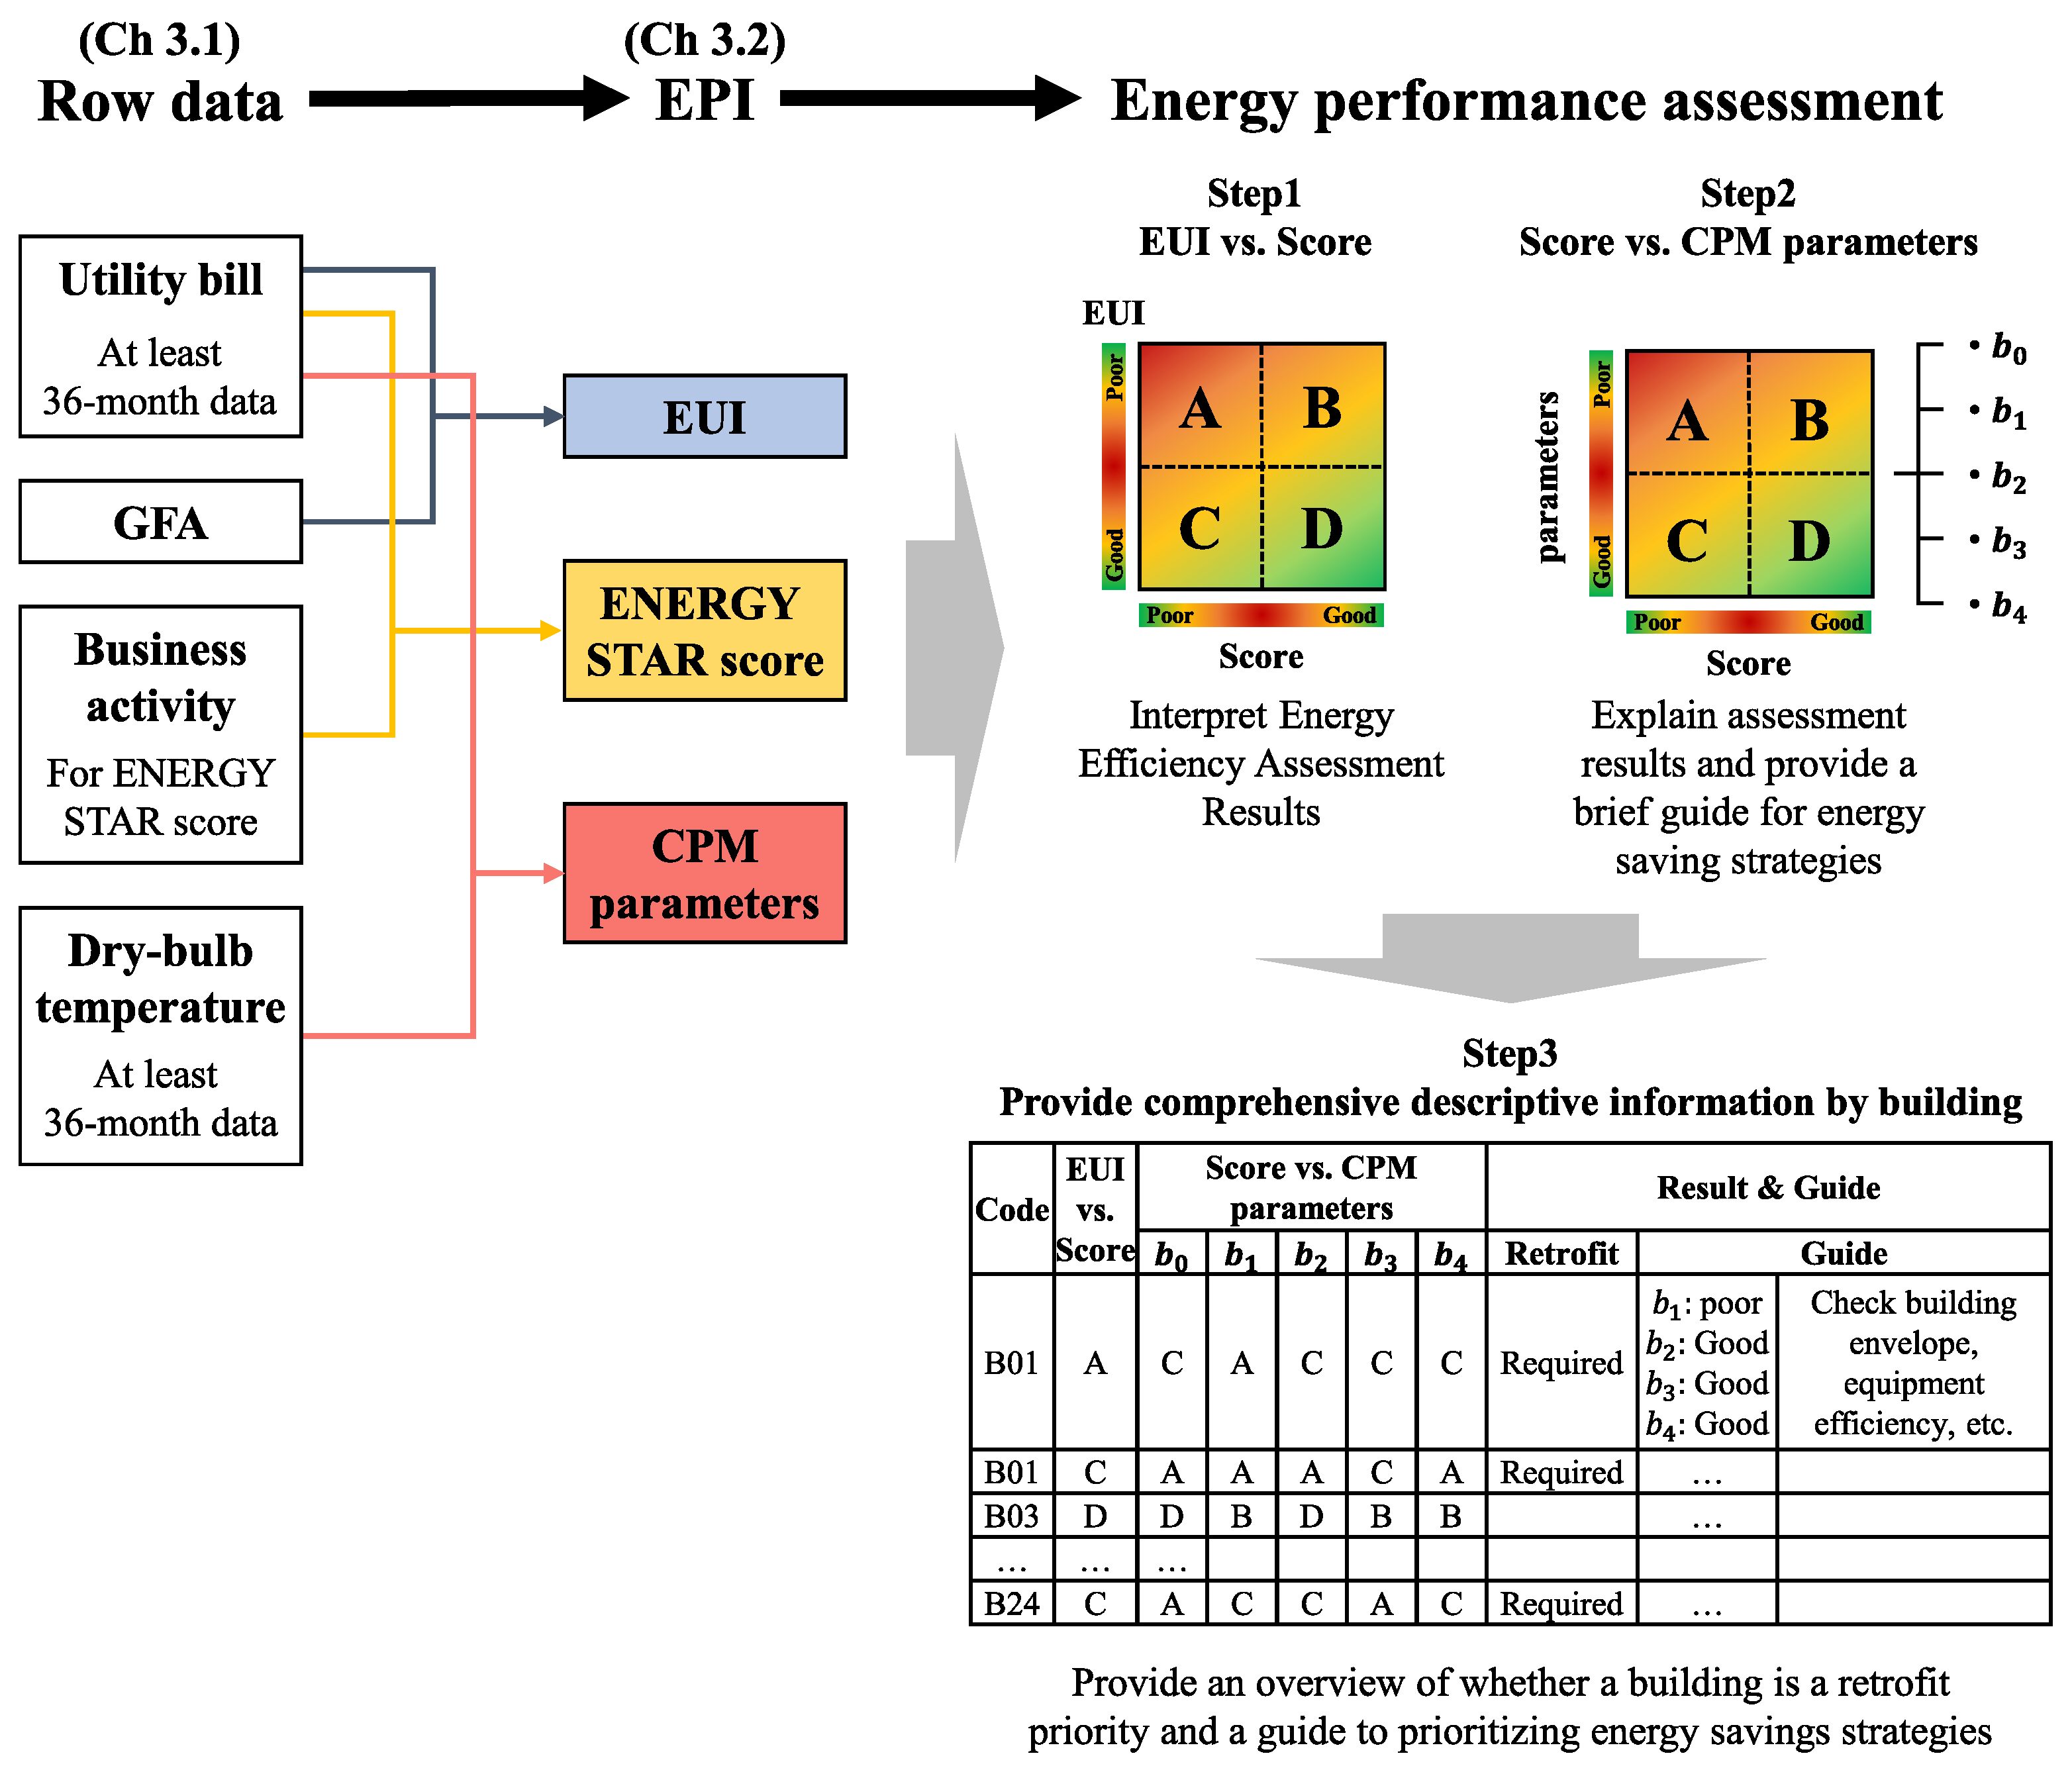
In this study, the general hospitals from which data were collected in a prior study were selected as the analysis target [11]. The overall research procedure is summarized in Figure 1. First, business activity, outdoor temperature, and energy data were collected to derive EER and CPM. Next, EPIs were derived. EPIs constitute the (1) EUI, (2) EER score, and (3) CPM parameters. For the EER score, among the EPIs, the modified EER score calculation method used for Korean general hospitals, applying the Energy Star method of the United States, as used in a previous study [11], was applied. For the CPM parameters, five parameters estimating the building performance or other causes in relation to heating, cooling, and the baseload, based on the outdoor temperature and 36-month energy consumption, were derived as indicators. Details on the calculation of these EPIs are described in Section 3.2. In the energy performance assessment step, a graph comparing the EUI and the EER score, as well as the score and CPM parameters, is created, and the areas of the graph are separated to derive information for each area. Details on the information are described in Section 3.3.
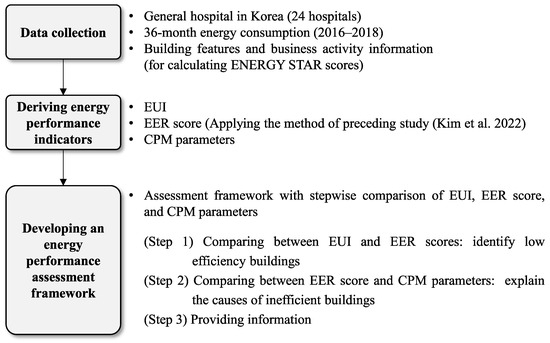
Figure 1.
Research procedures. (EER score was calculated by the method of preceding study [11]).
For green remodeling retrofit projects, with the aim of practically reducing the energy consumption of existing buildings, a method to provide the information, combined with the assessment result, is required. The proposed energy assessment method can be used to interpret the energy efficiency assessment results by simply comparing the CPM parameters, while maintaining the EER score. Considering the enduring institutional practicality of the EER, the proposed method is noteworthy for its capacity to address this knowledge gap, without requiring a complete modification of the assessment method.
2. Literature Review on EPIs and Building Energy Performance Assessment
EUI is a practical indicator because it can be easily calculated using the energy bill (annual energy consumption) and building register information (GFA) [3,4]. However, the use of EUI as an EPI has certain limitations [32,33,34,35]. Yoon and Park introduced the distortion of interpretation caused by the use of EUI as EPI [32]. For example, they mentioned a reduction in EUI, if the operating hours of the building are short or the indoor temperature exceeds the appropriate range. Mills et al. noted that using an EUI that aggregates the quantity of all end uses is somewhat ambiguous and is not helpful to identify opportunities for more detailed analysis and audits [33]. Wang et al. discussed the limitations of simply using EUI, without sufficiently considering energy-related factors [34]. They emphasized that buildings with the same climate or use must be compared, and they identified the need to consider the characteristics of use and occupancy as factors determining energy consumption because of their significant influence. Andrews and Jain also explained that while EUI is superior in regards to simplicity and cost-effectiveness, it assumes that energy use scales linearly with building size and ignores the impact of non-size features, such as building systems, construction, and occupancy, on energy use [35].
Because of the need for operation normalization, energy efficiency assessment methods considering energy use according to operational characteristics were presented in various studies.
Monts and Blissett discussed the aforementioned limitations of simply using EUI in commercial buildings and used a simple linear regression model to assess the energy consumption of commercial buildings [15]. Wei et al. evaluated the energy performance of office buildings by developing an assessment model that normalizes year built, building height, number of floors, GFA, number of people, and operating hours [16]. Dahlan et al. developed a multiple regression equation using nine variables, such as GFA, the number of outpatients, and medical devices, to assess the energy efficiency of Malaysian hospitals [17]. Kim et al. also developed a multiple regression equation based on information regarding business activities, such as the number of staffed beds and number of operating rooms, by applying the Energy Star method to assess the energy efficiency of Korean hospitals [11].
As a policy utilization case, the UK Department of Energy and Climate Change assessed the energy efficiency of buildings according to resident activities, indoor area, and building components (e.g., insulation and equipment) using the Display Energy Certificate (DEC) system [18,19]. Additionally, Energideklaration of Sweden [20], Commercial Building Disclosure of Australia [21], Verbrauchsausweis of Germany [22], and Building Energy Efficiency (BEE) Star Rating of India [23] also assessed energy efficiency, considering business activities.
Therefore, Energy Star is a highly practical tool for energy efficiency assessment, considering operation characteristics for more than 20 years [12,13]. Energy efficiency assessment is performed using a regression equation model based on the building characteristics and energy use data from the Commercial Building Energy Consumption (CBEC) survey [14]. The use of this model makes it possible to predict annual energy consumption given building characteristics and occupancy factors (e.g., GFA, the number of occupants, the number of computers, and operating hours). The estimated energy consumption is compared with the actual energy consumption for the process of assessing the energy performance of the given building and is converted to a score between 1 and 100 points to assess EER.
Although many studies consider operation characteristics, including Energy Star, only the energy efficiency assessment levels that consider the business activities of buildings, such as climate and operation, are known. In addition, the reasons underlying the existence of low or high EER scores are unknown [24]. Whether energy efficiency is determined by the physical performance of buildings or occupant behavior is unknown, and identifying potential energy saving opportunities is difficult.
EPIs were widely discussed in numerous studies globally. Specifically, energy performance assessment methods normalizing operation characteristics were used in various ways to compensate for the limitations of EUI. The limited reliability of the model and the lack of knowledge regarding the reasons underlying the energy efficiency levels were also discussed [10]. This situation obstructs government policies aimed at improving building energy efficiency and reducing greenhouse gas emissions [25,26,27,36,37].
Arjunan et al. proposed a new model to reduce these research gaps [28]. They proposed multiple linear regression with feature interactions (MLRi) and gradient boosted trees to improve model performance, used Shapley additive explanation (SHAP) values for the interpretation of non-experts, and provided an accessible overview of building aspects that affect the score.
This model improvement method is innovative because it can improve the reliability of energy efficiency assessment and explain the reasons underlying the energy efficiency levels. However, considering that EER has been utilized for more than 20 years, improving the model for various uses requires considerable time for the development and verification of methodologies, as well as for their accommodation in the market. Specifically, prior to improving the model, a balanced method explaining the reasons for energy efficiency levels, while maintaining the existing EPIs as a way to overcome the limitations of the EER method, must first be presented.
3. Materials and Methods
3.1. Data Description
The data surveyed in an earlier study [11] were utilized to derive EPIs that are suitable for general hospitals in Korea by applying the Energy Star method. Information from general hospitals was collected by conducting a survey. Among the 82 hospitals surveyed, 24 hospitals, presenting energy consumption information for more than 36 months (which is required for CPM derivation) were selected as targets.
Table 1 shows the information collected from the 24 hospitals.

Table 1.
Information for 24 general hospitals.
3.2. Deriving EPI
3.2.1. EUI and EER Score
The EUI was calculated by dividing the total energy consumption of a building by the gross floor area (GFA) [3], as shown in Equation (1).
Subsequently, the EER was calculated according to Equation (2), using the benchmark presented as Table 2. Then, the EER score was converted into a scale of 1–100 points using the look-up table represented by Table 3. The benchmark and look-up tables used were developed by referring to the Energy Star system method to ensure that they could be applied to the general hospitals in Korea [11].
Table 2.
Modified benchmark model for the general hospitals in Korea.
Table 3.
Look-up table based on the energy efficiency ratio (EER) for general hospitals.
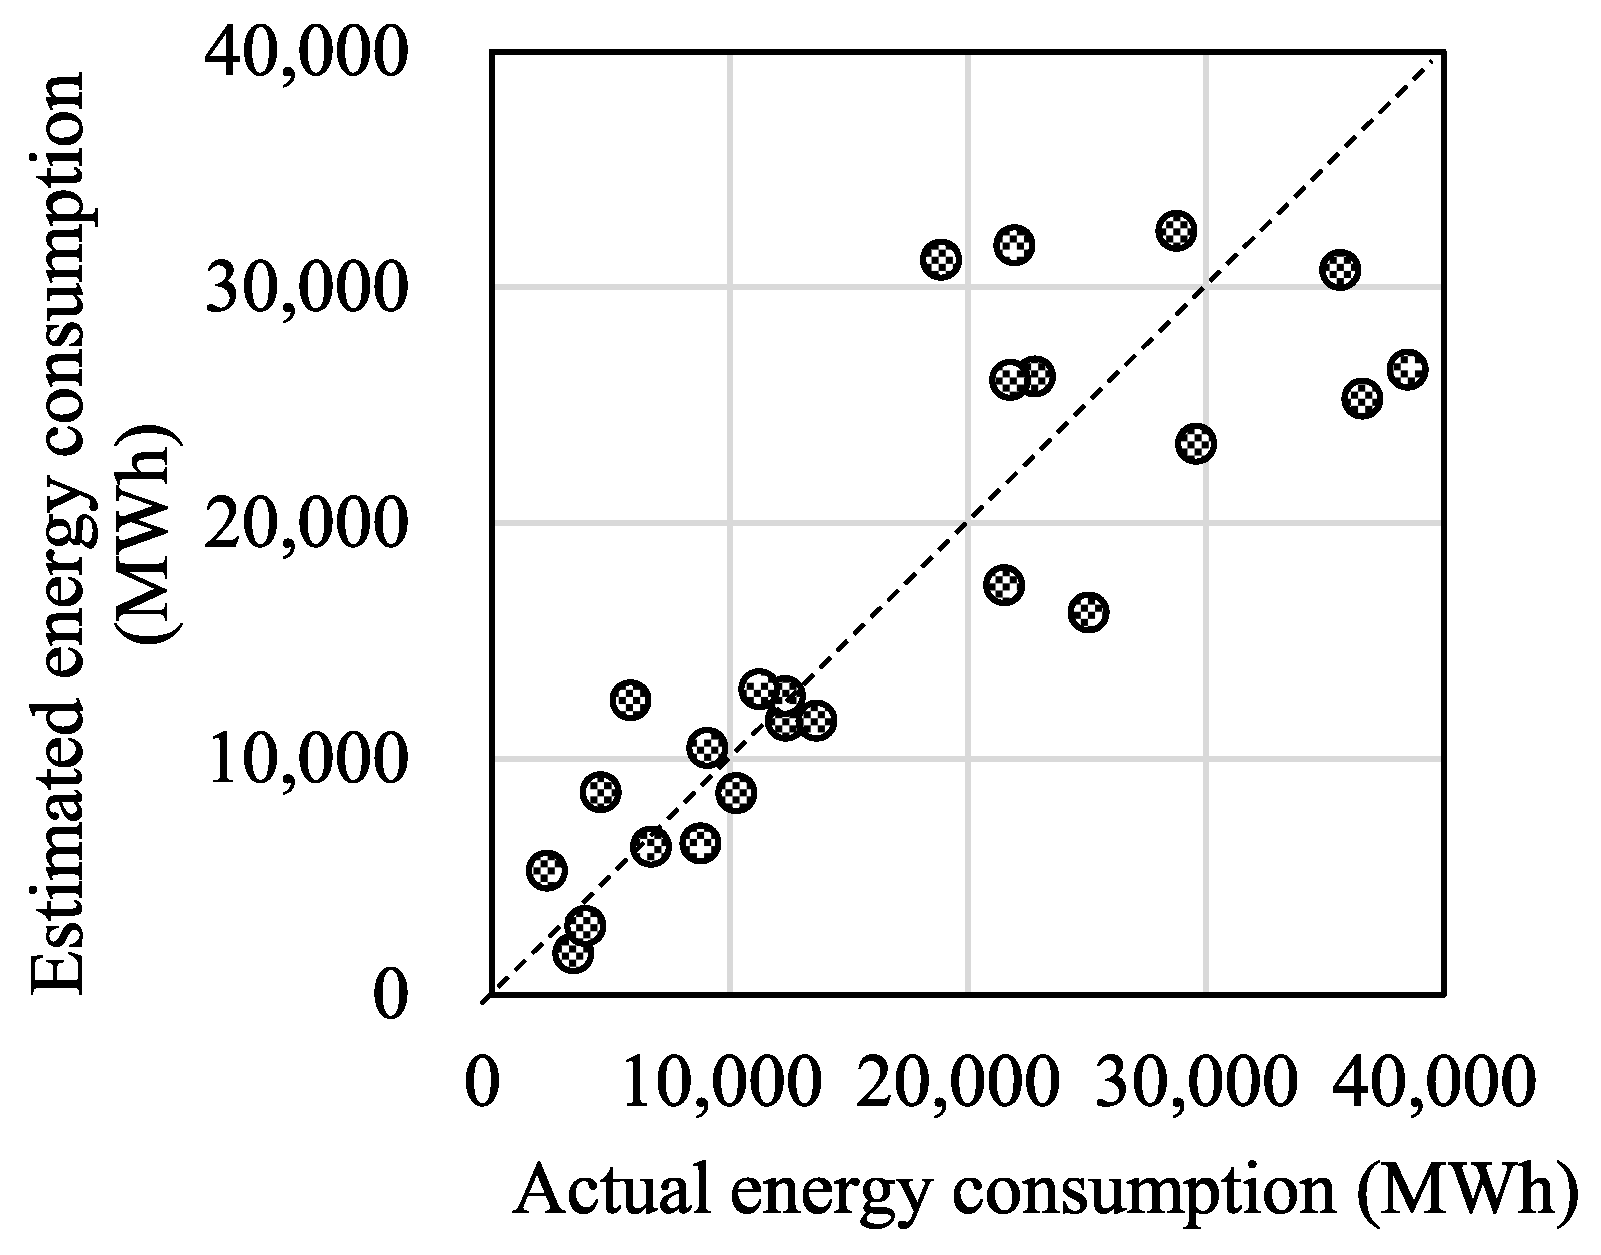
Figure 2 shows the results comparing the estimated energy consumption derived by entering the number of staffed beds and the number of operating rooms as of 2018 for 24 hospitals into the benchmark, along with the actual energy consumption for each hospital. The diagonal line shows the case in which the estimated energy consumption matches the actual energy consumption. As the result is closer to the line, the estimated energy consumption is more similar to the actual energy consumption.

Figure 2.
Actual and estimated energy consumption relationship (2018).
The right side of the diagonal line indicates buildings evaluated to have inefficient energy consumption, as the actual energy consumption is higher than expected, whereas the left side shows buildings evaluated to have high energy efficiency, as the actual energy consumption is lower than the estimated energy consumption.
As the Energy Star method cannot explain the energy efficiency assessment results, as mentioned in the introduction, a descriptive method that can solve this problem is required.
3.2.2. Change-Point Linear Model Parameters
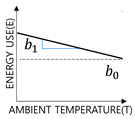
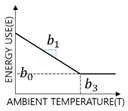
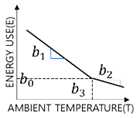
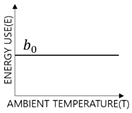
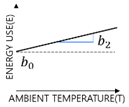
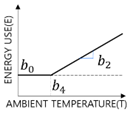
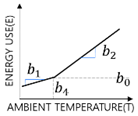
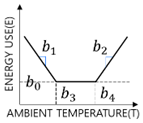
CPM is the inverse modeling technique of ASHRAE that analyzes the relationship between the outdoor temperature (T) and building energy consumption (E) from linear regression [30]. As seen in Table 4, CPM can extract parameters related to cooling, heating, and the baseload.
Table 4.
Change-point linear model type and parameters.
Baseload () represents the consumption of lighting, plug loads, and process loads, among others, whereas heating and cooling sensitivity (, , slope coefficient) reflect the sensitivity according to the envelope, ventilation, infiltration, and efficiency of the heating and cooling systems of the building. The heating and cooling change-point temperatures are analyzed as the outdoor temperature at which heating or cooling commences. A building does not utilize energy for heating or cooling, and exhibits consistent energy consumption. A building continuously uses energy for heating or cooling, depending on outdoor temperature changes. The and buildings do not use energy for heating or cooling based on outdoor temperature, but begin to do so at certain outdoor temperatures. The advantage of the parameters estimated according to the CPM, an inverse modeling technique, is that they can reflect all the actual conditions of building performance degradation, occupancy, and operation, based on measured data.
In this study, CPM was calculated by applying Kim et al.’s algorithm for deriving CPM parameters [38]. This algorithm uses the monthly EUI data processed by adding up monthly consumption for energy sources such as electricity, gas, and district heating. Under the assumption that the baseload is constant, six energy consumption data are selected as candidates for the baseload from the lowest consumption figures among the 36-month energy consumption data. Based on this, a heating or cooling regression equation is calculated to derive the CPM for each candidate. The model derives 3p and 5p under the assumption that heating or cooling energy consumption must exist along with the baseload, and the model with the highest coefficient of determination (R2), as shown in Equation (3), is selected as the final model.
where represents CPM-calculated energy consumption, is actual monthly energy consumption, is an average of actual monthly consumption over -month, and is the number of data points (-months, ).
3.3. Developing an Energy Performance Assessment Method
The proposed energy performance assessment method is employed to provide appropriate cause analysis results, along with building energy consumption levels, by comparing the EPIs described in Section 3.2 in stages.
In the energy performance assessment method shown in Figure 3, the EPIs derived in Section 3.2 are compared with each other in steps 1 and 2. They are classified into areas A through D, and the implications of each area are shown in Table 5. In this study, the average values of each EPI were set as the criteria for dividing the areas to compare the analysis targets.
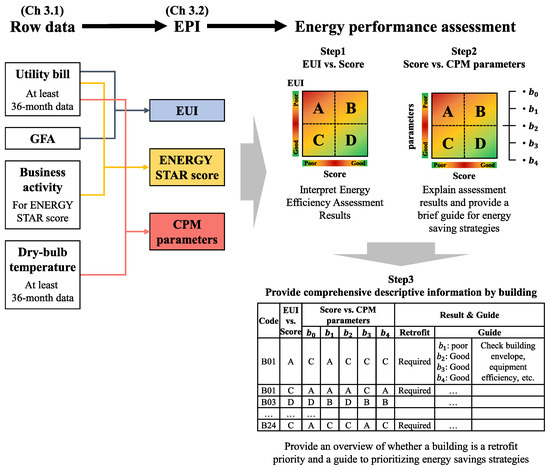
Figure 3.
Energy performance assessment method.
Table 5.
Definition of the score–energy performance indicator comparison area.
In step 1, the EUI and the EER scores are compared. Step 1 aims to examine the limitations of EUI assessment, confirm that energy efficiency assessment after operation normalization via the EER score can be different from that of the EUI evaluation results, and identify buildings that first require energy savings. For the EUI-based energy consumption assessment, buildings are evaluated to be more inefficient as the value increases. The EER score is the energy efficiency assessment result with normalized building operation, and buildings are evaluated to be more efficient as the score increases.
When assessment is performed based on EUI, areas A and B in step 1 are evaluated to be inefficient because the EUI value is higher than that of the average EUI. In contrast, when the assessment is performed based on the EER score, areas A and C are evaluated to be inefficient because of the low score; areas B and D are evaluated to be energy-efficient. Area C is evaluated to be efficient according to the EUI assessment, but inefficient due to the EER score. However, area D is evaluated to be inefficient according to the EUI assessment, but efficient due to the EER score.
After comparing the EUI assessment and the EER score in step 1, the EER score and the CPM parameters are compared in step 2. Step 2 explains the causes of low energy efficiency for buildings with low scores and identifies additional energy saving potentials based on the information regarding the parameters for buildings with high energy efficiency.
In the case of comparing the baseload () with the EER score, area A indicates that it is necessary to examine the cause of the high baseload as the cause of low energy efficiency. General hospitals have high baseloads because they are operated 24 h a day, and high-energy medical systems, such as magnetic resonance imaging and computed tomography, are used for medical services, including diagnosis and surgery. Specifically, as the EER score is the result of normalizing these operation characteristics, buildings with high baseloads that exhibit low energy efficiency indicates that other causes exist rather than operation. Contrarily, buildings with high energy efficiency despite the high baseload (area B) indicate the appropriate consumption of the baseload required for business activities. Areas C and D can be evaluated to be energy-efficient buildings based on the absolute amount of the baseload. However, area C, with a low EER score, indicates inefficient energy consumption compared to that of the baseload required for operation, whereas area D shows appropriate energy consumption as same as area B.
In the case of heating/cooling sensitivity (, ), area A shows that it is necessary to examine the thermal performance of the building envelope or the efficiency of the heating system as the cause of inefficient energy consumption. Area C shows that rather than heating sensitivity-related characteristics, other causes for low energy efficiency may exist. Area B indicates that additional building energy savings can be possible by examining the thermal performance of the envelope or the efficiency of the heating system.
Heating/cooling change temperature (, ) is a balance point temperature, which is the result of the internal heat gain created by people, lighting, and devices; heating/cooling setpoint temperature; and the solar radiation, insulation, and infiltration caused by the physical performance of the building. As the heating change-point increases, heating consumption increases because of the early onset of heating. As the cooling change-point decreases, cooling consumption increases because of the early start to cooling. Specifically, energy consumption is judged to be inefficient as the heating change-point increases or the cooling change-point decreases. When the heating change-point is judged to be inefficient, heating sensitivity also needs to be examined. For buildings with inefficient heating sensitivity (area A), it is first necessary to examine the thermal performance of the envelope or the infiltration of the building. However, when the heating change-point temperature is high, despite efficient heating sensitivity (area C), factors related to the heating setpoint temperature or occupant behavior can be examined first. For area B, additional energy saving potentials can be determined by first examining the items related to the physical performance of the building or occupant behavior, according to the heating sensitivity. These analyses can also be applied to the cooling change-point temperature. Particularly, when the cooling change-point temperature is low and the baseload is high, it is necessary to examine factors related to the internal load, such as the heat generated from lighting.
Step 3 presents an overview regarding whether or not a building is a retrofit priority, as well as a guide for energy saving by combining the results of steps 1 and 2. Buildings that correspond to areas A and C are determined as retrofit priorities in step 1, and the information concerning the items to be first examined for diagnosing the detailed causes of high or low energy efficiency is provided, based on the results of step 2.
4. Results
4.1. Results of Deriving EPIs for General Hospitals
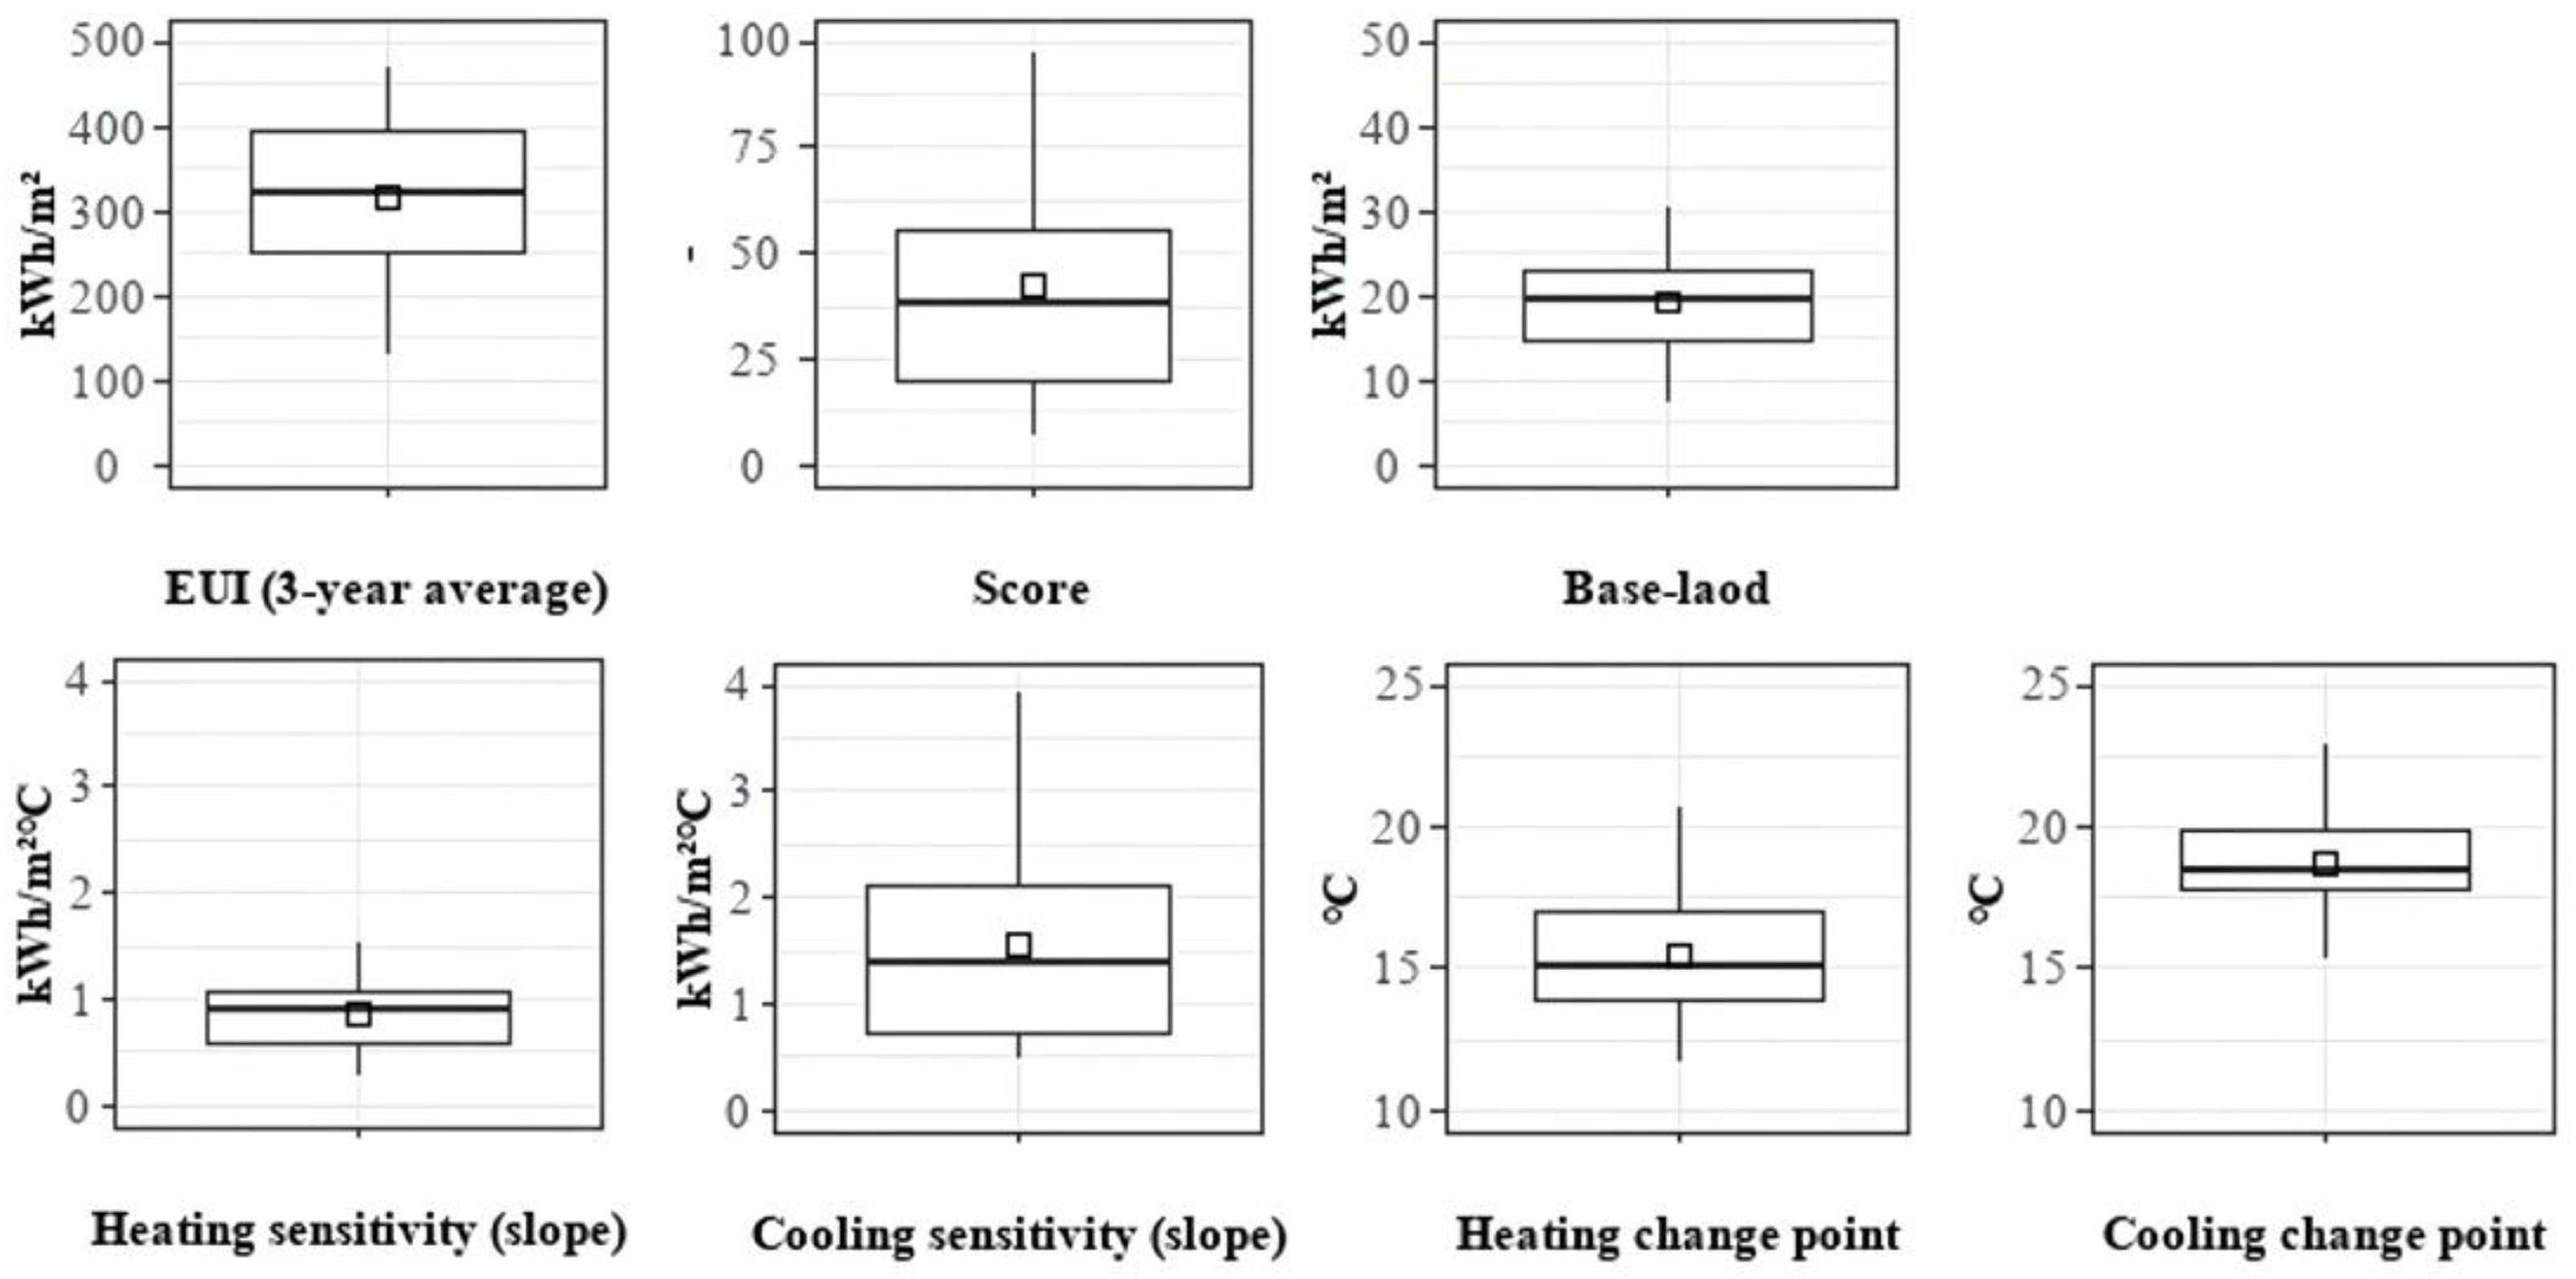
Table 6 lists the EPIs of 24 general hospitals; Figure 4 shows the EPI distribution of the hospitals. For all hospitals, the CPM type was found to be 5p. When the descriptive statistics of the EPIs were calculated for the 24 hospitals, the three-year EUI average was found to range from 312.2 to 324.8 kWh/m2. The EER score ranged from 7 to 97 points, and the average was 42.3 points.
Table 6.
Energy performance indicator information for 24 general hospitals.
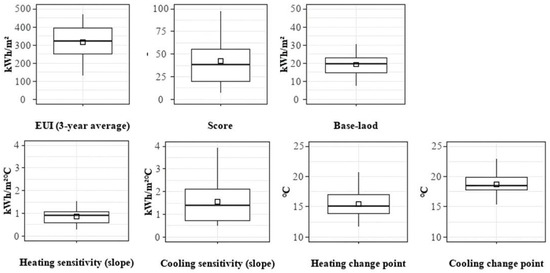
Figure 4.
The EPIs distribution of 24 general hospitals.
In regards to the distribution of heating and cooling sensitivity, the distribution of cooling sensitivity was wider than that of heating sensitivity, and the average cooling sensitivity (1.5 kWh/m2 °C) was higher than the average heating sensitivity (0.9 kWh/m2 °C). The heating change-point temperature ranged from 11.7 to 20.6 °C, whereas the cooling change-point temperature ranged from 15.3 to 22.8 ℃.
Figure 5 shows the results for the analysis of the correlations between the EPIs. The three-year energy consumption showed a clear correlation. As the EUI increased, the EER tended to increase, and the score tended to decrease, although very clear relationships were not observed.
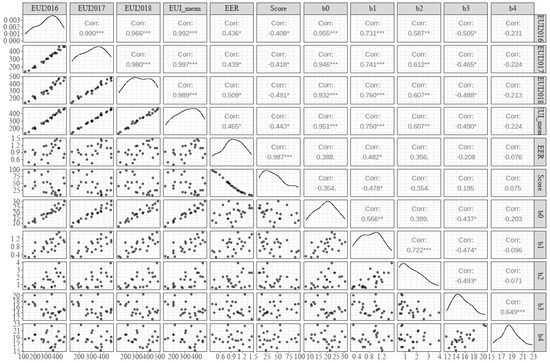
Figure 5.
Result of the EPIs correlation of 24 general hospitals (* p 0.05, ** p 0.01, *** p 0.001).
The baseload clearly increased as the EUI increased. For the relationship between the baseload and the EER score, the baseload tended to increase as the EER score decreased and to increase as the score increased; however, the correlation was low and was not significant compared to that of the EUI. This indicates that the results of normalizing the operational impacts of the number of staffed beds and the number of operating rooms were reflected in the outcomes. As the score increased, and showed a tendency to decrease. This implies that the envelope or system performance of the building is related to the EER score.
4.2. Applying the Energy Performance Assessment Method for the General Hospital
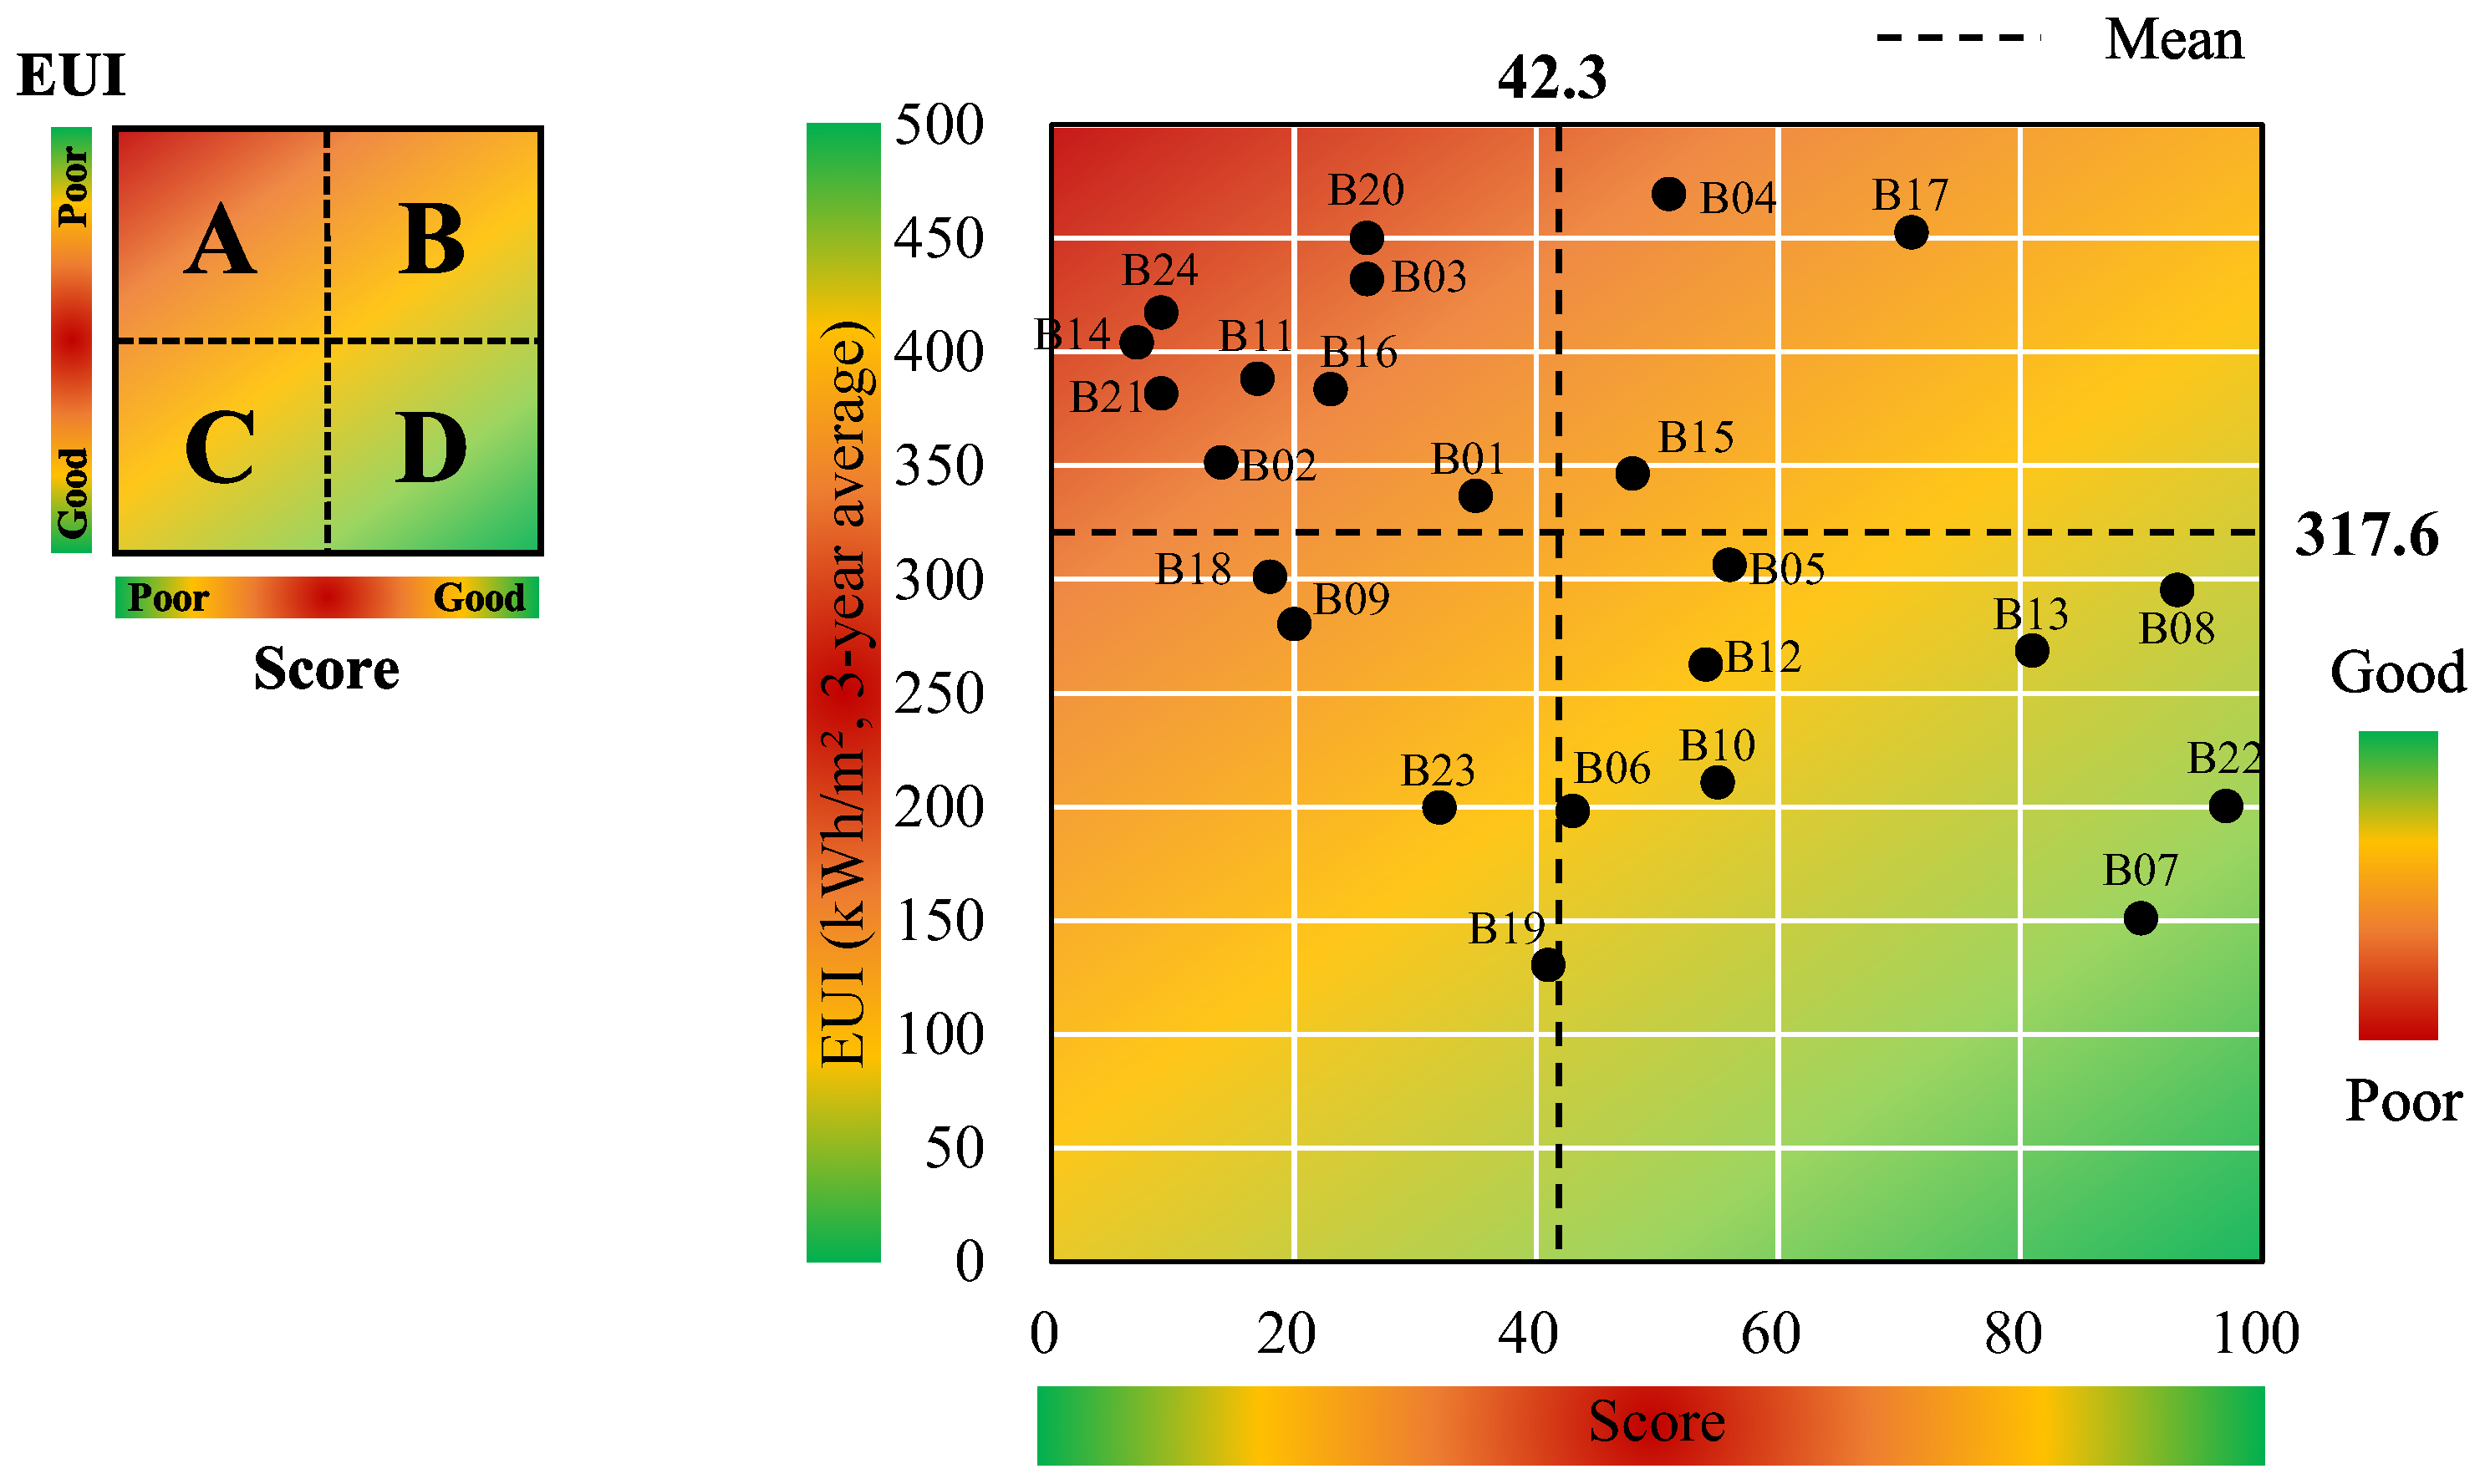
The EPIs derived in Section 4.1 were compared using the energy performance assessment method. Figure 6 shows the results of comparing the EER score and the EUI.
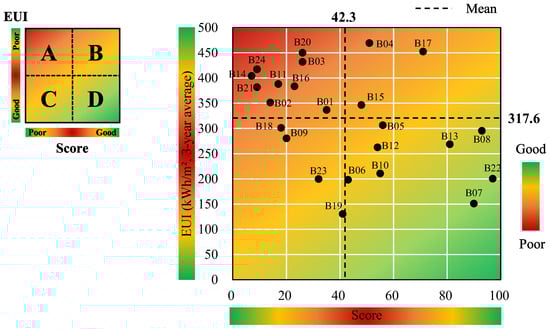
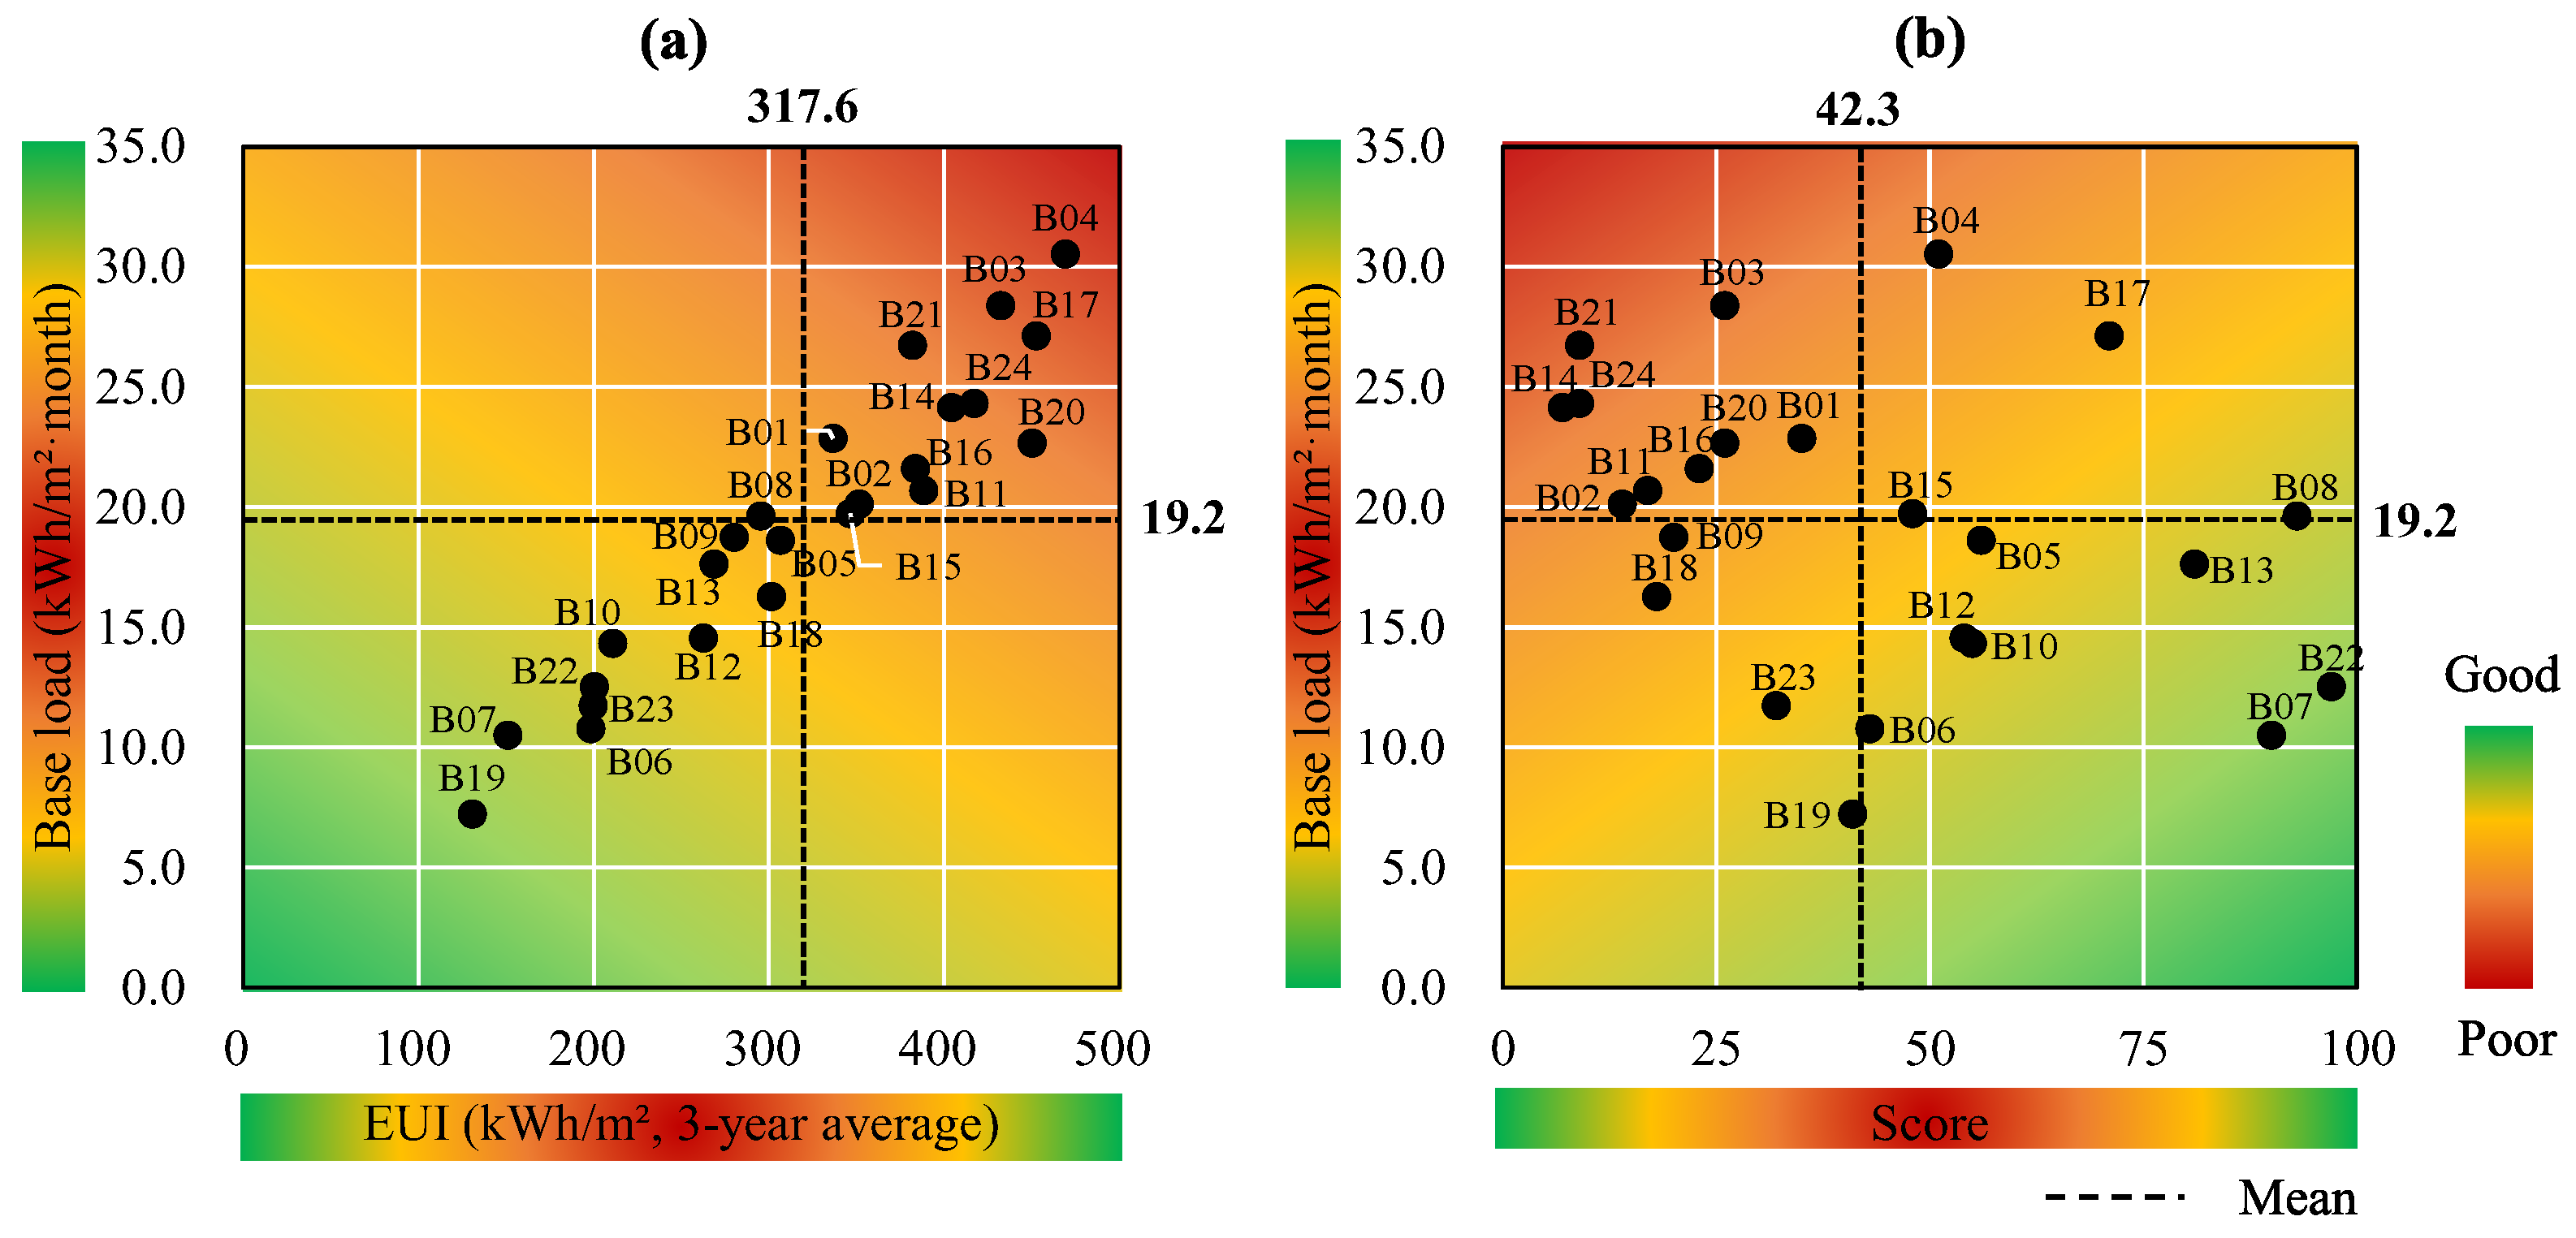
Figure 6.
Result of the EER score–EUI comparison.
Overall, the score decreased as the EUI increased. B04, B17, and B15 are buildings that correspond to area B, and are evaluated to be inefficient buildings for EUI, but efficient buildings for the score. In contrast, B19, B23, B09, and B18 are buildings that belong to area C. They are evaluated to have low energy efficiency because the score is low, even though the EUI is also low. Nine buildings that belong to area A (B20, B03, B24, B14, B11, B16, B21, B02, and B01) require energy saving first because the EUI is high, and the score is low. They are also retrofit priorities because of their low energy efficiency. Specifically, buildings in areas A and C can be determined as retrofit priorities.
For buildings that correspond to areas B and D, the score is high compared to that of buildings corresponding to areas A and C. It is necessary to increase the energy saving effect by identifying additional energy saving potentials based on the CPM parameter information.
Figure 6, Figure 7 and Figure 8 show the results of comparing the score and CPM parameters to explain the reasons of the energy efficiency assessment results. The proposed method compares only the score and the parameters; however, the results of comparing the EUI and CPM parameters were also analyzed to examine the difference, when the EUI is used.
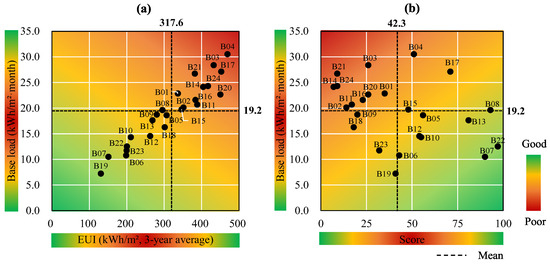
Figure 7.
Result of the EUI–baseload vs. the EER score–baseload comparison. (a) shows the EUI–baseload comparison results, and (b) shows the score–baseload comparison results.
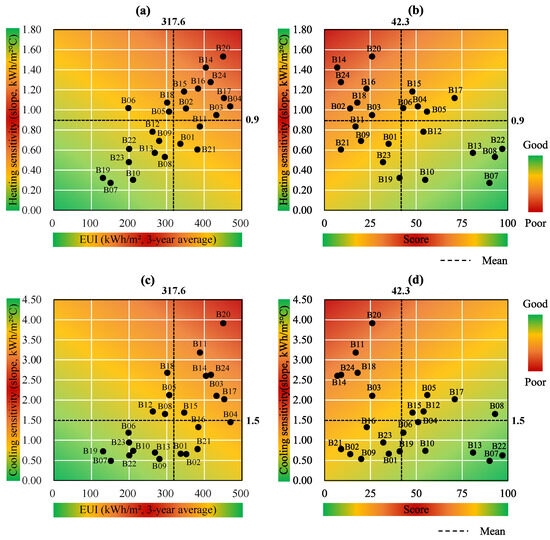
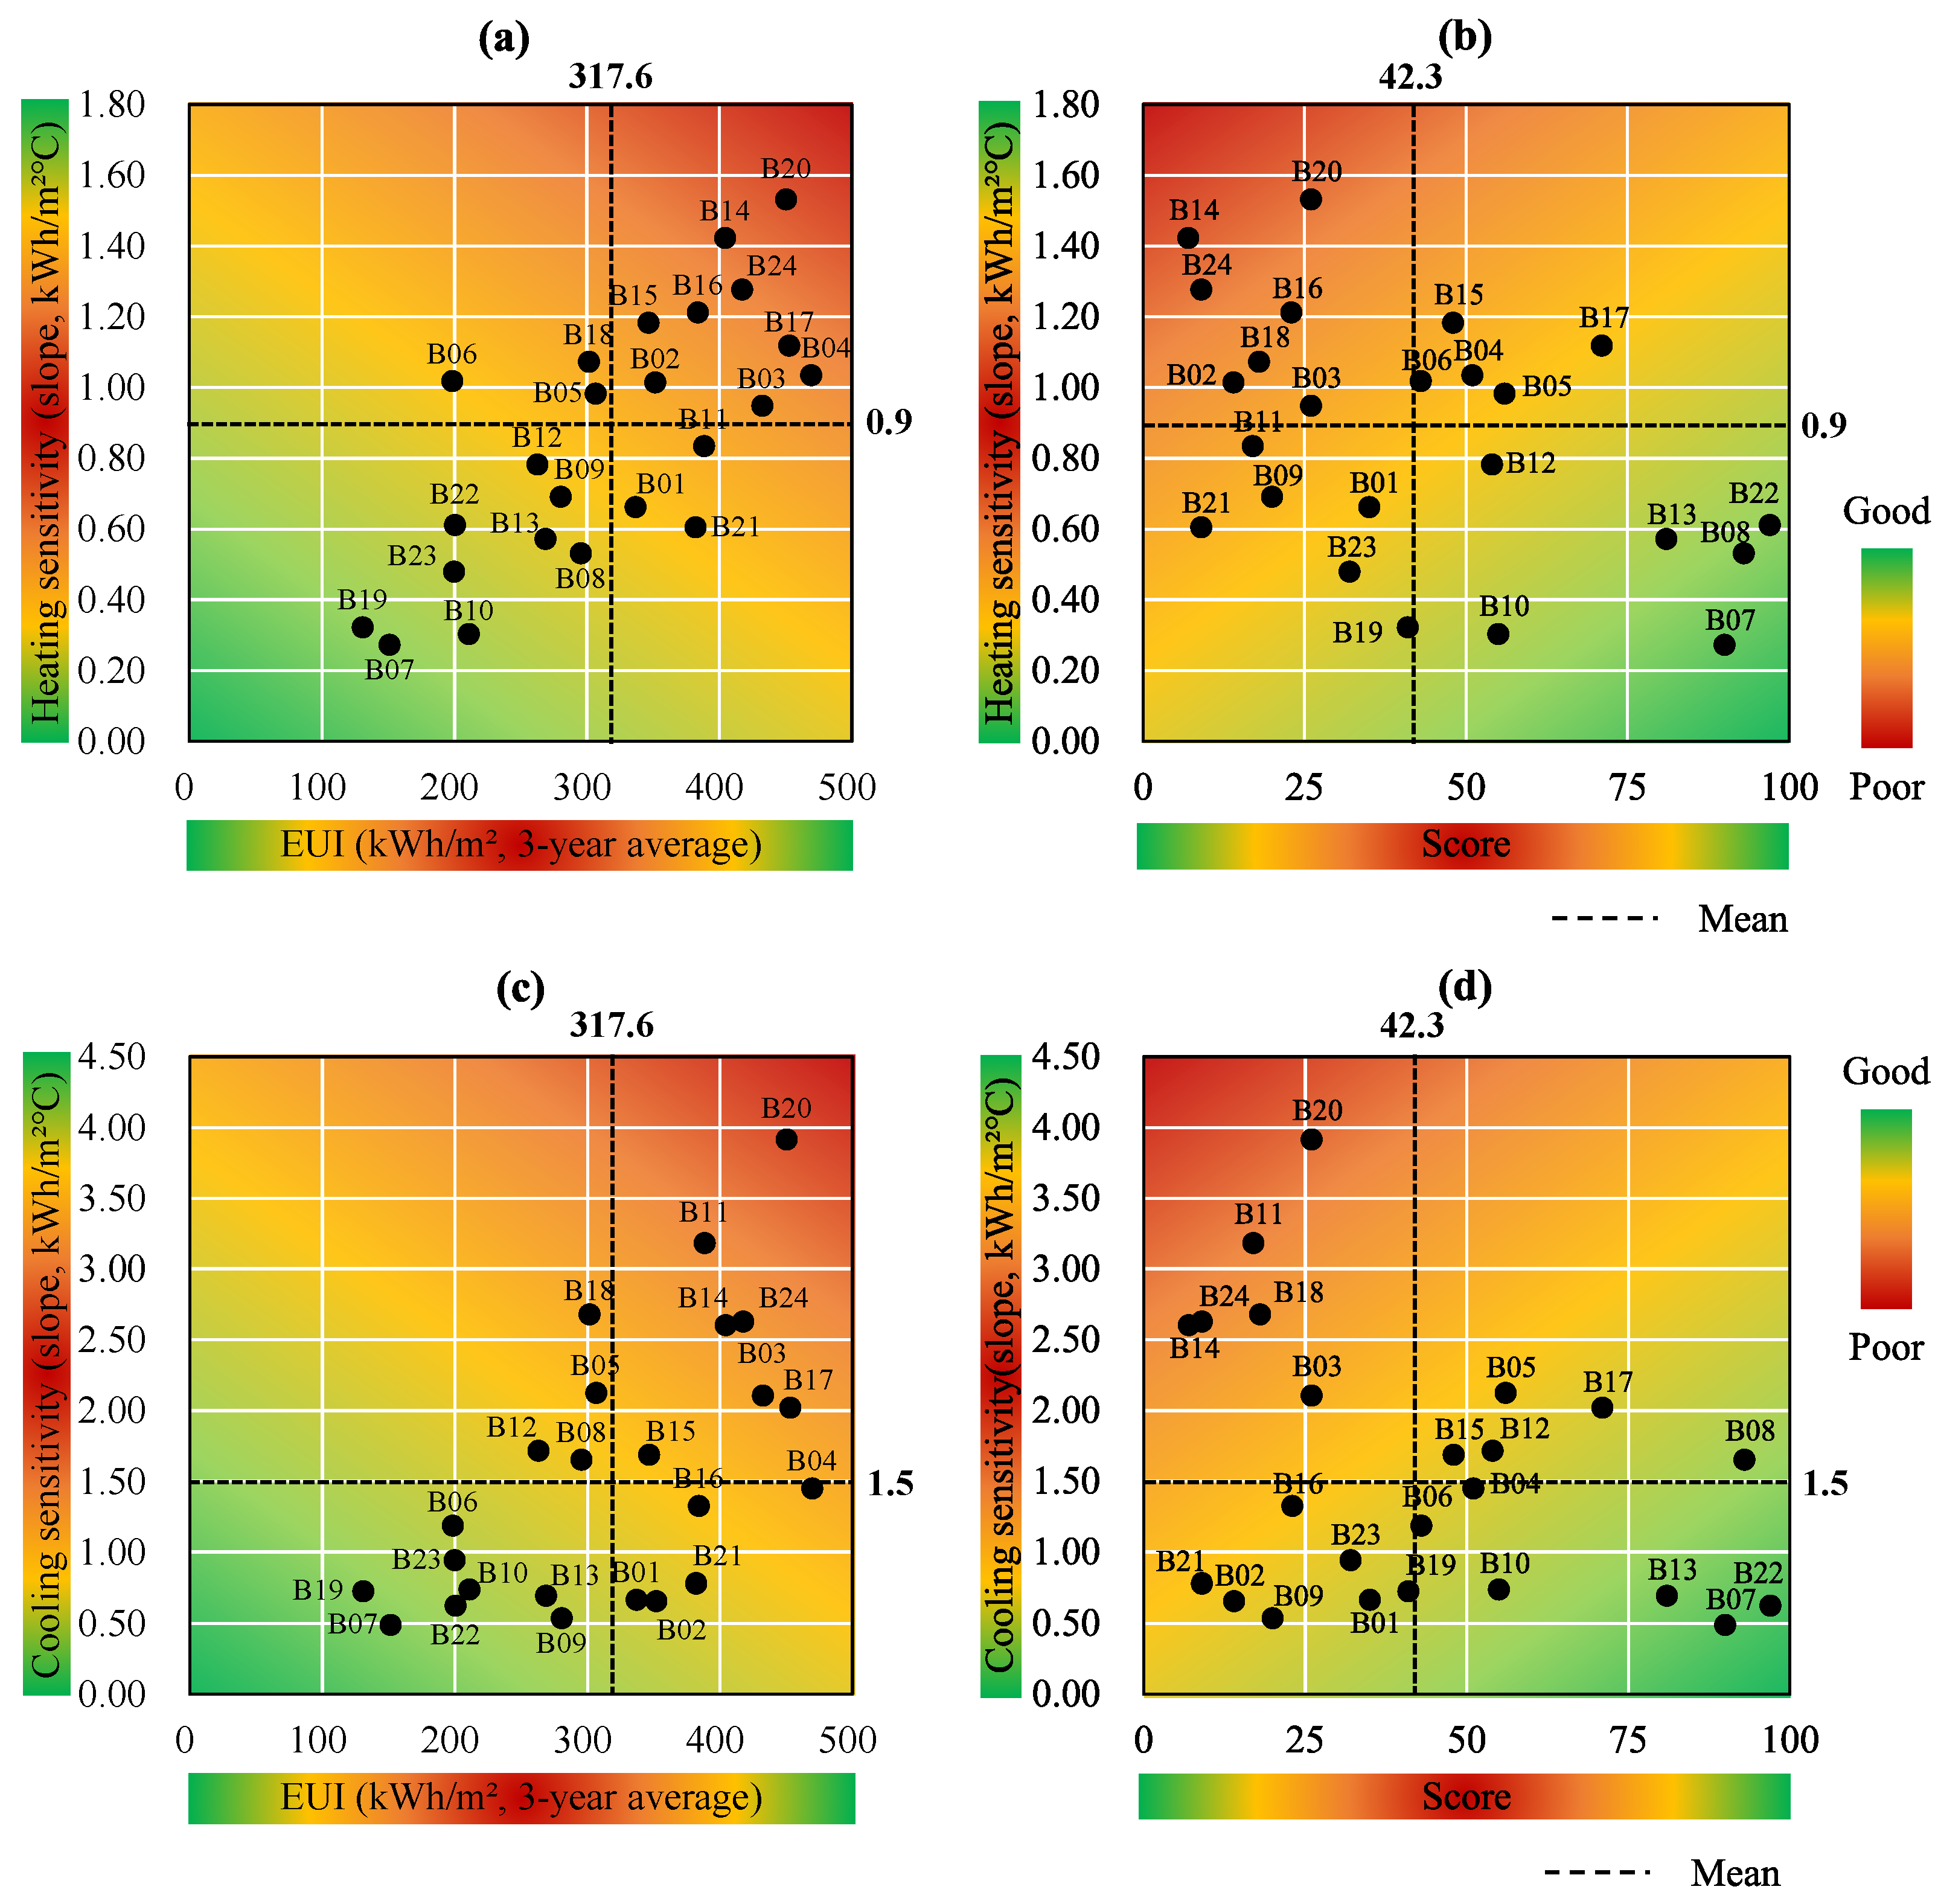
Figure 8.
Result of the EUI–sensitivity vs. EER score–sensitivity comparison. (a) shows the EUI–heating sensitivity comparison results, and (b) shows the score–heating sensitivity comparison results. (c) shows the EUI-cooling sensitivity comparison results, and (d) shows the score–cooling sensitivity comparison results.
In Figure 7a, a very strong positive correlation between the EUI and the baseload existed. This appears to be because the general hospitals are generally operated 24 h a day, and high-energy medical systems are used for medical services, such as diagnosis and surgery. However, it is unknown whether the high baseload was used for business activity or lighting.
In contrast, Figure 7b shows the relationship between the EER score and the baseload. Including B04, with the highest baseload, B17, B15, and B8 showed high efficiency scores, despite the high baseload. This indicates that the baseload required for operation is appropriately used, and the baseload for factors other than operation, such as lighting, is efficiently consumed. In contrast, nine hospitals that belong to area A (B03, B21, B24, B14, B20, B01, B16, B11, and B02) and four buildings that belong to area C (B09, B18, B23, and B19) show the inefficient consumption of the baseload, even considering their operation characteristics. This indicates that the lighting or other special equipment needs to be examined.
Figure 8a,c shows the results of comparing the EUI with the heating and cooling sensitivity, respectively. Figure 8b,d show the results of comparing the score with heating sensitivity and cooling sensitivity, respectively.
High heating and cooling sensitivity mean that energy consumption increases rapidly with temperature changes, and the related building envelope performance (e.g., thermal performance of the envelope and infiltration) or equipment efficiency needs to be examined. If they are compared with the score, as in Figure 8b,d, it is possible to identify whether the reason for energy-inefficient buildings is related to heating/cooling sensitivity.
For example, B11, B09, B21, B01, B23, and B19 in Figure 8b, as well as B16, B23, B21, B02, B09, B09, and B19 in Figure 8d, belonging to area C show, not only low EER scores, but also low heating/cooling sensitivity values. This means that the low EER scores are highly likely to be caused by the baseload or behavioral problems, rather than the physical performance of the buildings. Therefore, it is necessary to first examine the baseload or heating/cooling change temperature, as well as the related factors. In contrast, buildings that belong to area B (B15, B17, B04, B16, and B05 in Figure 8b, as well as B05, B17, B15, B12, and B08 in Figure 8d) exhibit efficient energy consumption, and they would be able to consume energy more efficiently if the physical performance factors related to cooling and heating were first examined and improved.
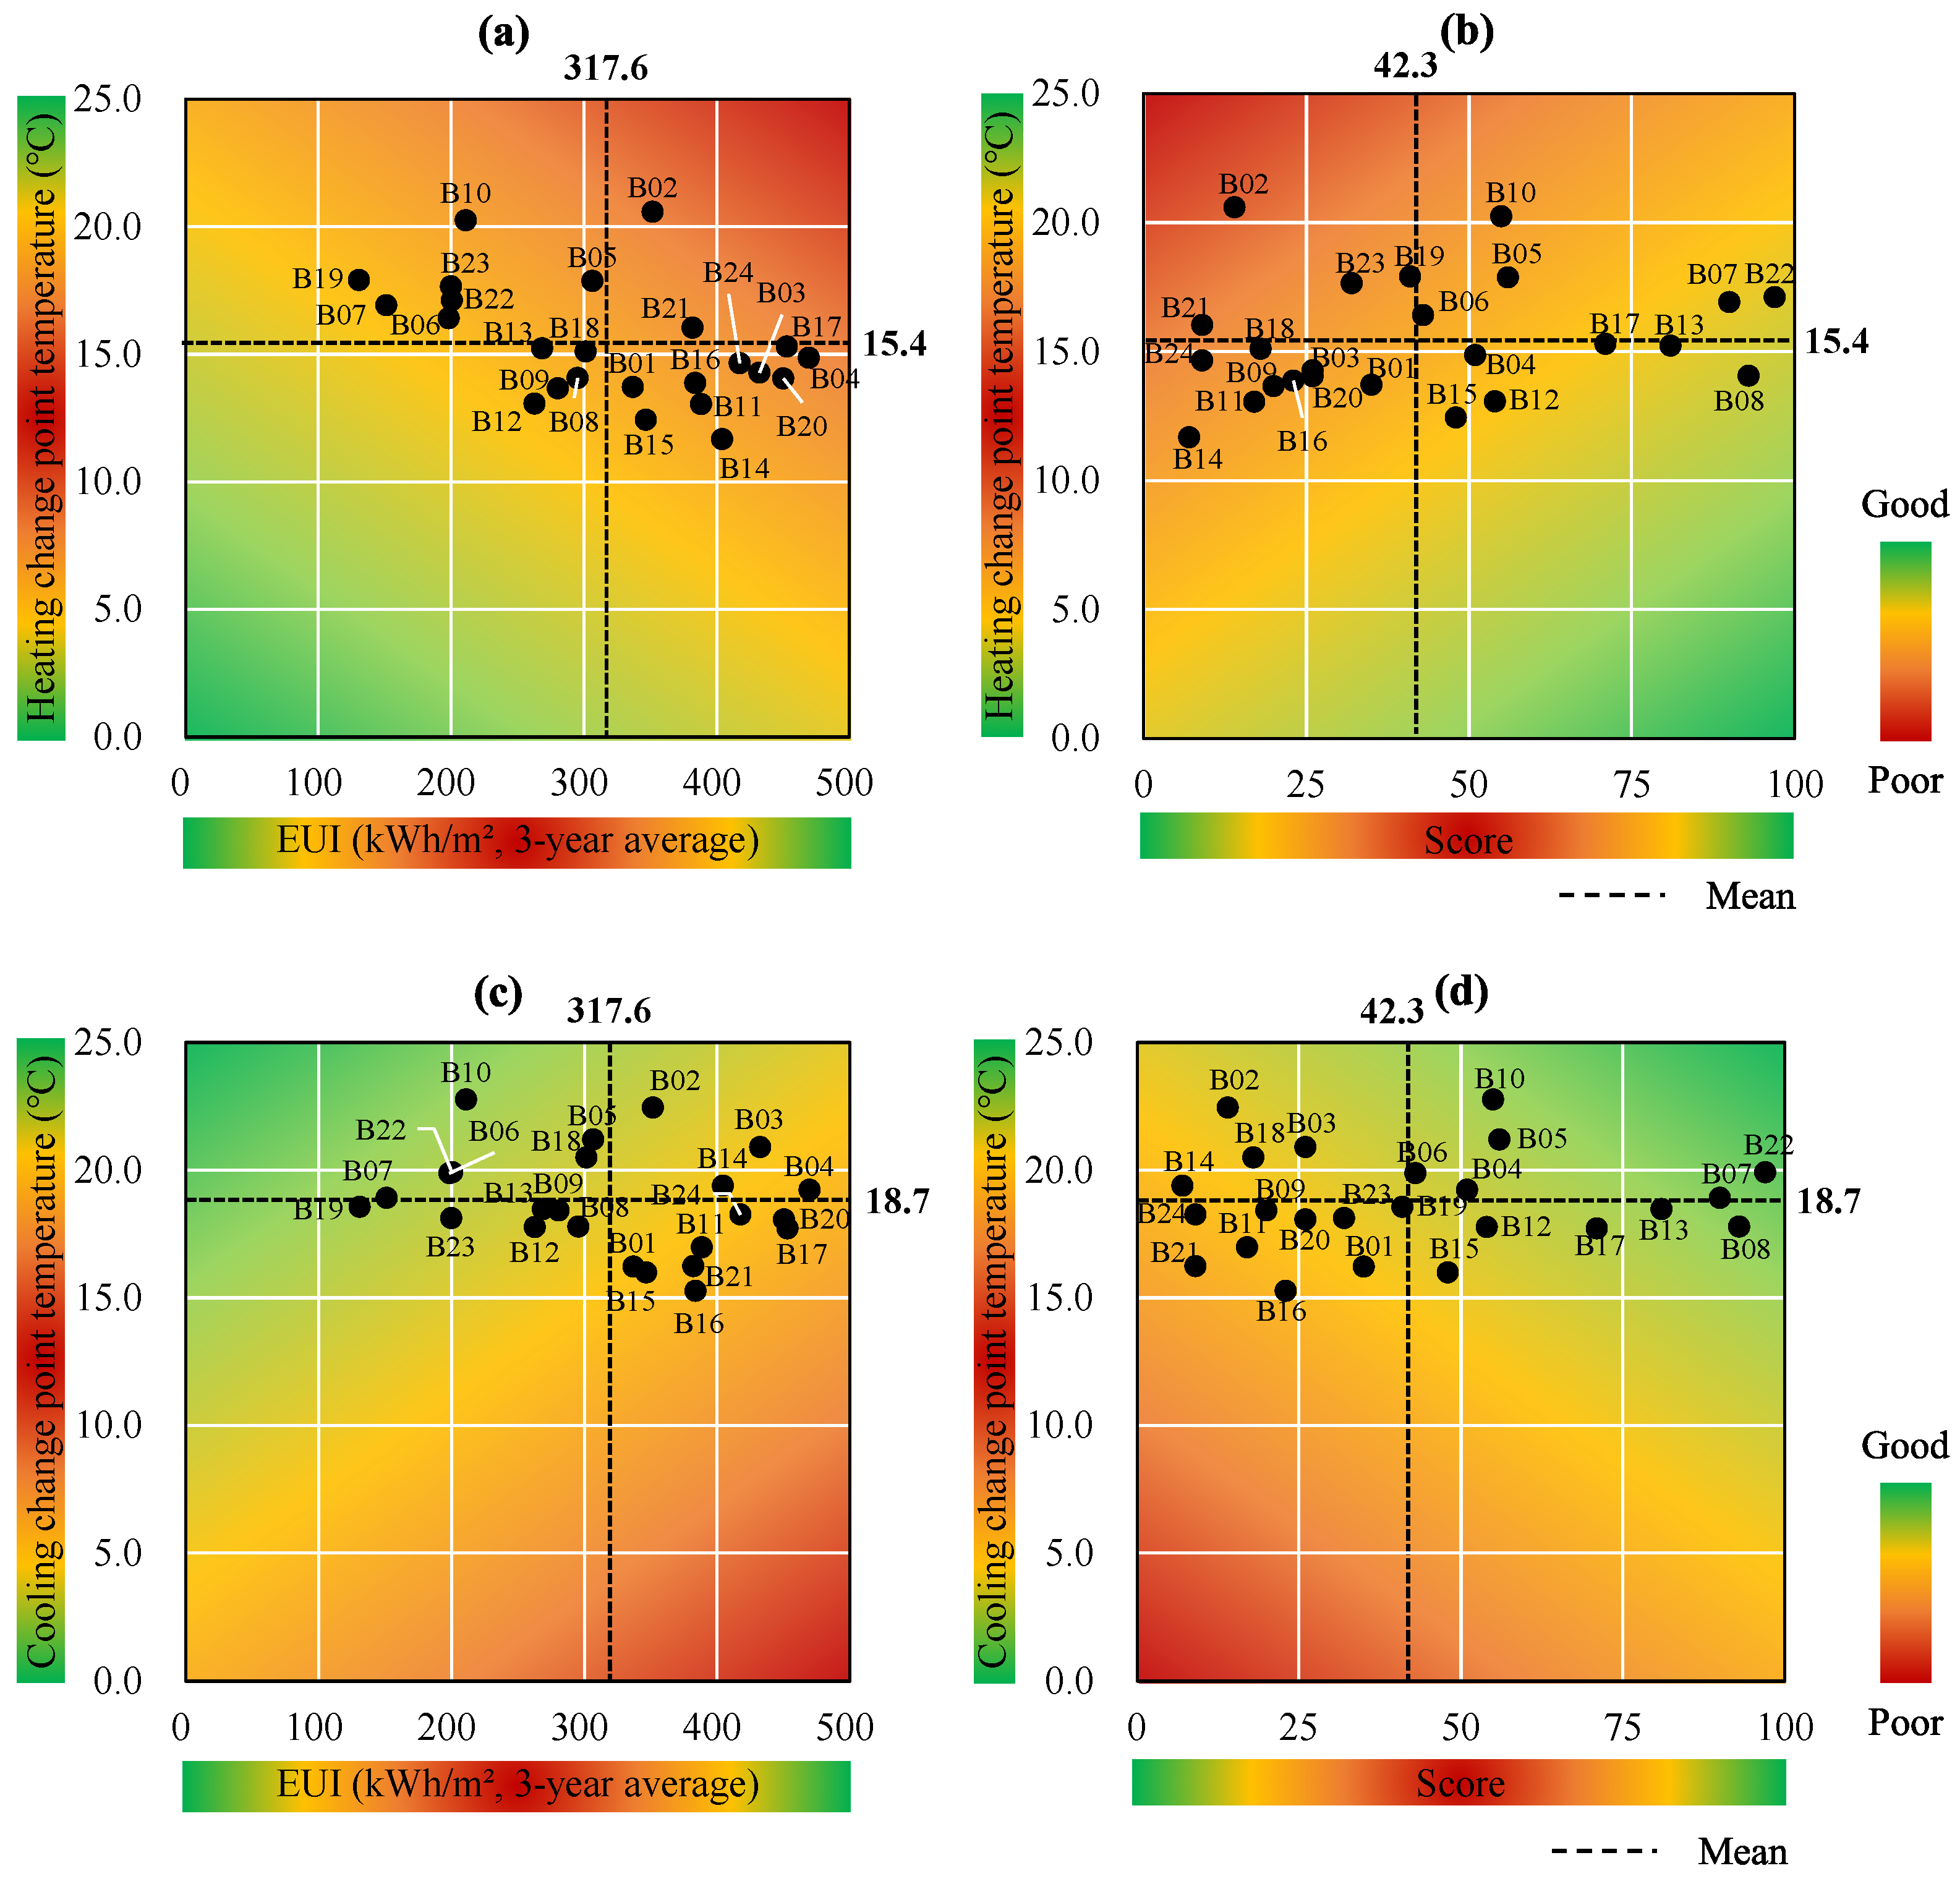
The change-point temperatures in Figure 9 are the results of the physical performance, indoor setpoint temperature, and occupant behavior of the buildings. A building with a high heating change-point temperature compared to other buildings means that it starts heating relatively early. A building with a lower cooling change-point temperature than other buildings indicates that it starts cooling relatively early.
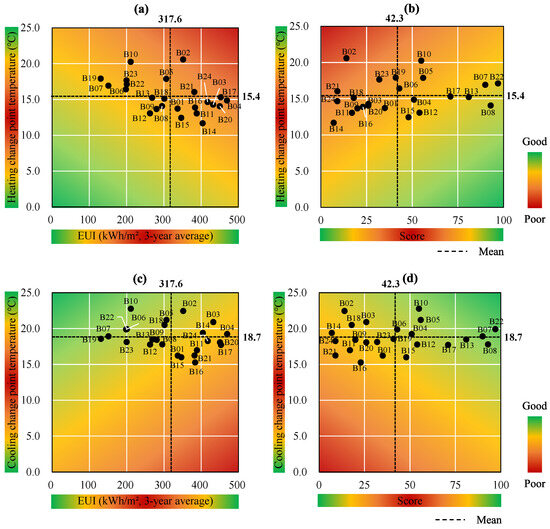
Figure 9.
Result of the EUI–change-point temperature vs. EER score–change-point temperature comparison. (a) shows the EUI–heating change point temperature comparison results, and (b) shows the score–heating change point temperature comparison results. (c) shows the EUI-cooling change point temperature comparison results, and (d) shows the score–cooling change point temperature comparison results.
Area A in Figure 9b is the case in which heating commenced early because of the high heating change-point temperature. If heating sensitivity is evaluated to be inefficient, it can be considered that heating begins early because of factors such as thermal performance of the envelope and infiltration. When the heating change-point temperature is high, despite efficient heating sensitivity (area C), factors related to the heating setpoint temperature or occupant behavior should be examined first. For area B in Figure 9b, additional energy saving potential can be determined by first examining the items related to the physical performance of the building or occupant behavior, according to the heating sensitivity.
These analyses can also be applied to the cooling change-point temperature in Figure 9d. Specifically, when the cooling change-point temperature is low and the baseload is high, examining factors related to the internal load, such as the heat from lighting, is necessary.
Summarily, setting the items that must be examined first is necessary to explain the reasons for energy efficiency levels and to establish plans for energy saving strategies, based on the results of comparing the score and each EPI. Table 7 shows the comprehensive EPIs analysis results for some buildings, as well as the subsequent guide derivation results. The guide derivation results for all buildings can be found in Table A1 in Appendix A.
Table 7.
Assessment results and guide for general hospitals.
5. Conclusions
This study presents a method for supplementing the limitations of the EER score by proposing an energy performance assessment method that can provide descriptive information regarding the assessment results, along with the energy efficiency assessment results which normalized business activities. The proposed method was applied to 24 general hospitals in Korea, and the results were analyzed.
For the hospitals, raw data were collected to derive the three-year energy consumption, the EUI, the modified EER score, and the CPM parameters; then, the EPIs were derived. The EPIs were compared with each other to evaluate the energy efficiency level and derive a guide to explain the reason for the EER score. The results of this study can be summarized as follows.
- 1.
- Supplementation of the limitations of the EER score using CPM parameters: It was possible to identify reasons for buildings with low scores and additional energy saving potential for buildings with high scores by comparing the EER score and the CPM parameters.
- 2.
- EER score–CPM parameter comparison to establish energy saving strategies: The characteristics of each area of the EUI-score comparison graph are summarized as follows:
- Area A (B01, B02, B03, B11, B14, B16, B20, B21, and B24): For all of the buildings, the baseload was high, and either heating or cooling sensitivity, or both, were found to be inefficient. For the baseload, examining the operation of special equipment and other factors, such as lighting, is necessary. Physical performance must also be examined because the sensitivity is relatively high compared to that of other buildings.
- Area B (B04, B15, and B17): Most hospitals have a high baseload, but also exhibit a high EER score, which means that a high baseload can be judged as an appropriate amount of energy consumption to operate the hospital. For all of the buildings, it was found that the efficiency of the heating/cooling sensitivity needs to be improved, although the change-point temperature was efficient. This indicates that further energy saving is possible by improving the physical performance of the buildings.
- Area C (B09, B18, B19, and B23): For three of the four buildings, the sensitivity was found to be efficient; however, the heating/cooling change-point temperature was inefficient. The indoor setpoint temperature or occupant behavior must first be examined.
- Area D (B05, B06, B07, B08, B10, B12, B13, and B22): Two buildings indicated that the baseload or sensitivity required examination. However, for most of the buildings, the heating/cooling sensitivity and the baseload were found to be efficient, and only the change-point temperature required examination.
The proposed energy assessment method shows that it is possible to interpret the energy efficiency assessment results by simply comparing the CPM parameters while maintaining the EER score. For green remodeling retrofit projects to practically reduce the energy consumption of existing buildings, a method to provide the information, combined with the EER score, should be employed.
However, this method presents a guide for factors that need to be examined prior to energy efficiency diagnosis, but it is not a method to diagnose accurate building energy performance. Additionally, this study is not intended to improve the reliability of the EER calculation model. Future research should further improve the reliability of the assessment results via a comparison with ML-based model improvement.
Author Contributions
Conceptualization, H.G.K. and S.S.K.; methodology, H.G.K. and S.S.K.; formal analysis, H.G.K. and S.S.K.; investigation, H.G.K. and S.S.K.; writing—original draft, H.G.K.; writing—review and editing, H.G.K.; supervision, H.G.K.; project administration, H.G.K. All authors have read and agreed to the published version of the manuscript.
Funding
This research was supported by the Basic Science Research Program through the National Research Foundation of Korea (NRF), funded by the Ministry of Science, ICT, and Future Planning (grant number NRF 2020R1A2C1103033) and the Korea Institute of Energy Technology Evaluation and Planning (KETEP) and the Ministry of Trade, Industry, and Energy (MOTIE) of the Republic of Korea (No. 20202020800360).
Institutional Review Board Statement
Not applicable.
Informed Consent Statement
Not applicable.
Conflicts of Interest
The authors declare no conflict of interest.
Appendix A. Assessment Result and Guidelines for Each of the 24 General Hospitals
Table A1.
The detailed guide derivation results for 24 hospitals.
Table A1.
The detailed guide derivation results for 24 hospitals.
| Code | EUI vs. Score | Score vs. CPM Parameters | Results and Guidelines | |||||
|---|---|---|---|---|---|---|---|---|
| Retrofit | Guidelines | |||||||
| B01 | A | A | C | C | C | A | Required |
|
| B02 | A | A | A | C | A | C | Required |
|
| B03 | A | A | A | A | C | C | Required |
|
| B04 | B | B | B | D | D | D |
| |
| B05 | D | D | B | B | B | D |
| |
| B06 | D | D | B | D | B | D |
| |
| B07 | D | D | D | D | B | D |
| |
| B08 | D | B | D | B | D | B |
| |
| B09 | C | C | C | C | C | A | Required |
|
| B10 | D | D | D | D | B | D |
| |
| B11 | A | A | C | A | C | A | Required |
|
| B12 | D | D | D | B | D | B |
| |
| B13 | D | D | D | D | D | B |
| |
| B14 | A | A | A | A | C | C | Required |
|
| B15 | B | B | B | B | D | B |
| |
| B16 | A | A | A | C | C | A | Required |
|
| B17 | B | B | B | B | D | B |
| |
| B18 | C | C | A | A | C | C | Required |
|
| B19 | C | C | C | C | A | A | Required |
|
| B20 | A | A | A | A | C | A | Required |
|
| B21 | A | A | C | C | A | A | Required |
|
| B22 | D | D | D | D | B | D |
| |
| B23 | C | C | C | C | A | A | Required |
|
| B24 | A | A | A | A | C | A | Required |
|
A: Poor EER score and poor parameters (or EUI). B: Good EER score and poor parameters (or EUI). C: Poor EER score and good parameters (or EUI). D: Good EER score and good parameters (or EUI).  : Need for improved efficiency.
  : Determined as an efficient EPI based on EER score.
: Need for improved efficiency. : Determined as an efficient EPI based on EER score.References
- Ye, Y.; Zuo, W.; Wang, G. A comprehensive review of energy-related data for U.S. commercial buildings. Energy Build. 2019, 186, 126–137. [Google Scholar] [CrossRef]
- Wu, T.; Wang, B.; Zhang, D.; Zhao, Z.; Zhu, H. Benchmarking Evaluation of Building Energy Consumption Based on Data Mining. Sustainability 2023, 15, 5211. [Google Scholar] [CrossRef]
- Borgstein, E.H.; Lamberts, R.; Hensen, J.L.M. Evaluating energy performance in non-domestic buildings: A review. Energy Build. 2016, 128, 734–755. [Google Scholar] [CrossRef]
- Geraldi, M.S.; Ghisi, E. Building-level and stock-level in contrast: A literature review of the energy performance of buildings during the operational stage. Energy Build. 2020, 211, 109810. [Google Scholar] [CrossRef]
- Mathew, P.; Mills, E.; Bourassa, N.; Brook, M. Action-oriented benchmarking: Using the CEUS database to benchmark commercial buildings in California. Energy Eng. 2008, 105, 6–18. [Google Scholar] [CrossRef]
- Chung, W. Review of building energy-use performance benchmarking methodologies. Appl. Energy 2011, 88, 1470–1479. [Google Scholar] [CrossRef]
- Kim, D.W.; Kim, Y.M.; Lee, S.E. Development of an energy benchmarking database based on cost-effective energy performance indicators: Case study on public buildings in South Korea. Energy Build. 2019, 191, 104–116. [Google Scholar] [CrossRef]
- Hong, T.; Yan, D.; D’Oca, S.; Chen, C.F. Ten questions concerning occupant behavior in buildings: The big picture. Build. Environ. 2017, 114, 518–530. [Google Scholar] [CrossRef]
- O’Brien, W.; Wagner, A.; Schweiker, M.; Mahdavi, A.; Day, J.; Kjærgaard, M.B.; Carlucci, S.; Dong, B.; Tahmasebi, F.; Yan, D.; et al. Introducing IEA EBC annex 79: Key challenges and opportunities in the field of occupant-centric building design and operation. Build. Environ. 2020, 178, 106738. [Google Scholar] [CrossRef]
- Hsu, D. How much information disclosure of building energy performance is necessary? Energy Policy 2014, 64, 263–272. [Google Scholar] [CrossRef]
- Kim, H.G.; Jeong, D.W.; Kwon, S.J.; Kim, S.S. Development of building energy performance benchmark for hospitals. Buildings 2022, 13, 12. [Google Scholar] [CrossRef]
- Environmental Protection Agency (EPA); Department of Energy (DOE). Energy Star Performance Ratings: Technical Methodology; United States Environmental Protection Agency: Washington, DC, USA, 2011.
- Environmental Protection Agency (EPA). Benchmark with EPA’s ENERGY STAR Portfolio Manager. Available online: https://www.energystar.gov/buildings/facility-owners-and-managers/existing-buildings/use-portfolio-manager/ (accessed on 21 August 2023).
- Energy Information Agency. Commercial Buildings Energy Consumption Survey. 2018. Available online: https://www.eia.gov/consumption/commercial/ (accessed on 21 August 2023).
- Monts, J.K.; Blissett, M. Assessing energy efficiency and energy conservation potential among commercial buildings: A statistical approach. Energy 1982, 7, 861–869. [Google Scholar] [CrossRef]
- Wei, Z.; Xu, W.; Wang, D.; Li, L.; Niu, L.; Wang, W.; Wang, B.; Song, Y. A study of city-level building energy efficiency benchmarking system for China. Energy Build. 2018, 179, 1–14. [Google Scholar] [CrossRef]
- Dahlan, N.Y.; Mohamed, H.; Kamaluddin, K.A.; Abd Rahman, N.M.; Reimann, G.; Chia, J.; Ilham, N.I. Energy Star based benchmarking model for Malaysian government hospitals-A qualitative and quantitative approach to assess energy performances. J. Build. Eng. 2022, 45, 103460. [Google Scholar] [CrossRef]
- Department for Communities and Local Government (DCLG). The Government’s Methodology for the Production of Operational Ratings, Display Energy Certificates and Advisory Reports; Communities and Local Government Publications: Wetherby West Yorkshire, UK, 2008.
- Sustainable Energy Authority of Ireland (SEAI). Display Energy Certificate (DEC). Available online: https://www.seai.ie/business-and-public-sector/display-energy-certificate/ (accessed on 21 August 2023).
- Rodin, C. Energideklaration för John Mattson Fastighets AB: Energibesparing Med Bibehållen Kundkvalitet; Department of Technology and Society, Mälardalens University: Västerås, Sweden, 2011. [Google Scholar]
- Australian Government Department of Industry. Science, Energy and Resources. Commercial Building Disclosure (CBD). Available online: http://cbd.gov.au/ (accessed on 21 August 2023).
- Bundesministerium für Wirtschaft und Energie und Bundesministerium des Innern, für Bau und Heimat. Bekanntmachung der Regeln für Energieverbrauchswerte und der Vergleichswerte Im Nichtwohngebäudebestand; Bundesministerium für Wirtschaft und Energie und Bundesministerium des Innern, für Bau und Heimat: Berlin, Germany, 2015.
- Bureau of Energy Efficiency. Scheme for Star Rating of Hospital Buildings; Ministry of Power, Government of India Publications: New Delhi, India, 2014.
- Environmental Protection Agency (EPA). Portfolio Manager Technical Reference: EER Score. Available online: https://www.energystar.gov/buildings/tools-and-resources/portfolio-manager-technical-reference-energy-star-score (accessed on 21 August 2023).
- Sesana, M.M.; Salvalai, G. A review on building renovation passport: Potentialities and barriers on current initiatives. Energy Build. 2018, 173, 195–205. [Google Scholar] [CrossRef]
- Sesana, M.M.; Rivallain, M.; Salvalai, G. Overview of the available knowledge for the data model definition of a building renovation passport for non-residential buildings: The ALDREN project experience. Sustainability 2020, 12, 642. [Google Scholar] [CrossRef]
- Ji, C.; Choi, M.; Hong, T.; Yeom, S.; Kim, H. Evaluation of the effect of a building energy efficiency certificate in reducing energy consumption in Korean apartments. Energy Build. 2021, 248, 111168. [Google Scholar] [CrossRef]
- Arjunan, P.; Poolla, K.; Miller, C. EnergyStar++: Towards more accurate and explanatory building energy benchmarking. Appl. Energy 2020, 276, 115413. [Google Scholar] [CrossRef]
- Scofield, J.H. Building EER Scores: Good Idea, Bad Science; CreateSpace Independent Publishing Platform: Scotts Valley, CA, USA, 2016. [Google Scholar]
- ASHRAE. Handbook: Fundamentals 2017; American Society of Heating, Refrigerating and Air Conditioning Engineers: Atlanta, GA, USA, 2017. [Google Scholar]
- Kissock, J.K.; Haberl, J.S.; Claridge, D.E. Development of a toolkit for calculating linear, change-point linear and multiple-linear inverse building energy analysis models. In ASHRAE Research Project 1050; Final Report; Energy Systems Laboratory, Texas A&M University: Bryan, TX, USA, 2002. [Google Scholar]
- Yoon, S.H.; Park, C.S. Objective building energy performance benchmarking using data envelopment analysis and Monte Carlo sampling. Sustainability 2017, 9, 780. [Google Scholar] [CrossRef]
- Mills, E.; Mathew, P.; Piette, M.A.; Bourassa, N.; Brook, M. Action–oriented benchmarking: Concepts and tools. Energy Eng. 2008, 105, 21–40. [Google Scholar] [CrossRef]
- Wang, S.; Yan, C.; Xiao, F. Quantitative energy performance assessment methods for existing buildings. Energy Build. 2012, 55, 873–888. [Google Scholar] [CrossRef]
- Andrews, A.; Jain, R.K. Beyond Energy Efficiency: A clustering approach to embed demand flexibility into building energy benchmarking. Appl. Energy 2022, 327, 119989. [Google Scholar] [CrossRef]
- Hamilton, I.G.; Summerfield, A.J.; Lowe, R.; Ruyssevelt, P.; Elwell, C.A.; Oreszczyn, T. Energy epidemiology: A new approach to end-use energy demand research. Build. Res. Inf. 2013, 41, 482–497. [Google Scholar] [CrossRef]
- Hamilton, I.; Summerfield, A.; Oreszczyn, T.; Ruyssevelt, P. Using epidemiological methods in energy and buildings research to achieve carbon emission targets. Energy Build. 2017, 154, 188–197. [Google Scholar] [CrossRef]
- Kim, H.G.; Kim, S.S. Building Energy Consumption Analysis System and Method. Korea 10-2023-0088982, 10 July 2023. [Google Scholar]


Disclaimer/Publisher’s Note: The statements, opinions and data contained in all publications are solely those of the individual author(s) and contributor(s) and not of MDPI and/or the editor(s). MDPI and/or the editor(s) disclaim responsibility for any injury to people or property resulting from any ideas, methods, instructions or products referred to in the content. |
© 2023 by the authors. Licensee MDPI, Basel, Switzerland. This article is an open access article distributed under the terms and conditions of the Creative Commons Attribution (CC BY) license (https://creativecommons.org/licenses/by/4.0/).