Abstract
The visibility and spatial characteristics of commercial space are the key factors that affect the space vitality. However, the coupling visibility graphical analysis of commercial spaces and spatial characteristics to quantitatively analyse consumer behaviour in commercial street spaces and assess the vitality of retail spaces has not been adequately studied. In this paper, the aim is to conduct a visibility graph analysis of Zhuangli Street in Letai Center, Shijiazhuang, using space syntax theory, assessing the spatial vitality of the retail space by investigating the shop visits. First, a methodology for obtaining data on spatial characteristics and consumer behaviour of shopping streets was developed. Secondly, this article constructs a process for a visibility graph analysis of Zhuangli Street based on space syntax theory. Third, two combination variables of the space coefficient and depth coefficient of shop windows in retail spaces of a commercial street are proposed. Finally, the effect of combination variables and business types on spatial vitality was analyzed using correlation and multiple regression methods, and a space vitality prediction model was proposed. The results showed that the shop with the highest shop visits of retail spaces in the shopping street is 13.55 times higher than the smallest shop. The space coefficient of the shop window, depth coefficient of the shop window, and space connectivity of retail spaces in commercial streets have positive effects on space vitality. The workflow proposed in this paper can provide technical support for retail space design in commercial streets as well as evaluating and optimizing commercial street space design solutions.
1. Introduction
Streets are the breathing space of the city. As White pointed out, “The road was the life stream of the city, the place where we meet, and the path to the core” [1]. Since ancient times, livable streets have not only been a place for people to cross the road or walk, but also a place for people to engage in business, social, and recreational activities. By the late 1950s, scholars had proposed two conflicting approaches to street development. The first was to increase the capacity of the streets to accommodate the rapidly increasing population and vehicles. The second was to provide a diverse street, which was able to accept a variety of public transport options and pedestrian networks rather than cars [2,3,4]. There is a global trend towards vibrant streets that meet needs ranging from food and basic safety to beauty, cultural impressions, and a sense of belonging to a community or place, encouraging people to stay longer and, thus, improving the quality of life in public spaces [5,6]. In this context, in order to meet the increasingly rich spiritual needs of the people, commercial spaces with functions, such as shopping, consumption, and leisure communication, have emerged [7]. Commercial building construction projects are often invested in a large number of social and economic resources, pedestrian commercial space design usually possessed low space utilization, a lack of spatial vitality, a poor pedestrian experience, and other realities, which can easily lead to a huge waste of space resources and social resources. The root of the problem was that, on the one hand, architects in the design of pedestrian commercial spaces were often based on project needs and subjective experience, and design specifications and expert opinions were used as a reference to generate design solutions, which mainly reflected the subjective will of the investor and designer and were not sufficiently cognitive of the interaction between the spatial environment and the consumer’s behaviour. On the other hand, there was a lack of objective quantitative analysis means so as to carry out the targeted planning and evaluation of the design scheme in advance, optimize the existing problems, and reduce the construction risk [8]. The method of using scientific and effective methods and means to improve the comprehensive quality of pedestrian commercial spaces was essential to promote urban economic development and enhance the public leisure experience.
1.1. The Work Done by New Urbanists and the Application of Design Patterns
New urbanism is a new urban planning and design theory formed in the early 1990s in response to urban problems brought about by suburban sprawl. It is advocated to learn from the excellent traditions of small towns and town planning in the United States before World War II to create compact communities with an urban living atmosphere and replace the development model of suburban sprawl. New urbanism consists of two theories: Traditional Neighborhood Development (TND) and Transit Oriented Development (TOD).
The New Urbanism movement began in the 1980s. In 1993, Andres Duany, Peter Calthrope, and Peter Katz, along with other architects and journalists, created the so-called Congress of the New Urbanism, which institutionalized the movement for development on the basis of the 27 rules set out in the «Charter of the New Urbanism» [9]. Since then, it had spread from the United States to other countries. For example, as J. L. Grant [10] pointed out, it has had a considerable impact on urban planning and design in Canada, and P. M. Cozens [11] highlighted the impact of New Urbanism on policy development and government projects in Australia. Wu et al. [12] taking Tuen Mun New Town in Hong Kong, China, as an example, from the perspective of planning/design, analyzed the key elements of new district development from the perspective of new urbanism and provided new inspiration and reflection for the construction of new districts in mainland cities. Beyond this, many authors listed and described examples of design practices built according to the principles of new urbanism [13,14].
The Congress for the New Urbanism is the main body organizing the New Urbanism movement. Andres Dunay and Elizabeth Plater-Zyberk are the two main founders of the Congress for the New Urbanism. The movement promotes walkability, mixed-use neighborhoods, sustainable communities, and healthier living conditions. Key principles of the New Urbanism include:
- “Livable streets” arranged in compact pedestrian blocks;
- A range of housing options to serve people of all ages and income levels;
- Schools, shops, and other nearby destinations can be reached by foot, bike, or bus service;
- An affirming, humane public realm, where appropriately designed buildings define and enliven streets and other public spaces.
Walkability should be one of the main modes of transportation in sustainable cities, as it is more environmentally friendly, sociable, and healthy. The principles of the New Urbanism (NU) promote walkability and create urban patterns that support the needs of pedestrians. This means that there must be a series of interconnected road streets that alleviate traffic problems and provide pathways for citizens to get from one place to another. Research by Monika and Marek [15] had shown that pedestrian behaviour and the urban form can be optimized through a holistic approach. An important point in the study was the relationship between walkability and the environment, i.e., how to improve the visual attractiveness of the space and the accessibility of the space for pedestrians.
1.2. Commercial Space Transformation and Upgrading and Quality Improvement Demand
Unlike retail commercial facilities in the general sense, such as shopping centers, department stores, and supermarkets, commercial streets were both commercial facilities and public spaces [16]. The process of urbanization was further accelerated, the life quality of the public was gradually improved, and their needs for material and spiritual dimensions were becoming more and more diversified, and the commercial street had become a favorite place for consumers with its diversified retail format type and rich shopping space. According to incomplete statistics, the number of commercial streets in China had exceeded 5000, of which 22 were famous commercial streets and 32 were Chinese characteristic commercial streets, showing a growing trend [17]. After decades of rapid development and construction, the commercial street no longer focused on pure shopping and entertainment functions but had gradually become a comprehensive area integrating various functions, such as commerce, culture, entertainment, leisure, and services. Commercial streets were becoming an important carrier of urban life, displaying the city’s history and cultural traditions and promoting the city’s economic development.
China has proposed in the 14th Five-Year Plan [18] to comprehensively improve the quality of cities, accelerate the transformation of the mode of urban development, co-ordinate urban planning, construction and management, implement urban renewal actions, and promote the optimization of the spatial structure of cities and the upgrading of their quality. Outdoor pedestrian commercial space as an important urban public activity space, at the same time as it shouldered and stimulated domestic demand, drove consumption and met the public’s leisure needs of multiple tasks, focusing on the quality of outdoor pedestrian commercial space, improving the quality of the design, and the built environment has become an inevitable development trend. The development objective of outdoor pedestrian commercial space was to enhance the vitality and utilization of space, optimize the allocation of spatial resources, realize the refinement and humanized design of outdoor pedestrian commercial space, and achieve sustainable development in terms of “both quantity and quality”.
1.3. New Issues and a Shift in Research Perspective on Contemporary Commercial Space
The space layout of commercial streets was the core of block planning and design, and the reasonable space layout of various retail format types was the key means to make the block prosperous and develop [19,20]. However, the planning and design of commercial streets by planners and architects focused on the design perspective and ignored the essential economic benefits [21]. Forecasting the distribution of consumer flows on commercial streets relied on designers’ empirical mode and experts’ recommendations [22], whose limitations made it difficult to apply to the complexity of commercial spaces on a block scale and reduce their space vitality. The deep structure of the city was undergoing a major transformation and with it a large number of new issues about commercial space: Can commercial space morphology truly reflect pedestrian activity patterns? How do commercial spaces influence consumer behaviour patterns? What kind of commercial space layout is more space vitality?
Research from the perspective of a single physical space had become increasingly unable to cope with the requirements of new phenomena and trends in the development of urban spaces, and a more comprehensive, human-centered perspective was needed to interpret contemporary complex commercial space issues. Under the influence of humanistic thinking, the actual problems of people and society in the city had been paid more and more attention. The focus of urban commercial space research had gradually shifted from material, economic, and other physical elements to the exploration of the interrelationships between people and the environment, people and society, and people and space in commercial spaces, with an emphasis on analyzing the deep inner structure of the space from the perspective of people’s subjectivity.
Given this background, the aim of this paper is to quantitatively analyze the correlation between the visibility parameters of a commercial street retail space and shopping behavior and determine which factors play the greatest role in influencing the vitality of commercial street retail space, with a view to guiding the layout planning and spatial design of urban commercial street retail space.
2. Literature Review
The study of space and behaviour correlations originated with the concept of behavioural geography in 1960, which first introduced crowds into geography. Between the late 1960s and the early 1970s, the study of behaviour and space in the urban context emerged, focusing mostly on how people perceive and define their own activity space and environmental interaction space through their own visual perception in an objective natural environment. Horton [23] pointed out that, in the process of human’s perceptual experience of the objective spatial structure, its ontological factors played a dominant role, and the residence location of the individual was the most obvious influencing factor, and based on this, Horton summed up the conceptual model of the travel behaviour space. In 1980, research began to focus on the interaction between behaviour and the spatial environment. By studying children’s traffic modes, Appleyard and Lintell [24] suggested that traffic flow had an impact on children’s autonomous activities. William H. Whyte [25], through the analysis of the daily behaviour patterns of pedestrians, suggested that travel modes, composite transport use, and comfortable service facilities have an influence on the public space activities. Jan Gehl [24] found that there was a correlation between the environmental quality of public spaces and outdoor activities and that this relationship can influence the number of people using the space, the type, mode, and duration of the activity. At the end of the 20th century, the research went deeper into the relationship between daily life behaviour and the urban spatial environment, shifting from the traditional “spatial behaviour” to “behaviour in space”.
2.1. The Correlation Studies of Space and Behavior
In recent years, many researchers have been working on the relationship between space and behavior in different built environments [26,27,28,29,30,31,32,33,34,35,36,37,38,39,40,41,42,43,44,45,46], which are important for the spatial quality improvement and safety design of the built environment. Some of the representative literature was sorted out in this paper, as shown in Appendix A—Table A1. From the 21 papers reviewed, it can be seen that current research on behaviour in built environments focused mainly on emergency evacuation behaviour, traffic behaviour, leisure walking behaviour, and shopping behaviour.
Among them, seven papers were on the study of emergency evacuation behaviour in spaces such as subway stations, industrial and commercial buildings. For example, Mandal et al. [27] carried out a study of exit choice behaviour in a metro station using partial immersive virtual reality, the results of which showed that the choice of an emergency exit was not the same for all participants in different situations. Factors, such as distance, queuing time, fire, and smoke, can negatively affect the choice of exit. Soltanzadeh et al. [28] researched the relationship between the number of elevators and fire staircases in high-rise buildings and the number and location of evacuation areas in order to find the best time for emergency exits; the results demonstrated that a 40-story building with a refuge floor in the middle would allow for more people to be evacuated. Lovreglio and Kuligowski [32] conducted emergency evacuation experiments to investigate pre-evacuation behaviour and times of 497 students; the results showed that the time of an unplanned evacuation was longer than that of a pre-evacuation.
Six papers were on the study of traffic behaviour in spaces, such as signalized crosswalks and escalators. For instance, Bendak et al. [34] assessed behaviors of pedestrians at signalized crosswalks with 708 pedestrians’ behavior data; the results demonstrated that pedestrians who crossed at road intersections walked more slowly than those who crossed at mid-blocks. Schwebel et al. [37] assessed the feasibility of observational methodology in evaluating child pedestrian behavior and risks in a middle-income country with chaotic traffic patterns with empirical data, and the research results showed that adults were always present to help, but children seemed to follow adults’ advice about intersections only 70% of the time. Less than a third of the children looked at oncoming traffic before entering a lane, and more than a third entered a lane approaching a moving vehicle. Xie et al. [36] conducted a case study to extract the physical attributes of the escalator, the pedestrians’ microscopic movement characteristics, and the macro-level pedestrian flow dynamics on the escalator of Beihang University’s canteen using a cellular-automaton model, the results of which showed that the cellular automata model can effectively present the group formation and walking characteristics of pedestrians at the micro level and describe the flow of pedestrians at the macro level.
Six papers were on the study of leisure walking behaviour in urban public spaces, street spaces, waterfront spaces, etc. For example, Wei et al. [42] built statistical models to explain the spatial pattern of pedestrian trajectories with a waterfront case utilizing surveillance video data; the results demonstrated that up to 71% of the spatial distribution of pedestrian tracks can be explained by two environmental factors, namely the road median and obstacles. Askarizad and Safari [44] investigated the influence of social interactions on behavioral patterns of the people in urban spaces, the results of which showed that social interaction had a profound impact on the way people behave in urban spaces. Ki and Lee [43] examined the street Green View Index (GVI) and its associations with walking activities by different income groups using survey data on walking behaviors in 2350 residents in Seoul; the results demonstrated that low-income residents generally live in communities with low green view index, but walking time is more sensitive to green view index.
While only two articles in the literature were studies of shopping behaviour in night markets and the retail district, Hahm et al. [45] identified built environmental components of retail districts that affect pedestrian behaviors and influence their shopping behavior. The results showed that pedestrians preferred streets that are safe from vehicles and that are well-designed; high level, central, and provide rest places or other street furniture; and all these variables also increase the visiting time of pedestrians and induce spending in shops on the street. Chiou and Bayer [46] improved the pedestrian movement model in night markets with the incorporation of the “destination attractiveness” factor, the results showed that the parameter values of the model were calibrated, the simulation results were verified with the real observation data, and the results agreed well.
The finding means that the shopping behavior in commercial spaces has not been sufficiently studied in previous research. However, a study of pedestrian shopping behaviour in commercial streets considering space vitality enhancement would improve space quality and promote a high quality development of the built environment. Therefore, there is an urgent need to study the relationship between space and behavior in the retail pace of commercial streets.
2.2. The Applied Studies of Space Syntax
The concept of space syntax was formally introduced by Bill Hillier and Hansen of University College London, UK, in their book The Social Logic of Space [47]. Simply put, space syntax was a theory and methodology for studying the relationship between spatial organization and human society by quantitatively describing the spatial structure of human habitats, including buildings, settlements, cities, and even landscapes [48]. The core idea of space syntax was spatial configuration, which Hillier defined as “a system of mutually independent relations, each of which determined all the others” [49].
Hillier and Hanson [47] developed space syntax as a theory to replace the principles of shape syntax as an organizer of spatial systems in a more systematic and mathematical way. Space syntax consists of measurement systems and various graphical models that can represent spatial configurations at any scale (cities, regions, buildings, and individual spaces) [49]. Space syntax had three basic maps to represent spatial structure based on scale and function. These maps were axial, convex, and isovist maps [50]. Axial maps have been used to study macro-scale urban space and meso-scale buildings and layout [51,52]. Convex maps have been used to study meso-scale buildings and block-scale spaces [51,53]. Isovist maps were used to study meso-scale and micro-scale spaces, such as complexly shaped architectural rooms with furniture [54,55]. There are some additional maps; they are visibility graph analyses (VGA) [56] and agent-based maps [57]. Isovist maps showed only the visual quality of certain spaces and certain locations while VGA shows the visual quality of the entire space in the system. The agent-based map is a simulation of people’s movement inside the system [58].
The basic morphological elements of space syntax analysis are the axial line and the convex space: the former corresponds to people seeing, walking, or driving, which may be simplified as a line of sight or a route, and the latter corresponds to people looking at each other, perceiving together, appearing together, gathering or talking, etc. From the mathematical definition, the line of sight between any two people in a convex space will not be interrupted by the boundary of the space [47]. In this sense, activities of social significance, such as walking and gathering, were spatialized through the axial line and convex spaces. This was considered to be a process of the integration of space and behavior, that is, the spatial form reflected environmental behavior while environmental behavior reflected the spatial form so that the spatial structure became the embodiment of environmental behavior, making the spatial analysis itself have the significance of social behavior [59]. Yang et al. [60] took Wulin Square in Hangzhou as an example to verify the application of syntactic analysis methods, such as axis model, visibility graph analysis, and agent model in commercial space. The research results showed that space syntax analysis methods can be used to compare and evaluate the commercial value potential of different commercial building schemes. It also showed that subtle spatial layout adjustments may bring about significantly different business behavior patterns, which need to be clearly displayed through an accurate spatial analysis.
In recent years, many researchers have been working on the applied studies about different maps of space syntax [61,62,63,64,65,66,67,68,69,70,71,72,73,74,75,76]. Some of the representative literature was sorted out in this paper, as shown in Appendix A—Table A2.
As can be seen from the 16 papers reviewed, 11 papers used an axial analysis to carry out the application studies of street networks, commercial streets, and residential blocks. For example, Hou and& Zheng [62] took the typical traditional commercial streets that are being built in Guangzhou as prototypes and simulated them with Depthmap and SPSS; the results demonstrated that under the condition of a balanced distribution of the entrance and traffic, the combination of integration degree and tenant can predict the distribution of passenger flow more effectively. Organization concise and reticular relative spaces help to achieve a balanced distribution of people. Yunitsyna and Shtepani [64] focused on the exploration of spatial parameters of the new neighborhoods in Tirana and found the factors affecting and the activities’ distribution; the results show a correlation between the type and location of the activity and the spatial and visual integration. Tannous et al. [72] analyzed the location and size of public parks, promenades, and other green spaces in Doha in terms of their accessibility; the results demonstrated that the physical and spatial characteristics of open green Spaces above a certain size in Doha have spatial and social logic.
Seven papers used a visibility graph analysis (VGA) to carry out the application studies of residential blocks, green spaces, and open spaces in universities. For instance, Yıldırım and Celik [69] examined the development and implementation of the mixed methodology to understand the relationship between pedestrian behavior and space in Besiktas Koyici settlement, Istanbul; the results demonstrated that pedestrian areas had a significant impact on pedestrian behavior by affecting the vitality and attractiveness of pedestrians, and Cullen’s theory can be used to analyze the pedestrian behavior and perception of the city. Bayoumi et al. [74] understood the factors affecting the spatial and social dimensions of the university open space, focusing on the social logic of space theory for understanding accessibility and the occupancy movement pattern through using VGA and agent simulation; the results showed that not all of Tanta University’s university open spaces were now being successfully used as major social spaces.
Five papers used agent-based modelling to carry out the application studies of urban underground spaces, city center districts, and traditional and modern houses. For example, Omer and Kaplan [65] presented an agent-based (AB) pedestrian volume model at the urban scale within the space syntax framework, the results of which showed that when the correspondence between street network structures, land use, and pedestrian movement were relatively low and the consistency was poor, the proposed AB model was better than the MRA model in predicting pedestrian movement. Alitajer and Alitajer [76] analyzed behavioral patterns in the spatial configurations of traditional and modern houses in Hamedan; the results demonstrated that the spatial configuration of houses had changed over time. However, in terms of spatial configuration indicators, the significant difference between traditional and modern houses in Hamidan was the integration and equivalence of all spaces in the house.
In the past few years, scholars have studied the application studies of visibility graph analyses, and these findings are very effective, but they still need to be further refined. Battistin [61] used space syntax to assess varied scenarios for incomplete urban layouts in cities, and the findings suggested that studies of cities benefit particularly from the use of an axial and segment analysis. Yunitsyna and Shtepani [64] studied the socio-space relations of the built environment using space syntax in Tirana City; the findings demonstrated a correlation between the type and location of activities and space and visual integration. Using spatial syntax theory, Mahmoud and Omar [68] investigated the impact of planting configurations on visual fields of urban parks, and the study demonstrated that space syntax techniques can be valuable in the evaluation of planting scheme designs, particularly at pedestrian movement level. Bayoumi et al. [74] adopted urban analysis, observational studies, and space syntax to examine the potential for pedestrian distribution levels in university open spaces; the results showed that open space and outdoor activities were essential, such as social interaction, wellness, pedestrian movement, and organizing outdoor lectures.
The method of visibility graph analysis based on space syntax provides a quantitative description of spatial visibility through graphical analysis. It integrates a number of disciplines centred on spatial behaviour and cognition, quantitative principles based on mathematical graph theory, and a series of results from computer visualization studies [77]. Li and Tang [78] used space syntax visibility analysis method to study the correlation between spatial visibility parameters and shopping behavior in Changsha shopping centers. The research results showed that the visibility of retail space affected the commercial value of stores. Min et al. [79] used space syntax to carry out visibility graph analysis of the single layer of large-scale commercial complex. By measuring the correlation between the visual integration, the space connectivity, the visual step depth-entrance, and the customer visit frequency and considering the spatial fabric and spatial planning, the influence of the formats’ combination on the customer behavior was studied. Fong [80] adopted space syntax to make a visibility graph analysis of seven spatial forms of shopping malls; measured the correlation between business attractiveness (number of stores, window length, and store area), spatial fabric (visual step depth-entrance), and customer visit frequency, respectively; and drew a conclusion that spatial fabric factors have a greater impact on customer behavior.
In summary, the research on the analysis and optimal design of the built environment based on a visibility graph analysis could improve the spatial quality of spaces, such as residential blocks, green spaces, university open spaces, etc., and provide practice for the concept of human-centered spaces. However, the research on the correlation of commercial space-shopping behaviour based on a visibility graph analysis is still at an early stage, and it is necessary to start the analysis of the correlation of retail space-shopping behaviour in the commercial streets of China.
2.3. The Collection and Processing of User Data
There are some methods to analyze pedestrian behavior in the built environment, such as a Global Positioning System (GPS), Global System for Mobile Communication (GSM), WLAN network, Bluetooth analysis, Radio Frequency Identification (RFID), eye-tracking device, direct observation, and video recording [81]. Wheeler et al. [82], adopting the use of a GPS, quantified the volume and intensity of physical activity of 1307 children aged 10–11-years-old in green spaces and other places after school in Bristol, England. The results demonstrated that most of the outdoor activities of children do not take place in green spaces. Liu et al. [83] used phone signaling data to obtain pedestrian visit behavior data of 152 parks in Chengdu, China, and studied the factors affecting the flow and duration of park visits. The results showed that environmental factors have a great influence on park visit behavior at weekends and peak hours. Wan et al. [84] used Wi-Fi probe positioning technology to obtain the pedestrian behavior trajectory of a commercial complex, and then, they adopted virtual reality to identify problems and optimize building spatial layouts. The findings showed that by optimizing the layout of circulation spaces at an early stage, the resulting design options were more attractive to stakeholders and better supported the usability of the built environment. Yoshimura et al. [85] adopted Bluetooth data to analyze the characteristics of visitor behavior in the Louvre Museum and the relationship between the spatial layout and visitor behavior. The results showed that there was no difference in visit patterns between short-stay and long-stay visitors. Choi et al. [86] proposed a new method for location awareness of moving targets using deployed passive UHF radio frequencies. The results showed that an empirical study was carried out using RFID system and mobile robot; the average estimation error of the mobile robot tracking system was 15.34 cm. Tang et al. [87] adopted the collaborative monitoring method based on eye movement and electroencephalography (EEG) to study pedestrian avoidance behavior in a real environment, taking the underground public space of a Wuhan commercial complex as the experimental site. The finding found that avoidance behavior was not merely avoidant of the current conflict situation, but a reaction to the behavioral tendencies of the surrounding environment and the people around it. Askarizad and Safari [44] studied the behavior pattern in the pedestrian area of the municipality square by direct observation, and the research results showed that node spaces, such as fountains, could promote human interaction in these spaces.
In addition, many scholars have used relevant methods to study the characteristics of pedestrian behavior [88,89]. There are many methods to identify pedestrian behavior characteristics in a built space, but each method has its applicability. Please see the discussion for a comparative analysis of each method. A video recording method was widely used in micro-scale pedestrian behavior analysis because it can provide detailed, objective, and reproducible data. Liu et al. [90] adopted video recording and manual observation methods to obtain the leisure behavior characteristics of a Shanghai waterfront space and then studied the comprehensive impact of public open space and microclimate on behavioral activities. The findings suggested that the neural network model could better predict the spatial integration of microclimate requirements for different activities. Sheng et al. [91] used a video recording method to obtain the pedestrian flow of a commercial complex in Beijing and then applied a space syntax isovist model and spatial design network analysis model to analyze the impact of epidemic control on the pedestrian flow, and the relationship between the distribution of people flow and the spatial structure, the distance of traffic nodes, the width of walking space, and other factors. The results showed that the relationship between the distance of traffic nodes, the width of walking spaces, and the distribution of people flow was relatively weak and unstable. Lian [92] adopted video recording method to obtain pedestrian leisure behavior characteristics of commercial plazas and then verified the validity of the intelligent agent shopping behavior model based on visual attention theory.
It has been found that there is a correlation between space and pedestrian behaviour in the built environment. However, the correlation between shopping behaviour and space in commercial streets has not been investigated in detail, especially based on an empirical research approach. In addition, existing studies showed that there are few studies on the quantitative analysis of consumer behavior in commercial spaces by coupling a visibility graphical analysis of a commercial space with spatial characteristics. Such knowledge will play a vital role in optimal design approaches in the future for the commercial street space layout and shop window design. Immediate improvements in understanding the influence of retail shop space layouts and window design parameters for commercial streets on space vitality are required. In particular, there are very limited studies considering the combination of design parameters, such as the space coefficient of shop windows, depth coefficient of shop windows, and retail format types, while taking an accurate assessment of space vitality into account, and few studies have been conducted in the urban environment of China.
2.4. Research Issues
In this context, this study aims to assess the space vitality of retail shops in commercial streets based on the space syntax method, and to quantify the influence of retail shop space layouts and window design parameters for commercial streets on space vitality, with a focus on the following three issues:
- Are there differences in the visibility characteristics of the retail shop spaces of the commercial streets, and if so, to what extent?
- Are there differences in shop visits across retail spaces in the commercial street, and if so, to what extent?
- How to couple retail space graph visibility analysis and spatial characteristics and then propose a space vitality prediction model for retail stores in commercial streets?
3. Methodology
The framework of this study is shown in Figure 1. First, the methods for acquiring data on spatial characteristics and pedestrian behaviour were developed in commercial streets. Second, the visibility graph analysis process was built for Zhuangli street in Letai center, Shijiazhuang, based on space syntax theory. Third, correlation analysis and multiple linear regression analysis were used to assess the influence of space coefficient of shop windows, depth coefficient of shop windows, and space connectivity on space vitality.

Figure 1.
Workflow of holistic approach.
3.1. Selection of Cases
3.1.1. The Concept of Commercial Street
Commercial streets carry daily outdoor shopping, communication, and other activities of urban residents. They are composed of catering, shopping, leisure, and entertainment and play an irreplaceable role in urban public space [93]. Compared with other commercial spaces, such as shopping centers, commercial plazas, and supermarkets, commercial streets are narrow and long and provide suitable pedestrian external space by arranging street furniture, planting landscape plants, and setting up a variety of street facilities. According to the type, commercial streets can be divided into traditional commercial streets [94,95,96] and commercial complex inner streets [91,97,98]. The traditional commercial block is generally located in the core area of the city. As the most intuitive place with complete commercial structure and rapid economic development, it occupies a very key position in modern urban architecture [93]. However, with the rapid growth of national economy, some traditional commercial blocks in domestic cities gradually decline in the process of urbanization because they no longer meet the development needs of the times and even affect the iterative renewal of urban core areas [99]. Since the 1950s, there have been many calls for commercial streets to be transformed into so-called shopping centers, i.e., specific areas in the city center with shade from trees and pavements dedicated to commerce [94]. The inner street of the commercial complex is a traffic space integrating and connecting the functions of the commercial complex. It is generally a walking system, and its types mainly include outdoor walking commercial street, indoor walking commercial street, and compound walking street. Outdoor pedestrian streets are the more common form of integrated internal streets, most of which have been adapted and developed from traditional commercial areas in urban center. Indoor commercial walkways can make use of roof cover to avoid climatic factors compared to outdoor commercial walkways. The complex commercial pedestrian street is applied to the commercial complex with large coverage and complex functions. Nicolai Street in Minneapolis, Minnesota, USA, is one of the earliest examples of such commercial pedestrian street design.
3.1.2. The Survey and Selection of Cases
- (1)
- The survey programme
Taking Shijiazhuang City as an example, in order to better study the characteristics of pedestrian leisure shopping behavior in commercial streets, this paper used CNKI database to search the relevant literature with the theme of “Research on commercial streets in Shijiazhuang” and combined the Internet query results to conduct statistics on commercial streets. Through field visited to the status of commercial streets, 12 commercial streets in Shijiazhuang were obtained (Table 1). Based on the type and scale of commercial streets, 12 commercial streets were screened, 6 commercial pedestrian streets were obtained, and the current situation of each commercial street was investigated. Based on the selection principle, the research object was finally determined as Zhuangli street, Lertai Center. The spatial elements and the characteristics of pedestrian leisure shopping behavior in Zhuangli street of Lerthai Center were investigated and studied to obtain pedestrian track and interaction information characteristics between pedestrians and environment.

Table 1.
The general situation of 12 commercial streets.
- (2)
- The selecting principle
Taking the widely used pedestrian commercial street as an example, this paper selected a typical commercial complex inner street as the research area for analysis according to the following principles, namely Zhuangli street in Lertai Center.
Principle 1: The research object chosen for this paper was the inner street of a commercial complex, which was a test of the applicability of space syntax. This is because scholars using space syntax to analyse the correlation between spatial features and pedestrian behaviour in commercial streets have focused on traditional commercial streets [100,101] and commercial complexes [102,103].
Principle 2: Although the retail format types in the inner street of the commercial complex was not as rich as that of the traditional commercial streets and the volume of space was not as large as that of the traditional commercial streets, it had a complete set of physical spatial elements, which corresponded to the space connectivity, visual integration, visual step depth-entrance, and other indexes that the space syntax was concerned with.
Principle 3: For the acquisition of data on spatial and behavioral elements, the relevant data acquired on the inner streets of commercial complexes were more complete [104]. These data were used to analyse the correlation between spatial and behavioral elements of commercial streets with higher validity.
3.2. Acquisition Method of Spatial Characteristics and Pedestrian Behaviour Data of Commercial Streets
3.2.1. Extracting Spatial Characteristics of Commercial Streets
The selection criteria of the research objects were “single-layer non-motor vehicle pure walking”, “relatively simple and relatively complex”, and “feasibility of pedestrian data acquisition”. Field survey was used to obtain data on the spatial characteristics of each retail shop on Zhuangli street in the Letai Center, such as retail format types, shop area, length and height of shop windows, length and height of shop signboards, and shop vignettes. This section mainly analyzed the length of the shop window and the retail format types of each shop in Zhuangli street; divided it into two sections, north and south, according to the morphology and plan shape of the commercial street; combined it with the availability of data on pedestrian behaviour; and ultimately focused the research on the northern section of Zhuangli street. The main retail format on the northern section of Zhuangli street were restaurants and snack bars, with ancillary retail format, such as beverage shops and shopping center, for a total of 14 retail shops, as shown in (Figure 2 and Figure 3).

Figure 2.
Location map of Zhuangli street [79].
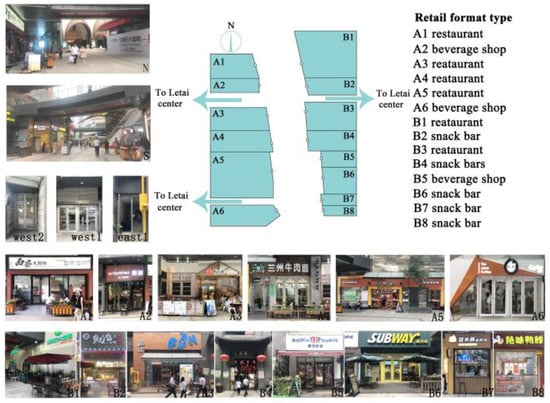
Figure 3.
Current situation of shop facade in the north section of Zhuangli street.
3.2.2. Acquisition Method of Pedestrian Behaviour Data
In this study, video recording and path following methods were used to obtain shopping behavior characteristics of pedestrians in commercial streets, which were characterized by high precision, detailed, objective, and reproducibility and have been used by many scholars [90,91,92] to study the feasibility of micro-scale pedestrian behavior.
The shopping behaviour of pedestrians in the northern section of Zhuangli street was recorded with video filming equipment (Figure 4 and Figure 5), and the behaviour characteristics of pedestrians in the snack bars and beverage shops in the northern alley were obtained with pedestrian tracking. In order to ensure the timeliness of the survey data, considering the number of shop visits of retail shop format types in the commercial street, the research period was set as 17:00–19:00, and the video data were filmed by four investigators in July and August 2019, each of which chose two weekdays and weekends with clear weather. First, the layout of the study object was mapped according to the current situation, and the shooting points of the digital equipment were determined based on the trial observation means. Second, digital video filming of the study area was used to assist in recording the trajectory characteristics of pedestrian shopping behaviour using sketching and photographs. Finally, through the video data and sketching, the pedestrian behaviour trajectory was drawn, and different colored lines were selected to annotate the characteristics of the pedestrian behaviour trajectory [75]. Pedestrian behaviour trajectories in the northern section of Zhuangli Street were divided into four categories: entering the mall from the north and south entrances, visiting shops, walking through the street, and entering the storage space; pedestrian behaviour characteristics in the northern alleyway were divided into two categories: visiting shops and walking through the alleyway area. Interviews with shopkeepers and a random sample of pedestrians in the study area were conducted to understand the characteristics of shop size and pedestrian distribution in the study area.

Figure 4.
Camera location map.
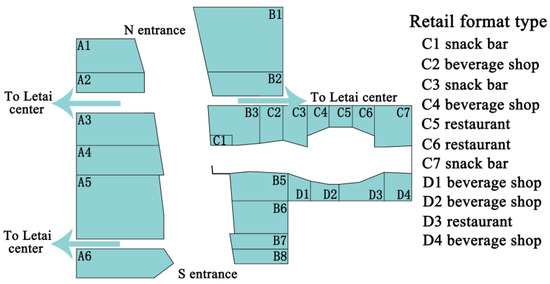
Figure 5.
Schematic diagram of north alleyg.
3.2.3. Trajectory Analysis of Pedestrian Behaviour of Zhuangli Street
The attractiveness of retail shops in commercial streets was closely related to pedestrian behaviour and street activity. The following characteristics of pedestrian behaviour were identified through fixed-point observations and digital image data analysis:
- (1)
- When pedestrians walked in the built environment of commercial streets, pedestrian attention was mainly focused on the surrounding environment visual stimuli and block environmental factors through the visual stimuli of pedestrians, which in turn affected the behaviour of pedestrians (Figure 6a).
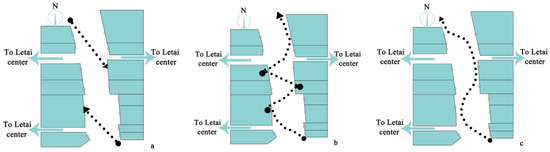 Figure 6. The pattern of pedestrian behavior: ((a) No clear destination; (b) Multiple scattered destinations; (c) Single clear destination).
 - (2)
- Pedestrians changed their direction of travel as a result of visual stimuli or communication with other pedestrians, and pedestrians’ choice of destination determined their direction of travel. Communication between pedestrians affected pedestrian behaviour (Figure 6b).
- (3)
- If pedestrians perceived that there were no visual attention activities or attention-grabbing shops and vignettes on the commercial street, pedestrians would maintain their current behaviour and continue to walk in search of attention-grabbing vignettes or shops (Figure 6c).
When commercial streets were equipped with facilities, such as featured landscape, promotional billboard, or sitting-out table and chair, they would attract the visual attention of pedestrians, who would stop and stay to watch, pay attention to, or rest at, thus slowing down the walking speed of pedestrians.
3.3. Visibility Graph Analysis of Space Syntax
3.3.1. Space Syntax
Visibility graph analysis (VGA) was a global spatial analysis method based on the space syntax theory, which was the superposition of visual information at the local level. It combined the results of previous research in related disciplines, integrated a series of results, including gestalt visual perception principles, cognitive map method, quantitative principles based on mathematical graph theory, computer visualization research, etc., in order to find a descriptive language between the abstraction and the real intuition for the analysis of current material spatial visibility and its application [77].
Visibility graph analysis was performed by setting up a certain density of spatial grids in the space syntactic analysis software Depthmap, where each grid was considered as a viewpoint, and calculating the visual variables for each point, with a set of syntactic parameters for the visual field analysis existing behind each grid point. The method of using cool to warm colour representations based on their visual variable data from small to large could visualize changes in visual perception at different locations in space.
When performing space syntactic visibility graph analysis, the visual depth was not a line-of-sight visibility distance but a line-of-sight topological relationship, where two viewpoints were one step apart if they can be visible to each other. If a can see b from a straight street, as shown in the figure below, this was said to be a situation where “a and b have a visual depth of 1” while c cannot see d directly and had to reach point e first, which was called “c was 2 line-of-sight visual depths away from d” (Figure 7).
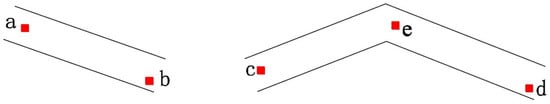
Figure 7.
The definition of visual depth.
In order to measure line-of-sight relationships, a grid of squares was required for planar spaces. This was shown in Figure 8. For the space f, there were two elements directly connected to it, hence the connection value (f) = 2; since it could see all other elements, the line-of-sight connection value (f) = 8. The mesh was subdivided to generate ideas about visual depth calculations and to establish a topological approach.

Figure 8.
Replace simple plans with infinitely subdivided grids.
3.3.2. The Analysis Process of Retail Space Visibility
Based on the space syntax theory, this paper took Zhuangli Street of Letai Center, Shijiazhuang, as the research object and focused on the northern section of Zhuangli Street to carry out the visibility graph analysis of retail space of commercial street. The method simulated the mechanisms of pedestrian behaviour in space and investigated the specific behaviour trajectory and communication styles when a pedestrian was in a particular space. The principle of this method was to first set up a viewpoint matrix in space, generated a view field for each viewpoint, and then measured the view field characteristics of each viewpoint and its visibility relationship with other viewpoints, finally indicating the different metrics and relationships by assigning different colour to the viewpoints [105]. The grid matrix chosen for this paper was 0.6 m × 0.6 m, and all the viewpoints were obtained with the help of a computational tool, which in turn developed a quantitative analysis of the view field. The retail space visibility graph analysis was mainly carried out from the three dimensions of space connectivity, visual integration, and visual step depth -entrance. The line-of-sight analysis of Zhuangli street (Figure 9) was carried out by Depthmap, space syntax analysis software, to obtain the index values of space connectivity, visual integration and visual step depth-entrance. The steps were as follows:

Figure 9.
Schematic diagram of the Zhuangli street.
Step 1: The outer contour of the buildings in the study area—Zhuangli Street—and the outer contour of the one-story buildings on both sides of the street were processed into closed multi-segment, and the processed images were imported into the analysis domain of the Depthmap Beta 1.0 software.
Step 2: The grid matrix of the analysis area was set to 0.6 m × 0.6 m, and the “Fill” command was used to fill the analysis area, identify the factors involved in the calculation, and then obtain the analysis boundary.
Step 3: Through “Tools→Visibility→Make Visibility Graph”, the visibility graph of selected space was analyzed, and the space connectivity index value and chromaticity graph were obtained.
Step 4: Through “Tools→Visibility→Run Visibility Graph Analysis”, the visibility graph of selected space was analyzed by line-of-sight, and the visual integration index value and chromaticity graph were obtained.
Step 5: Through “Tools→Visibility→Step Depth→Visibility Step”, the selected space was analyzed in terms of line-of-sight, and the values of visual step depth-entrance indicators and chromaticity maps were obtained.
3.4. Correlation Analysis and Multi Linear Regression Analysis
Correlation and regression analyses are both data analysis methods that analyse the correlation between objective things. Wei et al. [42] adopted geographically weighted regression models to explain the spatial pattern of pedestrian trajectories with a waterfront case. Li and Tang [78] used correlation and multiple regression analysis to investigate the association between retail space and shopping behaviour in multi-story shopping center. Clarifying how objective things are related to each other is extremely important to understanding correlation and regression analyses. Functional relationships could reflect the one-to-one correspondence between objective things, i.e., when the variable changes, only one unique can be obtained based on the function. The absolute value of the correlation coefficient, r, reflects the degree of correlation between the variables, taking a value between −1 and 1. The closer the absolute value is to 1, the stronger the correlation between the two variables. The expression r > 0 indicates that the two variables are positively correlated, and r < 0 indicates that the two variables are negatively correlated. Pearson’s correlation coefficient is used to measure the linear correlation between two numerical variables [106,107,108,109]. It is defined mathematically as follows:
where n is the number of samples, and and are the variable values of the two variables, respectively, while and are the average values of the two variables.
Regression analysis is used to analyse the statistical relationship between things, focusing on the examination of the change rule of variables, and through the form of regression equations to describe and reflect this relationship, which can help people to accurately grasp the extent to which the variables are affected by one or more other variables and thus provide a scientific basis for prediction.
A multiple linear regression model is a linear regression model with multiple explanatory variables that is used to reveal the linear relationship between the explained variable and multiple other explanatory variables [106,107,108,109]. The mathematical model of multiple linear regression is as follows:
where is the constant term, is the regression coefficient, and is the random error. The multiple linear regression equation consists of two parts; one is the linear variation part caused by the explanatory variables, and the other is the linear variation part caused by the random variables.
4. Results
This section may be divided by subheadings. It should provide a concise and precise description of the experimental results, their interpretation, and the experimental conclusions that can be drawn.
4.1. Visibility Graph Analysis of Retail Space
4.1.1. Space Connectivity
Space connectivity refers to the number of nodes in the system that are directly connected to a particular node. The higher the value of a particular space connection, the more closely this space is connected to the surrounding space, the stronger the influence on the surrounding space and the better the spatial permeability. In this paper, the space syntax software Depthmap Beta 1.0 was used for line-of-sight analysis (Make Visibility Graph) to obtain the results of the spatial connectivity analysis (Figure 10) and read the space connectivity value of each shop entrance (Figure 11). The warmer the colour of a commercial street space, the higher its space connectivity value while the cooler the colour of the space, the lower its space connectivity value. Colors ranging from warm to cold indicated space connectivity values ranging from high to low, with the space connectivity at the intersection of two streets being higher than the rest of the street, and the overall connectivity value of the alley connected to the street being lower than that of the street space.

Figure 10.
Visibility of space connectivity.
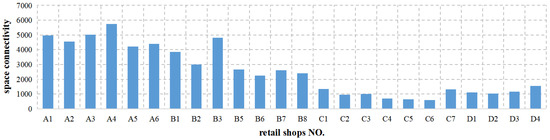
Figure 11.
Space connectivity of retail shops.
4.1.2. Visual Integration
Space syntax line-of-sight analysis required a high refinement degree of spatial morphology, and each closed polyline was judged to be an impassable obstacle to the line-of-sight [110]. Therefore, this paper analyzed the outer contours of the buildings and the one-story buildings on both sides of the Zhuangli street and ensured that the outer contour lines were closed.
This study combined Baidu map and field measurement data to draw the plan of Zhuangli street, divided it into closed polygonal lines according to the demand, and manually traced out the boundaries of the shops and the street boundaries of Zhuangli street so as to finally obtain a relatively simple function and closed polygonal lines. In the next step, the processed plan was imported into Depthmap software to set up the grid with the shop outline and the street boundary as the outer outline, the internal elements were not involved in the operation, and all the remaining external elements were used as the object of visual integration analysis for calculation; the results of the analysis were shown in Figure 12, the value of visual integration of each shop in the northern section of Zhuangli street was read out in the analysis map (Figure 13).
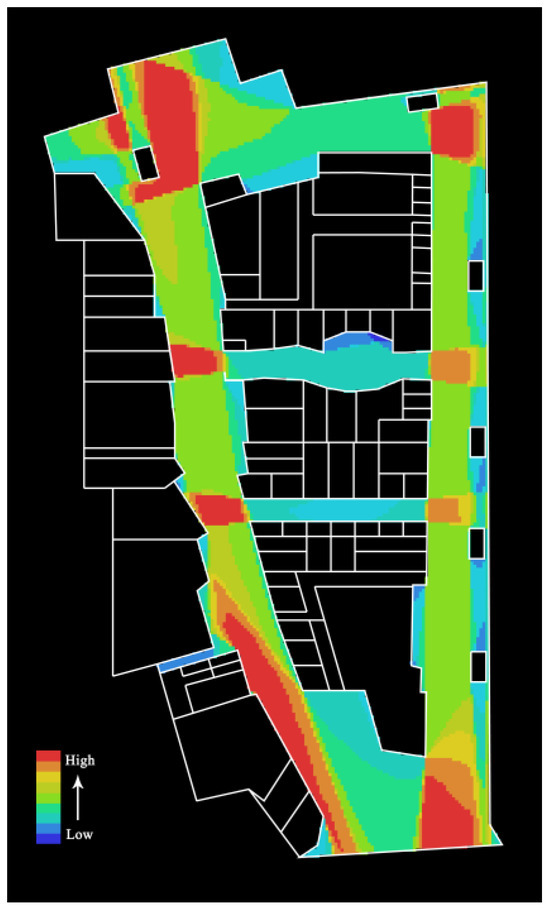
Figure 12.
Visibility of visual integration.
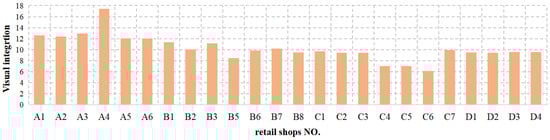
Figure 13.
Visual integration of retail shops.
Visual integration indicated line-of-sight visibility, with higher visual integration indicating that the line of sight was more likely to converge and be noticed by pedestrians. Generally speaking, the easier it was for consumers to see a place, the more potential it had to become a lively place and the higher the space vitality of the place. Warm colour in the space indicated high visual integration while cool colour indicated low visual integration. From the results of the analysis, it can be seen that the visual integration of the open space and street intersection space was higher while the visual integration of the sheltered space was lower.
4.1.3. Visual Step Depth-Entrance
The visual depth value is the line-of-sight topological distance, i.e., it is the number of topological steps from one convex space to another. The specific operation steps were as follows: when a region was selected, the region was highlighted in yellow, the rest of the space for the selected target region for the line of line-of-sight topological depth calculation; compared to the target region, the blue region was the minimum visual depth; the green region was the smaller visual depth; and the red region was the maximum visual depth. The visual step depth-entrance was the number of visual topological steps required for a space to make a visual connection with the entrance area. The smaller the visual depth of the space from the entrance indicated that the space is more visible to pedestrians as they enter the entrance.
In this study, when calculating the visual step depth-entrances of Zhuangli street, the three entrances in the north, south, and east were selected as the selected areas, and the visual step depth-entrances were calculated for the other areas; the results of the visibility diagram were shown in Figure 14, which showed the visual step depth-entrance values for each shop in the northern section of Zhuangli street (Figure 15). The results showed that the barrier obscured the line-of-sight and that the barrier was followed by an increase in visual topological depth. The area with shallow visual depth referred to the area where the line-of-sight was wide when the pedestrian stand at the entrance of the block, and the visual topological depth was bound to increase once it was turned.
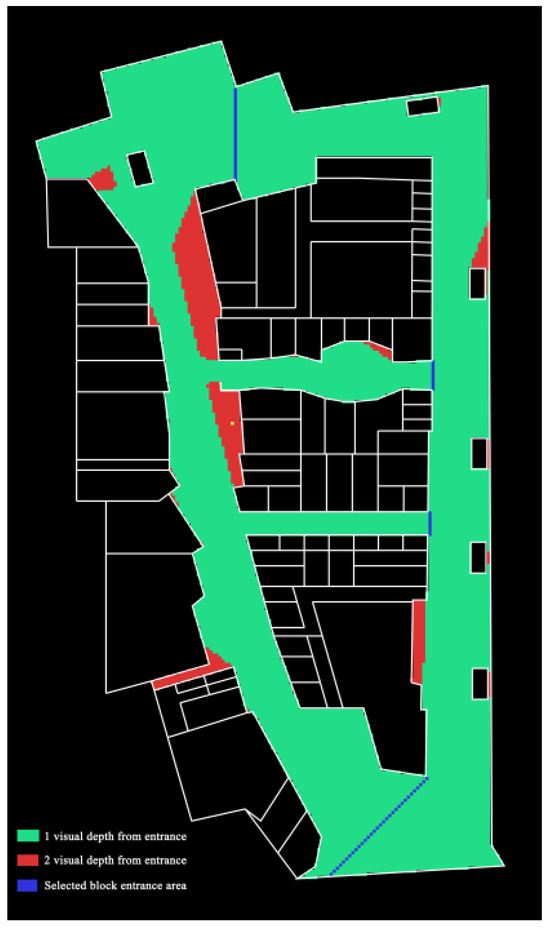
Figure 14.
Visibility of visual step depth-entrance.
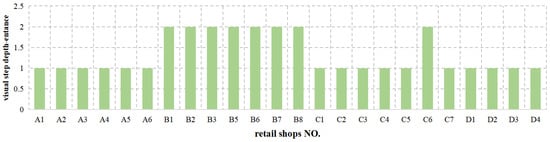
Figure 15.
Visual step depth-entrance of retail shops.
4.2. Store Visits of Retail Space
In this study, the shop visits were selected as an indicator to measure the space vitality of each retail shop in the commercial street. Video data were obtained by filming pedestrian behaviour on the commercial street using digital equipment. Through repeated viewing and recording of the video data, each of the shop visits in the northern section of Zhuangli street was obtained. Because the north alley was an indoor commercial street, it was difficult to obtain pedestrian data by filming with digital equipment, so the path-following method was used to obtain each shop visit, and two investigators were arranged to track the pedestrians entering the street at the same time as the video filming so as to obtain each shop visit on weekdays and weekends. The shop visits used in this paper to measure shop space vitality were the result of a weighted average of weekday and weekend shop visits (Figure 16). The survey results of shop visits for the 24 retail spaces showed that the retail shop space with the highest shop visits was 149 and the retail shop space with the lowest shop visits was 11. The retail space with the highest shop visits had 138 more shop visits than the retail space with the lowest shop visits; the combined influence of retail space visibility graph analysis and spatial characteristics on space vitality was 92.62%.
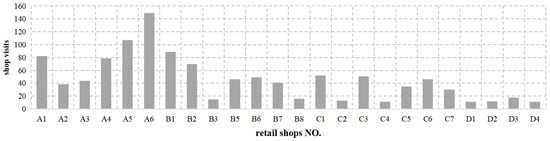
Figure 16.
Shop visits for 24 retail shops.
4.3. The Relationship between Space Vitality and Retail Space of Commercial Street
4.3.1. Identify Variable Indicators
- (1)
- Space coefficient of shop window
Previous studies usually considered shop window length as the key factor affecting visual attraction and ignored the differences in the effects of shop window length on visual attraction under different spatial characteristics [78]. The space coefficient of a shop window (L × I) combined the window length and spatial characteristics to form a combined variable, i.e., the product of the window length and visual integration, with L referring to the window length and I referring to the visual integration of the retail shop. The meaning of this coefficient was to correct the window length using the visual integration, which was a characteristic parameter of the visual attractiveness strength of different shop windows under different spatial characteristics of the commercial street space, reflecting the synergistic influence of the visual attractiveness and spatial characteristics on the number of block consumers stopping or visiting. In principle, the larger the space coefficient of shop window, the more it can attract more consumers to stop and visit, the higher the shop space vitality is, and the better the shop space layout is.
Calculations based on window length and visual integration values were performed to obtain space coefficients of shop windows for each shop in the northern section of Zhuangli street (Table 2).
Table 2.
Space coefficient of shop windows for 24 retail spaces.
- (2)
- Depth coefficient of shop window
Previous studies usually considered shop window length as the key factor affecting visual attraction and ignored the differences in the effects of shop window length on visual attraction under different spatial characteristics [78]. The depth coefficient of a shop window (L/D) combined the window length and spatial characteristics to form a combined variable, i.e., the ratio of window length to visual step depth-entrance, with L referring to the window length and D referring to the visual step depth-entrance of the retail shop. The meaning of this coefficient was to correct the window length using the visual step depth-entrance, which was a characteristic parameter of the visual attractiveness strength of different shop windows under different spatial characteristics of the commercial street space, reflecting the synergistic influence of the window length and visual step depth-entrance on the number of block consumers stopping or visiting. In principle, the larger the depth coefficient of shop window, the more it can attract more consumers to stop and visit, the higher the shop space vitality is, and the better the shop space layout is.
Calculations based on window length and visual step depth-entrance values were performed to obtain depth coefficients of the shop window for each shop in the northern section of Zhuangli street (Table 3).
Table 3.
Depth coefficient of shop windows for 24 retail spaces.
4.3.2. Dummy Variables
Dummy variables are used to reflect qualitatively artificial variables, which are quantitatively qualitative and usually take the value of 0 or 1. The introduction of dummy variables allows for a more concise description of the problem and is closer to reality. When the independent variable is a categorical variable, it needs to be transformed from a categorical variable to a dummy variable, and all dummy variables are dichotomous variables with values of “1” and “0”; variables with values of “0” are reference terms.
When constructing the regression equation, the retail format type is a qualitative and categorical variable, which can be converted into a dummy variable. SPSS25.0 was used to convert them into dummy variables. In order to avoid covariance between the dummy variables, this paper took the retail format type “restaurant” as the reference term and set its value as “0”, and the remaining two retail format types were set to “1”.
4.3.3. Multicollinearity Analysis
Multicollinearity refers to the distortion or difficulty in estimating the model accurately due to the presence of exact correlations or high correlations between explanatory variables in a linear regression model.
In order to avoid mutual influence between independent variables, SPSS25.0 was used to diagnose the covariance (Table 4), and the results showed that the tolerance value of the space coefficient of the shop window was 0.195, which was a small value, and there may be a covariance relationship between this variable and other variables. The variance inflation factor value of the space coefficient of the shop window was 5.134, which was less than 10, and there may be covariance between this variable and other variables. The eigenvalue of the depth coefficient of the shop window was 0.018, the eigenvalue of the depth coefficient of the shop window was 0.061, and the eigenvalues of the two variables were close to 0; therefore, there may be a covariance between them and other variables. The conditional indicator value for all five variables was less than 30, and it was not possible to determine the multicollinearity between the variables based on this value.
Table 4.
Collinearity diagnostics.
In order to determine more clearly whether there was a multicollinear relationship between the variables (Table 5), a correlation analysis was performed on the independent variables. The results demonstrated that the correlation between the space coefficient of the shop window and space connectivity was 0.696, and the correlation between the space coefficient of the shop window and the depth coefficient of the shop window was 0.715. There was a correlation between the two groups of indicators, so in order to avoid multicollinearity between the variables, the regression equations between the three variables and shop visits were constructed separately.
Table 5.
Correlation analysis.
4.3.4. Multiple Linear Regression Analysis
Correlation Analysis
In order to clarify the correlation between the space coefficient of the shop window, depth coefficient of the shop window, space connectivity, and shop visits in each retail space of the commercial street, a correlation analysis was carried out using the SPSS 25.0 statistical analysis software (Table 6). The results showed that the correlation between the space coefficient of the shop window, space connectivity, and shop visits was 0.547 and 0.577, respectively, and the correlation was significant at the 0.01 level while the correlation between the depth coefficient of the shop window and shop visits was 0.302, which was between 0.2–0.4; there was a weak correlation between the two variables. Based on the results of the covariance diagnosis and correlation analysis, this paper constructed the following three multiple liner regression equations, respectively.
Table 6.
Correlation analysis.
First, it constructed the regression equation of the space coefficient of the shop window, dummy variable, and shop visits; second, it constructed the regression equation of the depth coefficient of the shop window, dummy variable, and shop visits; and third, it constructed the regression equation of the space connectivity, dummy variable, and shop visits.
The results (Table 7, Table 8 and Table 9) of the three multiple linear regression equations constructed using SPSS 25.0 were as follows:
Table 7.
Regression analysis results of Model 1.
Table 8.
Regression analysis results of Model 2.
Table 9.
Regression analysis results of Model 3.
Model 1:
Model 2:
Model 3:
KJHL—Space vitality of retail shops, i.e., store visits;
C—Space connectivity of retail shops;
KJXS—Space coefficient of shop window;
KJSD—Depth coefficient of shop window;
—Retail format type 1, i.e., beverage shops;
—Retail format type 1, i.e., snack bar;
—Random disturbance term.
According to the results of the linear regression analysis, the regression coefficient of the space connectivity coefficient was 0.012, and it was significant at the 0.01 level, indicating that for every unit increase in space connectivity, the store visits of the retail shop increase by 0.012 units. The regression coefficient of the space coefficient of the shop window was 1.009, and it was significant at the 0.01 level, which indicated that with each unit increase in the space coefficient of the shop window, the store visits of the retail shop increase by 1.009 units. The regression coefficient for the depth coefficient of shop window was 6.758, and it was a weak correlation between it and the store visits, indicating that for every unit increase in the depth coefficient of shop window, there may be an increase of 6.758 units of store visits.
5. Discussion and Conclusions
5.1. Discussion
This work analyzed the relationship between retail space visibility parameters and space vitality in commercial streets based on space syntax. The results showed that the correlation coefficients between space connectivity, space coefficient of shop window, depth coefficient of shop window, and space vitality were 0.577, 0.547, and 0.302, respectively. This research finding is consistent with Li and Tang’s research [78] on the visibility analysis of retail spaces in multi-floor shopping malls. However, their research results showed that the correlation between the depth coefficient of the shop window and space vitality was significant at the level of 0.01 while this study found that the p-value of significance between the two was 0.151 mainly because there were many entrances in the commercial street in this paper and the visual step depth-entrance of each retail store was small. Min et al. [79] studied the correlation between the spatial layout of a single layer of large-scale commercial complex and the frequency of customer visits using the space syntax visibility graphic analysis method. The research results showed that the space connectivity and visual integration were positively correlated with the frequency of visits while the visual step depth-entrance was negatively correlated with the frequency of visits. This finding supports the conclusion of this paper.
The results of this paper showed that parameters, such as visual integration, visual step depth-entrance, and retail store window width, affected the space vitality of stores. Yunitsyna and Shtepani [64] focused on the exploration of spatial parameters of the new neighborhoods in Tirana and found the factors affecting the activities’ distribution; the results showed a correlation between the type and location of activity and the spatial and visual integration. This finding supports the conclusion of this paper. In addition, this paper found that the layout of spatial elements of the commercial street affected the behavior of pedestrians visiting shops by influencing the attraction of pedestrians. Yıldırım and Celik [69] examined the development and implementation of the mixed methodology to understand the relationship between pedestrian behavior and space in Besiktas Koyici settlement, Istanbul; the results demonstrated that pedestrian areas had a significant impact on pedestrian behavior by affecting the vitality and attractiveness of pedestrians. This finding is consistent with the results of this paper.
In addition, this paper took store visits as a representation of space vitality and did not carry out a detailed analysis of pedestrian shopping behaviors in the built environment, such as behavioral trajectories and behavioral preferences. In the era of artificial intelligence, the simulation analysis of pedestrian shopping behavior based on agent simulation were gradually carried out [92,111]. The future research will develop the pedestrian shopping behavior agent simulation model based on computer technology and visual attention theory and apply it to the pedestrian shopping behavior simulation research in the built environment. In addition, this paper only considered the space vitality of commercial space, and existing studies showed that the vitality of the built space was not consistent in different land use types [112]. In the future, the vitality assessment of different land use types should be considered to guide urban renewal.
The choice of which method to obtain pedestrian behavior characteristics in the built environment should be made based on the comprehensive consideration of the applicability and constraints of each method. Based on the relevant literature reviewed, the practicability, advantages, and disadvantages of each method were summarized in Table 10. Although there are some new methods, such as GSM, WLAN network, and Bluetooth, which can quickly obtain pedestrian behavior data, they were not suitable for the analysis of pedestrian behavior characteristics with high accuracy in the building scale. Although the direct observation and video recording consumed a lot of manpower and time, it was highly accurate and had the characteristics of being detailed, objective, and reproducible, which can describe the micro-scale pedestrian behavior data in detail.
Table 10.
The practicability, advantages, and disadvantages of pedestrian behavior acquisition methods.
5.2. Conclusions
This paper proposes a method to quantitatively assess the space vitality of retail shops in commercial streets by coupling a visibility graph analysis and spatial features, and it develops the correlation analysis between retail space and shopping behaviour to assess the space vitality of Zhuangli street in the Letai center of Shijiazhuang. A combination of a visibility graph analysis and statistical analysis was used to quantify the effects of the space coefficient of shop windows, depth coefficient of shop windows, and space connectivity on space vitality in commercial street retail spaces.
This paper contributes to the literature in two ways. First, from an academic perspective, it coupled with visibility analysis methods to study the correlation between retail space and shopping behavior in commercial streets, identifying important parameters that affect spatial vitality. Second, from a methodological perspective, the findings of this manuscript suggested that despite the shortcomings of the multiple regression model quantifying the correlation between the retail space and shopping behavior of commercial streets, it has the potential to predict the space vitality of retail stores in different commercial spaces. The workflow proposed in this paper can be applied to the planning and design of commercial streets to enhance the walkability of urban streets in other cities around the world to promote high-quality urban development.
There are some limitations in this study that need to be addressed in future research.
Through a low-cost, low-risk, high efficiency way, the space vitality of retail stores in commercial streets is reasonably predicted and analyzed so as to provide a more refined design scheme and auxiliary design means for the retail space design of a commercial street in China. However, if this workflow is applied to the design of other types of commercial spaces, the plan of the commercial space and parameter settings of the visibility graph analysis need to be rebuilt.
In this paper, from the perspective of coupling space visibility and spatial features of retail shops in commercial streets, the effect of the space connectivity, space coefficient of shop windows, and depth coefficients of shop windows on space vitality were assessed, and shopping behaviour features of commercial streets were extracted using an empirical method. However, there is no shopping behaviour analysis from the perspective of the pedestrian simulation. Future research should incorporate computer technology and use a pedestrian simulation to assess the correlation between retail space and shopping behaviour in commercial streets.
Author Contributions
Conceptualization, G.L. and H.L.; methodology, G.L.; software, G.L.; validation, G.L. and H.L.; formal analysis, G.L.; investigation, G.L.; resources, H.L.; data curation, G.L.; writing—original draft preparation, G.L. and H.L.; writing—review and editing, G.L. and H.L.; visualization, G.L.; supervision, H.L.; project administration, G.L. and H.L.; funding acquisition, G.L. and H.L. All authors have read and agreed to the published version of the manuscript.
Funding
This study was funded by Hebei Province Social Science Foundation, grant number HB19YS039, and Cyrus Tang Foundation Inclusive Urban Planning and Research Scholarship, grant number 2022009.
Data Availability Statement
No new data were created or analysed in this study. Data sharing is not applicable to this article.
Conflicts of Interest
The authors declare no conflict of interest.
Appendix A
Table A1.
Representative studies on the correlation between space and behavior.
Table A1.
Representative studies on the correlation between space and behavior.
| Authors | Behavior Types | Research Objects | Research Topics |
|---|---|---|---|
| Chen et al. [26] | Emergency evacuation behavior | Subway station | Simulated crowd behaviour during the evacuation of a Xiamen metro station under fire conditions |
| Mandal et al. [27] | Emergency evacuation behavior | Metro station | Understood the factors influencing exit choice through exit choice experiments in emergency evacuation |
| Soltanzadeh et al. [28] | Emergency evacuation behavior | High-rise building | Studied the relationship between the number of elevators and fire staircases in high-rise buildings and the number and location of evacuation areas in order to find the best time for emergency exits |
| Benseghir et al. [29] | Emergency evacuation behavior | Industrial building | Simulated crowd behaviour during the evacuation of industrial building under fire conditions |
| Kasereka et al. [30] | Emergency evacuation behavior | Supermarket | Proposed an agent model and simulated crowd behaviour during the evacuation of a supermarket under fire conditions |
| Mirzaei-Zohan et al. [31] | Emergency evacuation behavior | Multi-story commercial building | Developed a new integrated agent-based design framework for emergency evacuation of buildings with Building Information Modelling |
| Lovreglio and Kuligowski [32] | Emergency evacuation behavior | University library | Conducted emergency evacuation experiments to investigate pre-evacuation behaviour and times of 497 students |
| Haque and Kidwai [33] | Traffic behavior | Urban signalized intersections | Identified significant factors affecting pedestrian signal violation behavior using video recording technique and ANN |
| Bendak et al. [34] | Traffic behavior | Signalized crosswalks | Assessed behaviors of pedestrians at signalized crosswalks with 708 pedestrians’ behavior data |
| Lanzer et al. [35] | Traffic behavior | Urban streets | Assessed crossing and communication behavior of pedestrians in real traffic with self-reports and video observation using instructed as well as non-instructed pedestrians |
| Xie et al. [36] | Traffic behavior | Escalator | Conducted a case study to extract the physical attributes of the escalator, the pedestrians’ microscopic movement characteristics, and the macro-level pedestrian flow dynamics on the escalator of Beihang University’s canteen using cellular-automaton model |
| Schwebel et al. [37] | Traffic behavior | Crossing the street | Assessed the feasibility of observational methodology in evaluating child pedestrian behavior and risk in a middle-income country with chaotic traffic patterns with empirical data |
| Meir et al. [38] | Traffic behavior | Crossing roads | Examined the extent to which child participants’ attitudes, beliefs, and perceptions influence child pedestrian decisions and intentions |
| Cambra and Moura [39] | Leisure walking behavior | Two avenues connected by a plaza | Evaluated the relations of walkability, pedestrian volume and walking experience before and after a street improvement intervention in three connected but distinct sections |
| Mendiate et al. [40] | Leisure walking behavior | Urban form | Studied the influence of urban form on walking behaviour in Alto-molocue and Milange using empirical data |
| Istrate et al. [41] | Leisure walking behavior | Main streets | Assessed the way main streets are perceived and used by pedestrians in an industrial, Central-European city—Ostrava in Czechia |
| Wei et al. [42] | Leisure walking behavior | Waterfront space | Built statistical models to explain the spatial pattern of pedestrian trajectories with a waterfront case utilizing surveillance video data |
| Ki and Lee [43] | Leisure walking behavior | Neighborhoods | Examined the street Green View Index (GVI) and its associations with walking activities by different income groups using survey data on walking behaviors in 2350 residents in Seoul |
| Askarizad and Safari [44] | Leisure walking behavior | Urban spaces | Investigated the influence of social interactions on behavioral patterns of the people in urban spaces |
| Hahm et al. [45] | Shopping behavior | Retail district | Identified built environmental components of retail districts that affect pedestrian behaviors and influence their shopping behavior |
| Chiou and Bayer [46] | Shopping behavior | Night markets | Improved the pedestrian movement model in night markets with the incorporation of the “destination attractiveness” factor |
Table A2.
Representative studies on the space syntax applications.
Table A2.
Representative studies on the space syntax applications.
| Authors | Space Syntax Maps | Research Objects | Research Topics |
|---|---|---|---|
| Battistin [61] | Axial analysis, segment analysis, visibility graph analysis | The street network | Put forward the method for the application of Space Syntax based on the comparison of multiple reconstructive scenarios, calculated the effects each change in layout had on the entire urban system, allowing them to carry out a more in-depth review of the available archaeological dataset |
| Hou and Zheng [62] | Axial analysis | Commercial Streets | Took the typical traditional commercial Streets, which are being built in Guangzhou as prototypes and simulated with Depthmap and SPSS |
| Hoeven and Nes [63] | Axial analysis, isovist analysis, and agent-based modelling | Urban underground space in metro stations | Explored the potential use of the space syntax methodology for evaluating user wayfinding, orientation, and visibility in urban underground space |
| Yunitsyna and Shtepani [64] | Axial analysis and VGA analysis | Residential complexes | Focused on the exploration of spatial parameters of the new neighborhoods in Tirana and found the factors affecting and the activities’ distribution |
| Omer and Kaplan [65] | Segment analysis and agent-based modelling | The centers of two Israeli cities | Presented an agent-based (AB) pedestrian volume model at the urban scale within the space syntax framework |
| Soltani et al. [66] | Axial analysis and segment analysis | Street network morphology | Studied the commuting patterns of children from 18 primary schools in three distinct urban fabric zones (inner, middle, and outer) in Shiraz, Iran |
| Önder and Gigi [67] | Axial analysis | The South Haliç Area | Employed the space-syntax method to analyze the South Haliç Region before and after the implementation of a project, which we proposed to resolve some of the identified problems |
| Mahmoud and Omar [68] | VGA analysis and agent-based modelling | A small-scale garden in an urban park | Investigated the influence of spatial configuration produced by the proposed tree planting design on the visual fields of an urban park using space syntax theory |
| Yıldırım and Celik [69] | VGA analysis | The Besiktas Koyici settlement | Examined the development and implementation of the mixed methodology to understand the relationship between pedestrian behavior and space in Besiktas Koyici settlement, Istanbul |
| Asif et al. [70] | Justified graph analysis | Vernacular Malay architecture | Aimed to deepen the understanding of how syntactical analysis can extract social information embedded in traditional architectural practice in the Malay Archipelago |
| Li et al. [71] | Segment analysis | Tourist space at a historic site | Explored and verified the relationship between street network integration and the urban fabric as well as tourist preferences collated from data mining |
| Tannous et al. [72] | Axial analysis | Public parks, promenades, and green spaces | Analyzed the location and size of public parks, promenades, and other green spaces in Doha in terms of their accessibility |
| Mustafa and Rafeeq [73] | Axial analysis, isovist analysis, convex analysis | Elementary school buildings | Inspected three different floor plan typologies of elementary school based on space syntax analysis and feedback assessments of the school staff |
| Bayoumi et al. [74] | VGA analysis and agent-based modelling | University open space | Understood the factors affecting the spatial and social dimensions of the university open space, focusing on the social logic of space theory for understanding accessibility and occupancy movement pattern using VGA and agent simulation. |
| Hegazi et al. [75] | Axial analysis and VGA analysis | Heritage buildings | Assessed vulnerable spaces around heritage buildings concerning their socio-spatial properties |
| Alitajer and Alitajer [76] | VGA analysis and agent-based modelling | Traditional and modern houses | Analyzed behavioral patterns in the spatial configurations of traditional and modern houses in Hamedan |
References
- William, H.W. City: Rediscovering the Center, Reissue ed.; University of Pennsylvania Press: Philadelphia, PA, USA, 2012. [Google Scholar]
- Hameed, T.; Al_deen, H.S.F. Critical Evaluation of City Streets. J. Eng. 2013, 19, 19–44. [Google Scholar] [CrossRef]
- Miyake, Y. Modern KyoMachiya: Livable Architecture for Kyoto. Ph.D. Thesis, University of Hawaii at Manoa, Honolulu, HI, USA, 2011. [Google Scholar]
- Mehta, V. Lively Streets: Exploring the Relationship between Built Environment and Social Behavior. Ph.D. Thesis, University of Maryland, College Park, MD, USA, 2006; pp. 1689–1699. [Google Scholar]
- Ghazi, N.M.; Abaas, Z.R. Toward liveable commercial streets: A case study of Al-Karada inner street in Baghdad. Heliyon 2019, 5, e01652. [Google Scholar] [CrossRef] [PubMed]
- Momtaz, R.; Elsemary, Y. Qualitative conceptions of livability between theory and applications in Egypt. In Proceedings of the International Institute of Engineers (IIE), Dubai, United Arab Emirates, 22–23 May 2015. [Google Scholar]
- Sun, S.; Yu, Y. Dimension and formation of placeness of commercial public space in city center: A case study of Deji Plaza in Nanjing. Front. Archit. Res. 2021, 10, 229–239. [Google Scholar] [CrossRef]
- Zhuang, W. From Architectural Programming to Post Occupancy Evaluation: A Feedback Mechanism of Architectural Procedure Circle. Des. Community 2017, 5, 125–129. [Google Scholar]
- The Charter of the New Urbanism. Available online: https://www.cnu.org/who-we-are/charter-new-urbanism (accessed on 28 September 2023).
- Grant, J.L. Two sides of a coin? New urbanism and gated communities. Hous. Policy Debate 2007, 18, 481–501. [Google Scholar] [CrossRef]
- Cozens, P.M. New Urbanism, Crime and the Suburbs: A Review of the Evidence. Urban Policy Res. 2008, 26, 429–444. [Google Scholar] [CrossRef]
- Wu, S.; Zhuang, Y.; Chen, J.; Bai, Y. Enlightening and Rethinking of New Urbanism—A Case of Tuen Mun New Town, Hong Kong, China. Urban. Archit. 2019, 10, 31–35. [Google Scholar]
- Song, Y.; Stevens, M.R.; Gao, J.; Berke, P.R.; Chen, Y. An examination of early New Urbanist developments in the United States: Where are they located and why? Cities 2017, 61, 128–135. [Google Scholar] [CrossRef]
- Gao, J.; Song, Y.; Zhou, J.; Wu, D. Locating New Urbanism Developments in the U.S.: Which Cities Have New Urbanism and Why? Land 2021, 11, 44. [Google Scholar] [CrossRef]
- Cysek-Pawlak, M.M.; Pabich, M. Walkability—The New Urbanism principle for urban regeneration. J. Urban. Int. Res. Placemak. Urban Sustain. 2020, 14, 409–433. [Google Scholar] [CrossRef]
- Wei, J. The Patterning Study Of Commercial Walking District. Master’s Thesis, Xi’an University of Architecture and Technology, Xi’an, China, 2010. [Google Scholar]
- Zhou, Z. Study on Spatial Form of Zhongjie Commercial Block in Shenyang Based on Space Syntax. Master’s Thesis, Northeastern University, Shenyang, China, 2016. [Google Scholar]
- State council of the Central People’s Government of the People’s Republic of China (PRC). Outline of the Fourteenth Five-Year Plan for the National Economic and Social Development of the People’s Republic of China and the Vision 2035. 2021. Available online: https://www.gov.cn/xinwen/2021-03/13/content_5592681.htm (accessed on 26 June 2023).
- Nie, C.; Jia, S. Empirical research on optimization of tenant mix in shopping centers store categories. J. Zhejiang Univ. (Sci. Ed.) 2011, 38, 101–108. [Google Scholar]
- Li, Z.; Tang, G.; Shao, Z. Research on the Impact of Space Configuration and Tenant Mix on the Pedestrian Distribution in Commercial Complex: A Case Study of Taskin Square in Changsha. Archit. J. 2017, S1, 43–47. [Google Scholar]
- Liu, X.; Li, X. Multiple Design Types and Design Tendencies of Contemporary Commercial Buildings Abroad. Archit. J. 2005, 7, 79–82. [Google Scholar]
- Fujitani, M.; Kishimoto, T. A Study about the Pedestrian Distribution in the Commercial Buildings by the Location of Stores and the Structure of the Walking Space. In Proceedings of the Eighth International Space Syntax Symposium, Santiago, Chile, 3–6 January 2012. [Google Scholar]
- Horton, F.E.; Reynolds, D.R. An investigation of individual action spaces: A progress report. Proc. Associ. Am. Geogr. 1969, 1, 70–75. [Google Scholar]
- Gehl, J.; He, R. Life between Buildings; China Architecture & Building Press: Beijing, China, 2017. [Google Scholar]
- William, H.W.; Ye, Q.; Ni, X. The Social Life of Small Urban Spaces; Shanghai Translation Publishing House: Shanghai, China, 2016. [Google Scholar]
- Chen, Y.M.; Wang, C.; Yap, J.B.; Li, H.; Zhang, S. Emergency evacuation simulation at starting connection of cross-sea bridge: Case study on Haicang Avenue Subway Station in Xiamen Rail Transit Line. J. Build. Eng. 2020, 29, 101163. [Google Scholar] [CrossRef]
- Mandal, T.; Rao, K.R.; Tiwari, G. Study of exit choice behaviour in metro station using partial immersive virtual reality. IATSS Res. 2022, 46, 290–296. [Google Scholar] [CrossRef]
- Soltanzadeh, A.; Alaghmandan, M.; Soltanzadeh, H. Performance evaluation of refuge floors in combination with egress components in high-rise buildings. J. Build. Eng. 2018, 19, 519–529. [Google Scholar] [CrossRef]
- Benseghir, H.; Ibrahim, A.B.; Nurul Islam Siddique, M.N.I.; Kabir, M.N.; Alginahi, Y.M. Modelling emergency evacuation from an industrial building under spreading fire using a social force model with fire dynamics. Mater. Today Proc. 2021, 41, 38–42. [Google Scholar] [CrossRef]
- Kasereka, S.; Kasoro, N.; Kyamakya, K.; Goufo, E.F.D.; Chokki, A.P.; Yengo, M.V. Agent-Based Modelling and Simulation for evacuation of people from a building in case of fire. Procedia Comput. Sci. 2018, 130, 10–17. [Google Scholar] [CrossRef]
- Mirzaei-Zohan, S.A.; Gheibi, M.; Chahkandi, B.; Mousavi, S.; Khaksar, R.Y.; Behzadian, K. A new integrated agent-based framework for designing building emergency evacuation: A BIM approach. Int. J. Disaster Risk Reduct. 2023, 93, 103753. [Google Scholar] [CrossRef]
- Lovreglio, R.; Kuligowski, E. A pre-evacuation study using data from evacuation drills and false alarm evacuations in a university library. Fire Saf. J. 2022, 131, 103595. [Google Scholar] [CrossRef]
- Haque, F.; Kidwai, F.A. Modeling pedestrian behavior at urban signalised intersections using statistical-ANN hybrid approach—Case study of New Delhi. Case Stud. Transp. Policy 2023, 13, 101038. [Google Scholar] [CrossRef]
- Bendak, S.; Alnaqbi, A.M.; Alzarooni, M.Y.; Aljanaahi, S.M.; Alsuwaidi, S.J. Factors affecting pedestrian behaviors at signalized crosswalks: An empirical study. J. Safety Res. 2021, 76, 269–275. [Google Scholar] [CrossRef] [PubMed]
- Lanzer, M.; Gieselmann, M.; Mühl, K.; Baumann, M. Assessing crossing and communication behavior of pedestrians at urban streets. Transp. Res. Part F Traffic Psychol. Behav. 2021, 80, 341–358. [Google Scholar] [CrossRef]
- Xie, C.-Z.; Tang, T.-Q.; Hu, P.-C.; Chen, L. Observation and cellular-automaton based modeling of pedestrian behavior on an escalator. Phys. A Stat. Mech. Its Appl. 2022, 605, 128032. [Google Scholar] [CrossRef]
- Schwebel, D.C.; Wu, Y.; Swanson, M.; Cheng, P.; Ning, P.; Cheng, X.; Gao, Y.; Hu, G. Child Pedestrian Street-Crossing Behaviors outside a Primary School: Developing Observational Methodologies and Data from a Case Study in Changsha, China. J. Transp. Health 2018, 8, 283–288. [Google Scholar] [CrossRef]
- Meir, A.; Tapiro, H.; Oron-Gilad, T. Towards safer, more walkable urban environments for child-pedestrians—Application of the theory of Planned behavior. Saf. Sci. 2023, 164, 106148. [Google Scholar] [CrossRef]
- Cambra, P.; Moura, F. How does walkability change relate to walking behavior change? Effects of a street improvement in pedestrian volumes and walking experience. J. Transp. Health 2020, 16, 100797. [Google Scholar] [CrossRef]
- Mendiate, C.J.; Nkurunziza, A.; Machanguana, C.A.; Bernardo, R. Pedestrian travel behaviour and urban form: Comparing two small Mozambican cities. J. Transp. Geogr. 2022, 98, 103245. [Google Scholar] [CrossRef]
- Istrate, A.-L.; Bosák, V.; Nováček, A.; Slach, O. How Attractive for Walking Are the Main Streets of a Shrinking City? Sustainability 2020, 12, 6060. [Google Scholar] [CrossRef]
- Wei, W.; Deng, Y.; Huang, L.; Chen, S.; Li, F.; Xu, L. Environment-deterministic pedestrian behavior? New insights from surveillance video evidence. Cities 2022, 125, 103638. [Google Scholar] [CrossRef]
- Ki, D.; Lee, S. Analyzing the effects of Green View Index of neighborhood streets on walking time using Google Street View and deep learning. Landsc. Urban Plan. 2021, 205, 103920. [Google Scholar] [CrossRef]
- Askarizad, R.; Safari, H. The influence of social interactions on the behavioral patterns of the people in urban spaces (case study: The pedestrian zone of Rasht Municipality Square, Iran). Cities 2020, 101, 102687. [Google Scholar] [CrossRef]
- Hahm, Y.; Yoon, H.; Choi, Y. The effect of built environments on the walking and shopping behaviors of pedestrians; A study with GPS experiment in Sinchon retail district in Seoul, South Korea. Cities 2019, 8, 1–13. [Google Scholar]
- Chiou, Y.-S.; Bayer, A.Y. Microscopic Modeling of Pedestrian Movement in a Shida Night Market Street Segment: Using Vision and Destination Attractiveness. Sustainability 2021, 13, 8015. [Google Scholar] [CrossRef]
- Hillier, B.; Hanson, J. The Social Logic of Space; Cambridge University Press: Cambridge, UK, 1984. [Google Scholar]
- Bafna, S. Space syntax: A brief introduction to its logic and analytical techniques. Environ. Behav. 2016, 35, 17–29. [Google Scholar] [CrossRef]
- Hillier, B. Space Is the Machine: A Configurational Theory of Architecture; Cambridge University Press: Cambridge, UK, 1996. [Google Scholar]
- Behbahani, P.A.; Gu, N.; Nichols, J.; McGinley, T. Space Syntax in Design Curriculum: Opportunities and Challenges. In Proceedings of the 51st International Conference of the Architectural Science Association, Wellington, New Zealand, 29 November–2 December 2017. [Google Scholar]
- Nes, A.V.; Lopez, M. Macro and micro scale spatial variables and the distribution of residential burglaries and theft from cars: An investigation of space and crime in the Dutch cities of Alkmaar and Gouda. J. Space Syntax 2010, 1, 296–314. [Google Scholar]
- Van Nes, A.; Yamu, C. Space Syntax: A method to measure urban space related to social, economic and cognitive factors. The Virtual and the Real in Planning and Urban Design: Perspectives. Pract. Appl. 2018, 7, 136–150. [Google Scholar]
- Li, X.; Lv, Z.; Zheng, Z.; Zhong, C.; Hijazi, I.H.; Cheng, S. Assessment of lively street network based on geographic information system and space syntax. Multimedia Tools Appl. 2015, 76, 17801–17819. [Google Scholar] [CrossRef]
- Benedikt, M.L. To take hold of space: Isovists and isovist fields. Environ. Plan. B 1979, 6, 47–65. [Google Scholar] [CrossRef]
- Mustafa, F.A. Using space syntax analysis in detecting privacy: A comparative study of traditional and modern house layouts in Erbil city, Iraq. Asian Soc. Sci. 2010, 6, 157–166. [Google Scholar] [CrossRef]
- Turner, A.; Doxa, M.; O’Sullivan, D.; Penn, A. From Isovists to Visibility Graphs: A Methodology for the Analysis of Architectural Space. Environ. Plan. B Plan. Des. 2001, 28, 103–121. [Google Scholar] [CrossRef]
- Penn, A.; Turner, A. Space Syntax Based Agent Simulation. Pedestr. Evac. Dyn. 2002, 92–114. [Google Scholar]
- Andi, I.; Bontor, J. A Space Syntax Guide to Optimize Shopping Mall: A Systematic Review. Int. J. Environ. Archit. Soc. 2021, 1, 19–30. [Google Scholar] [CrossRef]
- Dalton, C.R.; Christoph, H. Understanding Space:the nascent synthesis of cognition and the syntax of spatial morphologies. In Proceedings of the Space Syntax and Spatial Cognition, Proceedings of the Workshop, Bremen, Germany, 24–28 September 2006; pp. 1–10. [Google Scholar]
- Yang, T.; Sheng, Q.; Liu, N. The Voids May Become Useful: An Application of Space Syntax in Commercial Building Design. World Archit. 2015, 04, 118–122. [Google Scholar]
- Battistin, F. Space Syntax and buried cities: The case of the Roman town of Falerii Novi (Italy). J. Archaeol. Sci. Rep. 2021, 35, 102712. [Google Scholar] [CrossRef]
- Hou, X.; Zheng, L. Simulation of Pedestrian Flow in Traditional Commercial Streets Based on Space Syntax. Procedia Eng. 2017, 205, 1344–1349. [Google Scholar]
- Van der Hoeven, F.; van Nes, A. Improving the design of urban underground space in metro stations using the space syntax methodology. Tunn. Undergr. Space Technol. 2014, 40, 4064–4074. [Google Scholar] [CrossRef]
- Yunitsyna, A.; Shtepani, E. Investigating the socio-spatial relations of the built environment using the Space Syntax analysis—A case study of Tirana City. Cities 2023, 133, 104147. [Google Scholar] [CrossRef]
- Omer, I.; Kaplan, N. Using space syntax and agent-based approaches for modeling pedestrian volume at the urban scale. Comput. Environ. Urban Syst. 2017, 64, 57–67. [Google Scholar] [CrossRef]
- Soltani, A.; Javadpoor, M.; Shams, F.; Mehdizadeh, M. Street network morphology and active mobility to school: Applying space syntax methodology in Shiraz, Iran. J. Transp. Health 2022, 27, 101493. [Google Scholar]
- Önder, D.E.; Gigi, Y. Reading urban spaces by the space-syntax method: A proposal for the South Haliç Region. Cities 2010, 27, 260–271. [Google Scholar] [CrossRef]
- Mahmoud, A.H.; Omar, R.H. Planting design for urban parks: Space syntax as a landscape design assessment tool. Front. Archit. Res. 2015, 4, 35–45. [Google Scholar] [CrossRef]
- Yıldırım, Ö.C.; Çelik, E. Understanding pedestrian behavior and spatial relations: A pedestrianized area in Besiktas, Istanbul. Front. Archit. Res. 2023, 12, 67–84. [Google Scholar] [CrossRef]
- Asif, N.; Utaberta, N.; Sabil, A.B.; Ismail, S. Reflection of cultural practices on syntactical values: An introduction to the application of space syntax to vernacular Malay architecture. Front. Archit. Res. 2018, 7, 521–529. [Google Scholar] [CrossRef]
- Li, Y.; Xiao, L.; Ye, Y.; Xu, W.; Law, A. Understanding tourist space at a historic site through space syntax analysis: The case of Gulangyu, China. Tour. Manag. 2016, 52, 30–43. [Google Scholar] [CrossRef]
- Tannous, H.O.; Major, M.D.; Furlan, R. Accessibility of green spaces in a metropolitan network using space syntax to objectively evaluate the spatial locations of parks and promenades in Doha, State of Qatar. Urban For. Urban Green. 2021, 58, 126892. [Google Scholar] [CrossRef]
- Mustafa, F.A.; Rafeeq, D.A. Assessment of elementary school buildings in Erbil city using space syntax analysis and school teachers′ feedback. Alex. Eng. J. 2019, 58, 1039–1052. [Google Scholar] [CrossRef]
- Bayoumi, A.A.; Eldin, S.S.; Elwan, M.M. Social retrofitting design through occupancy pattern in Tanta University, Egypt. Ain Shams Eng. J. 2023, 14, 101911. [Google Scholar] [CrossRef]
- Hegazi, Y.S.; Tahoon, D.; Abdel-Fattah, N.A.; El-Alfi, M.F. Socio-spatial vulnerability assessment of heritage buildings through using space syntax. Heliyon 2022, 8, e09133. [Google Scholar] [CrossRef]
- Alitajer, S.; Nojoumi, G.M. Privacy at home: Analysis of behavioral patterns in the spatial configuration of traditional and modern houses in the city of Hamedan based on the notion of space syntax. Front. Archit. Res. 2016, 5, 341–352. [Google Scholar] [CrossRef]
- Lu, Z.; Guo, W. Visibility Analysis Method of Material Space and Its Research Progress. Zhuangshi 2011, 8, 2. [Google Scholar]
- Li, Z.; Tang, G. Visibility Analysis of Multi-Floor Shopping Center Retail Space:Taking Taskin Square in Changsha as an Example. Zhuangshi 2017, 7, 94–96. [Google Scholar]
- Min, S.; Ju, C.; Kim, Y. The Impacts of Spatial Configuration and Merchandising on the Shopping Behavior in the Complex Commercial Facilities. In Proceedings of the 8th International Space Syntax Symposium, Pontificia Universidad Católica de Chile, Santiago, Chile, 3–6 January 2012. [Google Scholar]
- Fong, P. What Makes Big Dumb Bells a Mega Shopping Mall? In Proceedings of the 4th International Space Syntax Symposium, London, UK, 17–19 June 2003. [Google Scholar]
- Hanzi, M.; Ledwon, S. Analyses of human behaviour in public spaces. In Proceedings of the ISOCARP OAPA Congress, Portland, Oregon, USA, 24–27 October 2017. [Google Scholar]
- Wheeler, B.W.; Cooper, A.R.; Page, A.S.; Jago, R. Greenspace and children’s physical activity: A GPS/GIS analysis of the PEACH project. Prev. Med. 2010, 51, 148–152. [Google Scholar] [CrossRef] [PubMed]
- Liu, Y.; Lu, A.; Yang, W.; Tian, Z. Investigating factors influencing park visit flows and duration using mobile phone signaling data. Urban For. Urban Green. 2023, 85, 127952. [Google Scholar] [CrossRef]
- Wan, H.; Wang, S.; Du, J.; Li, L.; Zhang, J. Trace analysis using Wi-Fi probe positioning and virtual reality for commercial building complex design. Autom. Constr. 2023, 153, 104940. [Google Scholar] [CrossRef]
- Yoshimura, Y.; Sobolevsky, S.; Ratti, C. An analysis of visitors’ behavior in the Louvre Museum: A study using Bluetooth data. Environ. Plan. B Urban Anal. City Sci. 2014, 41, 1113–1131. [Google Scholar] [CrossRef]
- Choi, J.S.; Kang, W.S.; Son, C.S.; Son, B.R.; Lee, D.H. Tag Interference Based Mobile Object Tracking with Passive UHF RFID System. Comput. Sci. Its Appl. 2015, 330, 751–757. [Google Scholar]
- Tang, S.; Wang, J.; Liu, W.; Tian, Y.; Ma, Z.; He, G.; Yang, H. A study of the cognitive process of pedestrian avoidance behavior based on synchronous EEG and eye movement detection. Heliyon 2023, 9, e13788. [Google Scholar] [CrossRef]
- Qiao, S.; Yeh, A.G.-O. Understanding the effects of environmental perceptions on walking behavior by integrating big data with small data. Landsc. Urban Plan. 2023, 240, 104879. [Google Scholar] [CrossRef]
- Hu, X.; Shen, P.; Shi, Y.; Zhang, Z. Using Wi-Fi probe and location data to analyze the human distribution characteristics of green spaces: A case study of the Yanfu Greenland Park, China. Urban For. Urban Green. 2020, 54, 126733. [Google Scholar] [CrossRef]
- Liu, M.; Yang, C.; Fan, Z.; Yuan, C. Prediction approach on pedestrian outdoor activity preference under factors of public open space integrated microclimate. Build. Environ. 2023, 244, 110761. [Google Scholar] [CrossRef]
- Sheng, Q.; Cui, S. Research on the Pedestrian Distribution in Commercial Complexes before and after the COVID-19 Control: The Case of Taikoo Li Sanlitun in Beijing. New Archit. 2022, 3, 9–14. [Google Scholar]
- Lian, H. Intelligent Agent Shopping Behaviour Model Based on Visual Attention Theory. Zhuangshi 2018, 11, 128–1129. [Google Scholar]
- Chen, X.; Tian, W. Study on the Influencing Factors of Business Form and Function of Commercial Street: A Case Study of Two Commercial Streets in Tangshan. Archit. Cult. 2023, 1, 82–85. [Google Scholar]
- Mehanna, W.A.E.-H.; Mehanna, W.A.E.-H. Urban renewal for traditional commercial streets at the historical centers of cities. Alex. Eng. J. 2019, 58, 1127–1143. [Google Scholar] [CrossRef]
- Li, Z.; Han, X.; Lin, X.; Lu, X. Quantitative analysis of landscape efficacy based on structural equation modelling: Empirical evidence from new Chinese style commercial streets. Alex. Eng. J. 2021, 60, 261–271. [Google Scholar] [CrossRef]
- Balasubramanian, S.; Irulappan, C.; Kitchley, J.L. Aesthetics of urban commercial streets from the perspective of cognitive memory and user behavior in urban environments. Front. Archit. Res. 2022, 11, 949–962. [Google Scholar] [CrossRef]
- Luo, F. Optimization Design of Internal Street in West Castle Street Commercial Complex. Chongqing Archit. 2010, 09, 17–19. [Google Scholar]
- Su, Y. Study on street space design in urban commercial complex. China Constr. 2017, 11, 106–107. [Google Scholar]
- Dong, L.; Wei, C. Research on Stereo Design of Traditional Business District in City: Taking the Commercial District Around Kunshan Commercial Building as an Example. Zhuangshi 2022, 12, 139–141. [Google Scholar]
- Fang, K.; Wang, X.; Chen, L.; Zhang, Z.; Furuya, N. Research on the correlation between pedestrian density and street spatial characteristics of commercial blocks in downtown area: A case study on Shanghai Tianzifang. J. Asian Archit. Build. Eng. 2019, 18, 233–246. [Google Scholar] [CrossRef]
- Pan, M.; Shen, Y.; Jiang, Q.; Zhou, Q.; Li, Y. Reshaping Publicness: Research on Correlation between Public Participation and Spatial Form in Urban Space Based on Space Syntax—A Case Study on Nanjing Xinjiekou. Buildings 2022, 12, 1492. [Google Scholar] [CrossRef]
- Zinai, M.; Chaouche, S. Evaluation the Impact of Spatial Configuration on Socio-Economic Parameters in Emerging Shopping Centers. Case study of Ritaj Mall in Constantine, Algeria. Int. J. Built Environ. Sustain. 2022, 9, 19–33. [Google Scholar] [CrossRef]
- Omer, I.; Goldblatt, R. Using space syntax and Q-analysis for investigating movement patterns in buildings: The case of shopping malls. Environ. Plan. B Urban Anal. City Sci. 2016, 44, 504–530. [Google Scholar] [CrossRef]
- Ren, R.; Wu, S.; Bai, M.; Lian, H. Place Activation and Space Construction: Research on Space Design Optimization Method of Commercial Plazas Based on Pedestrian Simulation. South Archit. 2022, 11, 41–49. [Google Scholar]
- Ruth, C.D. Space Syntax and Spatial Cognition. World Archit. 2005, 11, 41–45. [Google Scholar]
- Xue, W. SPSS Statistical Analysis Methods and Applications, 4th ed.; Electronic Industry Press: Beijing, China, 2017. [Google Scholar]
- Tian, W. A review of sensitivity analysis methods in building energy analysis. Renew. Sustain. Energy Rev. 2013, 20, 20411–20419. [Google Scholar] [CrossRef]
- Deng, Q.; Wang, G.; Wang, Y.; Zhou, H.; Ma, L. A quantitative analysis of the impact of residential cluster layout on building heating energy consumption in cold IIB regions of China. Energy Build. 2021, 253, 111515. [Google Scholar] [CrossRef]
- Xu, S.; Li, G.; Zhang, H.; Xie, M.; Mendis, T.; Du, H. Effect of Block Morphology on Building Energy Consumption of Office Blocks: A Case of Wuhan, China. Buildings 2023, 13, 768. [Google Scholar] [CrossRef]
- Jiang, C.; Long, J. Research on The Visual Integration of Urban Public Space based on Space Syntax. In Proceedings of the 2018 China Urban Planning Annual Conference (07 Urban Design), Hangzhou, China, 24 November 2017. [Google Scholar]
- Li, G.; Lian, H. See it as it is—A Study on the effective of Intelligent Agent Shopping Behaviour Model. Inter. Des. Constr. 2020, 06, 130–131. [Google Scholar]
- Niu, T.; Qing, L.; Han, L.; Long, Y.; Hou, J.; Li, L.; Tang, W.; Teng, Q. Small public space vitality analysis and evaluation based on human trajectory modeling using video data. Build. Environ. 2022, 225, 109563. [Google Scholar] [CrossRef]
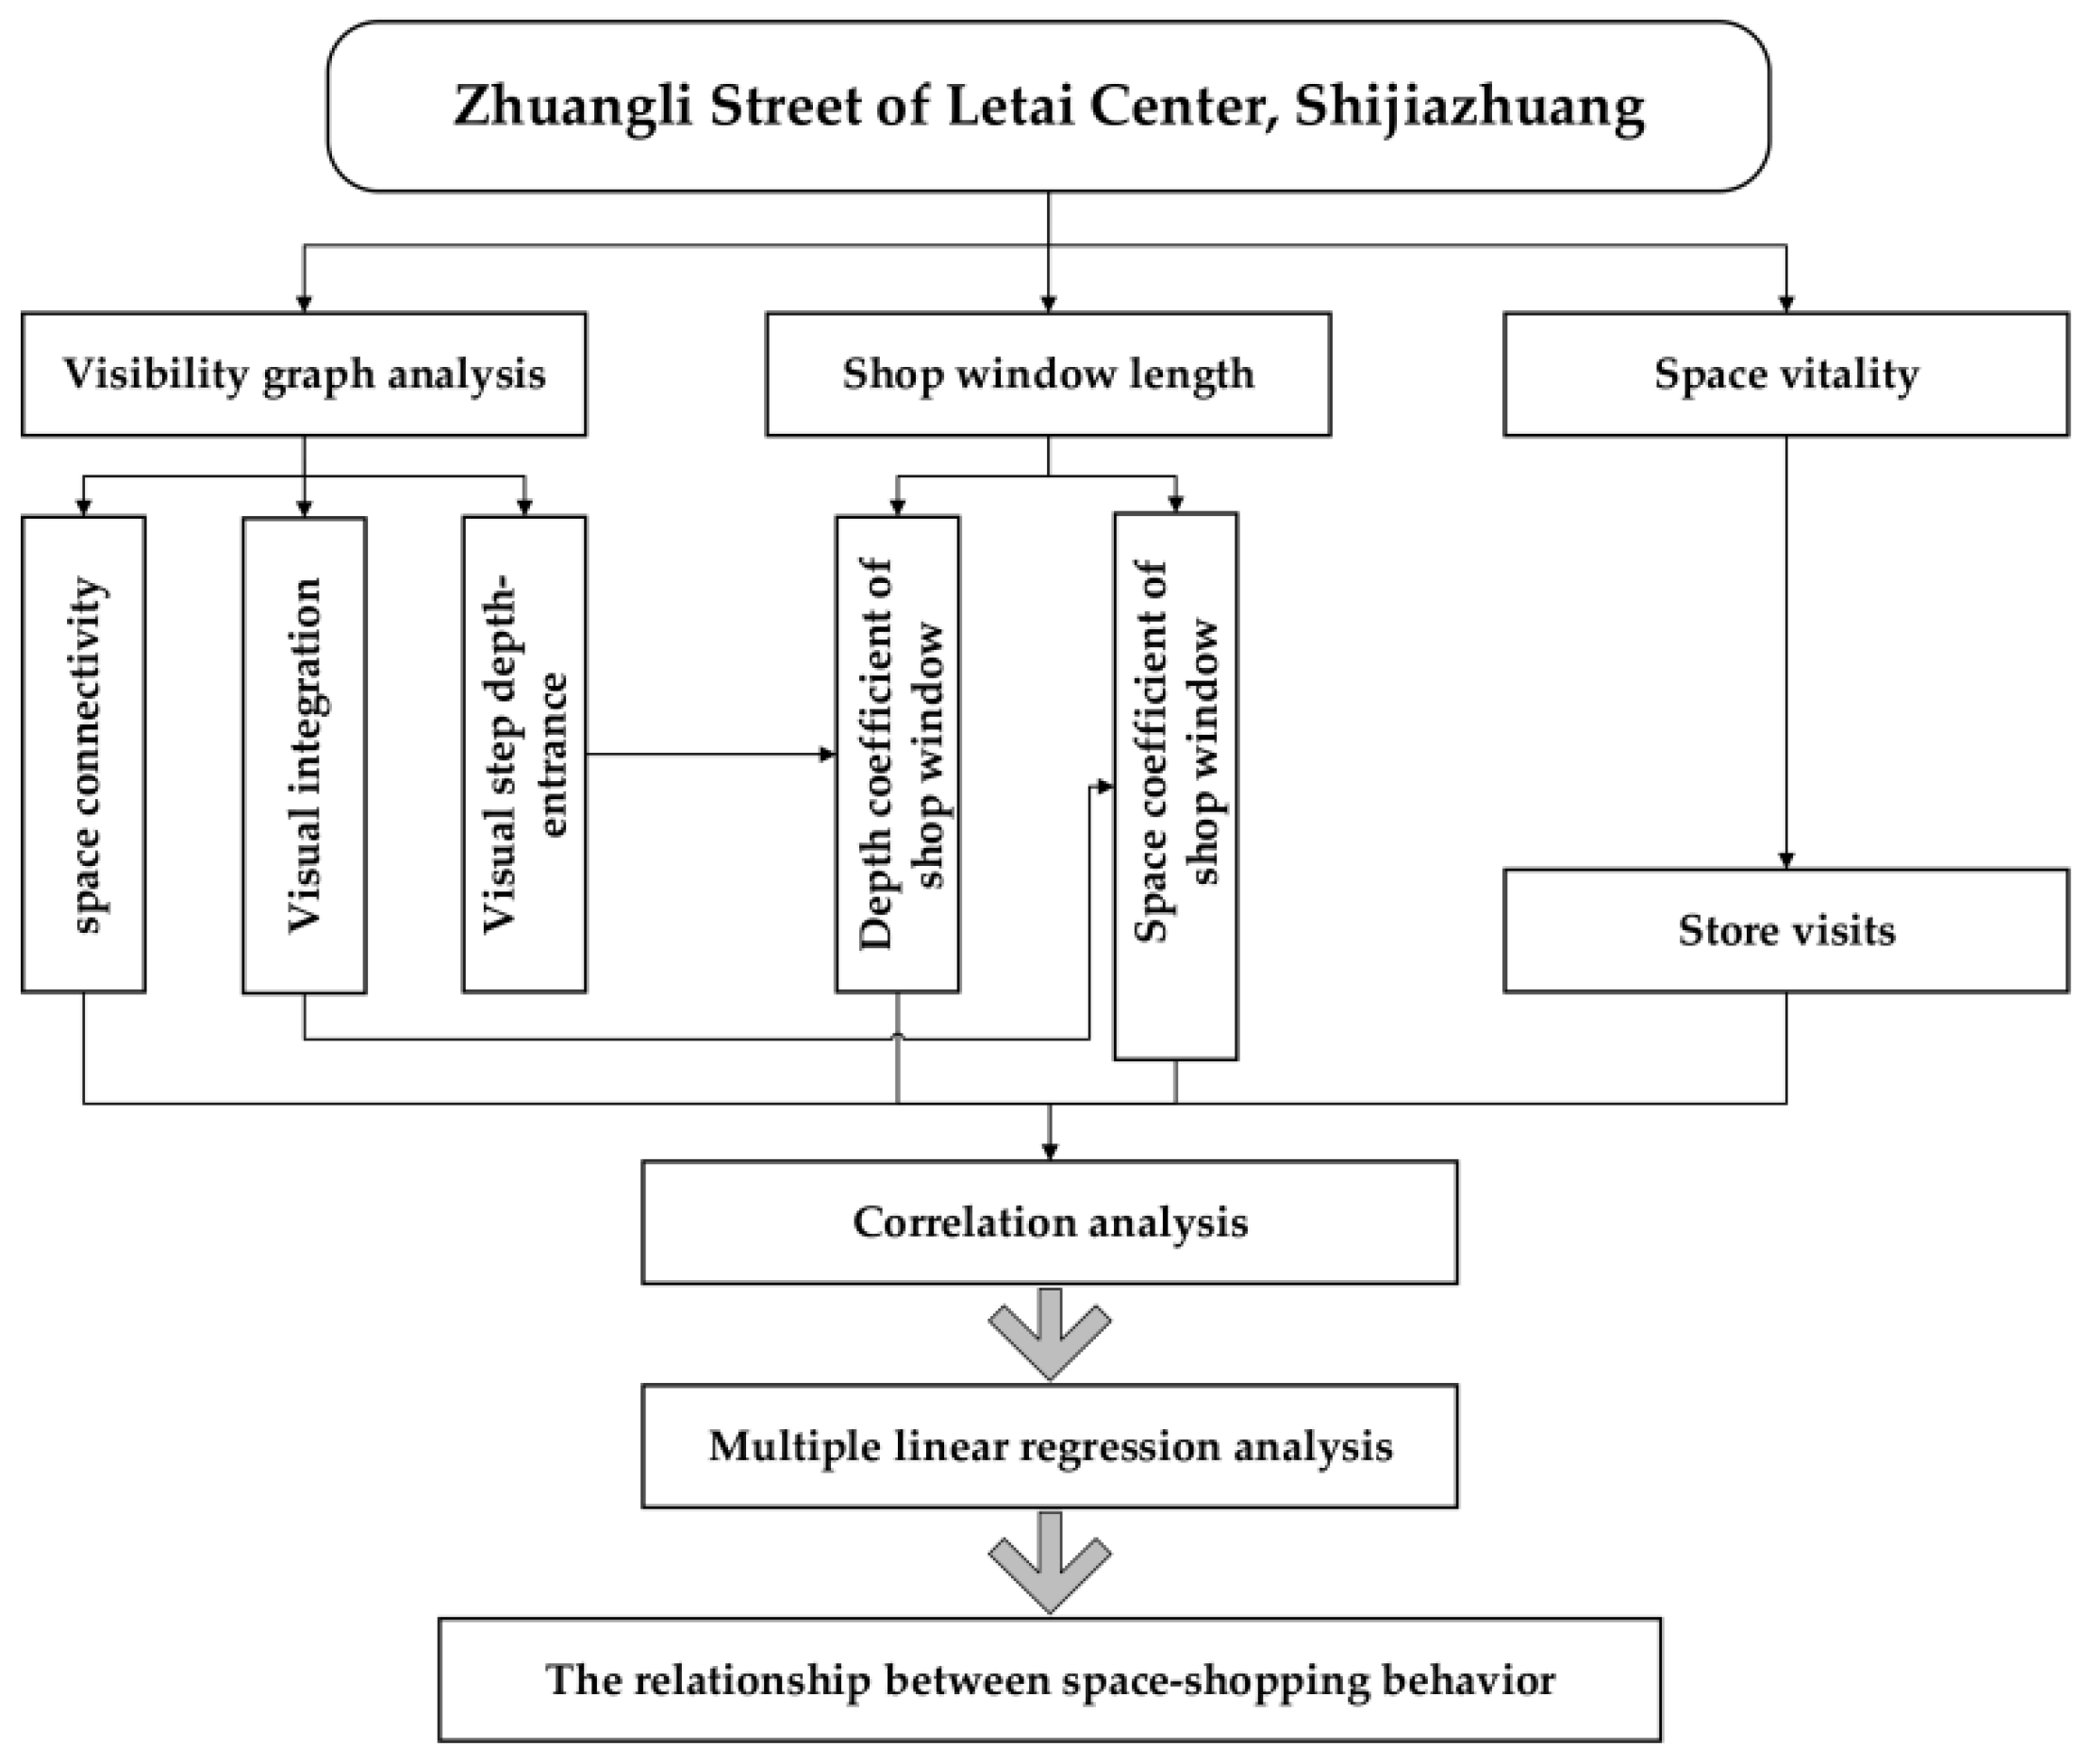
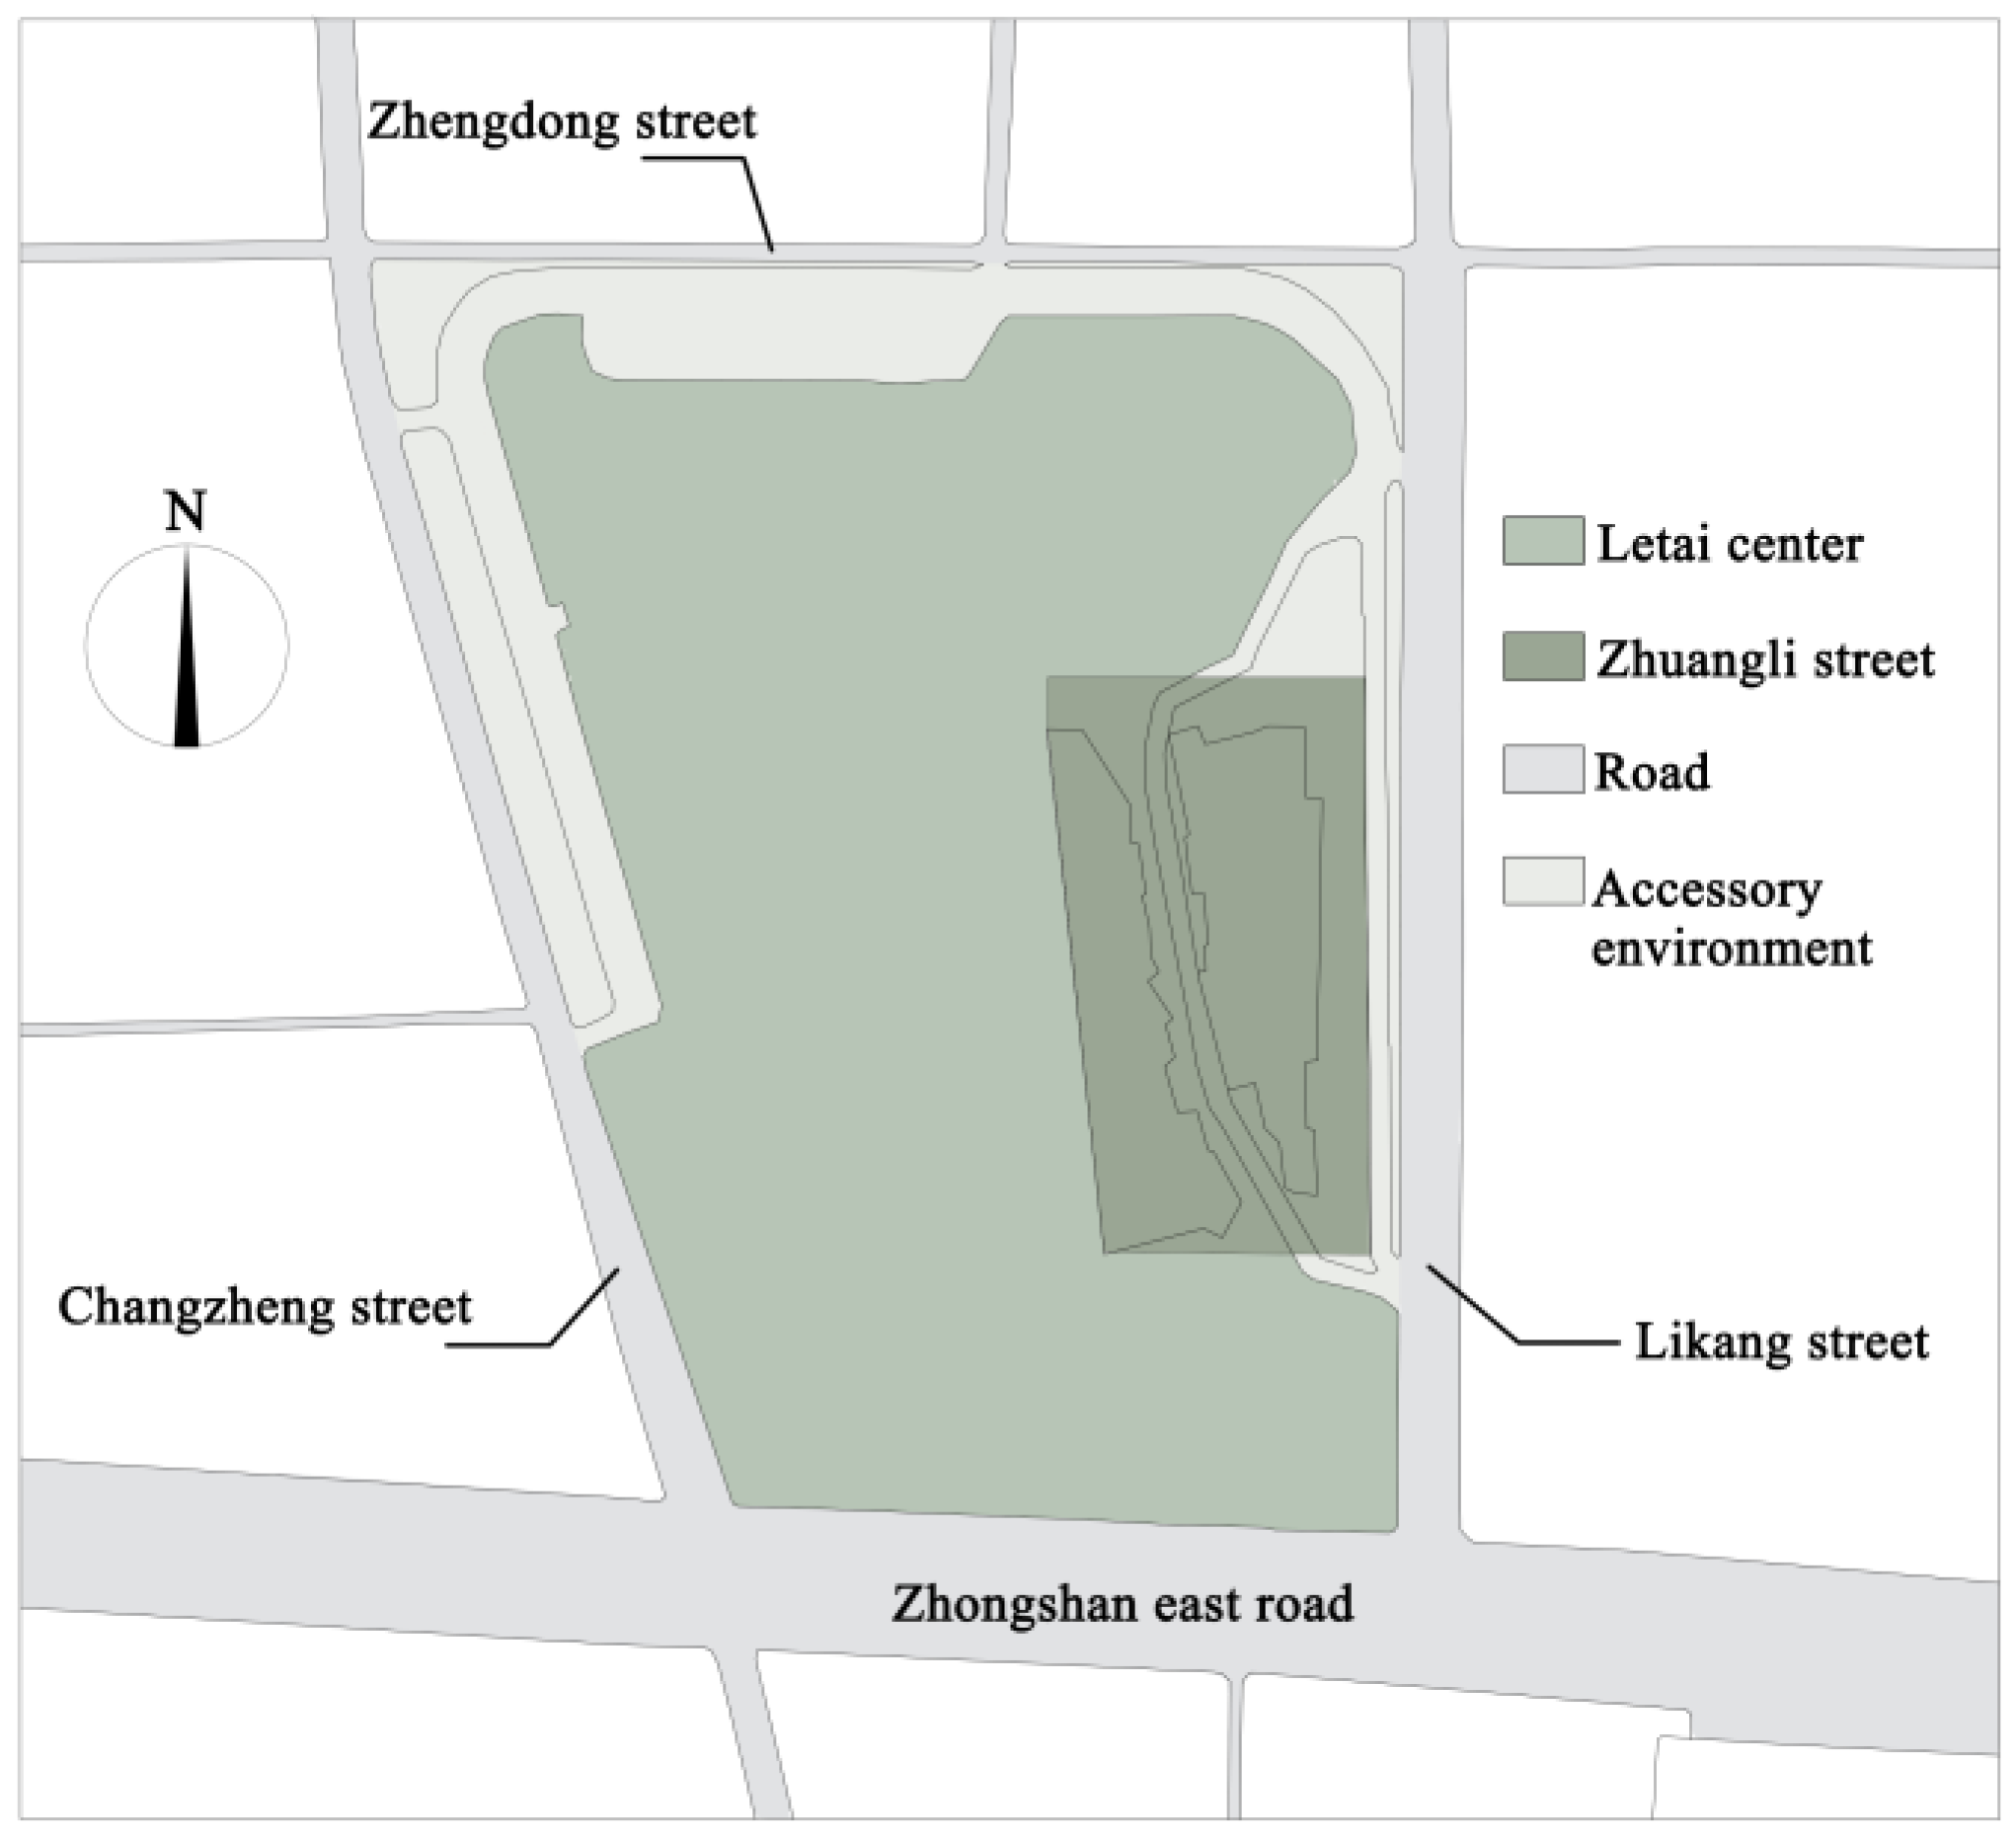

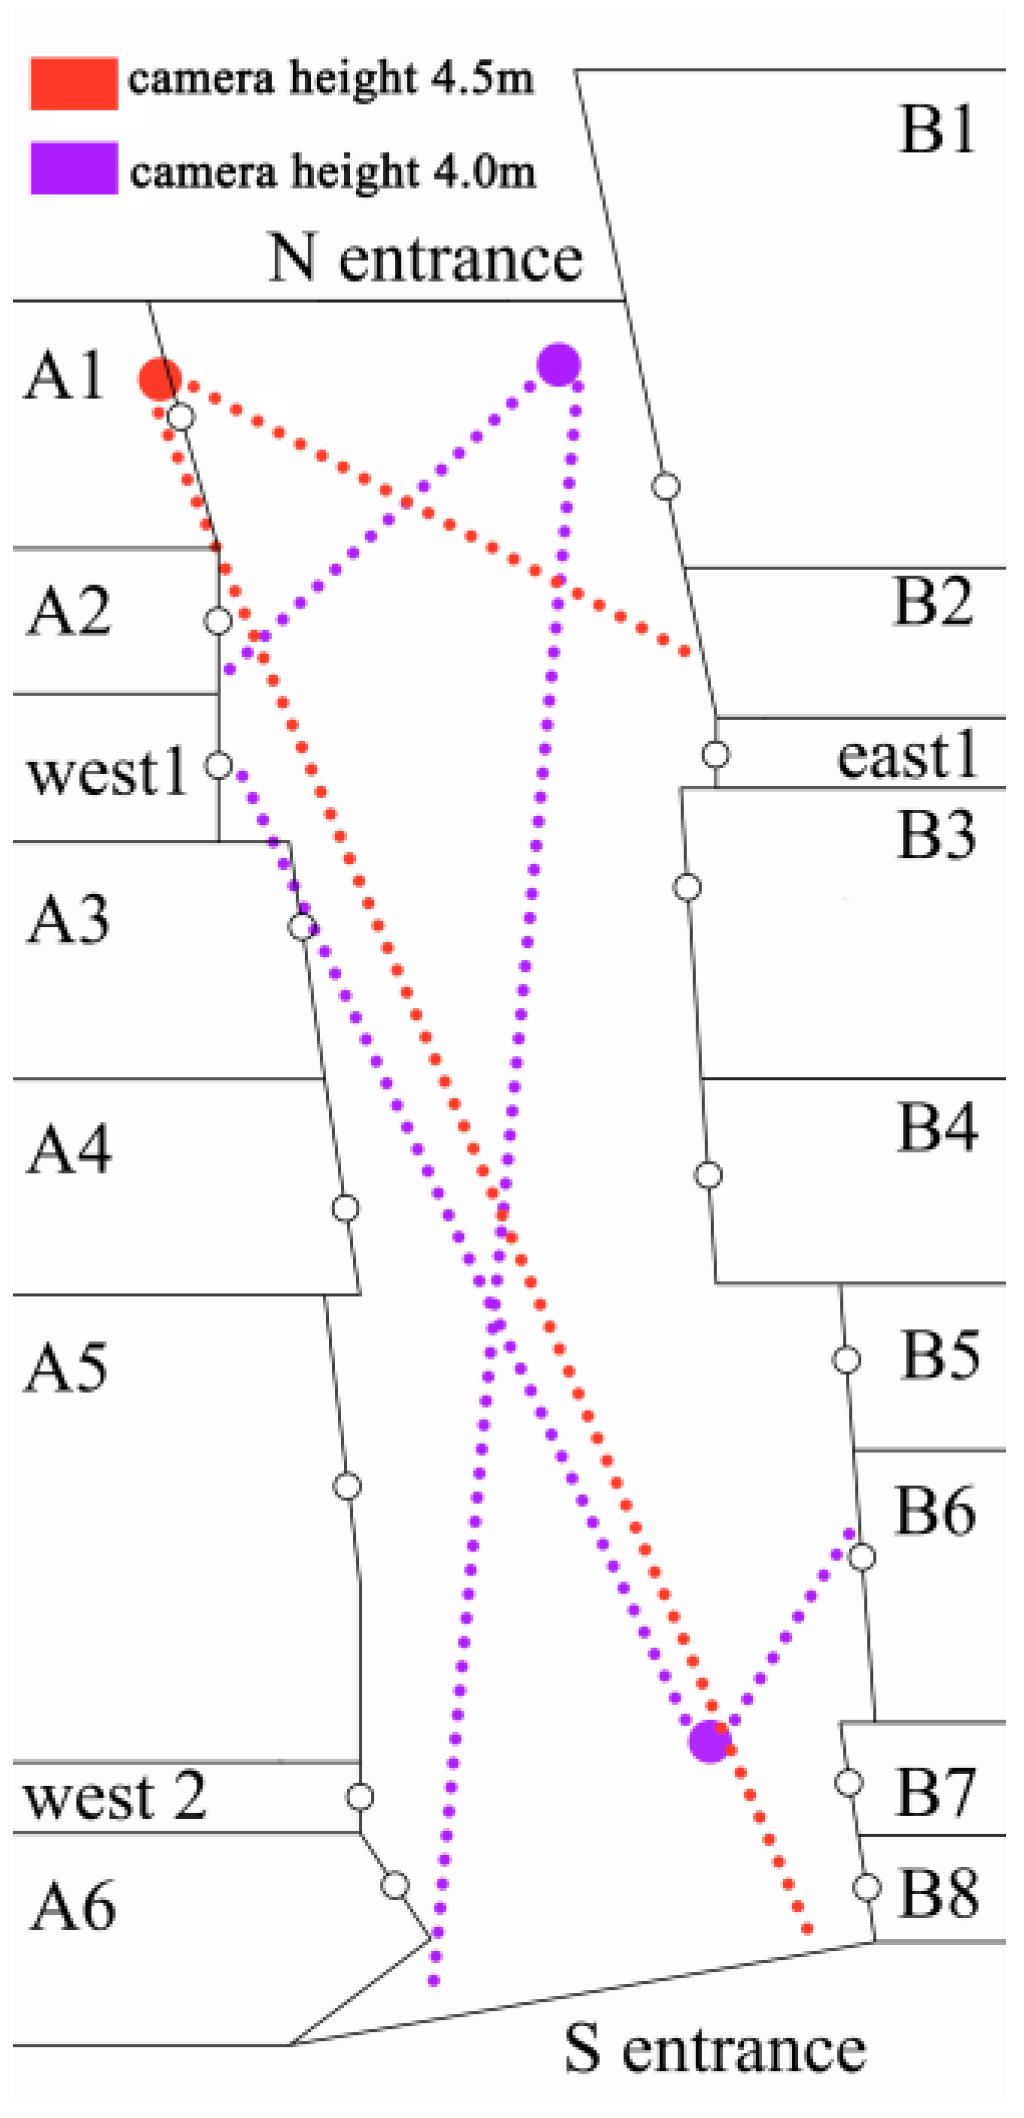
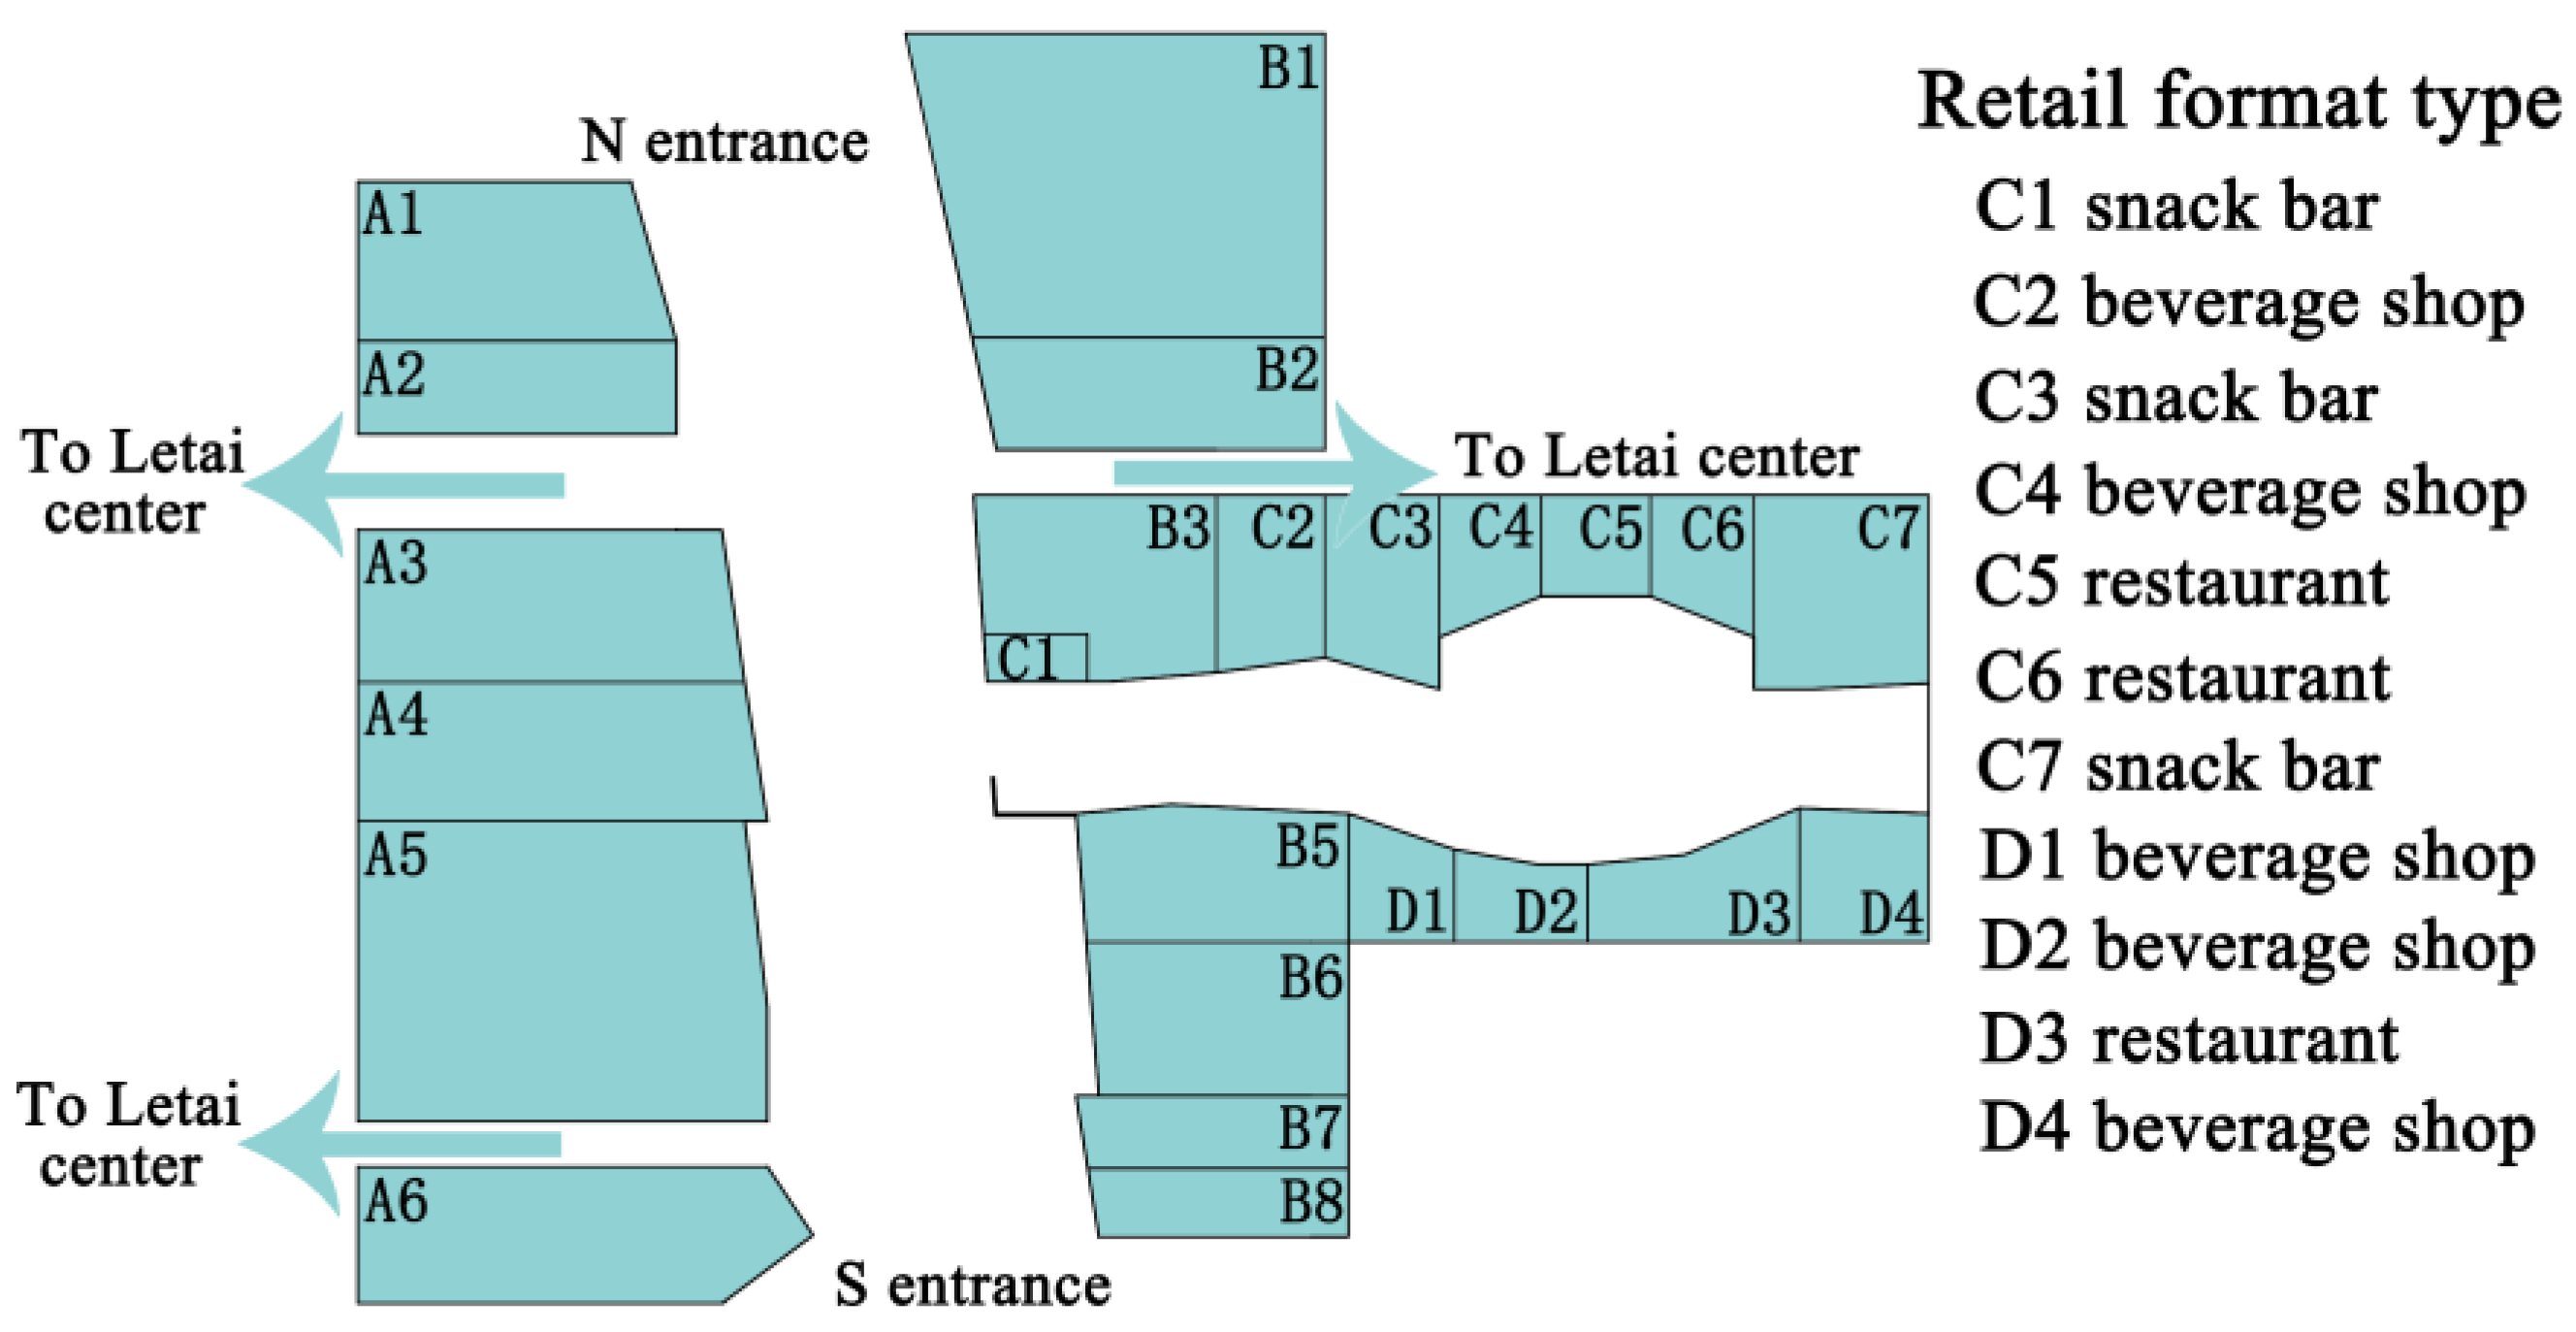

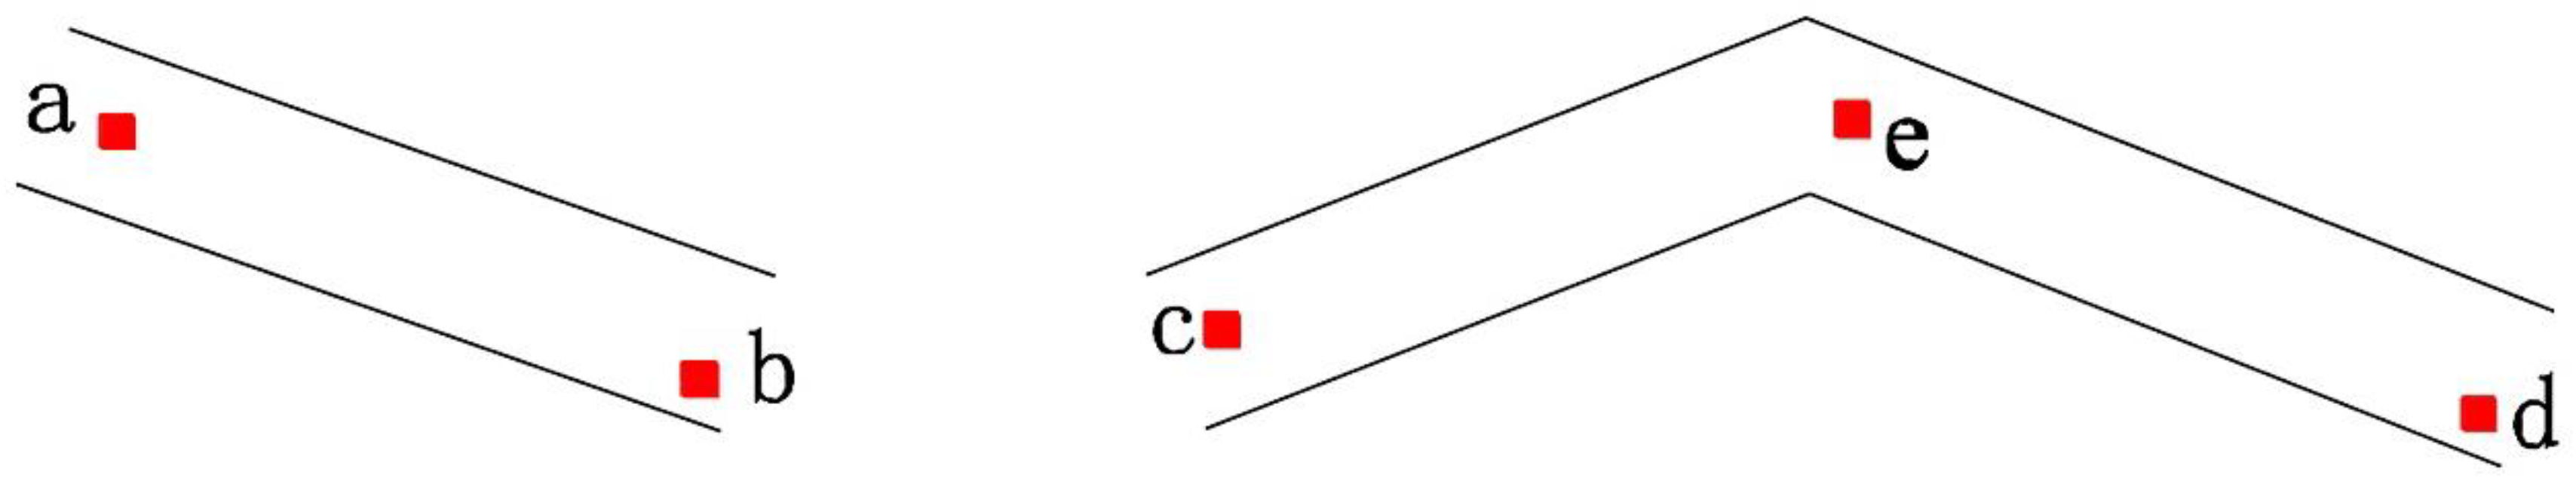

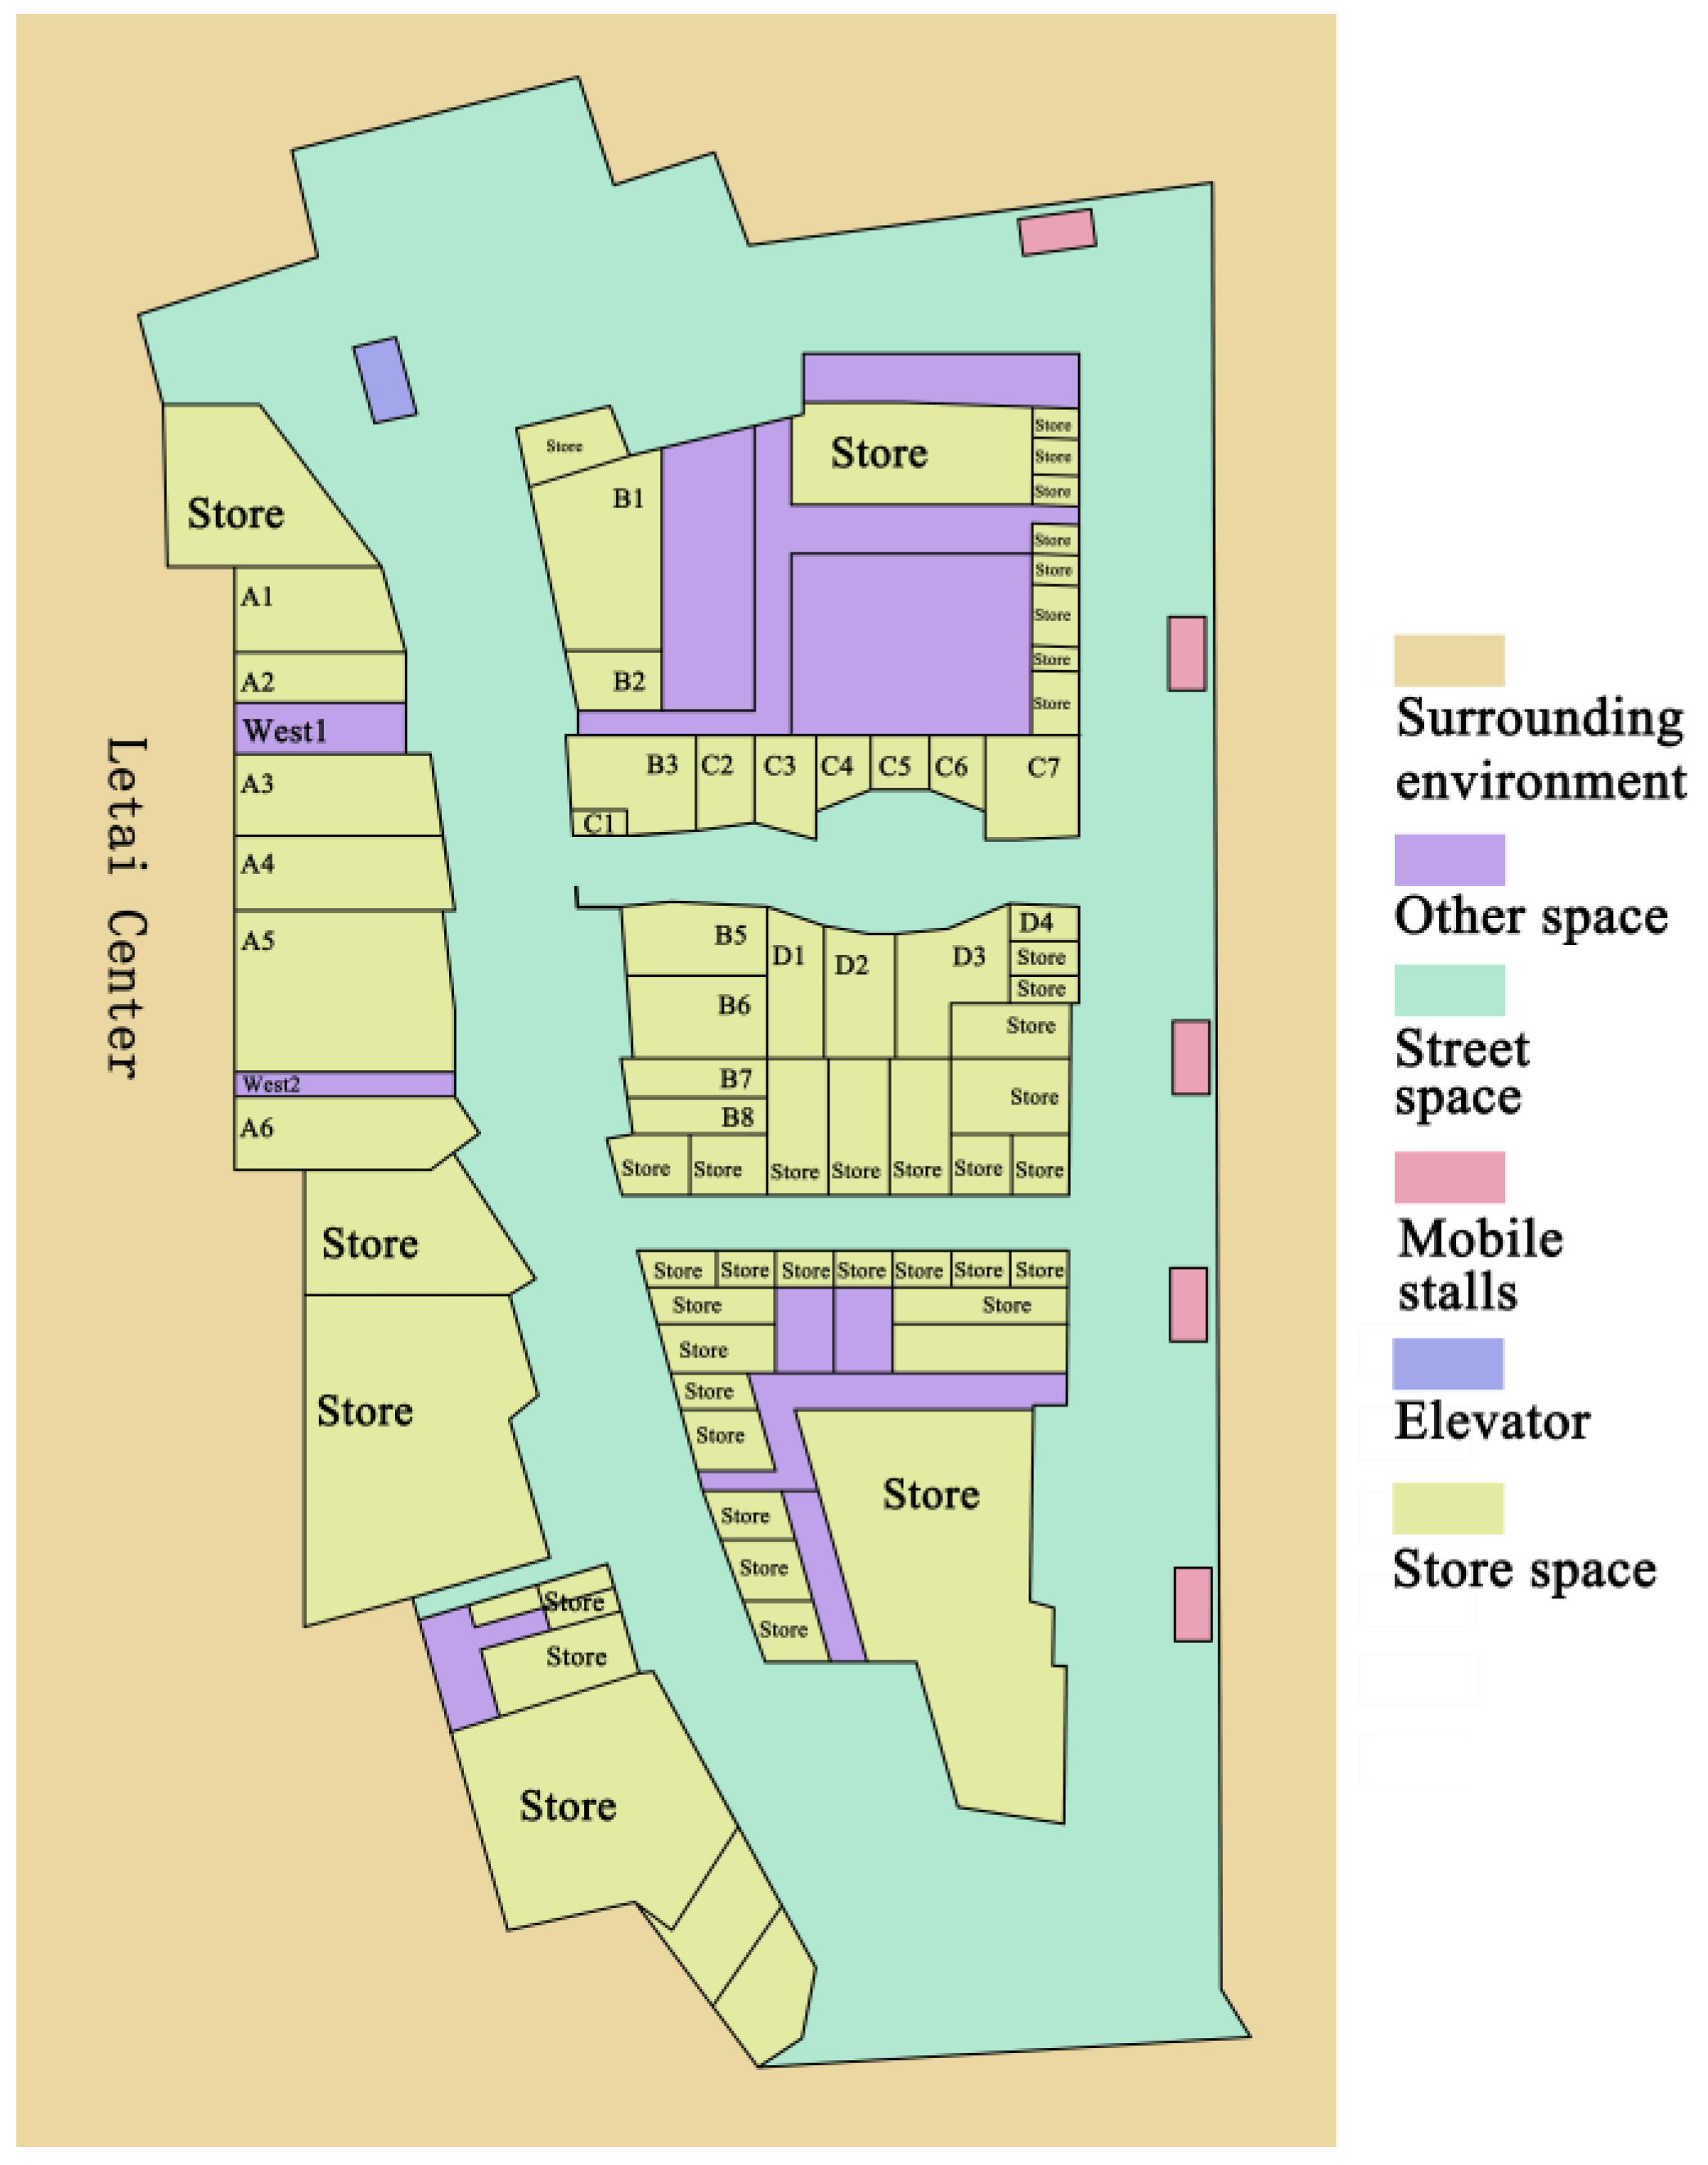
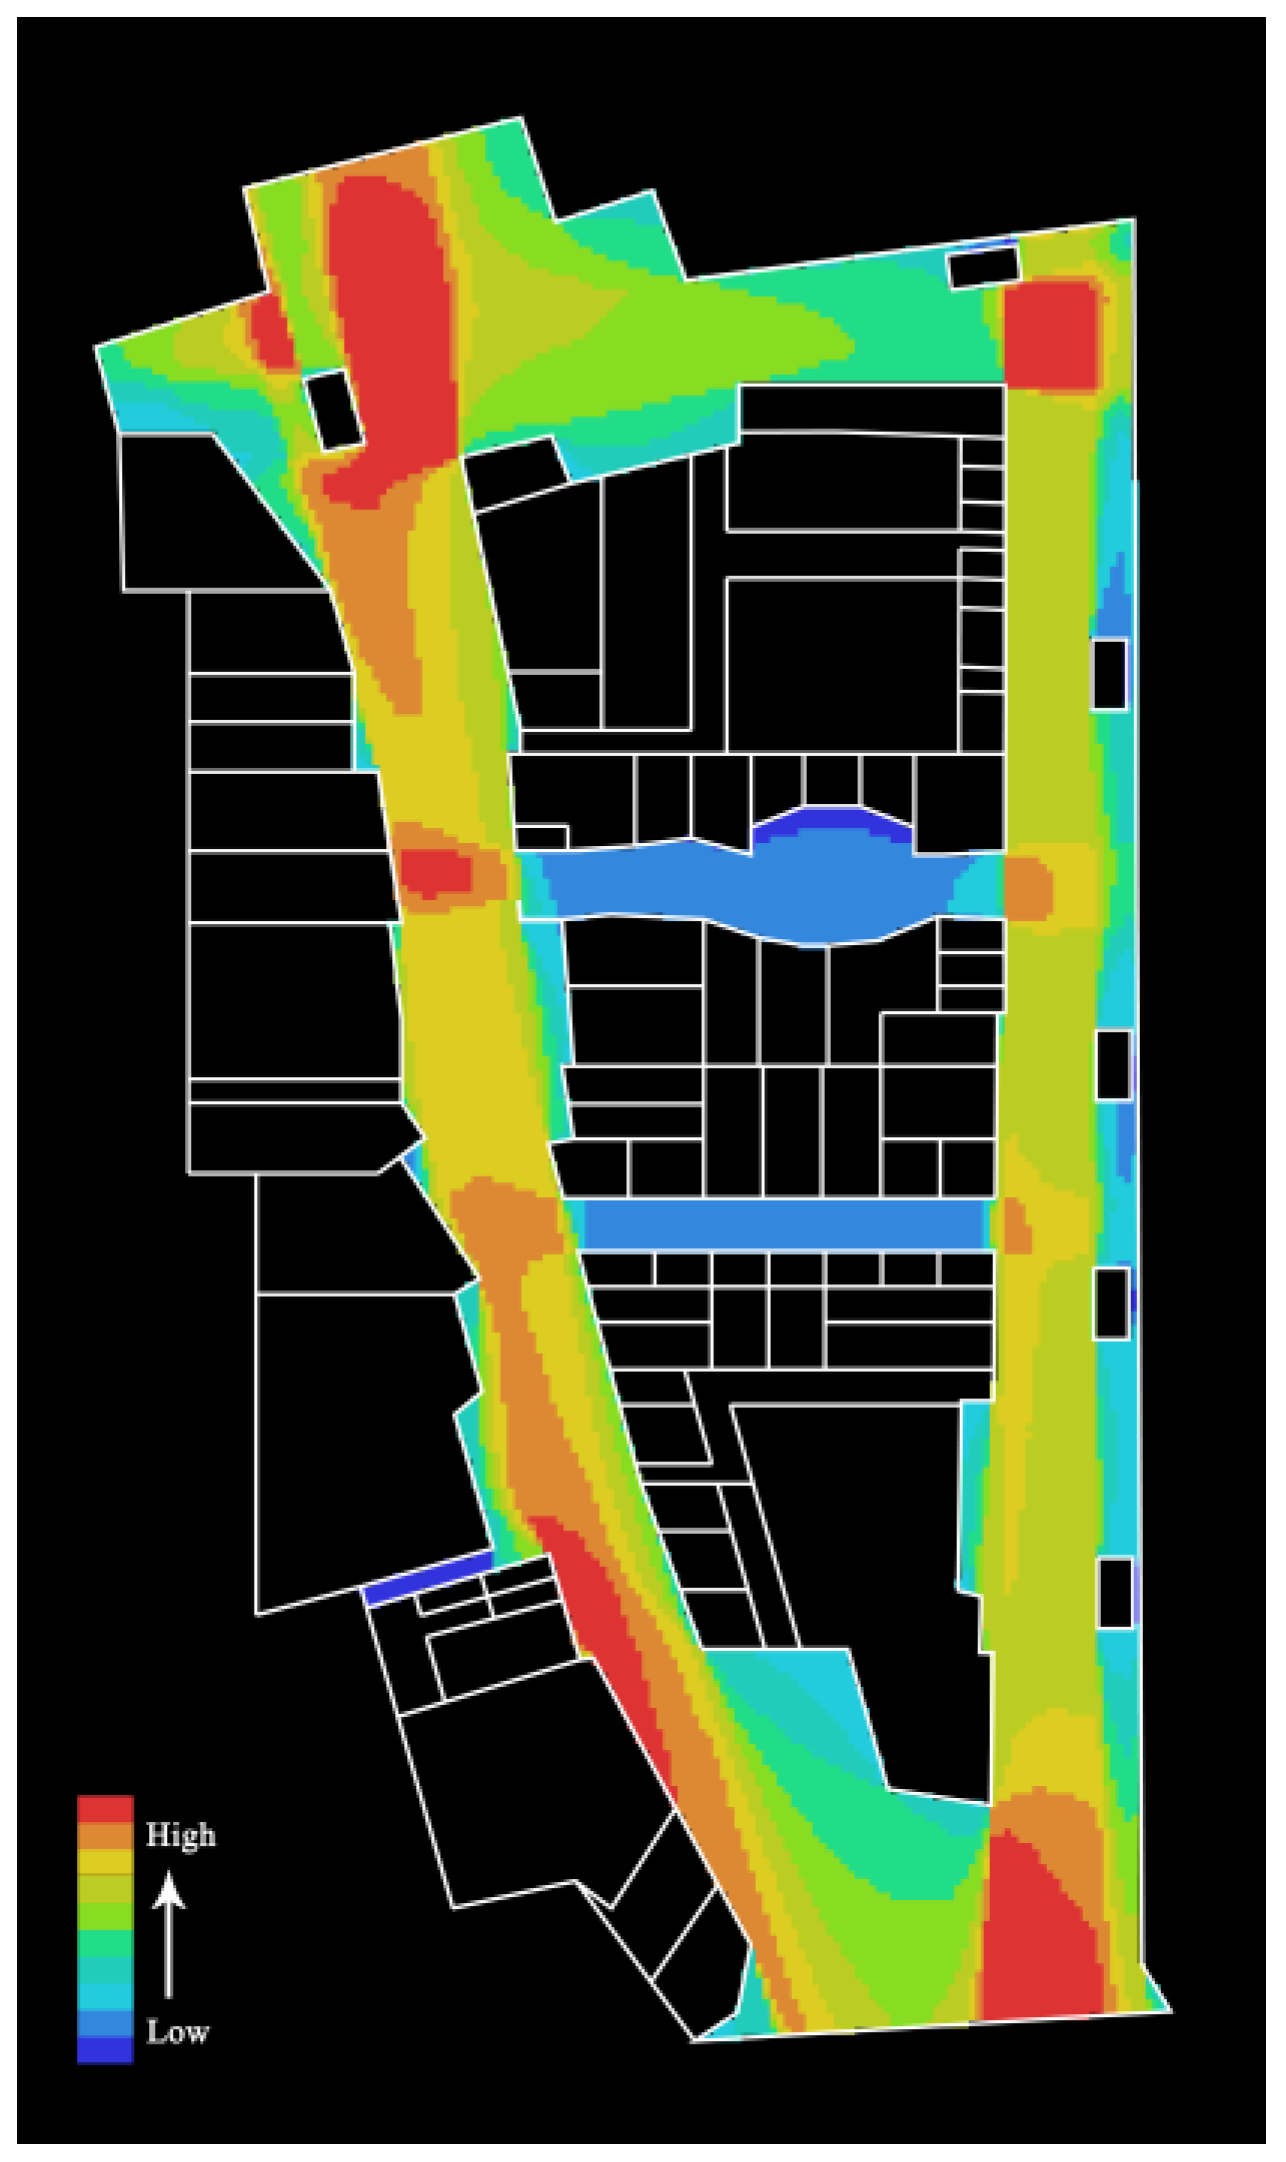


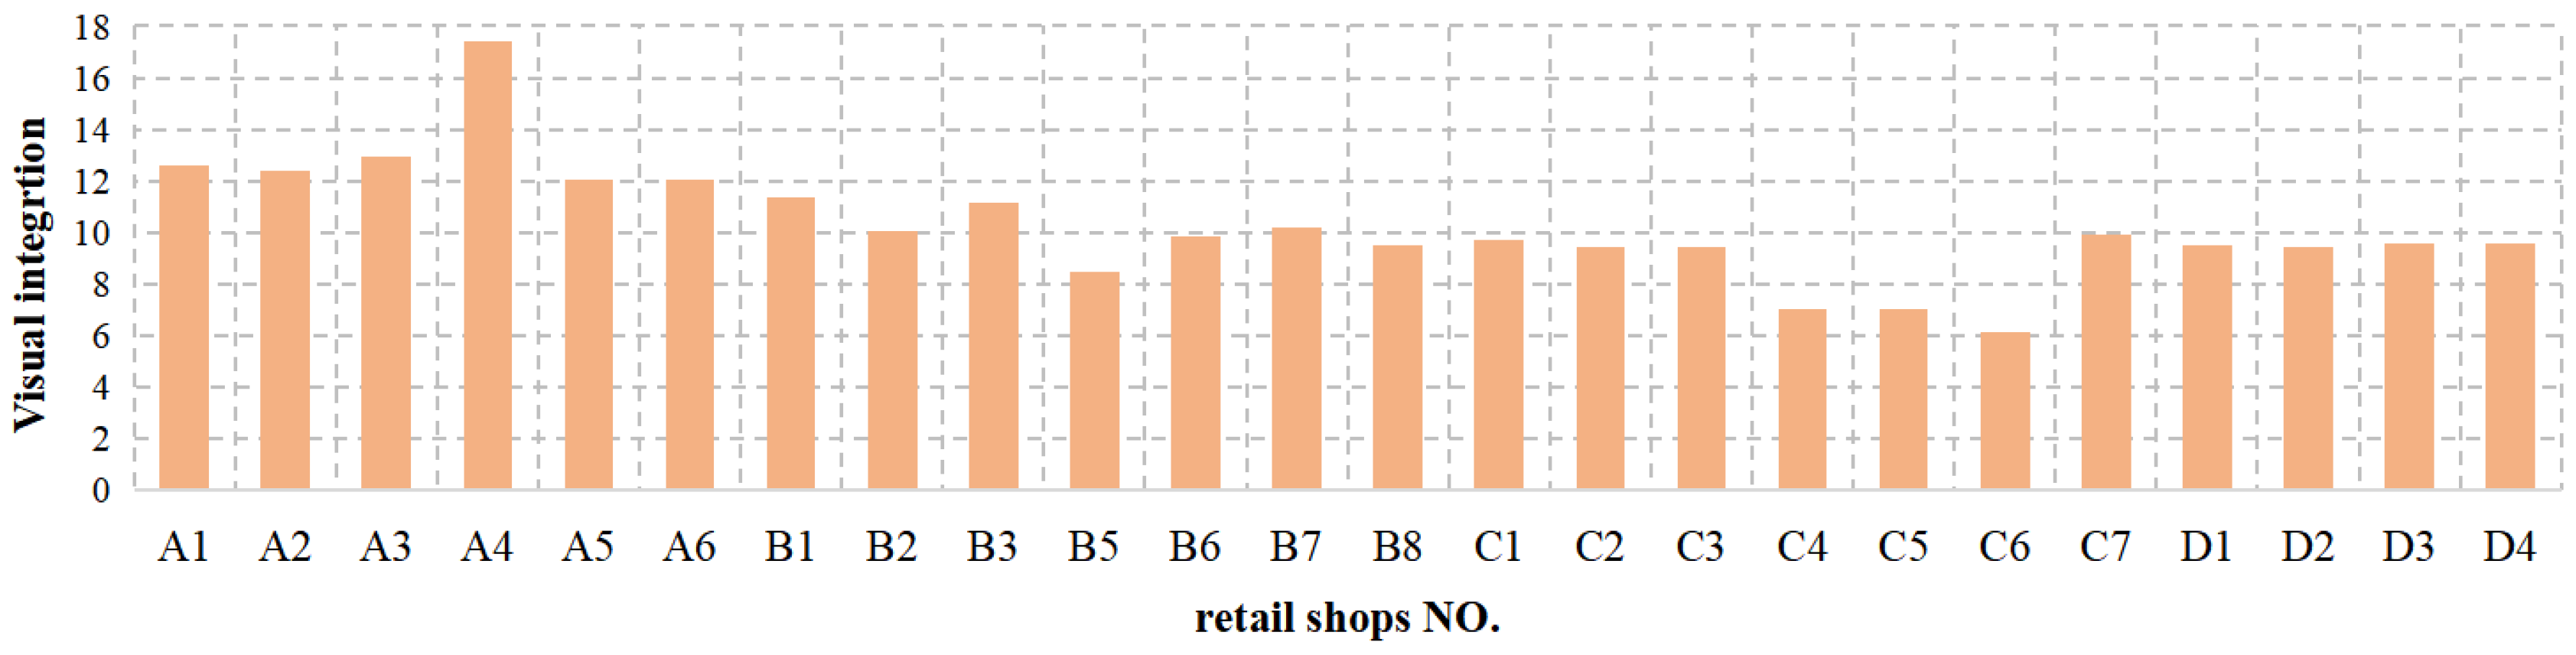

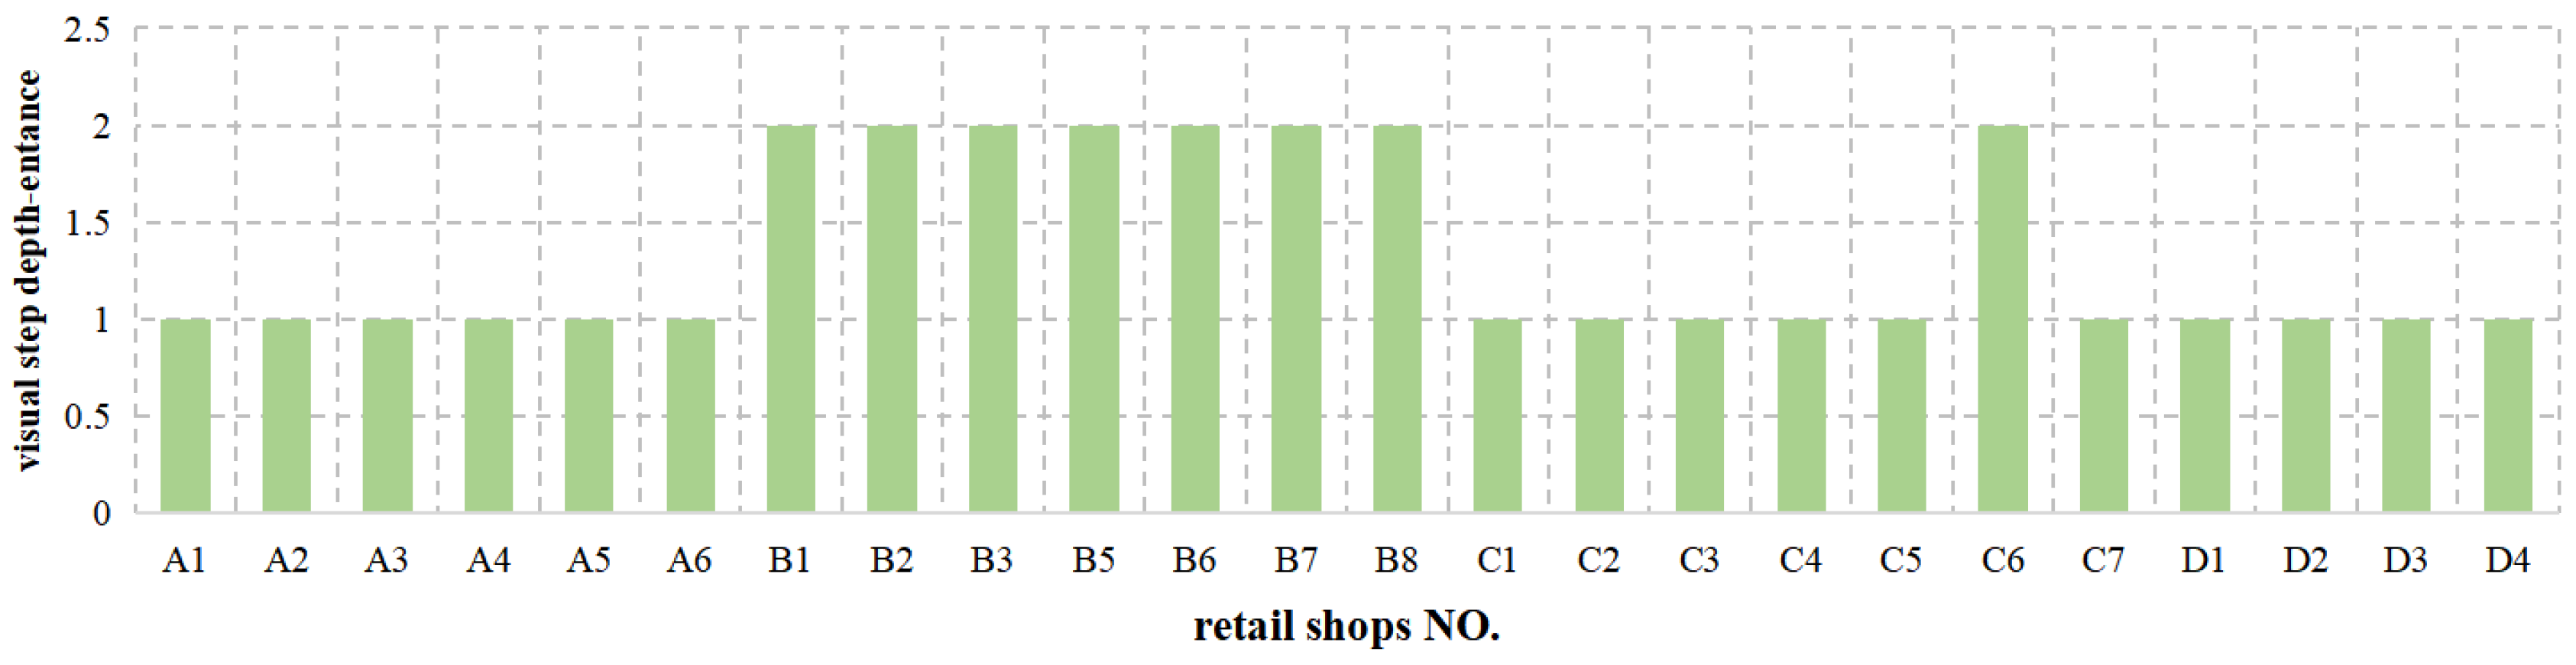
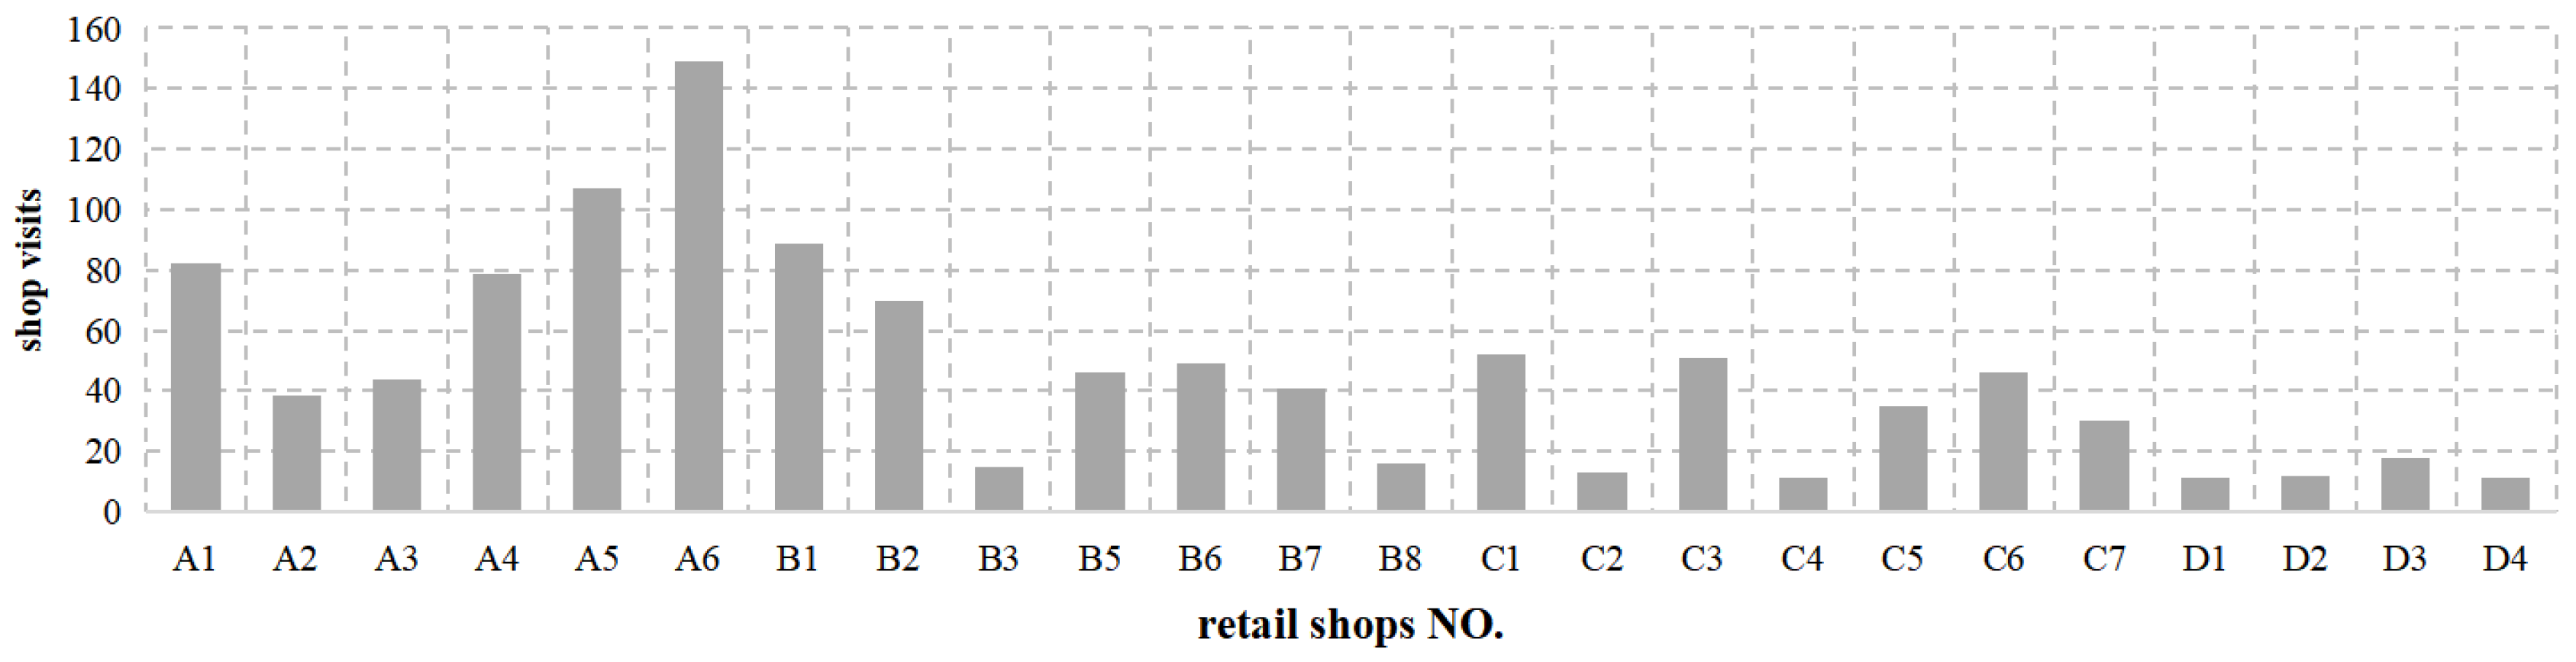
Disclaimer/Publisher’s Note: The statements, opinions and data contained in all publications are solely those of the individual author(s) and contributor(s) and not of MDPI and/or the editor(s). MDPI and/or the editor(s) disclaim responsibility for any injury to people or property resulting from any ideas, methods, instructions or products referred to in the content. |
© 2023 by the authors. Licensee MDPI, Basel, Switzerland. This article is an open access article distributed under the terms and conditions of the Creative Commons Attribution (CC BY) license (https://creativecommons.org/licenses/by/4.0/).