Article

Evaluation and Optimization of Urban Public Space Accessibility for Residents’ Satisfaction: A Case Study of Nanshan District, Shenzhen City

1
School of Architecture and Urban Planning, Beijing University of Civil Engineering and Architecture, Beijing 100044, China
2
Urban Governance and Communication Center of Tsinghua Urban Plan Institution, Beijing 100085, China
*
Author to whom correspondence should be addressed.
Buildings 2023, 13(10), 2624; https://doi.org/10.3390/buildings13102624
Submission received: 2 September 2023 / Revised: 12 October 2023 / Accepted: 15 October 2023 / Published: 18 October 2023
(This article belongs to the Section Architectural Design, Urban Science, and Real Estate)

Abstract

:
In order to meet the people’s growing aspirations for a better life and to improve the efficient supply capacity of the citizens’ diversified needs, our government has made the optimization of the supply of public services in urban communities a key task in urban planning and construction and has taken the community living circle as a starting point to make up for the short boards of urban public services, which is of great practical significance in improving the quality of urban life and optimizing the spatial structure of the city. As an important carrier of urban residents’ public life, urban public open space plays an indispensable role in improving the quality of life of urban residents. Accessibility is an important indicator to characterize the publicity and service level of a public open space. This study focuses on the construction of the community living circle, optimizing the GIS-based, Gaussian, two-part mobile search method to quantitatively calculate and evaluate the accessibility of a public open space within a 500 m walking distance for the residents in Nanshan District, Shenzhen. On this basis, social survey methods, including the questionnaire survey method via a field survey and the interview method, were used to conduct field research on the residents’ accessibility satisfaction. Comparing the differences and correlations between the two results, the deep-seated reasons affecting the residents’ accessibility satisfaction are explored at the levels of the construction system, management services, and structural layout and spatial design of the public open space, and targeted guiding countermeasures are put forward to guide the development and construction of public open space in the future.

1. Introduction

As a kind of public resource, urban public open space (POS) is the main spatial carrier of citizens’ public activities, displaying the history and cultural lineage of a city while improving the life of citizens and meeting the cultural needs of the general public; it is one of the most important spatial elements to support the sustainable development of a city. Public open space is defined as “an outdoor urban space, open to all citizens, free of charge throughout the day, which has been developed and provided with facilities for activities” [1,2]. Accessibility is an important indicator for measuring the service quality of public open space, and in this paper, the accessibility of public open space refers to the number and area of public open spaces that are available or approachable by urban residents within a certain time or spatial range. In recent years, the improvement of urban public open space accessibility and the establishment of quantitative evaluation systems is a major focus of urban development research.
The 15 min city concept was introduced as a post-COVID strategy to support more sustainable recovery from the pandemic, which was initially proposed in 2016 by Carlos Moreno as the “15-Minute City” [3,4]. Under the characteristics of proximity, density, diversity, mixed-use, modularity, adaptability, flexibility, human-scale design, connectivity, and digitalization, it offers a novel perspective of “chrono-urbanism” [5]. However, it has also been argued that in order to avoid gentrification and social exclusion by turning 15 min blocks into inward-looking enclaves, it is not just the core that should be walkable and accessible, but all neighborhoods across the region [6]. Under the concept of the 15 min city, China has further put forward the Technical Guidelines for Community Living Circle Planning, which make “reducing travelling distances and reshaping urban space” the core points of community living circle construction. The time distance of the neighborhoods’ unit is used as the spatial service radius of the community living circle, i.e., a 5–10 min walking distance. Considering the mobility of people of different ages and physical conditions, which corresponds to a spatial range of 300–800 m, it is difficult to accurately define a clear value, so this paper takes the 500 m service radius commonly used in China’s public service facilities as a spatial scale and quantitatively analyzes the accessibility of public space [7].
The 500 m walking accessibility data of public open space calculated based on the Gaussian two-step mobile search method is used to evaluate the areas with excellent to poor accessibility, and the subjective feelings of residents’ accessibility to public open space are investigated via questionnaire surveys, interviews, and field observations, as a supplement to the quantitative analysis of accessibility to validate the results of the quantitative evaluation. By comparing the two results and analyzing the differences and correlations between the two results and their reasons, we will explore the factors influencing the accessibility of public space in terms of residents’ satisfaction and the effectiveness of the construction of community living circles.

2. Literature Review

In recent years, from the perspective of quantitative evaluation on public open space accessibility at home and abroad, current quantitative evaluation methods mainly include the following methods: the ratio method, the nearest-distance method, the method based on spatial interaction, and the method based on the accumulation of opportunities [8,9,10].
The ratio method mainly calculates the ratio of the total number of service facilities to the total number of people served, and the larger the ratio, the better the level of accessibility. Although this method can reflect the overall level of residents’ access to public services, it is unable to reveal changes in the uneven distribution of a population across a large spatial area. The nearest-distance method assumes that residents always choose the nearest-neighboring public service facilities, and the closer the distance, the better the level of accessibility. However, this method cannot simulate the situation of making choices between multiple facilities within a limited time, and it is currently widely used for evaluating accessibility to emergency-type facilities [11]. The method based on spatial interaction is derived from the law of gravity, which holds that there is a mutual gravitational effect between the demand and supply sides, and the gravitational effect decays with an increase in spatial distance; this method is somewhat abstract and more difficult to understand, and at the same time, it is difficult to use this method to express the relationship of the decay of the distance between a facility and a demand point [8,12]. The method based on opportunity accumulation is developed on the basis of the proportional method and the distance method, focusing on estimating the critical value of limited travel distance (or time) and comparing the amount of resources per capita that can be searched by residents within the critical range; the higher the amount of resources per capita, the better the level of accessibility. Various methods based on opportunity accumulation have been developed, including the contour method [8], the mobile search method [13], and the two-step mobile search method [14].
The two-step floating catchment area method (2SFCA) was proposed by Prof. John Radke (University of California, Berkeley, CA, USA) in 2000. It has been continuously improved in recent years and is widely used in foreign countries to evaluate the accessibility of facilities providing public services, such as medical care [15,16,17], education [18,19], parks [20,21,22], and transportation [23].
At present, some researchers have introduced a Gaussian function in the mathematical calculation of the two-step mobile search method and verified that the combination of the two calculations leads to more accurate accessibility results. This method has obvious advantages in the field of accessibility evaluation, but the shortcoming is that the two-step mobile search method cannot reflect users’ subjective feelings [24,25,26].
In recent years, the number of surveys on user satisfaction regarding public open space has also gradually increased, and both resident satisfaction surveys and accessibility evaluation belong to the field of evaluation of public open space quality. Satisfaction research is conducted in a wide range of areas, including tourism [27], shopping [28], income [29], neighborhood environment [30,31], and workplace environment [32]. In terms of the research process, most of the studies first carried out the relevant social surveys via the selection of research subjects and the use of detailed questionnaires and interviews; then, after the analyses of the corresponding mathematical statistics and influencing factors, the results regarding residents’ satisfaction were obtained [33,34,35,36,37].
Satisfaction evaluation aims to understand the subjective feelings of residents who actually use a public open space via the use of an appropriate social survey method. The shortcoming is that this method is more subjective and easily affected by the value orientation and knowledge level of the researcher(s).
To summarize, many scholars at home and abroad have adopted the two-step mobile search method to quantitatively evaluate the accessibility of public open space, which has obvious advantages in the field of accessibility evaluation, but the shortcoming is that the two-step mobile search method cannot reflect the subjective feelings of users. In recent years, the number of surveys on user satisfaction of public open space has also increased, which can provide insight into the real feelings of residents from their point of view, but the shortcoming is that this method is more subjective and is easily affected by the value orientation and knowledge level of the researcher(s). At present, there is no relevant research that combines the two-step mobile search method and user satisfaction survey. Therefore, this study conducted a field survey on residents’ satisfaction with the accessibility of public open space based on the quantitative results of the two-step mobile search method and explored the influencing factors of residents’ accessibility satisfaction by comparing the results of the quantitative analysis and the satisfaction survey.

3. Materials and Method

3.1. Materials

The basic data included three aspects: urban public open space data, building and population distribution data, and urban-road spatial information data. The public open space data of Nanshan District were derived from the Public Open Space Planning of Shenzhen Special Economic Zone (Shenzhen Municipal Commission of Planning and Land Resources, 2006), Shenzhen Parks Inventory in 2022 (Shenzhen Municipal Bureau of Urban Management and Comprehensive Law Enforcement, 2023) [38]. The building and population distribution data, based on the Shenzhen Building Information Census data in 2022, were extracted from the residential building data (categorized into general residences and villages in the middle of the city), and after being combined with satellite remote sensing images and street maps at the December 2022 time point, as well as field surveys (Figure 1 and Figure 2), the residential building data were adjusted and updated. At present, China’s urban population statistics take the community as the smallest unit, and scholars in China have reported that the community population in Nanshan District has a significant correlation with the general residential floor area and the residential floor area of urban villages in the community via analysis using a multiple regression model [39]. In this study, the community population statistics of the Seventh National Census Data of Nanshan District in 2021 [40] and the general residential building and urban village building statistics of the community in 2022 were used. A linear regression analysis using the census population and residential building area can obtain the following multiple regression equation (Sig < 0.005) via SPSS linear regression analysis:
P = 0.019 × An + 0.042 × As.
In this formula, P is the estimated population of the community; An is the general residential building area within the community; and As is the construction area of private houses in urban villages within the community. From the formula, it can be seen that for general residential buildings, every 100 m2 of building area accommodates a population of 1.9 people. Every 100 m2 of private houses in urban villages accommodates a population of 4.2 people. This formula can be used to directly calculate the number of residents in each residential building to facilitate the statistical analysis of the number of people being able to access each public open space.
By mapping the roads in Nanshan District in the year 2022, the road level was categorized into highway; urban expressway, which is a main road; urban secondary road; urban branch road; and internal road of a residential area.

3.2. Methods

3.2.1. Calculation Steps of Gaussian Two-Step Mobile Search Method

The two-step mobile search method based on opportunity accumulation, which was used in this study, can be improved on the basis of a comprehensive consideration of travel distance, service population, and public open space area; this method can be combined with a regression equation analysis involving a variety of variables to measure the differences in public open space accessibility for people with different incomes and social statuses.
The accessibility calculation model of the Gaussian two-part mobile search method can be realized using a combination of ArcGIS (10.2) and Excel (2013) software, as shown in Figure 3, and the specific operation process is as follows:
  • By correlating the census data of a community with the data on residential buildings in that community and using the SPSS (27) software to analyze the correlation, it is concluded that the distribution of the population has a strong positive correlation with the distribution of residential buildings, and the corresponding correlation coefficients can be derived. By using this method, the distribution of the population and the number of residents in the whole Nanshan District can be determined, and the precision of this method is accurate at the level of residential buildings.
  • Using the urban road network as the base map, the urban road network is updated against the Baidu map and Google Earth images, including internal roads in residential areas and internal roads in urban villages. The updated urban road network is used as the data source to construct the data analysis network in GIS, and the connectivity is set up, while the main roads’ blocking attribute is set up for urban rapid arterial roads and highways.
  • Residential building data and public open space data are added to the data analysis network, and the network analysis is carried out by taking the public open space data as the facility point, a residential building as the time point, and the 500 m walking range as the interruption value; in this way, we can calculate all traveling paths from a residential building to a public open space, and by deleting duplicate paths, we can calculate how many residential buildings are served by each public open space [41]. Then, we can further calculate how many residents are served by each public open space and the area of a public open space that each resident of Nanshan District can access, which is the accessible per capita area of public open space.
The results are classified according to the relevant standards of Shenzhen, and the four levels of accessibility, namely excellent, good, poor, and none, are distinguished by four colors.

3.2.2. Optimization to Improve the Accuracy of Quantitative Calculation of Public Space Accessibility

First, we increased the space forms carrying the functions of a public open space, enriched the types of public open space covered, and increased the types of commercial public open space, country parks, and university campuses so that the results of the study would be more in line with the residents’ behavioral habits of using public open spaces. Second, the road network density in the encrypted network data set was encrypted to maximize the restoration of the real urban road network. In a previous study, the urban road network could only be accurate to the level of urban branch roads, and the roads inside residential areas and urban villages could not be accurately determined (except for individual large residential areas), while the lack of some road network data had a great impact on the calculation results. Therefore, in this study, the urban road network in the building census data was used as the base map, and the urban road network was updated against the Baidu map, Google Earth images, and UAV aerial map images, including internal roads in residential areas and in urban villages. Individual areas obscured by buildings were supplemented with road information via the field surveys. The density of the urban road network in the encrypted network data set maximizes the restoration of the real urban road network and increases the accuracy of the calculation results. Finally, we changed the line expression of the blocked road; as shown in Figure 4, the single line was changed to three lines, in which the center line is an intermittent single line; the crossing bridges, underpasses, crosswalks, and other crossing channels are divided and not connected to the center line; the two sides of the line form a continuous single line; and the crossing channels are connected to the simulation of the arterial road blocking, with only the intermittent center line being set as a linear obstacle. After improving the arterial road blocking algorithm, the path along the side of the road is preserved, the attribute of the road width is reflected, and the crossing pedestrian accesses such as urban overpasses, underpasses, and crosswalks are also reflected; thus, the accessibility results obtained are more accurate.

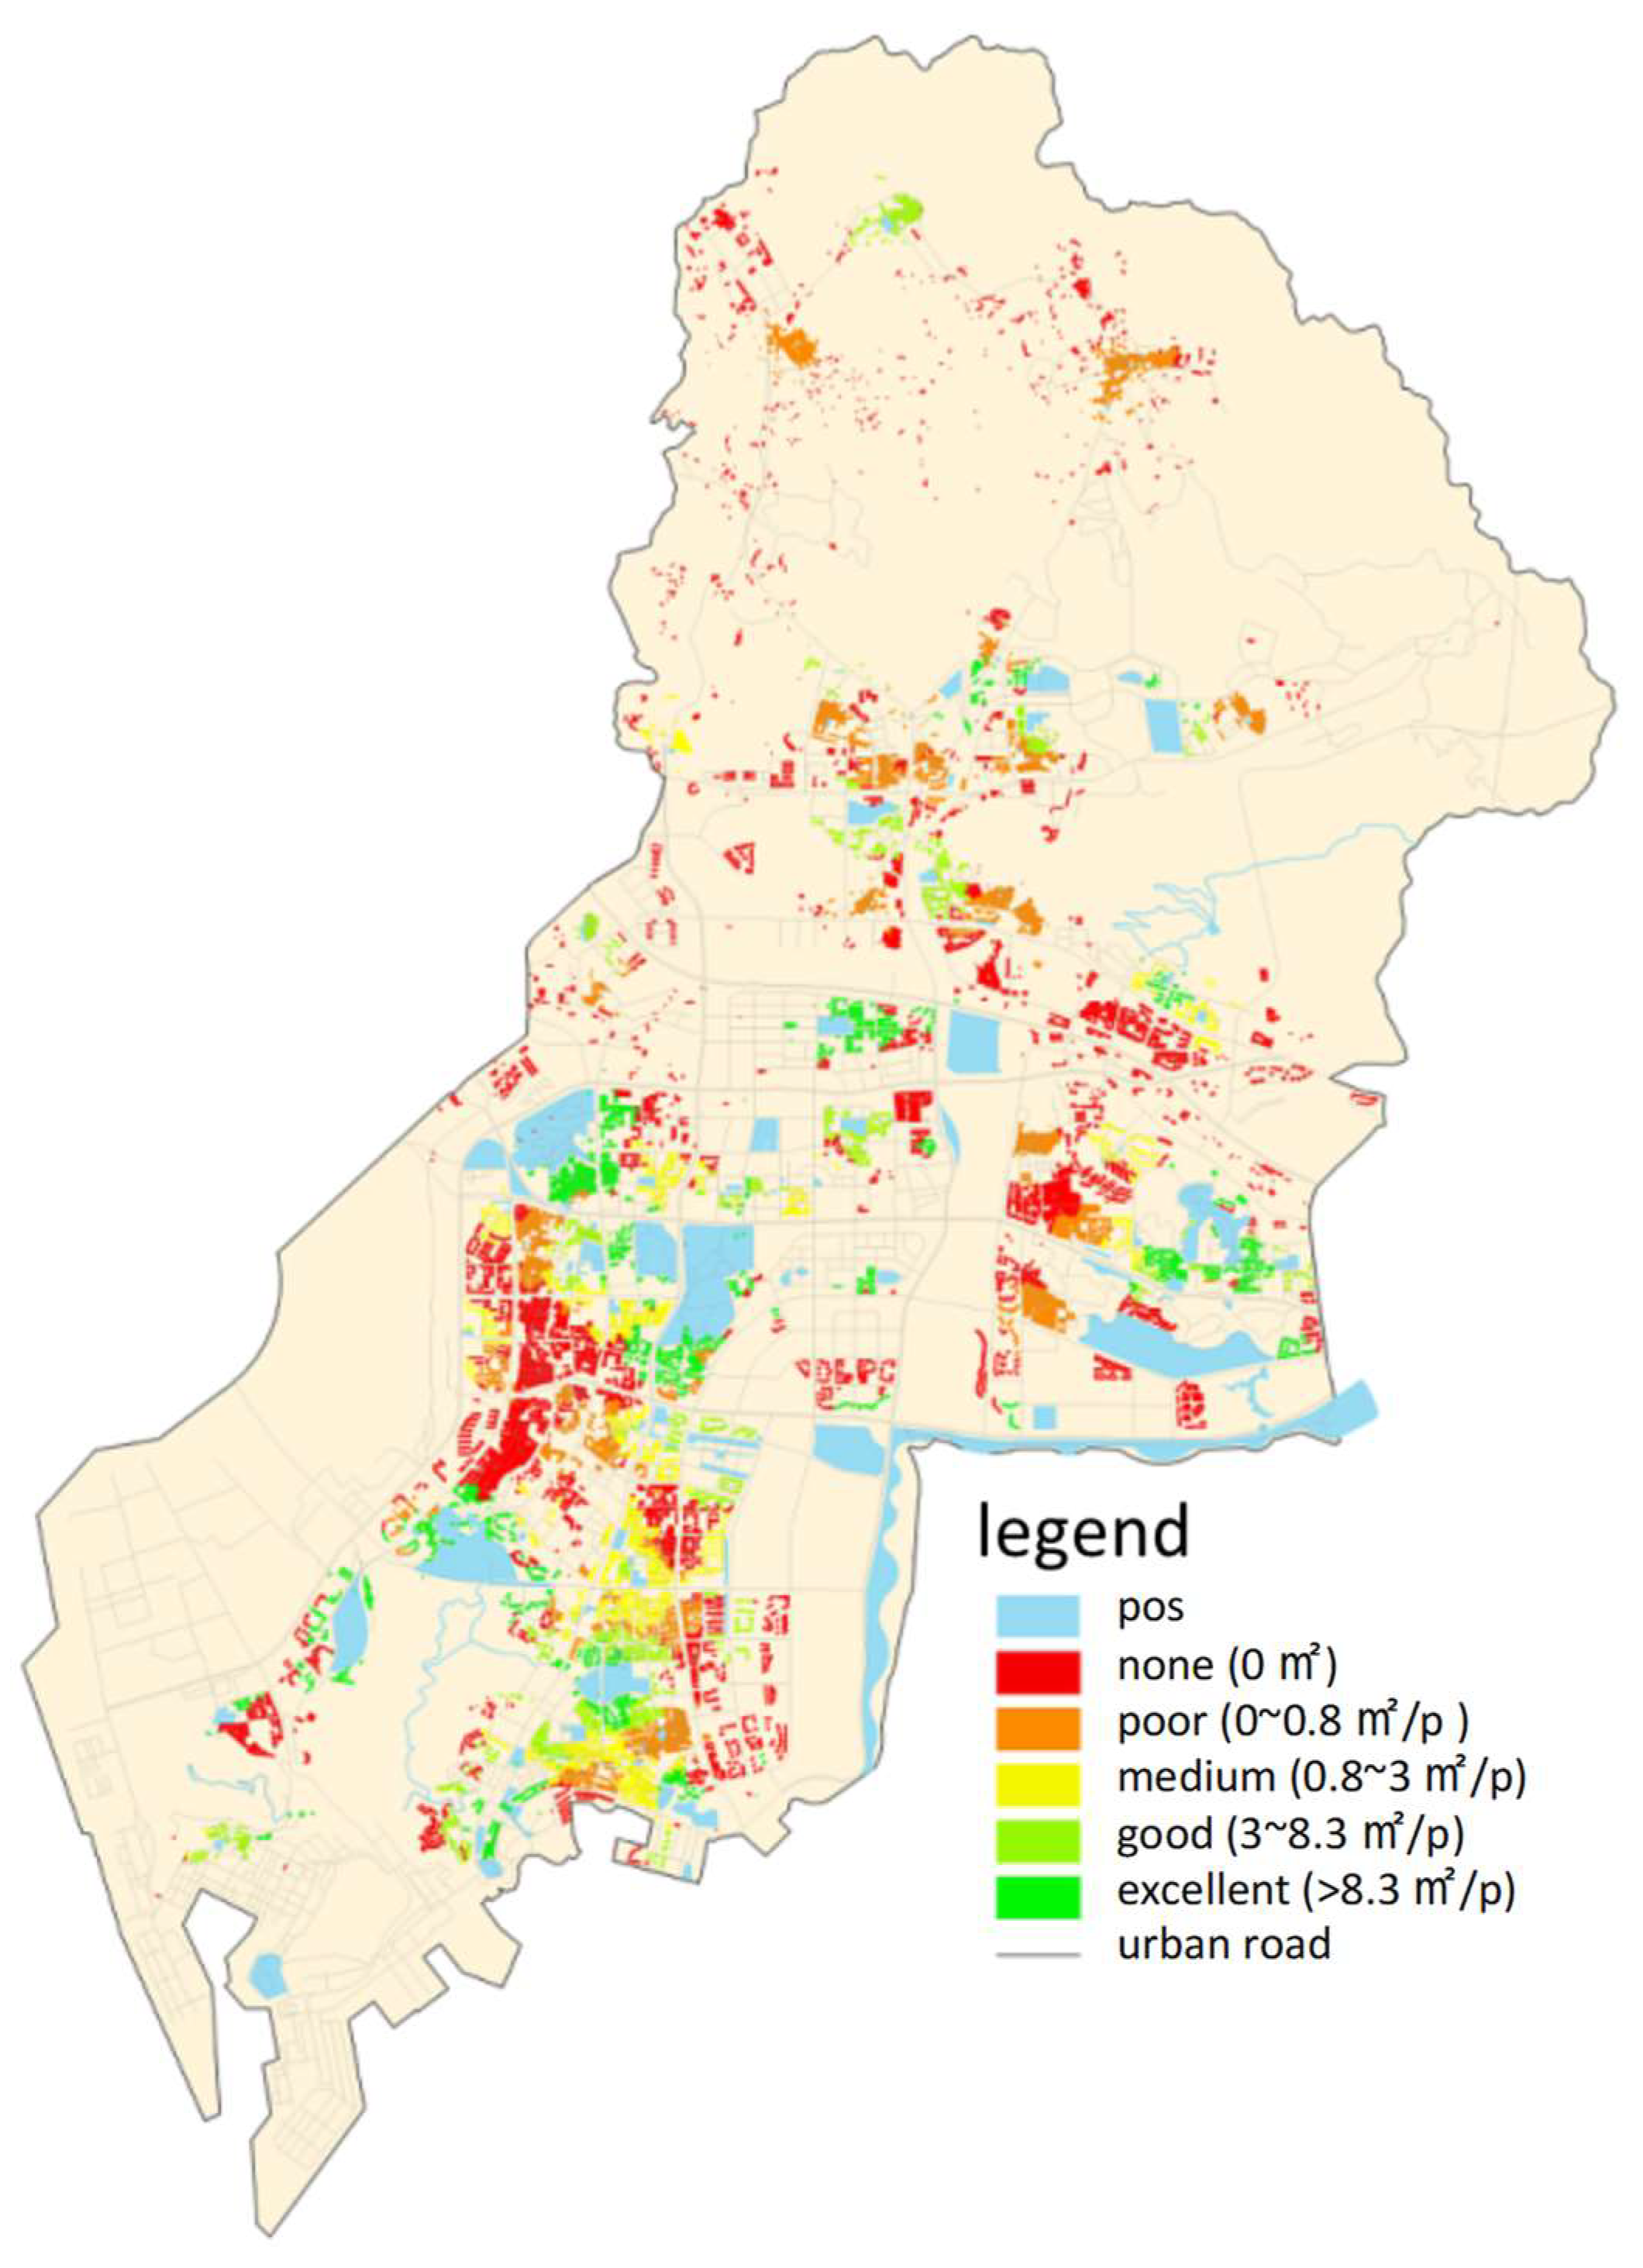
3.2.3. Quantitative Results of Public Space Accessibility Calculations

According to the multiple regression equation, the permanent population of Nanshan District in Shenzhen in 2022 was 1.7958 million. As shown in Figure 5a, the population of Nanshan District is mainly concentrated in the area south of the Guangzhou Shenzhen Expressway. The red patch area shows a population kernel density greater than 50,000 people/km2. According to the GIS analysis, the population nuclear density in Nanshan District is greater than 50,000 people/km2. There are six areas in the district mainly consisting of residential buildings in urban villages, as shown in the residential distribution map in Figure 5b.
As calculated via the GIS analysis, the number of Nanshan residents who can reach a public open space within a 500 m walk is 111,7925, accounting for 62.25% of the total population of Nanshan, and more than one-third of Nanshan residents who do not have any public open space to use within a 500 m walk is 677,933, accounting for 37.75%.
According to the area indicator stipulated in the 2006 Shenzhen Special Economic Zone Public Open Space Planning, which stipulates the standard for the allocation of public open spaces, the area of an independently occupied public open space should not be less than 0.8 m2/person, and the ideal value should be 8.3 m2/person. The accessibility index is divided into excellent (>8.3 m2/person), good (3~8.3 m2/person), medium (0.8~3 m2/person), poor (0~0.8 m2/person), and none (0 m2) at six levels. The per capita public open space accessible area for residents of Nanshan was calculated, and the results of the calculation are shown in Figure 6.
In terms of spatial layout, most of the residential building areas in Nanshan District are shown in red and orange (characterizing areas with no or poor accessibility). Areas of residential buildings with poor accessibility are more widely distributed. The inaccessible areas (red areas) are mostly concentrated in urban villages with a high population density, followed by most areas north of the Guangzhou–Shenzhen Expressway, due to the fragmentation of urban construction land by mountains and lakes, resulting in the dispersed layout of residential buildings and leading to poor accessibility as a whole. The areas with better accessibility are mainly distributed in the periphery of large-scale public open spaces, and they are connected to these public open spaces via smooth urban roads.
From the perspective of walking paths, as shown in Figure 7, the green paths are the paths that Nanshan District residents can take to reach a public open space within a 500 m walk, of which the red paths are the high-frequency and important walking channels connecting public open spaces in the city, carrying a large number of travel demand, which can be regarded as a kind of striped public open space network and provides the spatial continuation of public open spaces at the street level. These paths play an important role in connecting residential buildings and public open spaces as a whole. Based on the statistics of the number of people passing through the flyovers and underpasses of the district’s barrier arterial roads, it can be concluded that there is a high frequency of use of these cross-street channels, flyovers have become an important connection channel in the area, and a reasonable choice of flyover location can play an important role in connecting the blocked areas.
By comparing the number of people in each class of accessibility before and after considering trunk road blocking, the analysis shows that trunk road blocking has a lesser impact on public open space accessibility. Most of the areas are separated by the main road barrier, but there are one or more public open spaces in each sub-district, and a large number of residents in these areas can satisfy their needs for public open spaces without crossing the barrier road.

3.2.4. Field Survey Data on Residents’ Accessibility Satisfaction

In this study, based on the quantitative evaluation results calculated using the GIS, we conducted a field survey on the residents’ accessibility satisfaction, compared the field research results with the GIS quantitative results, and analyzed the differences and correlations between the two sets of results. The survey adopted a variety of social research methods, including questionnaire research, interview research, and on-site survey, to conduct in-depth research on the subjective feelings of Nanshan District residents regarding the use of public open space, the characteristics of the habits of use, and the problems existing in the management and operation of public open space as a supplement to the quantitative analysis of accessibility of public open space.
The five main principles of research location selection are as follows:
  • Residential neighborhoods with better or worse accessibility;
  • Urban villages with better or worse accessibility;
  • Areas with large differences in accessibility in the same parcel;
  • Areas with zero accessibility due to the blockage of urban roads;
  • The selected survey areas should be evenly distributed in the whole Nanshan District as far as possible.
A total of 30 survey areas were delineated in this research, which were scattered in the eight streets under the jurisdiction of Nanshan and covered a variety of settlement types, such as urban villages, high-grade residential areas, and general residential areas, as well as smaller residential areas with no internal green space, residential areas with a large area of internal green space and activity venues, residential buildings around a commercial-type public open space, residential buildings near a countryside-type public open space, and the university campus. The goal was to cover different situations of public open space and residential areas.
The questionnaire content was designed to be oriented to three main purposes:
  • To verify the quantitative evaluation results of the GIS analysis;
  • To investigate the behavioral habits and demand characteristics of residents using public open spaces, and to determine areas with large differences in accessibility in the same parcel;
  • To explore the problems of public open space construction and layout.
The research plan was to administer 40 questionnaires in each region, with a total of 1200 questionnaires in the 30 regions. In total, 1160 questionnaires were administered and 1037 questionnaires were recovered, which is a 90% valid questionnaire rate. The results show the following:
  • The degree of demand for public open space: As the residents’ willingness to use a public open space is higher, the frequency of use will increase accordingly, and the demand for a better-quality public open space will also increase; the degree of demand for public open space is higher for those who have more leisure time at their disposal after work. The questionnaire survey was conducted as a statistical study on the degree of demand for public open space by Nanshan residents, and the demand was divided into five grades from the highest degree of demand to the lowest in the following order: not needed, general, more needed, needed, and indispensable; this survey was conducted to explore the degree of demand for public open space in the subjective consciousness of residents. Based on the statistical analysis, 76.8% of the survey respondents have a high degree of demand for public open space, of which the proportions indicating needed and indispensable are 43.9% and 12%, respectively. Thus, the data show that public open space plays a more important role in the daily life of Nanshan residents, and nearly 80% of the surveyed residents of Nanshan indicated that they have a high degree of demand for public open space.
  • Frequency of use and distance perception: By analyzing the frequency of use of public open space by residents, we could analyze the behavioral characteristics of residents’ use of public open space. Drawing on the definition of frequency of use in the Shenzhen Special Economic Zone Public Open Space Plan, we classified the frequency of use into the following four levels: hardly go (less than 1 time/week), less often (1–2 times/week), often go (3–5 times/week), and go every day (6–7 times/week). We set up a jumping question on top of this question: if the option of hardly go (less than 1 time/week) was checked, the survey respondents were directed to the question asking the reasons for not going to public open spaces. Using 1–2 times per week as a measure of regular activity, the sum of survey respondents selecting the categories of less frequent (1–2 times/week), frequent (3–5 times/week), and every day (6–7 times/week) accounted for 81.7% of the total number of survey respondents.
Regarding the evaluation of the attractiveness of the public open spaces frequented by the survey respondents, the sum of the proportions of those who considered the public open spaces frequented by them as “somewhat attractive” and “very attractive” was 86.7%, showing the attractiveness of the public open spaces frequented by those who use them frequently. It can be concluded that a public open space that people frequently use has a strong attractiveness and people are willing to spend time on activities in such a public space, which leads to the conclusion that there is a high positive correlation between the attractiveness of a public open space and the frequency of its use by residents. Combined with the results of the interviews, it can be seen that there is no clear correspondence between the residents’ subjective feelings of distance and walking time. If residents are willing to go to a public open space to carry out activities, it does not matter whether the walking time is 3 min or 25 min or more, as long as the subjective distance judgment is that the public open space is not far away and within the acceptable range. In this case, the public open space will be used frequently. However, the proportion of survey respondents who chose “far away” increased significantly after the walking time exceeded 25 min.
In addition, a considerable portion of the survey respondents walk for 30 min or even up to one hour to reach a public open space. The public open spaces with the highest frequency of walking for such an amount of time to reach are shown in Figure 8. The field survey found that these public open spaces are all large and representative city parks in the district, with landscape design, facilities, and services that are significantly better than other parks, which further demonstrates that a high-quality public open space attracts urban residents to use it, and this increases the frequency of use, travel time, and distance of residents to reach such a public open space.

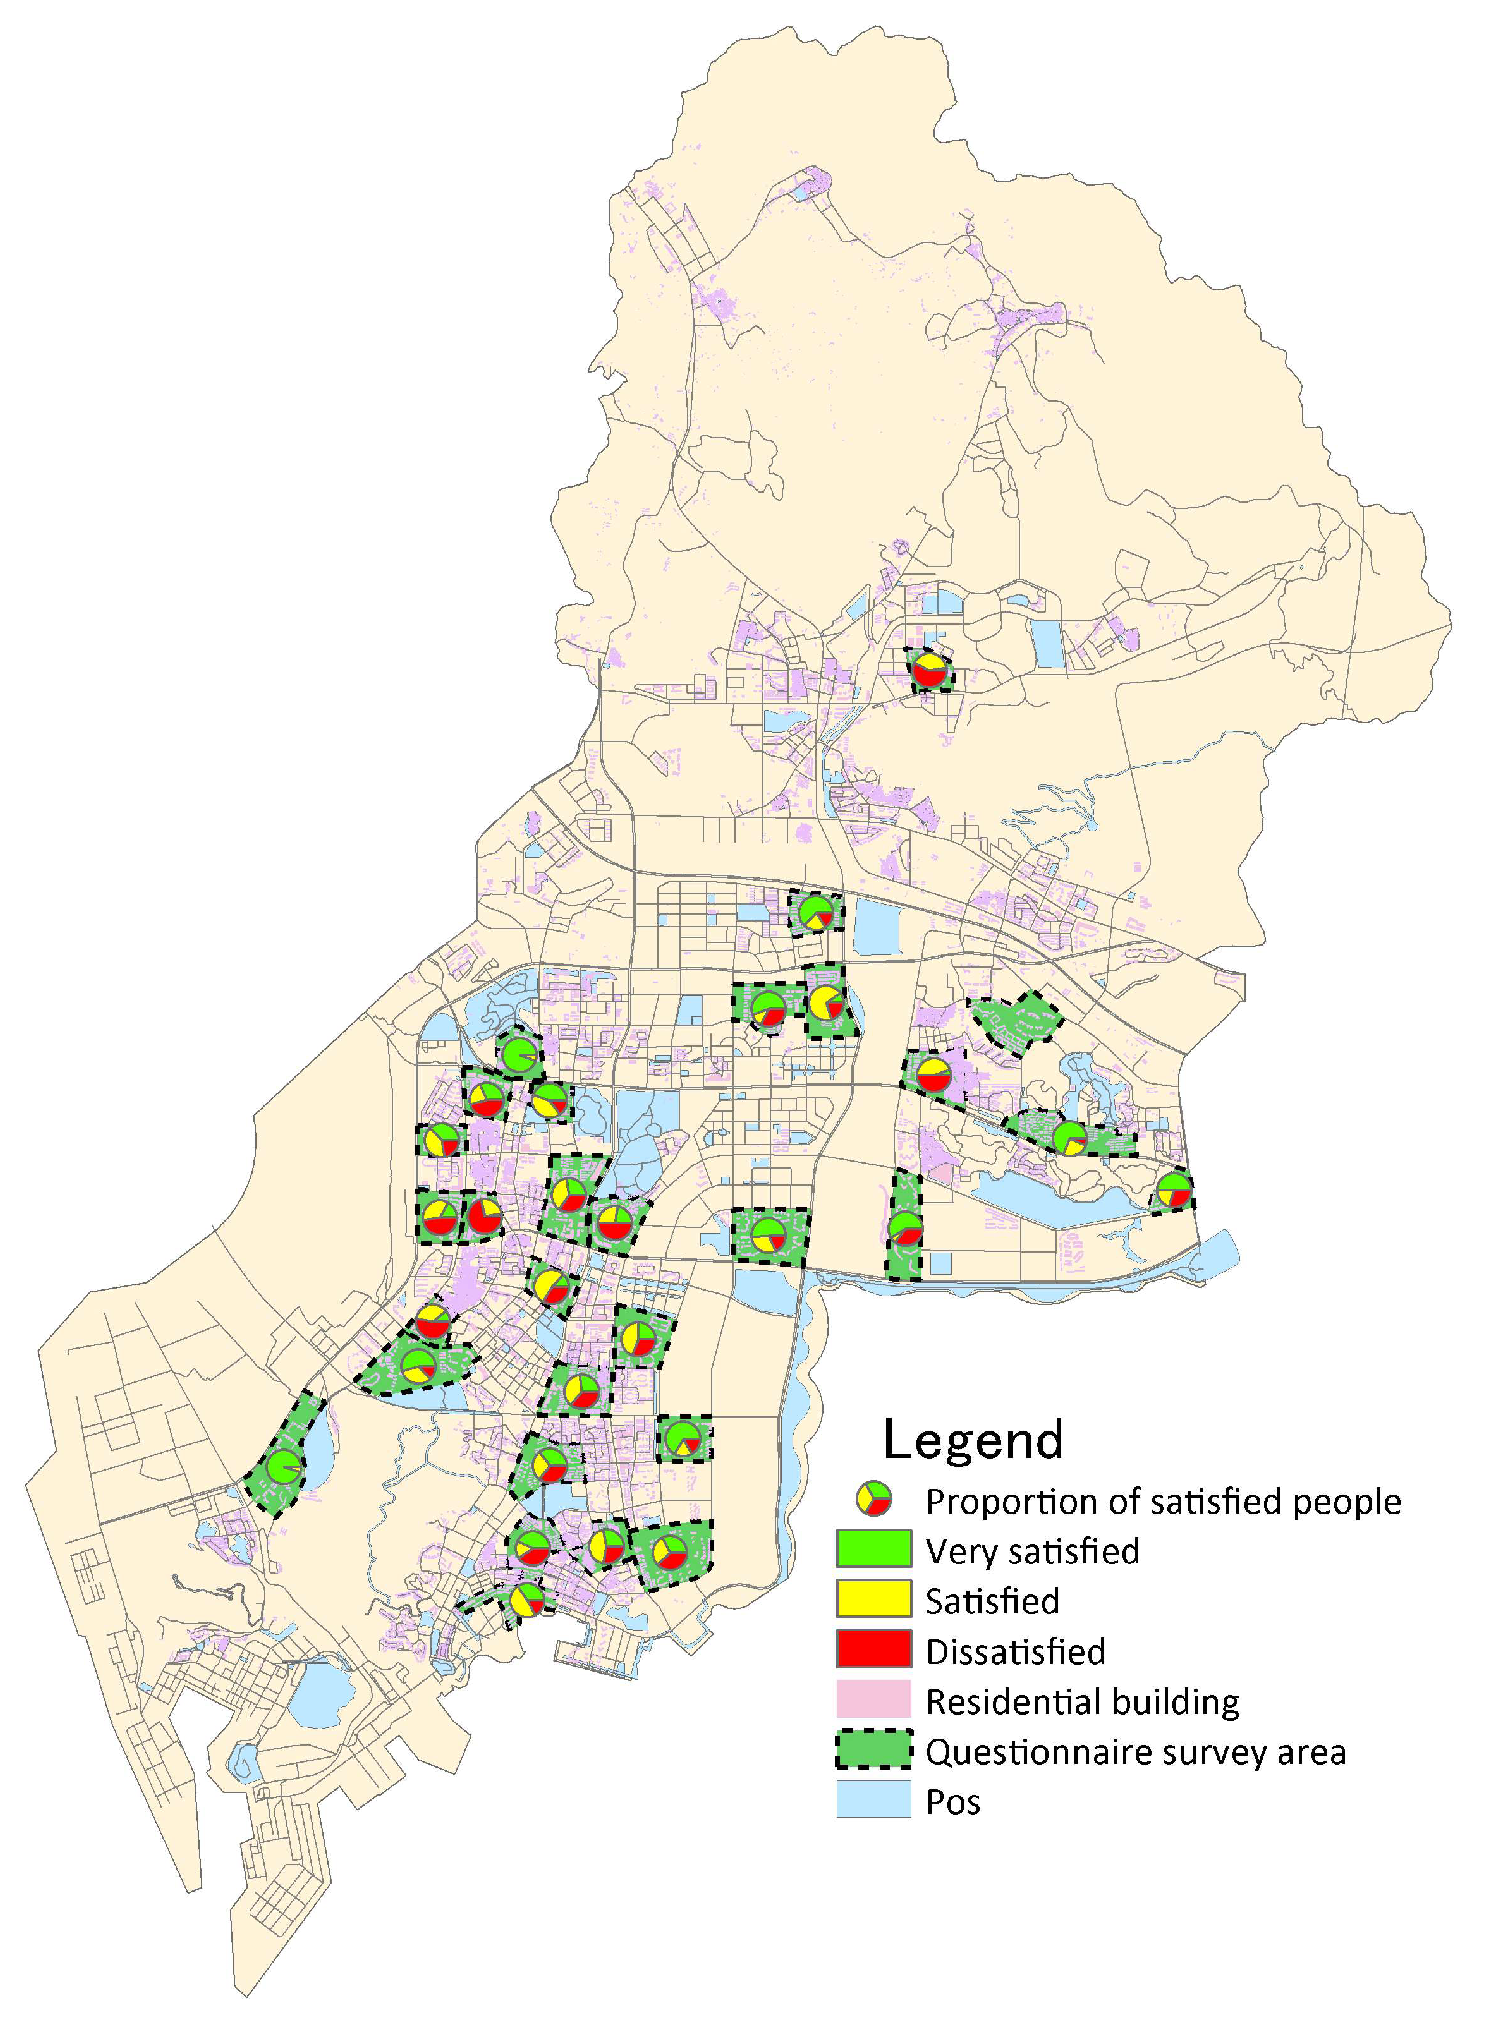
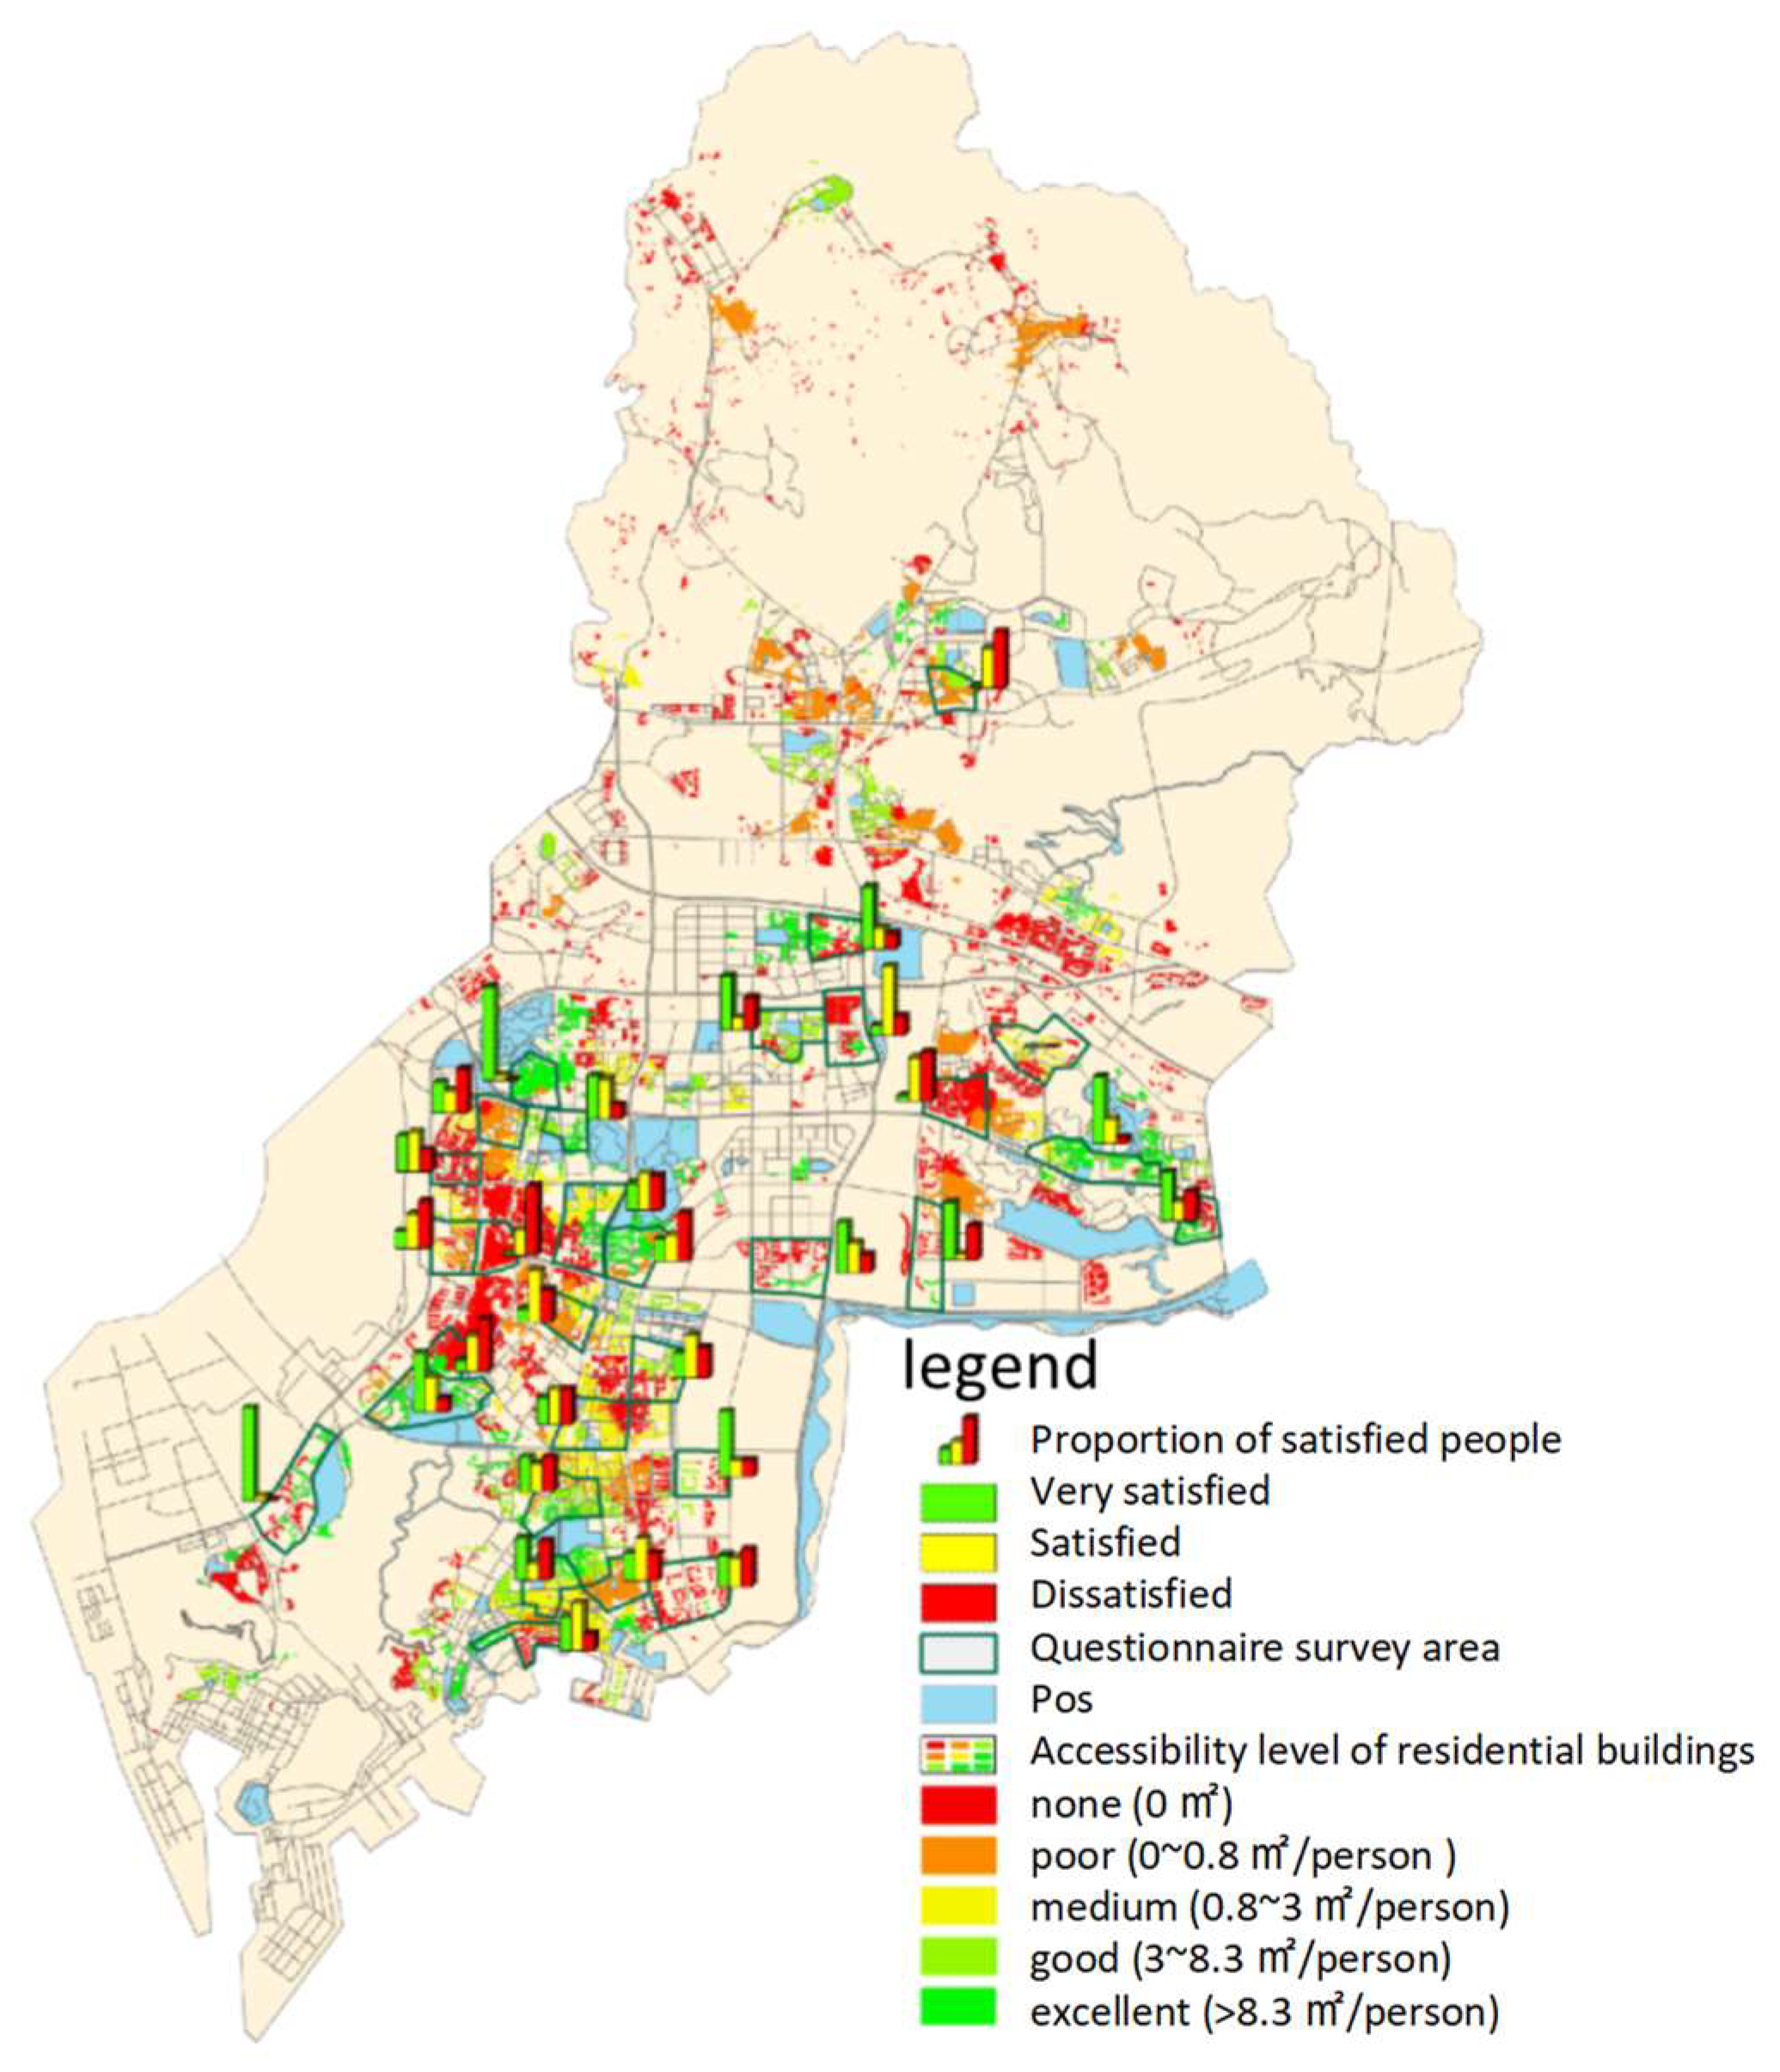
3.2.5. Determination of Satisfaction with Public Open Space Accessibility

Considering that the subjective feelings of residents are influenced more by personal emotional factors, their satisfaction of public open space accessibility was not directly asked in the questionnaire, but was comprehensively evaluated using multiple questions that were superimposed on each other. Based on the quantitative evaluation results, this study divided the per capita accessible area of public open space into four standards: excellent, good, medium, and poor. In the process of determining the subjective satisfaction of residents, it was also necessary to ask the question, “Is the area sufficient?”, as the first-level question, and then the results of the questions that could reflect the residents’ satisfaction were superimposed on the first-level question; in this way, the residents’ satisfaction with the accessibility of public open space in their residential area was obtained and classified into “dissatisfied”, “ satisfied”, and “very satisfied” (Figure 9).
According to the above determination method, we calculated the satisfaction of 1030 survey respondents with regard to the accessibility of public open space around their residential area. The calculation results are shown in Table 1, and the results of each research area are shown in Figure 10.
The distribution of accessibility satisfaction shows the following patterns:
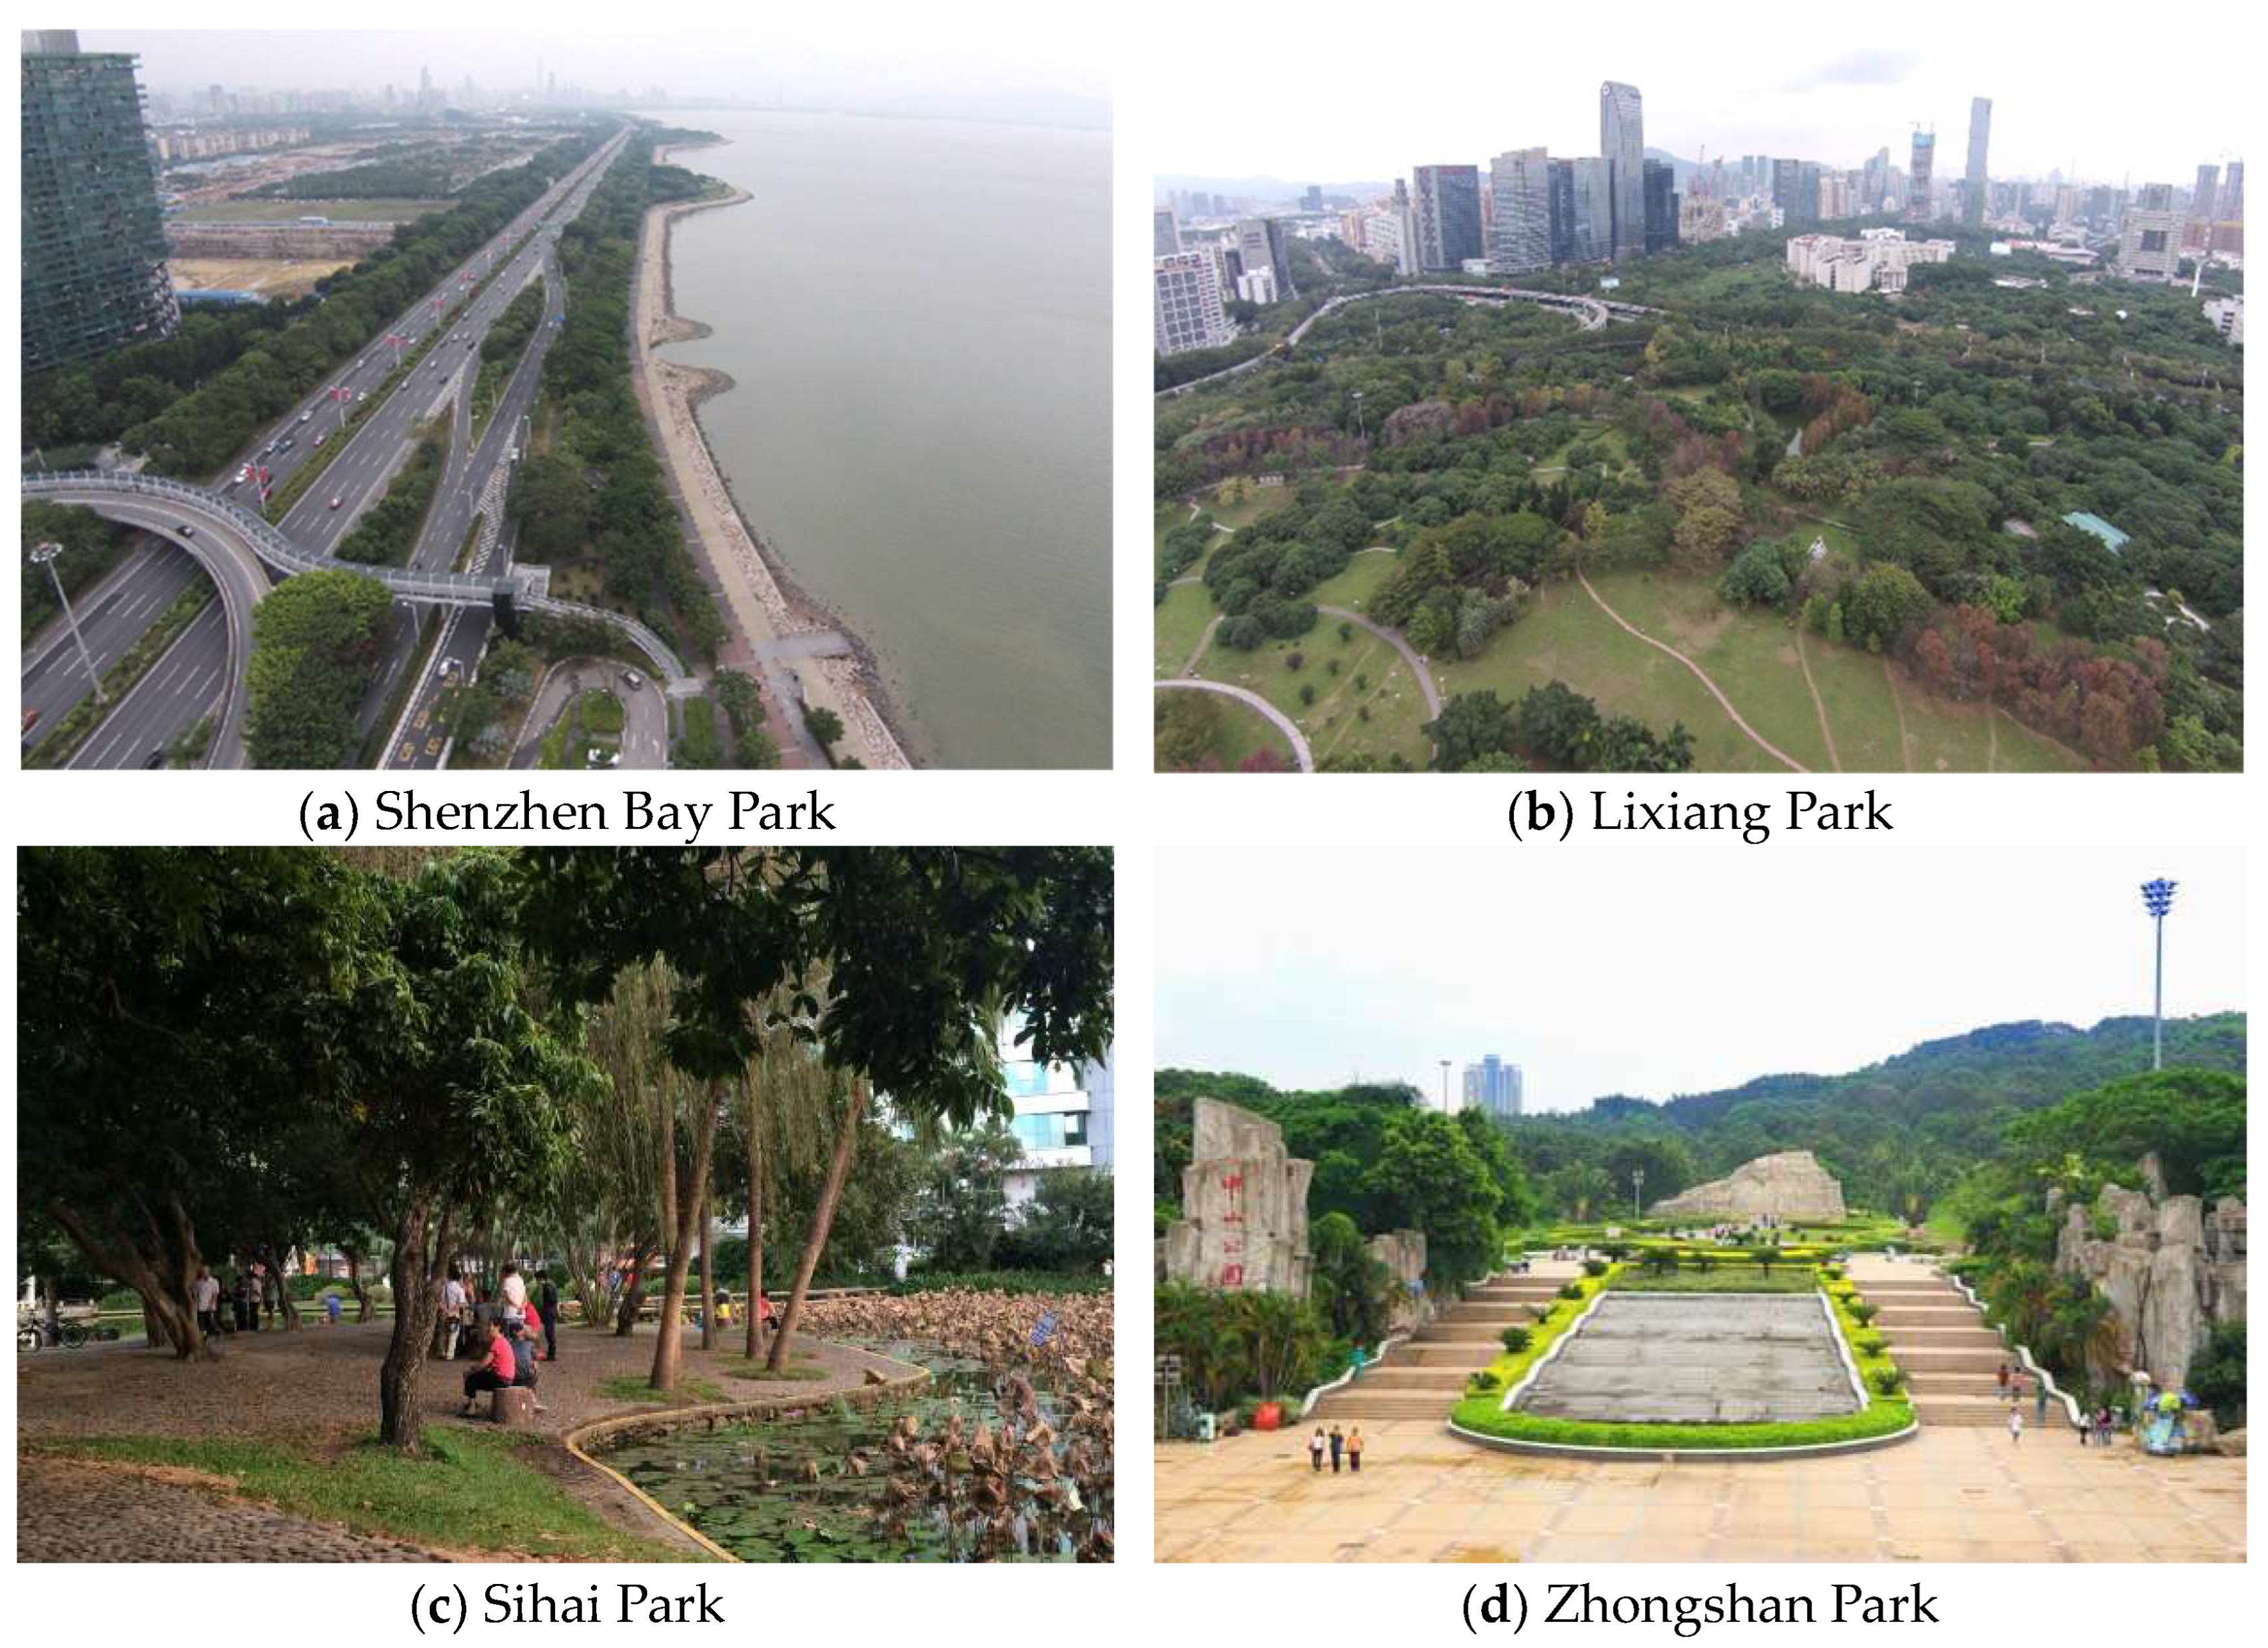
  • High-satisfaction areas are close to large urban parks, green areas, or urban waterfronts;
  • Accessibility satisfaction is also very high in the areas blocked by urban arterial roads;
  • Low-satisfaction areas are mostly concentrated in urban villages with a high population density, without large urban parks or open spaces in the surrounding; but not all urban villages have a low satisfaction, such as the Wanxia Village area and the Nanguang Village area;
  • None of the urban village districts with low satisfaction have a large area of public open space inside them.

4. Discussion

4.1. Overall Comparison of Quantitative Analysis and Field Survey

The five grades of excellent, good, medium, poor, and none of the GIS quantitative results were divided into three categories according to the level of per capita area of accessibility characterized, in which excellent and good were classified as one category, corresponding to “very satisfied” in the survey results. Poor and none were categorized as one category, corresponding to “unsatisfied” in the survey results. Medium was categorized as one category, corresponding to “satisfied” in the survey results. Figure 11 shows the comparison between the results of the quantitative GIS evaluation and the results of the field survey in each research area.
A comparison of the graphical and tabular values shows that the two sets of evaluation results are significantly different. Overall, compared to the GIS quantitative evaluation results, the field research results demonstrate that Nanshan residents are more satisfied with the accessibility of public open space, as shown in Table 2. This reflects that the current planning indicators for public open space are on the high side, and the per capita indicators for public open space are higher than what residents actually need. The difference between the two sets of results is mainly reflected in the proportion of the level of accessibility corresponding to being “unsatisfied”; the proportion of “unsatisfied” in the GIS quantitative evaluation results is twice as high as the corresponding value in the field research results, and the proportion of “very satisfied” in the field research results is also higher than the corresponding proportion in the GIS quantitative evaluation results. The percentage of “very satisfied” in the field study results is significantly higher compared to the GIS quantitative results.

4.2. Analysis of the Reasons for the Differences in the Comparison of Evaluation Results in Each Research Area

The quantitative evaluation method yields a mathematical analysis result in an ideal state, but resident satisfaction is influenced by multiple factors. By analyzing areas with significant differences in results between the two, the interaction mechanism between the quantitative evaluation results and residents’ satisfaction can be identified, which is conducive to optimizing the quantitative evaluation methods and making them more in line with the real situation of user’s actual use of public open spaces.
The bar charts comparing the proportions of “very satisfied” and “dissatisfied” in the GIS quantitative evaluation results and the field survey results in each research area are shown in Figure 12. The areas showing a significant difference between the two sets of results are identified in the bar charts.
From the overall results, the results of the two evaluation methods appear to show clear differences for the individual research areas, although not all research areas show a clear difference in the comparison. The comparison of the two sets of evaluation results suggests the following patterns:
  • Nearly a quarter of the surveyed areas have very close accessibility satisfaction ratios with no significant differences, and even if there are differences between individual areas, the differences mostly fluctuate around 15%. By analyzing the reasons, it is found that the “very satisfied” areas are adjacent to large city parks in terms of spatial location, with multiple entrances and exits set up in these parks, multiple convenient walking routes to reach the parks, and no obstruction by main roads. The “dissatisfied” areas do not have any public open space around them, and the subjective feelings of the public in these areas are relatively poor.
  • In more than half of the surveyed areas, the proportion of people with accessibility satisfaction indicating “very satisfied” is significantly higher, or the proportion of people with accessibility satisfaction indicating “unsatisfied” is significantly lower, and the proportion of changes fluctuates around 30%, with the proportion of changes in individual areas approaching 50%. By summarizing and analyzing the reasons for the differences found in the comparison of the above results, the following three main aspects can be drawn:
    • First, most residents are willing to cross the barrier of urban main roads to use a public open space, and the barrier effect of main roads is not obvious. The field survey found that all road crossings are interchanges, and when flyovers and tunnels become the only way to cross urban arterial roads, the effect of arterial road barriers on the accessibility satisfaction of residents regarding public open space is greatly reduced, and the accessibility satisfaction of residents is improved.
    • Secondly, residents’ walking distance ranges from more than 5 min to more than 30 min. The field research found that due to the attraction of high-quality public open spaces and the public’s own needs, many Nanshan residents spend more than 5 min to go to these public open spaces, with most of the walking times between 10 min and 25 min; the increase in walking distance means that residents have more public open spaces to choose from, and accessibility satisfaction is improved accordingly.
    • Thirdly, some residential neighborhoods have better-quality activity venues, which are not public open spaces, but residents’ accessibility satisfaction is higher with frequent use. It is difficult for survey respondents to eliminate their own subjective feelings of activity venues in their neighborhood and fill out the questionnaire from the perspective of urban public open space; this leads to an increase in the satisfaction of survey respondents regarding the accessibility of public open space. From the perspective of public interest, a “public open space” inside a closed district should be understood as the “privatization” of public space, which weakens residents’ willingness to use such a public open space and reduces their satisfaction with the accessibility of public open space. The “privatization” of public space also reduces the overall vitality of the city.
  • The proportion of people who are “very satisfied” with the accessibility of some individual research areas is significantly higher, or the proportion of people who are “dissatisfied” with the accessibility is significantly lower, with the range of change fluctuating from 10% to 30%. The reasons for this are as follows: First, the public open spaces designated in the GIS quantitative results are not recognized by the survey respondents, and the survey respondents are not willing to use these public open spaces. The public spaces that were included in the study scope when the two-step mobile search method was conducted were found in the field survey to be less attractive to the survey respondents, even though they are easily accessible in space and time due to the poor environmental quality, lack of relevant activity facilities, or occupation by parking lots. Secondly, due to the management measures of certain neighborhoods or public open spaces, certain paths or entrances and exits are closed, leading to a decrease in residents’ accessibility satisfaction. In order to reduce management costs, some property management has closed certain access routes in some neighborhoods, and residents must take a long detour to reach the public open spaces around their neighborhoods.
  • In the research area around the university-type public open space, the proportion of people indicating a “very satisfied” accessibility is significantly lower, and the function of the university-type public open space is not fully reflected. For security reasons, the university campus has set up security guard booths at all the entrances and exits and conducts identity checks on suspicious people, which protects security but, at the same time, gives a psychological hint of “rejection” to citizens who intend to enter the campus.
  • In summary, via the on-site investigation of data areas with significant differences in the satisfaction and quantitative analysis, we found that spatial layout patterns, road network density, environmental quality, and user walking tolerance time have a significant impact on user satisfaction.

5. Conclusions

5.1. Analysis of Factors Influencing Satisfaction with Accessibility of Public Spaces

Compared to the GIS quantitative evaluation results, the field research results show that Nanshan residents are more satisfied with the accessibility of public open space. Based on the analysis of the satisfaction situation in different research areas, the factors influencing residents’ satisfaction of the accessibility of public open space are summarized as follows:
  • The layout pattern of public open spaces in the city affects residents’ accessibility satisfaction. Firstly, large-scale, municipal, district-level public open spaces are indispensable in the city, and this level of public open space constructs the framework of the open space system of the whole city. Such large-scale public open spaces should be arranged on both sides of urban arterial roads to be convenient for residents to reach by public transportation or by car, and overpasses and sidewalks should be built at appropriate locations. Secondly, community-level public open spaces have a higher spatial service capacity, which can serve more residents, and should be arranged on both sides of urban branch roads or lower-level roads to reduce the blocking effect of urban arterial roads, which can reduce the barrier effect for residents. Moreover, the area of this level of public open space should not be too large, and such public open spaces should be evenly distributed around residential areas so that they are convenient for residents to reach on foot in a short time.
  • The structure and density of the urban road network affects accessibility satisfaction. The road network structure of “narrow roads and dense road network” can provide a better walking experience and improve the walking accessibility of residents to a public open space, and the periphery of a public open space should be divided into small blocks as much as possible to increase the density of the road network so as to provide multiple walking paths to reach the public open space and diversify the streetscape interfaces.
  • The attributes of a public open space affect the accessibility satisfaction of residents. Larger public open spaces with better environmental quality are more attractive to residents, which can increase the willingness of residents to undergo extreme walking time and the service scope of these public open spaces. In addition, the number of entrances and exits of a public open space affects accessibility; the more entrances and exits, the better the accessibility.
  • Users’ walking tolerance time and preference for the type of public open space affect accessibility satisfaction. This study shows that users with a longer walking tolerance time are more satisfied than those with a shorter walking tolerance time and that the attractiveness of a public open space can be enhanced by improving the environmental quality of the public open space and enriching the walking experience by connecting the streets of the public open space to prolong the walking tolerance time of users.

5.2. Applications

Based on the above analysis conclusions, we propose countermeasures and suggestions for planning land layout, public management and services, and spatial environment design, as well as for environmental quality, the spatial layout mode, road network density, and residents’ walking tolerance time.
First of all, from the perspective of urban planning, China’s statutory plans have made detailed provisions on the nature of urban land use, development intensity, and supporting facilities, as well as they are planning documents with legal effect. It is crucial to guarantee the formulation and implementation of these statutory plans according to the law and to implement the land-use arrangements for Class G land use, namely green space and plaza land use in actual urban construction, so as to strengthen the compliance with the rule of law in urban planning and to increase public awareness and participation in urban planning.
Secondly, from the perspective of public management and services, it is important to strengthen the maintenance and management of the stock of green space, improve the service level of the built green space, provide more complete activity facilities for the public by increasing financial investment, actively listen to the public’s opinions and suggestions in the process of day-to-day management, and build a more empirically grounded public open space. In addition, it is necessary to seize the opportunity of the rapid development of urban renewal in Shenzhen to strengthen the construction of public open space in old residential areas, old industrial areas, and urban village areas.
Finally, in terms of spatial environment design, the construction of a miniaturized and decentralized layout of community-level public open space for high-density urban areas is valuable, which advocates for the construction of pocket parks. Pocket parks have the characteristics of flexible seating, small area, and discrete distribution, and they can appear in large numbers in the city in a seamless manner, which, for a city of high-rise buildings, is like an oasis in the desert; they can improve the urban environment to a large extent, while partially solving the problem of people’s demand for public open space in high-density urban centers at the same time. It is also important to improve the quality of the environmental landscape, enrich the plant configuration, increase the number of interesting landscape vignettes, create a dynamic waterfront landscape, focus on creating high-quality open spaces, and improve the attractiveness of existing public open spaces to the public. In addition, we should respond to the national call to increase the density of the road network around large-scale public open spaces, advocate for the road network structure of “narrow road, dense road network”, open the walls of closed neighborhoods, enhance the micro-circulation of pedestrian traffic, improve the accessibility of residents on foot, and facilitate the sharing of green space resources in the city to the greatest extent possible.

Author Contributions

Conceptualization, M.W. and X.P.; methodology, X.P.; software, X.P.; validation, M.W., M.Z. and X.P.; formal analysis, X.P.; investigation, M.W.; resources, M.Z. and Y.T.; data curation, X.P.; writing—original draft preparation, M.W.; writing—review and editing, M.W.; visualization, X.P.; supervision, M.Z. and Y.T.; project administration, M.Z.; funding acquisition, M.Z. All authors have read and agreed to the published version of the manuscript.

Funding

This research was funded by the Major Program of National Natural Science Foundation of China, grant number 51938002; the General Program of Beijing Association of Higher Education, grant number YB202196; and the Education and Teaching Research Projects of China Association of Construction Education, grant number 2019006.

Data Availability Statement

Not applicable.

Conflicts of Interest

The authors declare no conflict of interest.

References

  1. Carr, S.; Francis, M.; Rivlin, L.G. Public Space (Cambridge Series in Environment and Behavior); Cambridge University Press: New York, NY, USA, 1993. [Google Scholar]
  2. Ning, X. Review of Urban Public Space Researches from Multidisciplinary Perspective. Landscape 2021, 28, 52–57. [Google Scholar] [CrossRef]
  3. CNU (Congress for the New Urbanism). Available online: https://www.cnu.org/publicsquare/2021/02/08/defining-15-minute-city (accessed on 31 August 2023).
  4. CNU (Congress for the New Urbanism). Available online: https://www.cnu.org/publicsquare/2022/12/13/slogan-substance-planning-15-minute-city (accessed on 31 August 2023).
  5. Khavarian-Garmsir, A.R.; Sharifi, A.; Hajian Hossein Abadi, M.; Moradi, Z. From Garden City to 15-Minute City: A Historical Perspective and Critical Assessment. Land 2023, 12, 512. [Google Scholar] [CrossRef]
  6. Moreno, C.; Allam, Z.; Chabaud, D.; Gall, C.; Pratlong, F. Introducing the “15-Minute City”: Sustainability, Resilience and Place Identity in Future Post-Pandemic Cities. Smart Cities 2021, 4, 93–111. [Google Scholar] [CrossRef]
  7. Ministry of Natural Resources of the People’s Republic of China. Available online: http://gi.mnr.gov.cn/202105/t20210526_2633012.html (accessed on 30 September 2023).
  8. Chen, J.; Lu, F.; Cheng, C. Advance in Accessibility Evaluation Approaches and Applications. Prog. Geogr. 2007, 26, 100–110. [Google Scholar] [CrossRef]
  9. Luo, W.; Wang, F. Measures of spatial accessibility to health care in a GIS environment: Synthesis and a case study in the Chicago region. Environ. Plan. 2003, 30, 865–884. [Google Scholar] [CrossRef] [PubMed]
  10. Gao, W.; Ouyang, Y.; Mei, Z. A Review on Accessibility Measurements of Public Service Facilities. Acta Sci. Nat. Univ. Pekin. 2023, 59, 344–354. [Google Scholar] [CrossRef]
  11. Song, Z.N.; Chen, W.; Zhang, G. Spatial Accessibility to Public Service Facilities and Its Measurement Approaches. Prog. Geogr. 2010, 29, 1217–1224. [Google Scholar] [CrossRef]
  12. Guagliardo, M.F. Spatial accessibility of primary care: Concepts, methods and challenges. Int. J. Health Geogr. 2004, 3, 3. [Google Scholar] [CrossRef]
  13. Luo, W. Using a GIS-based floating catchment method to assess areas with shortage of physicians. Health Place 2004, 10, 1–11. [Google Scholar] [CrossRef]
  14. Wei, Y.; Xiu, C.; Gao, R.; Wang, Q. Evaluation of green space accessibility of Shenyang using Gaussian based2-step floating catchment area method. Prog. Geogr. 2014, 4, 479–487. [Google Scholar] [CrossRef]
  15. Guo, X.; Zeng, S.; Namaiti, A.; Zeng, J. Evaluation of Supply–Demand Matching of Public Health Resources Based on Ga2SFCA: A Case Study of the Central Urban Area of Tianjin. ISPRS Int. J. Geo-Inf. 2023, 12, 156. [Google Scholar] [CrossRef]
  16. Shao, Y.; Luo, W. Supply-demand adjusted two-steps floating catchment area (SDA-2SFCA) model for measuring spatial access to health care. Soc. Sci. Med. 2022, 296, 114727. [Google Scholar] [CrossRef] [PubMed]
  17. Li, C.; Wang, J. A hierarchical two-step floating catchment area analysis for high-tier hospital accessibility in an urban agglomeration region. J. Transp. Geogr. 2022, 102, 103369. [Google Scholar] [CrossRef]
  18. Wang, Y.; Liu, Y.; Xing, L.; Zhang, Z. An Improved Accessibility-Based Model to Evaluate Educational Equity: A Case Study in the City of Wuhan. ISPRS Int. J. Geo-Inf. 2021, 10, 458. [Google Scholar] [CrossRef]
  19. Yao, L.; Lv, M.; Li, T.; Wang, D.; Cao, X. Exploring the Evolution of the Accessibility of Educational Facilities and Its Influencing Factors in Mountainous Areas: A Case Study of the Rocky Desertification Area in Yunnan, Guangxi, and Guizhou. ISPRS Int. J. Geo-Inf. 2022, 11, 296. [Google Scholar] [CrossRef]
  20. Li, L.; Du, Q.; Ren, F.; Ma, X. Assessing Spatial Accessibility to Hierarchical Urban Parks by Multi-Types of Travel Distance in Shenzhen, China. Int. J. Environ. Res. Public Health 2019, 16, 1038. [Google Scholar] [CrossRef]
  21. Zhang, S.; Yu, P.; Chen, Y.; Jing, Y.; Zeng, F. Accessibility of Park Green Space in Wuhan, China: Implications for Spatial Equity in the Post-COVID-19 Era. Int. J. Environ. Res. Public Health 2022, 19, 5440. [Google Scholar] [CrossRef]
  22. Zhang, J.; Cheng, Y.; Zhao, B. How to accurately identify the underserved areas of peri-urban parks? An integrated accessibility indicator. Ecol. Indic. 2021, 122, 107263. [Google Scholar] [CrossRef]
  23. Gu, X.; Tao, S.; Dai, B. Spatial accessibility of country parks in Shanghai, China. Urban For. Urban Green. 2017, 27, 373–382. [Google Scholar] [CrossRef]
  24. Wei, F. Greener urbanization? Changing accessibility to parks in China. Landsc. Urban Plan. 2017, 157, 542–552. [Google Scholar] [CrossRef]
  25. Wen, Z.; Zhang, S.; Yang, Y.; Zheng, X.; Song, Z.; Zhou, Y.; Hao, J. How does enclosed private residential green space impact accessibility equity in urban regions? A case study in Shenzhen, China. Urban For. Urban Green. 2023, 85, 127968. [Google Scholar] [CrossRef]
  26. Li, Y.; Xie, Y.; Sun, S.; Hu, L. Evaluation of Park Accessibility Based on Improved Gaussian Two-Step Floating Catchment Area Method: A Case Study of Xi’an City. Buildings 2022, 12, 871. [Google Scholar] [CrossRef]
  27. Olsson, L.E.; Friman, M.; Pareigis, J.; Edvardsson, B. Measuring service experience: Applying the satisfaction with travel scale in public transport. J. Retail. Consum. Serv. 2012, 19, 413–418. [Google Scholar] [CrossRef]
  28. Abrudan, I.N.; Dabija, D.-C. Measuring Clients’ Satisfaction toward Shopping Centers—Empirical Evidences from Romania. Procedia Econ. Finance 2014, 15, 1243–1252. [Google Scholar] [CrossRef]
  29. Aulia, D.N.; Ismail, A.M. Residential Satisfaction of Middle Income Population: Medan city. Procedia Soc. Behav. Sci. 2013, 105, 674–683. [Google Scholar] [CrossRef]
  30. Lovejoy, K.; Handy, S.; Mokhtarian, P. Neighborhood satisfaction in suburban versus traditional environments: An evaluation of contributing characteristics in eight California neighborhoods. Landsc. Urban Plan. 2010, 97, 37–48. [Google Scholar] [CrossRef]
  31. Xue, P.; Mak, C.; Ai, Z. A structured approach to overall environmental satisfaction in high-rise residential buildings. Energy Build. 2016, 116, 181–189. [Google Scholar] [CrossRef]
  32. García-Mainar, I.; Montuenga, V.M.; Navarro-Paniagua, M. Workplace environmental conditions and life satisfaction in Spain. Ecol. Econ. 2015, 119, 136–146. [Google Scholar] [CrossRef]
  33. Chen, J.H. Post evaluation of urban open space and its environmental use. Build. Sci. 2007, 9, 102–105. [Google Scholar] [CrossRef]
  34. Jan, G.; Lars, G. Public Spaces, Public Life; The Danish Architectural Press: Copenhagen, Denmark, 1997; ISBN 9788774073055. [Google Scholar]
  35. Lu, X.H.; He, Q.; Li, Q. Survey and Optimization Design of Urban Public Space in China. Open House Int. 2018, 43, 5–10. [Google Scholar] [CrossRef]
  36. Ahirrao, P.; Khan, S. Assessing Public Open Spaces: A Case of City Nagpur, India. Sustainability 2021, 13, 4997. [Google Scholar] [CrossRef]
  37. Wang, P.W.; Han, L.R.; Mei, R. An Impact Asymmetry Analysis of Small Urban Green Space Attributes to Enhance Visitor Satisfaction. Int. J. Environ. Res. Public Health 2022, 19, 2922. [Google Scholar] [CrossRef] [PubMed]
  38. Shenzhen Municipal Bureau of Urban Management and Comprehensive Law Enforcement. Available online: http://cgj.sz.gov.cn/zwgk/tjsj/content/post_10458204.html (accessed on 10 August 2023).
  39. Gu, Z.H. Disaster Evacuation Capability Evaluation for Urban Open Spaces: A Case Study in Nanshan District, Shenzhen City. China Saf. Sci. J. 2011, 21, 150–155. [Google Scholar] [CrossRef]
  40. Shenzhen Nanshan District People’s Government. Available online: http://www.szns.gov.cn/xxgk/qzfxxgkml/tjxx/tjgb/content/post_8900620.html (accessed on 10 August 2023).
  41. Lu, J.; Ye, H.Q. Reasonable distance of pedestrian crossing facilities. J. Traffic Transp. Eng. 2002, 2, 63–67. [Google Scholar] [CrossRef]
Figure 1. Satellite remote sensing image of Nanshan District (August 2022).
Buildings 13 02624 g001
Figure 2. Street map of Nanshan District.
Buildings 13 02624 g002
Figure 3. Operational flowchart of quantitative accessibility evaluation based on the Gaussian two-step mobile search method (GIS analysis and Excel calculation).
Buildings 13 02624 g003
Figure 4. Original and improved urban arterial barrier algorithms.
Buildings 13 02624 g004
Figure 5. Distribution of residents in Nanshan District.
Buildings 13 02624 g005
Figure 6. Distribution of public open space accessibility within a 500 m walk of South Hill residents.
Buildings 13 02624 g006
Figure 7. Pathway map of Nanshan District residents’ access to public open space within 500 m walking distance.
Buildings 13 02624 g007
Figure 8. Realistic view of open spaces with the highest frequency of walking for 30 min to 1 h.
Buildings 13 02624 g008
Figure 9. Determination of residents’ satisfaction with accessibility to public open space.
Buildings 13 02624 g009
Figure 10. Distribution of residents’ satisfaction with regard to the accessibility of public open space.
Buildings 13 02624 g010
Figure 11. Comparison between GIS quantitative results and results of residents’ satisfaction survey.
Buildings 13 02624 g011
Figure 12. Comparison of satisfaction between quantitative evaluation results and field research results.
Buildings 13 02624 g012
Table 1. Levels of residents’ satisfaction in Nanshan District.
Satisfaction LevelNumber of PeopleProportion
Very satisfied36935.8%
Satisfied32931.9%
Dissatisfied33232.3%
Total1030100%
Table 2. Comparison of the number of people and the proportion of the two sets of results.
Accessibility LevelGIS Quantitative Evaluation ResultsSatisfaction Results of Field Survey
Number of PeopleProportionNumber of PeopleProportion
(Excellent + good)/very satisfied390,88521.8%36935.8%
(Medium)/satisfied254,45214.2%32931.9%
(Poor + none)/dissatisfied1,150,48964.1%33232.3%
Total1,795,826100%1030100%
Disclaimer/Publisher’s Note: The statements, opinions and data contained in all publications are solely those of the individual author(s) and contributor(s) and not of MDPI and/or the editor(s). MDPI and/or the editor(s) disclaim responsibility for any injury to people or property resulting from any ideas, methods, instructions or products referred to in the content.

