Article

Hygrothermal Assessment of Insulation Systems for Internal Insulation of Solid Masonry Walls under Various Conditions

Institute of Energy Systems and Environment, Riga Technical University, LV1048 Riga, Latvia
*
Author to whom correspondence should be addressed.
Buildings 2023, 13(10), 2511; https://doi.org/10.3390/buildings13102511
Submission received: 6 September 2023 / Revised: 27 September 2023 / Accepted: 28 September 2023 / Published: 3 October 2023
(This article belongs to the Section Building Energy, Physics, Environment, and Systems)

Abstract

:
Energy efficiency renovation of building stock is an essential aspect of the climate change mitigation strategies in many countries. A large proportion of building stock is historical buildings. For this building stock, developing technology for safe internal insulation of external walls is crucial, preventing possible moisture damage to the building structures. Internal insulation is a risky technique as it has a high impact on the hygrothermal behavior of the wall. This study assesses the hygrothermal performance of massive masonry walls with 17 interior insulation systems exposed to different external boundary conditions, including a steady-state cycle, dynamic dry cycle, wind-driven cycle, and drying cycle. During the steady state cycle, the highest increase of moisture was observed under capillary active materials ranging from 39 to 119% increase in absolute moisture, with the exception of cellulose with an increase of only 7%. All the vapor-tight insulation systems showed no increase in absolute moisture during the steady-state cycle, with the exception being mineral wool in combination with a vapor barrier that showed a 30% increase in ablute humidity. In addition, relative moisture changes in masonry were measured. Results show that tested insulation systems exhibit similar thermal performance while having different moisture performance. Vapor-tight and vapor-open insulation systems exhibit different hygrothermal behavior under various test cycles depending on material vapor diffusion resistance. Numerical simulations are sensitive to the hygrothermal properties of materials.

1. Introduction

The Sixth Assessment Report of the Intergovernmental Panel on Climate Change [1] urges the mitigation of climate change driven by anthropogenic impact. Many countries are committed to international climate mitigation goals and continually set new targets for GHG reduction in climate policy packages. Energy consumption in buildings accounts for 30% of total global final energy demand [2], and energy efficiency is essential to reduce the climate crisis.
Renovation of historic buildings is an essential aspect of the energy efficiency strategies in Europe [3]. Historic buildings are often located in historic centers of cities. They are facing various limitations for measures related to the reduction of thermal losses, e.g., heritage value of the facade and space limitation on the street for additional material layers on the exterior of the building. For this building stock, developing technology for safe internal insulation of external walls is crucial, preventing possible moisture damage to the building structures. This measure is a risky insulation technique as it has a high impact on the hygrothermal behavior of the wall, leading to the risk of mold growth, frost damage, and decay of embedded wooden beams [4,5].
When considering the application of internal insulation, hygrothermal evaluation is crucial. Detailed planning reduces the risk associated with changes in hygrothermal behavior [6,7]. Various factors must be considered during the planning, such as properties of bricks in the original masonry, insulation materials, and outdoor and indoor boundary conditions.
Various studies have found that the hygrothermal properties of bricks are essential for the estimation of the impact of internal insulation; a single parameter is insufficient to estimate the hygrothermal impact of interior insulation, e.g., in a study [5], they found that the water absorption coefficient of a brick is not enough. The liquid water conductivity is more critical. A study by Johansson et al. (2014) [8] concluded that the thickness of the wall influences the moisture accumulation rate; the moisture content in the wall highly depends on the properties of the brick, and the drying rate depends on the mortar type.
Another vital factor is wind-driven rain [8,9,10,11,12]. Studies on the impact of the wind-driven rain load on the hygrothermal behavior of internally insulated wall show that under moderate rain protection, some insulation systems perform well at the normal indoor moisture load [13]. However, higher wind-driven loads have an influence on the magnitude of hygrothermal changes [5]. A study on a vapor-tight system showed that the rain load was the dominating factor determining the vapor and water transport in the wall and the relative humidity under insulation increased significantly during wind-driven rain [8]. Nielsen et al. (2012) stated that the effect of a vapor barrier and the thickness of the insulation is negligible, compared to wind-driven rain [14]. In vapor-open capillary active insulation systems, wind-driven rain can impact hygrothermal behavior by reducing thermal resistance or increasing indoor relative humidity [15]. High solar exposure on walls can contribute to drying [9]. However, it may cause inward solar-driven vapor flow.
A study [13] on the influence of indoor humidity on the performance of insulation systems showed that a high indoor moisture load can increase the risk of mold growth as it can lead to increased relative humidity behind calcium silicate and perlite insulation systems. For vapor-tight systems, a high risk of mold growth and interstitial condensation is predicted between masonry and the insulation and is mainly caused by outdoor boundary conditions [5].
Diffusion-open and diffusion-tight systems were compared in different studies [4,5,16,17,18,19,20,21]. When masonry is insulated internally, the moisture content in the masonry wall is higher for vapor-tight insulation materials [5]. Vereecken et al. (2014) [4] found that for the imposed quasi-steady-state winter condition, the increased stored moisture inside walls with a capillary active system is higher than for walls with a traditional vapor-tight system. The application of vapor-tight insulation materials prevents drying towards the inner surface [9,22]. Grunewald et al. (2006) [23] found that the moisture equilibrium of the original wall can reach up to three times higher moisture level when the moisture transport is driven by rain and evaporation. With calcium silicate insulation, the drying potential of the envelope walls is kept.
Vapor-open capillary active systems reduce the original wall’s drying rate by allowing inward drying and buffer interstitial condensation. In capillary active systems, the temperature and vapor gradient induce an outward vapor transfer during the heating season. They have a high buffering potential and a large liquid conductivity in the capillary moisture range and can absorb the liquid water and redistribute it toward the room by a liquid flow that follows the inward capillary pressure gradient [24]. It is essential to ensure good contact between the masonry and insulation material since this guarantees that no interstitial condensations occur at the warm side of masonry and the capillary active material can redistribute it [25]. Other studies show that the relative humidity below insulation material can reach a high level [5,26,27]. Vereecken et al. (2016) [25] found that capillary active materials have disadvantages, such as the moisture storage having an adverse impact on the thermal performance, and the buffered moisture transported toward the room possibly affecting indoor relative humidity. Most bio-based materials such as grass, date palm wood, Alfa plant, straw, cork, hemp, and plant concrete are vapor-open capillary active because they are hygroscopic. However, they have a heterogeneous composition, which limits the assessment of their thermophysical properties [28]. Vegetal materials are more hygroscopic and their thermal performance is more sensitive to moisture accumulation [7]. In other natural-based materials, such as cork, the moisture transport phenomenon is limited to the first layers of the expanded cork [29]. Analysis carried out by [30] showed that saw and wool exhibit dynamic response to hygrothermal changes to qualify as moisture buffers. The quantity of moisture accumulated is material-specific and dependent on the relative humidity and the temperature of the environment and by controlling these values, it is possible to accurately track the adsorption/desorption characteristics of bio-based materials [30]. Experimental data indicate that biotic and chemically hydrophilic (e.g., cellulosic) materials (wood, organic fibers, starches, earth and clay plasters, and plant derivatives) exhibit higher moisture buffer values than porous, abiotic (e.g., cementitious) materials (concretes, bricks, and gypsum, and other inorganics) [31].
When vapor-tight insulation systems are installed on the interior side of the wall, the drying capacity inwards is substantially reduced and the relative humidity in the wall increases substantially when exposed to driving rain [8]. Compared to the capillary active systems that are sensitive to small modifications of the wall structure (e.g., interior finishing coat, wall thickness), the hygrothermal behavior in vapor-tight systems exhibits minor differences [15]. Kloseiko et al. (2022) found that the vapor open solutions have lower frost damage and mold growth risks than the vapor-tight systems [32]. Hygrothermal behavior during winter conditions shows that if a capillary active system has risks of interstitial condensation due to high level of an accumulated moisture content in the wall and the glue mortar, a vapor-tight system is preferable [4]. Antolinc et al. (2021) found that in a room with very high indoor relative humidity, the capillary active interior insulation is not a suitable solution for improving the thermal insulation of buildings in a cold continental climate and vapor-tight insulation needs to be applied [33]. However, moist indoor air can diffuse outwards into the masonry due to mechanical damage to the vapor barrier or poor craftsmanship [34].
Many studies on the hygrothermal behavior of internal insulation are limited to pure simulation experiments, laboratory experiments in steady-state conditions, or in situ measurements in specific cases. Each of them faces limitations. Material properties are taken from the material database in simulation experiments, assuming perfect installation. Laboratory experiments with steady-state conditions do not account for the dynamics of real-world structures. In situ measurements are case-specific and general conclusions that can be applied to other cases and cannot be withdrawn. Various studies have obtained more evidence that wind-driven rain is a vital factor influencing the hygrothermal behavior of internally insulated walls, and other factors are less important. Insulation systems’ laboratory and in situ tests are diverse with various boundary conditions, thicknesses, vapor barriers, heterogenous bricks, plasters, etc., and are difficult to compare. Simulations differ from measured data because they assume perfect installation and face uncertainty of parameter values and initial values. Many insulation systems have specific demands for installation quality, and if not correctly executed (e.g., vapor barriers, adhesive glue), it affects hygrothermal behavior. The application of biobased insulation materials as internal insulation is still uncertain due to hygrothermal behavior and failure modes related to mold growth.
This study will address these limitations by:
  • Investigating the impact of dynamic outdoor climate on the internal insulation of solid masonry walls in a controlled environment
  • Testing selected insulation systems and comparing them in the same boundary conditions
  • Eliminating the impact of various bricks with heterogenous properties by applying commercially produced bricks
  • Experimenting with internally insulated masonry walls with U-value as similar as possible (only limited by the material installation specifics)
  • Eliminating the impact of external plaster by not applying it
  • Assessing the effect of installation quality on the hygrothermal performance of the wall (various vapor barriers, adhesive glue)
  • Using bio-based insulation materials.
This study aims to answer the following research question: What is the hygrothermal performance of a solid brick wall with various interior insulation systems with different moisture diffusion prevention levels under varying external boundary conditions?
The paper starts with a comprehensive literature analysis to define knowledge gaps in the research field of applying internal insulation on massive masonry walls. It is followed by describing tested materials and systems and applied methodology, including material characterization, experimental setup, and testing procedures for the laboratory and numerical experiments. The analysis of results from different test round results is presented, followed by conclusions.

2. Materials and Methods

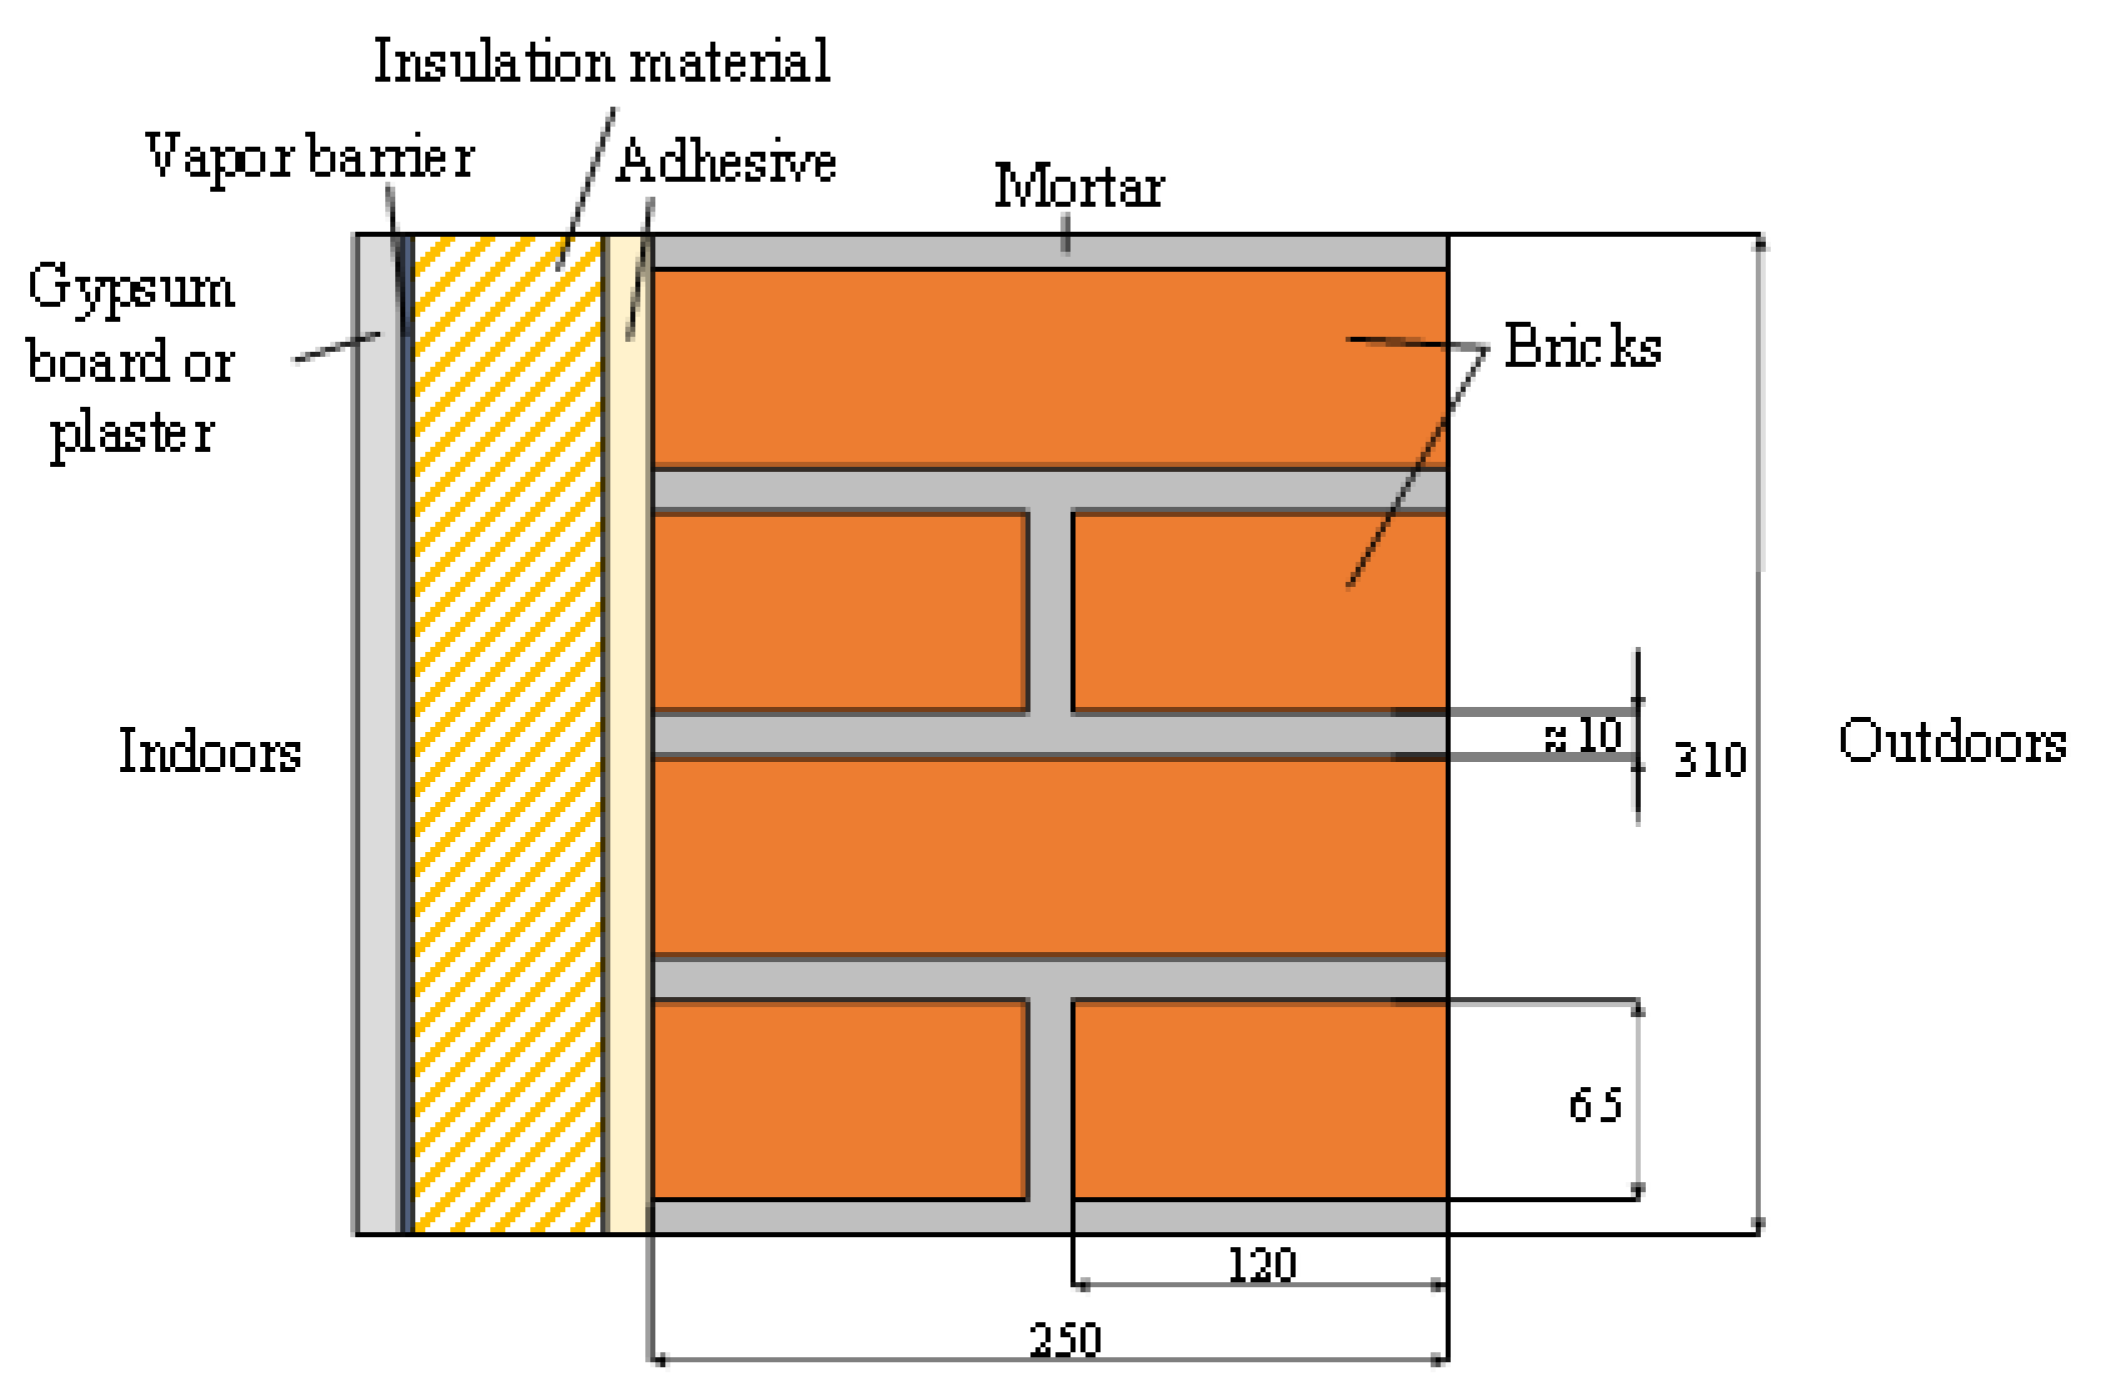
2.1. Material Characterization

Eighteen insulation systems underwent testing across two rounds. These systems combined various insulation materials with or without vapor barriers and binders, some following manufacturer instructions (e.g., mineral wool with vapor barrier, EPS, XPS, PIR with Sika cement and glass fiber net, cork, expanded cork, aerogel blanket) and others intentionally deviating to assess hygrothermal behavior (e.g., vapor-open materials without vapor barriers such as rock wool, expanded clay, cellulose, various wood fiber plates, and planing chips plates without external finishes). Insulation materials came from diverse sources and included both vapor-tight and vapor-open options. Gypsum plaster results were excluded due to sensor failure. The tested insulation systems encompassed inorganic mineral-derived materials (mineral wool with vapor barrier, rock wool, expanded clay, gypsum plaster, aerogel blanket), organic fossil fuel-derived materials (EPS, XPS, PIR with various coverings, VIP), and organic plants/animal-derived materials (cellulose, wood fiber plates with different densities, cork, expanded cork, planing chips plates). An overview of insulation materials, finishing, and mounting technologies is provided in Appendix A Table A1. Material properties were obtained from the manufacturer’s technical data sheets or directly contacting manufacturers. The information available was on the material’s thermal properties, such as the thermal conductivity λ, but other parameters, such as the specific heat or the vapor resistance, were missing from the technical data sheets of some products.
Vapor-open insulation systems are designed to allow the passage of water vapor. They have a higher permeability to moisture, which means that water vapor can move relatively freely through these materials. These systems are often used when moisture needs to be managed and allowed to escape from the building envelope. They can help prevent moisture buildup and related problems such as condensation and mold growth. These insulation systems are condensate-tolerating insulation systems where the material itself gives the only vapor resistance in these insulation systems; therefore, they have very small vapor diffusion resistances (sd value < 0.5 m) [35]. Materials such as cellulose insulation, some types of wood fiberboard, and certain natural insulation materials are vapor-open. On the other hand, vapor-tight insulation systems are designed to block the passage of water vapor. They have low permeability to moisture, which means they resist the movement of water vapor. Vapor-tight systems are used to create a moisture barrier, often when preventing moisture from entering or leaving a particular area is essential. They help maintain controlled indoor humidity and temperature levels. They can be distinguished as condensate-preventing systems that disable vapor transfer from the room side into the construction by a vapor barrier (min sd value 1500 m), and condensate-limiting insulation systems include a vapor barrier with an sd-value of min. 0.5 m and max. 1500 m [35]. Materials such as extruded polystyrene (XPS) and foil-faced insulation boards are vapor-tight. In summary, vapor-open insulation systems allow water vapor to pass through, making them suitable for applications where moisture management and breathability are needed. On the other hand, vapor-tight insulation systems act as barriers to moisture, ideal for maintaining controlled indoor conditions and preventing moisture intrusion. The choice between these systems depends on specific building requirements and environmental conditions.
In Appendix A Table A1, all materials and systems tested in this study are defined based on vapor tightness.

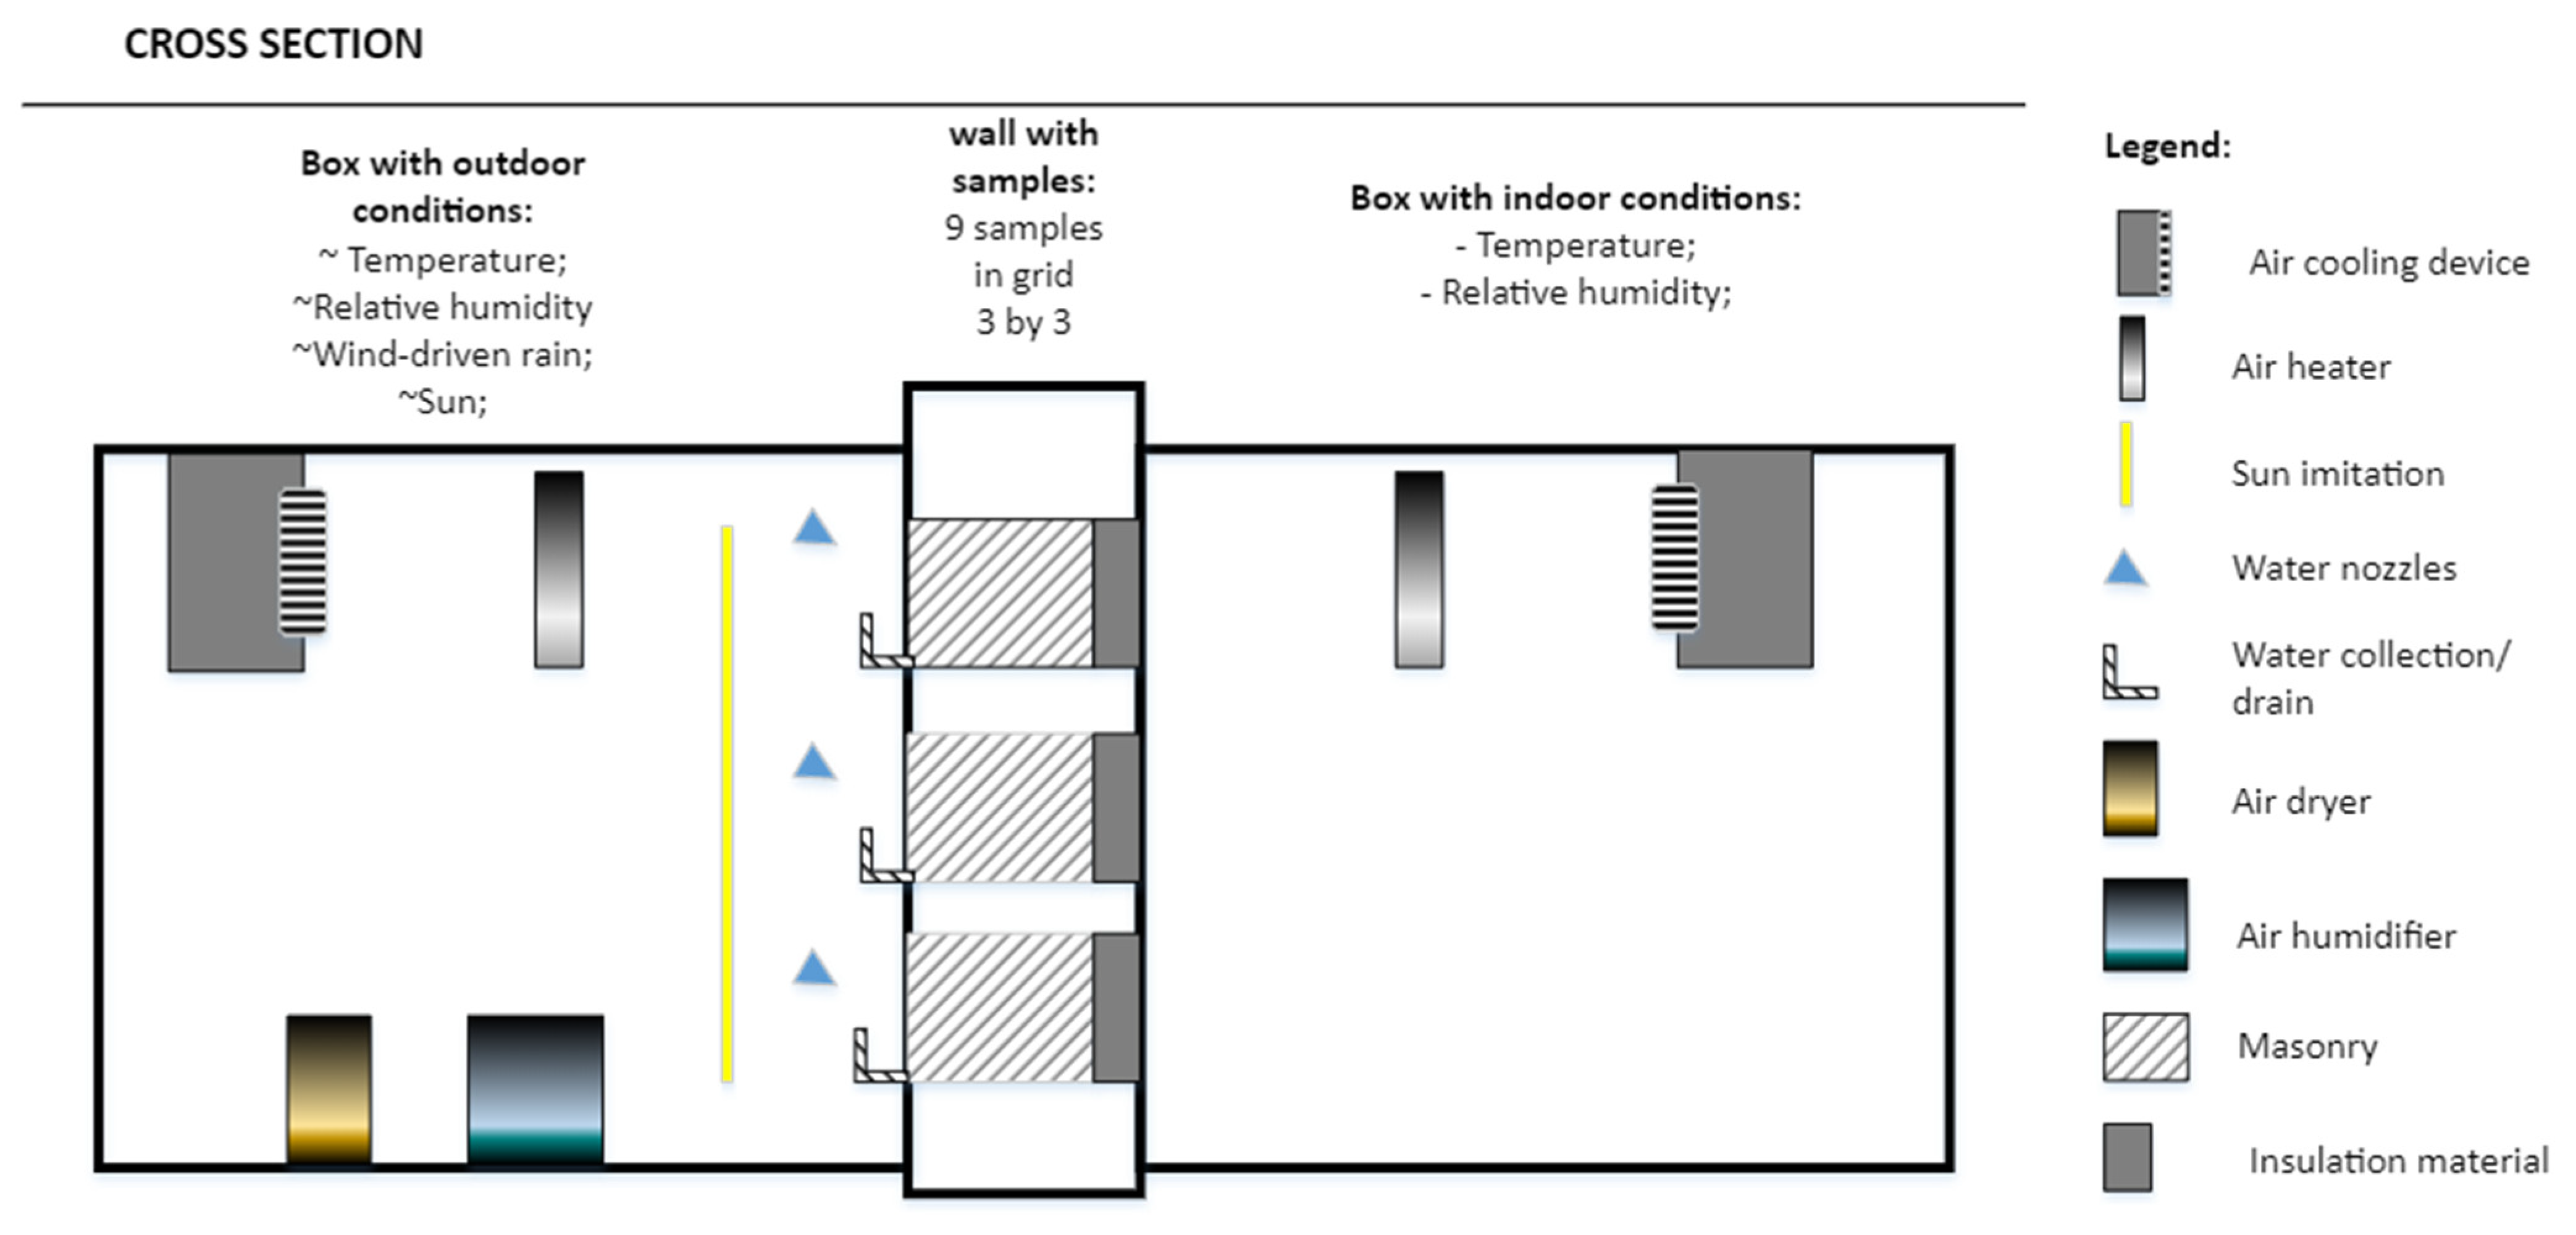
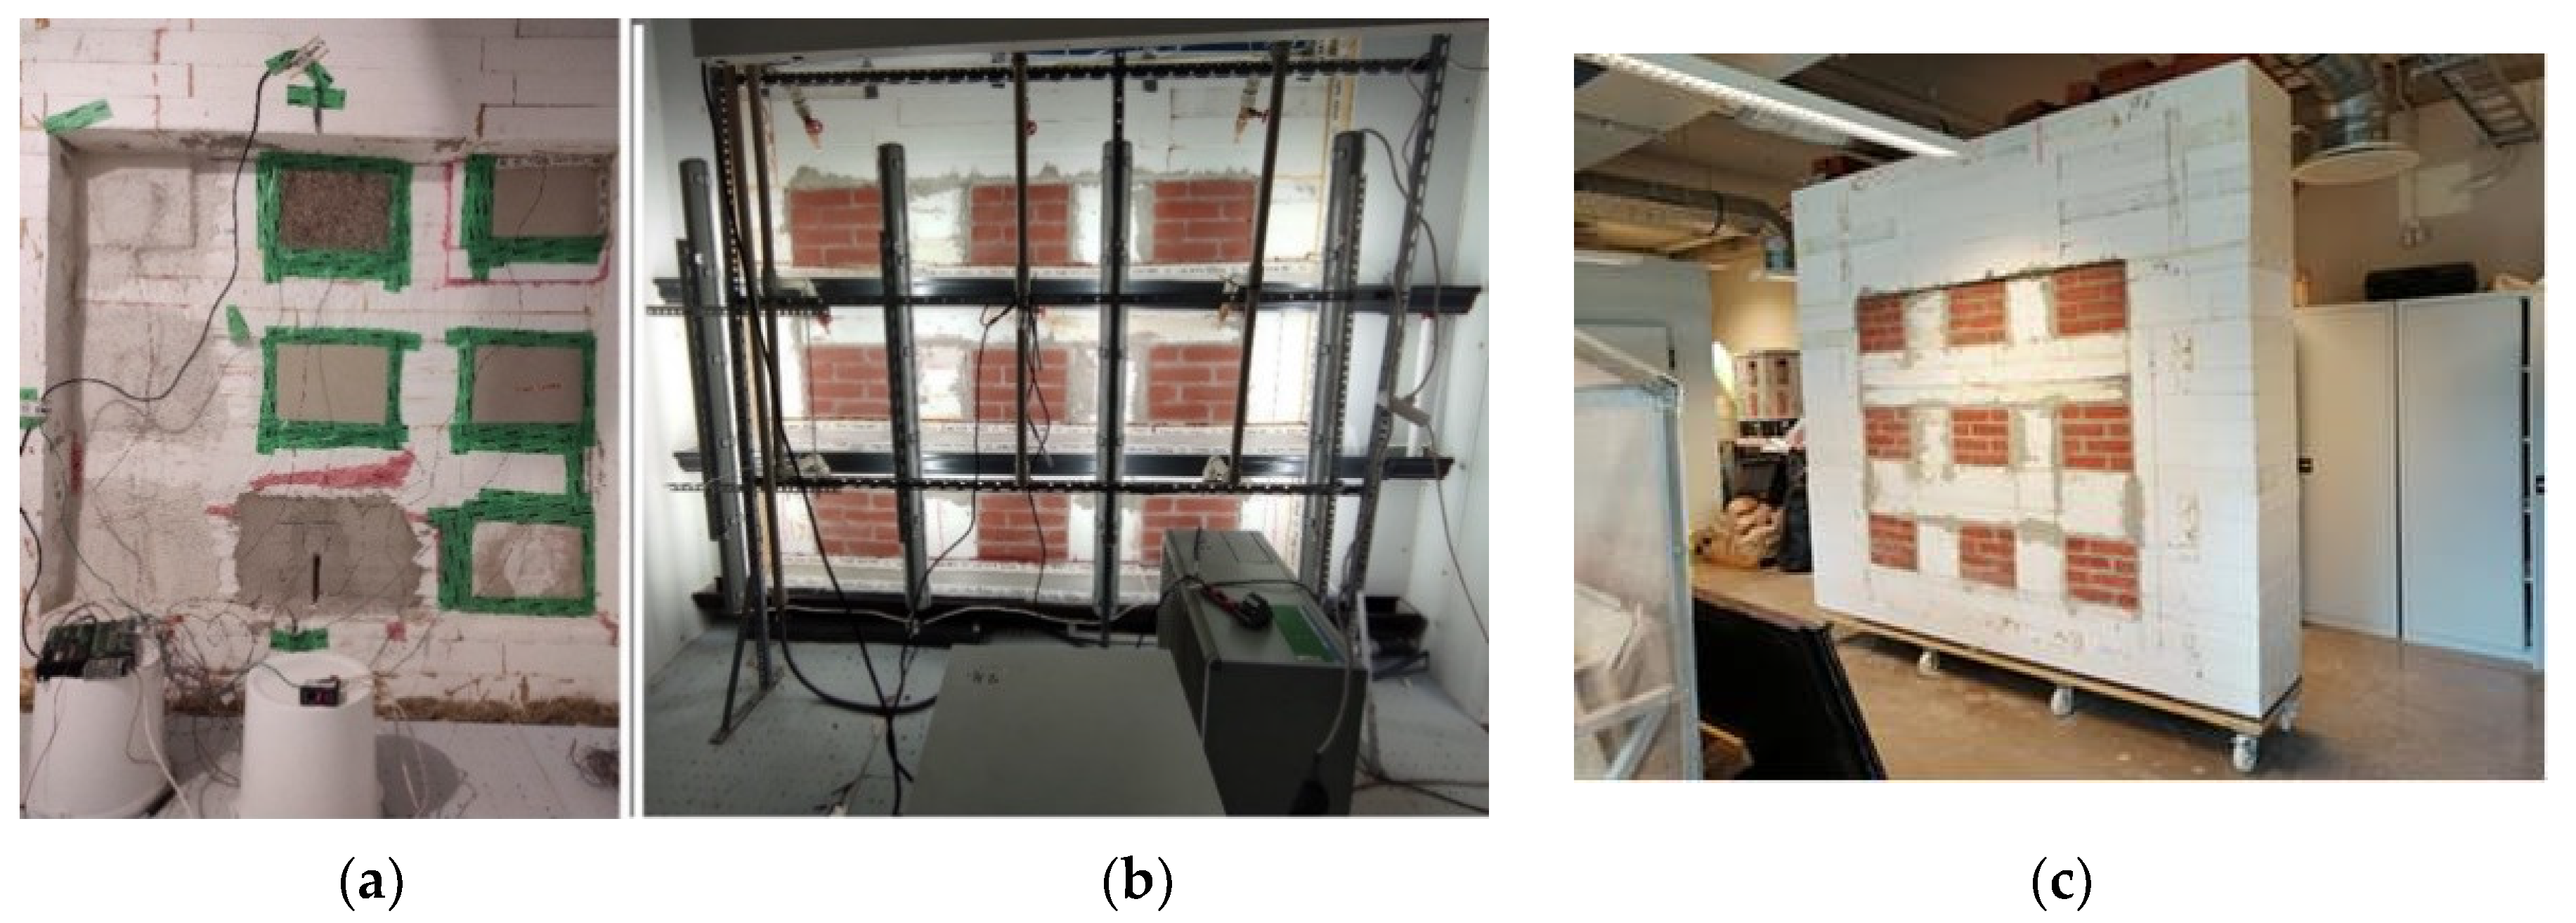
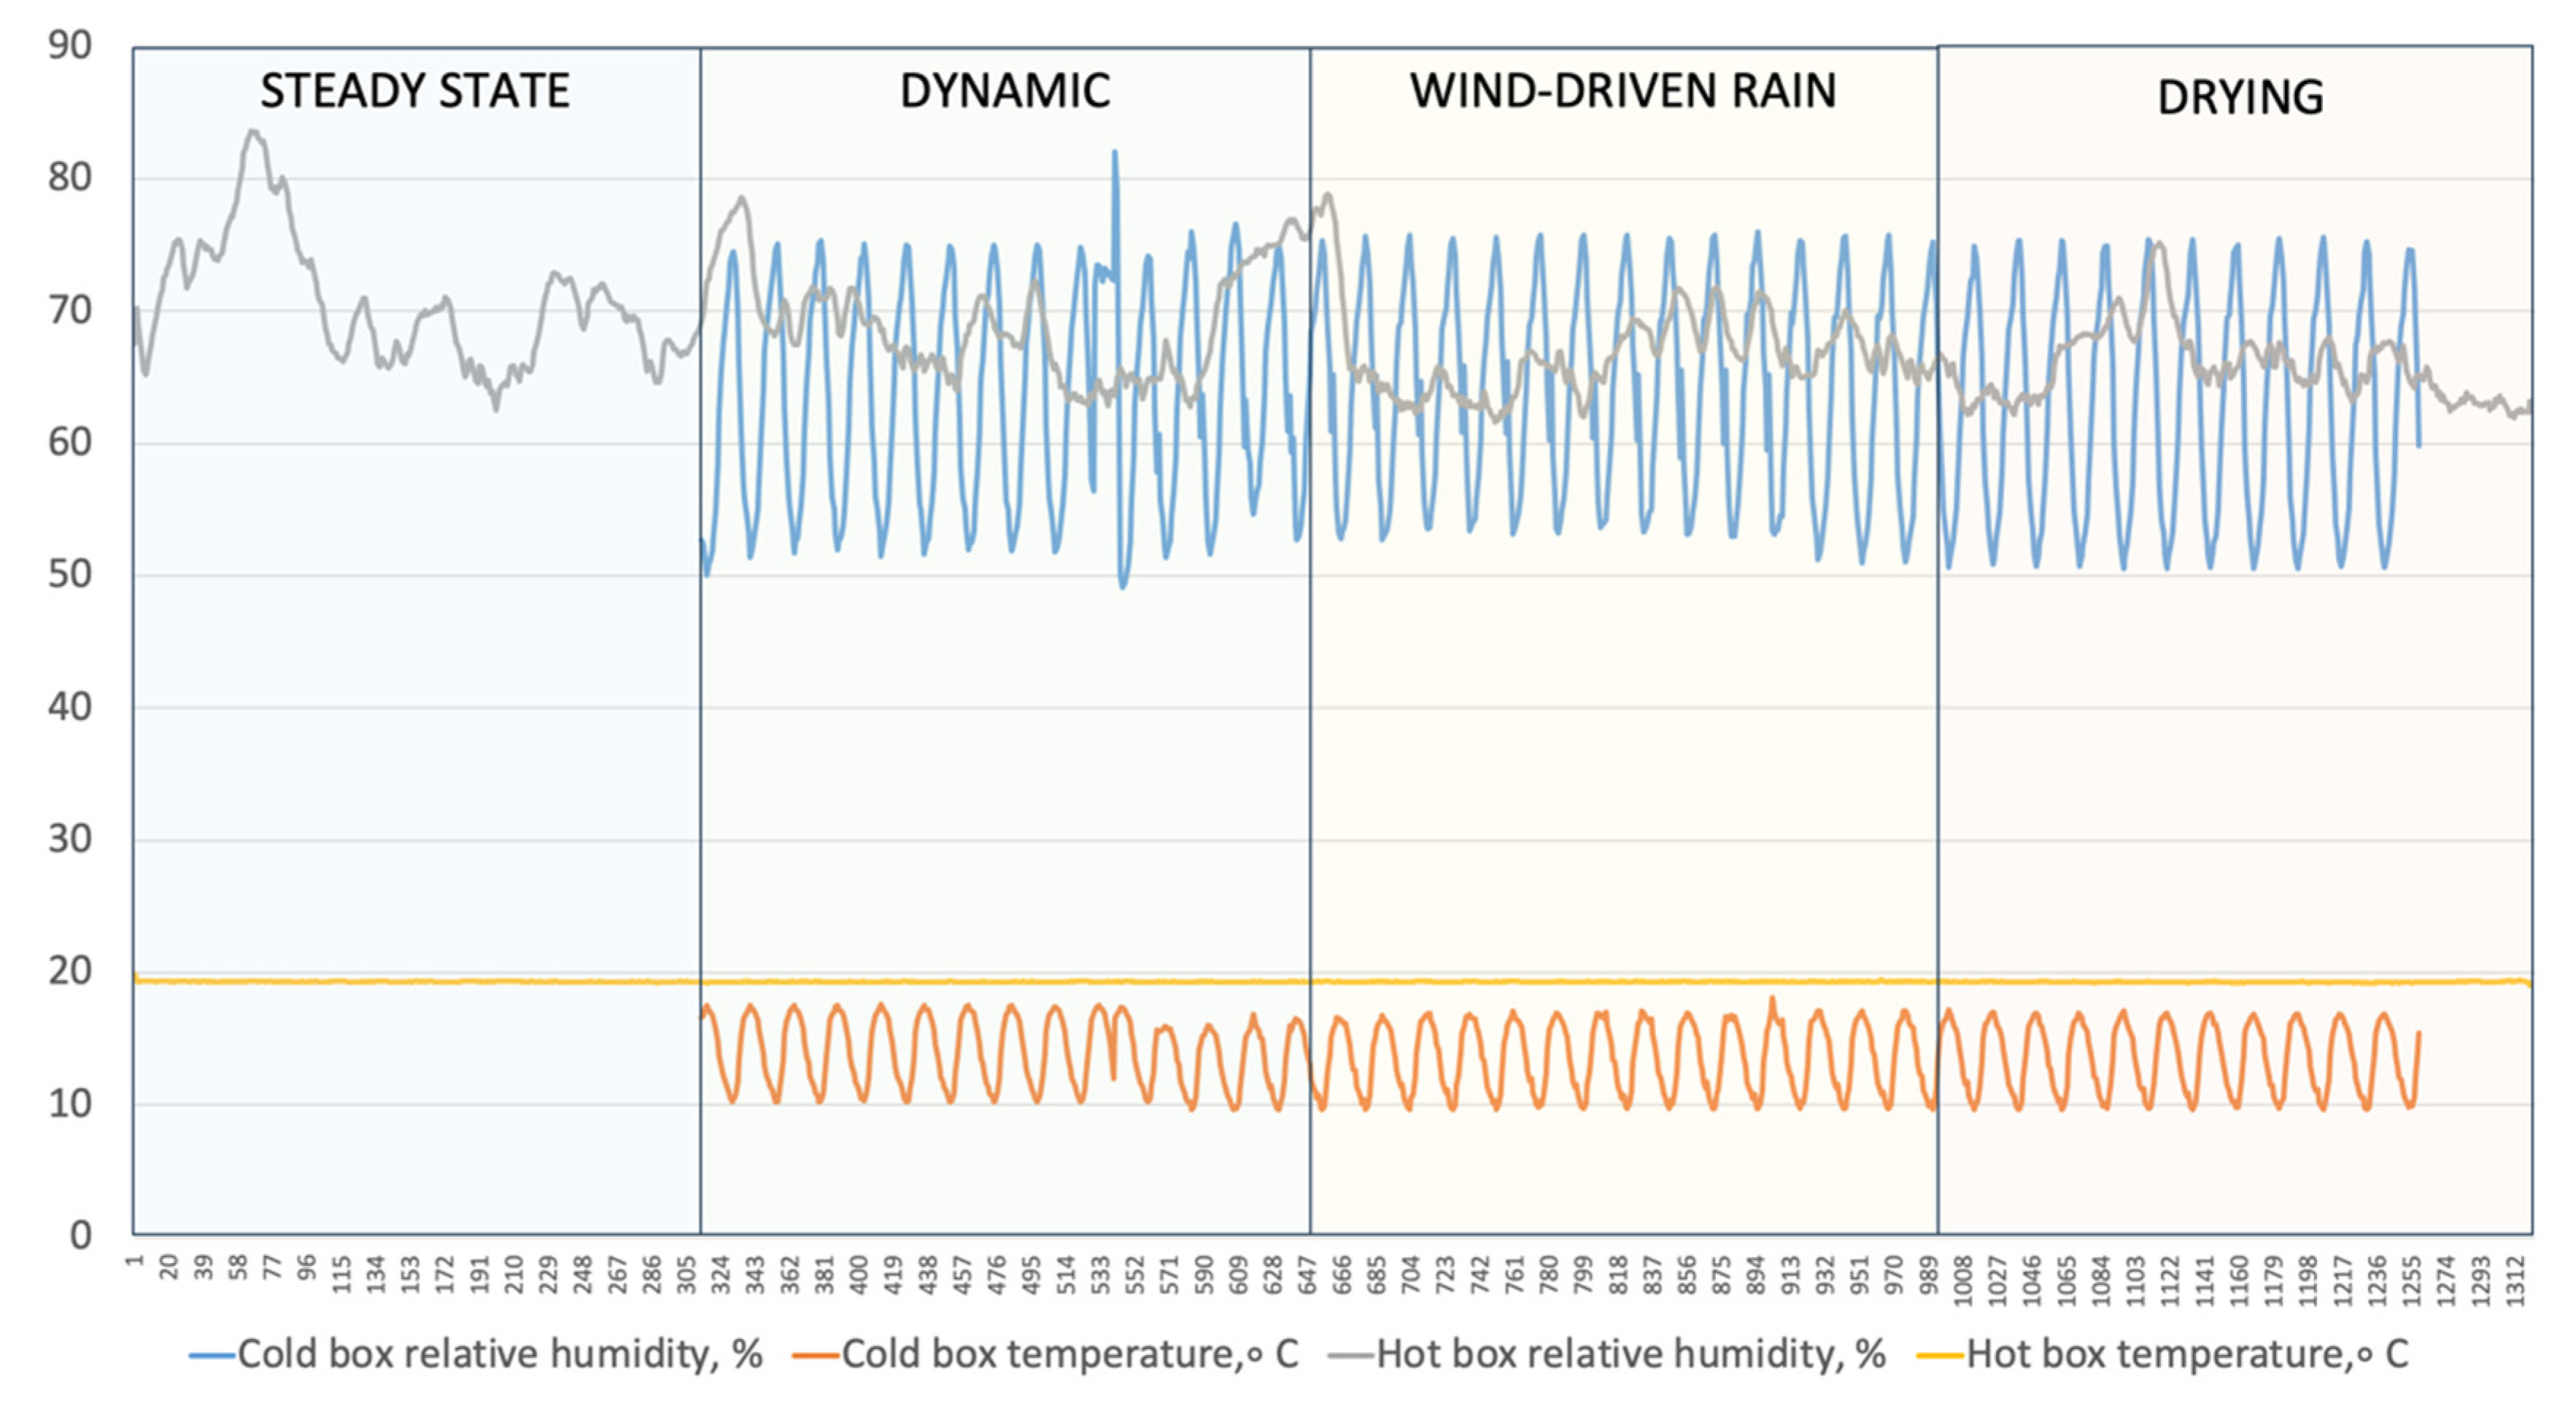
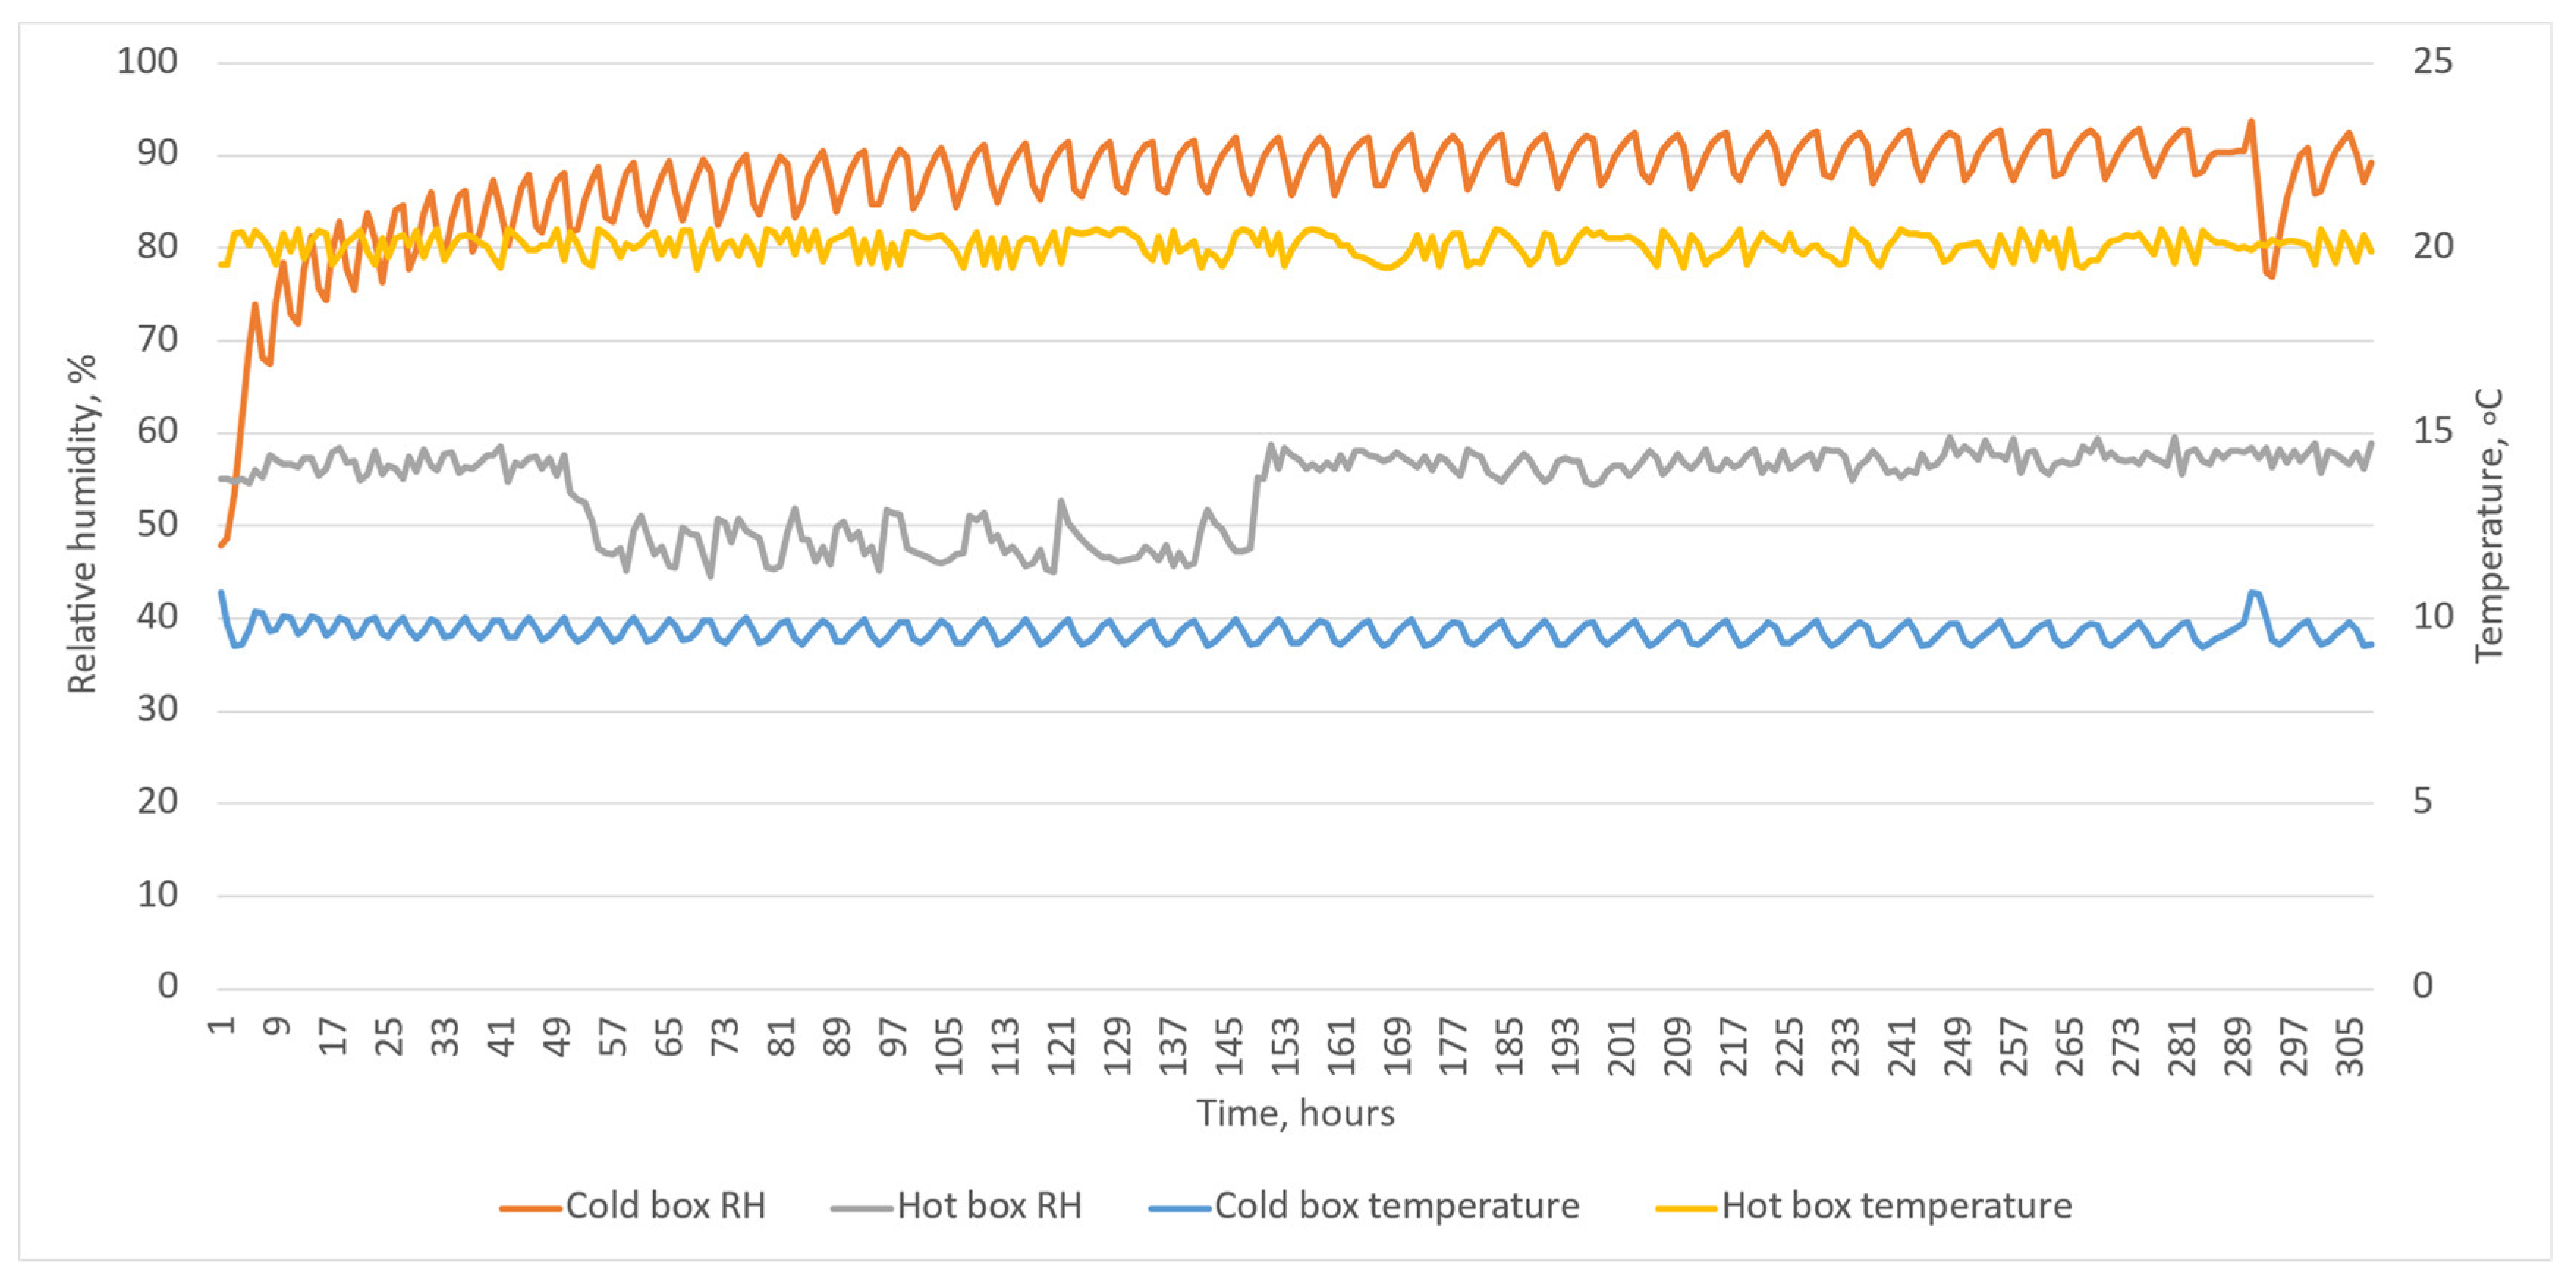
2.2. Experimental Setup and Testing Procedures

Two climate chambers (hot-box for indoor climate and cold-box for outdoor climate) were used to test insulation systems in a controlled environment (see Figure 1).
The setup consisted of a test wall built from EPS (Figure 2). The wall had nine samples of single-leaf masonry wall (40 cm wide, 30 cm high, 25 cm deep each). Two test walls were built—each for one test round.
The test wall was installed between hot-box and cold-box climate chambers. The cold box simulates outdoor conditions by dynamically controlling the chamber’s temperature, relative humidity, wind-driven rain, and solar radiation. Hot-box refers to indoor conditions; this chamber maintained a constant microclimate, maintaining constant relative humidity and temperature. The cold-box chamber was equipped with a water spraying and collecting system on the outside side of the structure to replicate the effects of wind-driven rain (when rain is affected by wind, a large amount of water impacts vertical surfaces). The system consisted of 9 nozzles, one for each wall sample, a pump, plastic pipes for the water distribution system, and a water collection system (see Figure 2b). Solar radiation simulation lamps simulated exposure to the sun.
Each insulation system was attached to a single-leaf masonry sample built from industrially produced new bricks. New bricks were used to reduce the impact of uncertainty of material properties. Before starting the measurements, a conditioning period in the room condition was kept for the wall specimens to dry out. Figure 3 provides a simplified 2D model of the masonry sample in a cross-section from indoors to outdoors.
Parameter values for the cold-box for all cycles were based on the weather data from 2014 to 2018 to mimic outdoor environmental conditions. They were obtained from the public observation database [36]. The decisive criterion for choosing the month for modeling the temperature fluctuation cycle was the highest amplitude of the daily temperature fluctuations. After the analysis, it was decided to model the temperature and relative humidity fluctuations according to the situation in May. Another critical selection criterion for the month was solar radiation on a vertical surface. The daily average hourly radiation profile for May was obtained. The average maximum amount of solar radiation was determined to be 607 W/m2. On the south-facing wall, the maximum solar radiation was 432 W/m2, and the total radiation received was 4037 Wh/day. With a constant solar simulator power (rounded to 450 W/m2), the solar simulator should be operated for approximately 8 h daily to reach 4037 Wh/day. In addition to temperature, relative humidity, and solar radiation data, horizontal precipitation data were also analyzed. The average amount of precipitation over the days in May considered was 10.1 mm. Since the intensity of wind-driven rain depends heavily on wind speed, horizontal rainfall, and direction, it is impossible to provide 100% reality-imitating dynamic conditions affected by all these factors in the laboratory. Therefore, following an analysis of the amount of rainfall, it was decided to use a different approach to assess the flow of wind-blown rain on the wall. The estimated wind rain flow was estimated to be 0.278 l/(m2 s). This amount of water was sprayed on the cold side of the wall for five minutes a day for two weeks during the rainy cycle of the test.
Eighteen insulation systems were tested in two rounds: 9 systems per round. The cycles were developed based on technical options, previous studies’ experience, and weather data analysis. The experimental plan was based on the following conditions in chambers:
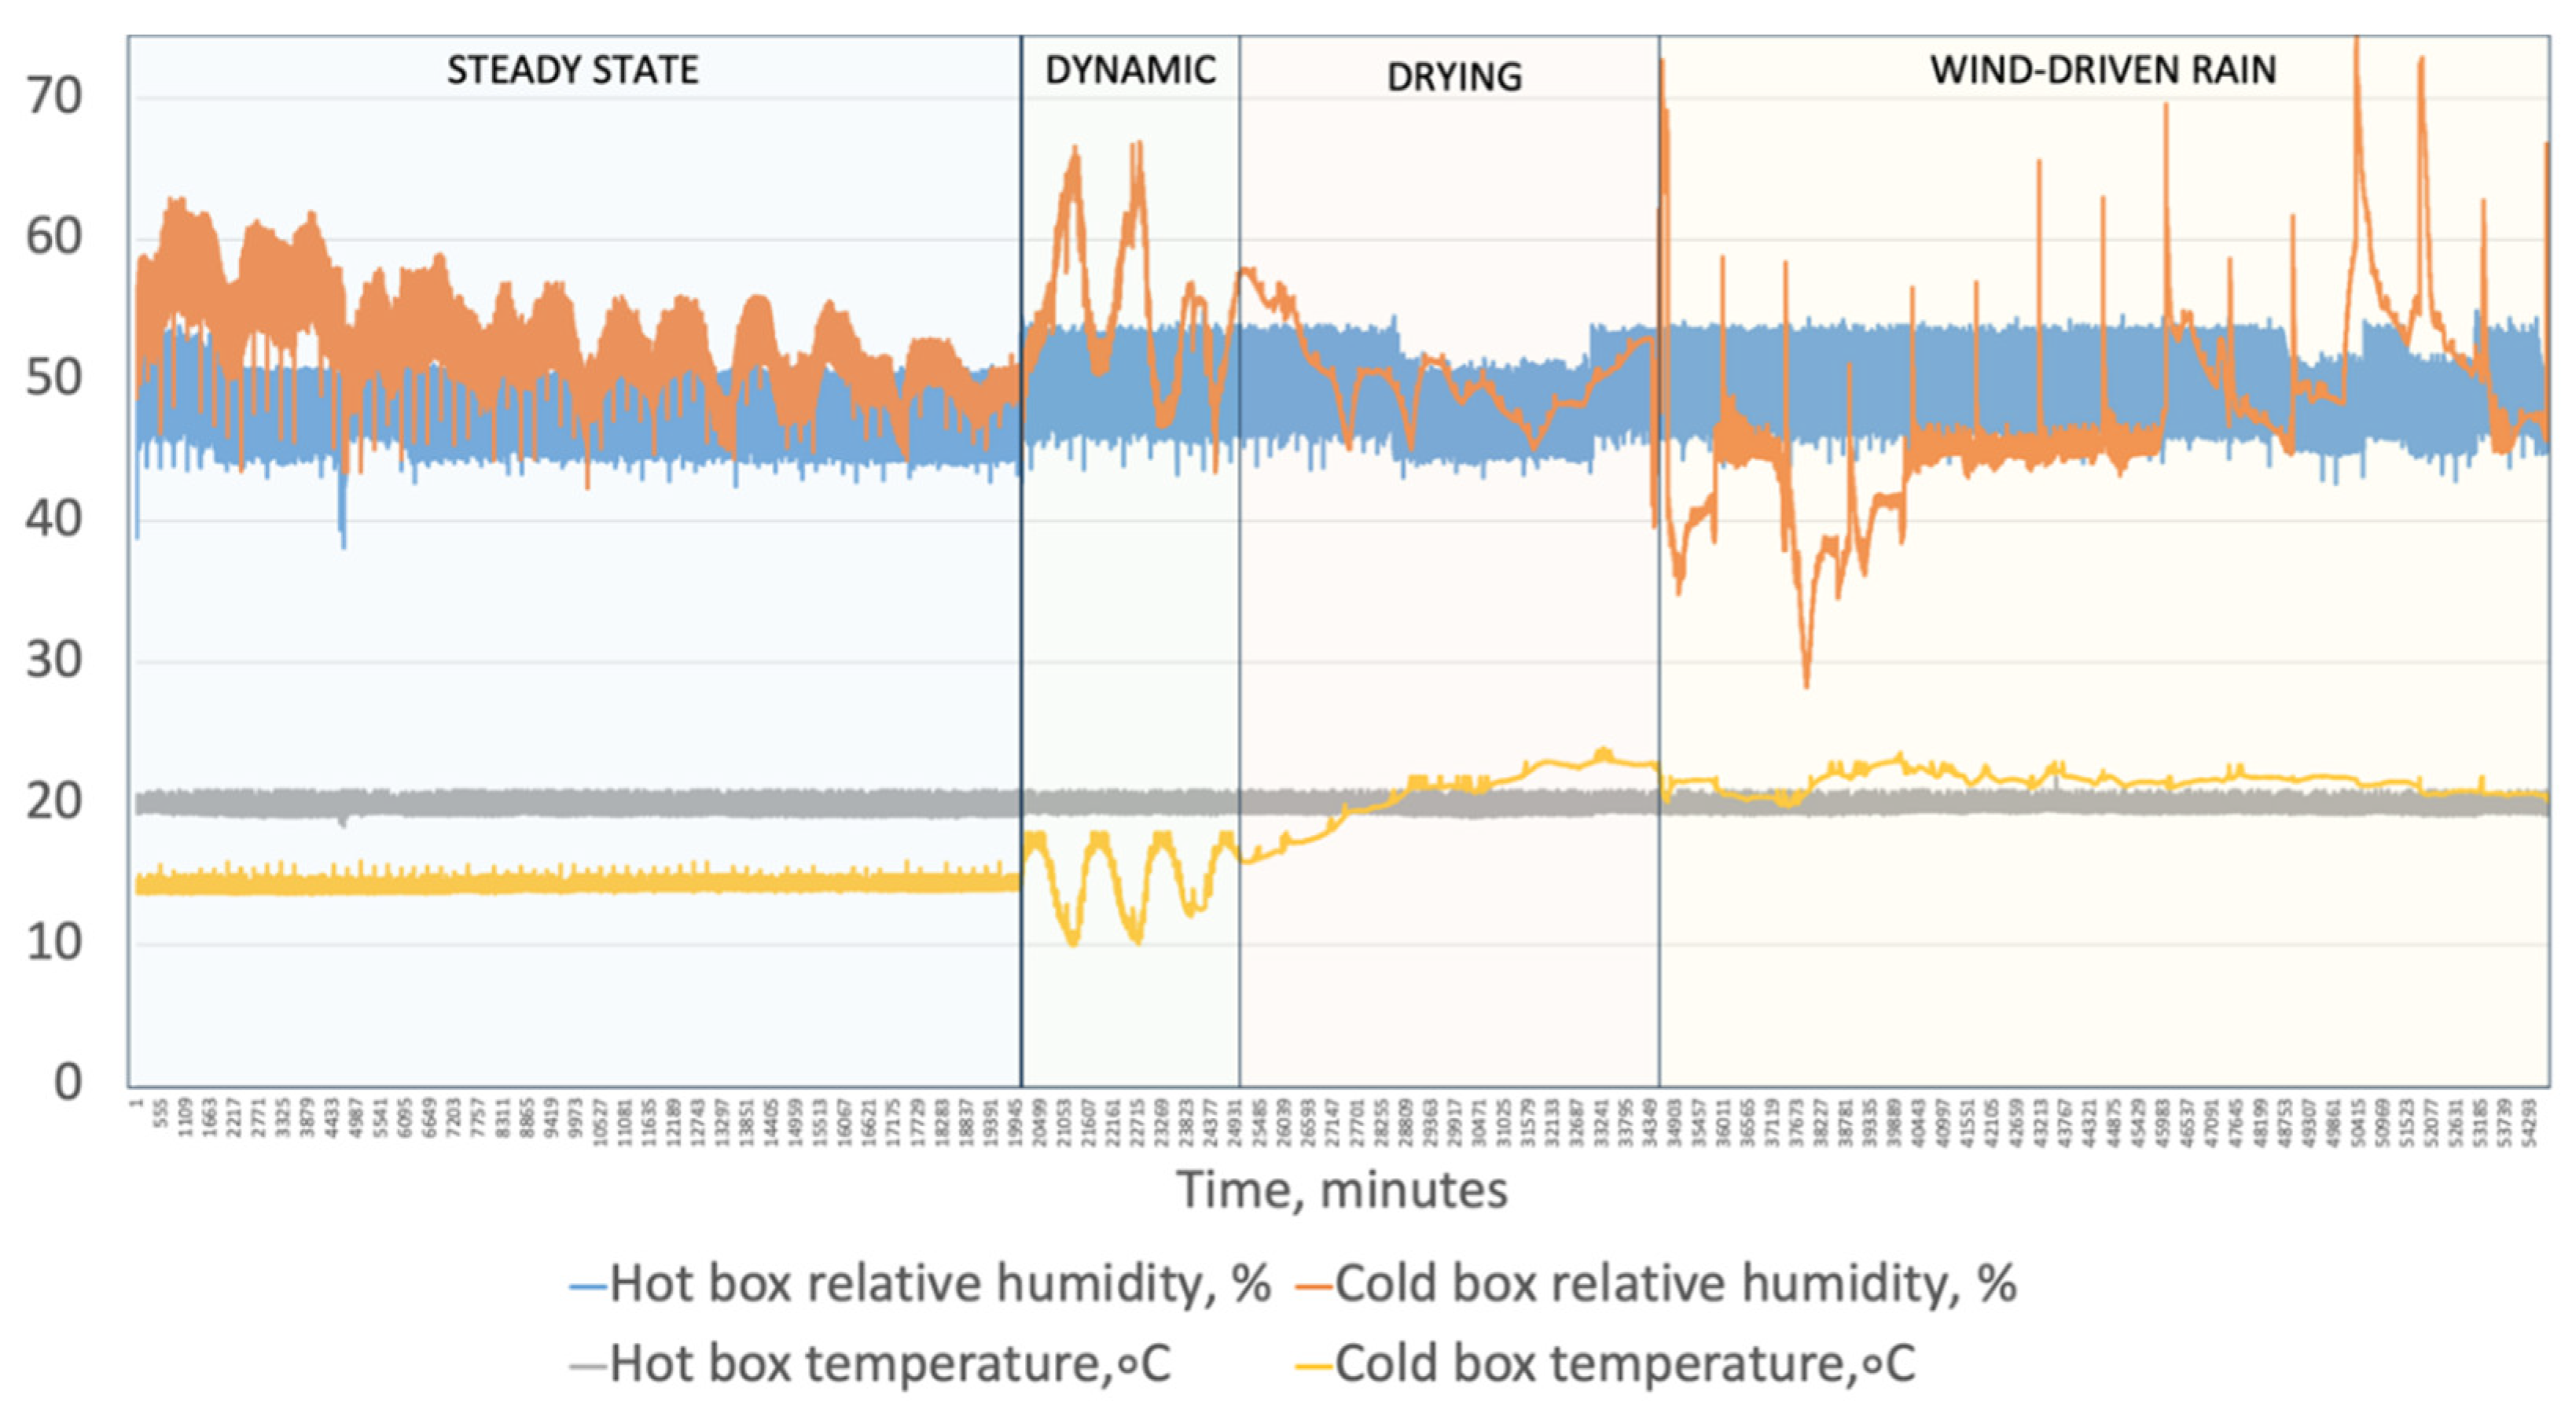
  • Hot-box chamber temperature +20 °C, relative humidity 50%.
  • old-box chamber temperature at the steady state conditions +10 °C and relative humidity 50%. For dynamic cycles, temperature and relative humidity followed outdoor daily fluctuations in May (see Figure 4). Wind-driven rain was 0.278 l/m2 s (5 min every day) and solar radiation 300 W/m2 (8 h per day)
The relative humidity between the insulation layer and the masonry was measured using Honeywell HIH-4000 series humidity sensors. Humidity sensors were installed under the insulation layer together with K-type thermocouples. The sensors in each sample measured the conditions between the insulation layer and the masonry wall where there is a significant risk of condensation. The Campbell Scientific CR1000 data logger recorded the data on a computer. In addition to the measurements of relative humidity and temperature under the insulation, measurements of masonry humidity were performed with non-invasive measurement methods (dielectric and microwave probe). Non-invasive moisture measurements were taken before and after each test cycle, five times during the test. Trotec T3000 (Trotect GmbH, Heinsberg, Germany) was used for measurements. A microwave probe was used to measure moisture at a depth of 20 cm, and a dielectric probe was used to measure moisture at a depth of 2 cm.

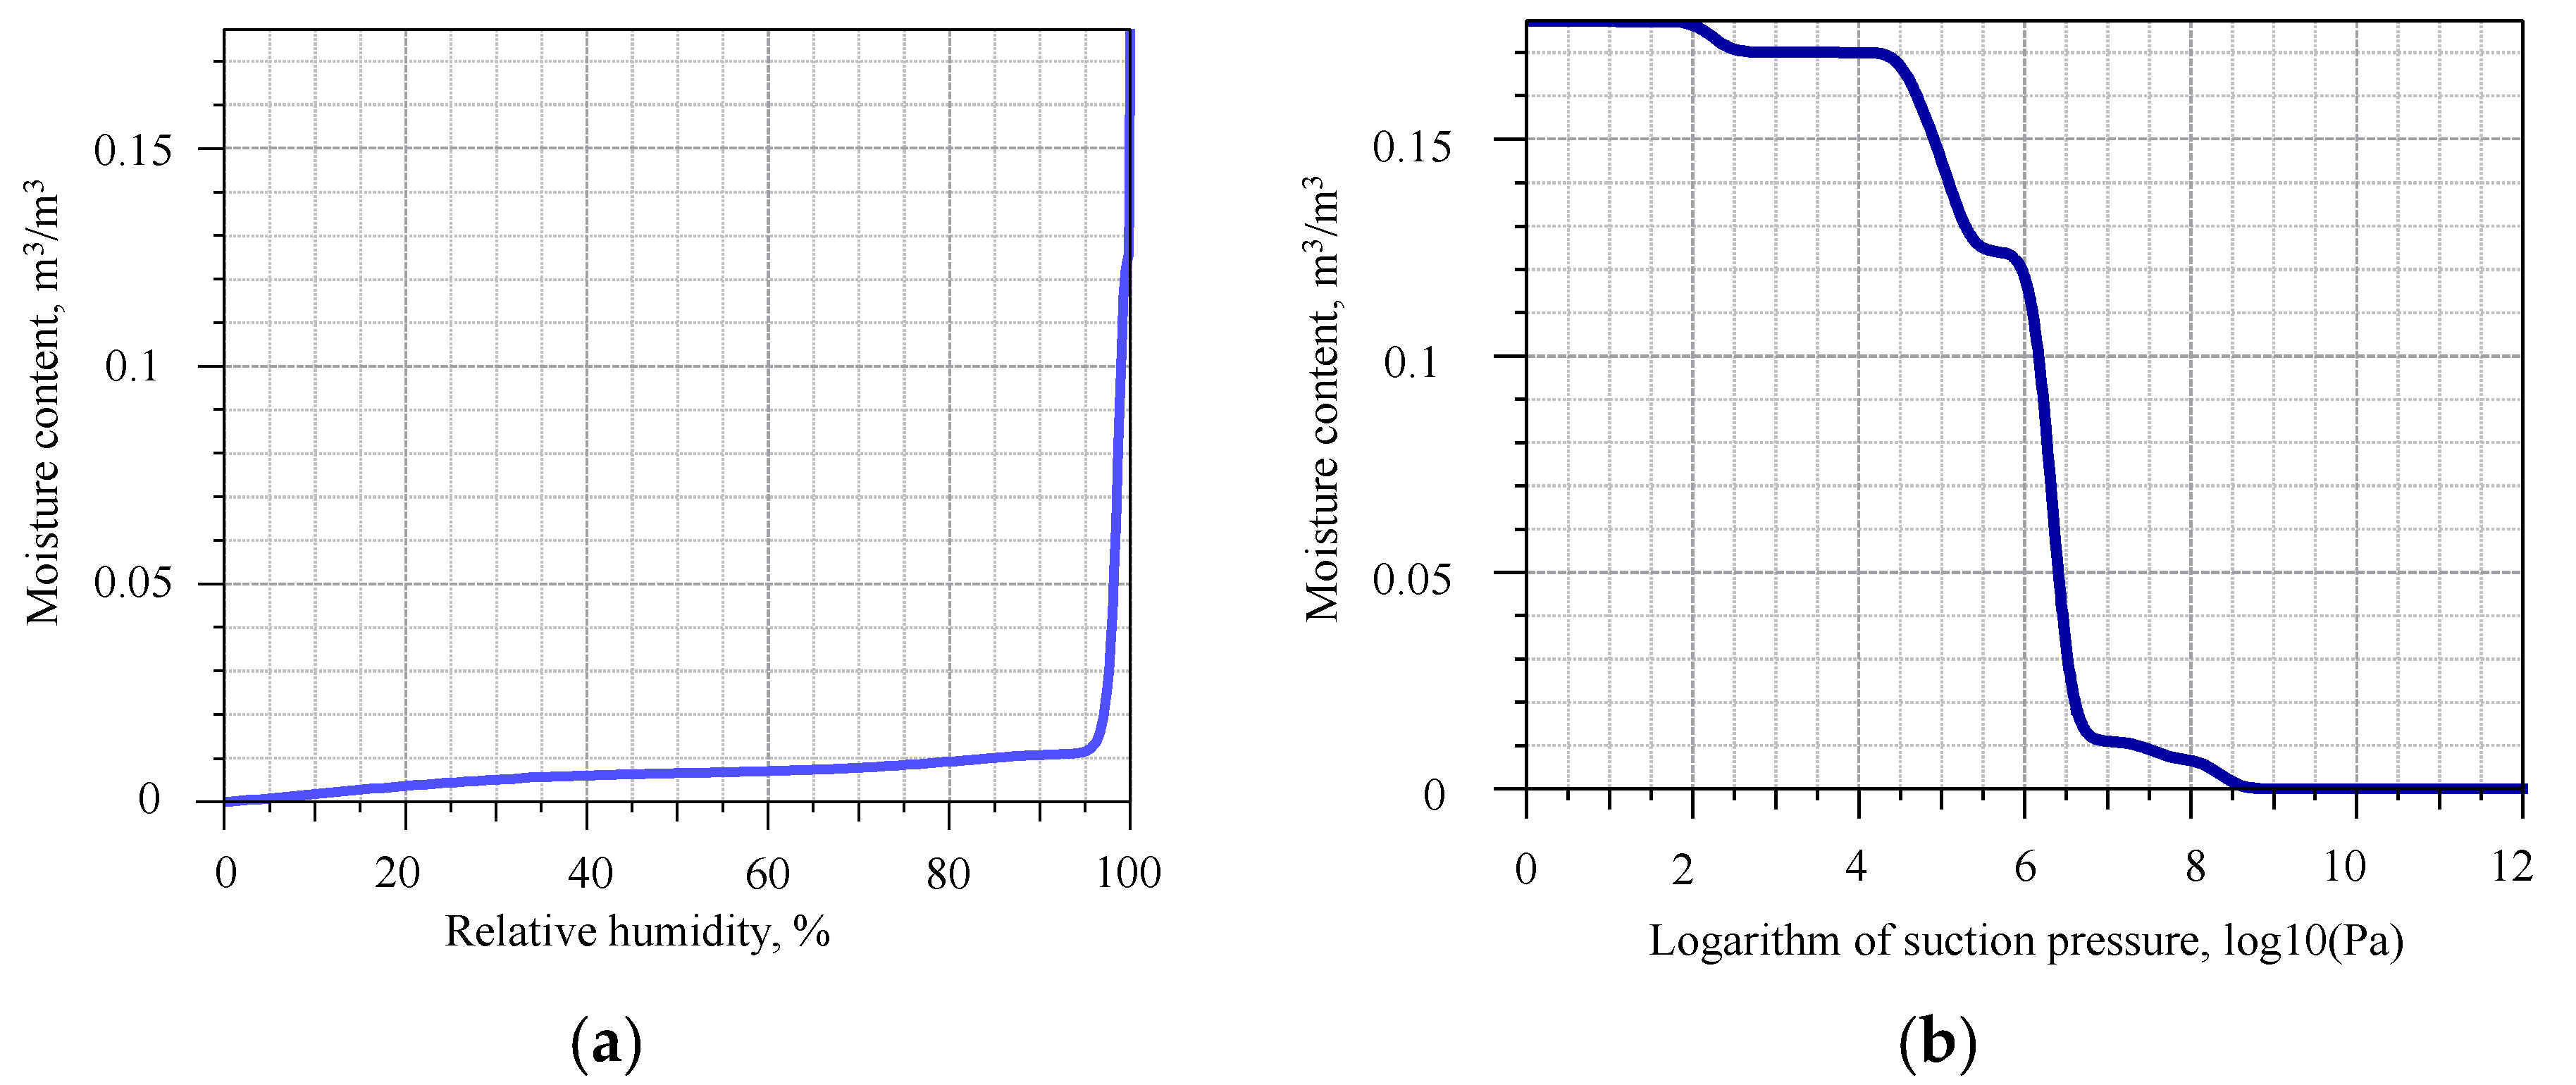
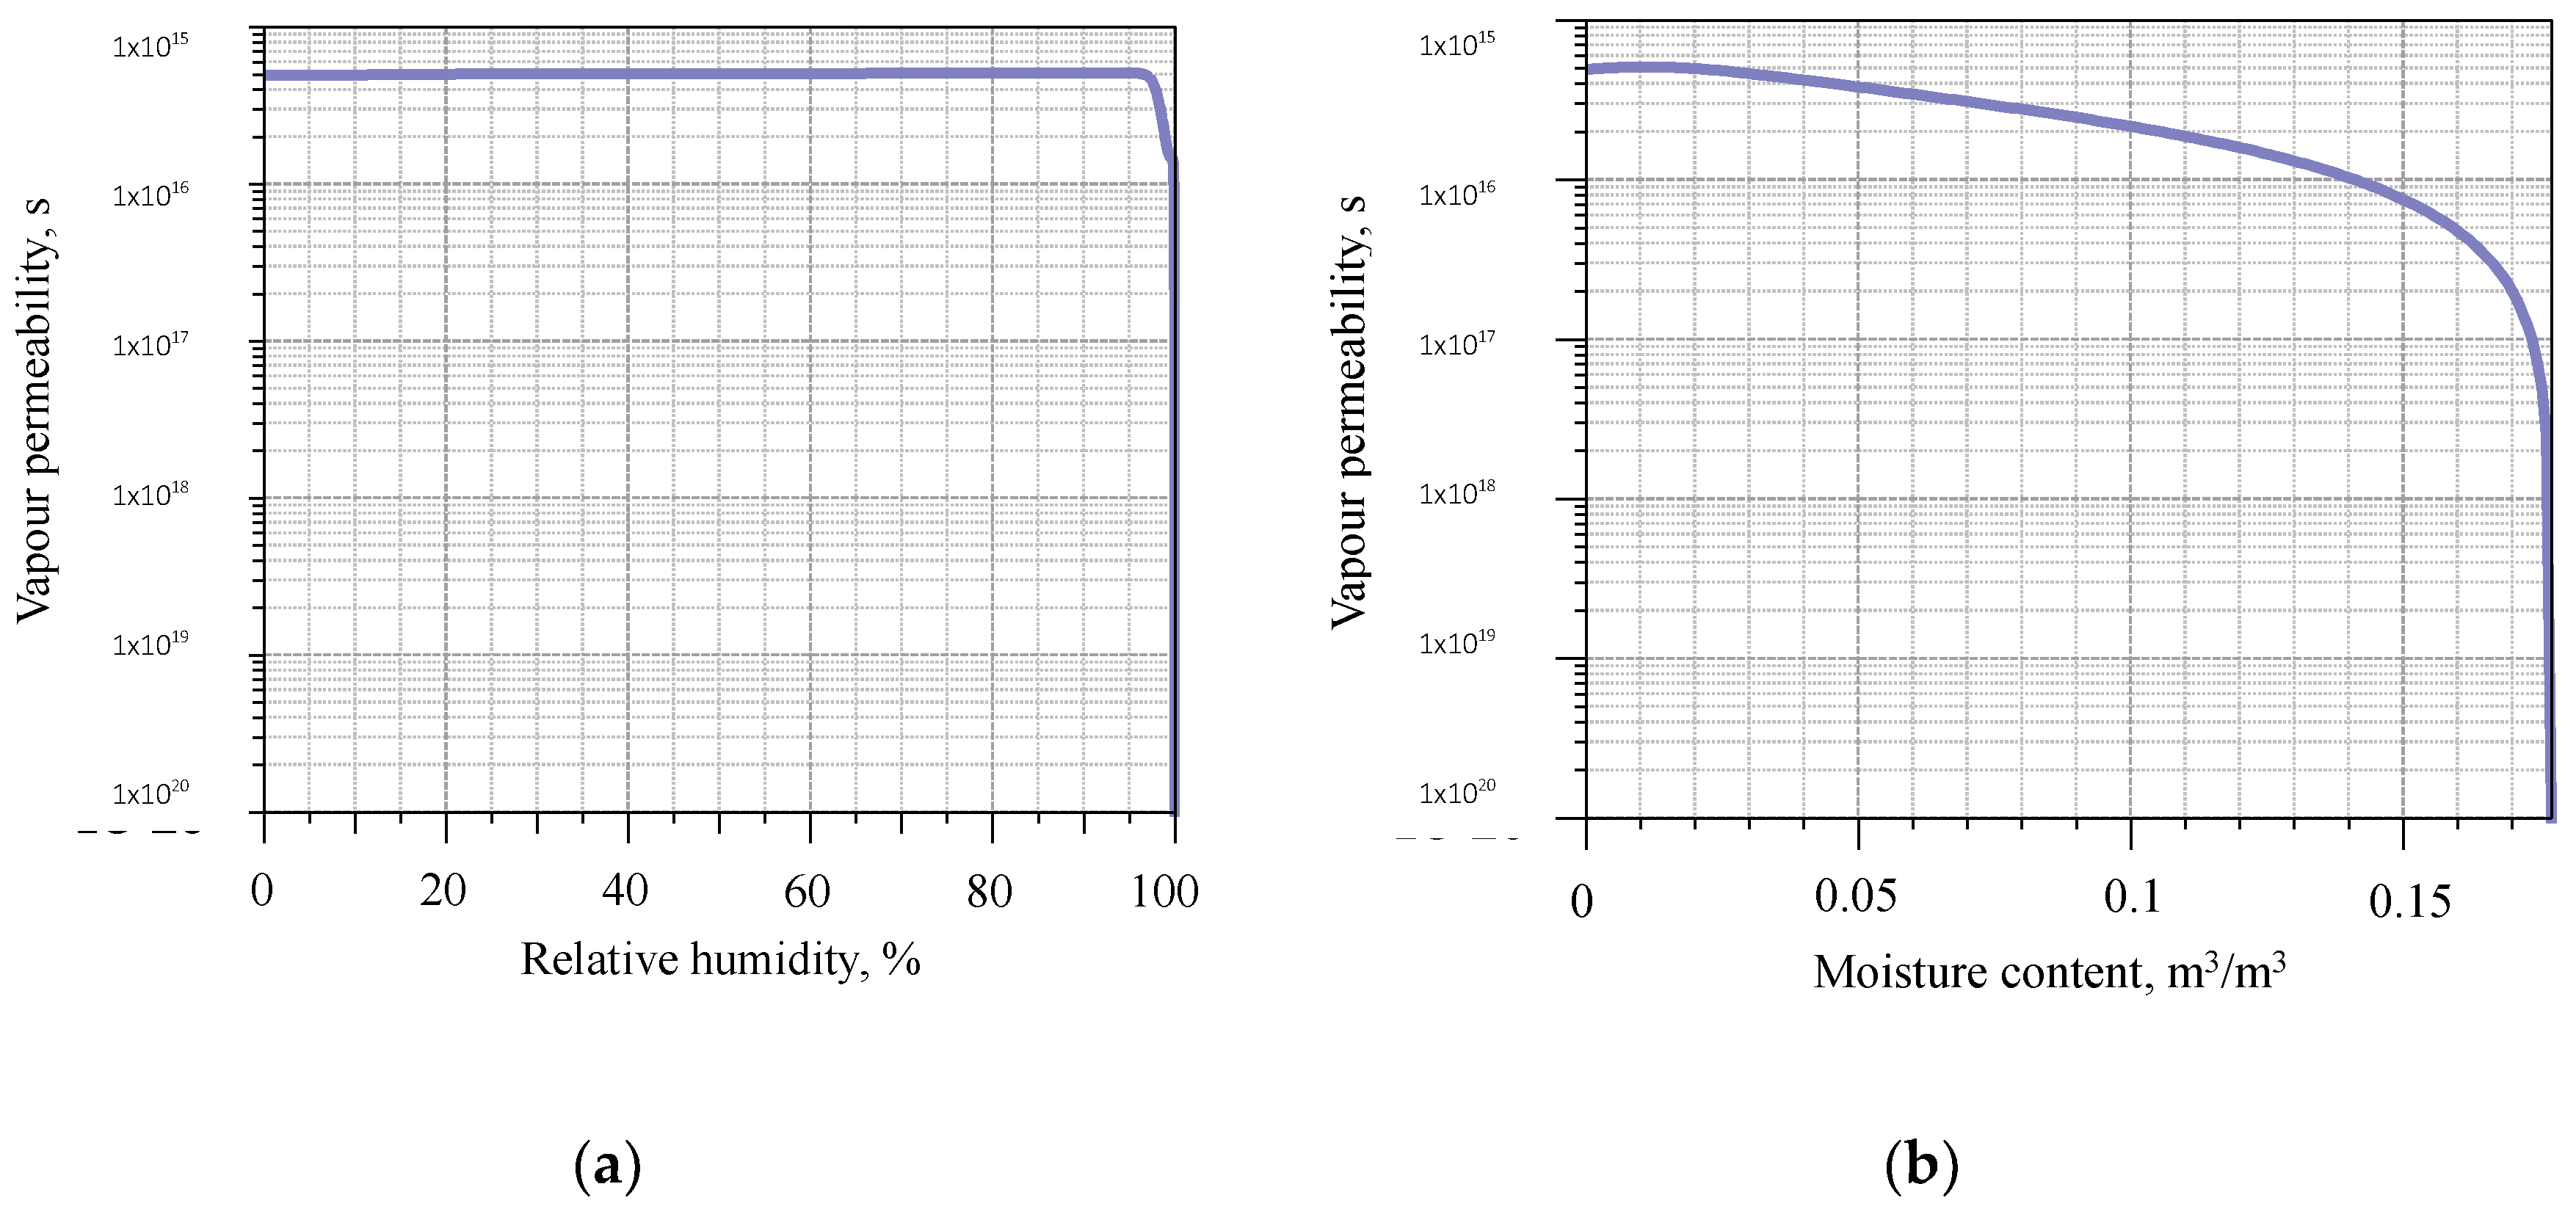
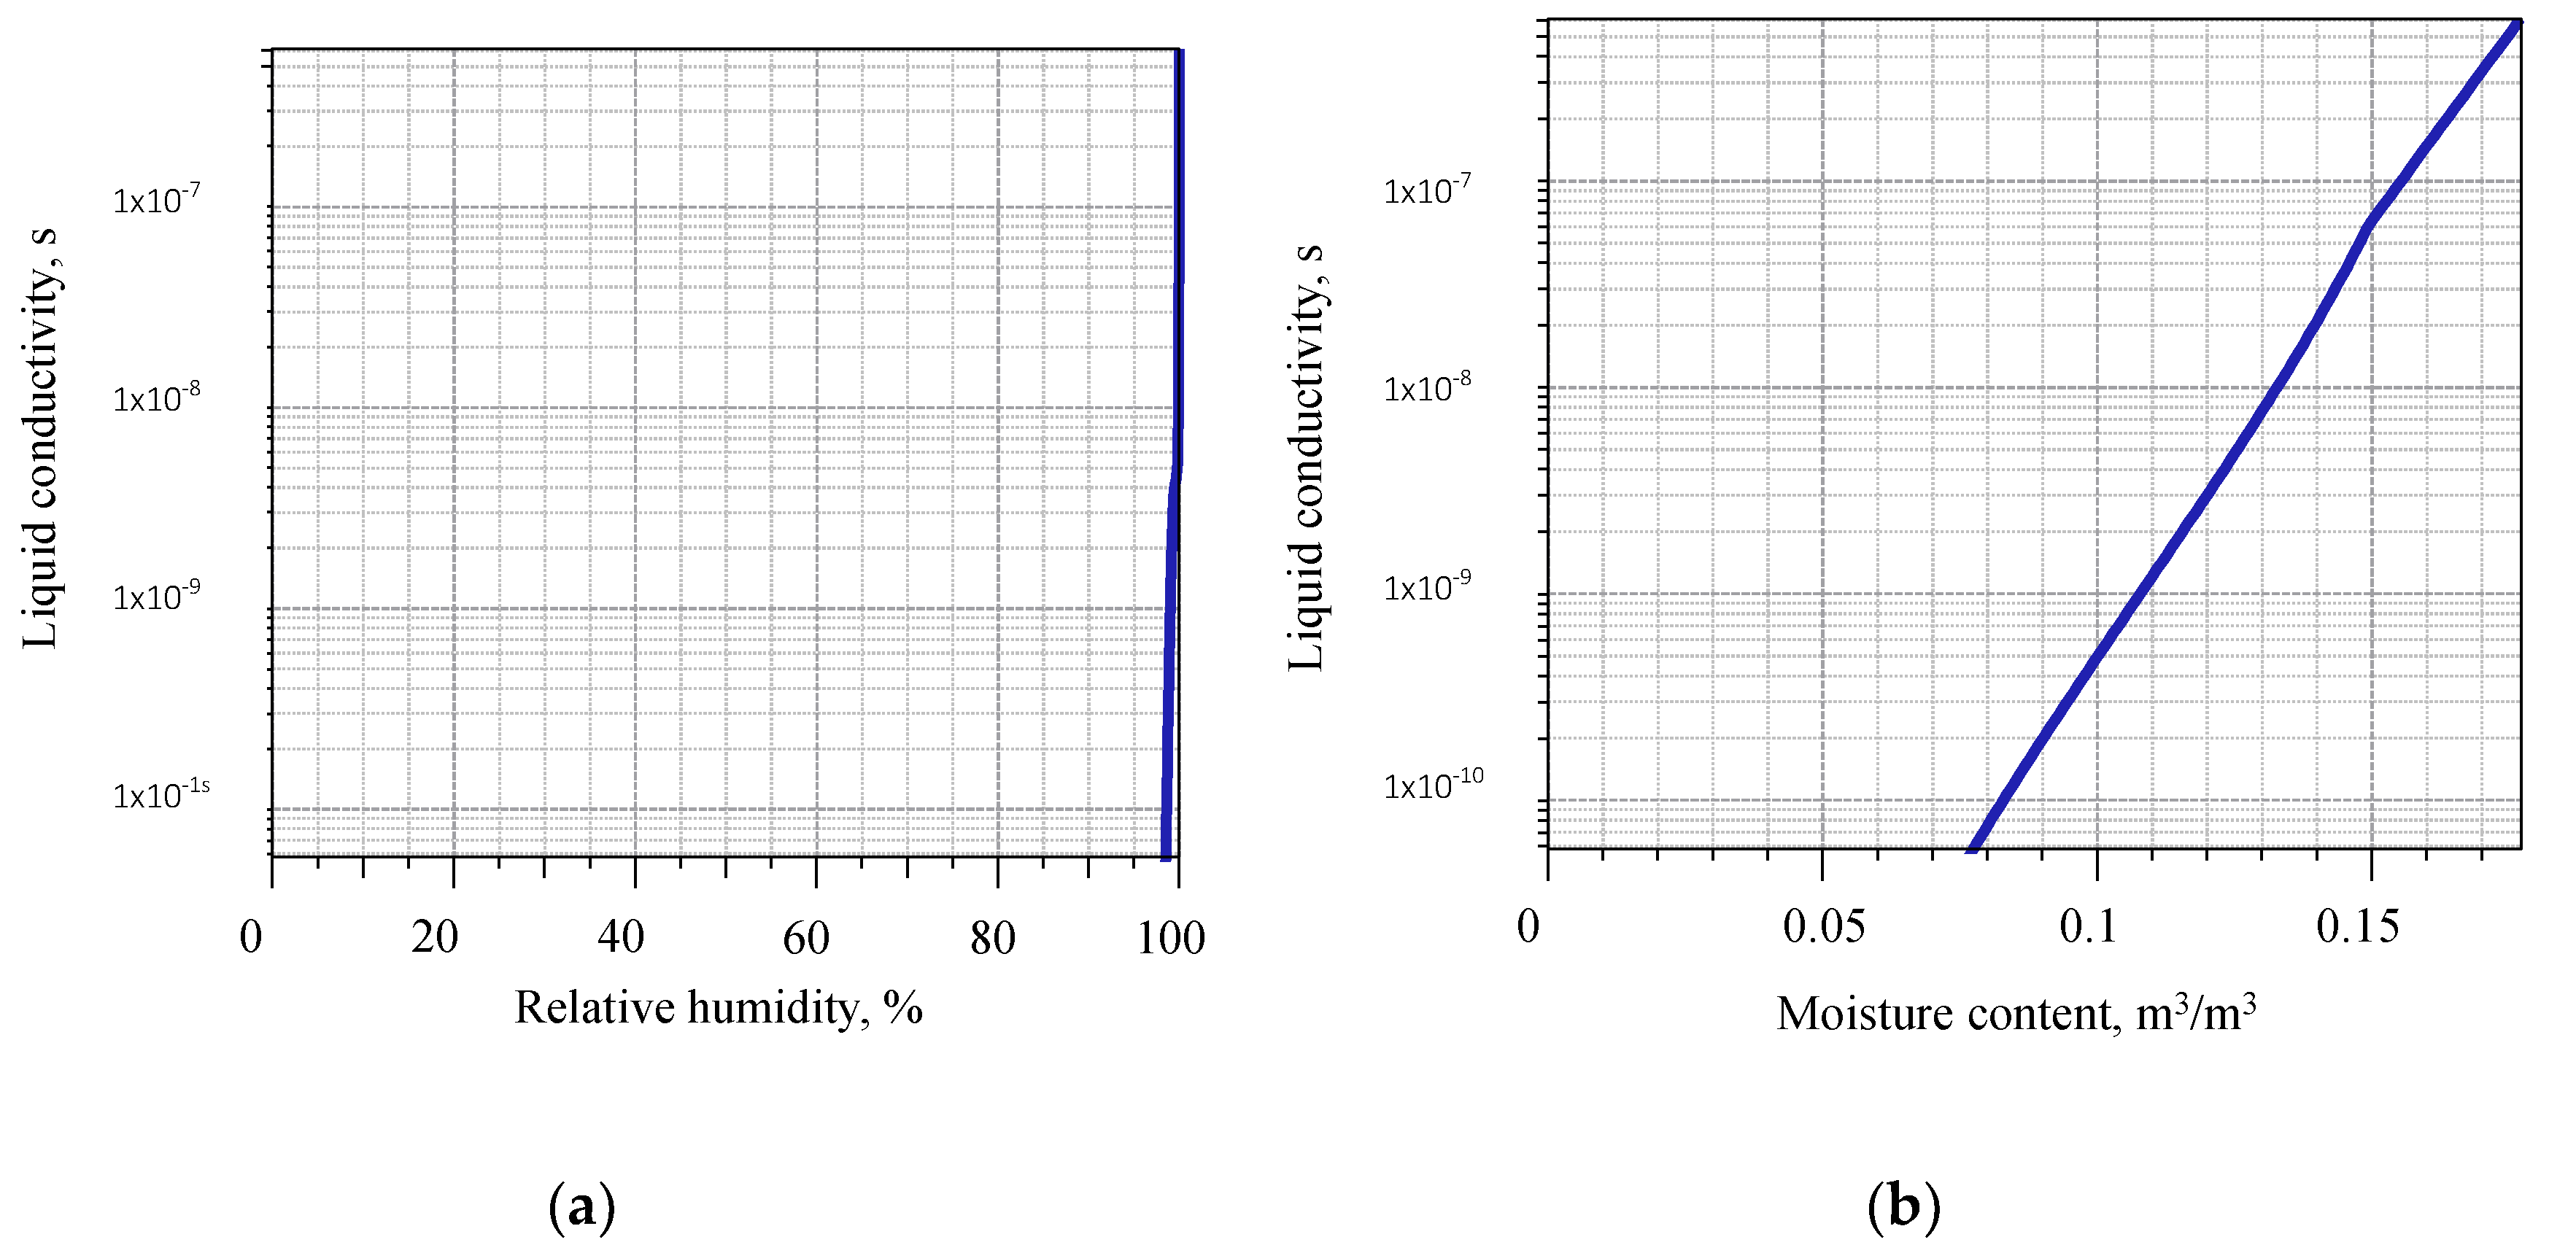
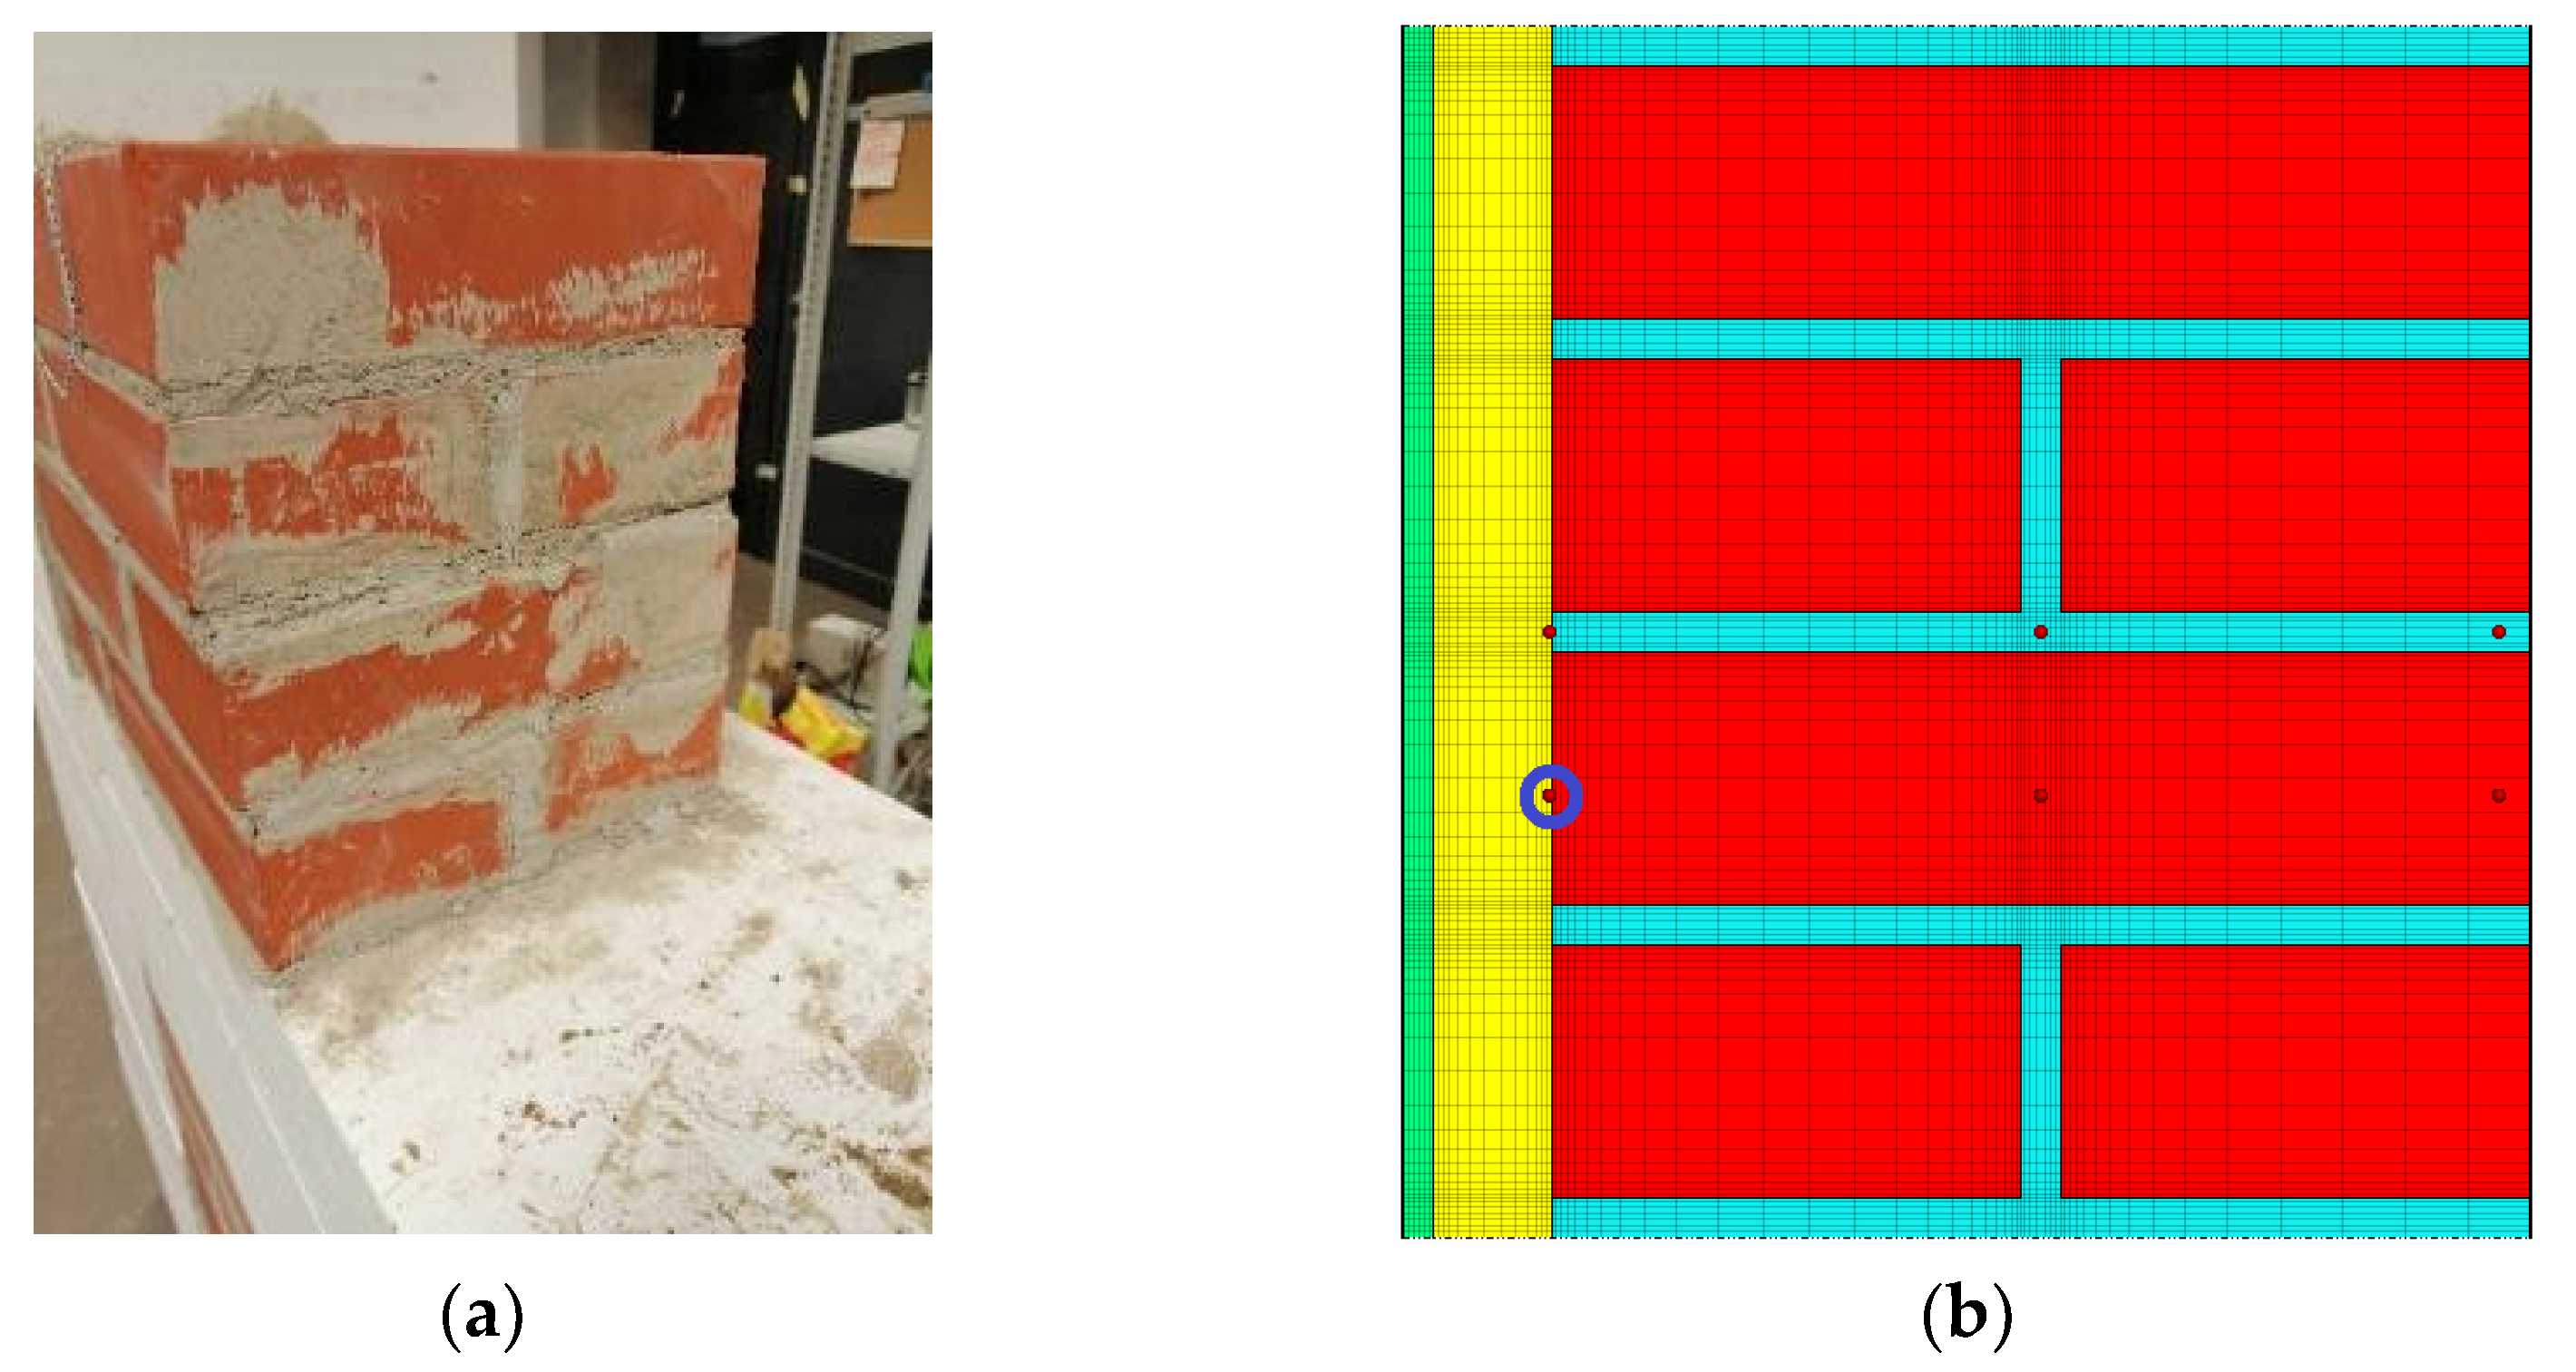
2.3. Numerical Simulation

The simulations for the insulation systems from the first test round steady state conditions were carried out in the DELPHIN software by using similar materials from the existing material database. The materials were selected based on the specifications, which are provided by the manufacturers for the original materials used in the laboratory experiment. These simulations were carried out both according to the variable outdoor climate conditions as well as for constant conditions to obtain data and compare it to the measurement data acquired from the laboratory experiment. The initial temperature and relative humidity conditions of the simulations were set to comply with the ones measured at the beginning of the experiment and the outdoor relative humidity was increased to 93% to match the conditions maintained in the climate chamber. The time step for the simulations was set to 1 h. Each insulation system was also modeled in the DELPHIN 6 software (see Figure 5). The overview of insulation materials is given in Appendix A Table A2. A DELPHIN file was created for the hygrothermal properties of bricks used in the test walls. Material tests were performed at the laboratory and test results are presented in Appendix A Table A3.

3. Results and Discussion

The first test round started with the first steady-state test for two weeks to gather data for numerical simulation. After that, the test wall was conditioned for 12 weeks in a room environment. That was followed by four cycles with various conditions. The second test round was designed differently from the first to better distinguish the impact of individual dynamic processes on measurement results, which is essential for drawing more accurate conclusions.
In all tests, temperature and relative humidity measurements between the insulation material and masonry look noisy. This is due to conditions in both climate chambers. This noise is in response to periodic fluctuations of air conditioning equipment working cycles (heater, humidifier, dehumidifier, refrigerator), and temperature and relative humidity oscillates in an amplitude of 1 °C. Both test rounds were carried out during the COVID-19 period, and laboratory access restrictions impacted the laboratory team’s ability to react to issues related to malfunctioning air conditioning equipment in both chambers.
Two test rounds with various test conditions were carried out to simulate steady and unsteady/transient conditions. The first test round started with the steady-state conditions to be used as an experimental basis for numerical simulations with eight insulation systems (insulation systems (1–8) from Appendix A Table A1). Twelve weeks after the first steady-state test, the second steady-state test started, followed by dynamic conditions, wind-driven rain, and drying condition. Figure 6 presents measured cold- and hot-box temperatures and relative humidity during the first test round for each test cycle. Due to a malfunction of the data logger, cold-box temperature and relative humidity were not logged during the steady-state cycle.
Figure 7 presents the measured temperature between insulation material and masonry for tested insulation systems during the first test round. Oscillations followed temperature dynamics in the cold box. The temperature in all insulation systems followed the same trend. However, the temperature reached various levels.
Figure 8 illustrates the measured relative humidity between insulation material and masonry for tested insulation systems during the first test round. The relative humidity in each insulation system exhibited different behavior in terms of amplitude and value. The oscillation amplitude was determined by temperature changes in the cold-box relative to the hot-box temperature and the hygrothermal properties of the insulation system. The overall relative humidity trend followed the relative humidity in the hot-box based on the hygrothermal properties of the insulation system.
Figure 9 presents the results of non-invasive moisture measurements for all cycles. Measurements were carried out to determine relative changes in moisture at 2 cm depth and 20 cm depth from the exterior surface of the masonry (5 cm from the internal surface of the masonry). The change in moisture value relative to initial moisture at a 2 cm depth (Figure 9a) revealed that after two weeks of steady-state conditions, all insulation systems were in the range of ±10% change in moisture level. After two weeks of dynamic dry cycle, all masonry wall samples had an increase in moisture from 0% to 18% compared to initial conditions. An increase of 78% to 108% was obtained for masonry moisture change after a dynamic wind-driven cycle compared to initial conditions. Finally, initial moisture increased by 38% to 65% after a dynamic drying cycle. The amplitude of the change in the moisture at the depth of 20 cm (Figure 9b) was less than the 2 cm depth. The shift in moisture after steady-state conditions was between +3% and −20% relative to initial conditions. After the dynamic dry cycle, changes in moisture were in the range of −8% to +10%. The highest changes occurred after a dynamic wind-driven cycle (5% to 60%). Finally, the dynamic drying cycle reduced the gap between initial moisture and actual to the range of −7% to 38%.
The second test round with nine insulation systems (insulation systems (9–18) from Appendix A Table A1) started with steady-state conditions, followed by dynamic conditions, drying conditions, and wind-driven rain for spring conditions. Measured cold- and hot-box temperature and relative humidity during the second test round are presented in Figure 10.
Figure 11 presents the measured temperature between insulation material and masonry for tested insulation systems during the second test round. Similar to the first test round, the temperature in all insulation systems followed the cold-box temperature, and insulation systems exhibited various levels.
The measured relative humidity between insulation material and masonry for tested insulation systems during the second test round is presented in Figure 12. Similar to the first test round, relative humidity exhibited very different behavior for insulation systems, and it mainly depended on the vapor diffusion resistance of the insulation system.
Measurements made with a dielectric probe at a depth of 2 cm maintained a relatively small dispersion after steady-state conditions (±5%). The same distribution was observed after the dynamic cycle. A significant increase in moisture changes was measured after a wind-driven rain cycle, ranging from 175% (XPS with the surface layer of Sika cement) to 215% (for PIR + aluminum cover). The average increase in moisture after a wind-driven rain cycle compared to initial conditions was 198%. In contrast to measurements at a depth of 2 cm, the dispersion between masonry samples was greater. After the first two weeks of constant conditions, moisture values in 20 cm depth in masonry samples begin to differ from +9% to −25% compared to initial conditions. The distribution of changes was the same after the dynamic cycle. After a wind-driven rain cycle, all masonry samples exhibited an increase in moisture level in the 10 to 35% range. Results are showed in Figure 13.

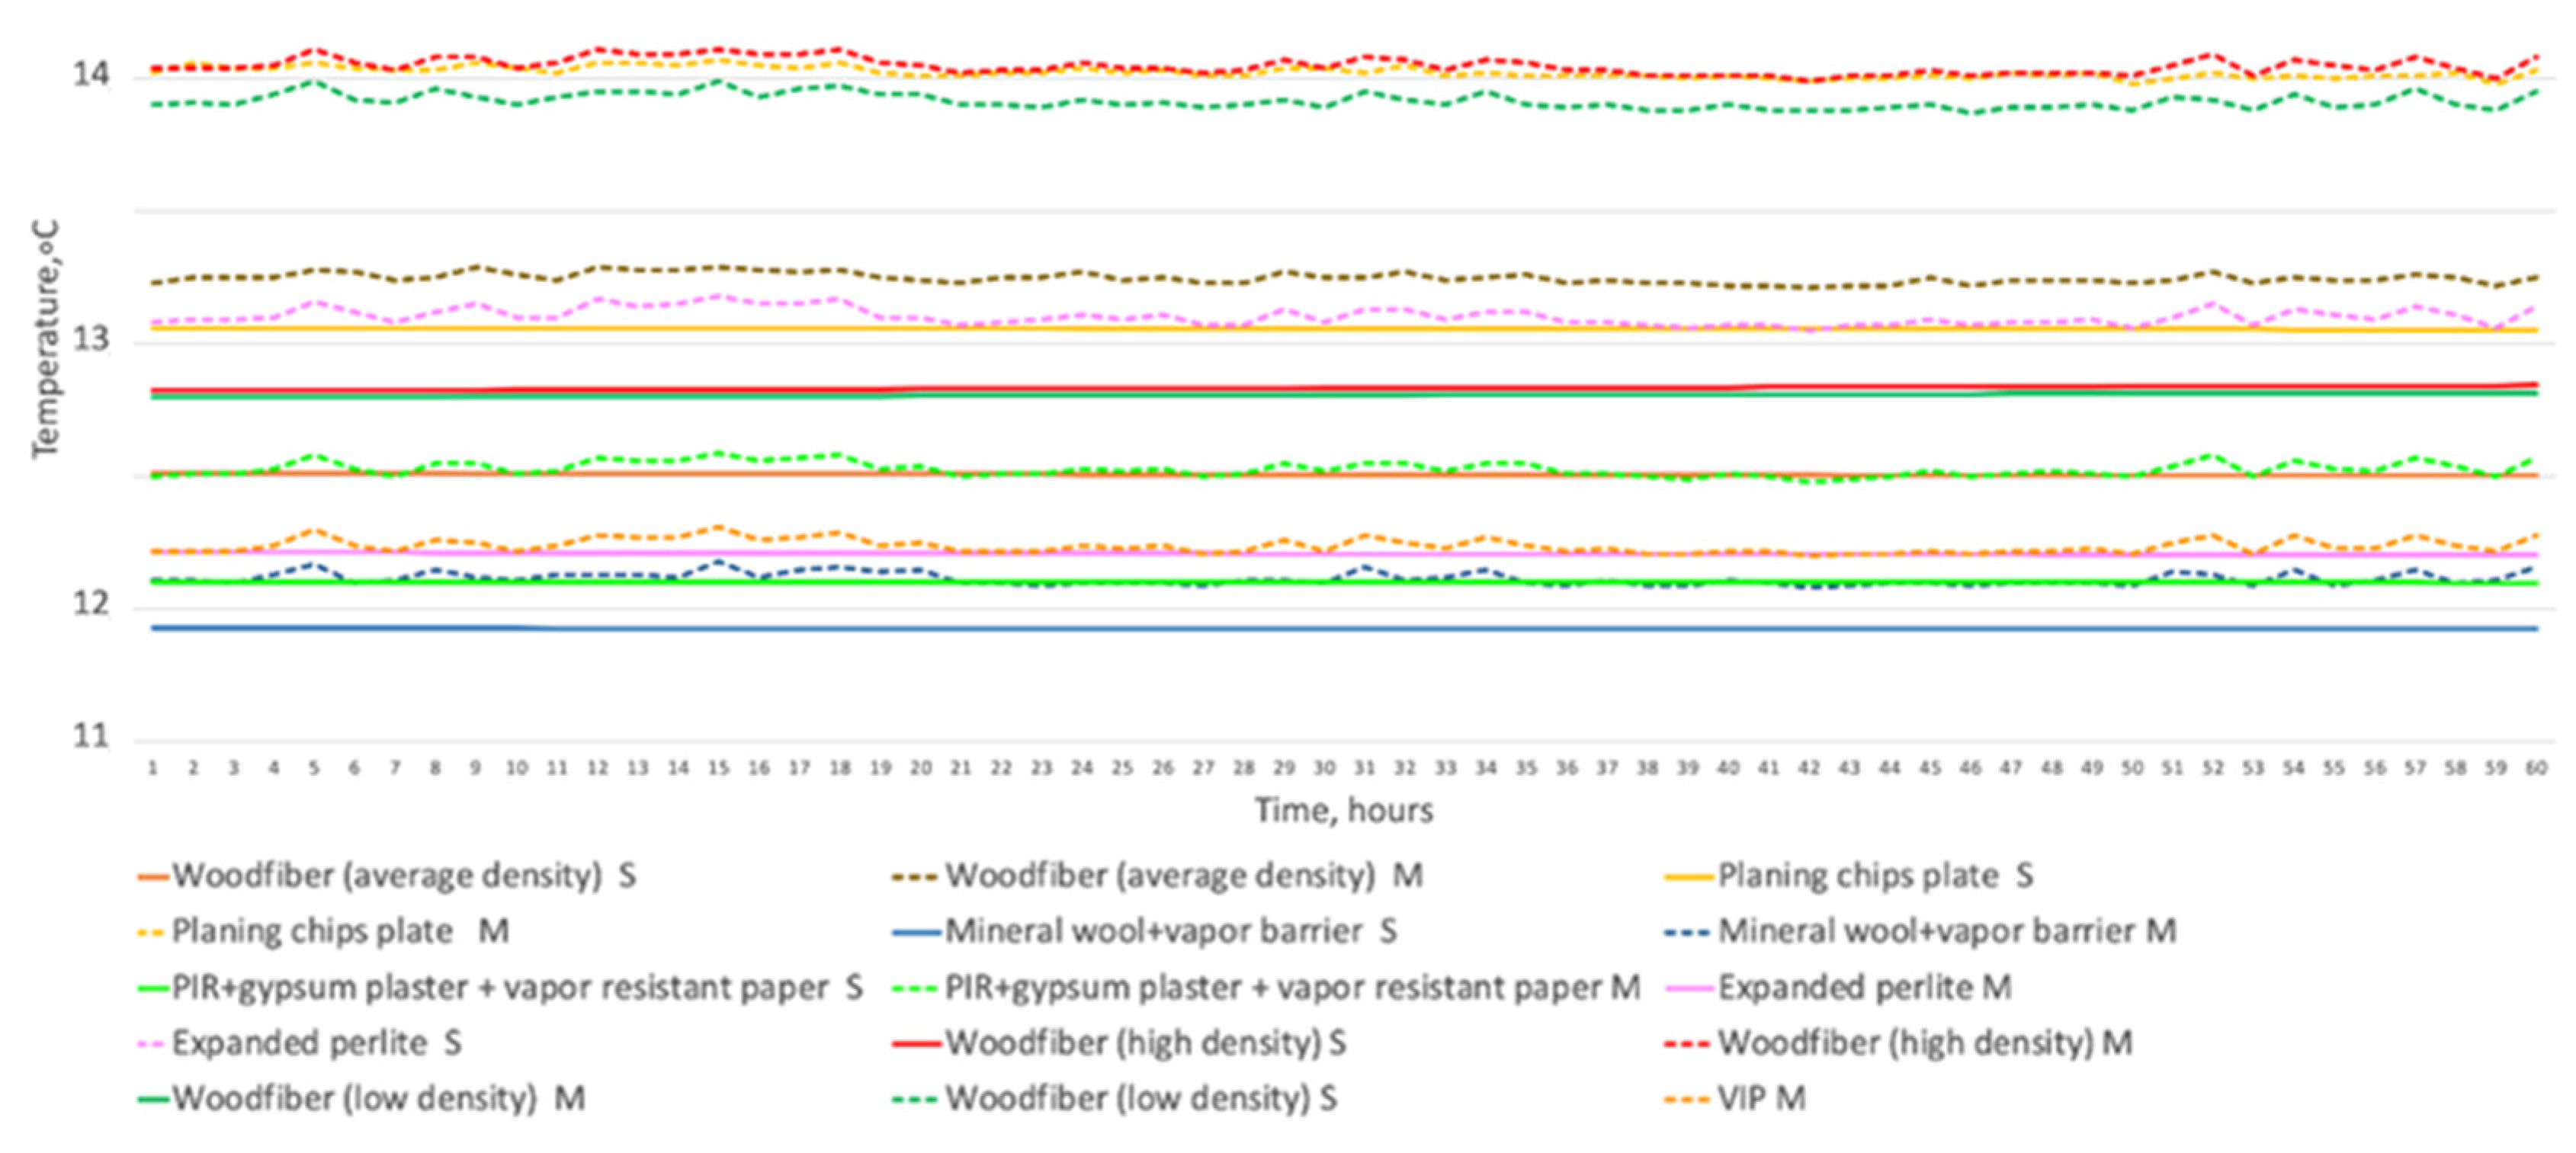
3.1. Steady-State Conditions

  • The first test round
Figure 14 shows the measured temperature and relative humidity profiles in hot- and cold-boxes during the first test of steady-state conditions. Relative humidity dropped in the hot-box from hours 49 to 150 due to the malfunctioning of the humidifier.
The measured and simulated temperature behavior for eight insulation systems tested in the first test round showed that the temperature rate of change was high at the beginning and reached steady-state conditions after approximately 72 h.
Figure 15 shows the zoomed-in measured (M) and simulated (S) temperature behavior between masonry and vapor-open insulation systems in the steady-state cycle. The highest temperature was measured behind vapor-open systems, while the lowest temperatures were reached in vapor-tight systems. For all insulation systems, the measured temperatures exceeded simulated temperatures and varied from 1 to 1.2 °C. For vapor-open systems, temperature stabilized at about +14 °C between masonry and planing chips plate, followed by high-density wood fiber and low-density wood fiber because their relatively low thermal resistance allows more heat flow from the hot-box. The temperature reached +13 °C for insulation systems with average-density wood fiber and expanded perlite. The simulated temperature behavior between these layers was also similar. However, the arrangement of the materials was slightly different. Similar to measurements, the lowest temperature was achieved by the mineral wool with a vapor barrier, followed by expanded perlite and average-density wood fiber. Moreover, the stabilization of temperatures was predicted to be at a slightly different range—from +12 to 13 °C. Vapor-tight insulation systems (PIR with gypsum board and vapor-resistant paper, VIP and mineral wool with vapor barrier) stabilized at lower temperatures than vapor-open systems.
The measured and simulated behavior of relative humidity between masonry and vapor-open insulation systems are illustrated in Figure 16. The internal side of the existing wall structure experienced reduced temperatures, resulting in the higher relative humidity levels between the wall and insulation system. The temperatures reached steady-state conditions after approximately 72 h while relative humidity still had not reached equilibrium after 13 days except for planing chips plate. The relative humidity increased faster for the vapor-open materials due to the vapor-open characteristic of these insulation systems. All vapor-open systems experienced a much higher increase of relative humidity at the beginning of the measurement compared to simulation. They also reached higher relative humidity levels compared to simulation results. The planing chips plate had the highest increase rate of relative humidity behind the masonry and reached equilibrium at 100% in 30 h. This is due to large and open pores, low vapor diffusion resistance, and lack of finishing material. In simulation, planing chips plate behavior is different: the trend increased at a slower rate and it did not reach 100% relative humidity. This material is suggested to be used as an internal finish because of its decorative nature. However, the application of this material without vapor barrier under the high indoor moisture load can result in mold growth behind the insulation system. Average density wood fiber had the second highest relative humidity level and simulated behavior differed from measured. The third and fourth materials with the highest relative humidity were expanded perlite and low-density wood fiber. All these materials had low vapor diffusion resistance. The slowest increase of the relative humidity was observed for high-density wood fiber. The main reason for the discrepancy between measured and simulated behavior can be variations in material properties values in real material and simulation.
The measured and simulated behavior of relative humidity between masonry and vapor-tight insulation systems (Figure 17) showed that measured and simulated trends were similar, but the values differed. The main cause might be the discrepancy in values of hygrothermal properties for actual materials and simulation. Mineral wool with a barrier exhibited similar behavior to vapor-open systems. This might be due to the low vapor resistance of the vapor barrier. The slowest increase in relative humidity was observed for the insulation systems with VIP, high-density wood fiber, and PIR with gypsum board and vapor-resistant paper, which had the lowest increase in relative humidity. PIR with gypsum board and vapor-resistant paper exhibited the lowest growth of relative humidity on both simulations and measurements in the test stand. There is no risk of condensation behind any of these insulation systems. The hygrothermal behavior of VIP was not simulated due to a lack of material with similar properties in the DELPHIN database.
Figure 18 illustrates that vapor-open systems were sensitive to changes in indoor relative humidity when the cold-box temperature was stable. When indoor relative humidity fell between time 40 and 82 (Figure 18a), vapor-open materials with low Sd values (expanded perlite, average and low-density wood fibers) mimicked this behavior with an average time lag of one hour but with different trends. Vapor-tight mineral wool also mimicked it. This might be explained by the vapor barrier’s low Sd value (7). Materials with higher Sd values did not imitate this behavior (VIP, high-density wood fiber, PIR with gypsum board, and vapor-resistant paper). The same reaction of insulation systems was observed when the hot-box relative humidity increased (Figure 18b). In both situations, mineral wool followed the trend closer than other materials, which might be explained by the limited moisture buffering capacity for this type of insulation, in contrast to the capillary active materials. The behavior of other materials followed the trend to a lesser extent because they have excellent MBV.
  • The second test round
Nine insulation systems were tested in the second test round. The vapor-open insulation systems were aerogel blanket, cellulose, and stone wool (without vapor barrier). The vapor-tight insulation systems were PIR with aluminum cover on both sides, expanded cork, cork, XPS with Sika cement layer, and XPS.
Figure 19 shows the temperatures that reached steady-state conditions after approximately 58 h. Temperatures below each material gradually decreased and stabilized between 15.3 C and 16.3 °C (the values were higher than the first test round due to higher temperature in the cold-box). The lowest temperatures reached XPS and expanded cork, coinciding with the measured U-values at the laboratory. PIR with aluminum cover measured U-value coincided with the U-value of an expanded cork. Still, when comparing temperatures below these insulations, the temperature below the PIR with aluminum cover was on the same level as the cellulose, whose U-value was 0.07 W/m2K higher. However, as these temperature differences were less than half a degree and fell within the error limits of temperature sensors, such small shifts were possible. Accordingly, expanded clay and XPS with the Sika cement layer, which had the highest U-values, also had the highest temperatures below these materials.
The relative humidity between masonry and insulation materials reached equilibrium after seven days for vapor-open materials, while others did not reach steady-state conditions even after 14 days (Figure 20).
The relative humidity level increased at a higher rate in vapor-open systems. In vapor-tight systems, a lower increase rate was observed. The relative humidity did not exceed 65% relative humidity. The highest relative humidity was under vapor-open insulation systems (stone wool without vapor barrier, aerogel blanket, cellulose, expanded clay). Vapor-tight systems had lower humidity levels: the highest level was reached by expanded cork, followed by XPS, XPS with Sika cement, cork, and PIR with aluminum cover. Vapor-open systems are sensitive to changes in indoor relative humidity. When indoor relative humidity fell or increased, vapor-open materials with lower Sd values (rock wool without vapor barrier, expanded clay, cellulose, aerogel blanket) mimicked this behavior but with different trends. Materials with higher Sd values did not imitate this behavior (VIP, high-density wood fiber, PIR with gypsum board, and vapor-resistant paper). In both situations, mineral wool followed the trend closer than other materials, which might be explained by the limited moisture buffering capacity for this type of insulation, in contrast to the capillary active materials. The behavior of other materials followed the trend to a lesser extent because they had excellent MBV.
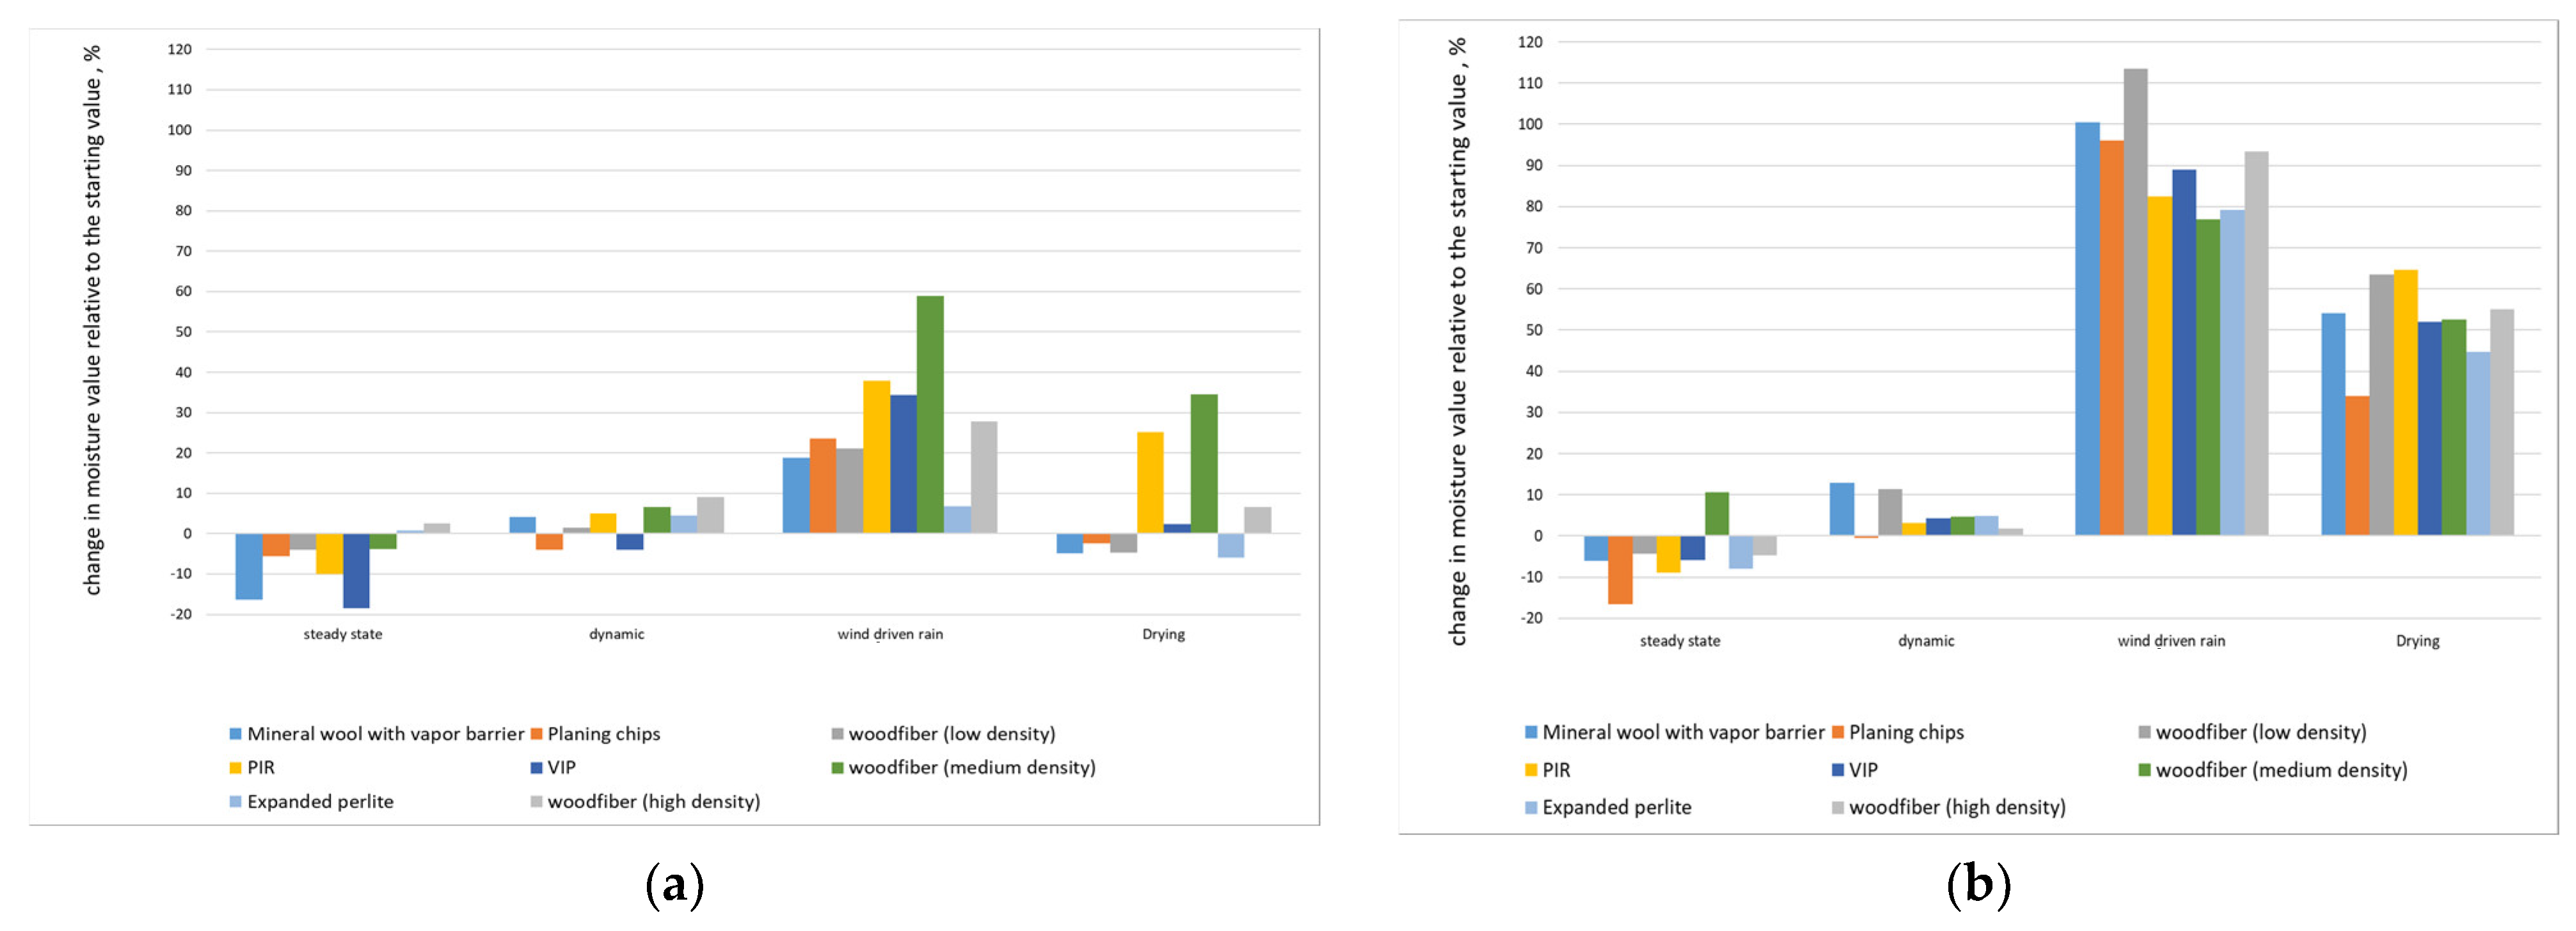
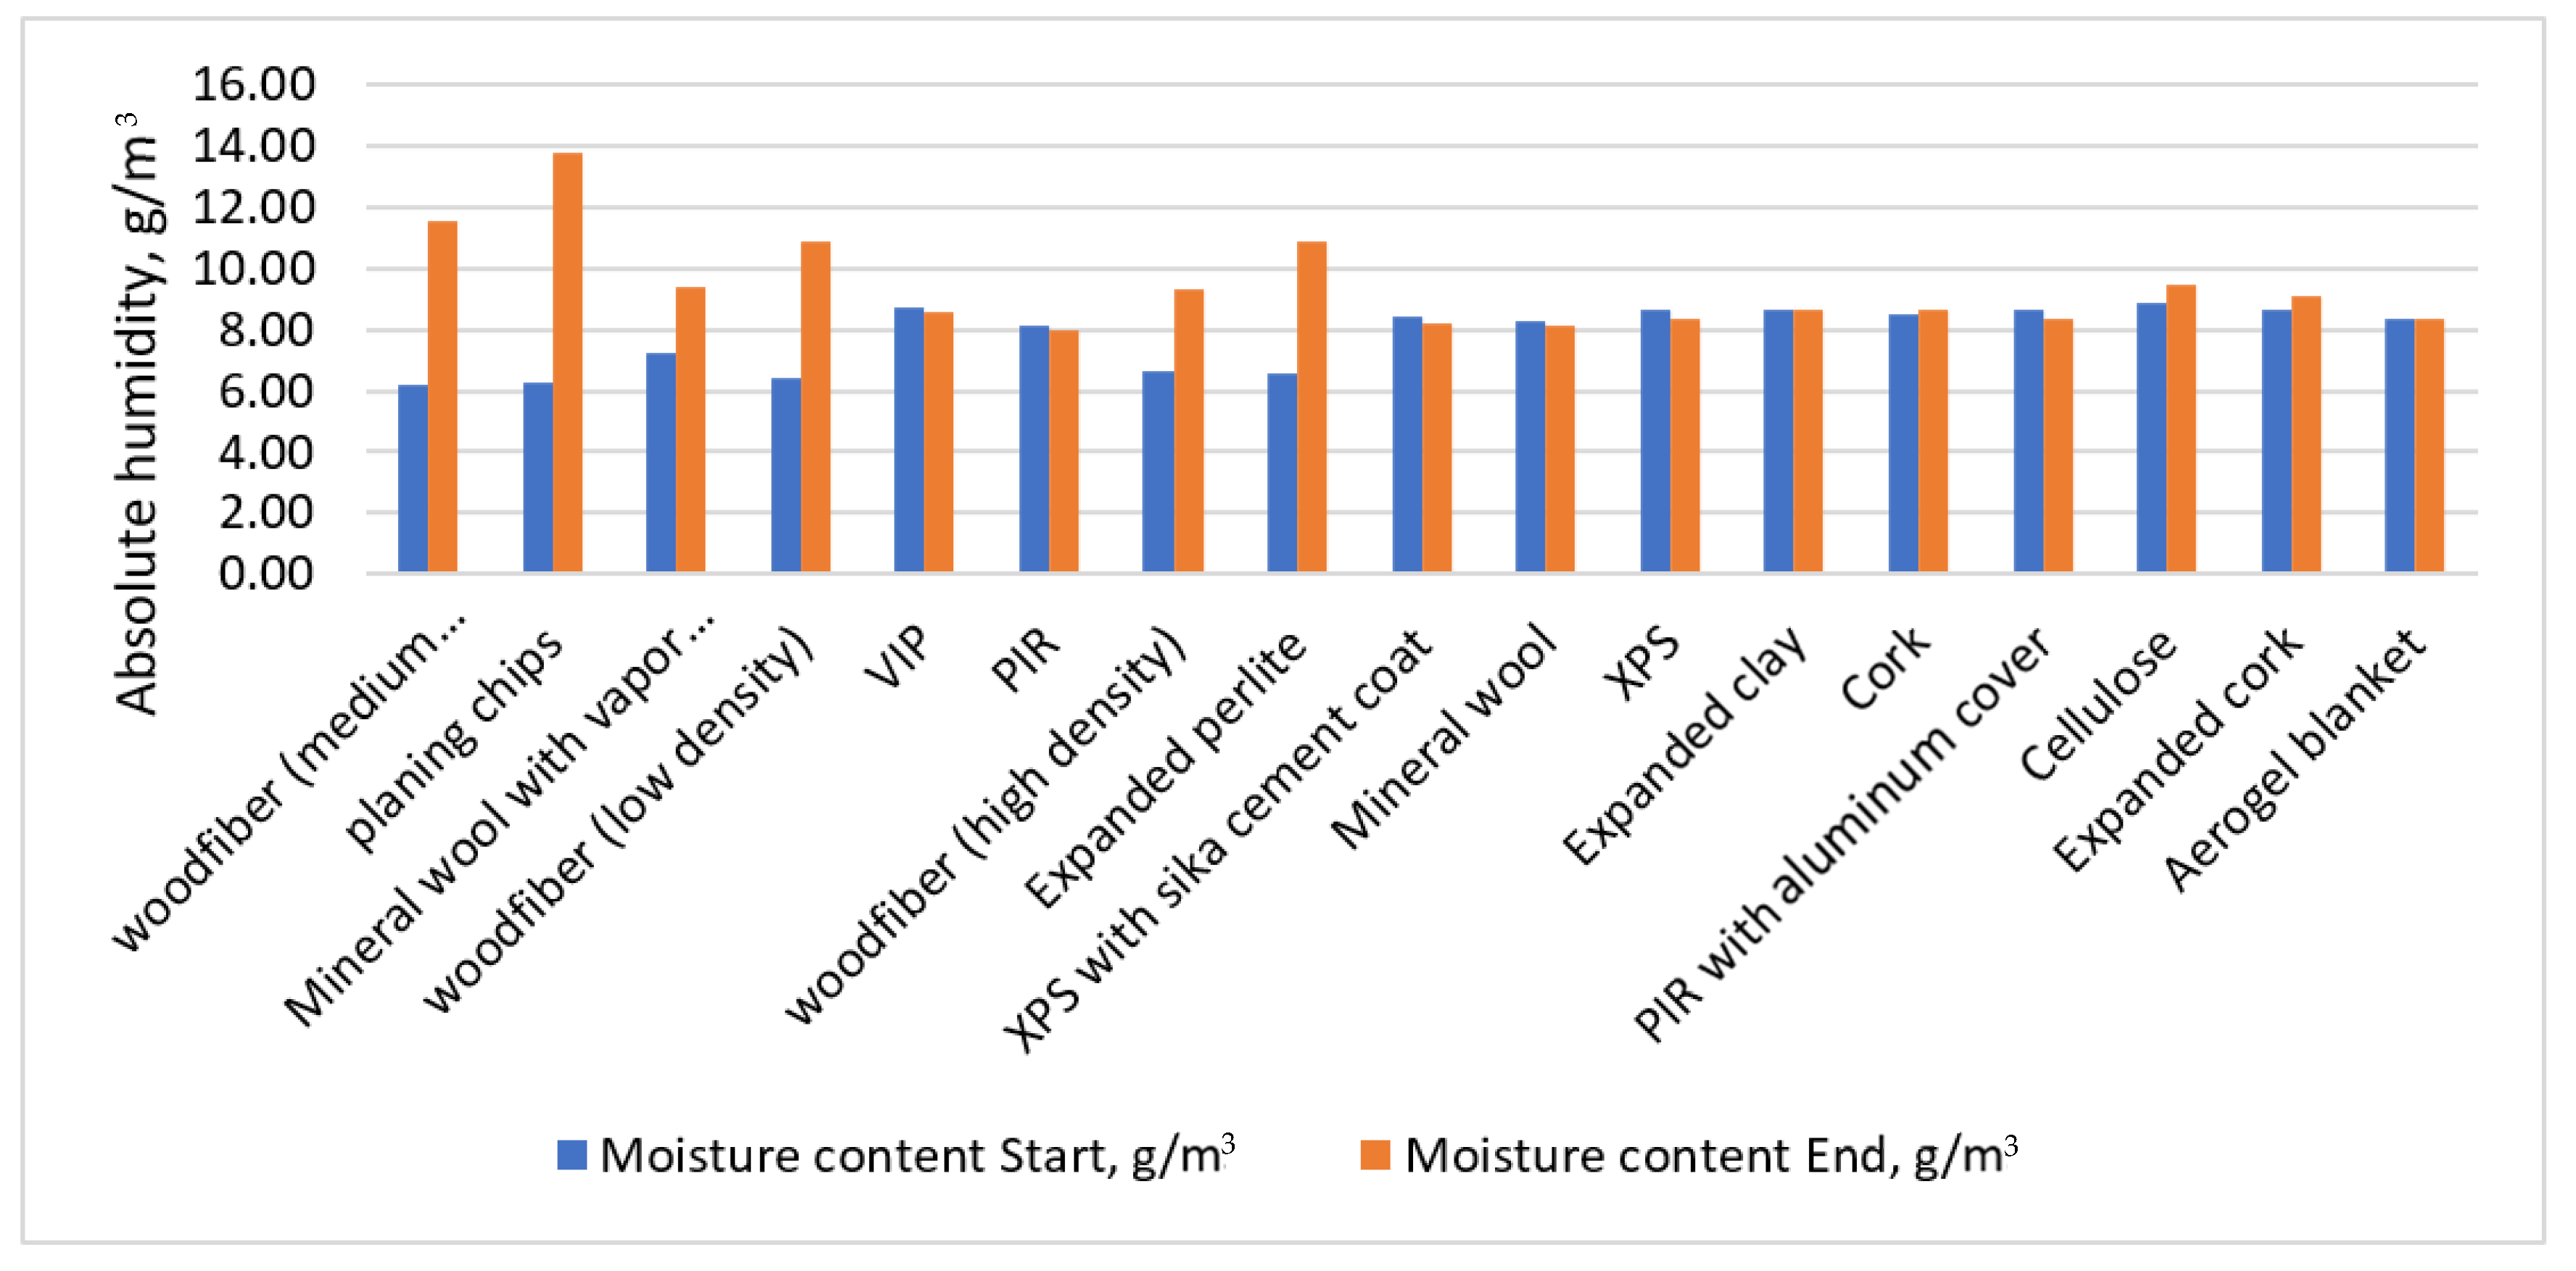
  • Changes in absolute humidity under the insulation materials
As the relative humidity was dependent on temperature, the absolute humidity in g/m3 was used to compare the impact on moisture changes under different insulation materials (see Figure 21).
The highest increase of moisture was evident under capillary active insulation materials (woofibers, planning chips, and expanded perlite). Two deviations were observed, the first being the mineral wool with vapor barrier (with sd value 12 m, could be considered as breathable wind barrier, not a true vapor barrier), that shows similar behavior to the capillary active insulation materials, and the second being capillary active cellulose that showed similar behavior to the vapor-tight insulation materials. The absolute moisture increase under insulation materials was as follows: Planing chips 119%, woodfiber (medium density) 85%, woodfiber (low density) 69%, expanded perlite 65%, woodfiber (high density) 39%, cellulose 7%, expanded cork 5%, cork 2%, aerogel blanket, and expanded clay 0%, and all the rest materials, all of which except for mineral wool are vapor-tight, had a negative absolute humidity change from −1 to −4%.

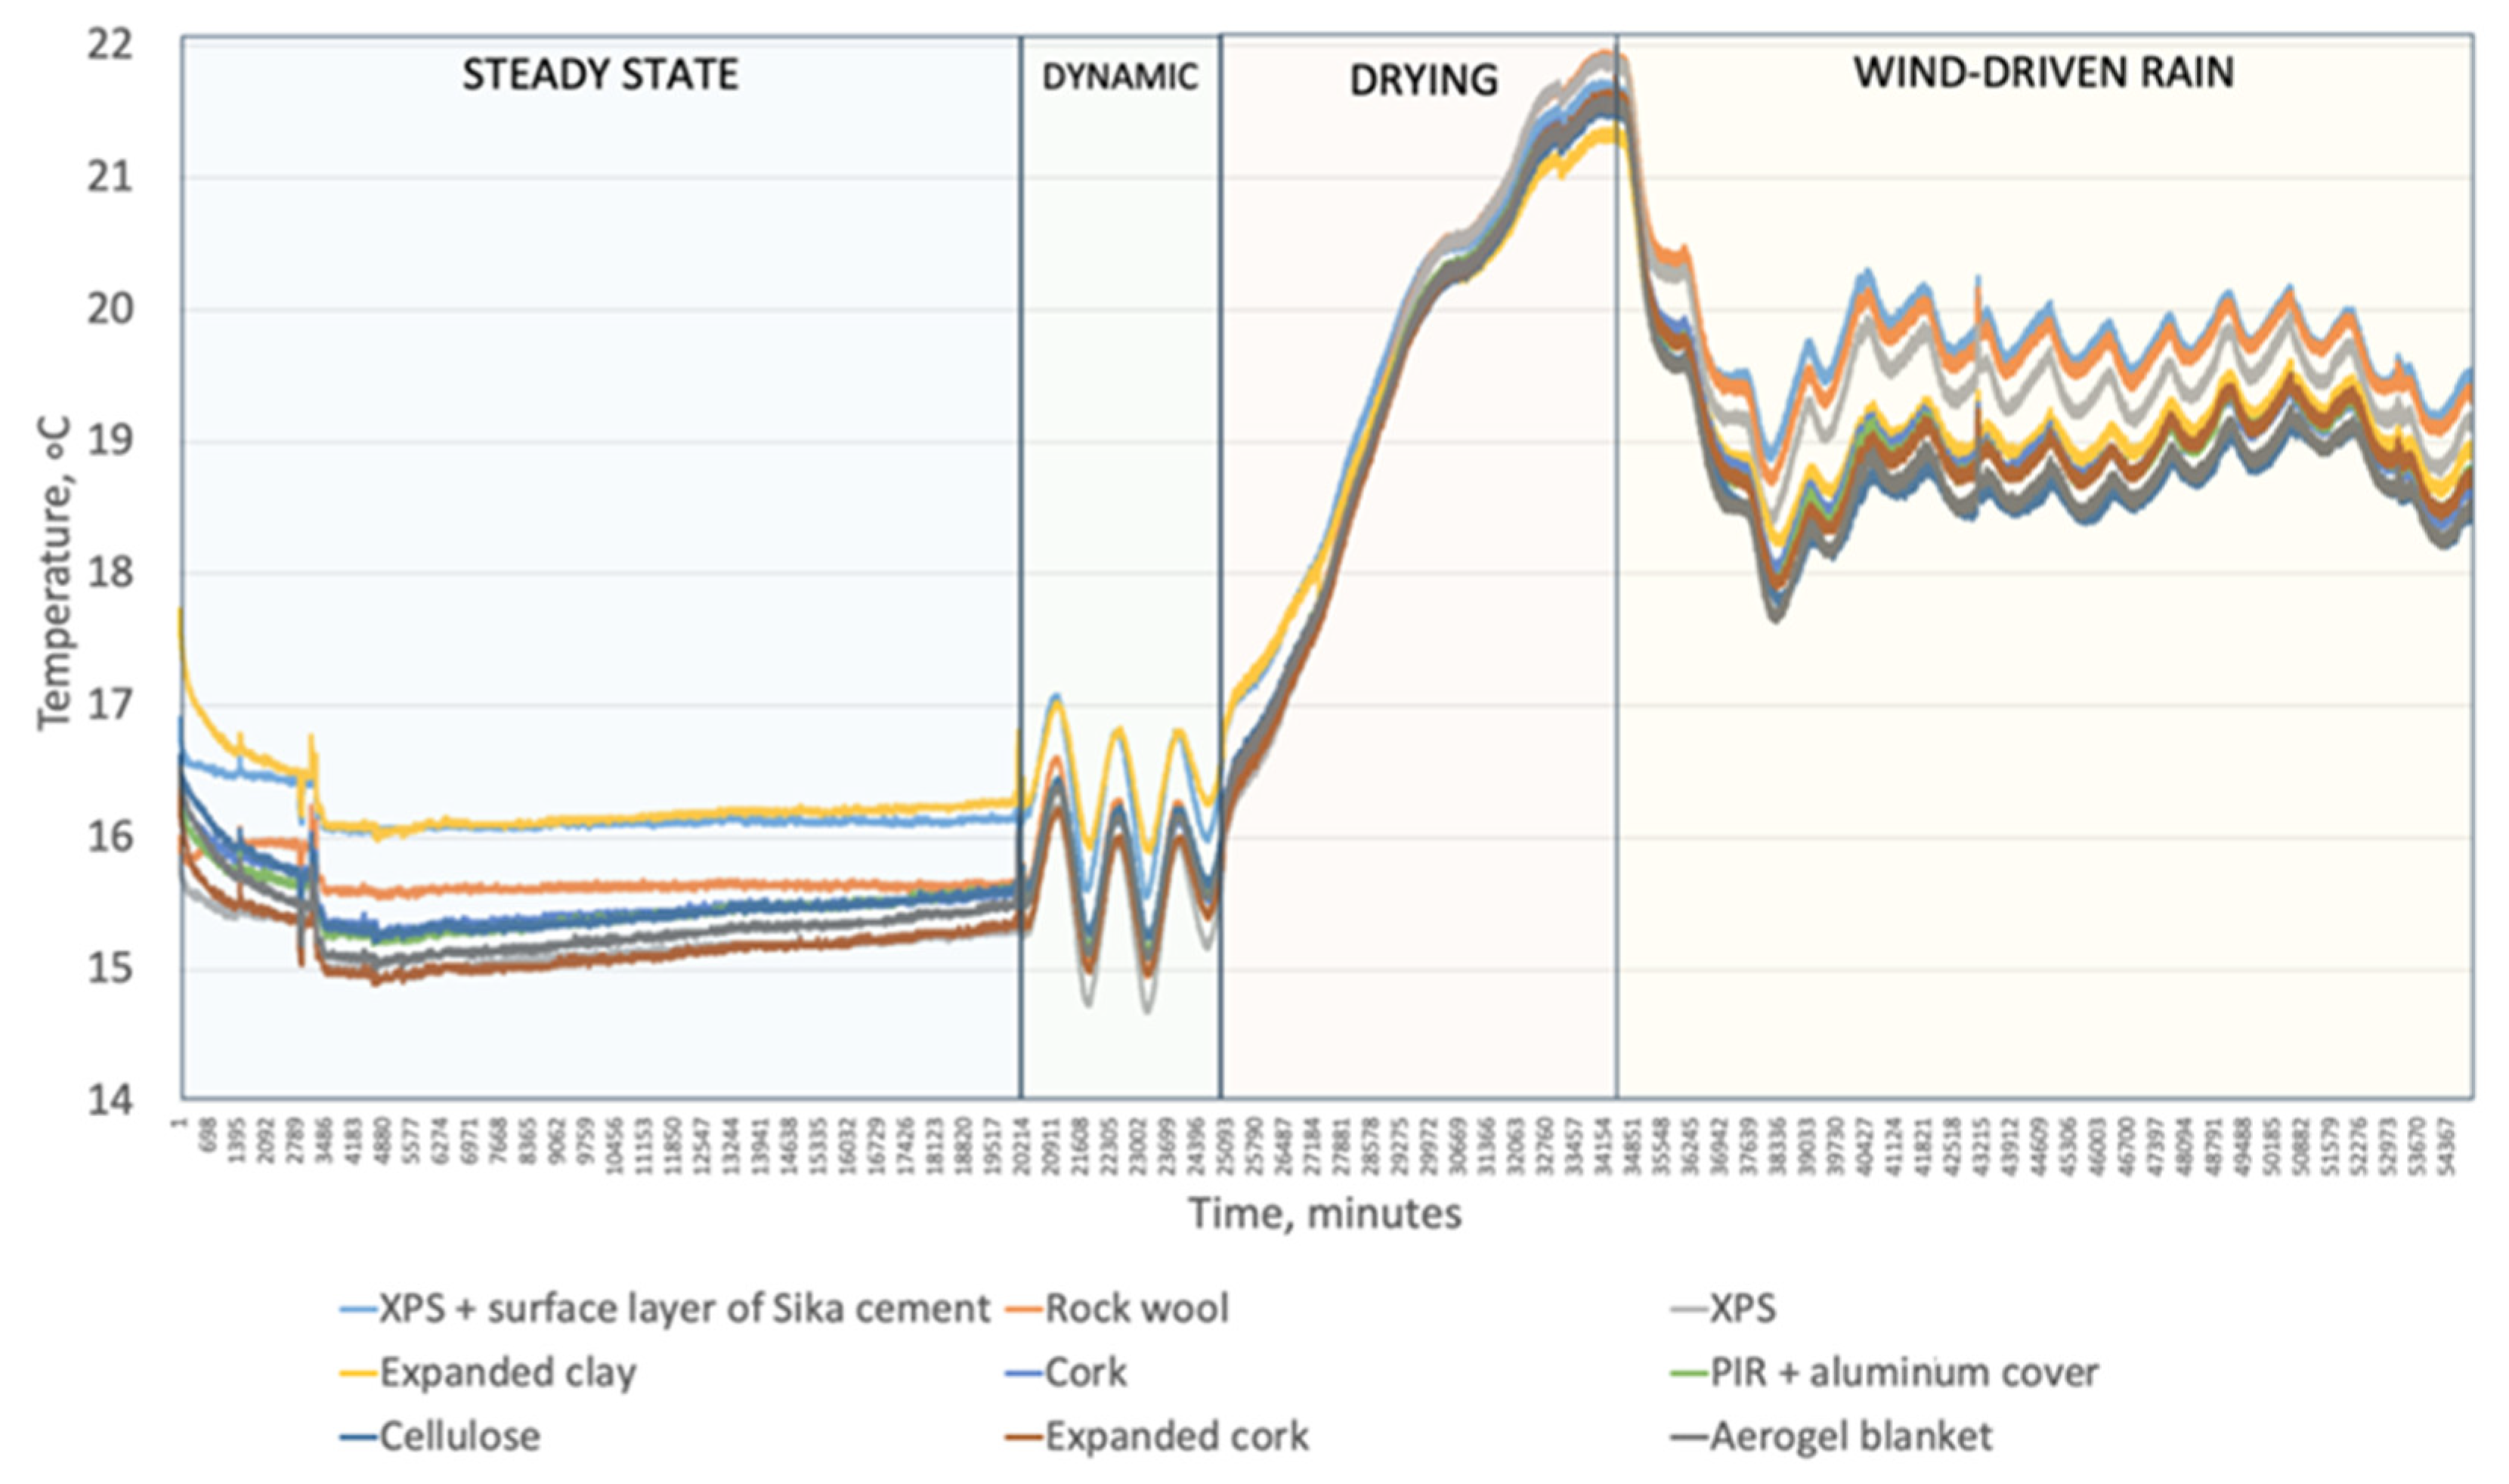
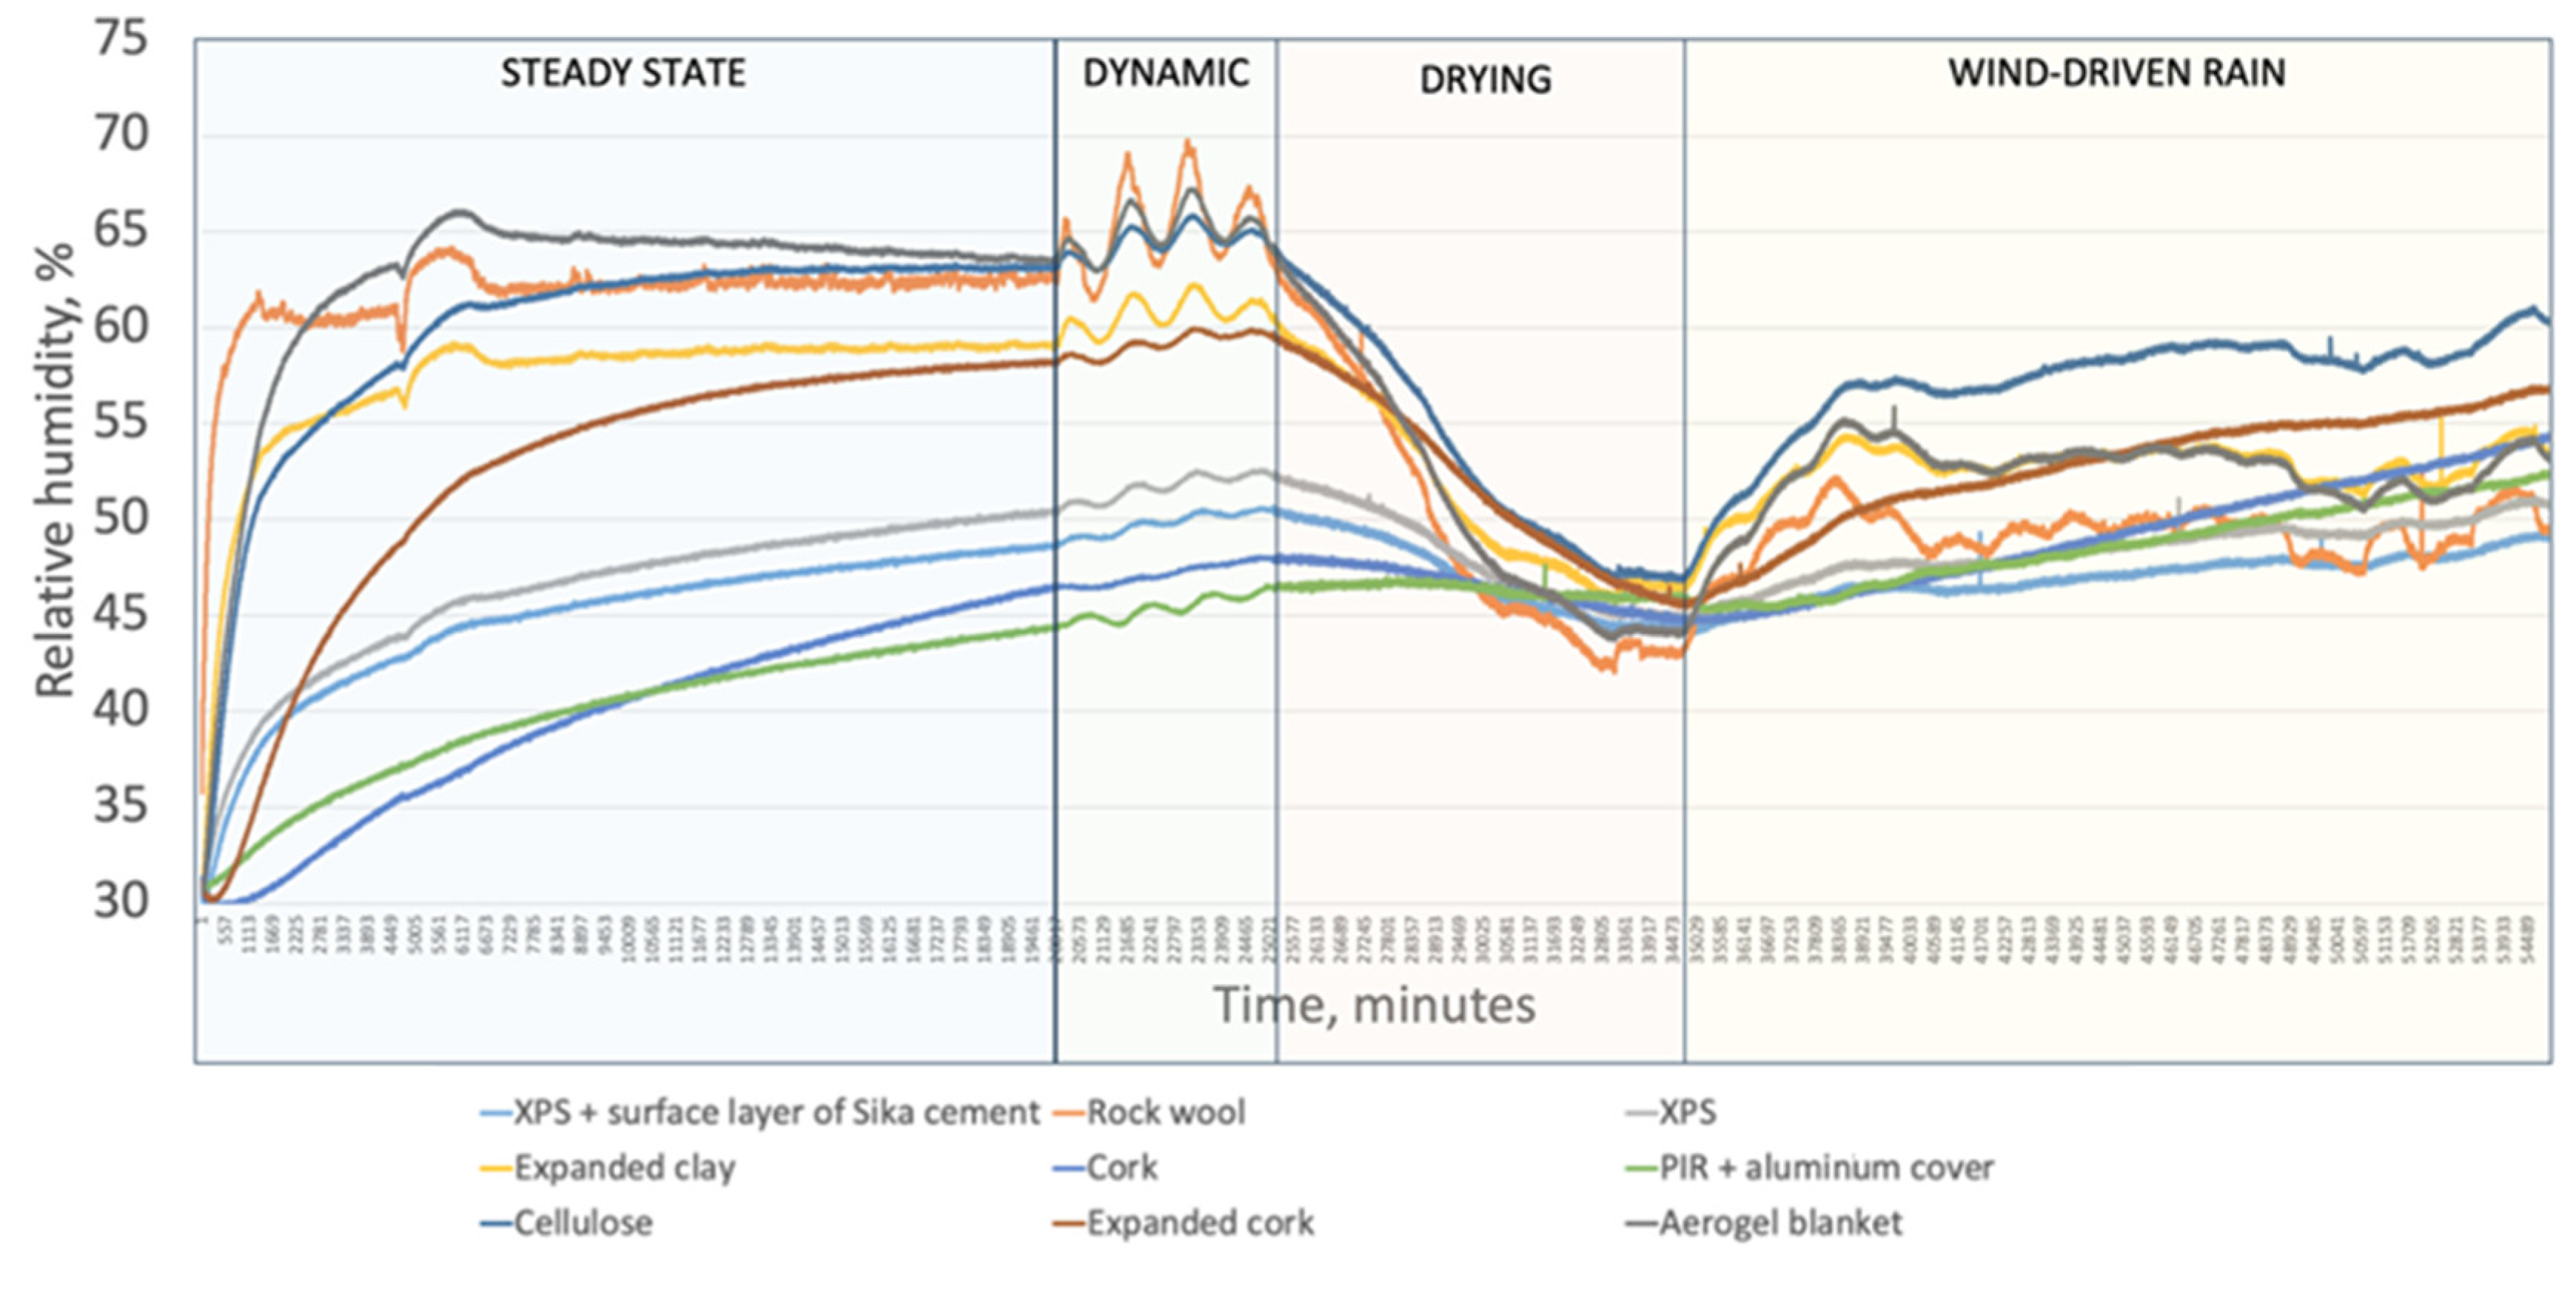
3.2. Unsteady State Conditions

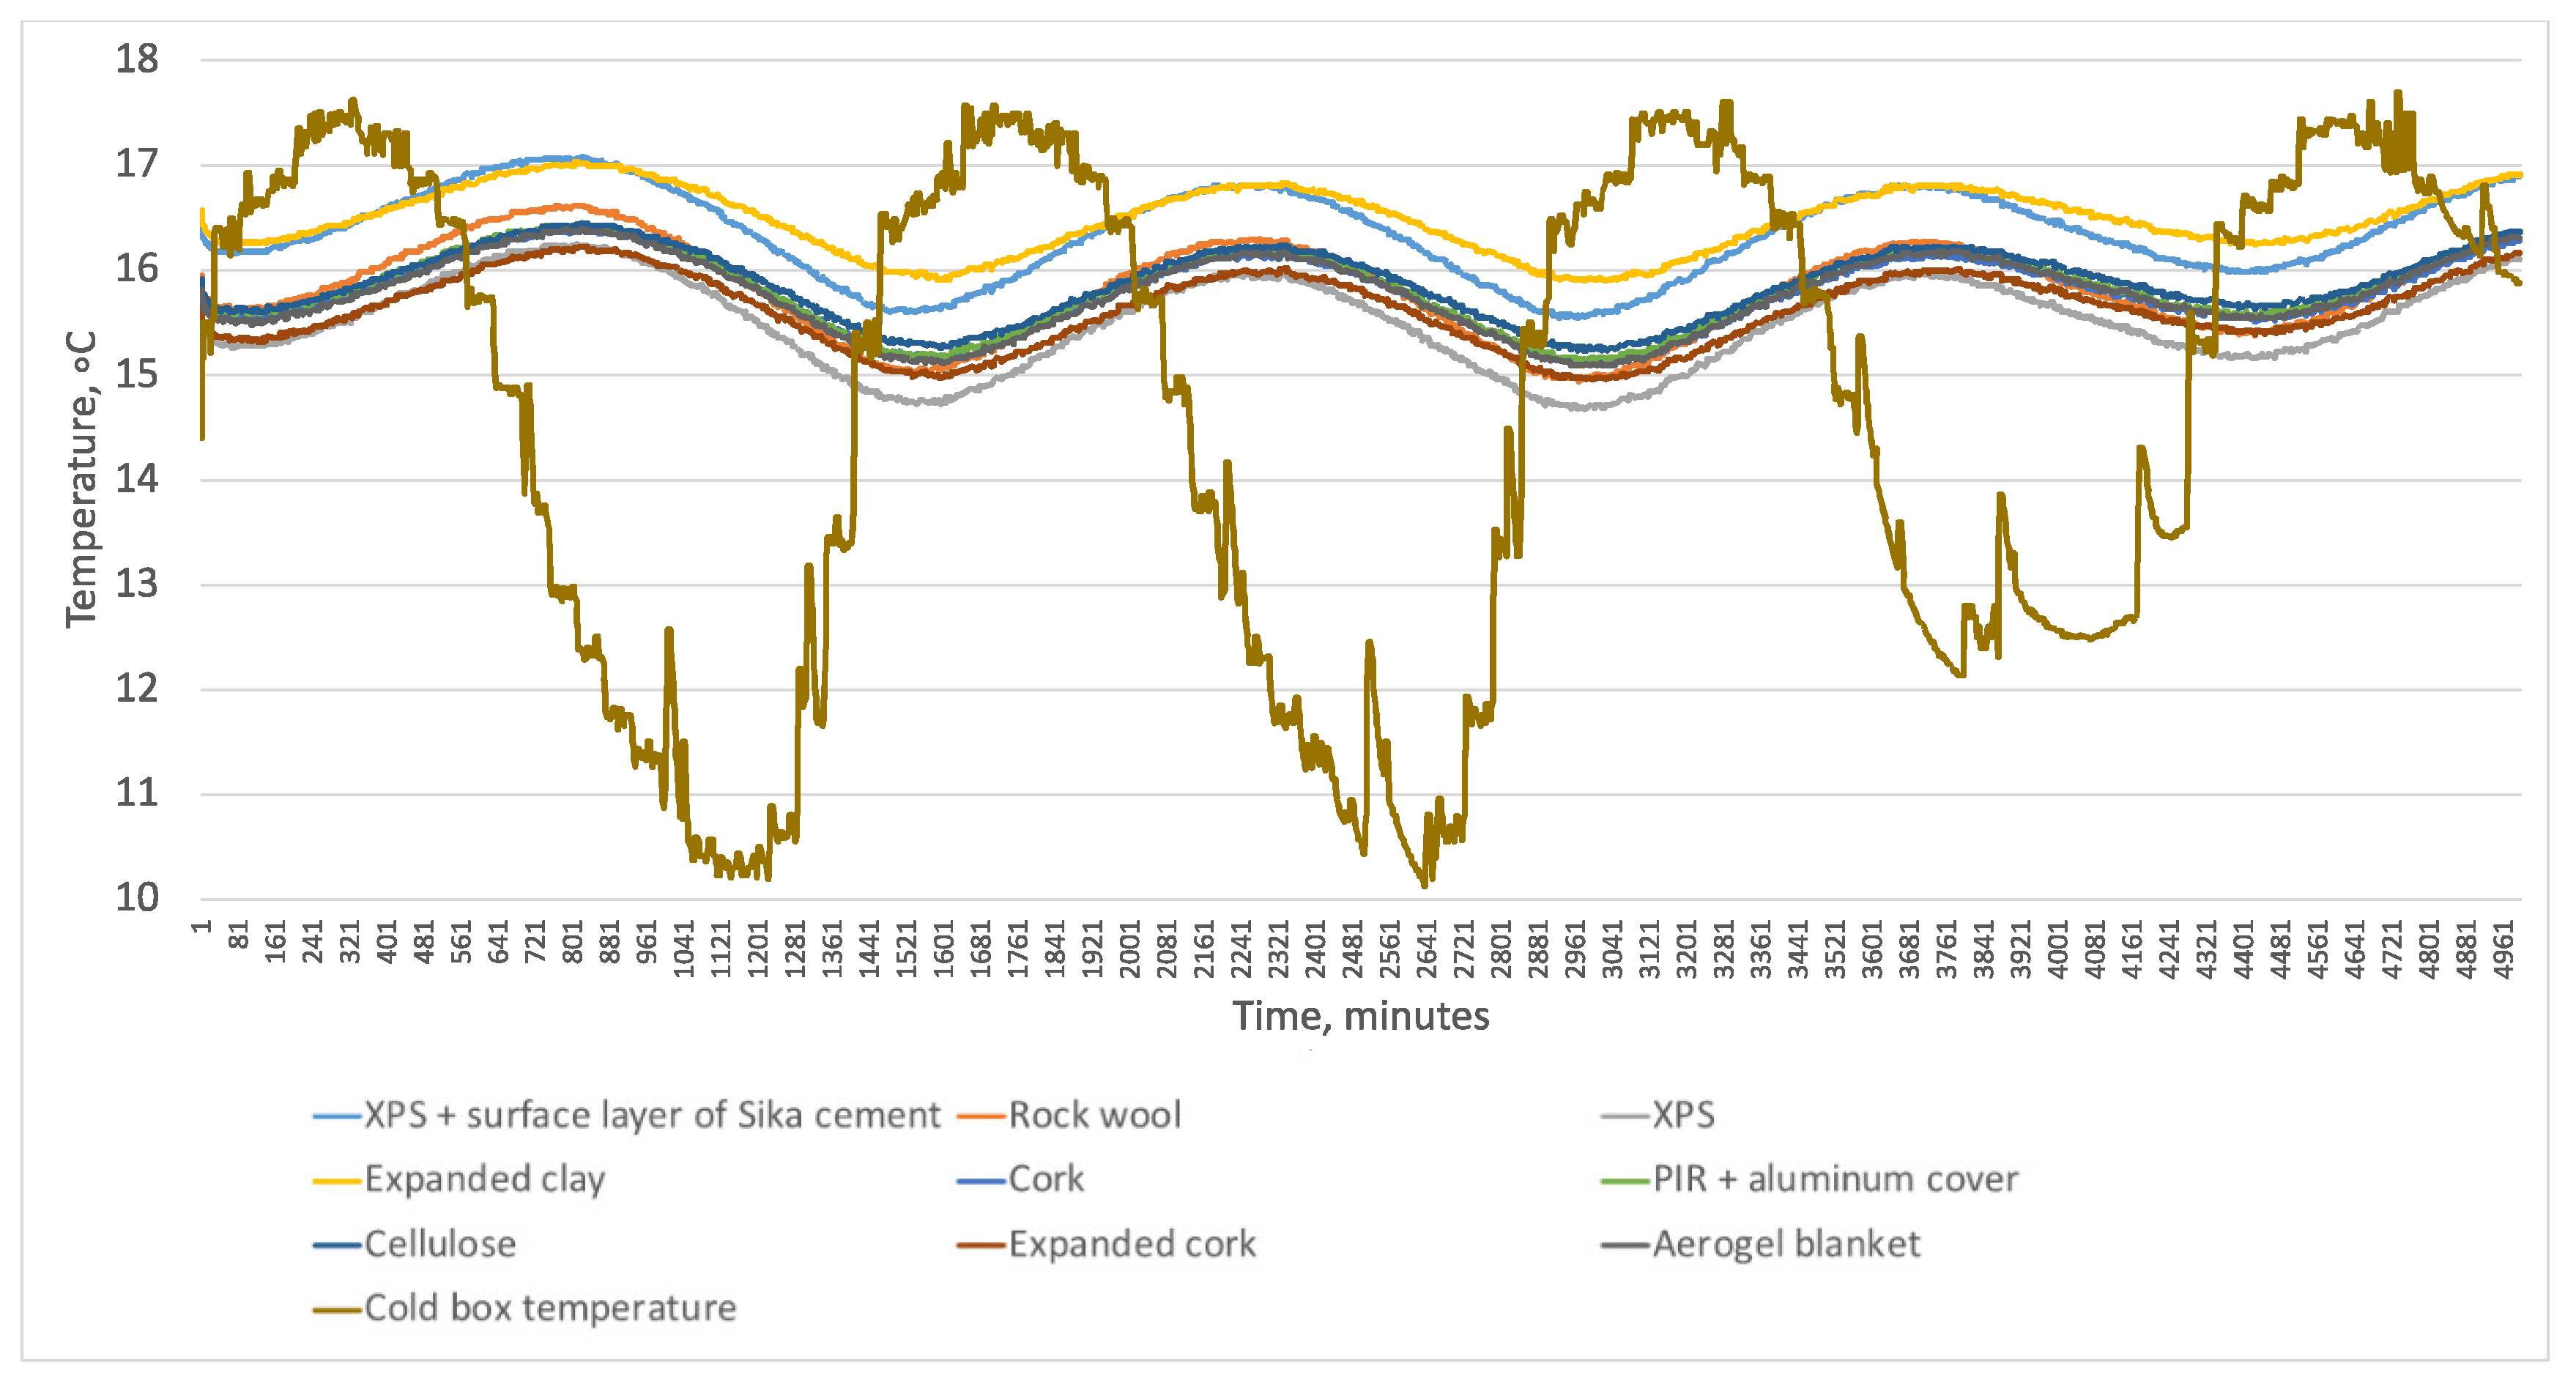
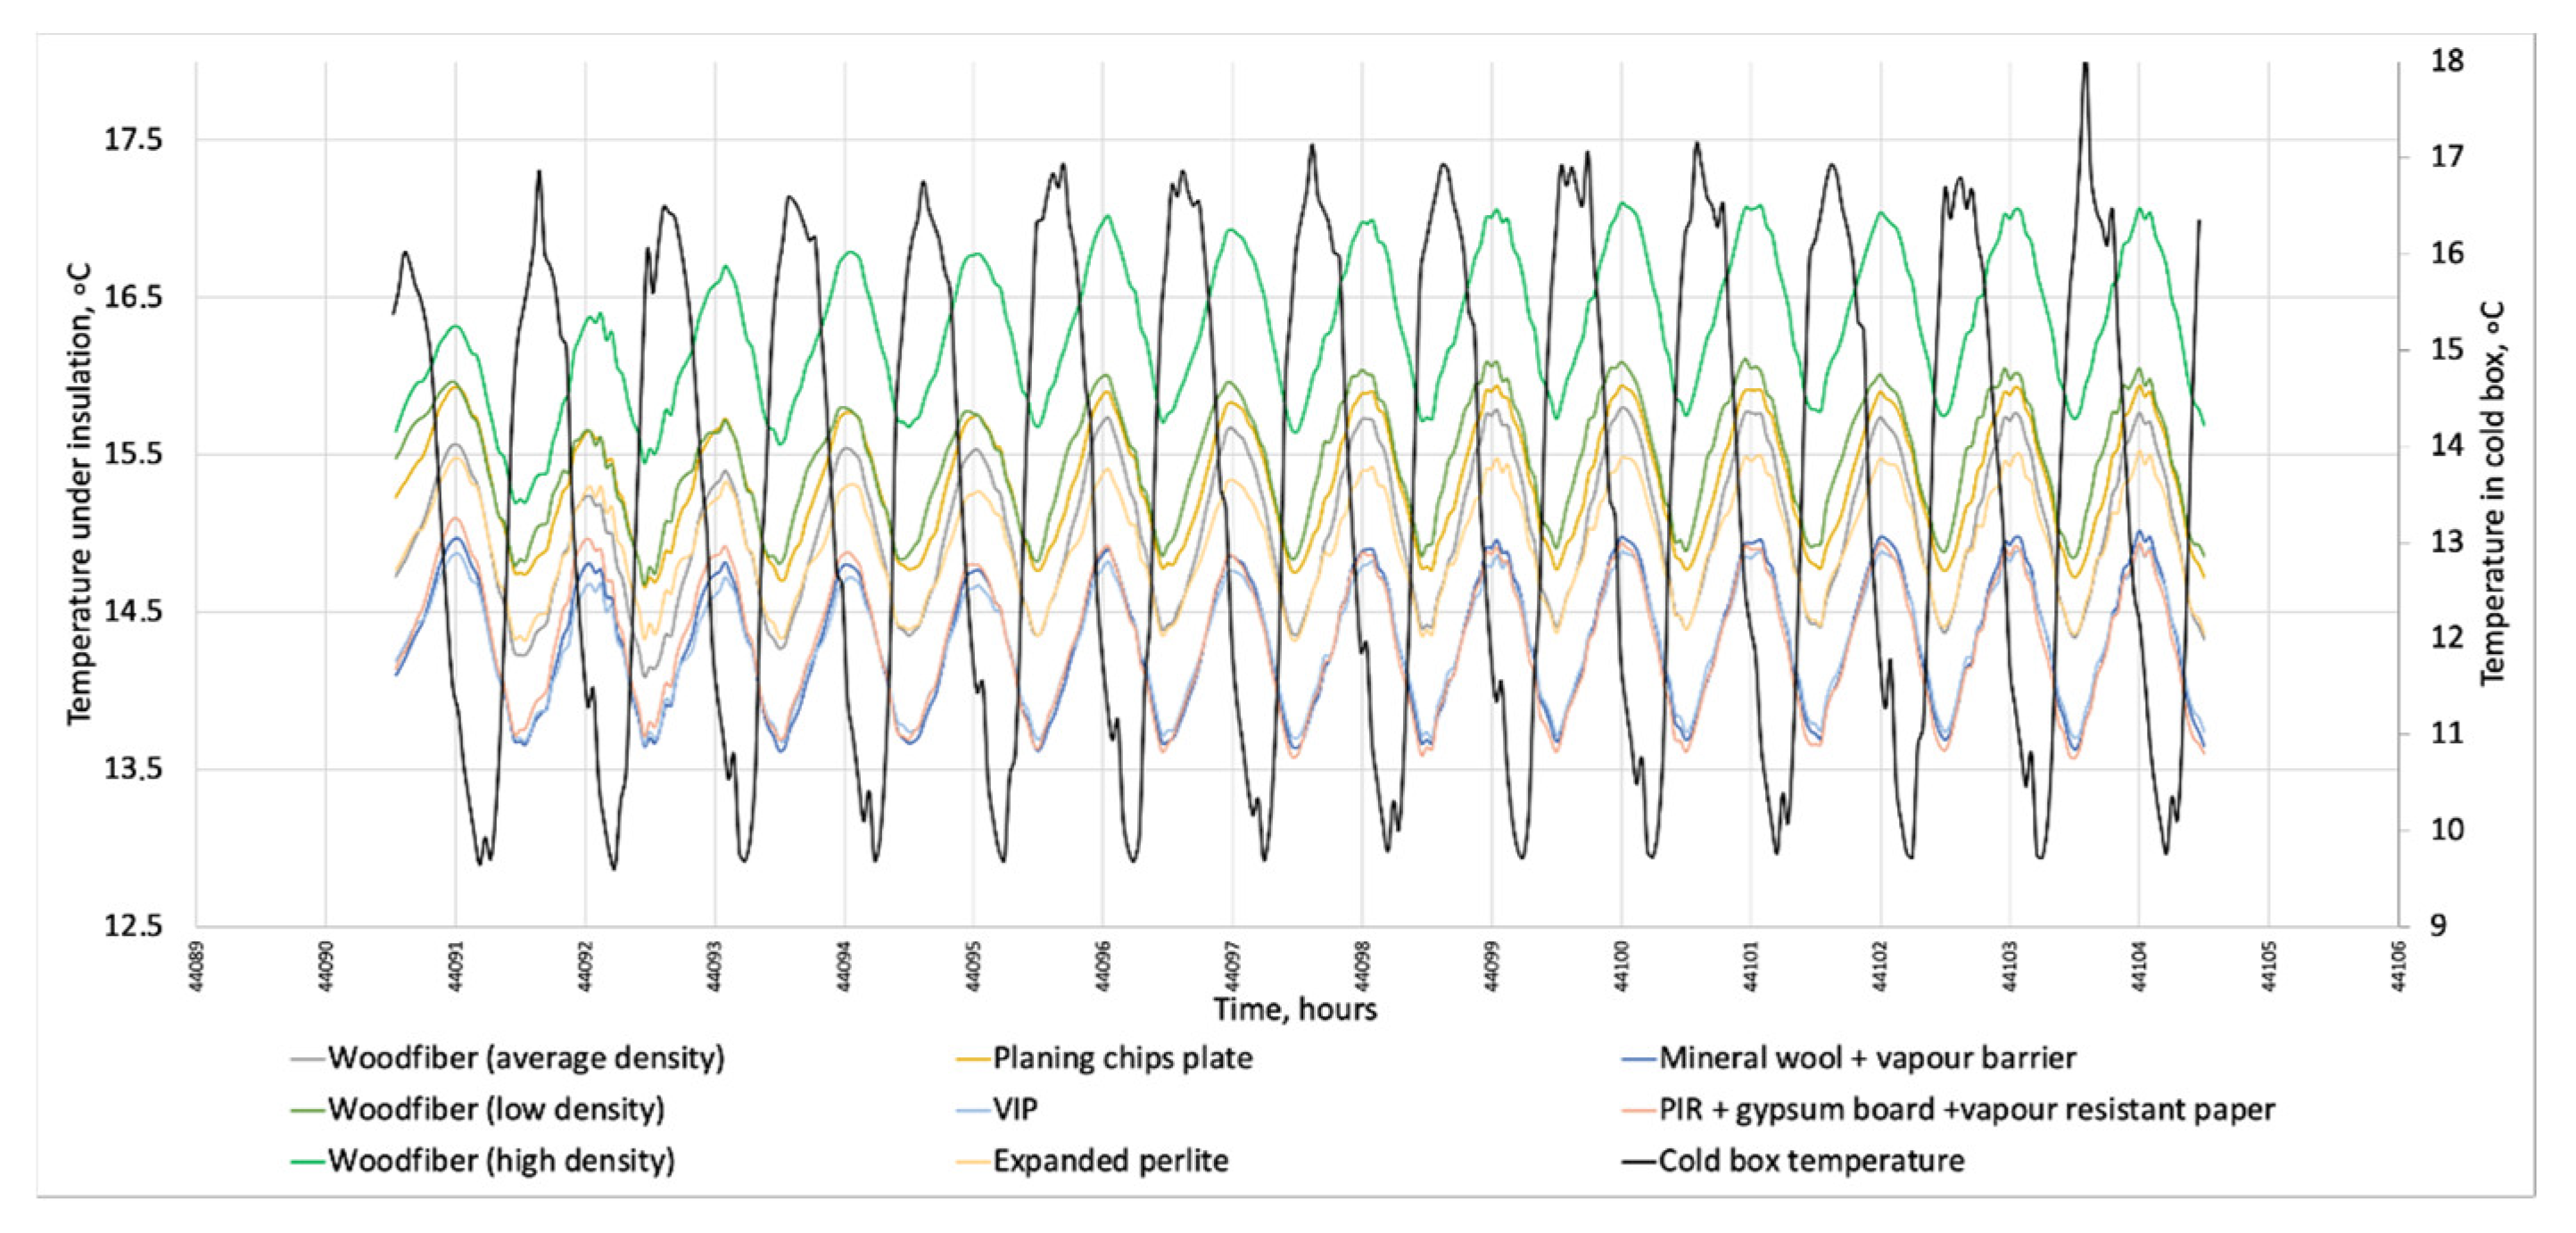
3.2.1. Dynamic Cycle

The first test round showed that each insulation system comprises materials with different thermophysical properties, determining how the envelope responds to climatic conditions. The results showed that the temperature below the insulation materials followed the same daily cycle as the cold-box temperature with a visible time lag. The average time lag for the heat wave propagating from the inner surface to the outer surface for all insulation systems was 7–10 h. The decrement factor was the ratio of the heat wave amplitudes at the two surfaces of the wall, and the values were between 0.07 and 0.49. The lowest value of the decrement factor was exhibited by vapor-open systems with the lowest Sd value and increased with increased Sd value (the highest value is for PIR with aluminum cover).
Figure 22 shows the temperature behavior under insulation during the dynamic cycle in the second test round. Like the first test round, the temperature profile followed the cold-box temperature with delay. The time lag was between 9 and 11 h. The decrement factor correlated with the Sd value—the higher the Sd value, the higher the decrement factor. The most significant temperature amplitude was observed under rock wool, XPS, and XPS with Sika cement. The smallest temperature amplitude was observed under expanded clay. All other insulating materials were in the middle, with relatively similar temperature amplitudes. The ranges were from 1.21 °C to 1.67 °C.
The relative humidity dynamics under insulation during the dynamic cycle of the first test round revealed that relative humidity behavior under insulation material was less intuitive than temperature behavior. Each insulation system’s initial relative humidity values were determined by the initial cold-box temperature at the beginning of the cycle. During this cycle, the cold-box average temperature was slightly higher than in the steady-state cycle. Similar to temperature, there was an effect of daily variation on relative humidity coupled with temperature fluctuations in the cold box. The time lag differed for the maximum and minimum values of temperature waves. For the maximum temperatures, the time lag was between 8 h (for vapor-open systems with low Sd values) and 17 h (for vapor-tight systems with high Sd values). The time lag for the minimum temperature values was more prolonged and varied from 10 to 19. However, the amplitude varied for insulation systems: vapor-tight systems had a lower amplitude, while vapor-open systems had a higher amplitude. The decrement factor was from 1.9 (for vapor-open systems with low Sd) to 7 (for vapor-tight systems with high Sd value). The other difference from the temperature was the slope of relative humidity profiles. The vapor-tight system’s relative humidity profiles were stable and increased only after the failure of the control system when the temperature in the cold-box decreased. Vapor-open systems had falling slopes, which meant the system was drying inwards. The steepest slope was exhibited by planing chips plate, followed by wood fiber with an average density, expanded perlite, and low-density wood fiber. After the failure of the control system, the same trend was present but in the opposite direction.
The relative moisture under insulation during the dynamic cycle in the second test round (Figure 23) behaved similarly to the first test round. The relative humidity followed temperature fluctuations because the hot-box relative humidity was steady, and the cold-box temperature oscillated. Vapor-tight systems had a lower amplitude, while vapor-open systems had a higher amplitude. When the amplitude of cold-box temperature decreased (starting at minute 3773), the relative humidity amplitude of the vapor-open insulation systems decreased after the time lag. The vapor-tight system’s relative humidity profiles were slightly increasing.
Due to failure of the controller unit during the 1st test round, it was possible to compare the amplitudes of RH changes under insulation materials with the amplitude of RH change in hot-box, a response in % to those changes was observed as follows—woodfiber (medium density) 97%, planing chips 96%, expanded perlite 45%, woodfiber (low density) 23%, woodfiber (high density) 23%, mineral wool with vapor barrier 20%, PIR 1% and VIP 0%. For the second test round, such a comparison was not possible due to lack of dynamic indoor relative humidity conditions.

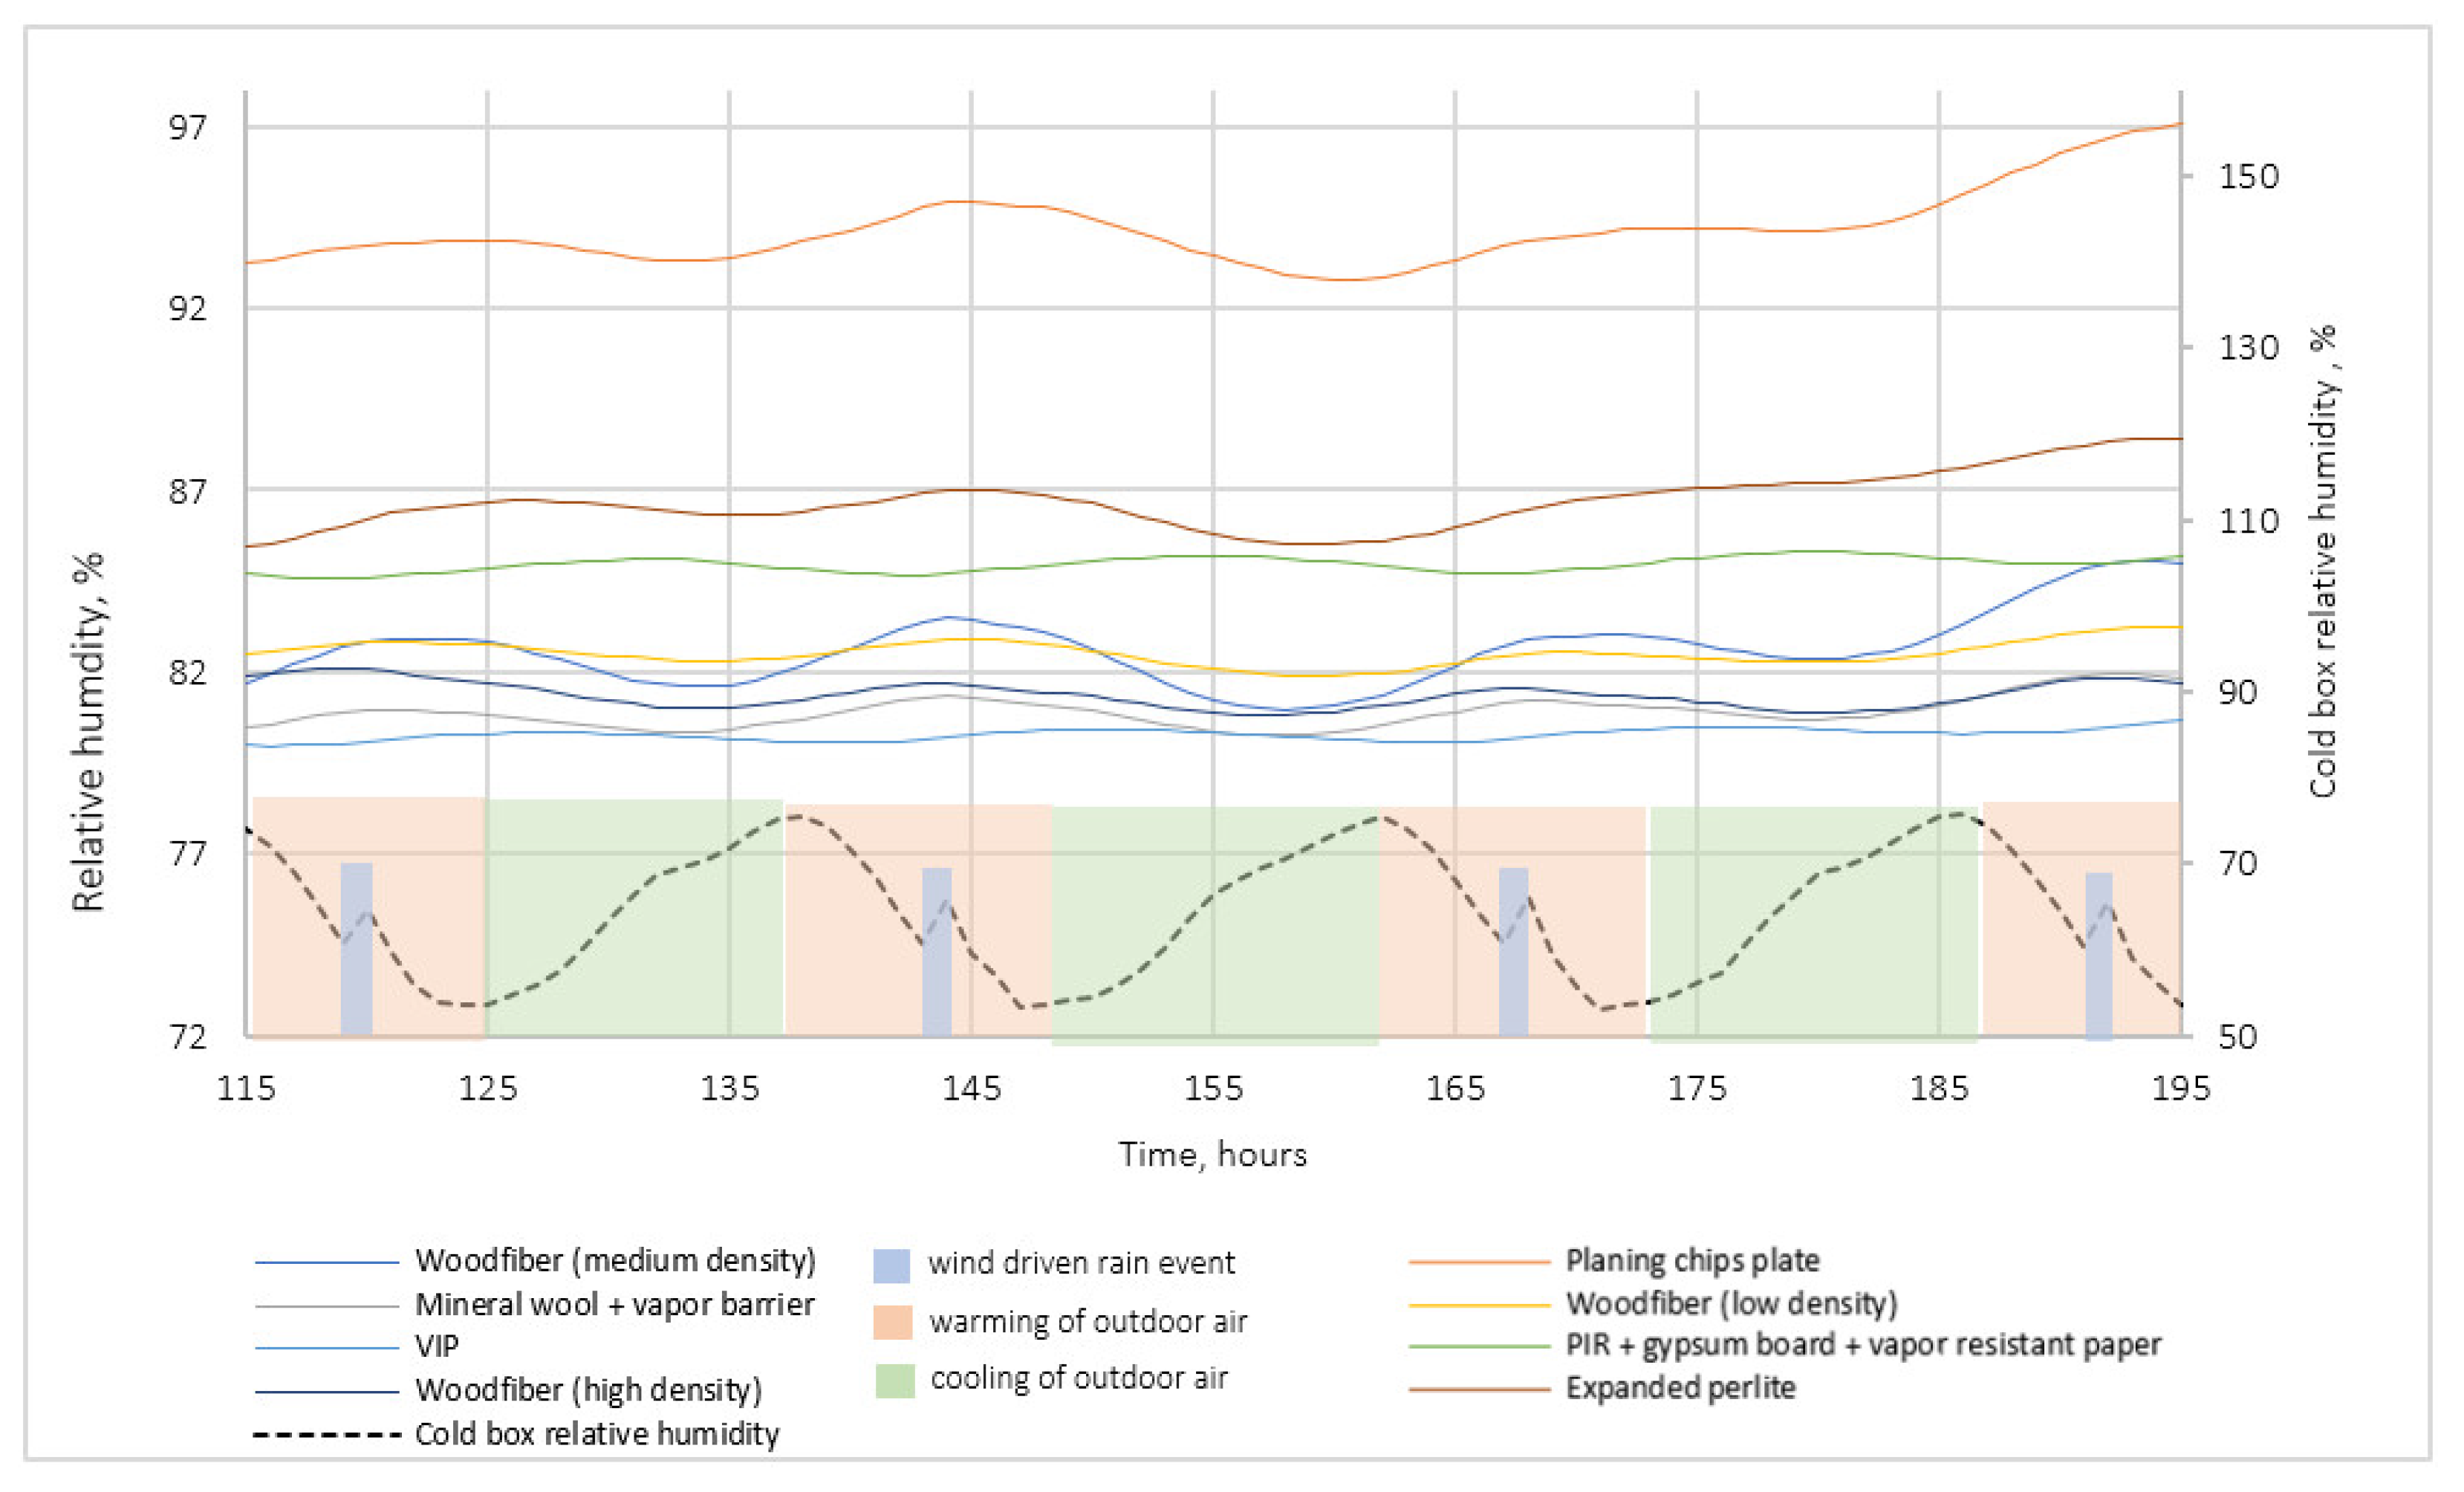
3.2.2. Wind-Driven Rain

As in the second cycle, the temperature continued to follow the outdoor temperature with an offset; the outdoor temperature is not plotted to make the graph easier to understand. As in the first/constant cycle, the lowest temperature was below PIR with gypsum board and vapor-resistant paper, VIP, and mineral wool with a vapor barrier, and the highest temperature was still below high-density wood fiber. The maintenance of the temperature distribution indicates that the thermal conductivity of the insulation materials was not significantly affected by moisture (see Figure 24).
When a dynamic cycle was complemented with wind-driven rain (regular peaks at the end of each cycle represent wind-driven rain injections in Figure 25), at the first part of the cycle, the relative humidity behavior was similar to a dry dynamic cycle where vapor-open systems exhibited a downward trend because systems with low Sd value followed an indoor relative humidity profile, and vapor-tight systems remained stable. After the seventh cycle, relative humidity profiles changed their slope upwards for both insulation systems. The rate of change was higher for vapor-open systems than for vapor-tight systems.
  • The second test round
During the second test round’s wind-driven cycle, the cold-box conditions were not controlled but left to follow laboratory indoor conditions while hot-box conditions were controlled. This led to conditions similar to summer when the outdoor climate is warmer than indoors. Only wind-driven rain was controlled during this cycle. Temperature profiles for this cycle (Figure 26) show that temperatures between masonry and insulation systems followed the outdoor temperature profile with delay.
The measurements of relative humidity under insulation during wind-driven rain in the second test round (Figure 27) show an increase in relative humidity under vapor-tight insulation systems with a μ-value of 10 or more (expanded cork, cork, PIR with aluminum cover, XPS, and XPS with the Sika cement layer). The increase in the relative humidity level in vapor-tight systems was likely caused by heat-driven vapor flow from the outside toward the inside (summer condensation). This can lead to condensing on the internal side of the masonry wall due to the tightness of these systems, indicating that seasonal drying out is not occurring behind the vapor-tight insulation. The relative humidity of the hot-box influenced the relative humidity under vapor-open materials with a μ-value of less than 10. The relative humidity behind the vapor-open insulation dropped in summer, indicating a seasonal drying out. Vapor-open systems such as rock wool without a vapor barrier, expanded clay, and aerogel blankets had high fluctuations behind insulation materials. Unlike cellulose with excellent moisture buffering capacity, which exhibited a flatter relative humidity profile at a higher value, they had negligible moisture buffering capacity.
For the 2nd test wall, the impact of wdr on the relative humidity under the insulation over 5 wdr cycles was observed as follows—cork 10%, expanded cork, mineral wool and PIR with aluminum cover 7%, aerogel blanket, cellulose and XPS 5%, expanded clay and XPS with Sika cement 4%.

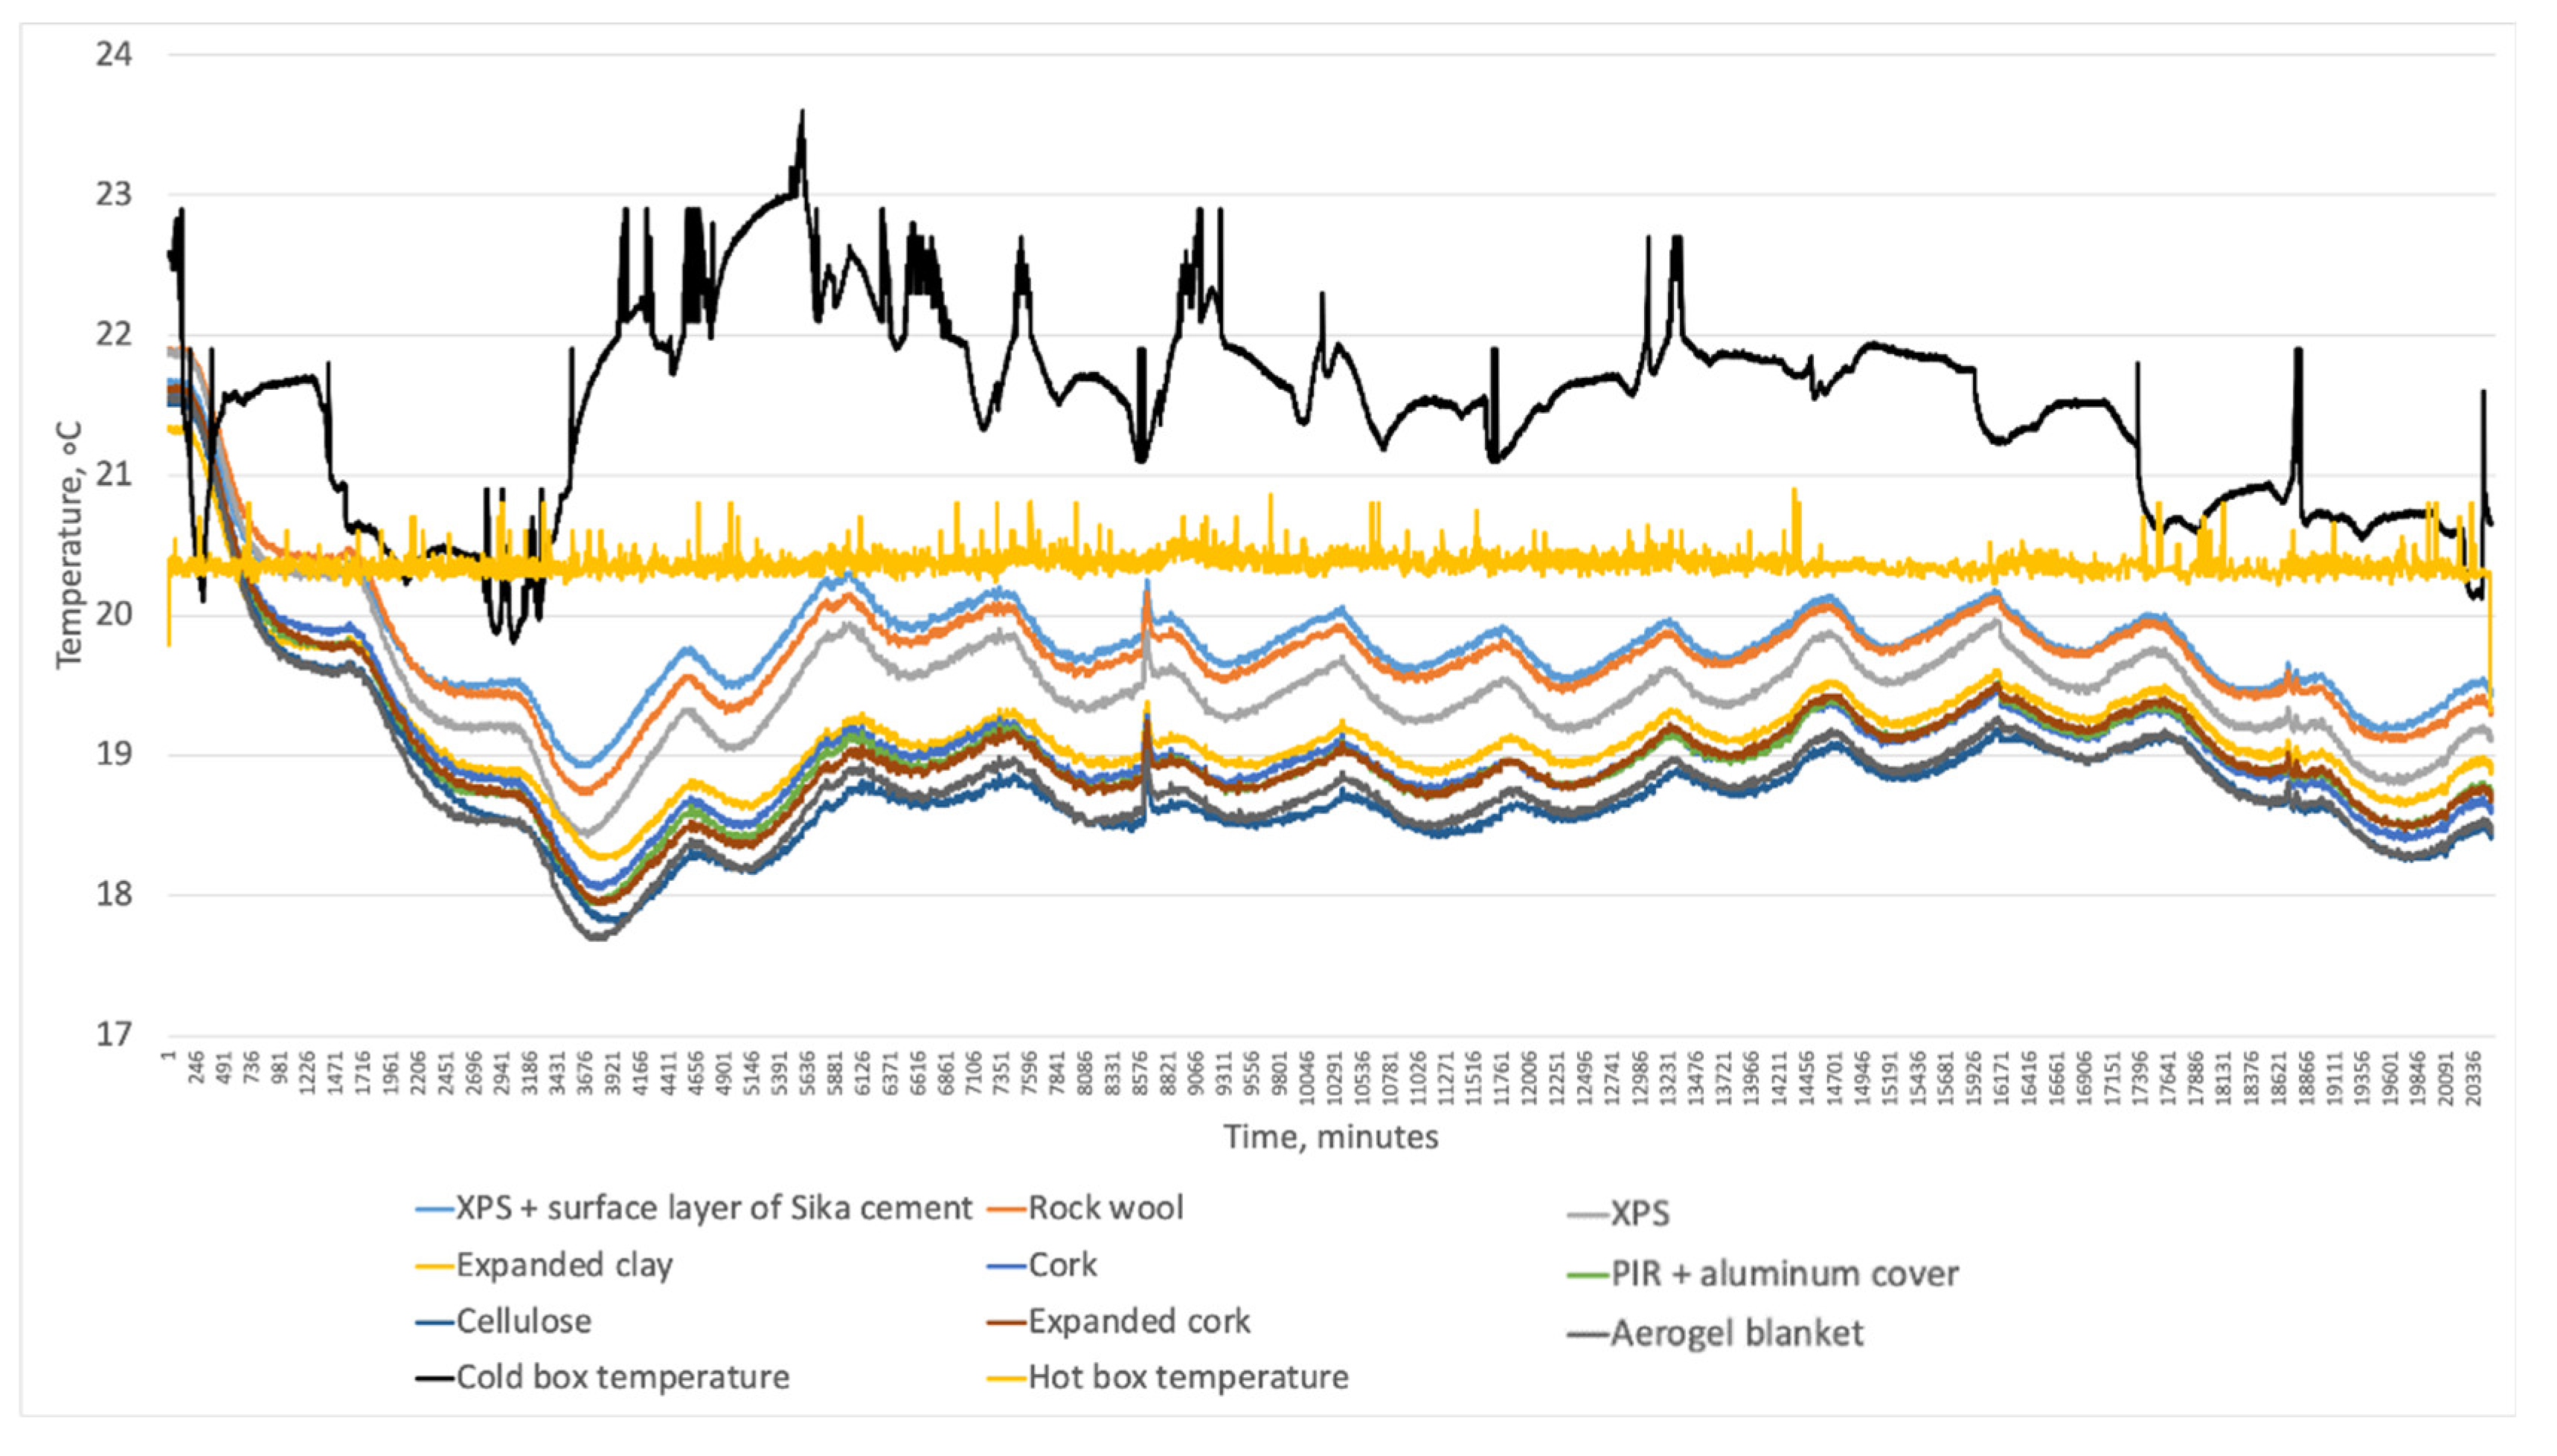
3.2.3. Dry Dynamic Cycle with Heating

During the dry dynamic cycle, the temperature below the insulating materials increased, and new equilibrium states were acquired (see Figure 28).
Figure 29 presents relative humidity changes under insulation during the drying cycle. First, the relative humidity trend followed outdoor temperature because indoor relative humidity was constant. When indoor humidity fell, the insulation systems with low Sd values moved downwards faster than other materials. When indoor relative humidity increased at the last part of the cycle, vapor-open materials with low Sd values followed the trend.

4. Conclusions

  • Internal insulation significantly impacts the hygrothermal behavior of masonry walls, leading to elevated relative humidity levels between insulation layers and an increased risk of frost damage and decay in embedded wooden components.
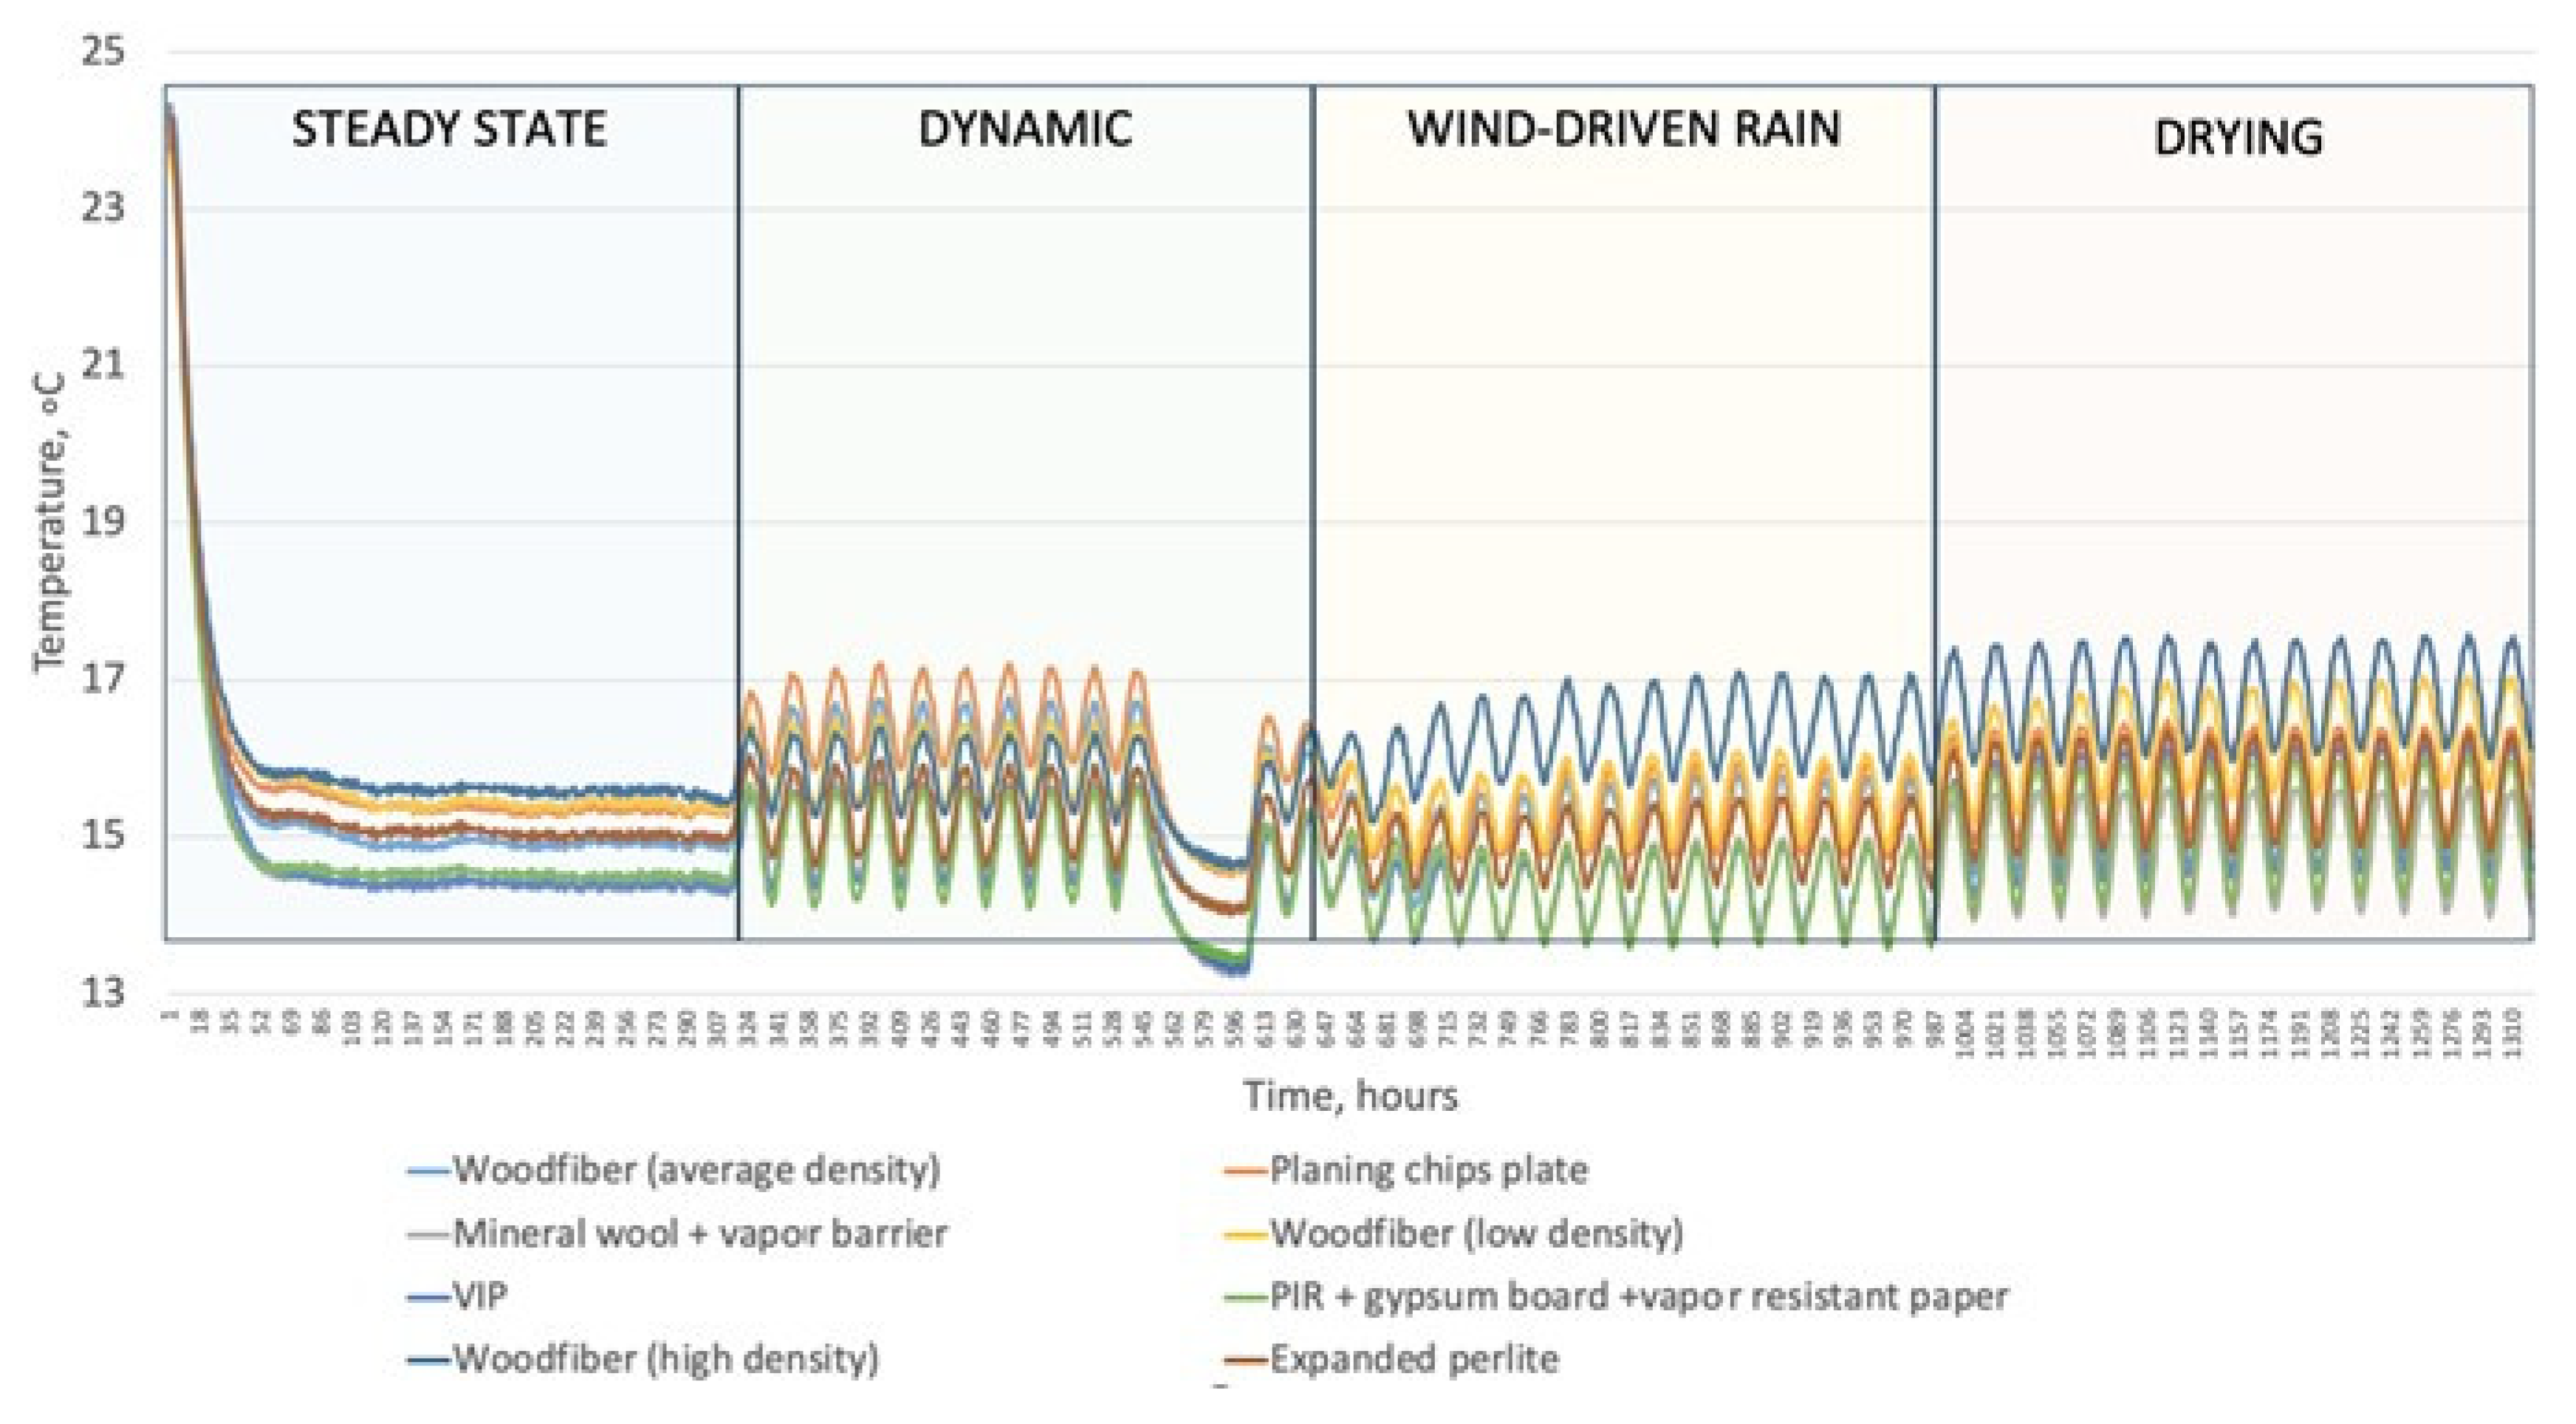
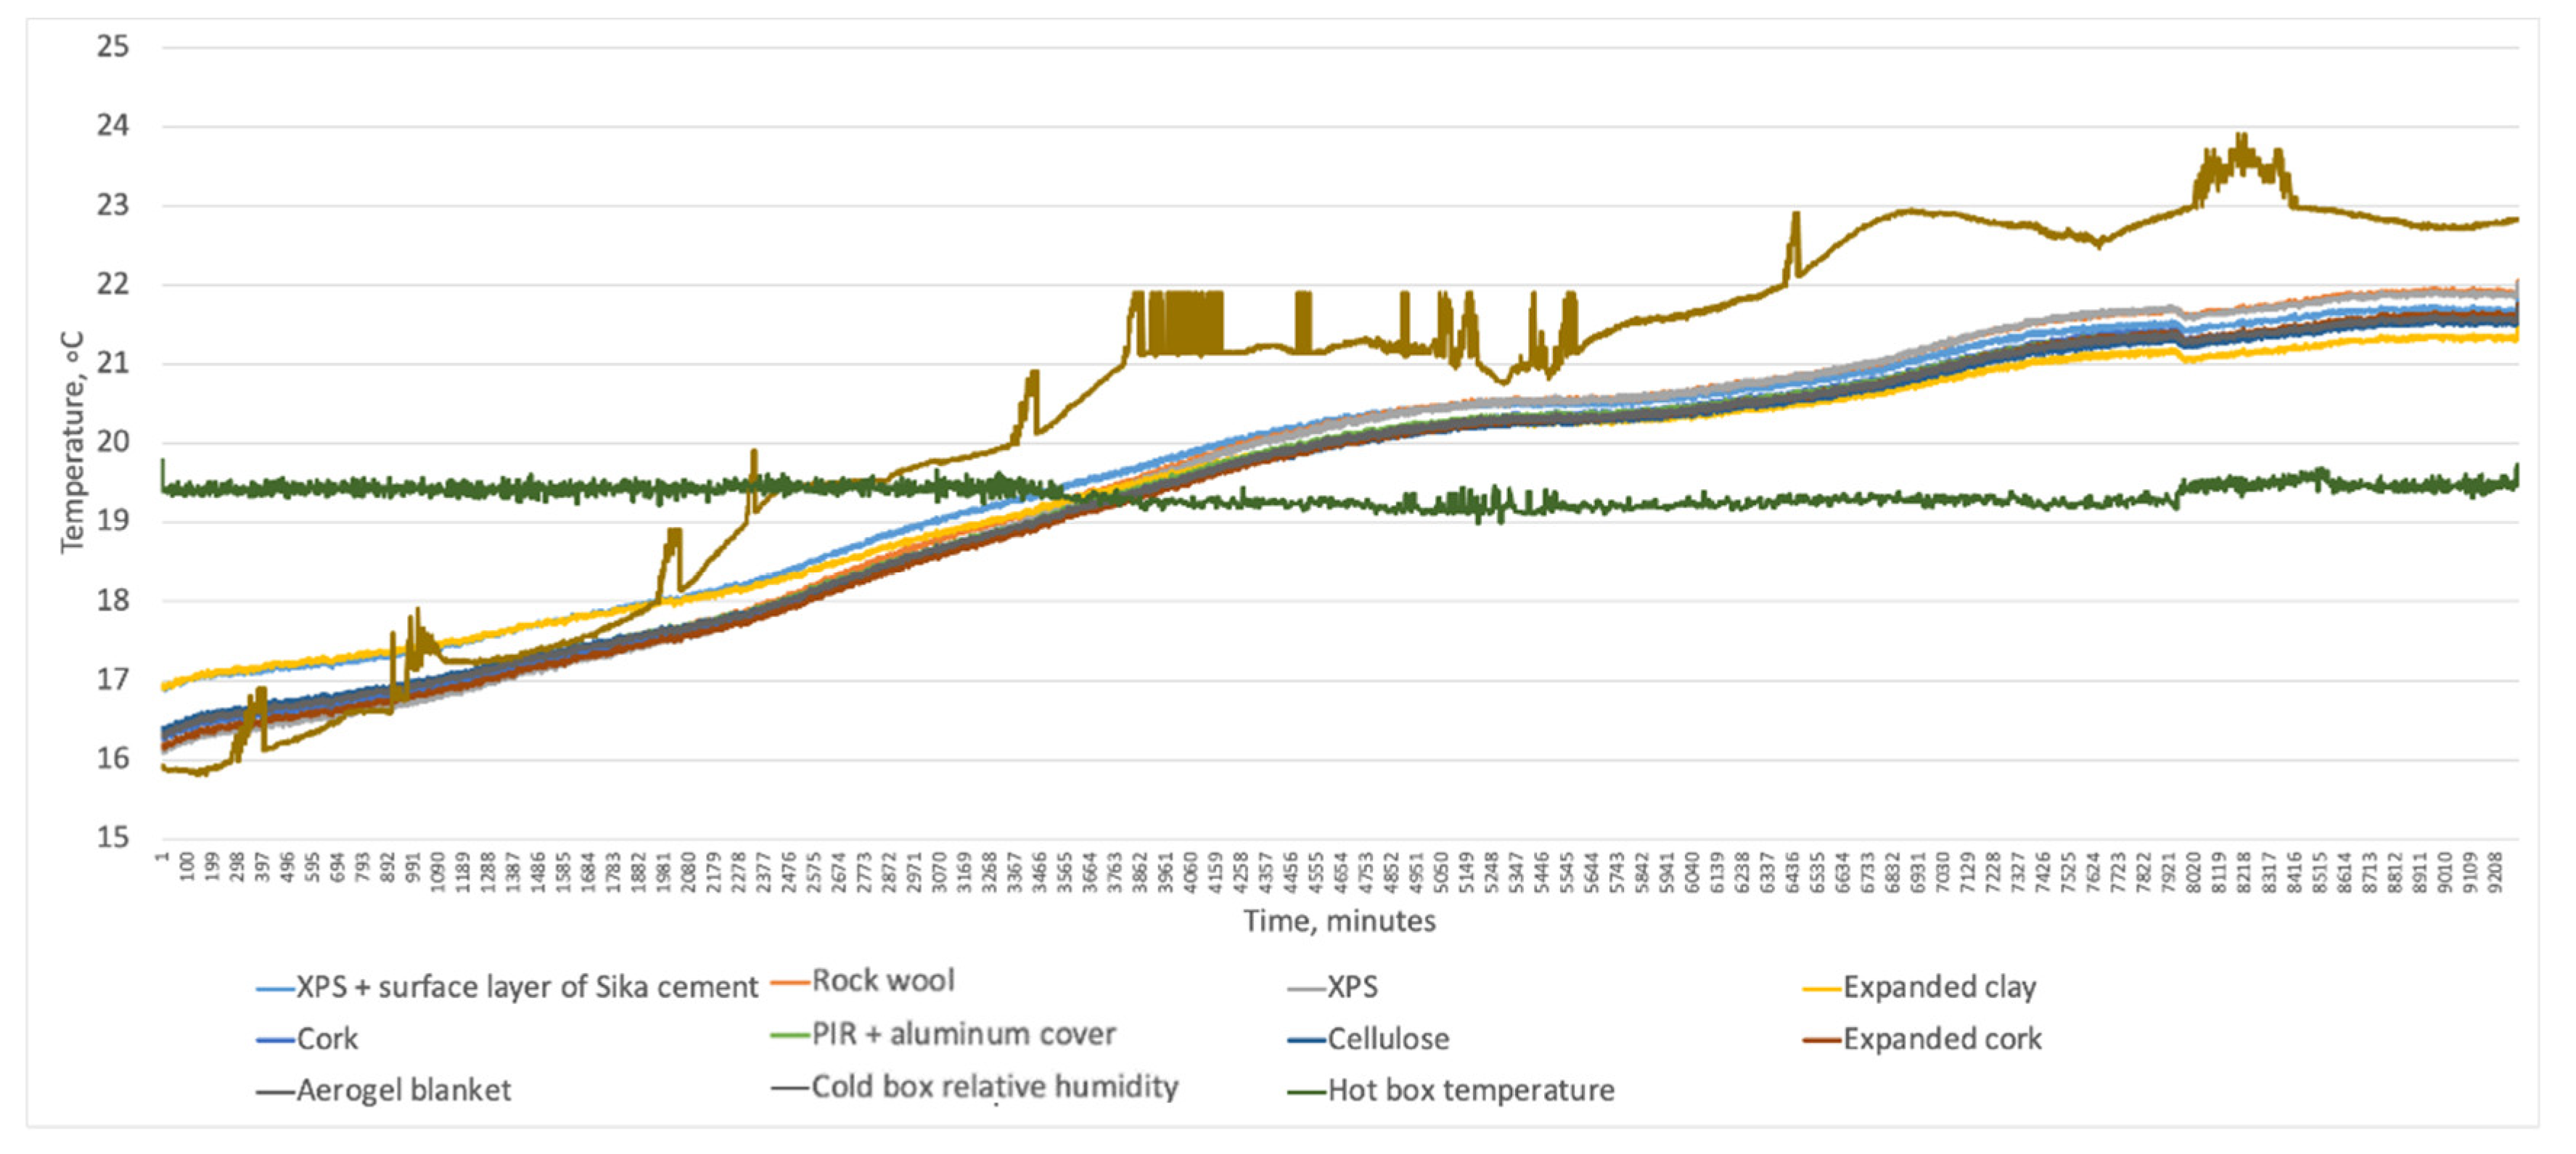
  • Tested insulation systems show similar thermal performance but distinct moisture performance, with temperature under insulation closely correlating with the insulation system’s thermal conductivity.
  • The time lag for heat waves to propagate from the inner surface to the outer surface varies among insulation systems and depends on boundary conditions, particularly the temperature differential between indoor and outdoor environments. The temperature decrement factor also varies and correlates positively with vapor diffusion resistance.
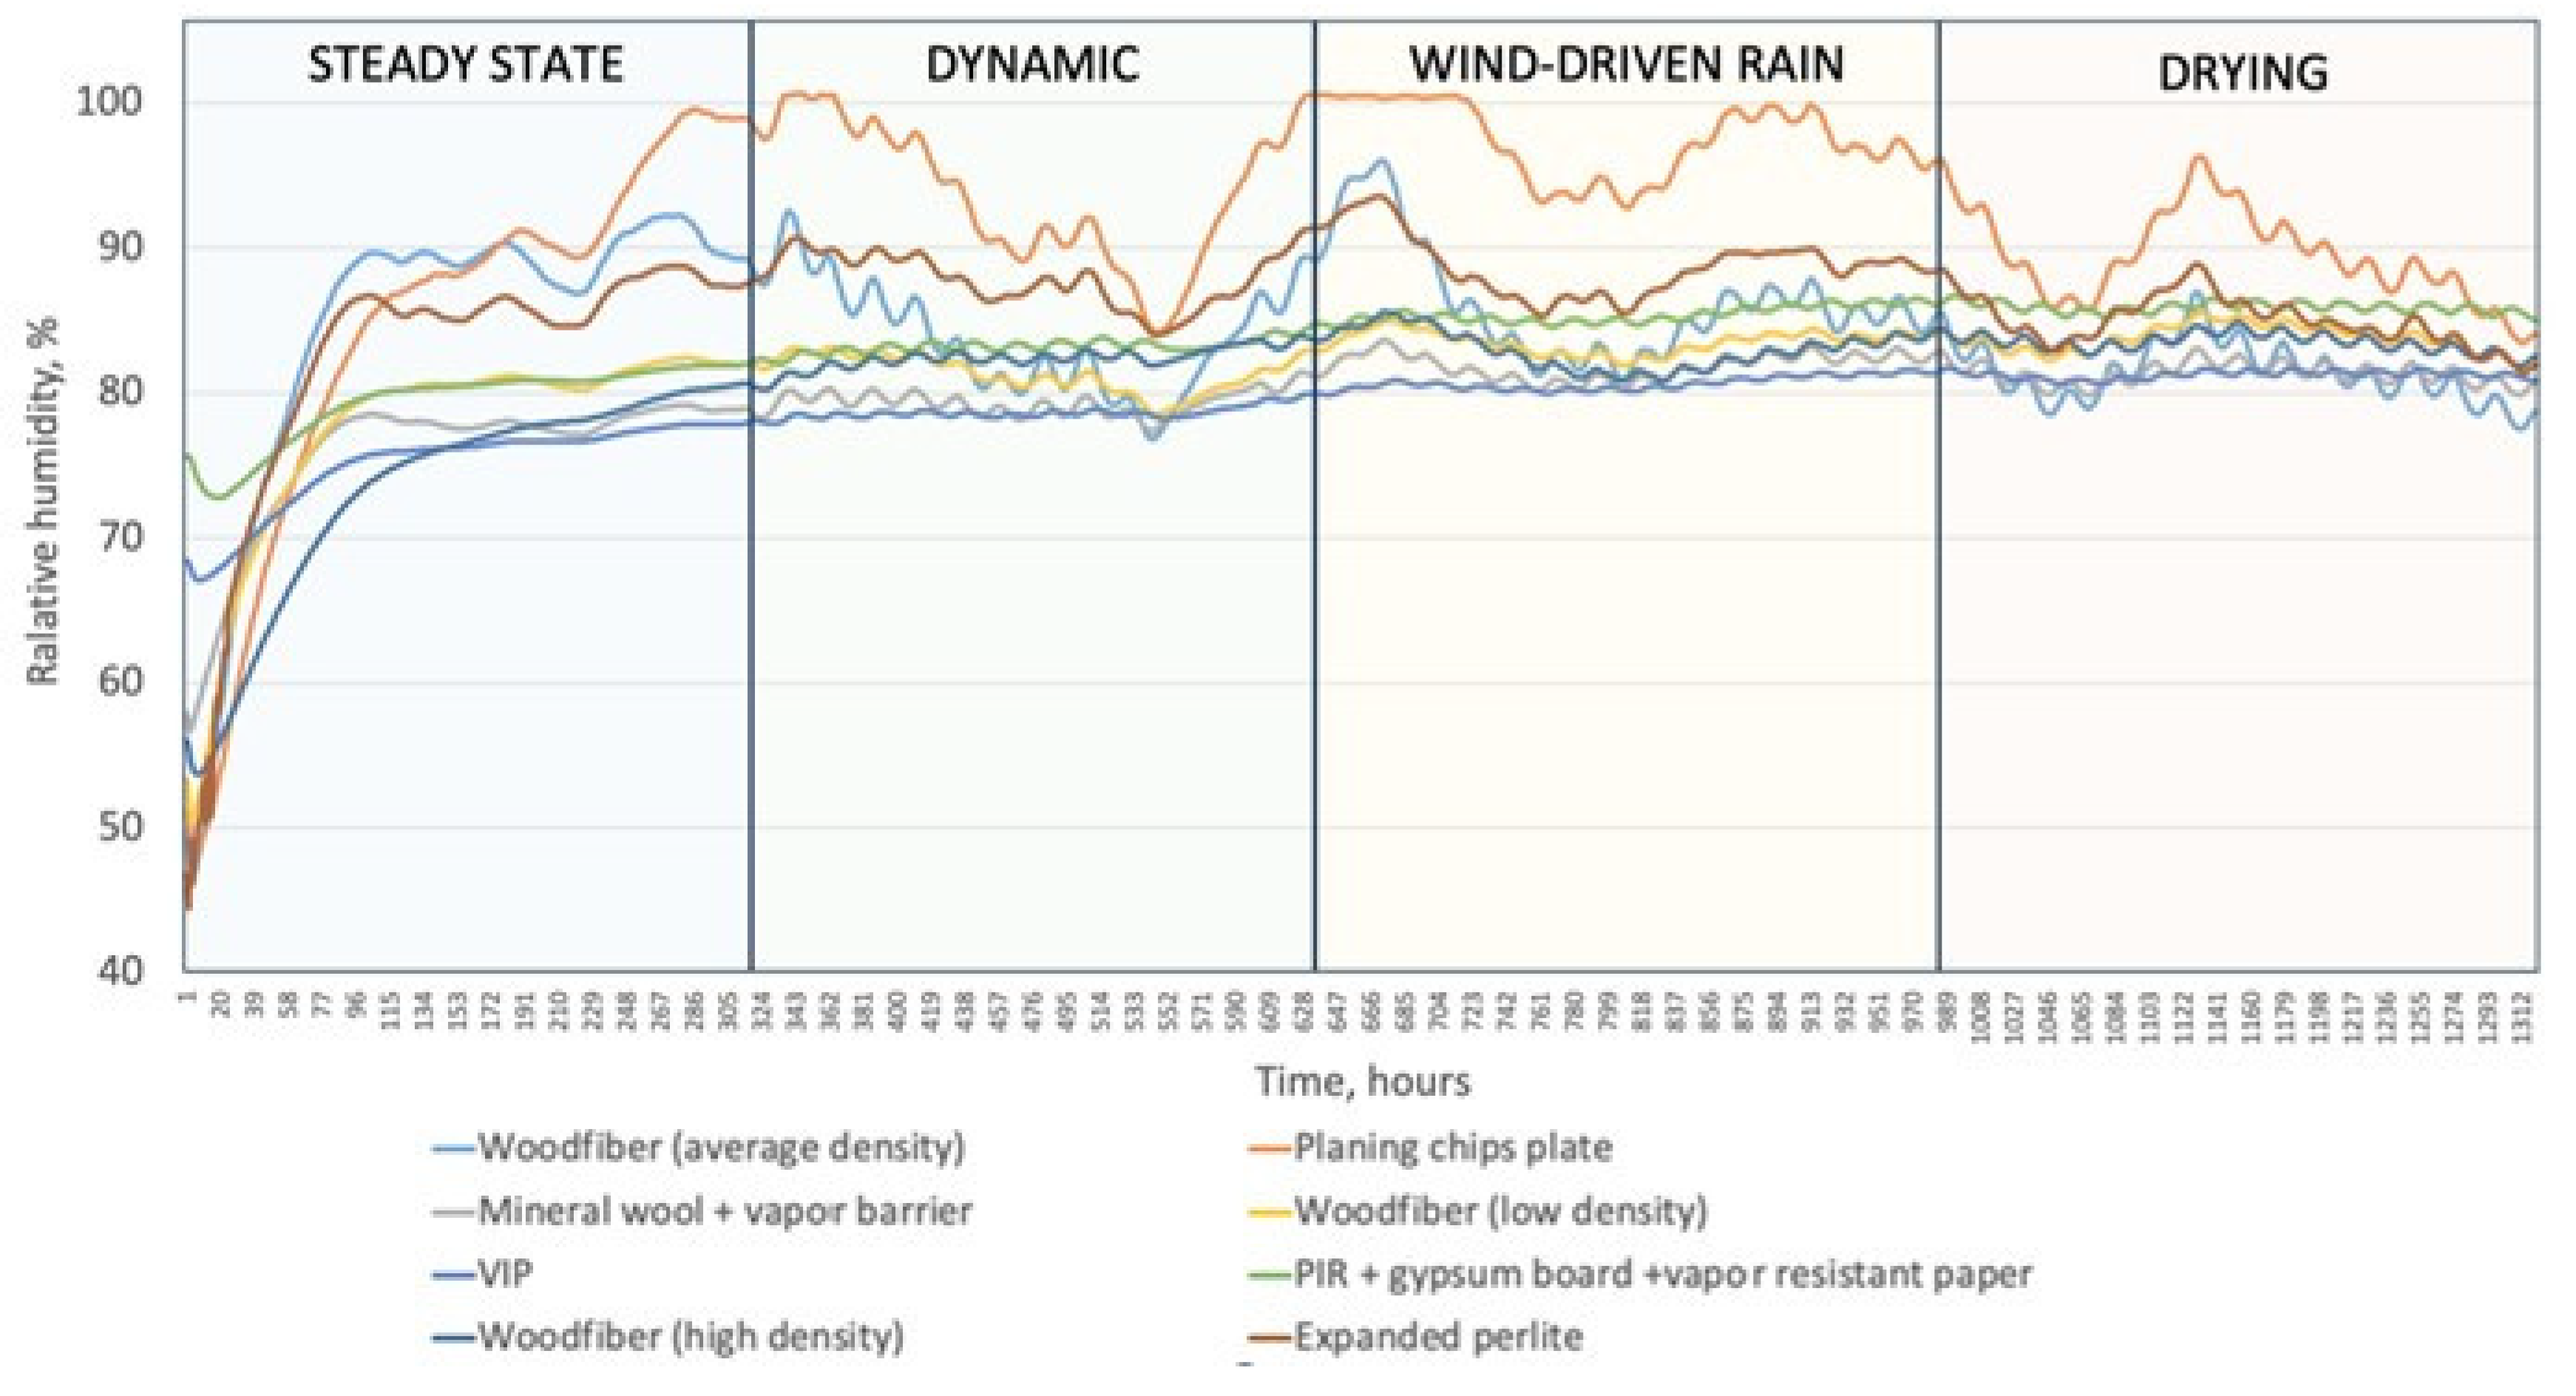
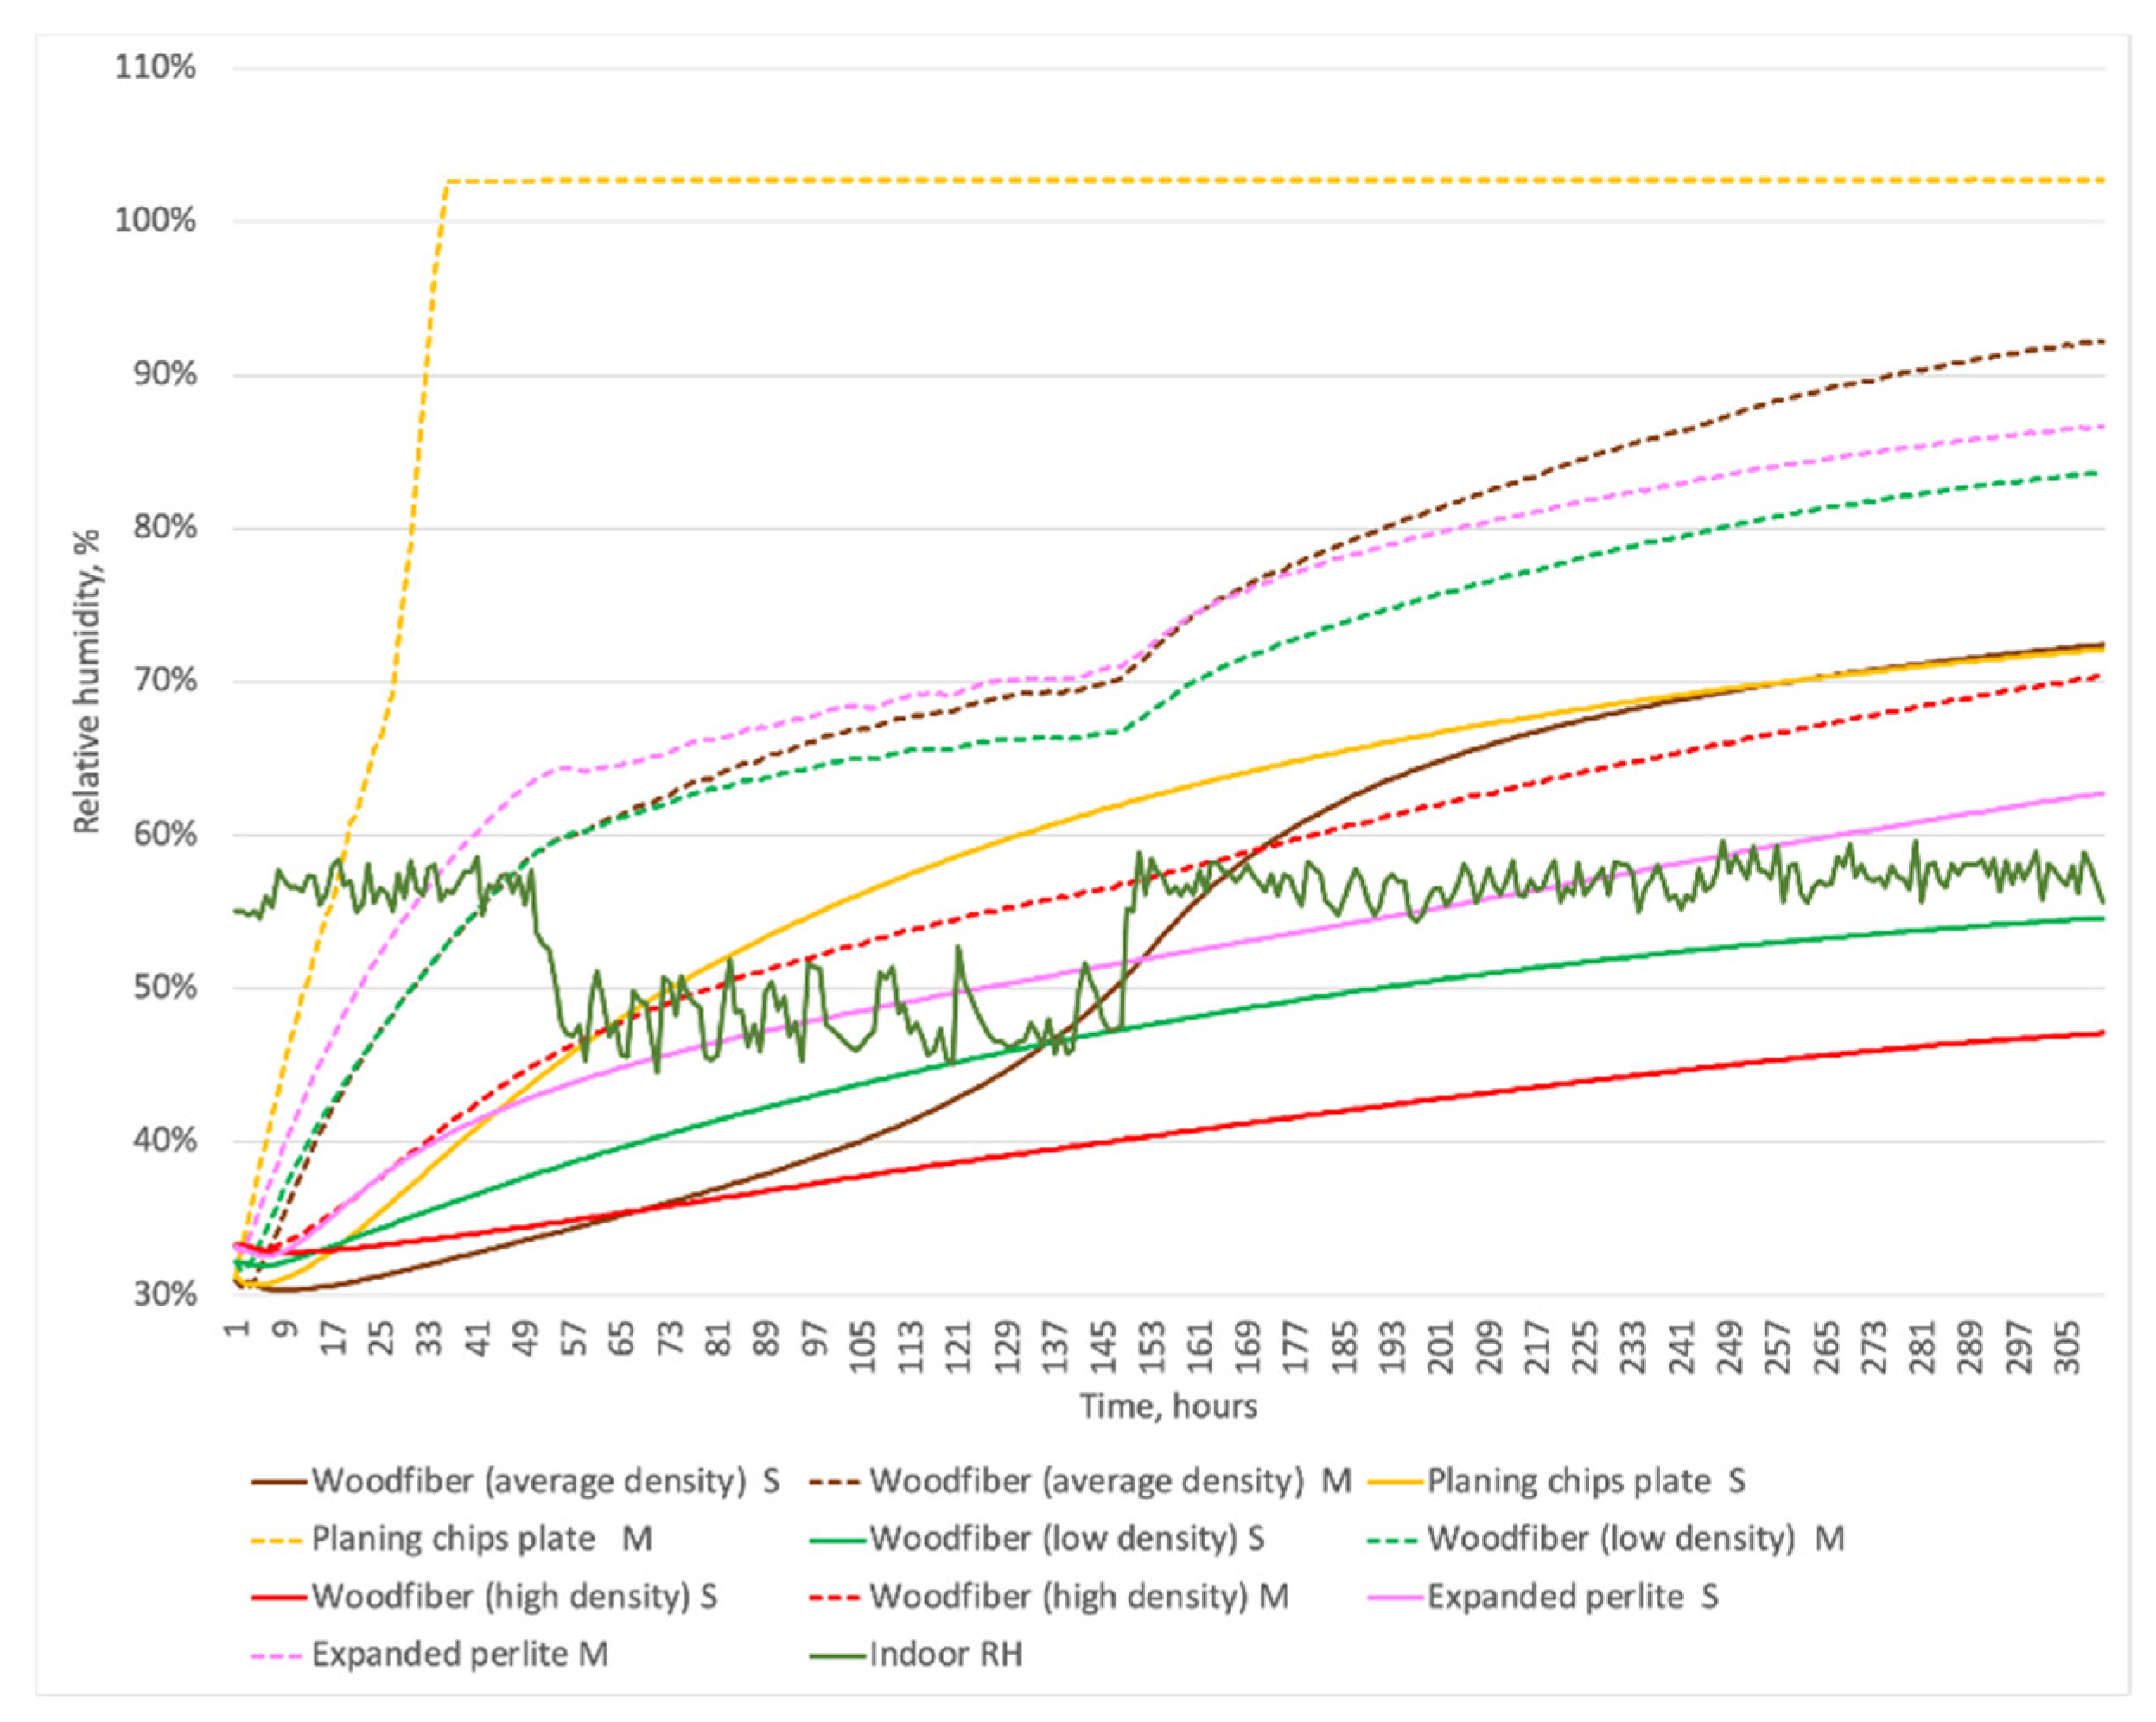
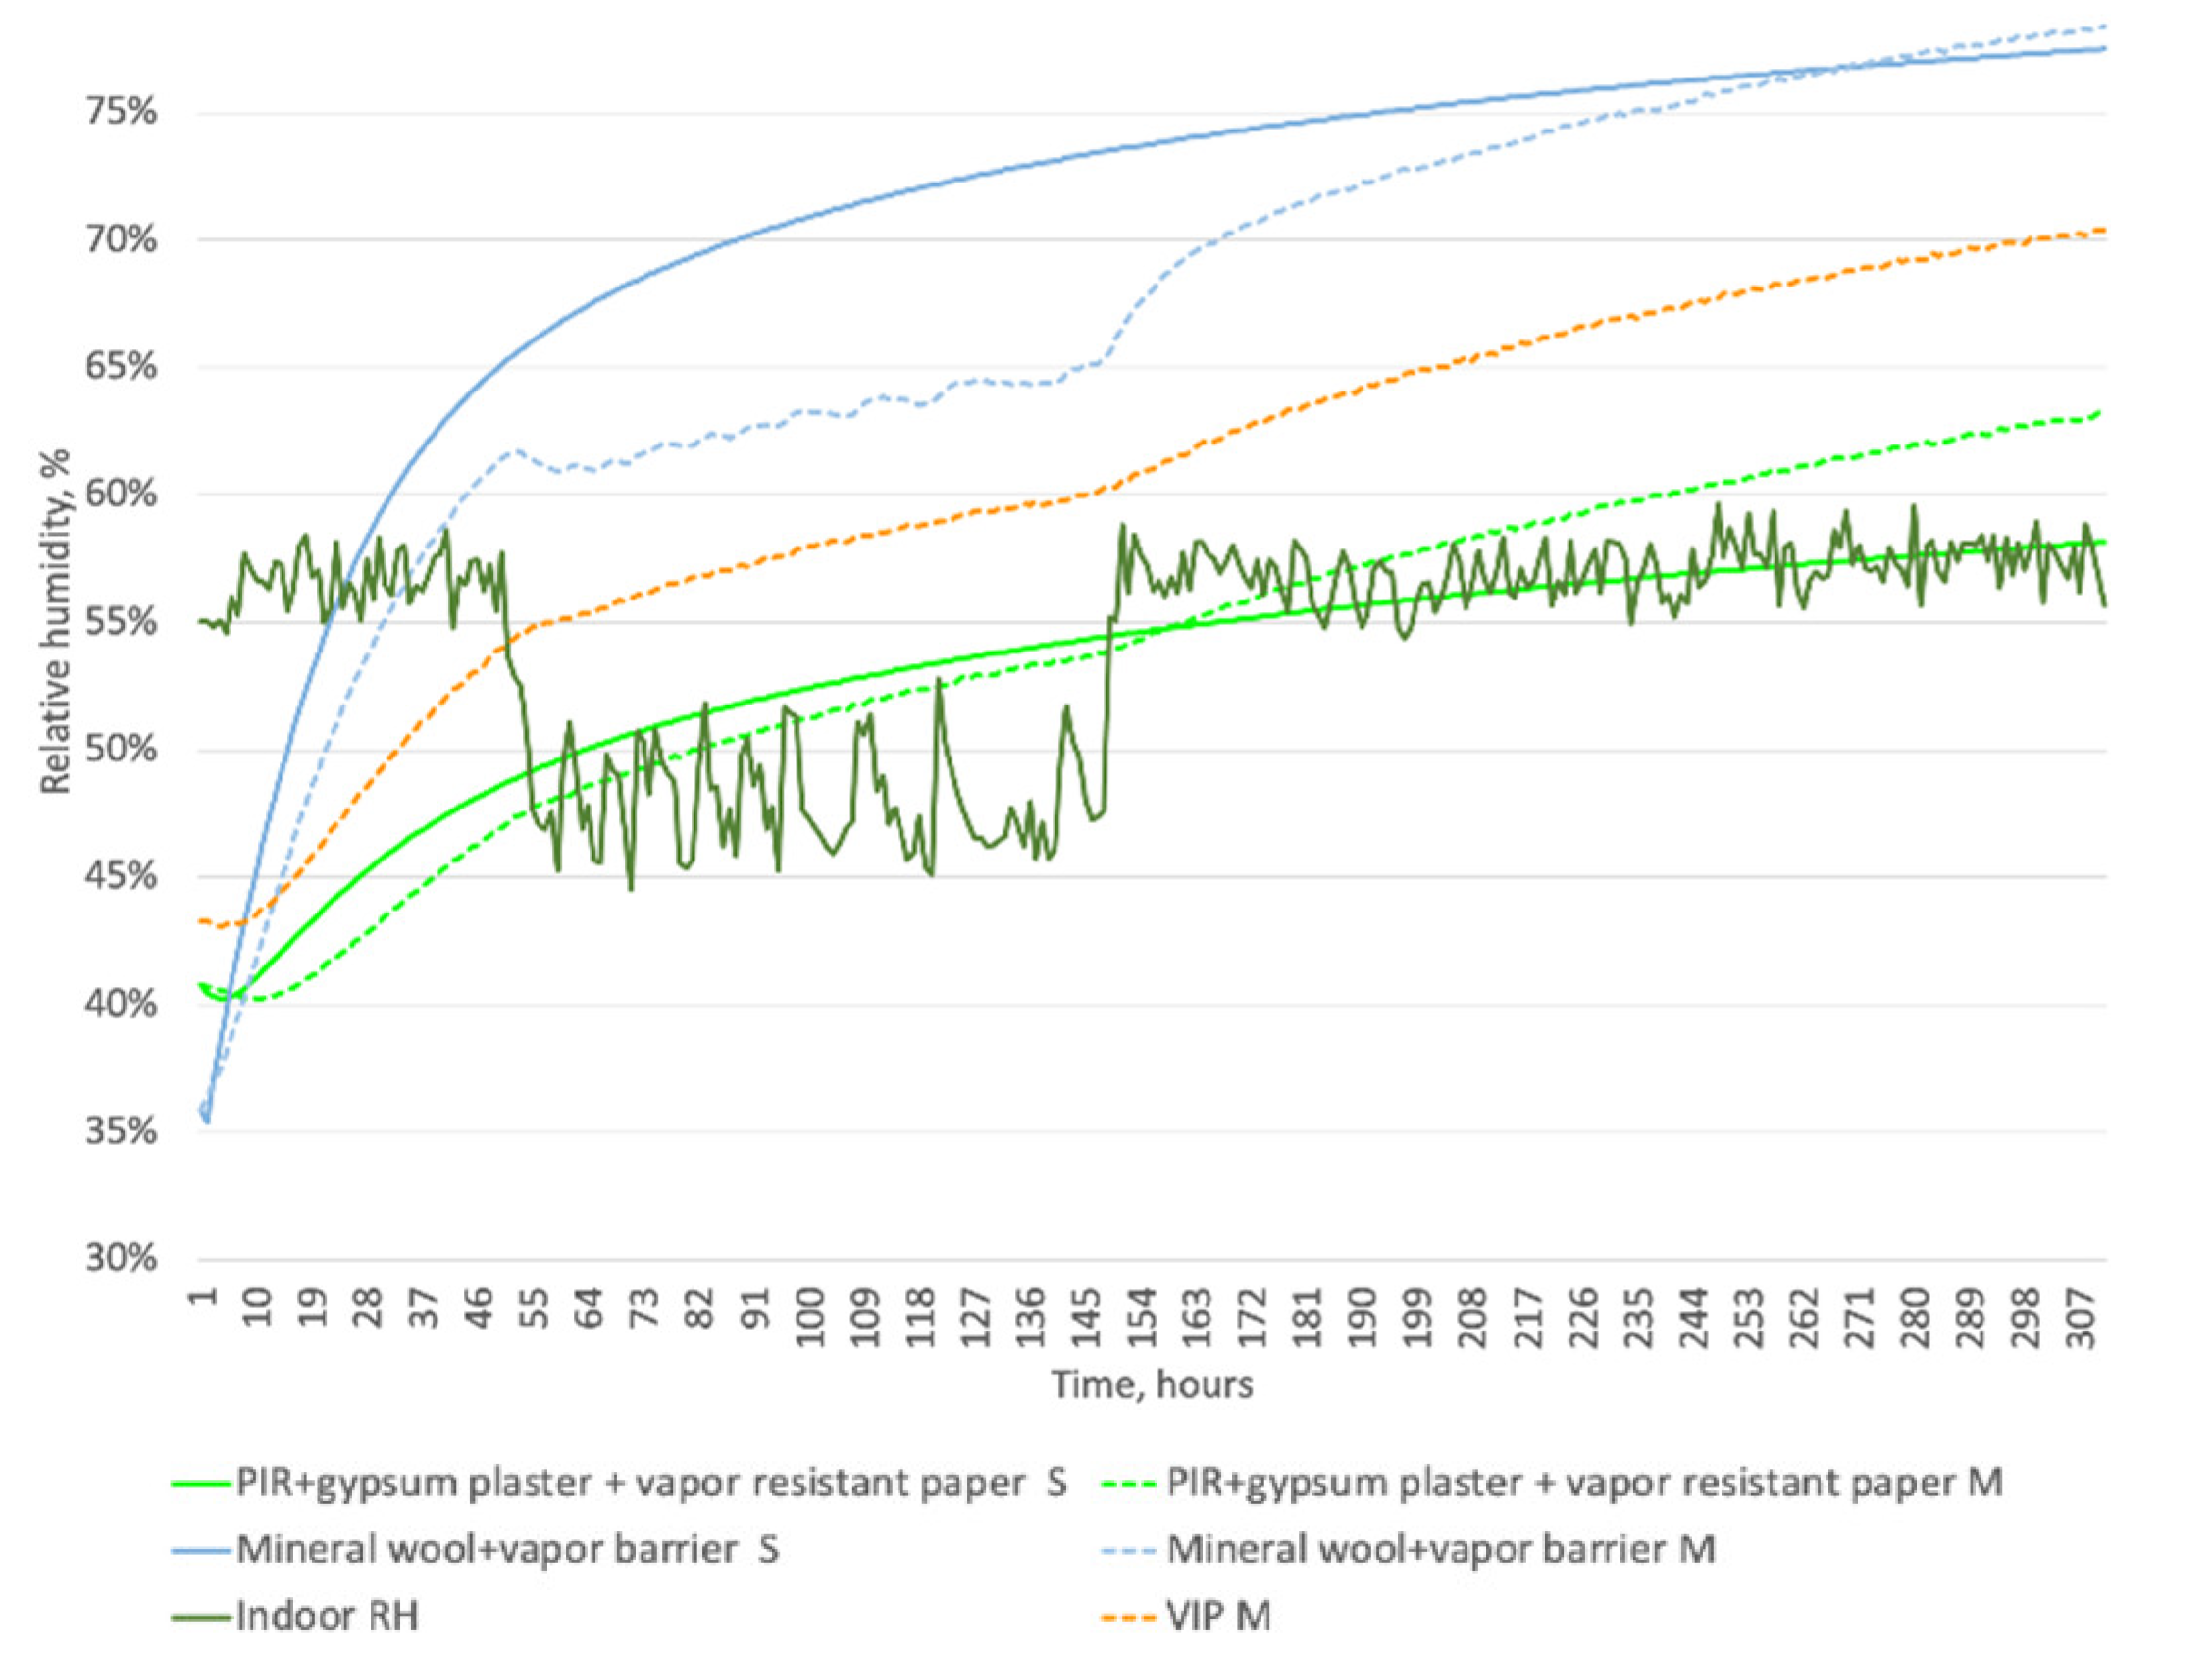
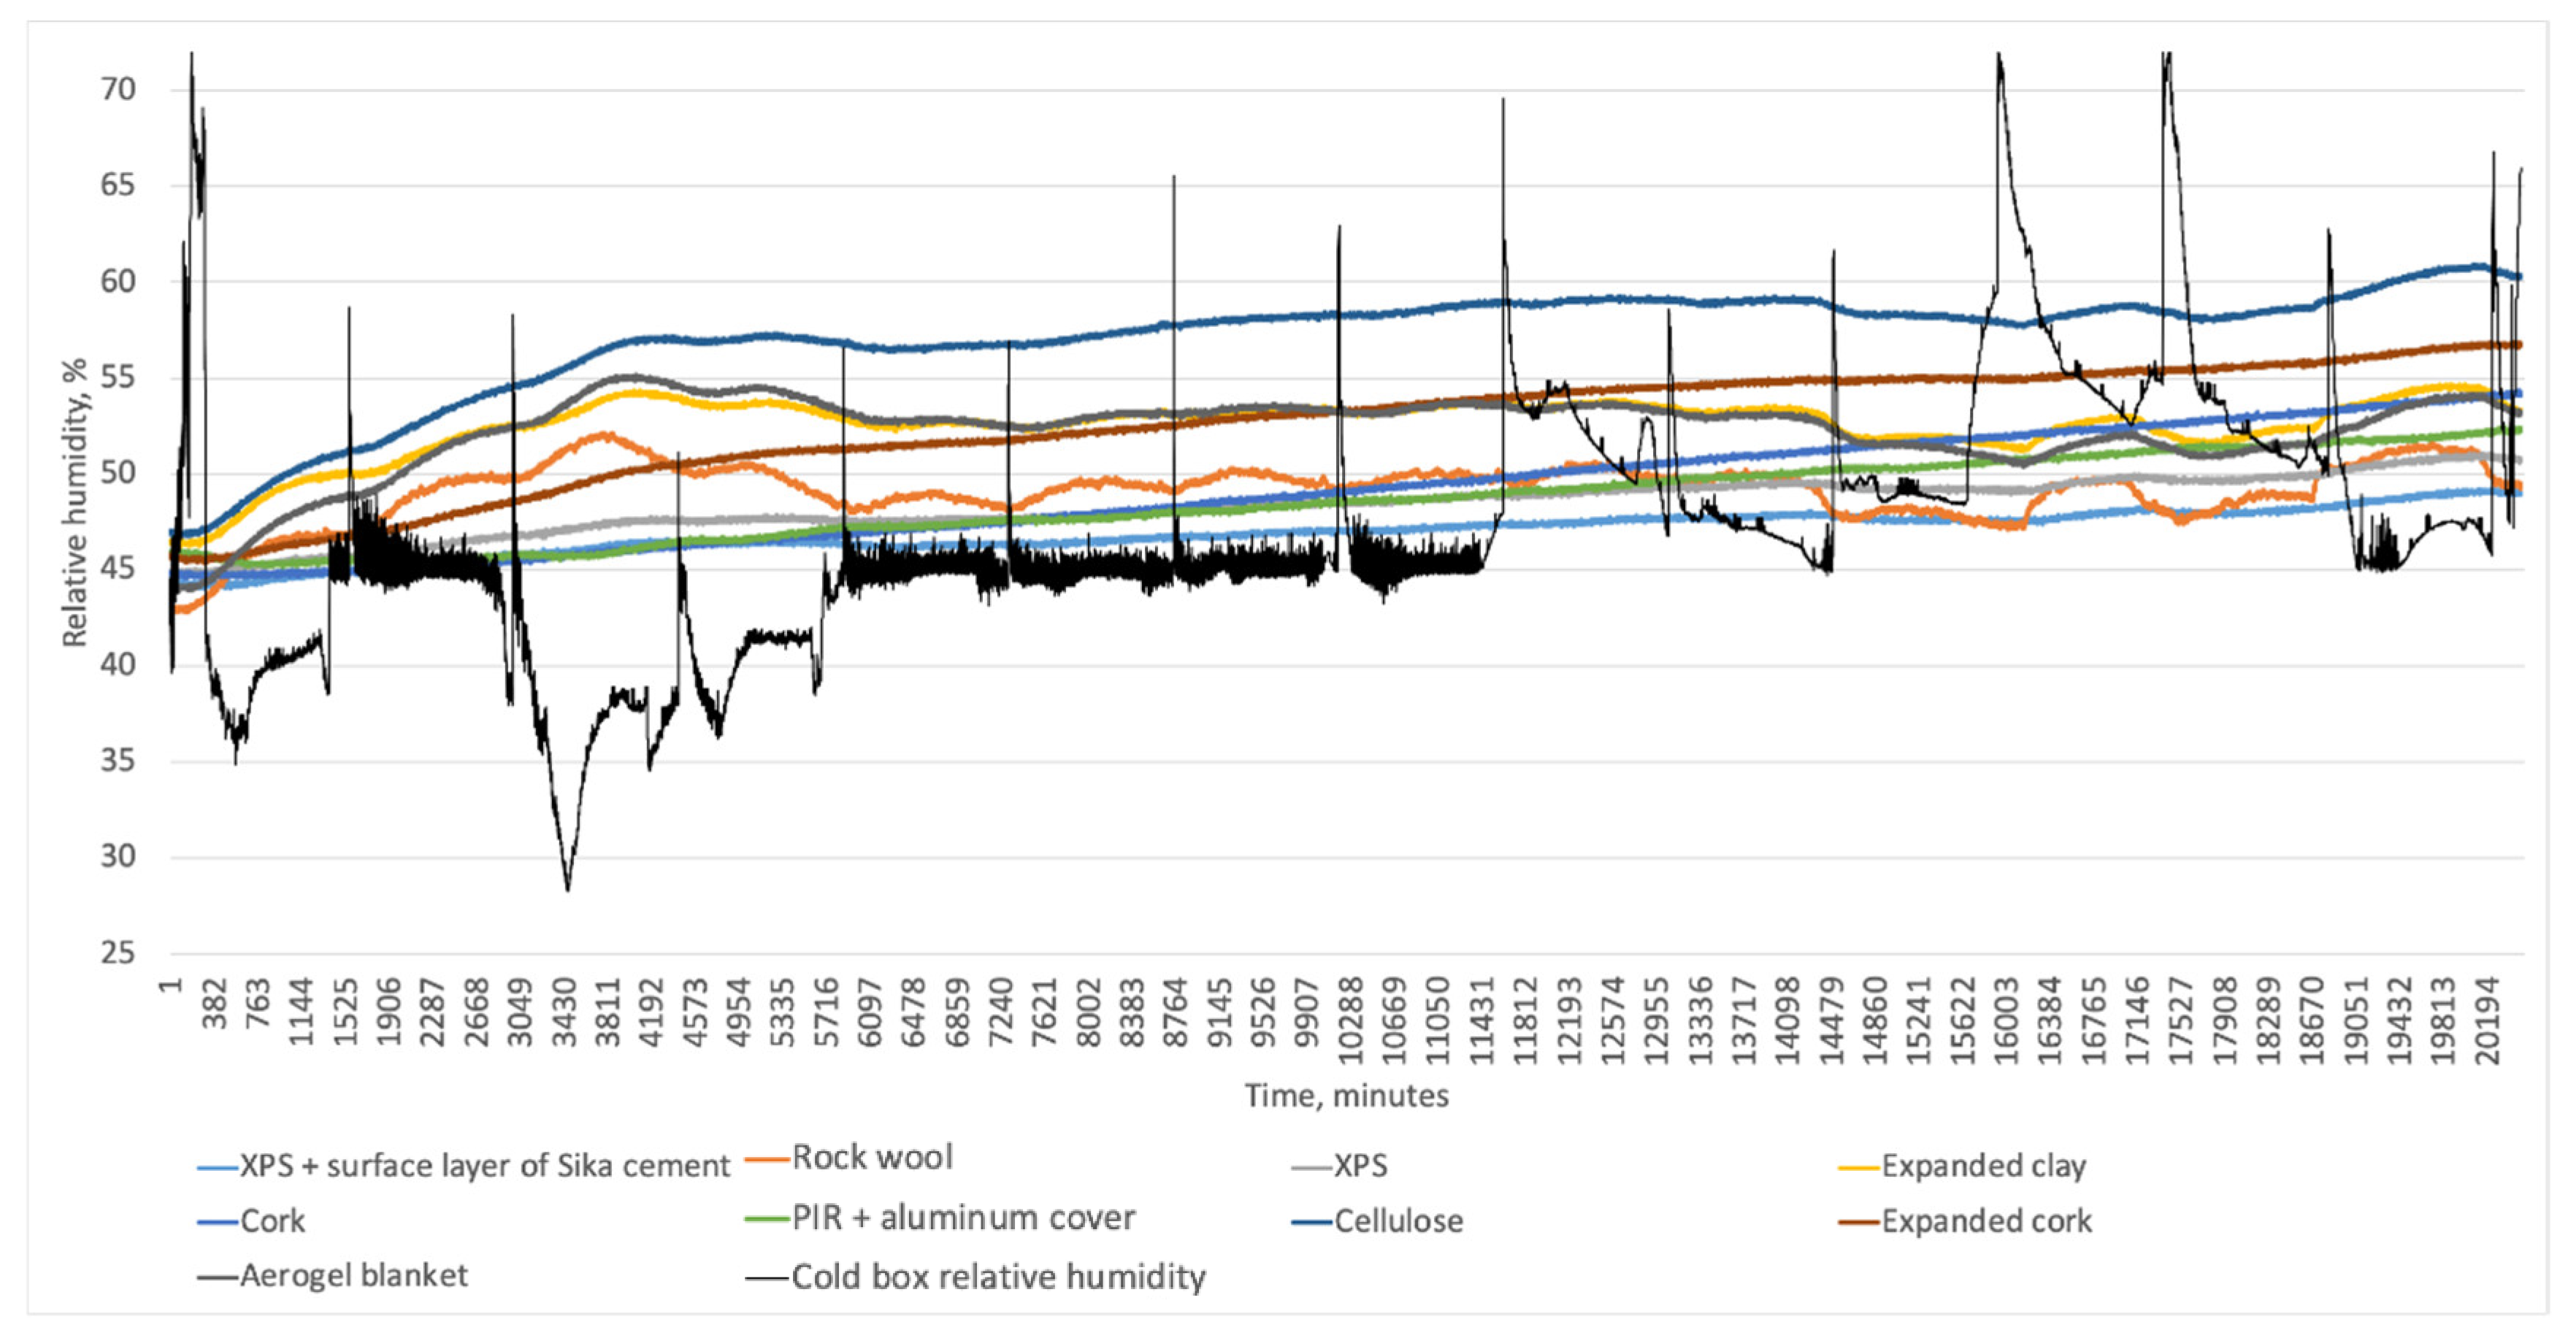
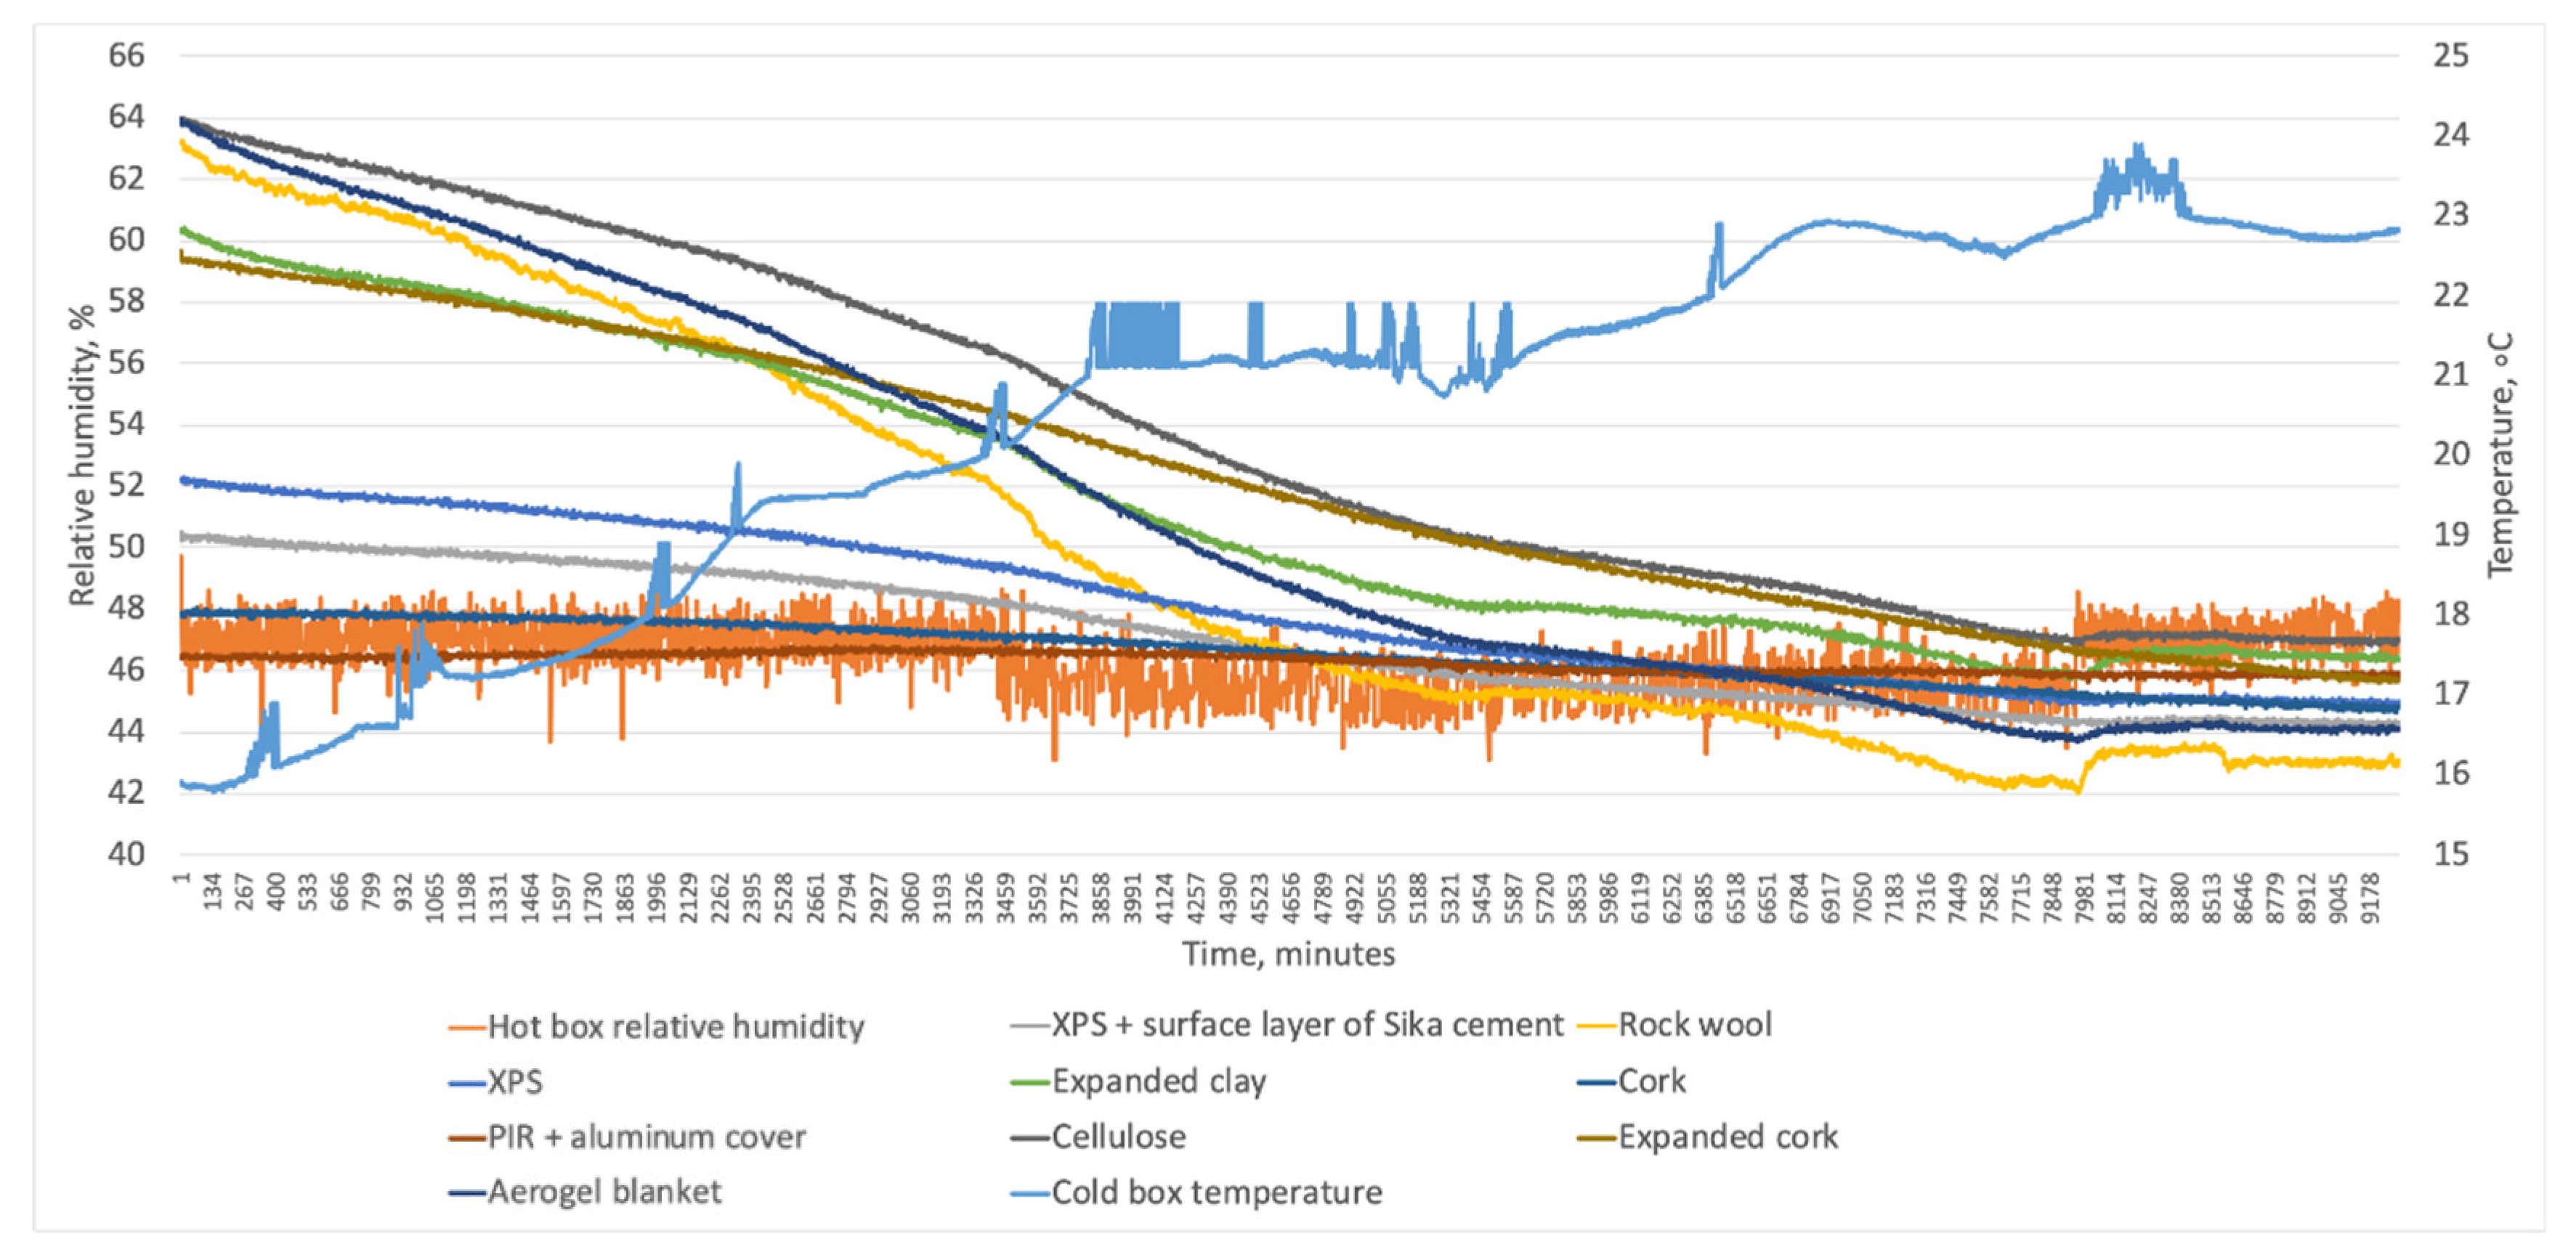
  • Relative humidity beneath insulation is influenced by outdoor temperature fluctuations and indoor relative humidity changes. In systems with low vapor diffusion resistance, relative humidity tracks indoor humidity, while high-resistance systems are primarily influenced by outdoor temperature.
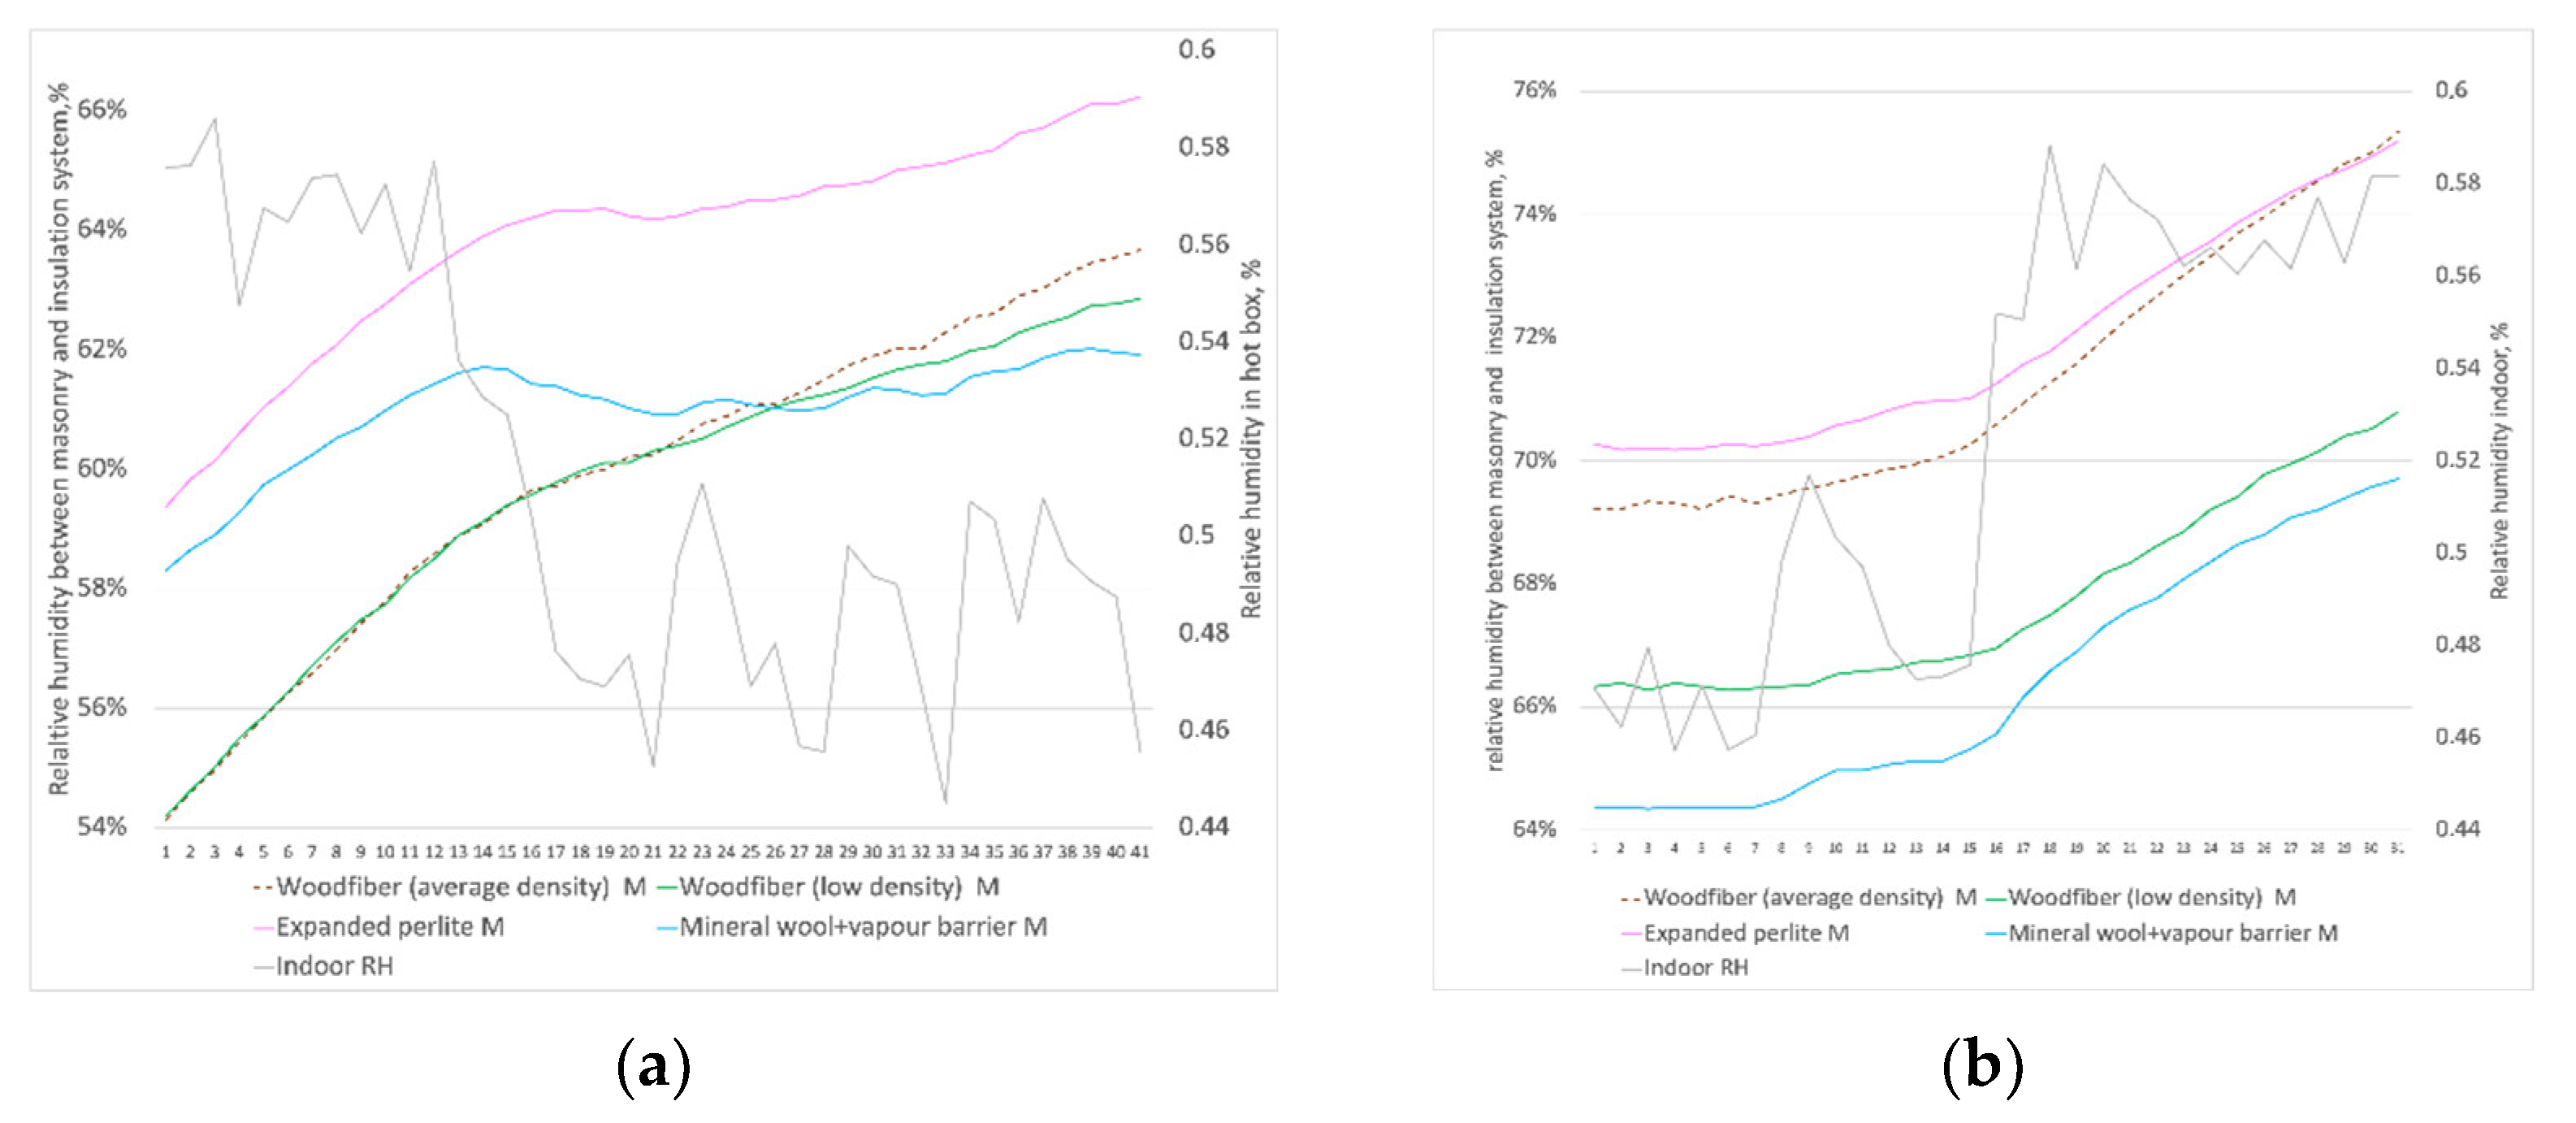
  • Under conditions of indoor humidity stability and outdoor temperature oscillation, vapor-open systems with low vapor diffusion resistance align their relative humidity behavior with temperature profiles. Vapor-tight systems exhibit reduced relative humidity amplitudes as vapor diffusion resistance decreases.
  • When both indoor relative humidity and outdoor temperatures oscillate, vapor-open systems with low vapor diffusion resistance resemble indoor humidity profiles more closely.
  • Wind-driven rain exacerbates relative humidity increase under insulation systems, with the impact being greater in materials with higher vapor diffusion resistance.
  • Vapor-open materials such as cork, expanded cork, and high-density fiberboard, even without vapor barriers, behave similarly to vapor-tight systems, being less sensitive to indoor relative humidity changes and more sensitive to outdoor temperature oscillations.
  • Longer test periods or mathematical model simulations based on short-term data are needed to detect and understand moisture accumulation effects on temperature and relative humidity under insulation.
  • Achieving accurate simulation results requires precise input data, including material properties such as insulation and mortar, which should closely match real-world values. The choice of brick type is also crucial, as different bricks with similar absorption coefficients can yield different results.
  • Internal insulation projects should be approached on a case-specific basis, considering various material parameters that can be challenging to determine, especially vapor and capillary conductivity as functions of moisture content. Detailed planning is essential to account for case-specific variables in hygrothermal simulations.
These conclusions underscore the complexity of hygrothermal behavior in internally insulated masonry walls and emphasize the need for careful material selection, long-term testing, and accurate simulation to ensure effective and durable insulation solutions.

Author Contributions

Methodology, V.B.; data curation, Z.Z.; writing—original draft, R.F.; writing—review and editing, R.V. and A.B.; supervision, A.B. All authors have read and agreed to the published version of the manuscript.

Funding

European Social Fund within Project No 8.2.2.0/20/I/008 ‘Strengthening of Ph.D. students and academic personnel of Riga Technical University and BA School of Business and Finance in the strategic fields of specialization’ of the Specific Objective 8.2.2 ‘To Strengthen Academic Staff of Higher Education Institutions in Strategic Specialization Areas’ of the Operational Program ‘Growth and Employment’.

Conflicts of Interest

The authors declare no conflict of interest.

Appendix A

Table A1. Thermal insulation systems used in the experiment.
No.Insulation MaterialInsulation TypeMounting Mechanism/GlueVapor BarrierPlaster MaterialType of Thermal Insulation SystemProperties of Insulation Material Used in the Insulation System
δ, mλ, W/mKRλ, m2K/WU, W/m2KμSd, mMBV Tested
1.Planing chips plates Organic plants/animal-derivedGlueNoNoVapor-open non capillary active0.050.0660.761.08n/an/aYes
2.Mineral woolInorganic mineral-derivedCarcassYesGypsum plasterVapor-tight (vapor-open with vapor barrier)0.050.0421.190.7410.05Yes
3.PIR with gypsum board (indoors) and vapor-resistant paper (outdoors)Organic fossil fuel-derivedPolyurethane glueEmbedded in materialPlasterboard embedded in the materialVapor-tight0.030.0231.300.686400256 *Yes
4.High density woodfiber Organic plants/animal-derivedClay plaster
Two layers were glued with clay plaster to achieve similar U value to other woodfiber-based materials.
NoSpecial clay plasterVapor-open capillary active 0.0440.0480.920.9250.22Yes
5.Average density woodfiberOrganic plants/animal-derivedclay plasterNoSpecial clay plasterVapor-open capillary active0.040.0381.050.8250.20Yes
6.Low density woodfiberOrganic plants/animal-derivedclay plasterNoSpecial clay plasterVapor-open capillary active0.050.0381.320.6720.10Yes
7.Expanded perliteInorganic mineral-derivedSpecial glue for expanded perliteNoGypsum plasterVapor-open capillary active0.050.0451.110.7850.25Yes
8.VIP InnovativePolyurethane glue and carcassNoGypsum plasterVapor-tight0.020.0072.860.33n/an/aNo
9.XPS with the surface layer of Sika cement and a glass fibef netOrganic fossil fuel-derived NoGypsum plasterVapor-tight0.020.0350.571.751332.66Yes
10.Rock woolInorganic mineral-derived NoGypsum plasterVapor-open non capillary active 0.050.0451.110.910.05Yes
11.XPSOrganic fossil fuel-derived NoGypsum plasterVapor-tight0.050.0351.430.71336.65Yes
12.Expanded clayInorganic mineral-derivedLoose fillNoGypsum plasterVapor-open0.050.070.711.420.1Yes
13.CorkOrganic plants/animal-derived NoGypsum plasterVapor-open non capillary active0.0450.041.130.89100.45No
14.Expanded corkOrganic plants/animal-derived NoGypsum plasterVapour-open non capillary active0.050.041.250.8100.5No
15.PIR with aluminum cover on both sides Organic fossil fuel-derived NoGypsum plasterVapor tight0.030.0231.30.7799No
16.CelluloseOrganic plants/animal-derivedLoose fillNoGypsum plasterVapor-open capillary active0.050.0361.390.7220.1Yes
17.Aerogel blanketInnovative NoGypsum plasterVapor-open non capillary active0.0160.020.81.2550.08No
* Sd values were assigned to the entire insulation system because the manufacturer was unable to provide information on the insulation material separately.
Table A2. Properties of materials used for simulations to correspond with the laboratory experiment.
MaterialBrickMortarHigh Density WoodfiberLow Eensity WoodfiberAverage Eensity WoodfiberPlaning Chips PlateExpanded PerlitePIR with Gypsum Board and Vapor-Resistant PaperClay Plaster for Woodfiber
Name of the material in the DELPHIN databaseOld Building Brick Rote Kaserne Potsdam (inner brick 2)Lime cement mortarWood Fiber BoardWood Fiber Board indoorWood Fiber Insulation BoardWood Wool Cement BoardTecTem Insulation Board Indoor 50 + 60 mmPolyurethane boardsLight Clay Mortar
Density of the material, kg/m32049187830011916118010035900
Porosity, m3/m30.2270.2910.4200.9230.8930.9310.9620.9490.470
Water vapor diffusion resistance factor19.036.95.01.13.44.98.010030.0
Specific heat capacity of dry material, J/kg∙K8477581880100016621470164015001000
Thermal conductivity, W/m∙K0.8610.8030.0500.0400.0390.0600.0460.0280.230
Effective saturation (long term process), m3/m30.2400.2230.4000.5900.5500.3400.07700.9490.450
Water uptake coefficient, kg/m2s0.50.33590.03608520.06740.005035910.002885930.00891.98091 × 10−70.00367
Table A3. The brick properties acquired from laboratory tests and comparison with building brick from DELPHIN database used for initial simulations.
BrickBulk Density ρ, kg/m3Specific Heat Capacity c, J/kg∙KThermal Conductivity λdryTotal Porosity Opor, m3/m3Capillary Saturation Ocap, m3/m3Dry Cup Value μdryWater Uptake AW, kg/m2s0.5
Lode2081.36710.88090.18880.149224.040.0946
Old Building Brick Rote Kaserne Potsdam (inner brick 2)20498470.8610.2270.24190.3359
Difference, %+1.6%−26.2%+2.3%−20.2%−60.9%+21.0%−255.1%
Sorption isotherm and moisture retention curves were obtained from the performed tests (Figure A1).
Figure A1. (a) Sorption isotherm and (b) moisture retention curves, of the brick used for the masonry sample.
Buildings 13 02511 g0a1
The vapor permeability curves depending on relative humidity and moisture content were also determined (Figure A2).
Figure A2. Vapor permeability curves of the brick rick used for the masonry sample depending on (a) relative humidity and (b) moisture content.
Buildings 13 02511 g0a2
The liquid conductivity curves depending on relative humidity and moisture content were also determined (Figure A3).
Figure A3. Liquid conductivity curves of the brick rick used for the masonry sample depending on relative humidity (a) and moisture content (b).
Buildings 13 02511 g0a3
From the acquired data, a new material file, which could be used in the DELPHIN simulation software, was created.

References

  1. Calvin, K.; Lee, H.; Dasgupta, D. IPCC, 2023: Climate Change 2023: Synthesis Report. Contribution of Working Groups I, II and III to the Sixth Assessment Report of the Intergovernmental Panel on Climate Change. Proceedings of the Intergovernmental Panel on Climate Change (IPCC), Geneva, Switzerland, 13–19 March 2023; Core Writing Team, Lee, H., Romero, J., Eds.; IPCC: Geneva, Switzerland, 2023. [Google Scholar] [CrossRef]
  2. Tracking Clean Energy Progress 2023—Analysis. IEA. Available online: https://www.iea.org/reports/tracking-clean-energy-progress-2023 (accessed on 6 September 2023).
  3. Laaroussi, Y.; Bahrar, M.; Zavrl, E.; El Mankibi, M.; Stritih, U. New qualitative approach based on data analysis of European building stock and retrofit market. Sustain. Cities Soc. 2020, 63, 102452. [Google Scholar] [CrossRef]
  4. Vereecken, E.; Roels, S. A comparison of the hygric performance of interior insulation systems: A hot box–cold box experiment. Energy Build. 2014, 80, 37–44. [Google Scholar] [CrossRef]
  5. De Mets, T.; Tilmans, A.; Loncour, X. Hygrothermal assessment of internal insulation systems of brick walls through numerical simulation and full-scale laboratory testing. Energy Procedia 2017, 132, 753–758. [Google Scholar] [CrossRef]
  6. Cornet: In2eurobuild–Consistent European Guidelines for Internal Insulation of Building Stock and HeritaGE. Available online: https://wufi.de/de/wp-content/uploads/sites/9/In2EuroBuild_Guideline-II_Internal-Insulation.pdf (accessed on 6 September 2023).
  7. Bottino-Leone, D.; Larcher, M.; Herrera-Avellanosa, D.; Haas, F.; Troi, A. Evaluation of natural-based internal insulation systems in historic buildings through a holistic approach. Energy 2019, 181, 521–531. [Google Scholar] [CrossRef]
  8. Johansson, P.; Geving, S.; Hagentoft, C.E.; Jelle, B.P.; Rognvik, E.; Kalagasidis, A.S.; Time, B. Interior insulation retrofit of a historical brick wall using vacuum insulation panels: Hygrothermal numerical simulations and laboratory investigations. Build. Environ. 2014, 79, 31–45. [Google Scholar] [CrossRef]
  9. Straube, J.; Schumacher, C. Interior Insulation Retrofits of Load-Bearing Masonry Walls in Cold Climates. J. Green Build. 2007, 2, 42–50. [Google Scholar] [CrossRef]
  10. Morelli, M.; Svendsen, S. Investigation of interior post-insulated masonry walls with wooden beam ends. J. Build. Phys. 2013, 36, 265–293. [Google Scholar] [CrossRef]
  11. Nielsen, A.; Møller, E.B.; Rasmussen, T.V.; Jan de Place, E. Use of sensitivity analysis to evaluate hygrothermal conditions in solid brick walls with interior insulation. In Proceedings of the 5th International Building Physics Conference (IBPC), Kyoto, Japan, 28–31 May 2012; pp. 377–384. [Google Scholar]
  12. Morelli, M.; Scheffler, G.; Nielsen, T.; Svendsen, S. Internal Insulation of Masonry Walls with Wooden Floor Beams in Northern Humid Climate. In Proceedings of the Thermal Performance of the Exterior Envelopes of Whole Buildings XI, Clearwater Beach, FL, USA, 5 December 2010. [Google Scholar]
  13. Zhao, J.; Grunewald, J.; Ruisinger, U.; Feng, S. Evaluation of capillary-active mineral insulation systems for interior retrofit solution. Build. Environ. 2017, 115, 215–227. [Google Scholar] [CrossRef]
  14. Freudenberg, P.; Ruisinger, U.; Stöcker, E.; Roles, S.; Feldt Jensen, N.; Odgaard, T.; Otiv, P.; Capener, C.-M.; Lång, L.; Peuhkuri, R.; et al. Robust Internal Thermal Insulation of Historic Buildings Title of the Deliverable: 637268 Robust Internal Thermal Insulation of Historic Buildings RIBuild D3.1 Closed Technology Loop of Laboratory Experiments and Simulation Models in the Field of Internal Insulation Testing Contractual Date of Delivery to the CEC: 31.12.2017 Actual Date of Delivery to the CEC: Organisation Name of Lead Contractor for this Deliverable: TUD Work Package Contributing to the Deliverable: WP3 Nature: R Version: 2.0.; European Commission: Brussels, Belgium, 2018. [Google Scholar]
  15. Vereecken, E.; Roels, S. Capillary active interior insulation: Do the advantages really offset potential disadvantages? Mater. Struct. 2015, 48, 3009–3021. [Google Scholar] [CrossRef]
  16. Vereecken, E.; Roels, S. Wooden beam ends in combination with interior insulation: The importance of an airtight sealing. Energy Procedia 2017, 132, 664–669. [Google Scholar] [CrossRef]
  17. Hansen, T.K.; Bjarløv, S.P.; Peuhkuri, R.H.; Harrestrup, M. Long term in situ measurements of hygrothermal conditions at critical points in four cases of internally insulated historic solid masonry walls. Energy Build. 2018, 172, 235–248. [Google Scholar] [CrossRef]
  18. Vereecken, E.; Van Gelder, L.; Janssen, H.; Roels, S. Interior insulation for wall retrofitting—A probabilistic analysis of energy savings and hygrothermal risks. Energy Build. 2015, 89, 231–244. [Google Scholar] [CrossRef]
  19. Blumberga, A.; Freimanis, R.; Biseniece, E.; Kamenders, A. Hygrothermal Performance Evaluation of Internally Insulated Historic Stone Building in a Cold Climate. Energies 2023, 16, 866. [Google Scholar] [CrossRef]
  20. Biseniece, E.; Freimanis, R.; Purvins, R.; Gravelsins, A.; Pumpurs, A.; Blumberga, A. Study of Hygrothermal Processes in External Walls with Internal Insulation. Environ. Clim. Technol. 2018, 22, 22–41. [Google Scholar] [CrossRef]
  21. Biseniece, E.; Žogla, G.; Kamenders, A.; Purviņš, R.; Kašs, K.; Vanaga, R.; Blumberga, A. Thermal performance of internally insulated historic brick building in cold climate: A long term case study. Energy Build. 2017, 152, 577–586. [Google Scholar] [CrossRef]
  22. Klõšeiko, P.; Arumägi, E.; Kalamees, T. Hygrothermal performance of internally insulated brick wall in cold climate: A case study in a historical school building. J. Build. Phys. 2015, 38, 444–464. [Google Scholar] [CrossRef]
  23. Grunewald, J.; Ruisinger, U.; Häupl, P. The Rijksmuseum Amsterdam—Hygrothermal analysis and dimensioning of thermal insulation. In Proceedings of the 3rd International Conference in Building Physics–Research in Building Physics and Building Engineering, Montreal, QC, Canada, 27–31 August 2006; pp. 345–352. [Google Scholar]
  24. Scheffler, G.; Grunewald, J. Material development and optimisation supported by numerical simulation for a capillary-active inside insulation material. In Research in Building Physics; CRC Press: Boca Raton, FL, USA, 2003; pp. 77–85. [Google Scholar]
  25. Vereecken, E.; Roels, S. Capillary Active Interior Insulation Systems for Wall Retrofitting: A More Nuanced Story. Int. J. Archit. Herit. 2016, 10, 558–569. [Google Scholar] [CrossRef]
  26. Odgaard, T.; Bjarløv, S.P.; Rode, C. Influence of hydrophobation and deliberate thermal bridge on hygrothermal conditions of internally insulated historic solid masonry walls with built-in wood. Energy Build. 2018, 173, 530–546. [Google Scholar] [CrossRef]
  27. Scheffler, G.A. Hygric performance of internal insulation with light-weight autoclaved aerated concrete. In Proceedings of the 5th International Conference on Autoclaved Aerated Concrete, Bydgoszcz, Poland, 14–17 September 2011. [Google Scholar]
  28. Bourbia, S.; Kazeoui, H.; Belarbi, R. A review on recent research on bio-based building materials and their applications. Mater. Renew. Sustain. Energy 2023, 12, 117–139. [Google Scholar] [CrossRef]
  29. Fino, R.; Tadeu, A.; Simões, N. Influence of a period of wet weather on the heat transfer across a wall covered with uncoated medium density expanded cork. Energy Build. 2018, 165, 118–131. [Google Scholar] [CrossRef]
  30. Romano, A.; Bras, A.; Grammatikos, S.; Shaw, A.; Riley, M. Dynamic behaviour of bio-based and recycled materials for indoor environmental comfort. Constr. Build. Mater. 2019, 211, 730–743. [Google Scholar] [CrossRef]
  31. Kreiger, B.K.; Srubar, W.V. Moisture buffering in buildings: A review of experimental and numerical methods. Energy Build. 2019, 202, 109394. [Google Scholar] [CrossRef]
  32. Klõšeiko, P.; Kalamees, T. Hygrothermal performance of a brick wall with interior insulation in cold climate: Vapour open versus vapour tight approach. J. Build. Phys. 2022, 46, 3–35. [Google Scholar] [CrossRef]
  33. Antolinc, D.; Černe, K.; Jagličić, Z. Risk of Using Capillary Active Interior Insulation in a Cold Climate. Energies 2021, 14, 6890. [Google Scholar] [CrossRef]
  34. Jensen, N.F.; Odgaard, T.R.; Bjarløv, S.P.; Andersen, B.; Rode, C.; Møller, E.B. Hygrothermal assessment of diffusion open insulation systems for interior retrofitting of solid masonry walls. Build. Environ. 2020, 182, 107011. [Google Scholar] [CrossRef]
  35. RIBuild_D1.2_1.0.pdf. Available online: https://static1.squarespace.com/static/5e8c2889b5462512e400d1e2/t/5e9db814e1ea8b0e935c76d2/1587394584525/RIBuild_D1.2_1.0.pdf (accessed on 20 September 2020).
  36. Latvijas Vides, Ģeoloģijas un Meteoroloģijas Centrs. Available online: https://videscentrs.lv (accessed on 6 September 2023).
Figure 1. Testing setup for testing insulation systems in controlled environment.
Buildings 13 02511 g001
Figure 2. Test wall constructed for the laboratory experiment: (a) test wall from the hot-box side; (b) test wall from the cold box side; (c) test wall before insertion between hot-box and cold-box.
Buildings 13 02511 g002
Figure 3. Two-dimensional model of the masonry sample (all measurements in mm).
Buildings 13 02511 g003
Figure 4. Daily fluctuations in relative humidity and temperature.
Buildings 13 02511 g004
Figure 5. Test wall brick sample in laboratory (a) and in DELPHIN model (b). The data for further analysis were taken from the point circled in blue; (red-brick; yellow-insulation; green-plasterboard; blue-mortar; red dots-data points).
Buildings 13 02511 g005
Figure 6. Measured cold- and hot-box temperature and relative humidity during the first test round.
Buildings 13 02511 g006
Figure 7. Measured temperature between insulation material and masonry for tested insulation systems during the first test round.
Buildings 13 02511 g007
Figure 8. Measured relative humidity between insulation material and masonry for tested insulation systems during the first test round.
Buildings 13 02511 g008
Figure 9. Change in moisture value relative to initial moisture at a depth (from the external surface of the masonry) of (a) 2 cm and (b) 20 cm.
Buildings 13 02511 g009
Figure 10. Measured cold- and hot-box temperature and relative humidity during the second test round.
Buildings 13 02511 g010
Figure 11. Measured temperature between insulation material and masonry for tested insulation systems during the second test round.
Buildings 13 02511 g011
Figure 12. Measured relative humidity between insulation material and masonry for tested insulation systems during the second test round.
Buildings 13 02511 g012
Figure 13. Change in moisture value relative to start moisture at a depth (from the external surface of the masonry) of (a) 2 cm and (b) 20 cm for the second test round.
Buildings 13 02511 g013
Figure 14. Measured temperature and relative humidity in hot- and cold-boxes during steady state conditions.
Buildings 13 02511 g014
Figure 15. Measured (M) and simulated (S) behavior of temperature between masonry and vapor-open insulation systems in the steady state cycle (zoomed-in hours 245 to 305).
Buildings 13 02511 g015
Figure 16. Measured (M) and simulated (S) behavior of relative humidity between masonry and vapor-open insulation systems.
Buildings 13 02511 g016
Figure 17. Measured (M) and simulated (S) behavior of relative humidity between masonry and vapor-tight insulation systems.
Buildings 13 02511 g017
Figure 18. Behavior of vapor-open when hot box relative humidity (a) decreases (time 40–82 in Figure 17) and (b) increases (time 145–177 in Figure 17).
Buildings 13 02511 g018
Figure 19. Temperature under insulation in steady state conditions for the second test round.
Buildings 13 02511 g019
Figure 20. Relative humidity under insulation in steady-state conditions for the second test round.
Buildings 13 02511 g020
Figure 21. Absolute humidity under insulation materials at the start and end of steady state cycle.
Buildings 13 02511 g021
Figure 22. The temperature under insulation during dynamic cycle in the second test round.
Buildings 13 02511 g022
Figure 23. Relative humidity under insulation during dynamic cycle in the second test round.
Buildings 13 02511 g023
Figure 24. Temperature under insultation during wind-driven rain in the first test round.
Buildings 13 02511 g024
Figure 25. Relative humidity under insultation during wind-driven rain in the first test round.
Buildings 13 02511 g025
Figure 26. Temperature under insultation during wind-driven rain in the second test round.
Buildings 13 02511 g026
Figure 27. Relative humidity under insultation during wind-driven rain in the second test round.
Buildings 13 02511 g027
Figure 28. Temperature below insulation during the drying cycle.
Buildings 13 02511 g028
Figure 29. Relative humidity under insulation.
Buildings 13 02511 g029
Disclaimer/Publisher’s Note: The statements, opinions and data contained in all publications are solely those of the individual author(s) and contributor(s) and not of MDPI and/or the editor(s). MDPI and/or the editor(s) disclaim responsibility for any injury to people or property resulting from any ideas, methods, instructions or products referred to in the content.

