Abstract
In the architecture, engineering and construction industry, site management during construction is a key phase. Scheduling activities and monitoring their progress allow any deviations from the schedule to be identified so that timely action can be taken. Until now, the monitoring phase has mainly been characterised by inspections in which the construction site manager manually collects data and produces a summary report. This proves to be a time-consuming process and is prone to errors. The authors propose an innovative construction progress monitoring method that combines BIM-based construction scheduling (4D BIM) with periodic geometric surveying using an indoor mobile mapping system (iMMS). Ten surveys were carried out on a real case study, producing point clouds to be compared with the 4D BIM, thereby comparing the as-built with the as-planned. The comparison was carried out using Sitemotion exploiting a custom class, the work breakdown structure (WBS), added to the BIM to associate each element with its scheduled construction date. The results show how the proposed method can effectively support the evaluation of construction progress, allowing the monitoring to be performed digitally and linked to the BIM. The paper details the proposed methodology, highlighting the problems encountered and suggesting adjustments for future implementation.
1. Introduction
Management of the construction process plays a key role in ensuring that the project is delivered to the client on time, that the quality of the work is maintained and that the profit margin is kept stable (or even increased). In recent years, research efforts have focused on the automation of construction progress monitoring, which is one of the most difficult and time-consuming tasks in construction project management [1,2]. The purpose of monitoring is twofold: to evaluate the construction management of a project in the short term and to improve overall construction management in the long term. This includes site inspections, progress measurements and comparison with the expected performance. [1,3]. By comparing the planned construction progression with the actual progression, stakeholders can identify variances and delays, allowing them to take the necessary action promptly [4]. Moreover, the quality of the progress data (e.g., percentage of completion, actual start date, actual end date, and measurement date) highly depends on the surveyor’s experience and how measurements are carried out [5]. Data collected during inspections are usually manually organised and sorted and then compared with traditional and paper-based documentation. In addition to being time-consuming, this activity is also tedious [6] and, above all, disproportionately expensive [7]. In fact, it has been found that a significant proportion of a construction project manager’s time is spent measuring, recording and subsequently analysing the progress of construction works [8]. As a result of these factors, progress reports are provided too infrequently to allow for timely follow-up and effective communication between construction stakeholders. In addition, there is a lack of an effective visual interface to digitally display for a given date: built elements, elements planned but not built, and elements built but not planned.
Prompt and accurate monitoring of project performance can provide immediate insight into construction problems, and numerous attempts have been made in recent decades to automate this process [9,10]. Laser scanning, spherical imaging, augmented reality, barcode solutions [11] and sensing technologies are just a few examples of the proposed tracking, measurement and management techniques. Moreover, BIM-based progress monitoring has been investigated to facilitate the automated comparison of the actual state of construction with the planned state for the early detection of deviations in the construction process [12]. A first distinction between existing approaches concerns the type of construction: whether it is prefabricated (i.e., off-site construction) or on-site. In the case of off-site construction, it is relatively easy to assess construction progress, as construction sites are tidy and free of loose materials, and installed construction elements can be easily identified. On the other hand, it is more difficult to monitor multi-stage or mixed structures (e.g., load-bearing masonry, on-site reinforced concrete). Today, modern digital technologies help overcome (partially or completely) the complexity of construction progress monitoring. Several technologies have been tested in this field. They can be distinguished according to the type of sensors used, point cloud generation or image generation. Increasingly, however, these technologies are being used together to obtain accurate and detailed data.
Research Objectives
In this study, an innovative method of monitoring construction progress is experimented: an indoor Mobile Mapping System (iMMS) is used to monitor the construction progress of a building by collecting 3D data at different stages of the construction process. The 3D point clouds generated by the iMMS device at the different stages are then compared with the 4D BIM model (i.e., the 3D design model integrated with information on the construction schedule). The comparison is therefore made between the as-built and the as-planned, highlighting the agreement between the two or the differences that may be due to delays in the construction process. A real case study related to the construction of a new office building (i.e., a corporate canteen) was selected for the study and followed through the entire construction phase from the start of work to the final handover.
The proposed approach to construction progress monitoring is made possible using a iMMS device as the survey technique of choice. In fact, iMMS are measuring instruments that can quickly and in motion derive the geometric point cloud of an environment both outdoors and indoors, and on flat or uneven terrain. A key difference between the common and more widely used outdoor mobile mapping systems and an iMMS is that the outdoor systems estimate the position of the mapping device by relying on Global Navigation Satellite System (GNSS) receivers, working in relative positioning, using a Master GNSS Station, a positioning service in Real Time Kinematic (RTK) or an innovative RTX approach [13]. The iMMS, on the other hand, use Simultaneous Localization and Mapping (SLAM) algorithms to estimate the trajectory taken by the instrument at the time of the measurement. The SLAM method works by acquiring rich 3D geometry and then tracking the position of the sensor relative to its (fixed) context. If significant unambiguous geometry can be captured, the SLAM method allows accurate positioning in GNSS-denied environments, enabling rapid and dynamic indoor surveys [14].
The paper is organised as follows: Section 2 discusses the related literature; Section 3 introduces the technology used, presents the building taken as a case study and describes the methodology applied; Section 4 makes explicit the results and provides a discussion of the results obtained; and finally, Section 5 draws the final conclusions and highlights limitations of the research and the future developments.
2. Related Literature
This section aims to expand on the research background introduced in Section 1 regarding the automation of construction progress monitoring. In particular, the paper introduces the data acquisition approach and illustrates the various methodologies applied for data analysis and evaluation of construction progress. Scientific sources such as Scopus, ScienceDirect and Google Scholar were used for a narrative review of the literature. On ScienceDirect and Google Scholar, the keyword searched was ‘Construction Progress Monitoring’, while on Scopus, a combination of ‘Construction Progress Monitoring’ and the technology used was searched (i.e., ‘Construction Progress Monitoring’ and ‘Laser Scanner’).
The construction industry is increasingly in need of automated tools to measure construction progress, particularly approaches using remote sensing technology, as the methods typically used to measure progress are laborious and therefore time-consuming [15]. Adherence to the construction schedule of a building or infrastructure is closely linked to careful monitoring of the construction site [16]. The choice of practical data collection tools for monitoring construction progress is extremely valuable because it ensures data reliability by reducing errors.
For some years, professionals and researchers have been developing various technologies for collecting site data and assessing the progress of work on construction sites. These technologies range from simple barcode scanners to sophisticated imaging tools. Barcode scanning was widely used in the 2000s, with positive results for prefabricated structures [17]. Conversely, for on-site construction, although it gave positive results due to the ease of capturing information on-site, it proved inefficient due to the time-consuming installation and maintenance of the tags [18]. The construction site is a constantly evolving and changing place, and this technology is considered too static to be sustainable.
Other studies have focused on the use of imaging technology and computer vision to extrapolate useful and necessary information for construction progress. In this approach, images are used to detect and compare objects in order to assess progress. The images are taken by Unmanned Aerial Vehicles (UAVs), such as simple drones [19], sophisticated cameras or satellites. The images are then processed manually or automatically. A widely used technology for change detection is the generation of 3D point clouds. In recent years, laser scanning and photogrammetry have become the most common methods for collecting construction data [20,21]. El-Omari and Moselhi [22] demonstrated that these technologies can improve the accuracy and time of data collection on construction sites.
Point cloud generation is possible by using static laser scanners, mobile laser scanners and photogrammetry. The operator programs and performs the survey operations with the aim of capturing the complete geometry of the artefact with maximum efficiency:
- In the first case, it means evaluating the best positions to perform the scans. The Terrestrial Laser Scanner (TLS) approach provides a local accuracy of 1 mm, but typically requires time-consuming field acquisitions and post-processing compared to the mobile alternative.
- In the second case, the mobile mapping approach requires the establishment of an optimal acquisition path. The use of mobile survey technologies results in improved flexibility and speed of data acquisition compared to the static equivalent [23,24]. In fact, iMMS allow for faster acquisition in large indoor areas, especially in construction sites, which are characterised by a rapidly and continuously changing environment. LiDAR-based iMMS have been developed and made efficient with the development of SLAM methods [25,26].
- In the third case, the photogrammetric approach requires an experienced operator capable of performing an efficient image network. In recent years, the use of photogrammetry has been increasing thanks to the diffusion of effective structure of motion commercial software that allows the use of consumer grade sensors and platforms of all types: by using UAV [27] or terrestrial images [28].
When it comes to static laser scanner-enabled applications, the most common combination is the use of LiDAR and RGB cameras. Together, they are surveying tools that can meet industrial requirements [29] and provide an accurate representation of buildings [30]. Yang [31] carried out a monotonic load measurement of an arch structure based on terrestrial laser scanning technology. Soni [32] describes the use of TLS to monitor a series of masonry arches during a major railway station refurbishment. Seo [33] used terrestrial laser scanners to evaluate the long-term behaviour of a concrete support structure by performing eight laser scans in eight different years.
Subsequently, the survey results, i.e., the point clouds, obtained using the technologies described, have to be post-processed with different approaches to assess changes and can be used to perform various analyses. Wei [34] applied a segmentation approach to stereoscopic images to automatically assess the progress of construction work by placing the camera on a robot that moves around the construction site to collect the necessary information. Kavaliauska [35] proposes to survey the construction site using static and dynamic laser scanners to automatically assess the completeness of the construction by comparing the 3D survey with the BIM model. Furthermore, Alizadehsalehi [36] proposes a methodology that integrates BIM with virtual reality, augmented reality, mixed reality and extended reality [37].
3. Materials and Methods
As described in the previous sections, many technologies can be used to collect progress data on construction sites. This section describes the technology adopted in this research, gives a brief description of the case study on which the field monitoring tests were carried out, and details the methodology used in the research.
3.1. Materials
The Heron MS Twin Color iMMS (Figure 1), manufactured by Gexcel Ltd. [38], was used to conduct the study. The instrument consists of a backpack containing the acquisition and navigation sensors: two multi-beam LiDAR, a panoramic camera and the IMU mounted on an acquisition head, and a touchscreen control unit, which can be a rugged tablet or a personal digital assistant (PDA). The processing unit is housed in a backpack or directly in a tablet, depending on the version [39].
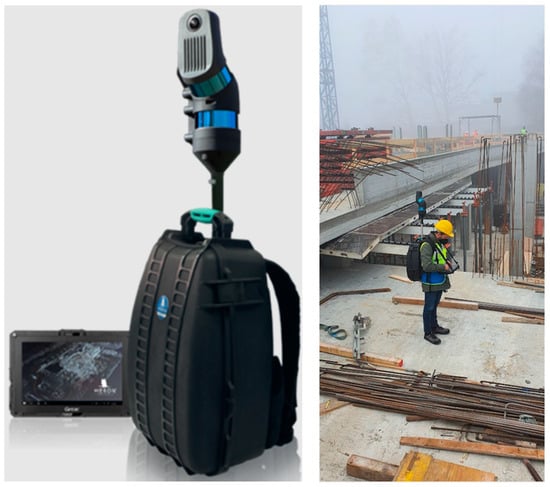
Figure 1.
The wearable mobile mapping device (left) and its use during the monitoring phase at the construction site (right).
The capture head consists of two LiDAR Velodyne Puck Lite sensors, one rotating horizontally along the vertical axis and the other tilted by 45°. The Puck Lite (formerly known as VPL16) is a sensor with a 360° horizontal Field Of View (FOV) and a 30° vertical FOV each. The sensor can acquire 600,000 points per second with a declared accuracy of ±3 cm and a range of 100 metres. The actual FOV of the instrument is greater when worn as a backpack by a walking operator than when mounted on a vehicle or robot. The oscillation introduced by human walking increases the actual FOV of the instrument and the amount of geometry captured. If necessary, the capture head can be removed from the backpack and installed on a pole to acquire the geometry of the manholes or areas that are inaccessible to the operator. To support the SLAM algorithm, a low-cost IMU sensor is installed in the base of the capture head. Colour information is captured using an RGB camera. During the mapping operations, a video of spherical images is recorded at a 15 Hz resolution and a high-resolution picture at 5.7 K can be acquired on demand. The last mapping sessions of the investigation were carried out with a new version of the Heron backpack employing the new MG1 camera developed by Gexcel, the manufacturer of the mapping backpack. The Gexcel MG1 camera is capable of capturing 360° panoramic images at 8 K resolution on demand, using high-quality lenses and an improved stitching algorithm. Figure 2 shows the 5.7 K camera capture, and Figure 3 shows the 8 K one.
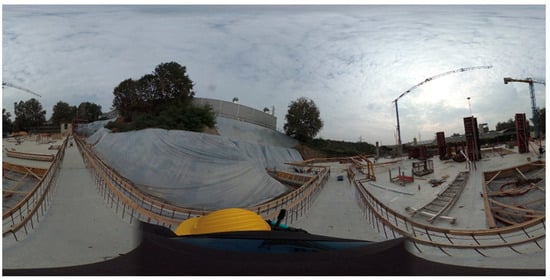
Figure 2.
The image taken with a 5.7 K panoramic camera.
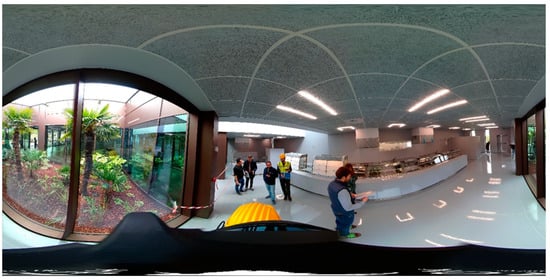
Figure 3.
The image taken with an 8 K panoramic camera.
The raw data acquired by the Heron MS Twin Color consists of LiDAR measurements, IMU measurements and panoramic images. The system comes with desktop software (i.e., Heron Desktop version 2.4, distributed by Gexcel srl., Brescia, Italy) for post-processing the data and producing a 3D point cloud as a result. The software also includes a navigation function that allows the user to reconstruct the trajectory followed by the instrument during acquisition and provides easy access to the acquired images, including both the continuous video stream and on-demand panoramic images displayed as a virtual tour of bubble views.
The mobile mapping device and the Heron Desktop processing software can also use point cloud data acquired by other instruments to support the acquisition or processing phase. This is done by loading the external point cloud into the memory of the system during real-time acquisition or into the software during post-processing, where it is used as reference data to constrain the iMMS trajectory solution. A BIM exported in the IFC (Industry Foundation Classes) neutral data schema can also be processed to produce a 3D point cloud that can be used as reference data.
3.2. Case Study
The case study construction site is a canteen (i.e., an office building) characterised by a depression of around 6 m, ideal for the construction of a single-story semi-basement building. In fact, the north and west elevations are built at ground level, the south elevation has a glazed curtain wall and the east elevation has a curtain wall with some openings. The interior contains a large canteen, a private dining area, a bar, toilets, a technical room (double height) and the kitchen with adjoining changing rooms (Figure 4).
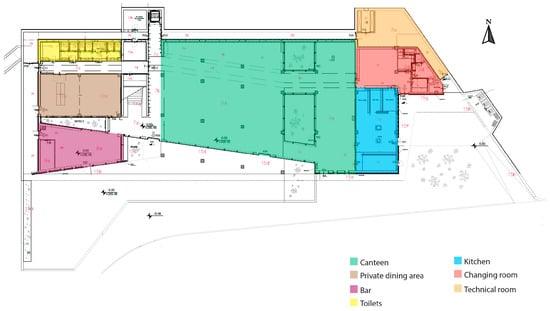
Figure 4.
2D design plan of the canteen.
It is an on-site construction. Specifically, the supporting structure consists of a foundation slab, columns and beams. To the north and west, two parallel reinforced concrete walls have been designed, the first to support the ground and the second to define the planting area. Construction of the building started in June 2021, and the building was scheduled to be delivered in July 2023.
3.3. Proposed Work Progress Monitoring Approach
This section explains the methodology adopted by the authors to acquire data during the site inspections and to assess the construction work progress by comparing it with the construction schedule. The phases of the proposed methodology can be distinguished into the following four points that are further detailed in the sub-chapters:
- Generation of a 4D Building Information Model (4D BIM): In this phase, the as-designed building information model is generated and integrated with the information about the construction schedule.
- Periodic surveying using an indoor mobile mapping system: In this phase, as-build data are collected periodically as point clouds and panoramic images data. These are acquired during the scheduled site inspections using the Heron MS Twin Color iMMS, distributed by Gexcel Ltd.
- Data processing for point cloud generation: In this phase, the iMMS data are processed using the SLAM method implemented in the Heron Desktop software and the resulting point clouds are cleaned and filtered to prepare them for the next phase.
- Comparison of the 4D BIM and the point clouds for work progress monitoring: In this phase, the as-planned and the as-built models are compared to analyse the progress of the construction.
3.3.1. Generation of a 4D BIM
Scheduling and planning are critical to safe, efficient and quality construction. Using a 4D BIM, the computer becomes a practice field where sequencing, safety, special relationships and more can be visualised, analysed and discussed continuously before and during the life of the project. The goal of this phase is to model the BIM and to enrich it by associating each element with its construction schedule.
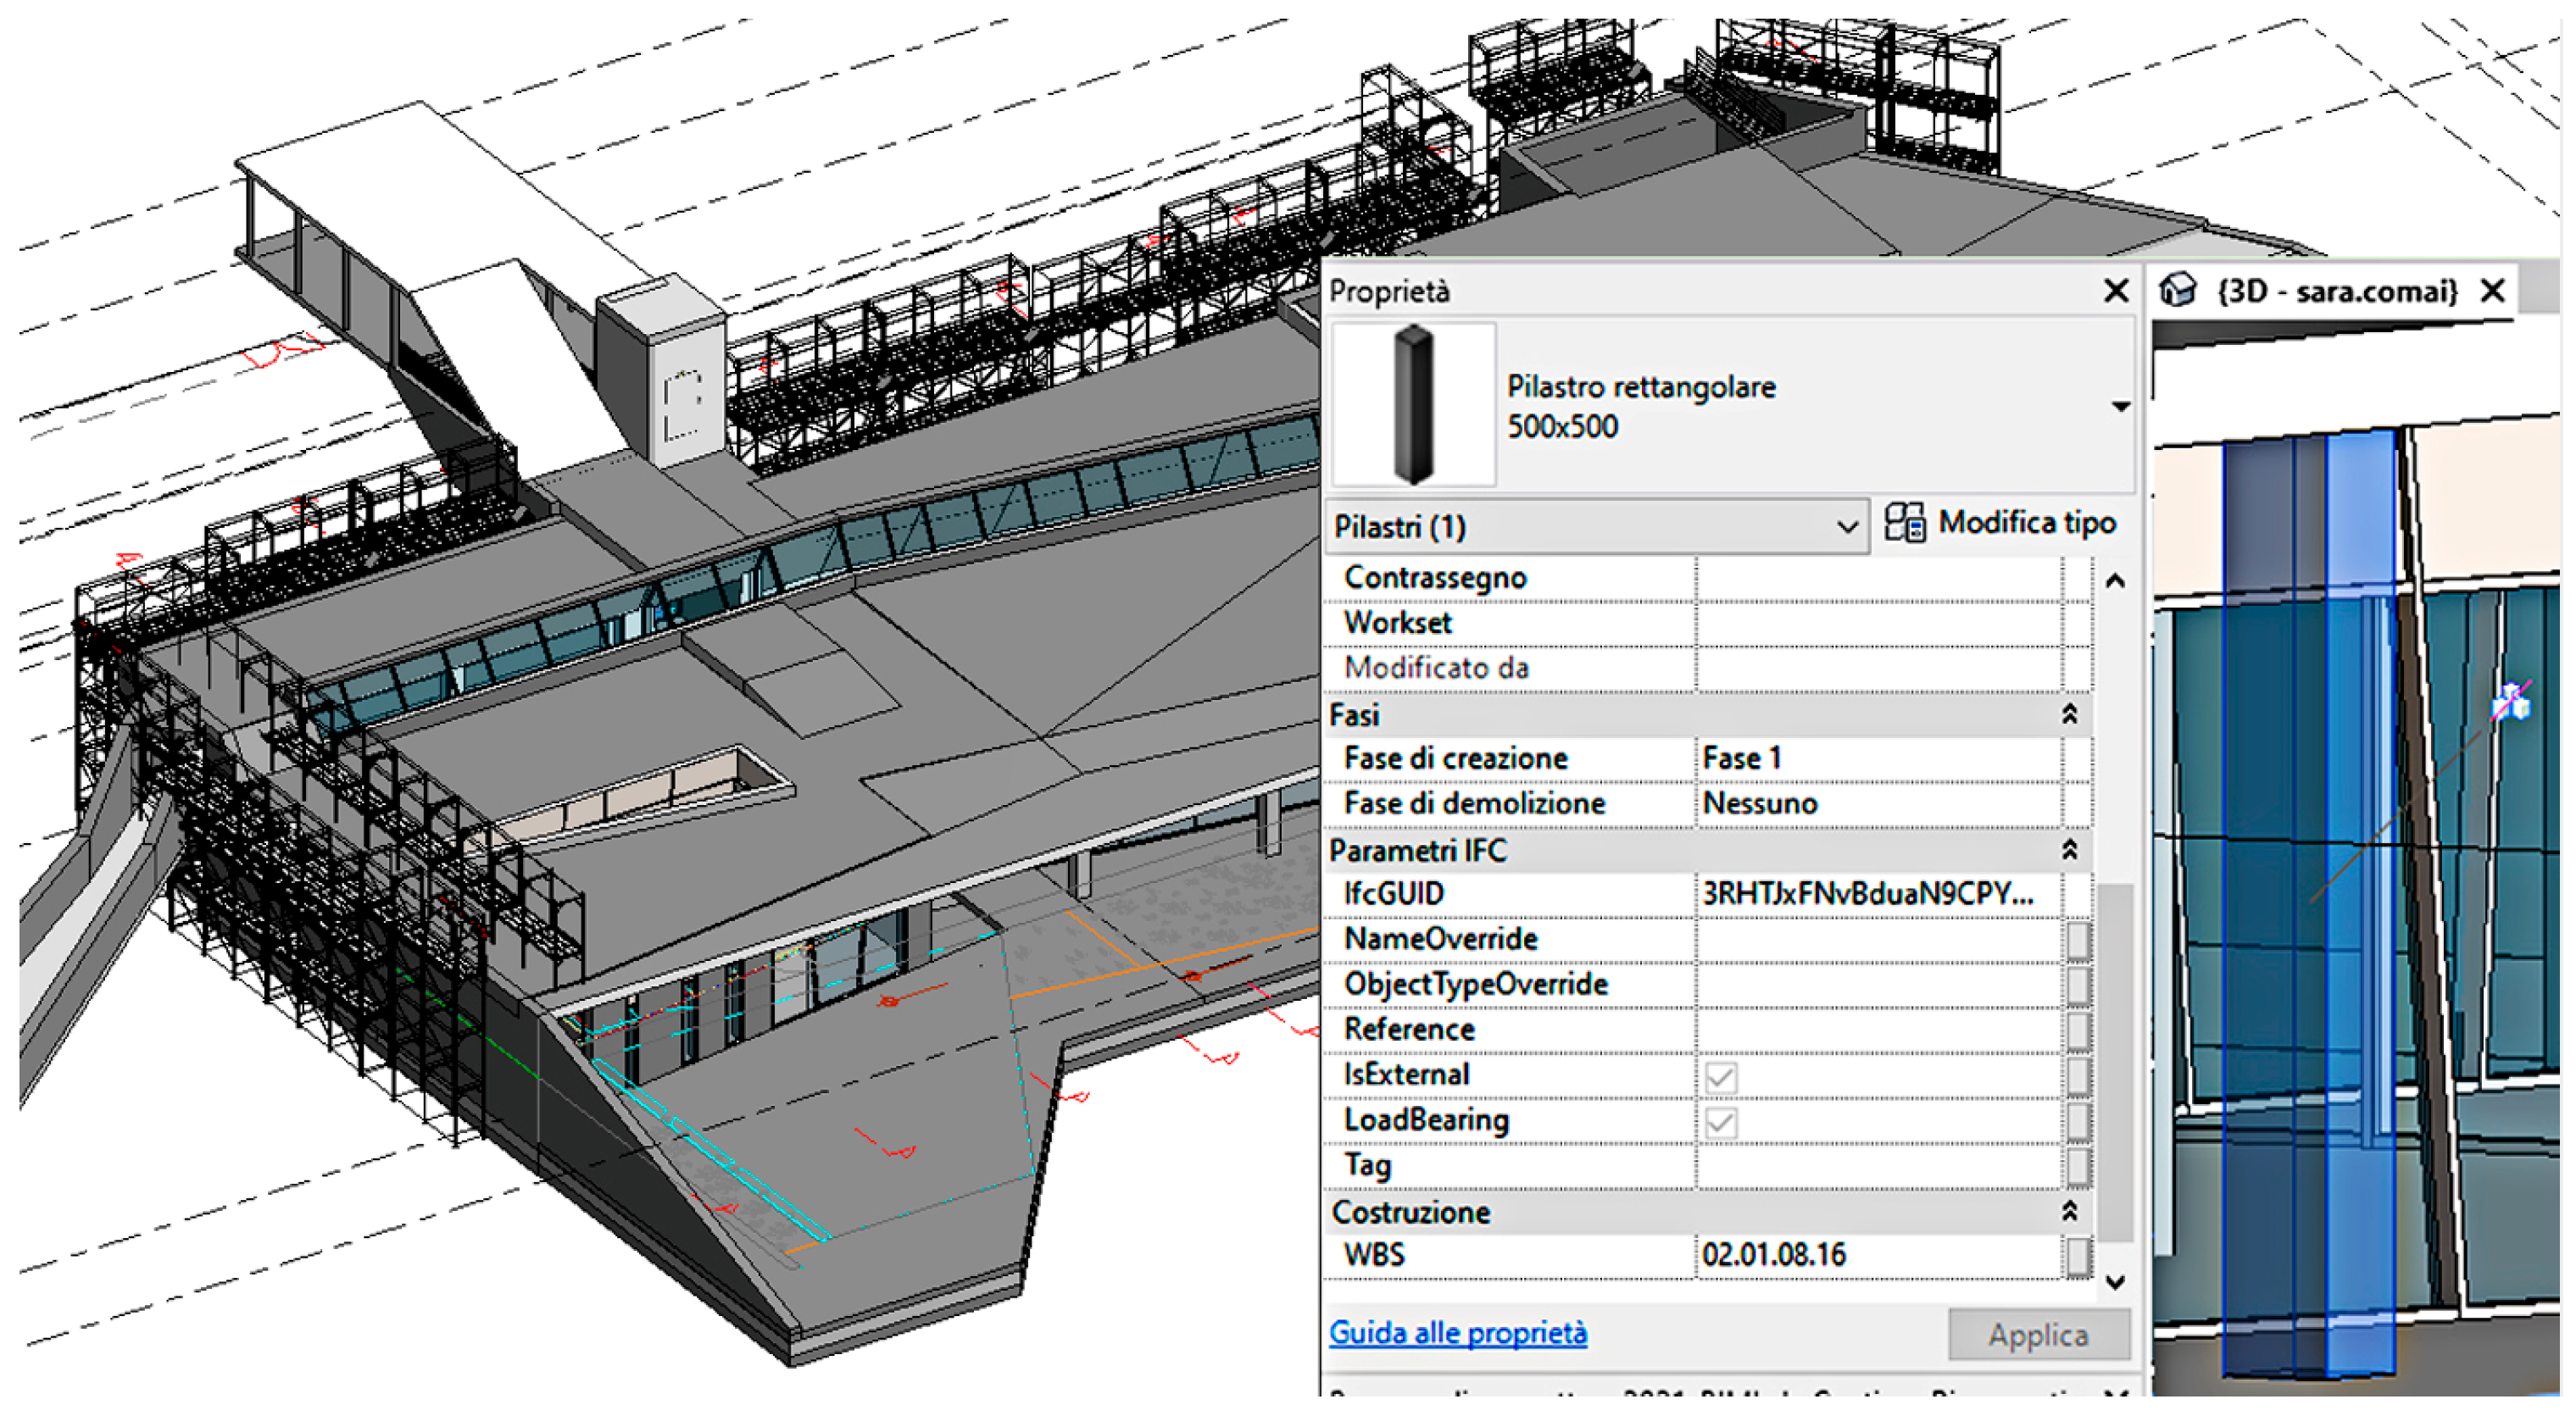
The authors propose to create a new property called “WBS’’ to be added to each modelled building element (Figure 5). The Work Breakdown Structure (WBS) property consists of an alphanumeric code that is manually added. Subsequently, the model is exported in the compatibility IFC format and imported into the Synchro 4D Pro (version 6.5.1.5) construction management software, from Bentley. The construction schedule is also imported into Synchro 4D Pro and the WBS code is manually added to each task in the construction schedule. Using the auto-matching tool, it is possible to associate each building element (on Synchro 4D Pro called “resource”) with the planned construction activity. Synchro 4D Pro’s auto-matching function allows resources to be automatically assigned to activities using custom filters and search rules. The matching proposed in this search is based on the property added to both the information model and the schedule: the WBS code. Using the automatic matching function greatly simplifies the task of linking resources to tasks.
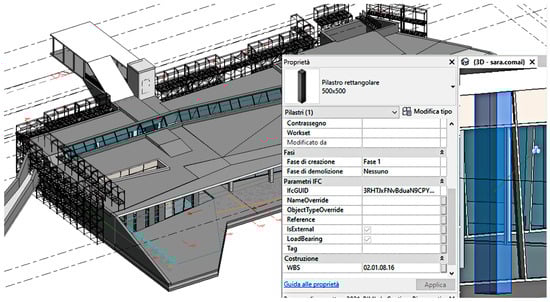
Figure 5.
Three-dimensional modelling of the case study using Autodesk’s Revit 2022 software (version 22.0.2.392) and entry of the WBS alphanumeric property.
3.3.2. Periodic Survey Using an Indoor Mobile Mapping System
For the periodic survey activities, the authors propose the use of the iMMS Heron MS Twin Color, capable of obtaining the 3D point clouds describing the construction site at the different progress stages. The survey operations are carried out by a single operator and consist of walking through the environment to be surveyed at an average walking speed. The registration of the iMMS data is based on the BIM model; no additional measurements need to be carried out, i.e., no targets are to be placed and measured to reference the point clouds survey to a specific coordinate system. The only set-up required before the acquisition is to approximately plan the survey trajectory to be followed and to briefly stop work during the acquisition. For this reason, the iMMS approach can acquire the whole construction site rapidly without any significant interference in work.
3.3.3. Point Cloud Generation and Processing
The processing workflow follows three main steps: odometer, local maps and global optimization. The odometer step consists of calculating an initial estimate of the trajectory, followed by the instrument during the survey. The initial trajectory estimate is obtained using a geometric SLAM algorithm, and this result is simultaneously compared with the IMU estimate to provide a co-evaluation of both: convergence between the two methods is indicated by green colouring. The second step, local maps, is a way of segmenting the point cloud, previously represented as a continuous acquisition, into data chunks generated by dividing the acquisition trajectory into chunks of defined length. The local map representation creates rigid groups of points that can be aligned during the global optimisation phase. The aim of this final operation is to refine the estimated trajectory, allowing some flexibility in the alignment of individual data chunks within it to compensate for sensor drift. For surveys that consisted of multiple acquisitions, manual connections between local maps were used to connect the roof, the exterior and the ground floor together, and then the entire network of connections between local maps was optimised, a process that reduces the error between local maps through iterations that find the best fit between point clouds. Figure 6 shows views of the 3D network of connections between local maps during the global optimisation process. Each coloured dot represents a local map, i.e., a point cloud, a part of the acquisition that can be freely adjusted in position during the optimisation process (the dot is placed at the centre of mass of the local map). Each blue line represents an iterative best-fit constraint between two overlapping local maps. The entire global optimisation results in an optimised estimate of the survey trajectories. In the case of low overlap and point matching, no connections between local maps are added.
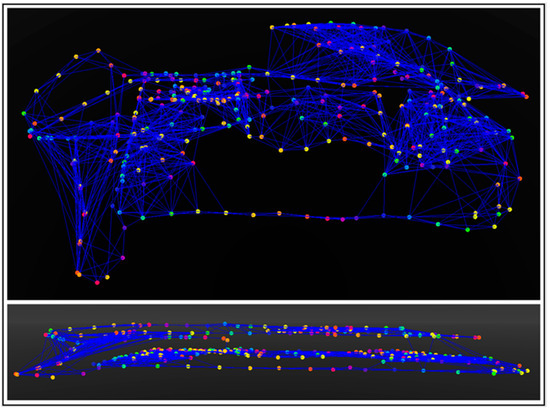
Figure 6.
Network of connections between local maps during a global optimisation process. Plan view (top) and elevation view (bottom). Each local map is represented by a coloured dot placed in its centre of gravity, and each ICP connection between local maps are represented by a blue segment. The colour of the dots is based on recursive indexes.
3.3.4. Comparison of BIM and Point Clouds for Monitoring Construction Progress
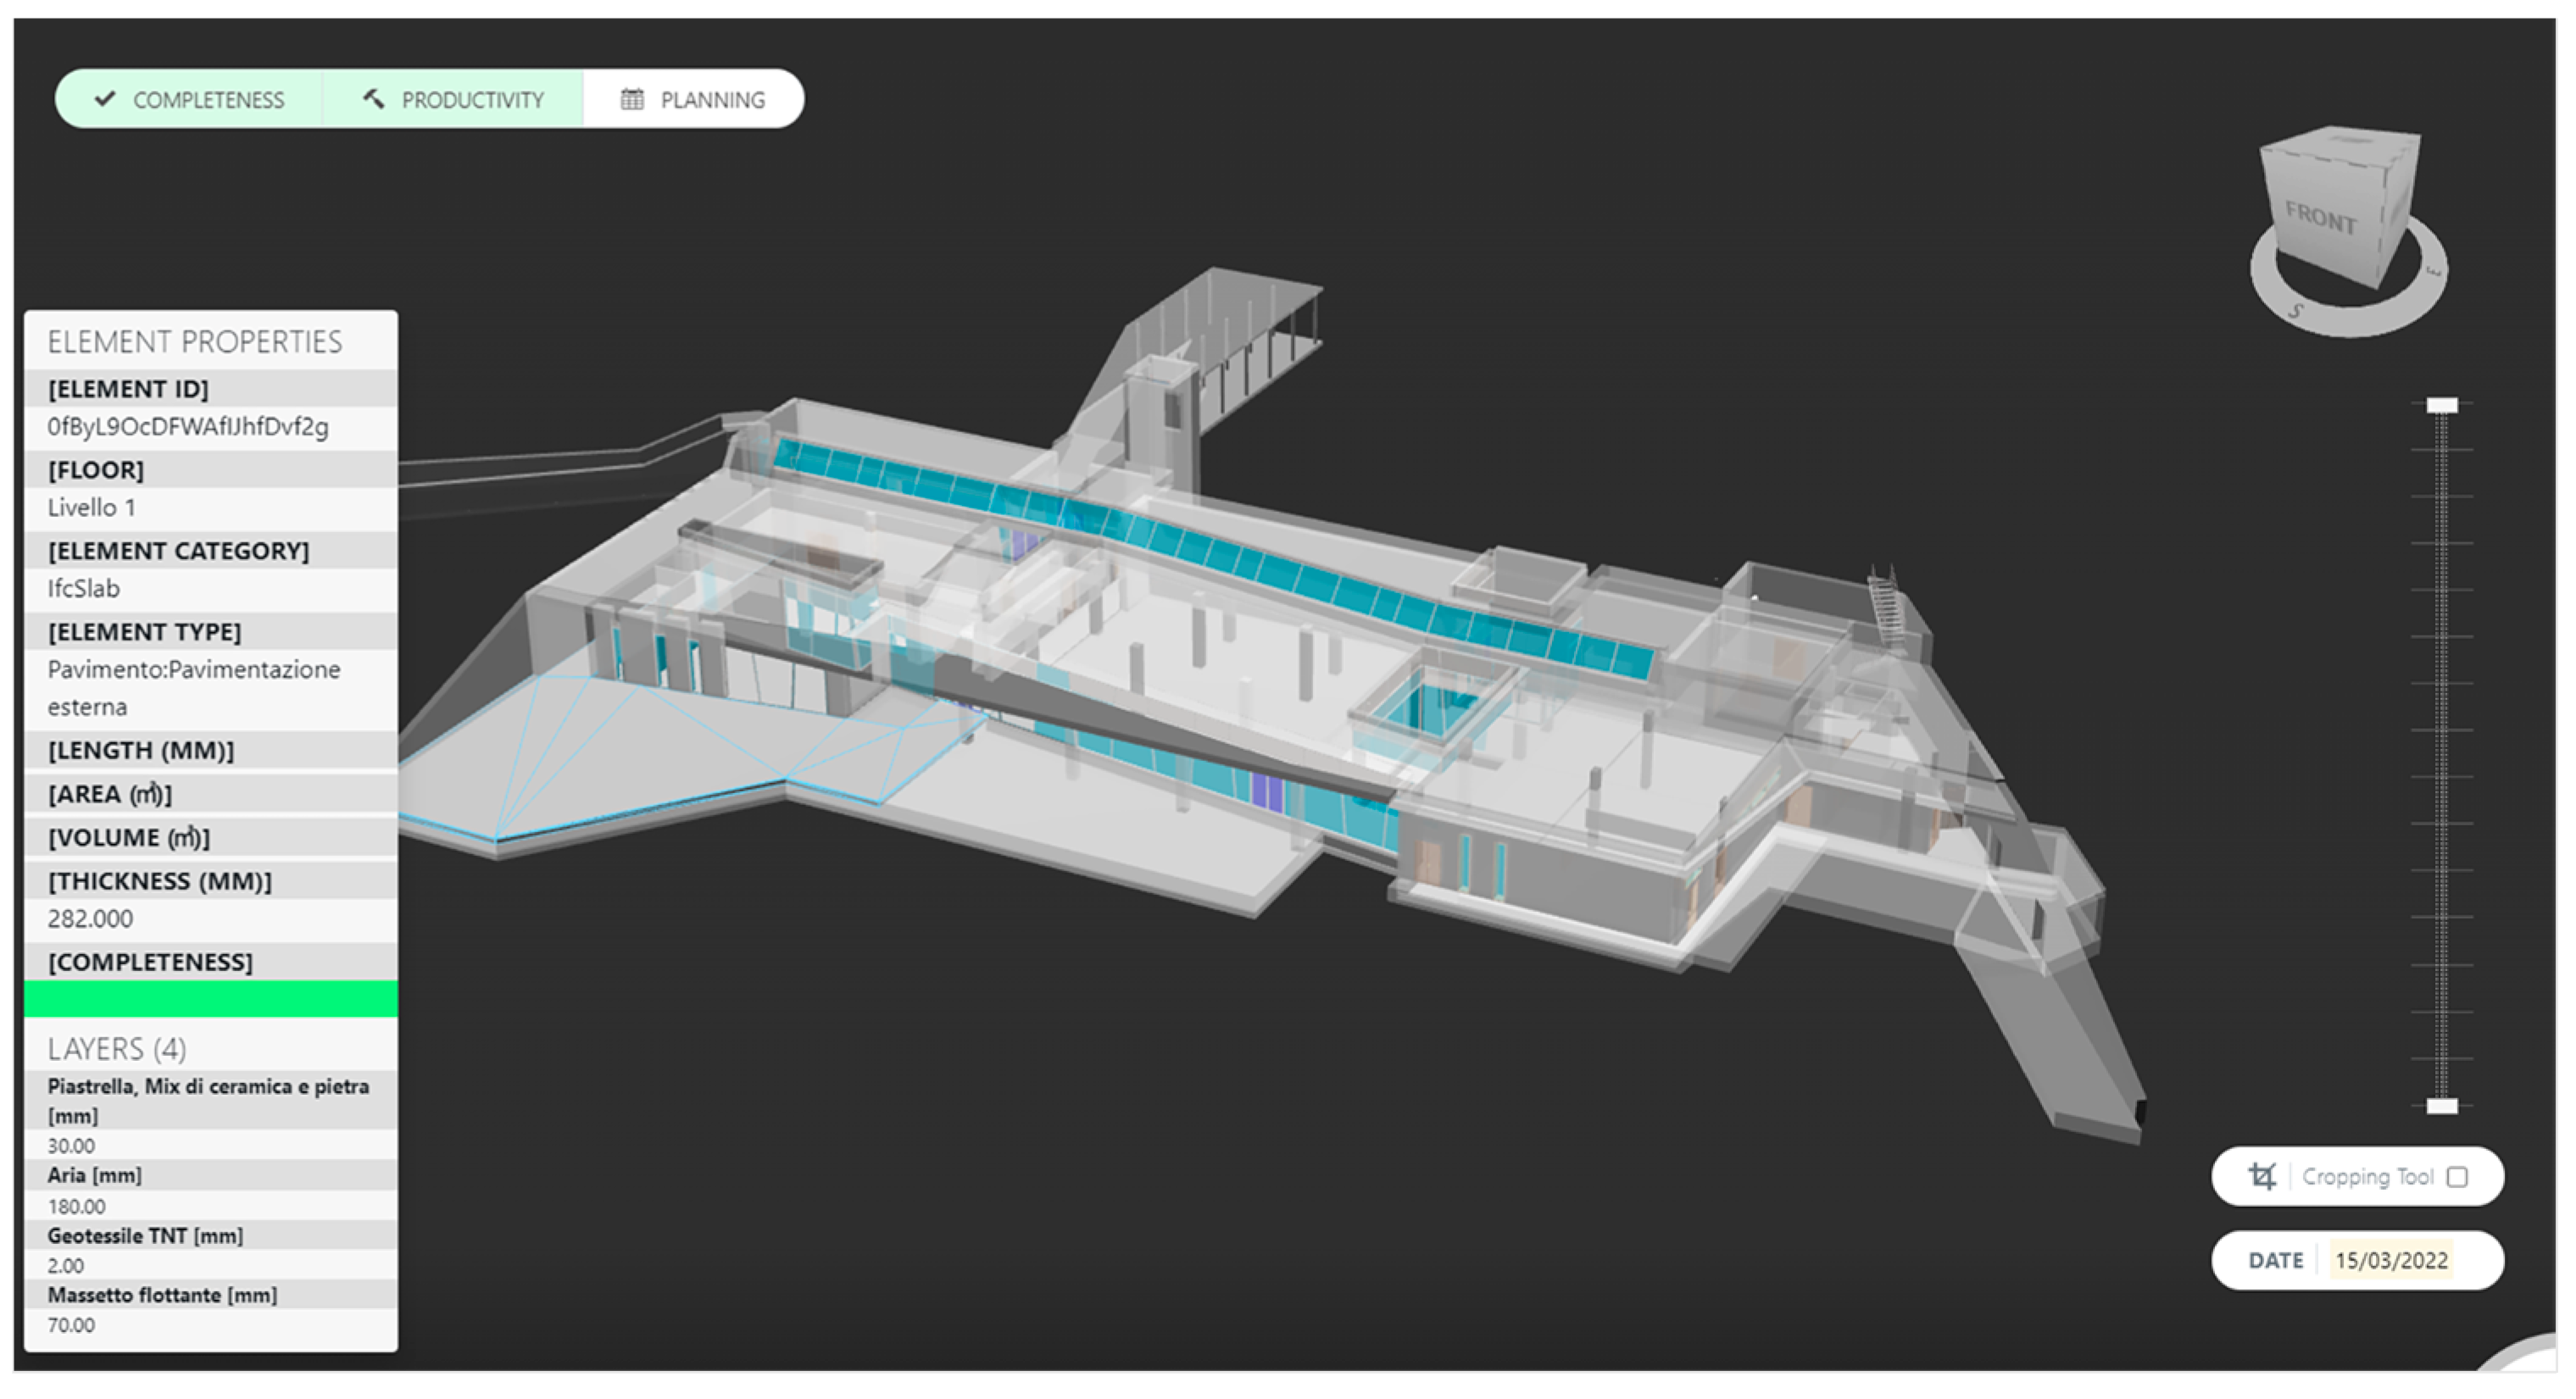
Quantitative comparisons between as-designed/as-planned BIM and point cloud models are used to provide a quick and thorough view of construction progress. Nowadays, various platforms are able to perform this analysis automatically, even on a time scale, so that the integration of construction scheduling is also used to identify delays in the construction programme. For this research, the authors tested the following method: BIM and point clouds were loaded into Sitemotion from BuildCode [40] to test the feasibility of the workflow. The BIM was loaded as IFC, and the point clouds as LAS formats. The system requires a minimum of 100 points per square metre and a tolerance of 4 cm as the maximum distance between points and BIM surfaces. Various metadata fields are extracted from the IFC and displayed to the user, such as element ID, category and type. This interface is shown in Figure 7. Two types of results are obtained from the platform: (1) graphical, with green colouring of the elements for which a match is found within the tolerance; and (2) quantitative, a percentage of completion of the IFC element based on its geometric properties. Figure 8 shows an analysis of two consecutive point clouds on two different dates.
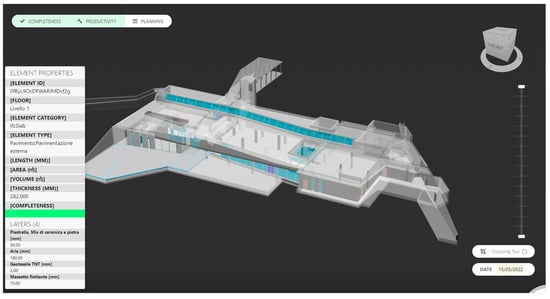
Figure 7.
Sitemotion interface.
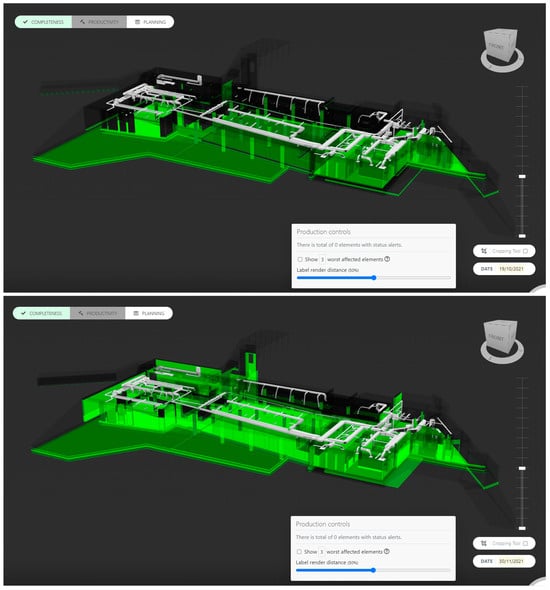
Figure 8.
BIM and point cloud comparison on different dates using Sitemotion.
3.4. Alternative Approach—Real-Time Work Progress Monitoring
During this progress monitoring study, a different approach was also initially attempted with the aim of performing progress monitoring in real time by exploiting the automatic localisation and change detection capabilities of iMMS. This attempt failed due to the complexity of the construction site selected as a case study, in particular (i) changes in the site due to the movement of materials and construction machineries and equipment rather than the actual progress of construction, and (ii) the simultaneous presence of different construction stages (structural, architectural, MEP) at the same time. This attempt is illustrated below and discussed in Section 4.1.
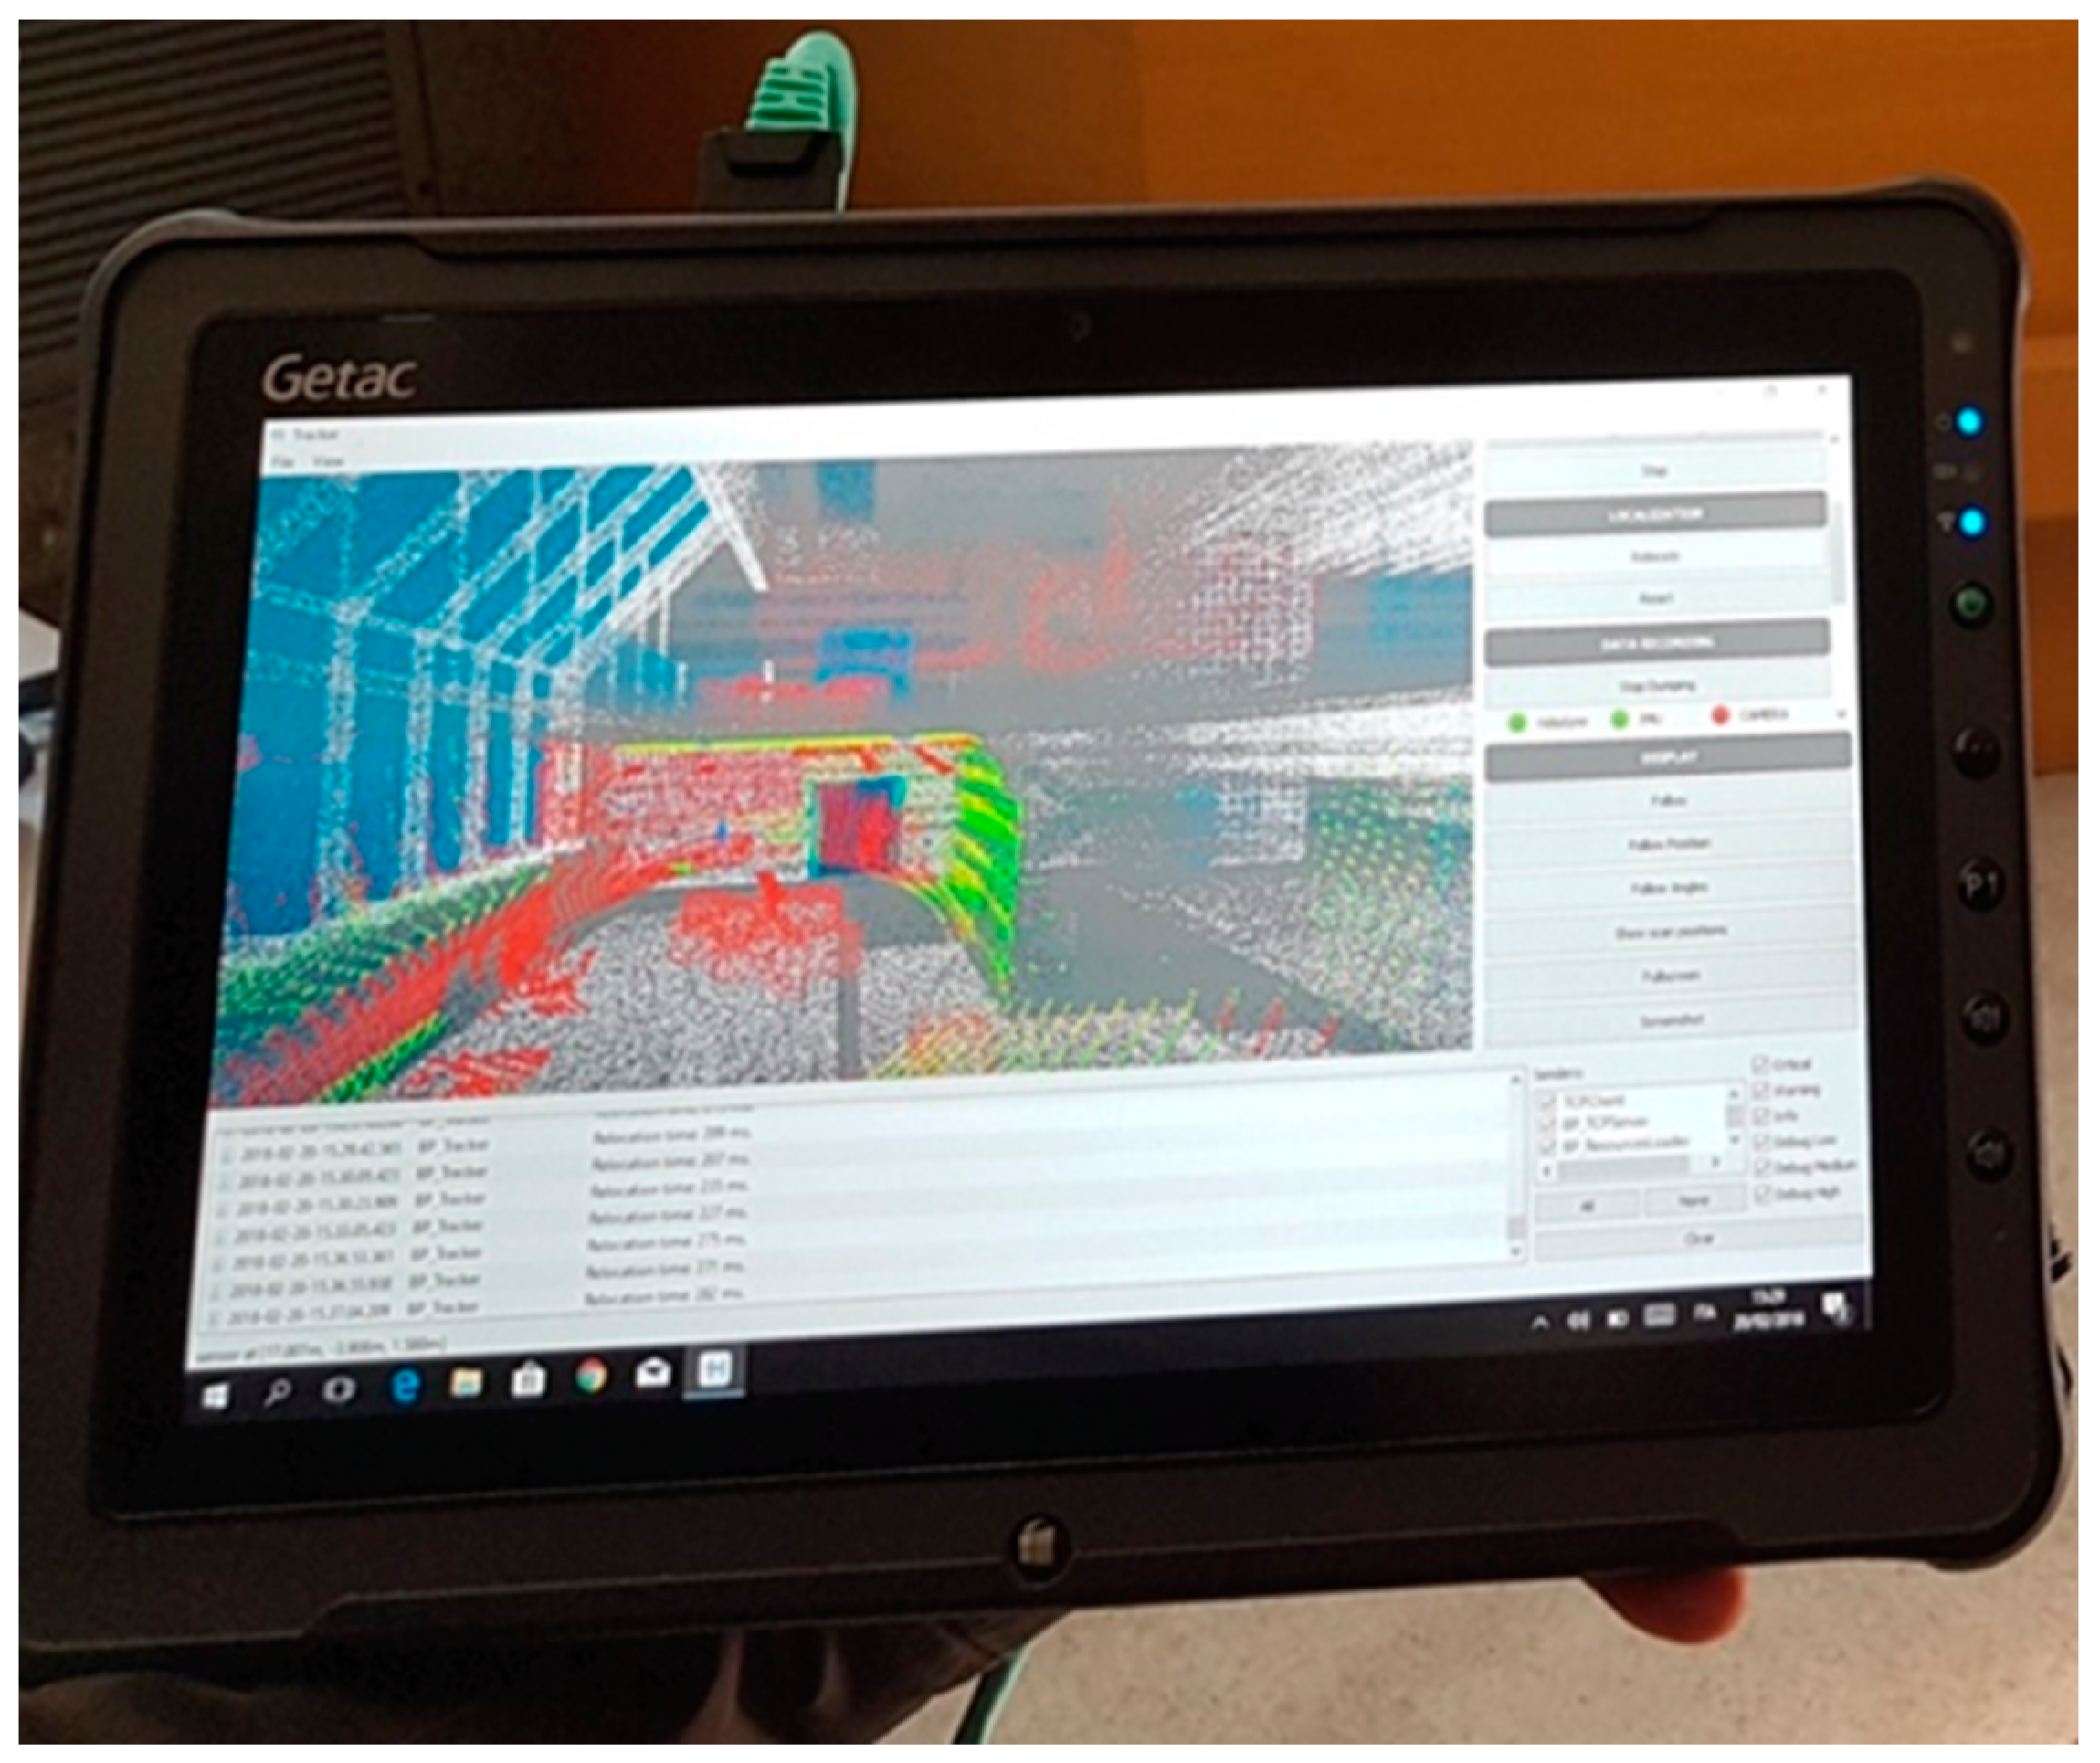
Like other mobile mapping devices, Heron can perform real-time change detection during the mapping procedure. As mentioned in Section 3.1, the as-designed BIM exported in the IFC can be converted into a point cloud and loaded into the memory of the device. The change detection function allows a comparison to be made between the reference (i.e., as-designed) model and the as-built geometry of what has been constructed on-site at the time of the survey (i.e., when the construction progress is monitored). These algorithms operate in real time on the field during the survey. They compare a pre-loaded point cloud with the real-time stream of data captured by the LiDAR sensors. The geometry acquired in the field is compared with the geometry stored in memory, and from an initial rough correspondence defined by the operator, it automatically finds the current location of the sensor within the pre-loaded geometry. From this point, the operator can visualise the real-time data stream on the display, i.e., the incrementing LiDAR point cloud, with the points coloured either green or red. The green colouring corresponds to matching elements, i.e., geometry being acquired in real-time that has some correspondence with the stored data; on the other hand, the red colouring corresponds to non-matching elements, i.e., geometry being acquired that is not present in the stored data.
This function of the Heron iMMS is designed to detect changes in real time, but in this context, it can also be used to monitor the difference between the planned work progress and the as-built status for the same date. On-site, it is possible to display the difference between the two data in real time: the surveyor can see on the monitor of the control unit, in real time the elements of the model that have not been built yet or that have been built in an out-of-tolerance position, highlighted in red. The parts of the construction that match the reference model are displayed in green (Figure 9). In this way, it is possible to verify 3D changes between different mapping sessions on-site or to show the differences between the as-designed, the as-planned and the as-built. The result of the live comparison can be saved for further processing, including the information on matching and non-matching elements.
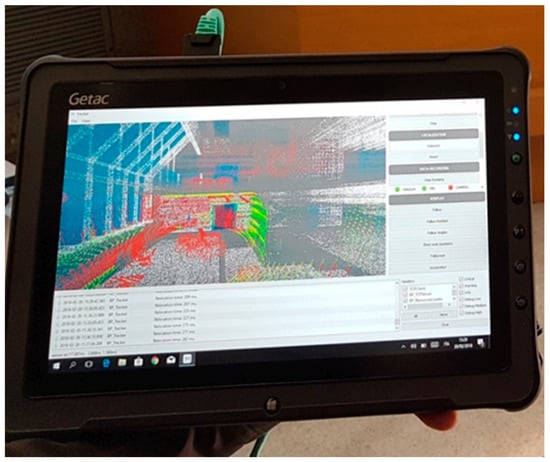
Figure 9.
Results of the “real time change detection procedure” on the control unit of the mobile system. The changes are highlighted in red.
However, this approach, although promising, failed to provide a reliable approach to monitoring construction progress for several reasons (detailed in the Section 4). Therefore, in this research, we limited our tests to post-processing analysis.
4. Results and Discussion
4.1. Results of the Real-Time Progress Monitoring Test
The real-time approach described in Section 3.4 is based on the change detection function of Heron, which estimates the trajectory followed by the instrument in real time, similar to the odometer post-process, but by continuously matching the live data stream with the stored point cloud. The success of the procedure therefore depends on the continuous matching of the two sets of data, i.e., the live point cloud and the point cloud derived from the 4D BIM. In cases where the track is lost due to significant differences between the two data sets, the process cannot continue, meaning that this process is only applicable when most of the geometry matches. This aspect was the main source of unreliability of this approach, and indeed, during testing, the automatic localisation technique had mixed results on the construction site. The first acquisitions during the early phases of construction were negatively affected by the lack of geometry and the presence of metal frameworks, which compromised the live tracking of the instrument trajectory. However, later tests during the construction phase showed that the system was able to self-localise and detect real-time changes in an environment free of highly reflective windows and temporary piled material. The on-site tests demonstrated that implementing real-time change detection with LiDAR-based tools requires that the construction site be designed to accommodate such a progress monitoring approach. As the construction site was small, there were accumulations of material, machinery and various types of obstructions on the site during the survey, which caused false matches during live tracking. In addition, the different phases of construction, described by the transition between structural BIM, architectural BIM and MEP, were not temporally distinct at the site and therefore present at the same time in different areas of the construction. This has made it difficult to define which BIM model to load in order to perform the semi-automated progress monitoring process. A construction site as the case study described here makes it complex to perform an automatic progress monitoring process because of the simultaneous presence of different construction phases at the same time. Therefore, semi-automatic construction progress monitoring processes require that the work organisation on-site be designed in such a way as to ensure the success of the automatic detection and analysis procedures. For this reason, it was not applicable to the case study at hand.
4.2. Results of the Post-Processing Progress Monitoring Test
4.2.1. Data Acquisition, Processing and Modelling
Data collection with the Heron MS Twin Color continued throughout the construction of the building from November 2021 to May 2023. Survey activities were scheduled monthly, with only a few exceptions. During each survey session, point clouds were generated and spherical photographs were taken and georeferenced. The first survey was carried out on 30 November 2021, while the last one described in this paper was acquired on 22 May 2023. A total of 10 surveys were carried out, each taking an average of 30–40 min to complete. The time taken to collect data on-site varied over the course of the test, depending on the stage of construction and the degree of completeness and complexity of the building. Indeed, during the early stages, the survey could be completed quickly, whereas during the final stages, the complexity of the finished architecture extended the survey trajectory and thus the survey time. The first survey was carried out during the laying of the foundations and lasted 15 min; the elements already completed at that stage were the foundation slab, the concrete columns of the basement and two retaining walls. The final survey was carried out shortly before the construction was completed, and it took 35 min to acquire the entire structure. During the iMMS acquisition, the 3D point cloud was augmented with on-demand panoramic imagery. A high-resolution image was captured almost every 3–5 m of the walked path to support the creation of a virtual tour based on stepping from one image to another.
The 4D BIM was created by the authors based on the building design. The construction company provided the authors with two-dimensional documents such as floor plans, sections, elevations and details of the building in DWG format, as well as the construction schedule generated by Gantt Project software (version 3.1.3102). Using Autodesk’s Revit 2022 three-dimensional modelling software, it was possible to model the entire building in all its parts and layers (Figure 5). Later, the BIM was enriched with the WBS property, as suggested in Section 3.3.1, using Synchro 4D Pro. The WBS property makes it possible to generate sub-versions of the BIM for each construction phase by isolating the elements planned for a specific date. In this way, BIMs of the planned progress stages were generated for the same iMMS survey dates in order to carry out progress monitoring.
The different surveys taken at different stages of construction were not referenced to a set of ground control points; instead, each point cloud was exported with an arbitrary reference system. Later, the reference coordinate system was established based on the 4D BIM. This meant that all the resulting point clouds were aligned with the Building Information Model coordinate system. This was done by converting the IFC model to a point cloud model by sampling random points on the model surfaces. Iterative closest point (ICP) registrations between point clouds were performed. The point cloud derived from the BIM model was used as a fixed reference, while the point clouds from the iMMS surveys were registered to it. The results of this alignment were visually assessed to confirm that the constructed elements were correctly matched.
4.2.2. Post-Processing Monitoring
At each monitoring stage, the two files, the as-planned BIM and the as-built point cloud, were imported into Sitemotion software and visually compared. During the comparison, two different situations were identified: (1) points in the as-built point cloud that matched the as-designed building elements and (2) as-designed building elements that did not match the as-built point clouds. The first situation confirms that the planned work has been delivered on time, while the second situation assesses that a planned stage has not been delivered on time, indicating delays.
It is important to note that the proposed comparison methods assume that there should be no difference between the as-designed/as-planned BIM and the as-built. It is only under this assumption that construction elements in the BIM at a particular stage of construction that do not match the as-built point cloud at the same stage confirm a delay in the progress of the work. If there is a discrepancy between as-designed and as-built due to a variation during construction, this needs to be identified and addressed by updating the as-designed BIM accordingly.
In the early stages of construction, there was a significant discrepancy between the as-designed and as-built situations. On closer inspection, however, this discrepancy was not due to delays in construction, but due to incorrect alignment of the iMMS data with the BIM data. The ICP registration performed to reference the iMMS point clouds provided correct alignments in most cases, but failed to provide correct vertical alignments where floors were already poured, but additional layers were missing. In this situation, the ICP registration converged to an incorrect surface of the BIM, meaning that the concrete slab surface matched the finished floor surfaces of the BIM. In these cases, it is necessary to check the result on a sectional view and create a manual shift along the vertical axis of the point cloud. Another way to find a good fit and correct final positioning of the survey point cloud is to perform ICP registration between the iMMS point cloud and the segmented BIM at the same progress stage as used for the progress monitoring comparison, instead of using the full BIM. However, it is still critical to check for misalignment, as the same problem can occur with this method if there is a delay in construction—for example, if the floor should be finished at this stage, but instead has just been poured. In this example, the ICP may converge on the wrong surface, causing the delay to go undetected.
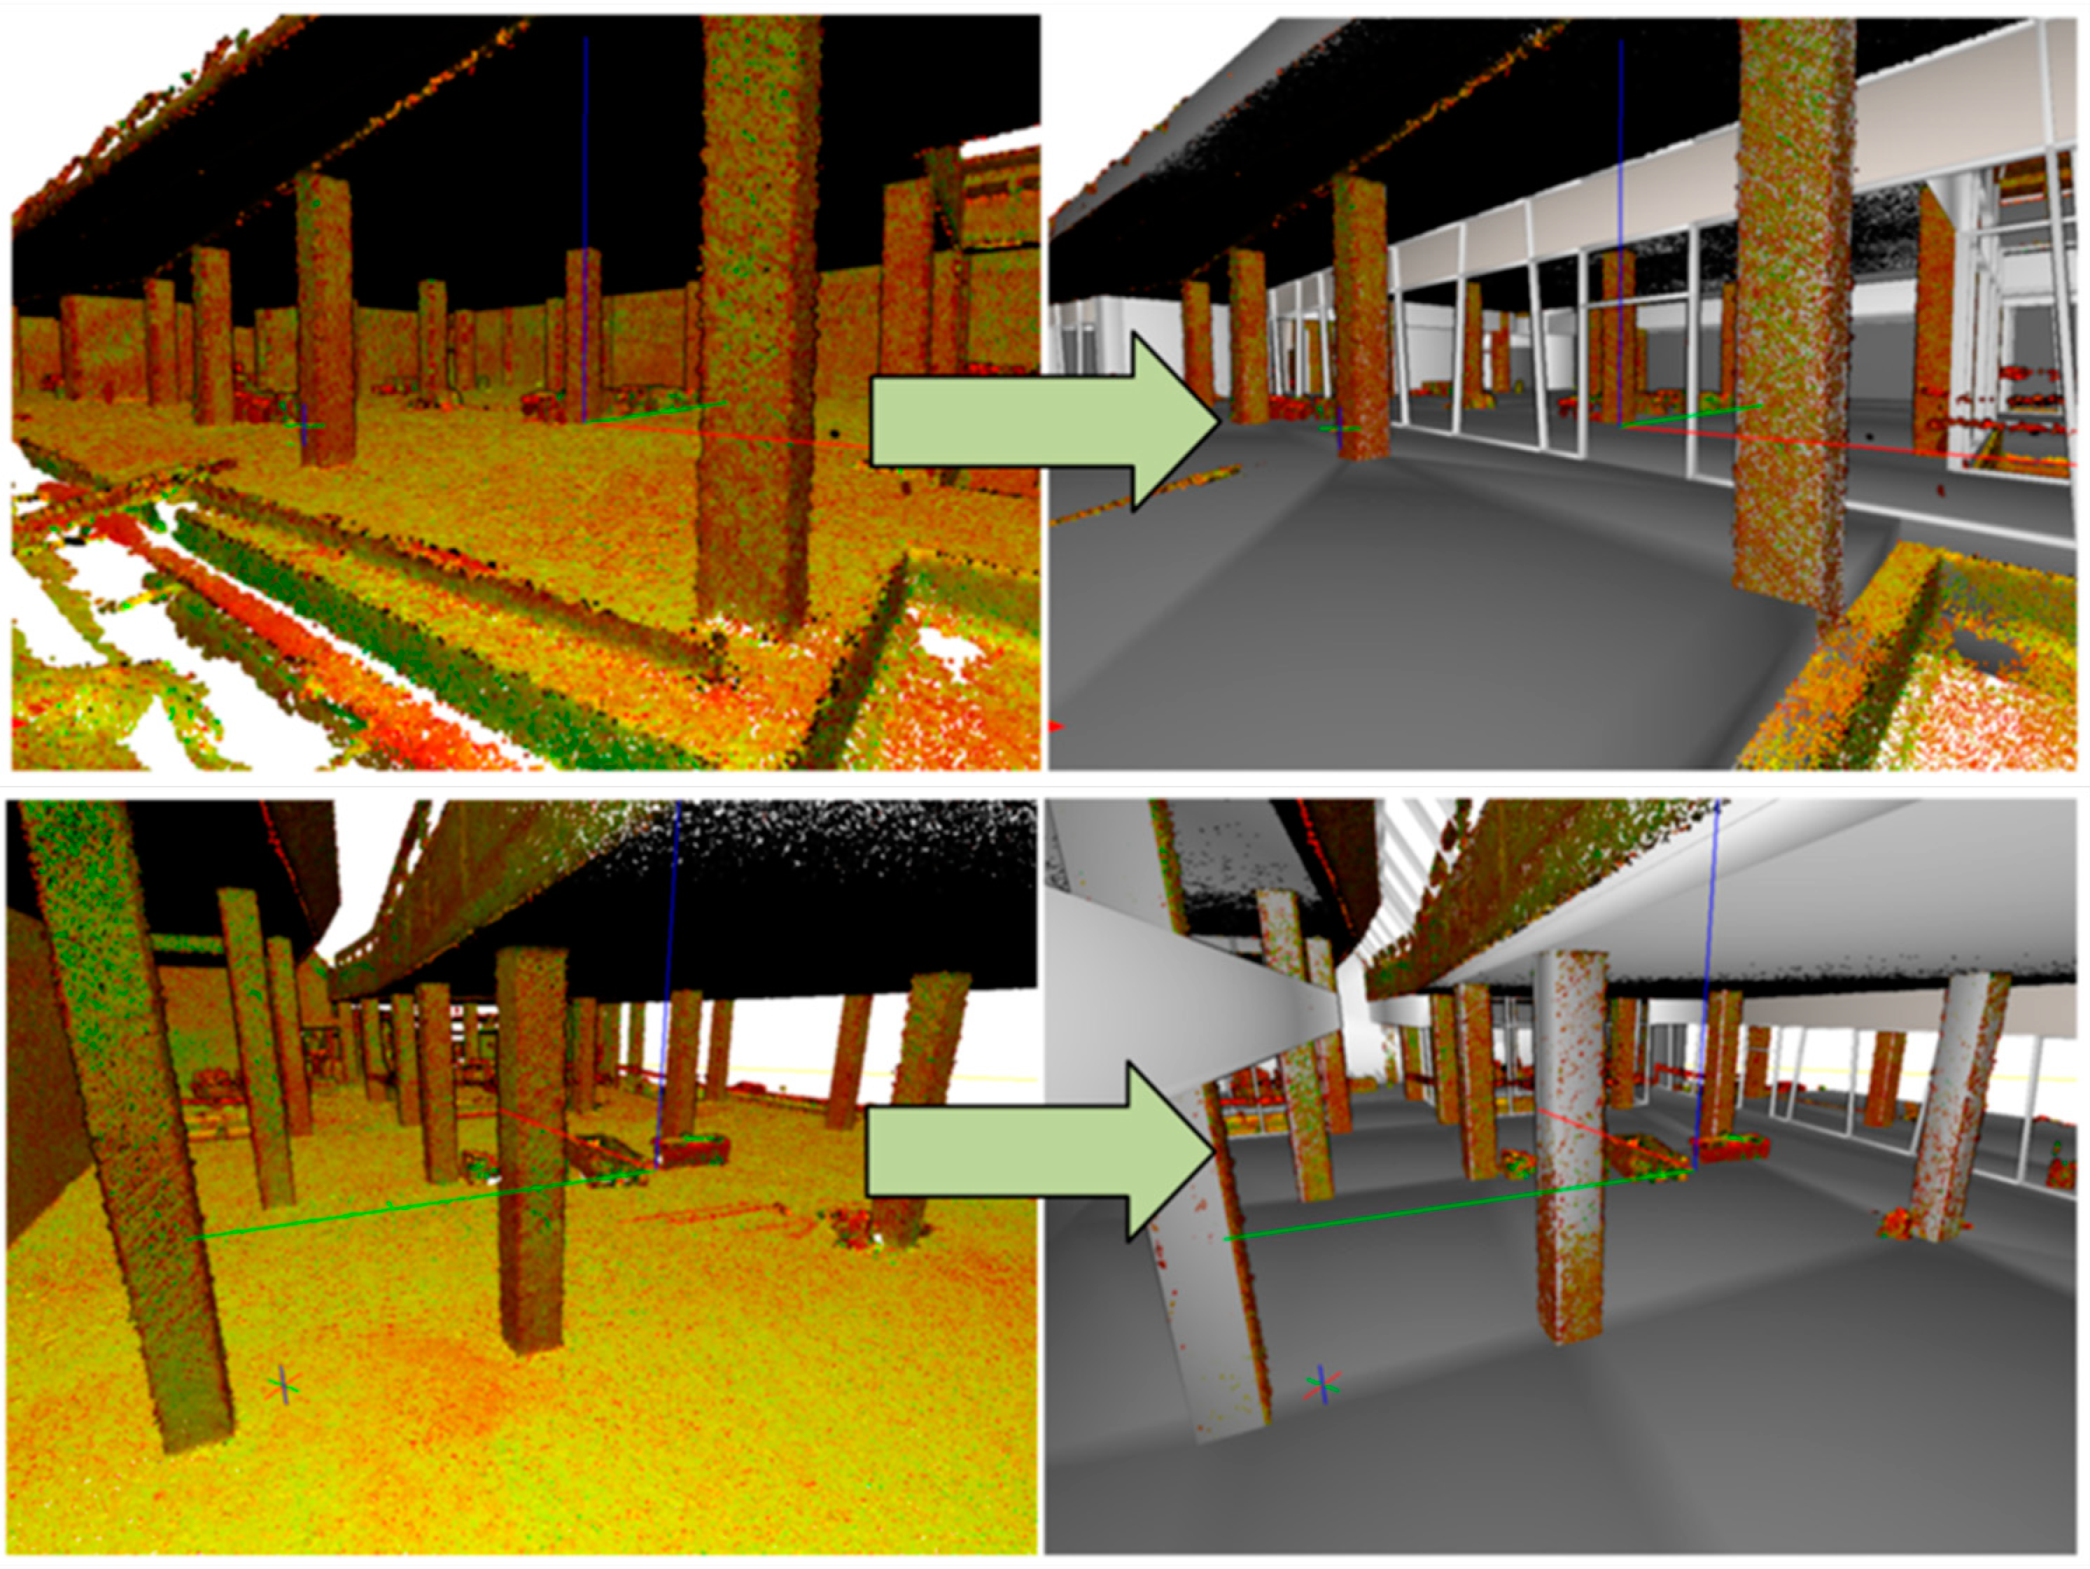
Figure 10 shows the result obtained after a correct ICP registration of the iMMS point cloud model and BIM.
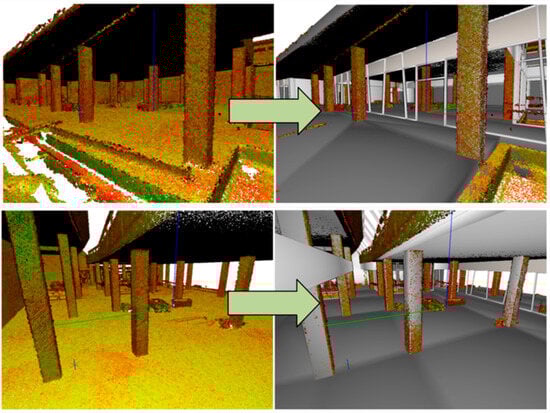
Figure 10.
Alignment evaluation between point cloud and BIM. Images on the first column showcase views of the iMMS point cloud while images on the second column showcase the same views with the BIM and point cloud superimposed.
During the construction phase, where significant geometry is available on-site, the alignment of the point cloud with the BIM was straightforward and the percentage of agreement shows that the construction was on schedule.
During the phases where architectural details were incorporated, such as the installation of highly reflective sloping windows on the front facade, the result in the point cloud was affected by the specular reflections captured by the LiDAR sensor, adding a fictitious building that clashes with the real one, as shown in Figure 11. These types of reflections are common in sensors that capture a single return of the laser pulse; in this case, the strongest response is recorded as a single measurement, but its definition results in ambiguity among the multiple peak returns [41]. A filtering procedure was defined to remove mirrored points using the reflectance value criterion due to the low reflectivity of these points. The filtering step was added as an intermediate mandatory process for the surveys of the latest construction phases; the result is shown in Figure 11, in grey.
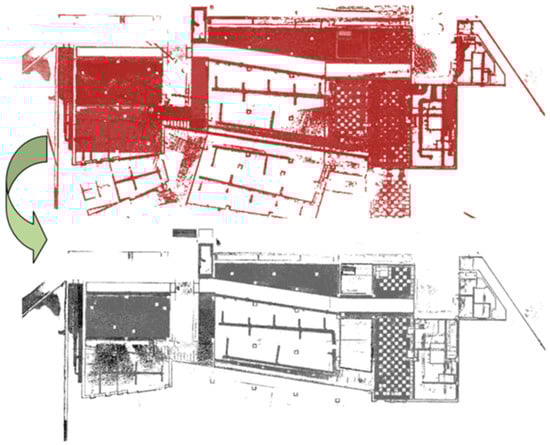
Figure 11.
Point clouds plan view; red colour before filtering and grey for the final result.
4.3. Discussion
The research highlighted some potential for the proposed methodology, as well as some critical issues in relation to (1) how the iMMS survey is carried out, (2) how data are processed to create the as-built point cloud, and (3) how data are analysed for construction progress monitoring purposes overlaying the point cloud and the as-planned building information model. In terms of (1) data acquisition and (2) processing, it is evident that the iMMS approach is effective in the fast-paced environment of a construction site. This technology enabled a detailed representation of the as-built situation to be obtained quickly and with minimal disruption to the working environment, avoiding the need to stop or reschedule work activities to accommodate the survey operations. The productivity of the iMMS technology allows frequent site inspections and data collection. In addition, the photographic documentation inherent in the geometric survey itself allows the construction inspection to be continued or revisited virtually and also provides evidence for future recall of the construction progress. On the other hand, the main critical issues with iMMS surveying are twofold: (i) the presence of transparent or reflective surfaces, which introduce noise or false points into the acquired data, and whose removal may require manual intervention by a technician; and (ii) the amount of data acquired and archived, which can grow rapidly as the size and complexity of the construction site and the frequency of inspections increase.
Regarding (3) as-built/as-design comparison for construction progress monitoring, it can be said that the proposed methodology allows for the digital monitoring of construction sites through BIM-based management procedures, unifying and centralising the management of the building. On the other hand, the criticalities highlighted are numerous and mainly relate to two aspects: (i) the co-registration of data acquired at different construction stages with the BIM as-design model; and (ii) the mismatching of geometrically similar but semantically different elements in the analysis phase due to the lack of attributes at the level of the object or individual construction element in the point cloud.
In terms of data co-registration, the proposed methodology uses ICP registration between iMMS point clouds and a point cloud derived from the BIM. Control points were not used, as it is impractical in many real-world applications to materialise and keep physical points visible throughout construction and it is impractical to reconstruct the location of these physical references in the digital model. However, co-registration for ICP matching produces instances of data misalignment that occur in two situations: (i) in the case where the full BIM model (at the final construction stage) is used as an alignment reference for iMMS data acquired at early construction stages and (ii) in the case where the BIM model at early construction stages is used to align iMMS acquisitions at the same stage of progress, but there is insufficient 3D geometry to achieve robust ICP convergence.
In terms of misalignment of construction elements during the data analysis phase, a significant error was the misinterpretation of the formwork of concrete columns as the columns themselves. For example, in a point cloud acquisition run on 19 October 2021, the formwork surveyed in the field was found to be the same as the finished concrete column. This type of error can be significant, as a delay in the construction of the columns, which hypothetically should be ready on the inspection date, would not be detected if the formwork has already been made. Similar errors are due to the lack of semantic understanding of the objects in the point cloud data. To make the proposed methodology reliable in all cases without the need for manual intervention, it is necessary to include a semantic interpretation of the data in the process, which can be greatly facilitated by taking advantage of image acquisition.
5. Conclusions and Future Works
The research tested an innovative method of monitoring construction work progress by combining 4D BIM with periodic geometric surveying using an indoor mobile mapping device capable of capturing point clouds and panoramic images quickly and efficiently. Construction progress monitoring is a complex, critical and labour-intensive activity. It relies on continuous periodic inspections and comparisons with the planned schedule, requires a lot of effort and can depend on significant reductions in construction time, resulting in resource savings. Until now, this activity has consumed a large part of a construction manager’s time and has been poorly if not completely disconnected from the digital and integrated management of the design, construction and maintenance of a building within a BIM-based management process. The proposed methodology involves the joint application of 4D BIM and periodic 3D acquisitions during site inspections. The surveys were carried out quickly and without significant disruption to the construction schedule using the Heron MS Twin Color indoor mobile mapping tool from Gexcel Ltd. The tool can create a digital construction site diary from the acquired 3D point clouds, which can be used in conjunction with the 4D BIM model to monitor construction progress. The 4D BIM alone makes it possible, during the design phase, to improve the understanding of the project’s milestones and construction plans by the owner and the actors involved in the project. And combined with periodic iMMS inspections during the construction of the building, it allows the progress of the work to be monitored by identifying delayed work and allowing the site to be rescheduled. Knowing in real time critical aspects of the site allows you to reduce the time and costs associated with any delays.
The proposed methodology has proved to be effective and efficient on-site and has shown that it can be used for digital analysis of construction progress. The proposed method, despite the issues encountered, allows digital management and monitoring of on-site constructions that notoriously introduce more complexity than prefabricated ones and effectively centralise the construction monitoring task to the BIM. However, some issues have emerged in the different stages of data processing and analysis: (i) in the management of the survey reference system of an evolving structure, (ii) in the management of the data, in terms of file size and organisation of the different time stages, and (iii) in the lack of object semantics in the point cloud data. The latter problem has been shown to cause significant errors in the assessment of construction delays. In addition, any misalignments between the acquired data and the occasional presence of noise and incorrect points require manual intervention to be resolved. Thus, the proposed methodology is a semi-automatic process that requires the supervision and intervention of some technicians.
The addition of object semantics to the point cloud is considered by the authors as a crucial point to make the proposed methodology more reliable and less manual. The research carried out proved to be effective and promising and will need to be extended and repeated in the future. The current feasibility of the proposed approach in a real application will have to be evaluated according to the complexity and scale of the project. Future work should also validate the proposed approach by comparing it to the traditional time-consuming method.
Author Contributions
Conceptualisation, G.P.M.V. and A.L.C.C.; methodology, G.P.M.V., A.L.C.C. and S.M.V.; resources, G.P.M.V.; data curation, L.P. and S.C.; writing—original draft preparation, G.P.M.V., L.P. and S.C.; writing—review and editing, S.M.V., G.P.M.V., L.P. and S.C.; supervision, G.P.M.V., A.L.C.C. and S.M.V.; project administration, A.L.C.C.; funding acquisition, A.L.C.C. All authors have read and agreed to the published version of the manuscript.
Funding
This research was partially funded by the Italian government through the PRIN2017 project titled “Distributed Digital Collaboration Framework for Small and Medium-Sized Engineering and Construction Enterprises”.
Data Availability Statement
Restrictions apply to the availability of these data. Data were obtained from Rigamonti srl and are available from the authors with the permission of Rigamonti srl.
Acknowledgments
The authors would like to acknowledge Francesco Rigamonti and the construction company Rigamonti srl for providing the case study described in this article. The authors thank the BuildCode for providing free access to the Sitemotion platform and for the support and collaboration on data elaboration. Moreover, the authors would like to thank the significant contribution of Jacobo Ortiz Barrientos and Lorenzo Cavallari from Gexcel, Antonio Mainardi from Acoma srl, Paola Federici and Daniela Julea from the University of Brescia in investigation and data curation activities.
Conflicts of Interest
The authors declare no conflict of interest. The funders had no role in the design of the study; in the collection, analyses, or interpretation of data; in the writing of the manuscript; or in the decision to publish the results.
References
- Pučko, Z.; Šuman, N.; Rebolj, D. Automated continuous construction progress monitoring using multiple workplace real time 3D scans. Adv. Eng. Inform. 2018, 38, 27–40. [Google Scholar] [CrossRef]
- Meyer, T.; Brunn, A.; Stilla, U. Change detection for indoor construction progress monitoring based on BIM, point clouds and uncertainties. Autom. Constr. 2022, 141, 104442. [Google Scholar] [CrossRef]
- Nakanishi, Y.; Kaneta, T.; Nishino, S. A review of monitoring construction equipment in support of construction project management. Front. Built Environ. 2022, 7, 632593. [Google Scholar] [CrossRef]
- Puri, N.; Turkan, Y. Bridge construction progress monitoring using lidar and 4D design models. Autom. Constr. 2020, 109, 102961. [Google Scholar] [CrossRef]
- Mahami, H.; Nasirzadeh, F.; Hosseininaveh Ahmadabadian, A.; Esmaeili, F.; Nahavandi, S. Imaging network design to improve the automated construction progress monitoring process. Constr. Innov. 2019, 19, 386–404. [Google Scholar] [CrossRef]
- Teizer, J. Status quo and open challenges in vision-based sensing and tracking of temporary resources on infrastructure construction sites. Adv. Eng. Inform. 2015, 29, 225–238. [Google Scholar] [CrossRef]
- Rebolj, D.; Pučko, Z.; Babič, N.Č.; Bizjak, M.; Mongus, D. Point cloud quality requirements for Scan-vs-BIM based automated construction progress monitoring. Autom. Constr. 2017, 84, 323–334. [Google Scholar] [CrossRef]
- Greeshma, A.S.; Edayadiyil, J.B. Automated progress monitoring of construction projects using Machine learning and image processing approach. Mater. Today Proc. 2022, 65, 554–563. [Google Scholar] [CrossRef]
- Mahmoudi, M.; Vatankhahan, F.; Malekahmadi, O.; Goharimehr, R. Study and performance of three-dimensional laser scanning technology in preparation industrial As-Built plans. In Proceedings of the 3rd International Conference on Research in Science and Technology, Berlin, Germany, 9 July 2016; pp. 1–11. Available online: https://www.sid.ir/FileServer/SE/271E20160340 (accessed on 18 December 2022).
- Navon, R. Automated project performance control of construction projects. Autom. Constr. 2005, 14, 467–476. [Google Scholar] [CrossRef]
- Bosché, F.; Turkan, Y.; Haas, C.T.; Chiamone, T.; Vassena, G.; Ciribini, A.L.C. Tracking MEP installation works. In Proceedings of the 30th International Symposium on Automation and Robotics in Construction and Mining and 23rd World Mining Congress, Montréal, QC, Canada, 11–15 August 2013; pp. 229–239. [Google Scholar] [CrossRef]
- Braun, A.; Tuttas, S.; Stilla, U.; Borrmann, A. Bim-based progress monitoring. In Building Information Modeling—Technology Foundations and Industry Practice; Borrmann, A., König, M., Koch, C., Beetz, J., Eds.; Springer: Berlin/Heidelberg, Germany, 2018; pp. 463–476. [Google Scholar] [CrossRef]
- Leandro, R.; Landau, H.; Nitschke, M.; Glocker, M.; Seeger, S.; Chen, X.; Deking, A.; BenTahar, M.; Zhang, F.; Ferguson, K.; et al. RTX positioning: The next generation of cm-accurate real-time GNSS positioning. In Proceedings of the 24th International Technical Meeting of the Satellite Division of the Institute of Navigation (ION GNSS 2011), Portland, OR, USA, 20–23 September 2011; pp. 1460–1475. [Google Scholar]
- Cantoni, S.; Vassena, G. Fast indoor mapping to feed an indoor DB for building and facility management. ISPRS Int. Arch. Photogramm. Remote Sens. Spat. Inf. Sci. 2019, 42, 213–217. [Google Scholar] [CrossRef]
- Leung, S.W.; Mak, S.; Lee, B.L.P. Using a real-time integrated communication system to monitor the progress and quality of construction works. Autom. Constr. 2008, 17, 749–757. [Google Scholar] [CrossRef]
- Alizadehsalehi, S.; Yitmen, I. A concept for automated construction progress monitoring: Technologies adoption for benchmarking project performance control. Arab. J. Sci. Eng. 2019, 44, 4993–5008. [Google Scholar] [CrossRef]
- Cheng, M.Y.; Chen, J.C. Integrating barcode and GIS for monitoring construction progress. Autom. Constr. 2002, 11, 23–33. [Google Scholar] [CrossRef]
- Kopsida, M.; Brilakis, I.; Vela, P.A. A review of automated construction progress monitoring and inspection methods. In Proceedings of the 32nd CIB W78 Conference on Construction IT, Eindhoven, The Netherlands, 27–29 October 2015. [Google Scholar]
- Rocha, G.L.; Mateus, L.; Fernández, J.H.; Ferreira, V. A scan-to-BIM methodology applied to heritage buildings. Heritage 2020, 3, 47–65. [Google Scholar] [CrossRef]
- Woodhead, R.; Stephenson, P.; Morrey, D. Digital construction: From point solutions to IoT ecosystem. Autom. Constr. 2018, 93, 35–46. [Google Scholar] [CrossRef]
- McCulloch, B. Automating field data collection in construction organizations. In Construction Congress V: Managing Engineered Construction in Expand Global Markets; ASCE: Reston, VA, USA, 1997; pp. 957–963. [Google Scholar]
- El-Omari, S.; Moselhi, O. Integrating 3D laser scanning and photogrammetry for progress measurement of construction work. Autom. Constr. 2008, 18, 1–9. [Google Scholar] [CrossRef]
- Otero, R.; Lagüela, S.; Garrido, I.; Arias, P. Mobile indoor mapping technologies: A review. Autom. Constr. 2020, 120, 103399. [Google Scholar] [CrossRef]
- Sgrenzaroli, M.; Ortiz Barrientos, J.; Vassena, G.; Sanchez, A.; Ciribini, A.L.C.; Mastrolembo Ventura, S.; Comai, S. Indoor Mobile Mapping Systems and (BIM) digital models for construction progress monitoring. Int. Arch. Photogramm. Remote Sens. Spatial Inf. Sci. 2022, 43, 121–127. [Google Scholar] [CrossRef]
- Ceriani, S.; Sànchez-Belenguer, C.; Taddei, P.; Wolfart, E.; Sequeira, V. Pose interpolation slam for large maps using moving 3d sensors. In Proceedings of the IROS 2015—IEEE/RSJ International Conference on Intelligent Robots and Systems, Hamburg, Germany, 28 September–2 October 2015; pp. 750–757. [Google Scholar] [CrossRef]
- Zhang, J.; Singh, S. Visual-lidar odometry and mapping: Low-drift, robust, and fast. In Proceedings of the IEEE International Conference on Robotics and Automation (ICRA), Seattle, WA, USA, 26–30 May 2015; pp. 2174–2181. [Google Scholar]
- Qu, T.; Zang, W.; Peng, Z.; Liu, J.; Li, W.; Zhu, Y.; Zhang, B.; Wang, Y. Construction site monitoring using uav oblique photogrammetry and bim technologies. In Proceedings of the 22nd CAADRIA Conference, Suzhou, China, 5 April 2017; pp. 5–8. [Google Scholar] [CrossRef]
- Braun, A.; Tuttas, S.; Borrmann, A.; Stilla, U. A concept for automated construction progress monitoring using bim-based geometric constraints and photogrammetric point clouds. J. Inf. Technol. Constr. 2015, 20, 68–79. [Google Scholar]
- Fröhlich, C.; Mettenleiter, M. Terrestrial laser scanning—New perspectives in 3D surveying. Int. Arch. Photogramm. 2004, 36, 7–13. [Google Scholar]
- Fryskowska, A.; Stachelek, J. A no-reference method of geometric content quality analysis of 3D models generated from laser scanning point clouds for hBIM. J. Cult. Herit. 2018, 34, 95–108. [Google Scholar] [CrossRef]
- Yang, H.; Omidalizarandi, M.; Xu, X.; Neumann, I. Terrestrial laser scanning technology for deformation monitoring and surface modeling of arch structures. Compos. Struct. 2017, 169, 173–179. [Google Scholar] [CrossRef]
- Soni, A.; Robson, S.; Gleeson, B. Structural monitoring for the rail industry using conventional survey, laser scanning and photogrammetry. Appl. Geomat. 2015, 7, 123–138. [Google Scholar] [CrossRef]
- Seo, H. Tilt mapping for zigzag-shaped concrete panel in retaining structure using terrestrial laser scanning. J. Civ. Struct. Health Monit. 2021, 11, 851–865. [Google Scholar] [CrossRef]
- Wei, W.; Lu, Y.; Zhong, T.; Li, P.; Liu, B. Integrated vision-based automated progress monitoring of indoor construction using mask region-based convolutional neural networks and BIM. Autom. Constr. 2022, 140, 104327. [Google Scholar] [CrossRef]
- Kavaliauskas, P.; Fernandez, J.B.; McGuinness, K.; Jurelionis, A. Automation of construction progress monitoring by integrating 3D point cloud data with an IFC-based BIM model. Buildings 2022, 12, 1754. [Google Scholar] [CrossRef]
- Alizadehsalehi, S.; Yitmen, I. Digital twin-based progress monitoring management model through reality capture to extended reality technologies (DRX). Smart Sustain. Built Environ. 2021, 12, 200–236. [Google Scholar] [CrossRef]
- Li, C.Z.; Xue, F.; Li, X.; Hong, J.; Shen, G.Q. An internet of things-enabled BIM platform for on-site assembly services in prefabricated construction. Autom. Constr. 2018, 89, 146–161. [Google Scholar] [CrossRef]
- Gexcel Web Page. Available online: https://gexcel.it/it/ (accessed on 20 November 2022).
- European Commission Sector Observatory; European Construction Sector Observatory; Digitalisation in the construction sector. Analytical Report April 2021 Ref. Ares(2021) 2699252—22/04/2021—Ecso-Ar-Digitalisation-2021.pdf (Euagenda.Eu), pag 30. Available online: https://ec.europa.eu/docsroom/documents/45547 (accessed on 15 August 2023).
- Build Code. Available online: https://buildcode.dk/en/ (accessed on 18 June 2023).
- Hernandez-Marin, S.; Wallace, A.M.; Gibson, G.J. Bayesian Analysis of Lidar Signals with Multiple Returns. IEEE Trans. Pattern Anal. Mach. Intell. 2007, 29, 2170–2180. [Google Scholar] [CrossRef]


Disclaimer/Publisher’s Note: The statements, opinions and data contained in all publications are solely those of the individual author(s) and contributor(s) and not of MDPI and/or the editor(s). MDPI and/or the editor(s) disclaim responsibility for any injury to people or property resulting from any ideas, methods, instructions or products referred to in the content. |
© 2023 by the authors. Licensee MDPI, Basel, Switzerland. This article is an open access article distributed under the terms and conditions of the Creative Commons Attribution (CC BY) license (https://creativecommons.org/licenses/by/4.0/).