Article

Assessing the Effect of Air Intrusion on Reflective Insulations Performance with Horizontal Heat Flow

by
Hamed H. Saber
1,* and
David W. Yarbrough
2
1
Research and Consultations Department at the Deanship of Research and Industrial Development, Royal Commission of Jubail and Yanbu, Jubail Industrial City 31961, Saudi Arabia
2
R&D Services, Inc., Watertown, TN 37184, USA
*
Author to whom correspondence should be addressed.
Buildings 2023, 13(10), 2461; https://doi.org/10.3390/buildings13102461
Submission received: 31 August 2023 / Revised: 21 September 2023 / Accepted: 22 September 2023 / Published: 27 September 2023
(This article belongs to the Section Building Energy, Physics, Environment, and Systems)

Abstract

:
The determination of thermal resistances (R-values) for enclosed airspaces, including those with one or more low-emittance surfaces, has advanced from one-dimensional heat transfer between large parallel planes to multi-dimensional heat flow in a wide variety of physical configurations. The key elements in this advancement, however, are the evaluation of the heat flow due to conduction-convection and the solution for radiation that includes all surfaces bounding the region of interest. The model used in this study has been validated against several sets of laboratory test data, including the data from the U.S. National Bureau of Standards for the thermal resistance of airspaces, which has been the basis for handbook values for reflective airspaces for five decades. In addition, this model has been previously used to determine the reductions in the R-values of reflective insulations assemblies due to imperfect installations and internal defects in multilayer reflective systems with cross-airflow between the layers. In this study, the model is used to examine the impact on R-value of air intrusion of different air changes per hour (ACH) at various exterior air temperatures into reflective insulation assemblies with a range of effective emittance from 0 to 0.82. Two cases are considered in this study. In the first case, called “infiltration”, exterior air enters the assembly through an opening located in the hot side of the assembly and exits through another opening located in the cold side of the assembly. In the second case, called “wind washing”, the exterior air enters the assembly through an opening located in the hot side of the assembly and exits through another opening located in the same side of the assembly. To quantify the reductions in the R-values due to infiltration and wind washing conditions, a reference case is included in this study for the case in which no air intrusion occurs in the reflective insulation assemblies. Finally, consideration is given to investigating the effect of the aspect ratio on the R-values of reflective insulation assemblies without air intrusion and with air intrusion of different ACH at various exterior air temperatures. The results show that the aspect ratio has a significant impact on the R-value of reflective insulation assemblies with and without air intrusion. Additionally, the results show that the impact of infiltration and wind washing on R-values of reflective insulation assemblies increase as the difference between the exterior air temperature and the undisturbed temperature of the cavity increases.

1. Introduction

Since thermal energy losses through the building envelopes account for nearly 50% of total building energy usage, there has been an increase of interest in studying the thermal properties of building envelope components in recent years [1]. In many countries, the energy used for the heating of residential buildings accounts for 40% of the overall energy consumption in the residential sector, making it the most significant component in terms of operating cost [2]. However, the implementation of optimal insulation for walls and roofing systems has the potential to result in a significant reduction of up to 77% in heating energy consumption [3,4]. Thus, the performance of thermal insulation used in building components requires that the insulation material be installed correctly in order to achieve the thermal resistance claimed by the manufacturers. This means that the thickness specified for the insulation is achieved and the region containing the insulation is not subjected to air intrusion or infiltration [5,6]. Henning [7], for example, published results showing the effectiveness of air barrier materials on preventing loss of thermal performance due to air infiltration into a wall cavity insulated with fiberglass batts. The use of reflective insulations and radiant barriers has been a component of building energy management for many years. The subject of air infiltration and ventilation of heat transfer across air spaces was studied by Joy [8]. Joy showed that combinations of low-emittance surfaces and ventilation could result in significant improvement of thermal resistance in attic spaces. Joy’s work was reported in several editions of the ASHRAE Handbook of Fundamentals (HOF), including the 1989 edition [9]. Reflective insulation use in the UK was documented by Nash et al. [10] in a UK publication that included installation diagrams and design data. The use of reflective technology (primarily in attics as radiant barriers) was reviewed in 2012 by Medina [11]. Medina surveyed and tabulated results from field studies and laboratory research to characterize performance for various climate zones in North America. The results showed that the energy savings were greatest in climate zones 1–3, which are in the southern third of the United States [11].
Recently completed studies sponsored by the American Society for Heating, Refrigerating and Air-Conditioning Engineers (ASHRAE) on the impact of air intrusion on the thermal resistance of airspaces, including reflective insulation assemblies, established the potential for loss of thermal resistance [12,13]. The ASHRAE research report (1759-TRP) included estimates of the impact of air infiltration expressed in terms of air changes per hour (ACH) on the heat flux across a wall and the corresponding thermal resistances (R-values) for non-reflective enclosed cavities and reflective cavities (i.e., cavities with low-emittance surfaces). An example of results that were reported is shown in Table 1 to provide some insight for the impact of air infiltration on thermal performance. The R-value results were calculated for cavities with reflective insulation at an effective emittance (E) of 0.05 and without reflective insulation (E = 0.9). The R-values shown in Table 1 are for the case of no solar radiation on the exterior surface of the wall. The results provided in this table show the significance of air infiltration and the magnitude of thermal resistance of a reflective insulation application.
Table 1. An example showing the impact of air infiltration on thermal resistances of a wall cavity without solar radiation and subjected to horizontal heat flow.
ACHR-Value ** for Brick VeneerR-Value for Vinyl Siding
At E * = 0.9At E = 0.05At E = 0.9At E = 0.05
00.160.550.160.56
1000.050.350.150.50
2000.000.240.130.47
* E (effective emittance) = 1/(1/ε1 + 1/ε2 − 1), where ε1 and ε2 are the surface emittances [14]. ** R-values with units of m2∙K/W.
Reflective insulation assemblies are subjected to the same requirements as other types of building insulation (e.g., fiberglass batts, cellular plastic insulations, etc.). The region occupied by a reflective insulation assembly must be enclosed to prevent air infiltration [15]. The insulated region is taken to be enclosed when “located on the interior of the continuous air barrier and bounded on all sides by building components” [16]. It is interesting to note that when solar radiation is being absorbed on the exterior wall surface, air infiltration generally reduces the heat flow to the structure interior, and thus reduces the heat flux into the structure. This would result in enhancing the thermal performance of the structure under both transient and steady-state conditions. Note that the performance parameter of R-value for a building component must be calculated under steady-state condition, which is the case in this study, where the R-value can be expressed as follows: R v a l u e = T / e t o t ,   a v g , where T is the temperature difference between the average temperature of the exterior surface and interior surface, and e t o t ,   a v g is the total average energy flux on the exterior surface or on the interior surface. As provided in Appendix B, under steady-state condition and due to the energy conservation, the flux of the energy flow across the exterior surface must equal the flux of the energy flow across the interior surface.
Goss and Miller [17] observed the need for airspaces containing reflective insulation to be free of air infiltration and air movement between air layers present in multi-layer reflective assemblies. It was further emphasized that a reduction in R-value occurs when there is air intrusion into the reflective insulation assembly [17]. The contribution of the heat transfer by natural convection in a reflective insulation assembly is included in thermal results obtained by testing or computer simulation. An alternative method using an infrared thermographic system for evaluating convective transport coefficients from surface temperatures has been discussed by Rainieri et al. [18]. Their technique is an alternative to the method used in the present paper (using numerical modeling) that can be considered in future experimental studies. For heat transfer by radiation between large parallel planes, the view factor between the surfaces of these planes is considered to be equal to 1.0 [19,20]. In this case, the corresponding radiative heat flux, QRad, given by Equation (1), has been typically obtained by an application of the Boltzmann equation with effective emittance E representing the surface emittances, ε1 and ε2 [21].
QRad = E·σ·(TH4 − TL4),
where σ = 5.67 × 10⁻⁸ W/m2∙K4, T is the absolute temperature (K), TH is the hot surface temperature, TL is the cold surface temperature, and QRad is the radiative heat flux (W/m2). In the one-dimension method, the radiative component given by Equation (1) does not account for radiative exchange on all surfaces that bound the airspace.
Robinson and Powell used data from a set of 96 hot-box tests to obtain thermal resistances for five heat flow directions (up, down, horizontal, 45° up, and 45° down), which provided the basis for R-values for large parallel planes (see [22] for details of deriving the R-values from the test data). These R-values have been published in the ASHRAE Handbook—Fundamentals for many years [23,24]. The data set established by Robinson and Powell [22] was extended in 1990 at the Oak Ridge National Laboratory (ORNL) by an extensive set of hot-box tests completed and reported by Desjarlais and Tye that included multilayer reflective insulation assemblies [25]. The 1990 results agreed with the earlier U.S. National Bureau of Standards (NBS) data and provided direct measurement of 98 reflective assemblies to obtain R-values for regions with up to four airspaces in series. The authors of the ORNL report [25] noted that there was a need to include airspace aspect ratio as an important variable for determining the R-values of enclosed airspaces. Detailed results showing the impact of the aspect ratio on thermal resistance are also available in previous studies for the case without air intrusion or infiltration [15,26]. The novelty in this study is to investigate the impact of the aspect ratio on the R-values for reflective assemblies with the full range of effective emittance (E from 0 to 0.82) for the case with air intrusion, including infiltration or wind washing.
Evaluations of the thermal performance of reflective insulation assemblies have focused on parallel planes with heat flow in one dimension, as described above. This is widely used in handbook data [24] and those obtained by test facilities in North America, for example, based on ASTM C1363 [27]. The report by Robinson et al. [28] recognized a need for evaluation of heat transfer between non-parallel surfaces and included a computational procedure in Building Materials and Structures Report 152. In this report, the thermal resistances are reported for wedge-shaped airspaces contained in 85.7 mm thick airspace for five heat flow directions of up, down, horizontal, 45° up, and 45° down. The results provided in this report showed that the R-value for wedge-shaped airspaces was observed to be the most significant for heat flow down. However, the impact of non-uniform airspace thickness on R-values was smaller, with heat flow up being almost negligible [28]. The International Standard ISO 6946 includes an Annex with instructions for calculating the thermal transmittance (U-value, which is 1/R-value) of tapered layers and the total thermal resistance for a building assembly with tapered layers [29]. Furthermore, a previous study by the authors of this paper was conducted to determine the R-values for non-parallel surfaces at various values of effective emittance [15].
The hot-box data used to establish the R-value found in handbooks were obtained with test specimens with an aspect ratio of ~17.8 for the case of 85.7 mm thick airspaces that were 1524 mm long and 813 mm wide. However, the effect of the aspect ratio on the R-value is not included in the handbook tables that are commonly used. Aspect ratio was varied and reported in a major experimental project conducted by Tye and Desjarlais [25]. The impact of aspect ratio on the R-values of airspaces without air intrusion is significant [15,26] and will be demonstrated in this paper for the case with air intrusion due to infiltration or wind washing.
Reflective insulation assemblies have entered the stream of commerce with an ASTM product specification [30], standards published by the International Standards Organization (ISO) [29], and National Standards from, for example, South Africa, Malaysia, and Australia [31,32,33]. Reflective insulation technology is now entering a new era with advanced modeling that provides numerical evaluation of heat transport for the three modes of heat transfer: conduction, convection, and radiation exchange on all surfaces of the enclosure. In addition, there are computational procedures for enclosed airspace thermal resistance published by the International Standards Organization (ISO 6849) [29] and national standards such as the AUS/NZ standard 4859 [34]. Calabrese et al. [35] used thermal modelling to study intumescent coatings intended for fire protection, thus avoiding the expense and time associated with direct measurements. Their work precedes the present paper that uses modelling rather than time-consuming and expensive guarded hot box testing to evaluate the thermal performance of enclosed reflective airspaces. As provided in the next section, however, guarded hot box test results were used to benchmark the numerical model that is used in this study.
This introductory section is provided to encourage the reader to accept the need to extend understanding of the thermal resistance of enclosed airspaces to include non-parallel surfaces and the impact of practical imperfections in application on the performance on reflective and non-reflective airspaces. This study provides scenarios of evaluations that can now be performed for reflective insulation assemblies of different aspect ratios when these assemblies are subjected to air intrusion (infiltration or wind washing) of different exterior air temperatures at various ACH values. The novelty of this study is the evaluation of the thermal performance of reflective insulation assemblies of various dimensions and properties with air intrusion characterized by air changes per hour, exterior air temperatures, and temperature of the insulation assembly. Since the focus of this is under steady-state condition, the predicted thermal performance data are used to determine R-values and the reductions in these values due to air intrusion. To the best of our knowledge, there is no study available that shows quantitative reductions in the performance of reflective insulation assemblies due to air infiltration or wind washing. The model that is used in this study was published in previous publications and briefly described next.

2. Numerical Model Descriptions and Validations

The numerical model used in this research simultaneously solves the energy equation, surface-to-surface radiation equation, and the momentum equation for a compressible fluid in reflective insulation assemblies of different dimensions with and without air intrusion when they are subjected to various operating conditions of the exterior air entering the assemblies. These equations are given in Appendix B.1. For building components with reflective insulations, this model was previously validated by comparing its predictions with experimental data that were obtained using a guarded hot box (GHB) in accordance with ASTM C1363 [27] and a heat flow meter in accordance with the ASTM C518 [36] (e.g., see [26,37]). As an example from the previous validations, the measured R-value using GHB for above-grade wall system with reflective insulation installed in furred-air assembly was compared with the model prediction. The result showed that the predicted R-value was in good agreement with the measured R-value to within 1.2% [37].

2.1. Descriptions of the Cases Used for Model Validations and Sensitivity Analyses

In this study, another example for validating the model is provided by comparing its predictions for the R-values of horizontal single- and double-enclosed airspaces with heat flow up and down (the case for roof applications), and vertical single- and double-enclosed airspaces with horizontal heat flow (the case for wall applications), with laboratory test data from the U.S. National Bureau of Standards for the thermal resistance of enclosed airspaces that are provided in Housing Research Paper 32 (HRP 32) [22]. The HRP 32 data that was obtained using hot box in accordance with ASTM C236 [38] have been the basis for handbook R-values of reflective enclosed airspaces for five decades. Figure 1 and Figure 2 show comparisons of the predicted R-values with R-values from HRP 32 [22] for horizontal heat flow across a single-enclosed airspace (Figure 1) and across a double-enclosed airspace containing two equal-size reflective airspaces (Figure 2). The total distance across the enclosed airspace (D) in the direction of heat flow is 88.9 mm in both cases. In these airspaces, the hot side temperature (TH) and the cold side temperature (TL) are 32.2 °C and 15.6 °C, respectively. Additionally, the airspace aspect ratios (AR = H/D) for the simulations are the same as the aspect ratios of the test specimens reported in HRP 32 [22]. The results provided in Figure 1 are based on the data for an enclosed reflective airspace of 813 mm long (i.e., aspect ratio of 9.14), whereas the results shown in Figure 2 are for the same enclosure as in Figure 1 but with two airspaces of equal size in series (i.e., aspect ratio of 18.29).
For given operating conditions (TH and TL) and dimensions (D and H) of enclosed airspaces in the absence of heat transfer by convection, the R-values (i.e., due to heat transfer by conduction and radiation) of these airspaces must be the same for various orientations and heat flow directions. Like many other heat transfer systems, the effect of gravity due to the system orientation plays an important role in determining the contribution of the convective heat transfer (e.g., see the study by Pagliarini et al. [39]). In this study, however, not only the orientation but also the heat flow direction in reflective insulation systems would cause significant effects on the contribution of the convective heat transfer in these assemblies. To investigate the sensitivity of convective heat transfer on the R-value at effective emittance of 0.05, as an example, the temperature and resultant velocity distributions in vertical single-enclosed airspace with horizontal heat flow are provided in Figure 1a. The corresponding results for vertical double-enclosed airspace with heat flow horizontal are shown in Figure 2a. To provide a comprehensive sensitivity analysis, the temperature and resultant velocity distributions in horizontal single- and double-enclosed airspaces with heat flow up and down are provided in Figure 3a–d. The corresponding model R-values for single- and double-enclosed airspaces of different orientations and heat flow directions at E = 0.05 are also provided in these figures.
Due to the effect of gravity as a result of airspace orientation (θ), the contribution of heat transfer by convection depends on two parameters, namely (a) the magnitude of air velocity (V) and (b) the number of convection loops formed in the airspace (N). For the same air velocity, an increase in the number of convective loops results in an increase in the thermal conductance of the airspace, which leads to obtaining a lower R-value. In addition, for the same number of convection loops, an increase in air velocity increases the thermal conductance, resulting in obtaining a lower R-value. An example of the latter scenario is represented by vertical airspace with horizontal heat flow in which N is equal to one for various operating conditions, whereas the magnitude of air velocity increases by increasing the temperature difference across the airspace (see Figure 1a and Figure 2a).
For single-enclosed airspaces of the same dimensions at E = 0.05, the maximum resultant velocities and the area-weighted average velocities, respectively, are 182 mm/s and 47.5 mm/s for vertical airspace with horizontal heat flow in which N = 1 (Figure 1a), 129 mm/s and 60.5 mm/s for horizontal airspace with heat flow up in which N = 6 (Figure 3a), and only 20.5 mm/s and 1.6 mm/s for horizontal airspace with heat flow down in which N = 2 (Figure 3c). The coupled effect of the two parameters V and N mentioned above has resulted in calculated R-values for single-enclosed airspace of 0.47 m2·K/W (for θ of 90° with heat flow horizontal, Figure 1a), 0.37 m2·K/W (for θ of 0° with heat flow up, Figure 3a), and 1.36 m2·K/W (for θ of 0° for heat flow down, Figure 3c). Thus, the sensitivity of the effect of the gravity effect due to airspace orientation and the heat flow direction results in the R-value for heat flow down being 2.9 times the R-value for heat flow horizontal and 3.7 times the R-value for heat flow up.
For double-enclosed airspaces of the same dimensions at E of 0.05, the maximum resultant velocities and the area-weighted average velocities, respectively, are 119.5 mm/s and 52.6 mm/s in the left airspace, and 120 mm/s and 53.1 mm/s in the right airspace (for the case of θ = 90°, heat flow horizontal, and N = 1 in each airspace, Figure 2a), 60.3 mm/s and 30.5 mm/s in the top airspace, 56.8 mm/s and 29.7 mm/s in the bottom airspace (for the case of θ = 0°, heat flow up, and N = 20 and 18, respectively, in the top and bottom airspaces, Figure 3b), only 10.0 mm/s and 1.0 mm/s in the top airspace, and 9.8 mm/s and 1.0 mm/s in the bottom airspace (for the case of θ = 0°, heat flow horizontal, and N = 2 in each airspace, Figure 3d). In addition, the coupled effect of the parameters V and N has resulted in R-values for double-enclosed airspace of 0.99 m2·K/W (for θ of 90° with horizontal heat flow, Figure 2a), 0.70 m2·K/W (for θ of 0° with heat flow up, Figure 3b), and 2.07 m2·K/W (for θ of 0° for heat flow down). Consequently, the sensitivity of the effect of the gravity effect due to orientation and heat flow direction has resulted in the R-value for heat flow down being 2.1 times the R-value for horizontal heat flow and 3.0 times the R-value for heat flow up. In closing, the effect of gravity due to orientation and heat flow direction on the R-value of reflective insulation assembly is significant.

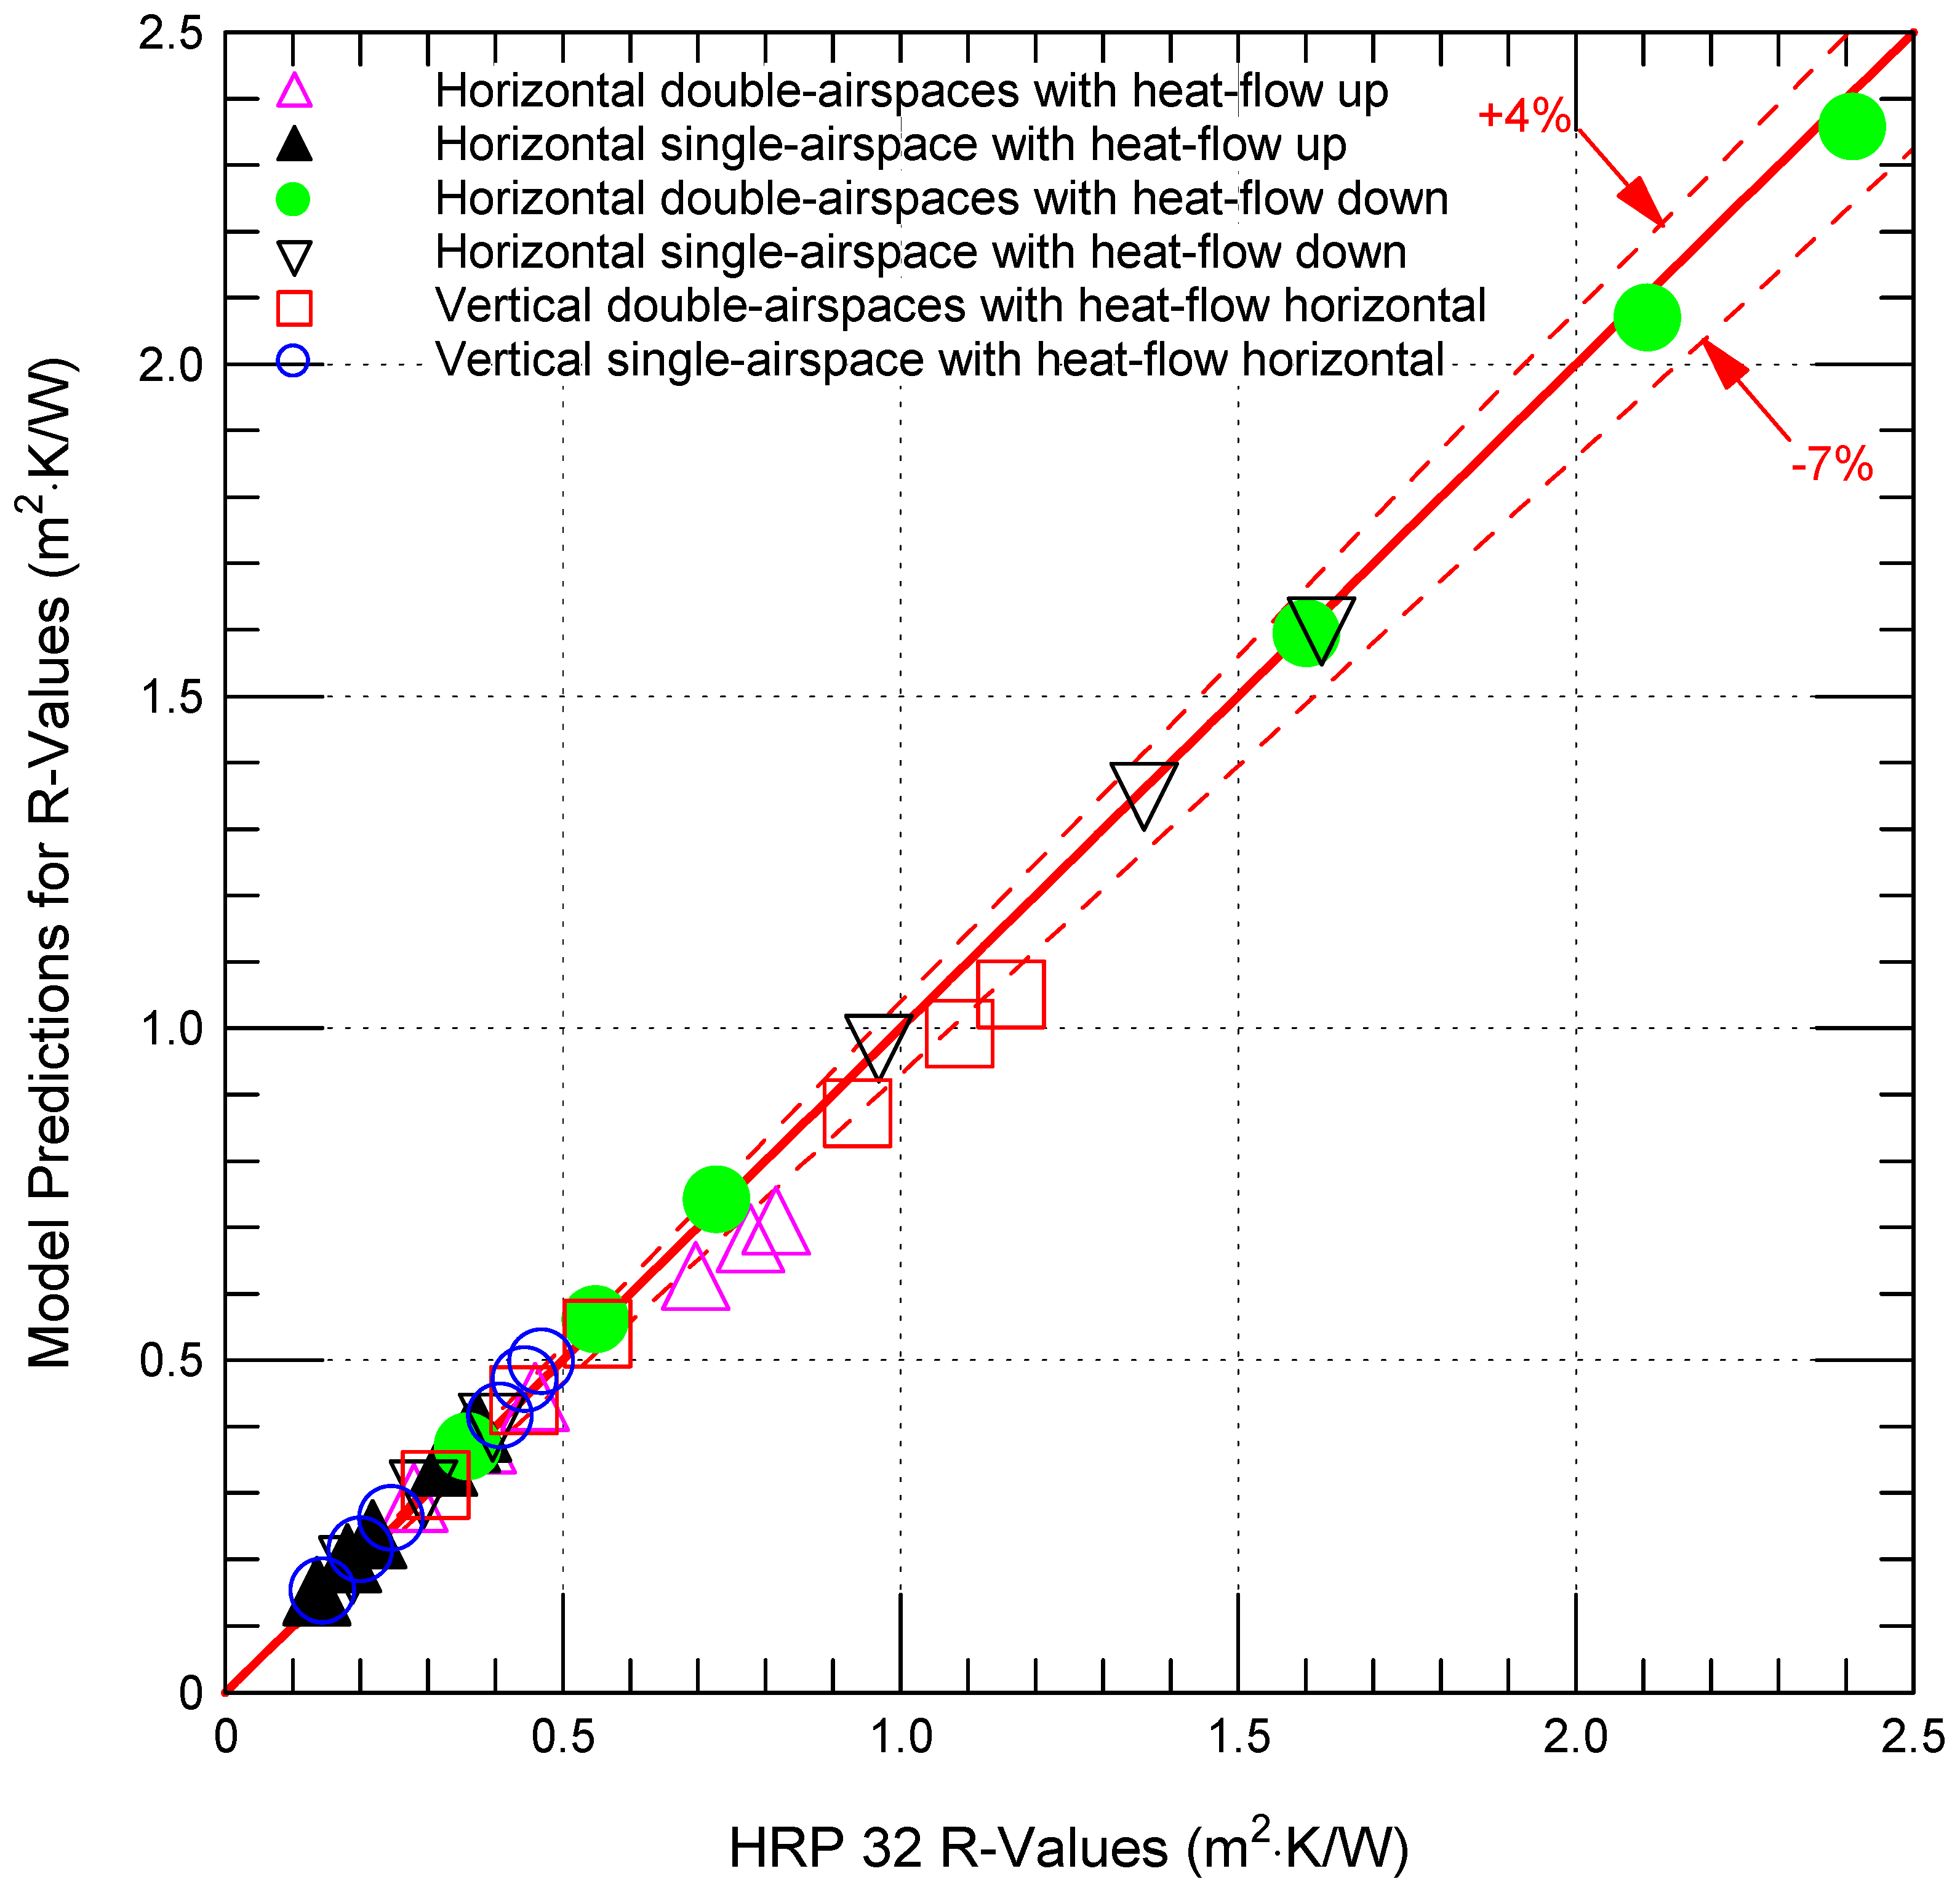
2.2. Comparisons of Model Predictions with Test Data

For a wide range of effective emittance (0 to 0.82), the blue curves in Figure 1b and Figure 2b represent the model predications for the R-values, and the symbols represent the test R-values [22]. Figure 1a and Figure 2b, respectively, show agreement between the simulation results and hot box test results for the assemblies of single-enclosed airspace and double-enclosed airspace. Additionally, for single- and double-enclosed airspaces with a wide range of effective emittance and subjected to three typically considered heat flow directions (up, down, and horizontal), Figure 4 shows comparisons of the model predictions for the R-values with the HRP 32 R-values [22]. As shown in this figure, the majority of the data for the six sets of simulations agreed with test results to within −7% to +4% for the range of the measured R-values from ~0.2 to 2.5 m2·K/W.
Note that the HRP 32 data set (used to benchmark the present model) that has been widely used in the past to evaluate reflective insulation assemblies was developed in the 1950s [22]. This data set is based on hot box data in accordance with ASTM C236 [38]. The results of the laboratory testing were represented in figures showing correlations based on dimensionless groups. Nevertheless, these data have been used for decades to characterize the thermal performance of enclosed reflective air spaces. Modern hot box data in accordance with ASTM C1363 [27] yields results with measurement uncertainty of around 10% based on the complexity of the test specimen. Specimens for hot box testing are typically large sections of building materials subject to variabilities of construction.
Given the above observations and extensive experience in the area of thermal testing, 7% difference between the data based on hot box testing and the present model predictions, as shown in Figure 4, is judged as good. Thus, this multi-dimensional model was used with confidence to assess the performance of reflective insulation assemblies with air intrusion, including air infiltration or wind washing, when these assemblies are subjected to different conditions. By using thermographic acquisitions to estimate the heat flux, Pagliarini et al. [39] have discussed the organization and analysis of a similar complex multi-dimensional heat transfer system in which its performance, provided in terms of thermal resistance, depends on several parameters (e.g., orientations to account for the effect of gravity, pressure, temperature, fluid properties, heat input, etc.).

2.3. Performance Assessment of Reflective Insulations Using the Model

As provided in [40] for various airspace parameters including thicknesses (D), aspect ratios (AR), average temperatures (Tavg), temperature differences (ΔT), and effective emittances (E), the present model was used to develop practical correlations for determining the R-values as functions of these parameters for vertical enclosed airspaces (θ = 90°) with horizontal heat flow, horizontal enclosed airspaces (θ = 0°) with heat flow up and down, 45° sloped airspaces with heat flow up and down, and 30° sloped airspaces with heat flow up and down. Additionally, the model has been used to develop and design an optimization tool called the “Reflective Airspace Tool” for use by the technical community to determine thermal resistances for a variety of unventilated/enclosed airspaces with different dimensions, orientations, effective emittances, and operating conditions [41]. For non-rectangular airspaces, the model was used to assess the performance of an attic radiant barrier with surfaces of difference emittances [15]. The numerical model has been used previously [15] to evaluate the impact of non-parallel surfaces on the thermal performance of reflective insulations assemblies, where these types of assemblies could result from product design or careless installation. In addition, it was used to quantify the reduction in the thermal performance due to imperfect installations, including internal defects in multilayer reflective systems that result in airflow between the layers of reflective insulation assemblies, subjected to various conditions [15].
R-values for reflective insulation assemblies are currently being measured using the standard test methods such as the guarded hot box in accordance with the standard test method ASTM C1224 for specimens of large sizes [30] and heat flow meter apparatus in accordance with the standard test method ASTM C518 for specimens of small sizes [36]. The measured R-values are reported at isothermal conditions for both the hot surface at a temperature TH and the cold surface at a temperature TL despite the fact that the temperatures of these surfaces are not uniform. It is important to point out that most of the thermal resistances of enclosed airspaces (if not all, to the best of our knowledge) that are available in the literature and handbooks (including this study) are given in terms of constant hot surface temperature TH and constant cold surface temperature TL (i.e., isothermal conditions on both the hot and cold surfaces). In practical building applications, however, the hot and cold surfaces are not isothermal. Thus, the question is raised: is it a good assumption to use the isothermal conditions on both the hot and cold surfaces for determining/reporting the R-value of enclosed airspaces for different building applications? Most recently, the present model was used to answer this question [42]. Results showed that the use of isothermal airspace surfaces of different orientations and heat flow directions to report the R-values is a good assumption (within ± 3%, see [42]).
Several studies have been conducted about the airflow behavior in enclosed airspaces [26,43]. However, research to investigate the thermal performance of airspaces with air intrusion either due to infiltration or wind washing is still lacking. In particular, the R-values of reflective insulation assemblies of various effective emittances with air intrusion have not been identified in the previous studies due to the lack in thermal performance data and test methods that allow introducing air intrusion into the assemblies. Thus, for reflective insulation assemblies of different dimensions and effective emittances, the objectives of this study are to use this model to: (1) quantify the R-values’ sensitivity to the air intrusion rate in terms of air changes per hour (ACH) for both infiltration and wind washing conditions of various exterior air temperatures (Tair), and (2) investigate the R-values’ sensitivity to the airspace aspect ratio at different air intrusion conditions (i.e., wide ranges of ACH and Tair).

3. Parameters of the Simulated Cases
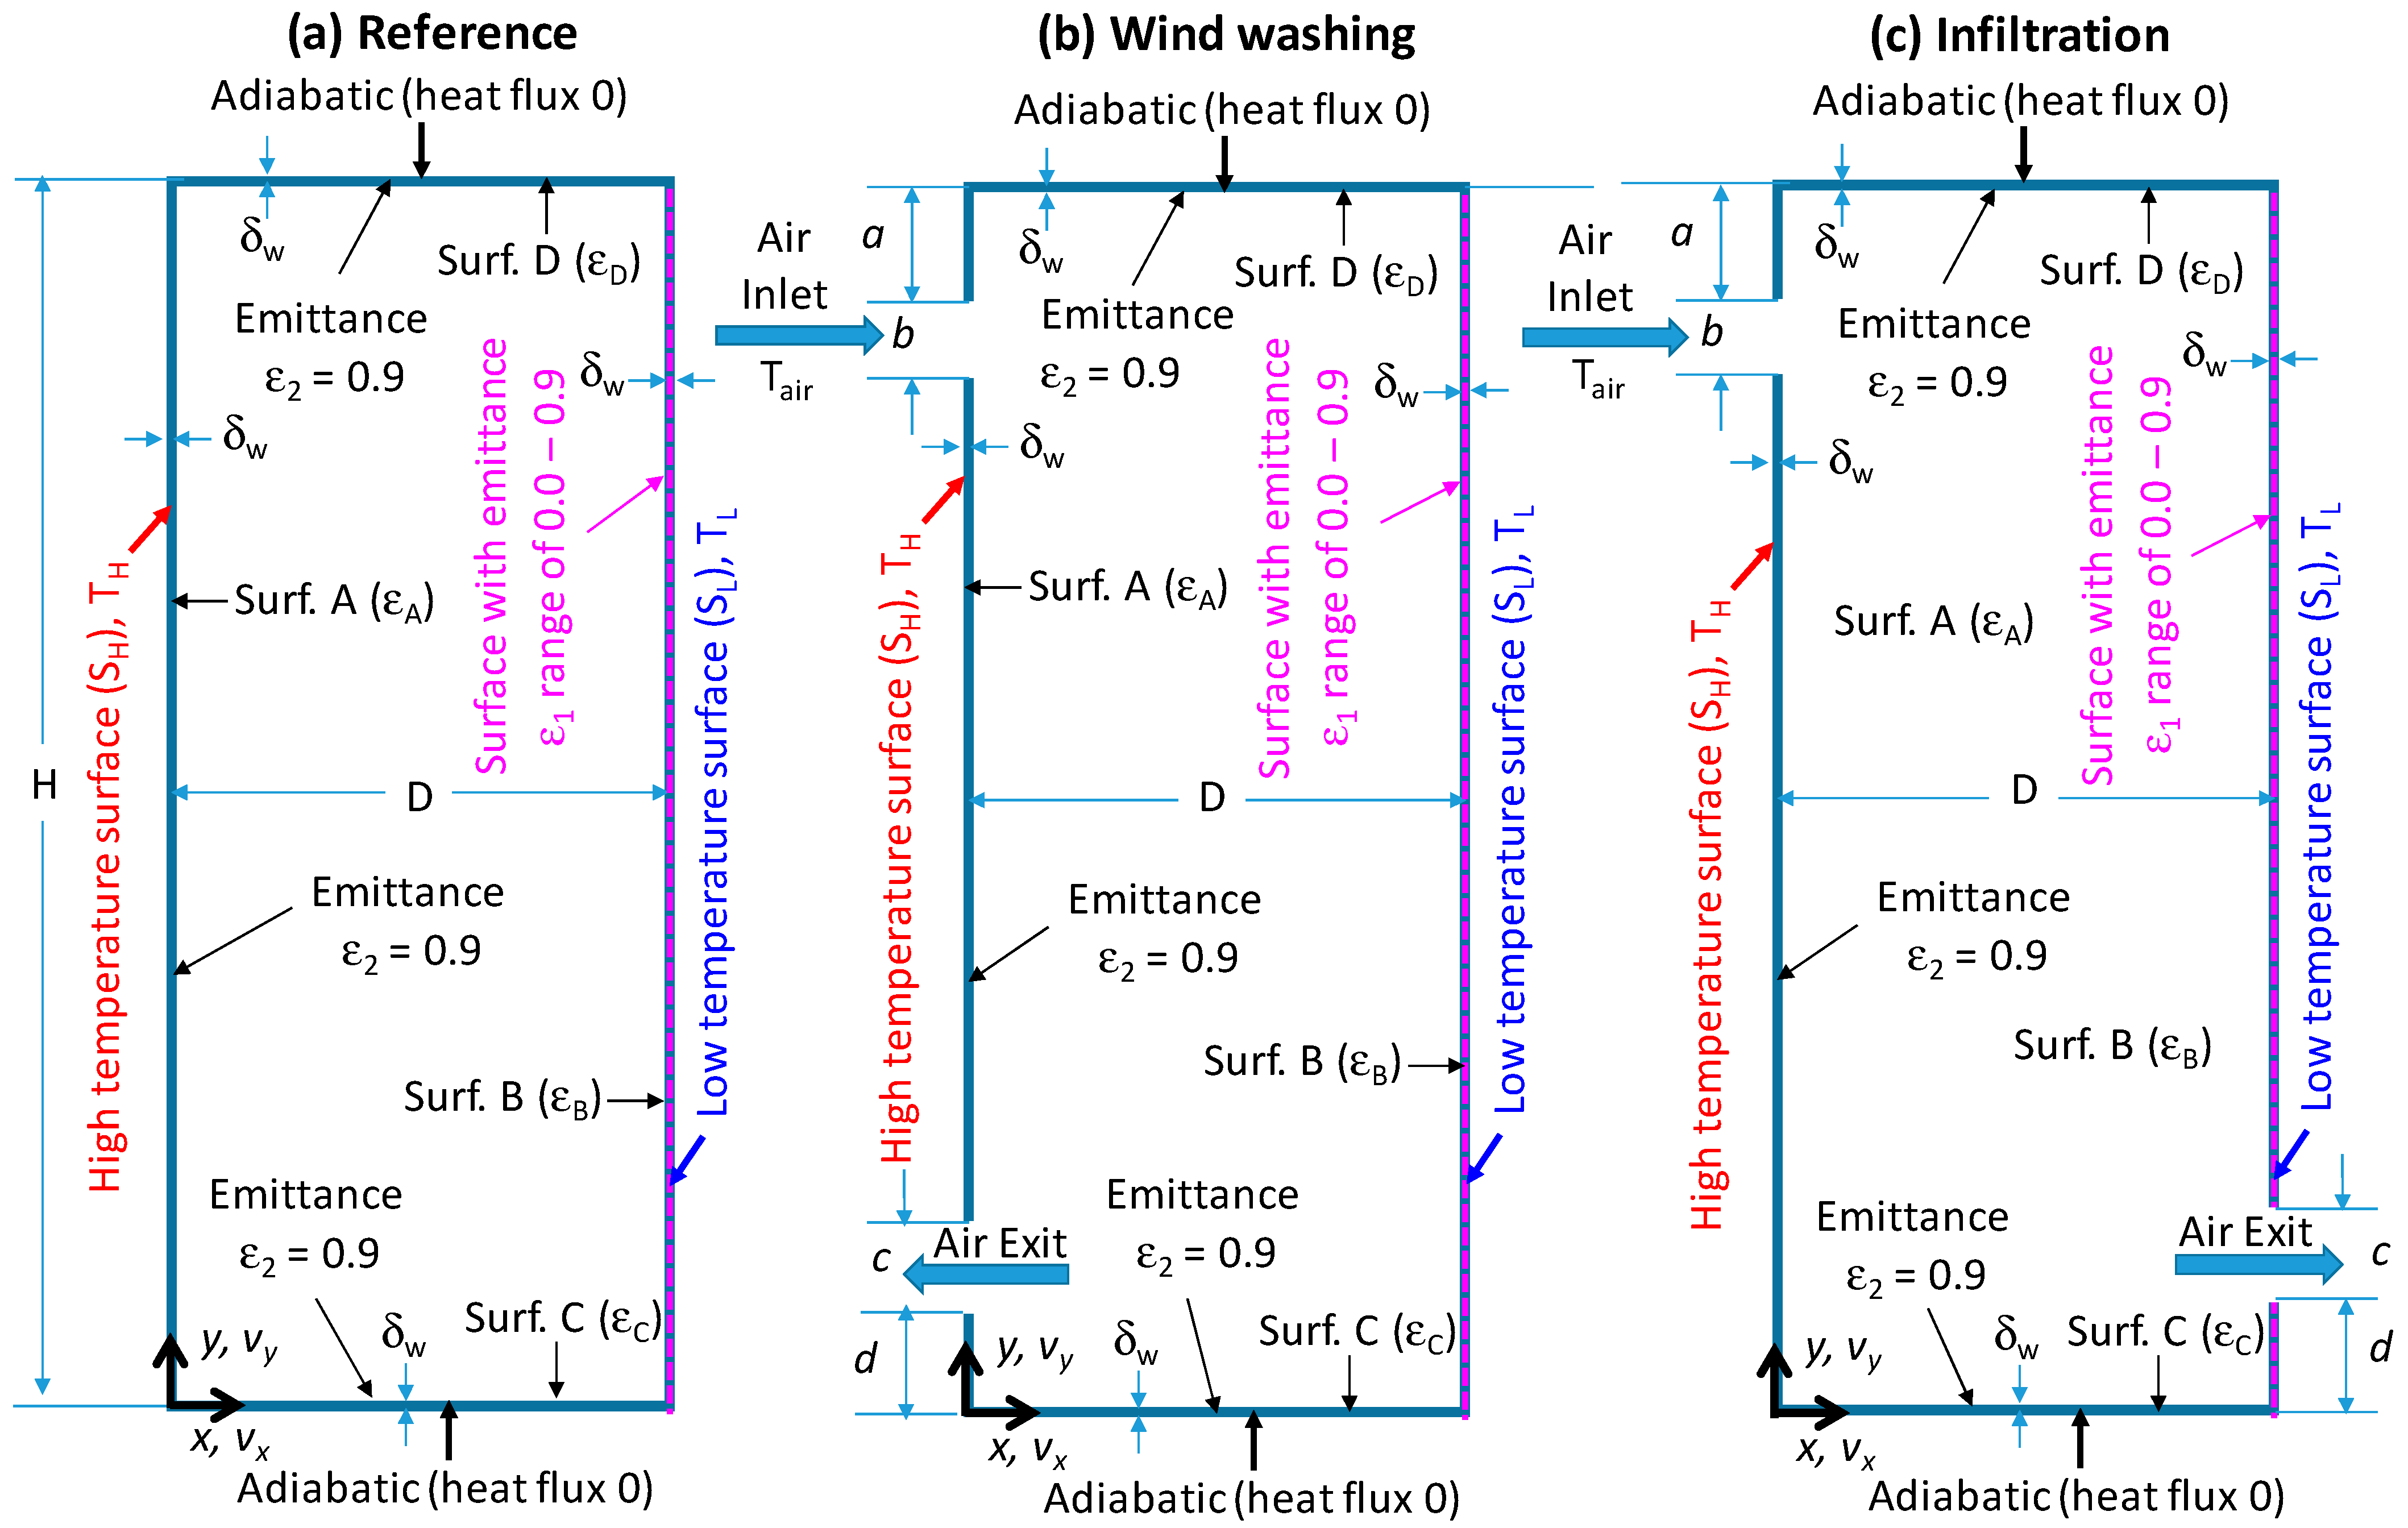
In this study, the intrusion of exterior air with a temperature Tair into a reflective insulation assembly has been simulated. Three cases for reflective insulation assemblies with various aspect ratios were considered. These cases are:
(a)
Reflective insulation assembly with no air intrusion, called “Reference”, which is shown in Figure 5a.
(b)
Reflective insulation assembly with wind washing in which the exterior air enters the assembly through an opening “b” of 6.4 mm located on the top-left of the assembly and exits through an opening “c” of 6.4 mm located at the bottom-left of the assembly (Figure 5b).
(c)
Reflective insulation assembly with infiltration in which the exterior air enters the assembly through an opening “b” of 6.4 mm located on the top-left of the assembly and exits through an opening “c” of 6.4 mm located at the bottom-right of the assembly (Figure 5c).
As indicated earlier, the R-values of such an assembly must be determined under steady-state condition. Therefore, all numerical simulations were conducted under steady-state condition, in which the air intrusion rate from the exterior into a reflective insulation assembly must equal the air expelled rate to the exterior for the case of wind washing and to the interior for the case of air infiltration. This is due to the conservation of mass (see Appendix B). In addition to the information provided in Figure 5 for the cases (a), (b), and (c), the momentum equation of the air filling the reflective insulation assemblies is subjected to no-slip condition on all surfaces that bound the airspace. To solve the energy equation for horizontal heat flow that represents using reflective insulation in wall systems, the left sides of the assemblies are assigned a high temperature (TH) of 32.2 °C, whereas the right sides of the assemblies are assigned a low temperature (TL) of 15.6 °C. The top and bottom surfaces of the assemblies are taken to be adiabatic. Additionally, the surface-to-surface radiation equation is subjected to a wide range of emittance ε1 (0.0–0.9) on the right surface, and emittance ε2 of 0.9 on the top, bottom, and left surfaces [24]. Note that the details of the boundary conditions that were used in this study along with the procedure of calculating the R-values from the numerical results are available in Appendix B.2.
The ultimate goal of this research study is to investigate the sensitivities of different parameters on the thermal performance of reflective insulation assemblies. To show the effect of the aspect ratio, AR = H/D (where H is the assembly dimension perpendicular to the heat flow direction, and D is the assembly dimension parallel to heat flow direction as shown in Figure 5), on the R-values of the reference case (Figure 5a), wind washing case (Figure 5b), and infiltration case (Figure 5c), two H values (508 mm and 2324 mm) and two D values (38.1 mm and 88.9 mm) were considered. These represent aspect ratios of 13.3 and 61.0 for the case of D = 38.1 mm and aspect ratios of 5.7 and 26.1 for the case of D of 88.9 mm. Additionally, three values of exterior air temperature Tair of 26.7 °C (lower than the hot-side temperature), 32.2 °C (equal to the hot-side temperature), and 37.8 °C (higher than the hot-side temperature) were used to show the effect of Tair on the R-values for the cases of wind washing and infiltration.
For a given environmental condition, the value of the ACH depends mainly on the wind speed and its direction. The expression for ACH can be given as:
A C H = Q ˙ V
In Equation (2), Q ˙ is the volumetric flow rate of the air entering the reflective insulation assembly in the opening located on the top-left, and V is the volume of the reflective insulation assembly. Using the dimensions of the reflective insulation assembly shown in Figure 5 and Equation (2), the mean inlet velocity of the exterior air v ¯ i n to the assembly can be expressed as:
v ¯ i n = A C H × D × H / b .
As per the review study by Rahiminejad and Khovalyg [44], the ACH values found in the literature are either directly reported in ACHs or converted to ACHs based on reported air velocity values. It is important to point out that for the same ACH value as per its definition provided in Equation (2), the volumetric flow rate of the air entering the reflective insulation assembly is greater for the assembly of larger length (H) and for the assembly of larger thickness (D). For example, for the same ACH and H, the volumetric flow rate of the air entering the reflective insulation assembly with D of 88.9 mm is 2.333 times that for D of 38.1 mm. Additionally, for the same ACH and D, the volumetric flow rate of the air entering the reflective insulation assembly with H of 2324 mm is 4.575 times that for H of 508 mm. As such, to investigate the effect of the aspect ratio on the R-value of the reflective insulation assembly, comparisons for the R-values of different aspect ratios are conducted in this study for two cases: (a) at the same value of ACH, and (b) at same value of the volumetric flow rate of the air entering the assembly ( Q ˙ ). The results of the numerical simulations for these two cases are discussed next. The sensitivities of different parameters including D, H, E, AR, ACH, and Tair, on the R-values of reflective insulation assemblies without and with air intrusion due to infiltration or wind washing are discussed next.

4. Results and Discussions

The results presented in this section are for reflective insulation assemblies of various dimensions at a hot-side temperature (TH) of 32.2 °C and cold-side temperature (TL) of 15.6 °C. Air change per hour (ACH) values of 0, 25, 50, and 100 with air intrusion temperatures of 26.7 °C (<TH), 32.2 °C (=TH), and 37.8 °C (>TH) were simulated to show the effect of air intrusion on the R-value for two cases. The first case represents the wind washing condition (Figure 5b), while the second case represents the infiltration condition (Figure 5c). To focus in this section on the effect of air intrusion on the R-values of reflective insulation assemblies, a set of figures (Figure A1, Figure A2, Figure A3, Figure A4, Figure A5, Figure A6, Figure A7 and Figure A8) showing details related to the temperature distribution and the velocity distribution of the air inside the assemblies is provided in Appendix A.
Figure A1, Figure A2, Figure A3, Figure A4, Figure A5, Figure A6, Figure A7 and Figure A8 show the impact of air intrusion from the exterior side with a temperature TH of 32.2 °C into a reflective insulation assembly with interior side temperature TL of 15.6 °C with an equal amount of air expelled to the interior side for the case of infiltration (see Figure A1 and Figure A2 for assembly of D = 38.1 mm, and Figure A5 and Figure A6 for assembly with D = 88.9 mm) and to the exterior side for the case of wind washing (see Figure A3 and Figure A4 for assembly of D = 38.1 mm, and Figure A7 and Figure A8 for assembly with D = 88.9 mm). At E = 0.05, Figure A1, Figure A2, Figure A3, Figure A4, Figure A5, Figure A6, Figure A7 and Figure A8 show the resultant air velocity and temperature distributions, where the air intrusion from the exterior side at Tair of 26.7 °C (<TH), 32.2 °C (=TH), and 37.8 °C (>TH) causes a disturbance of the convective transport in the reflective insulation assembly that is further altered thermally by the difference in temperature between the exterior air and the reflective assembly temperature.

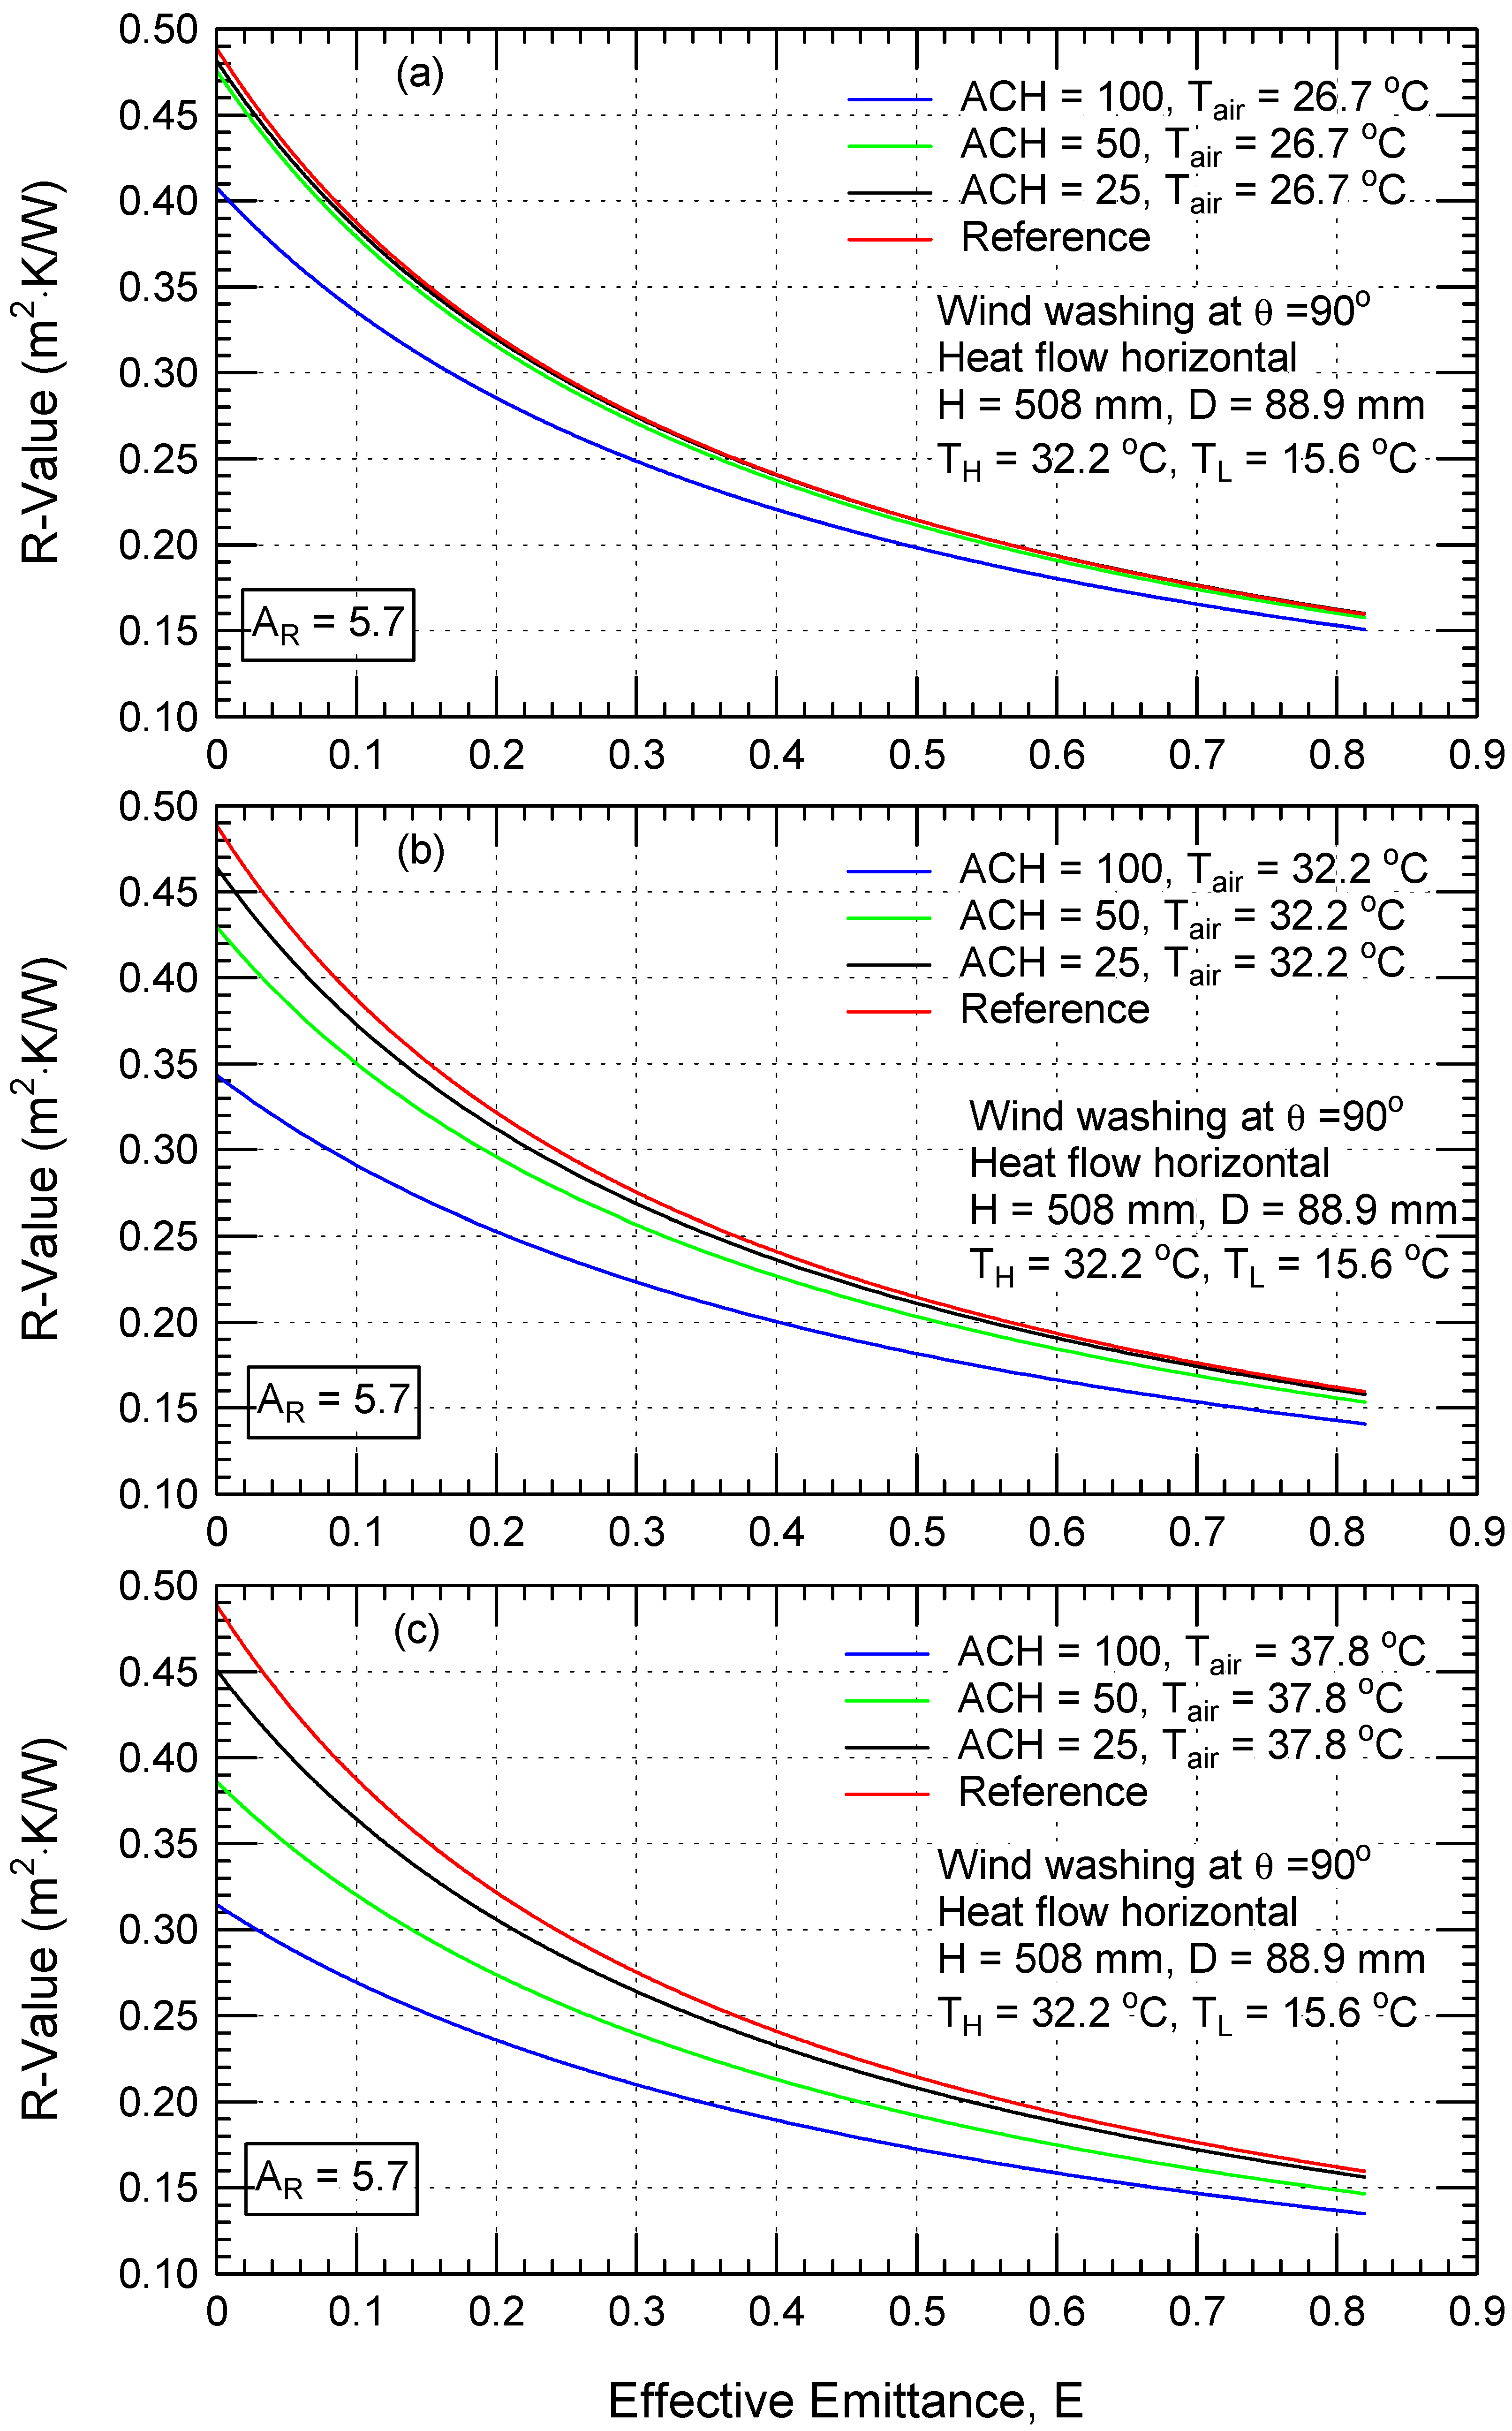
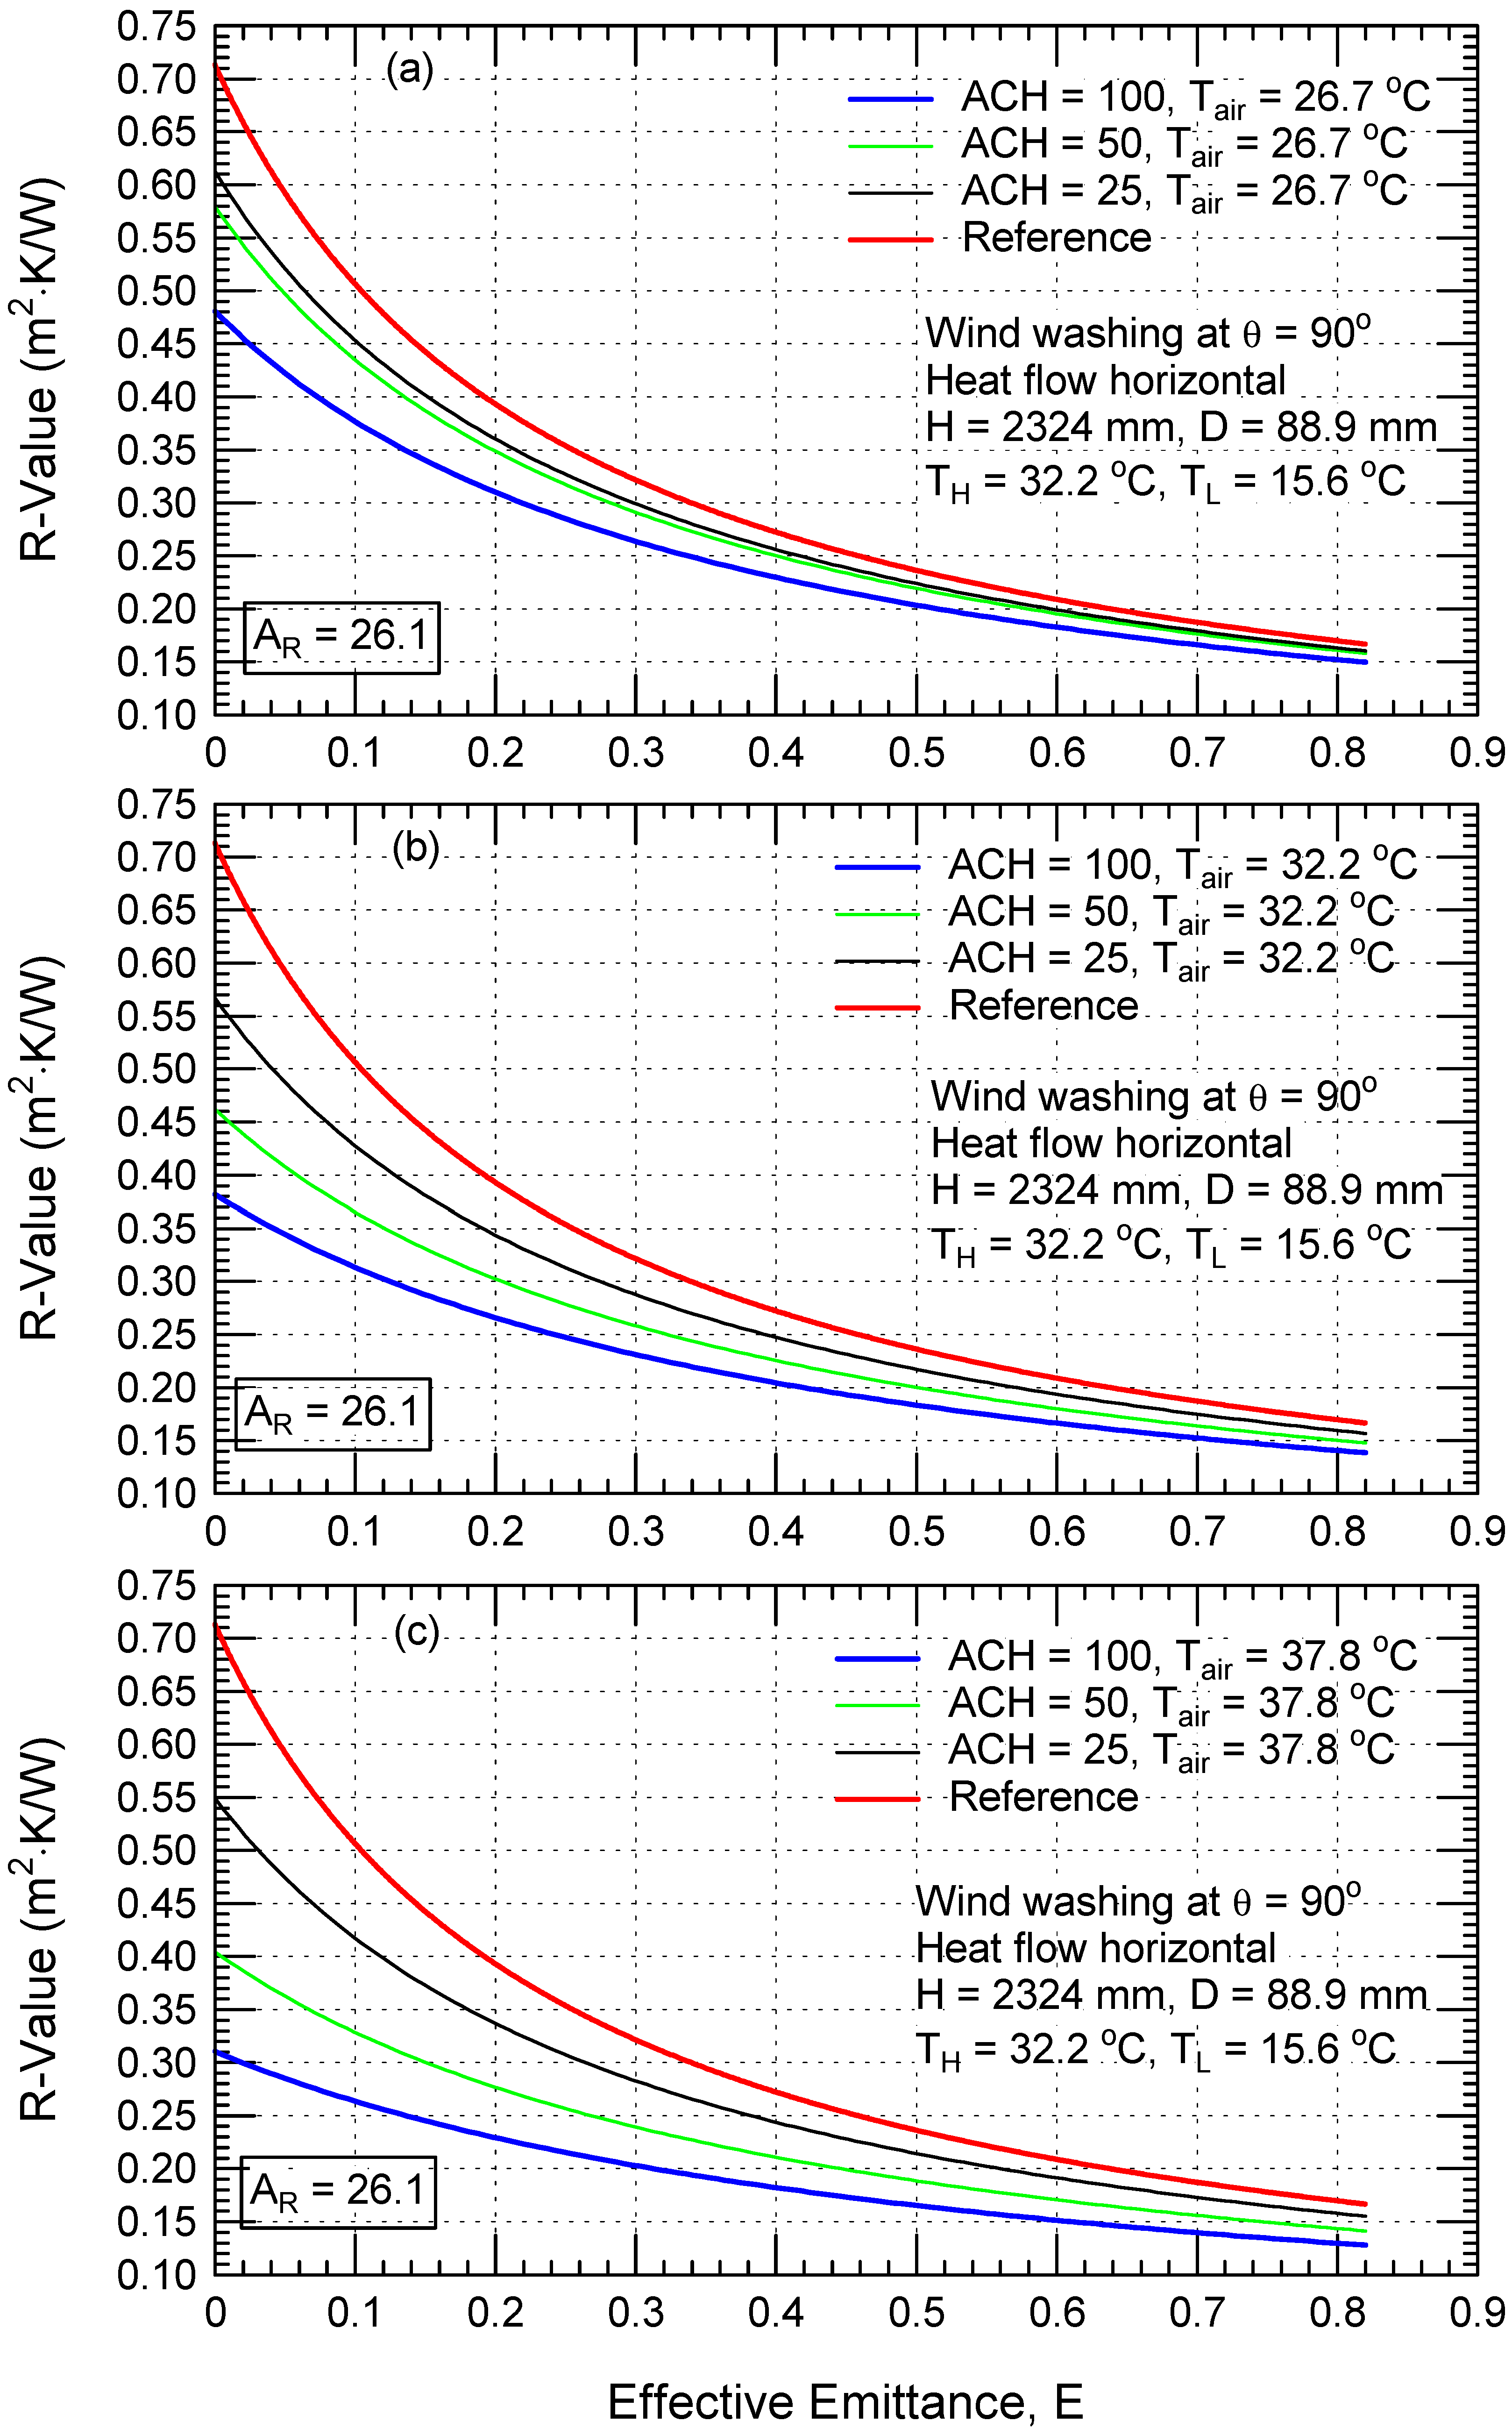
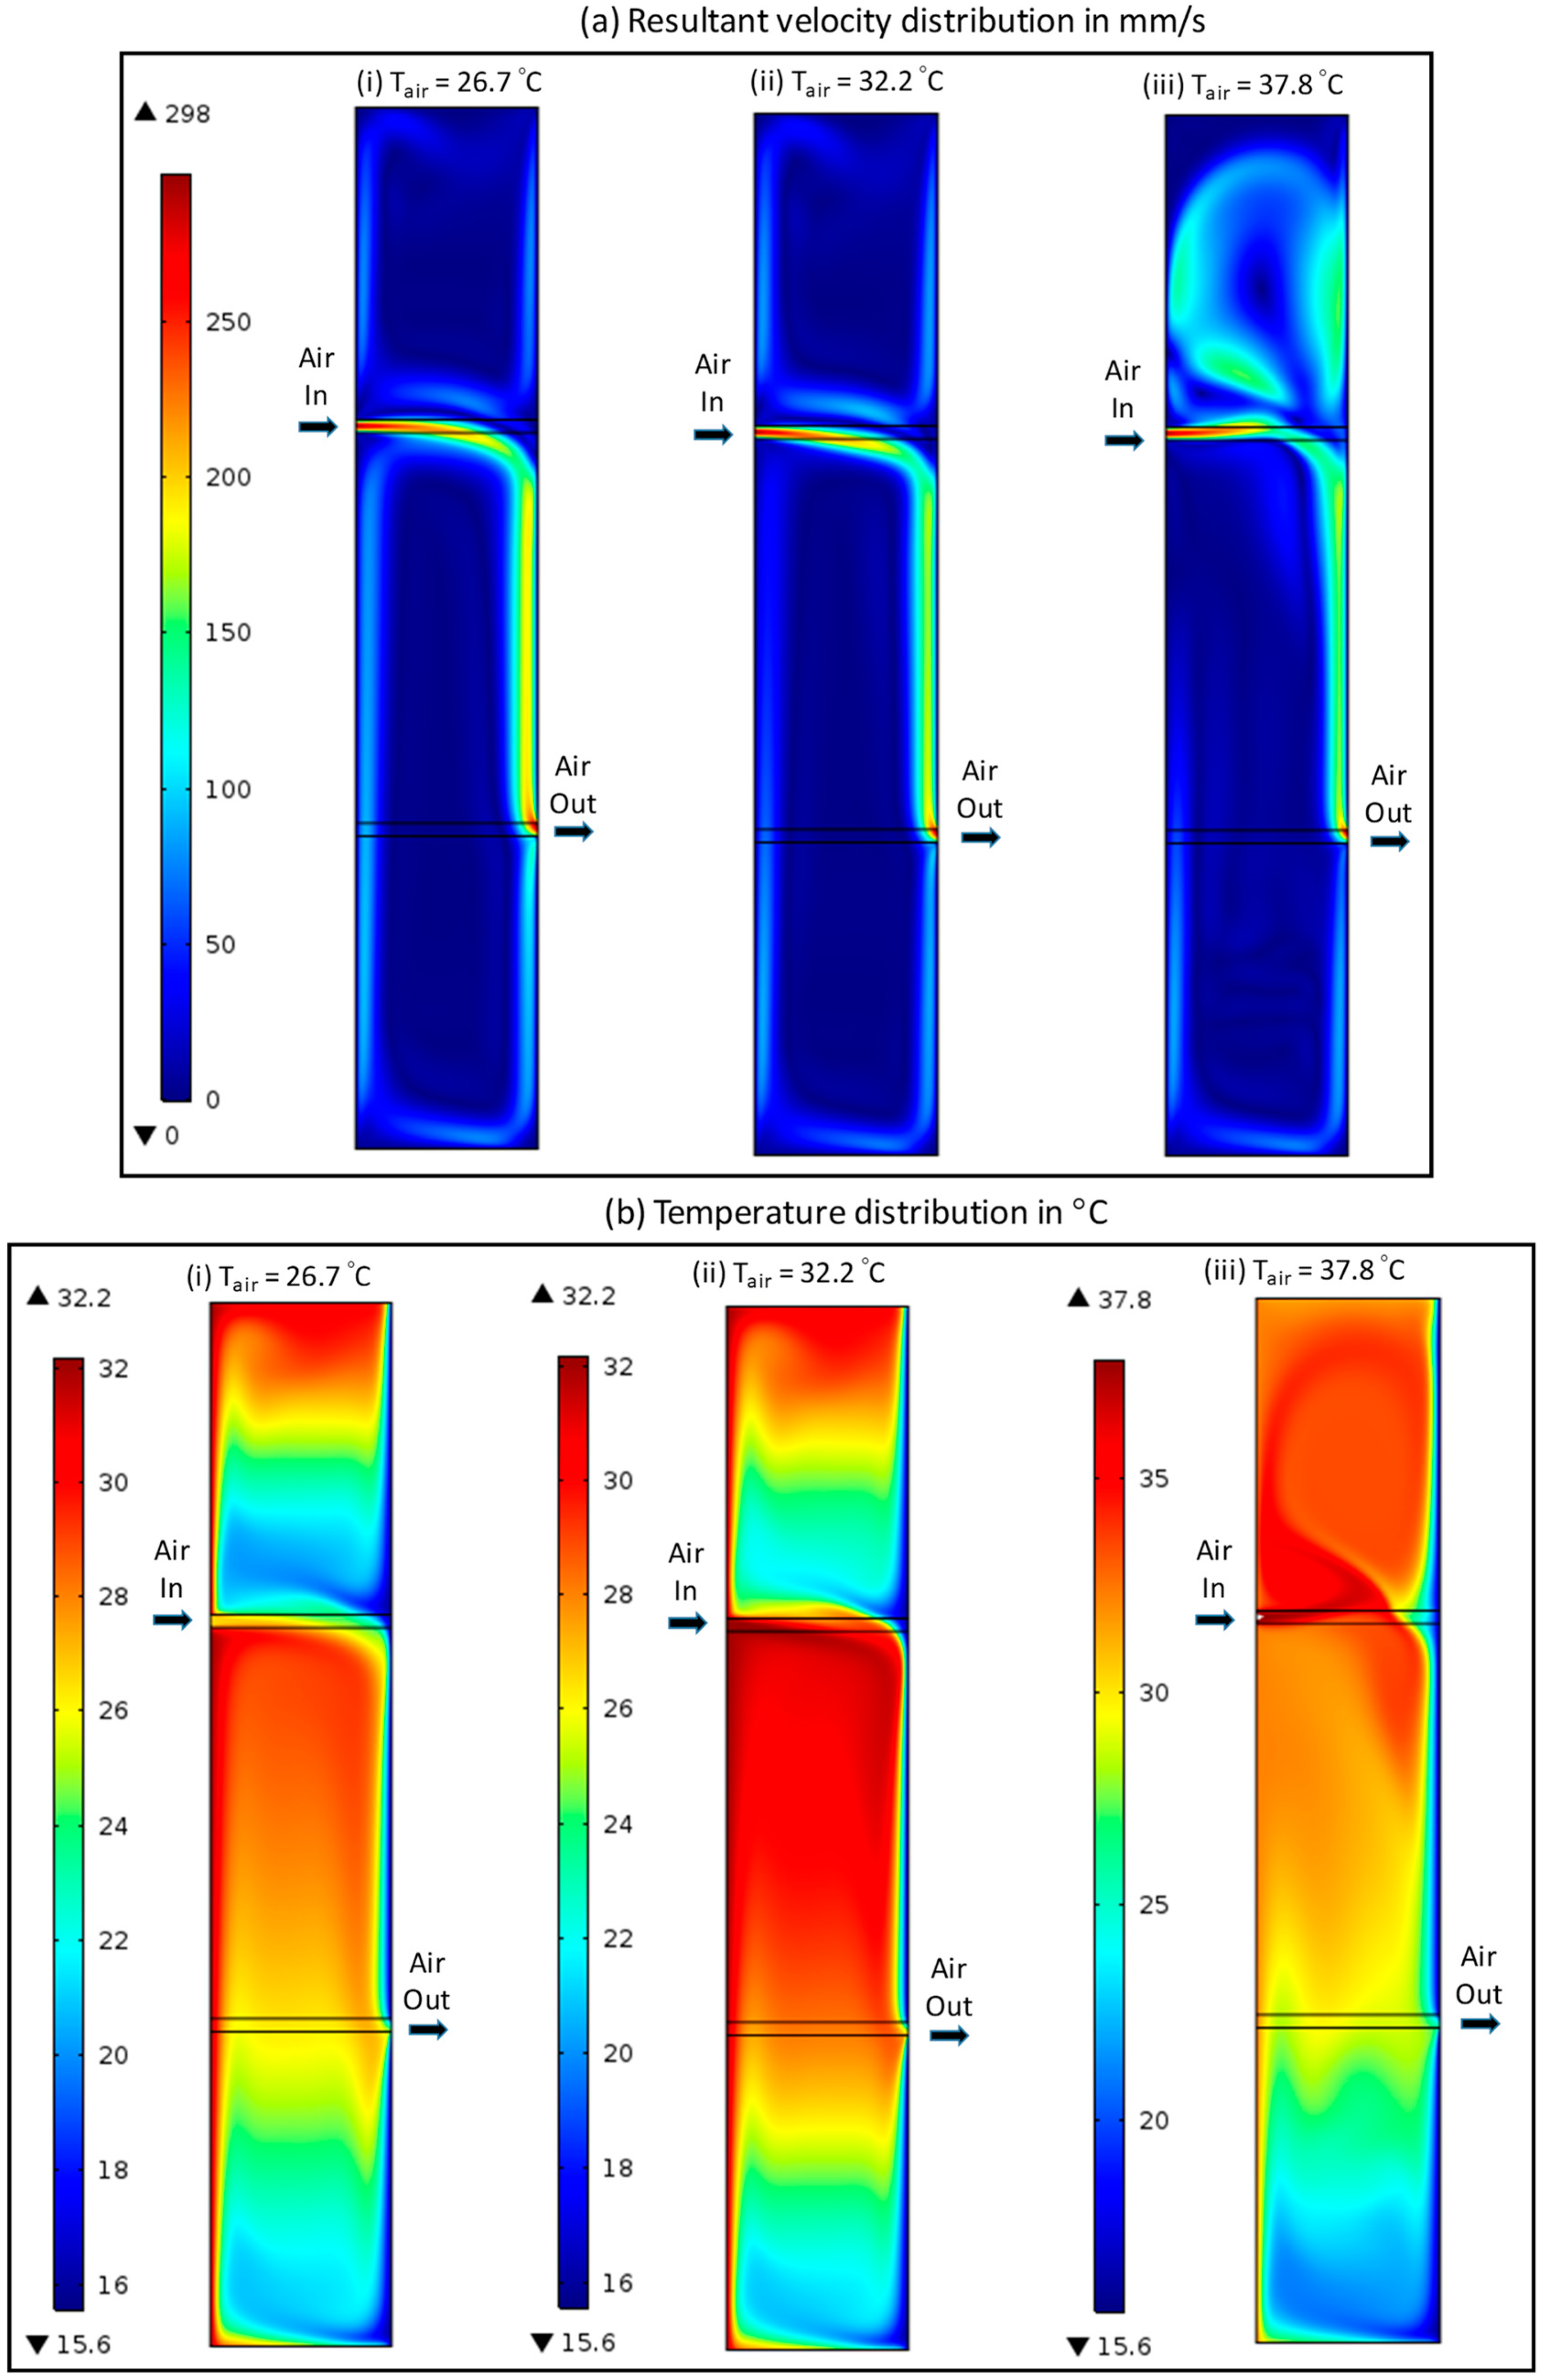
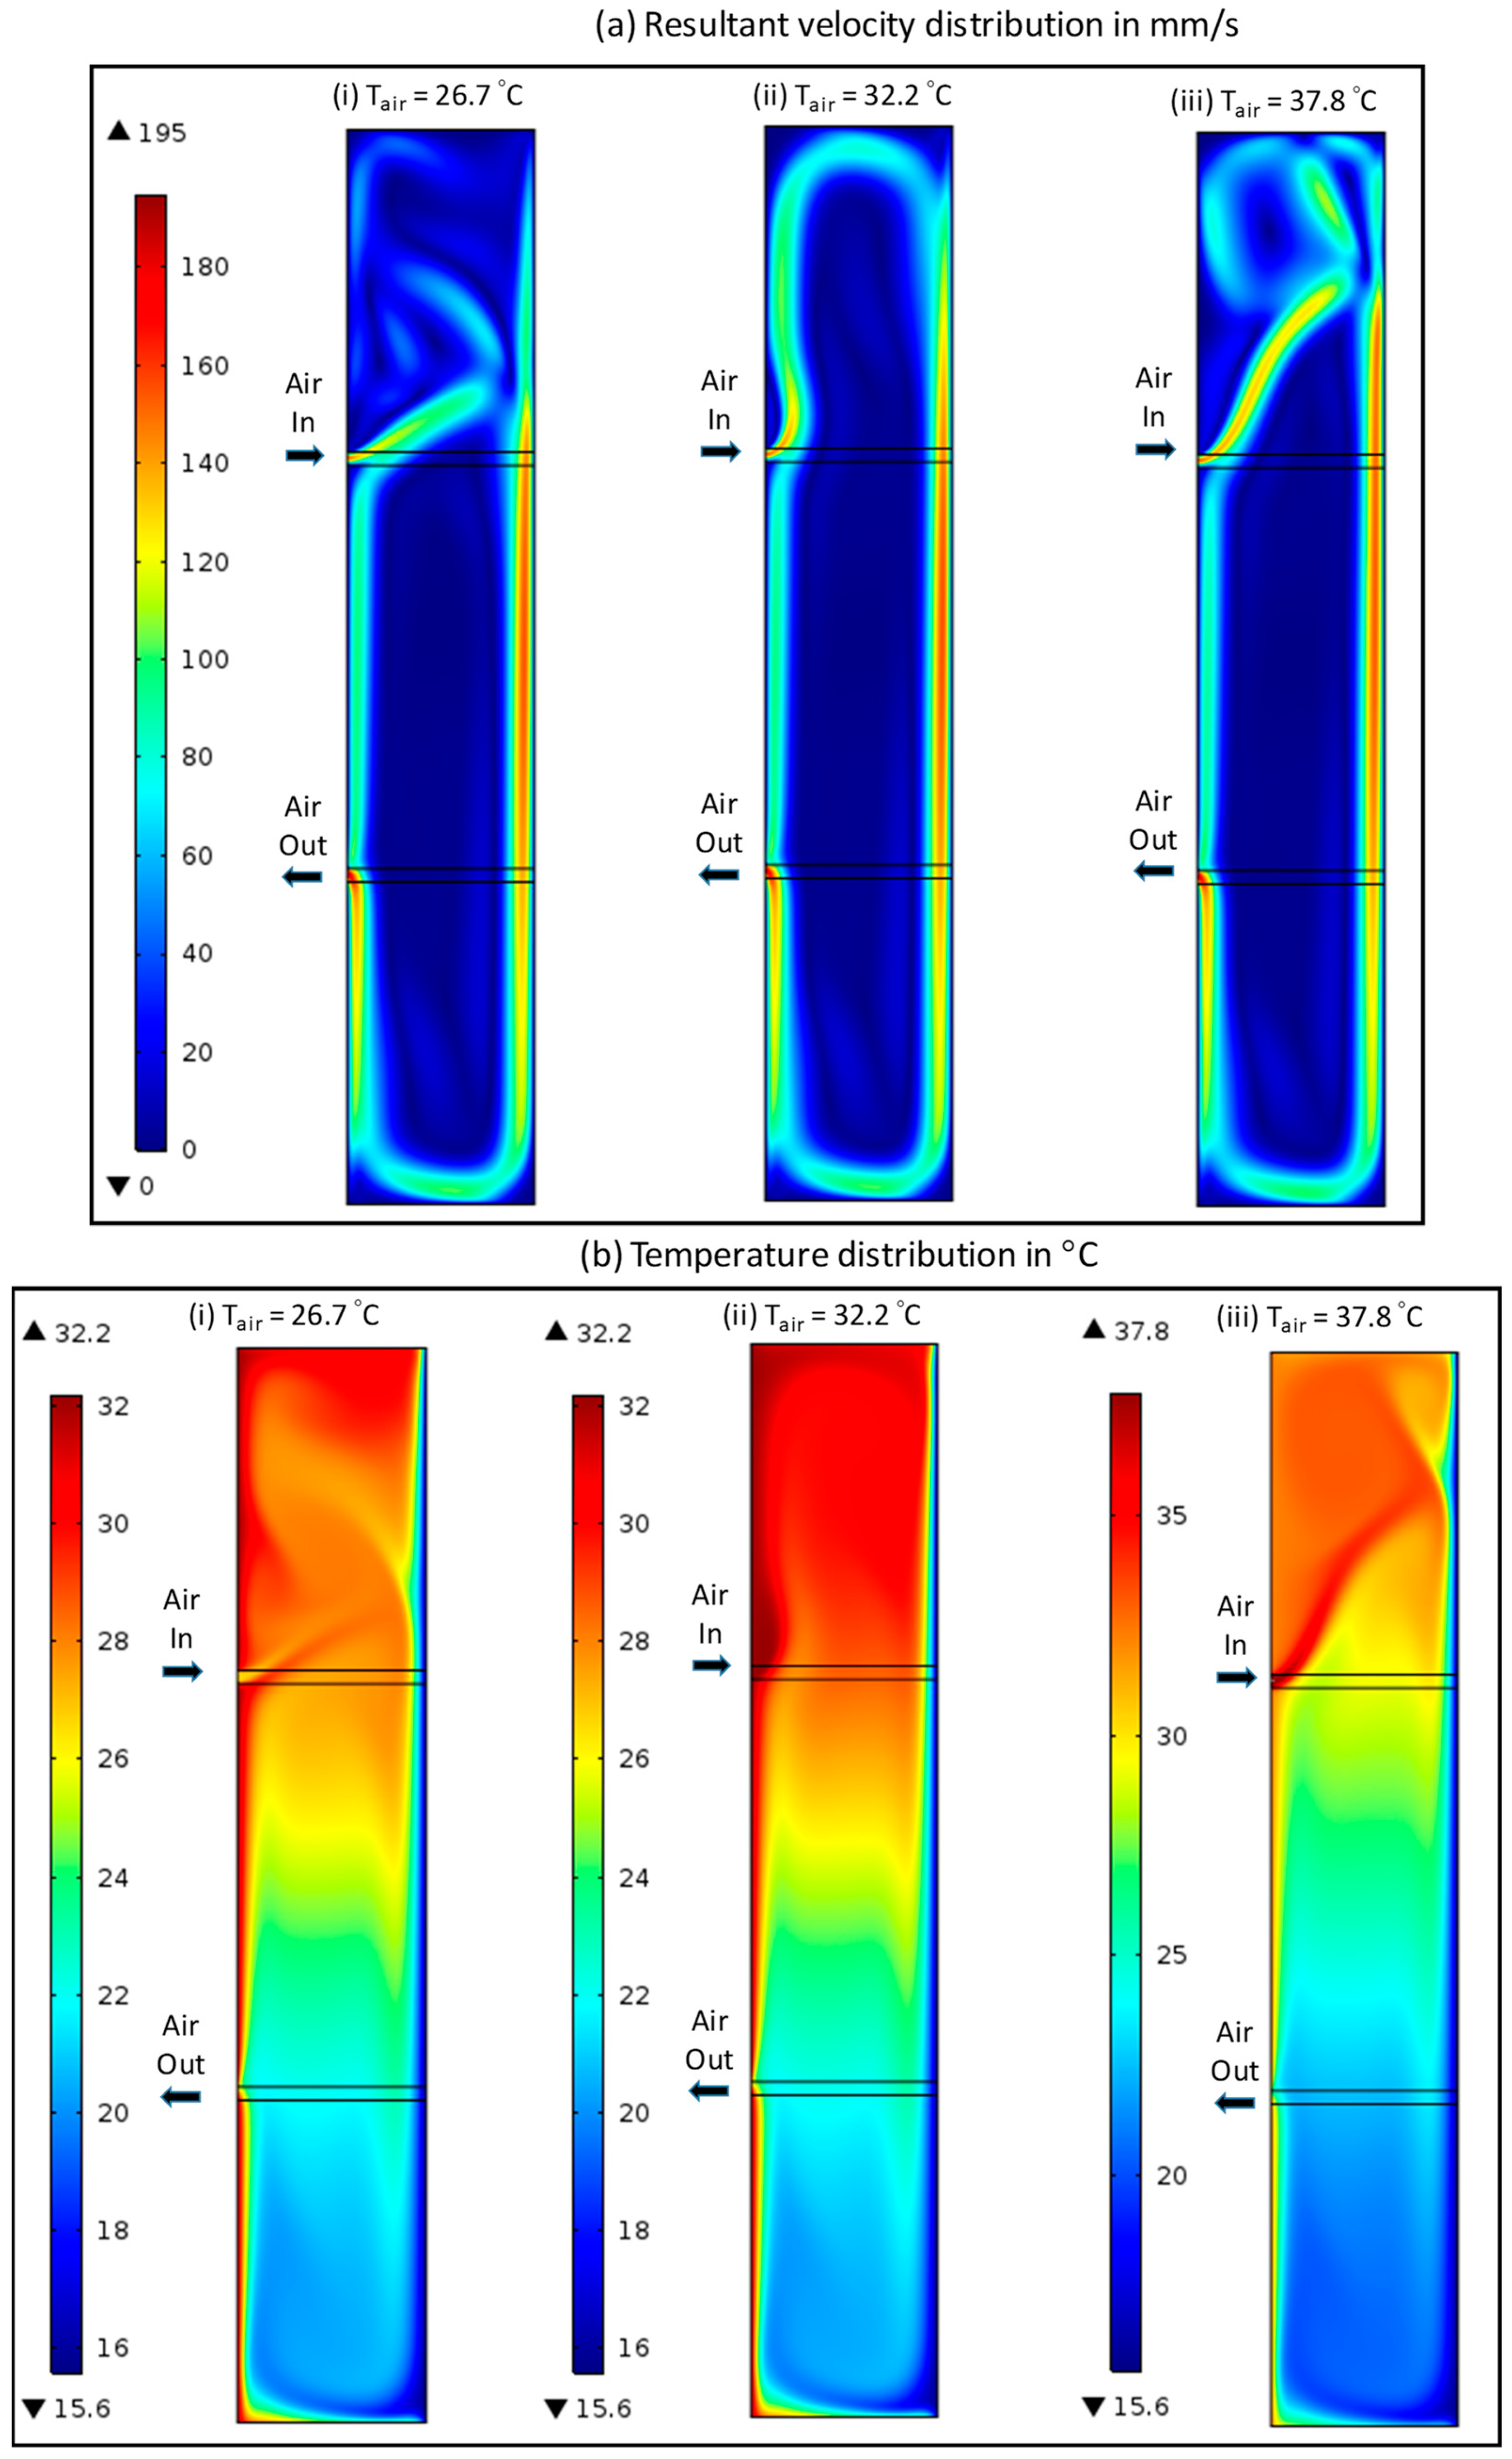
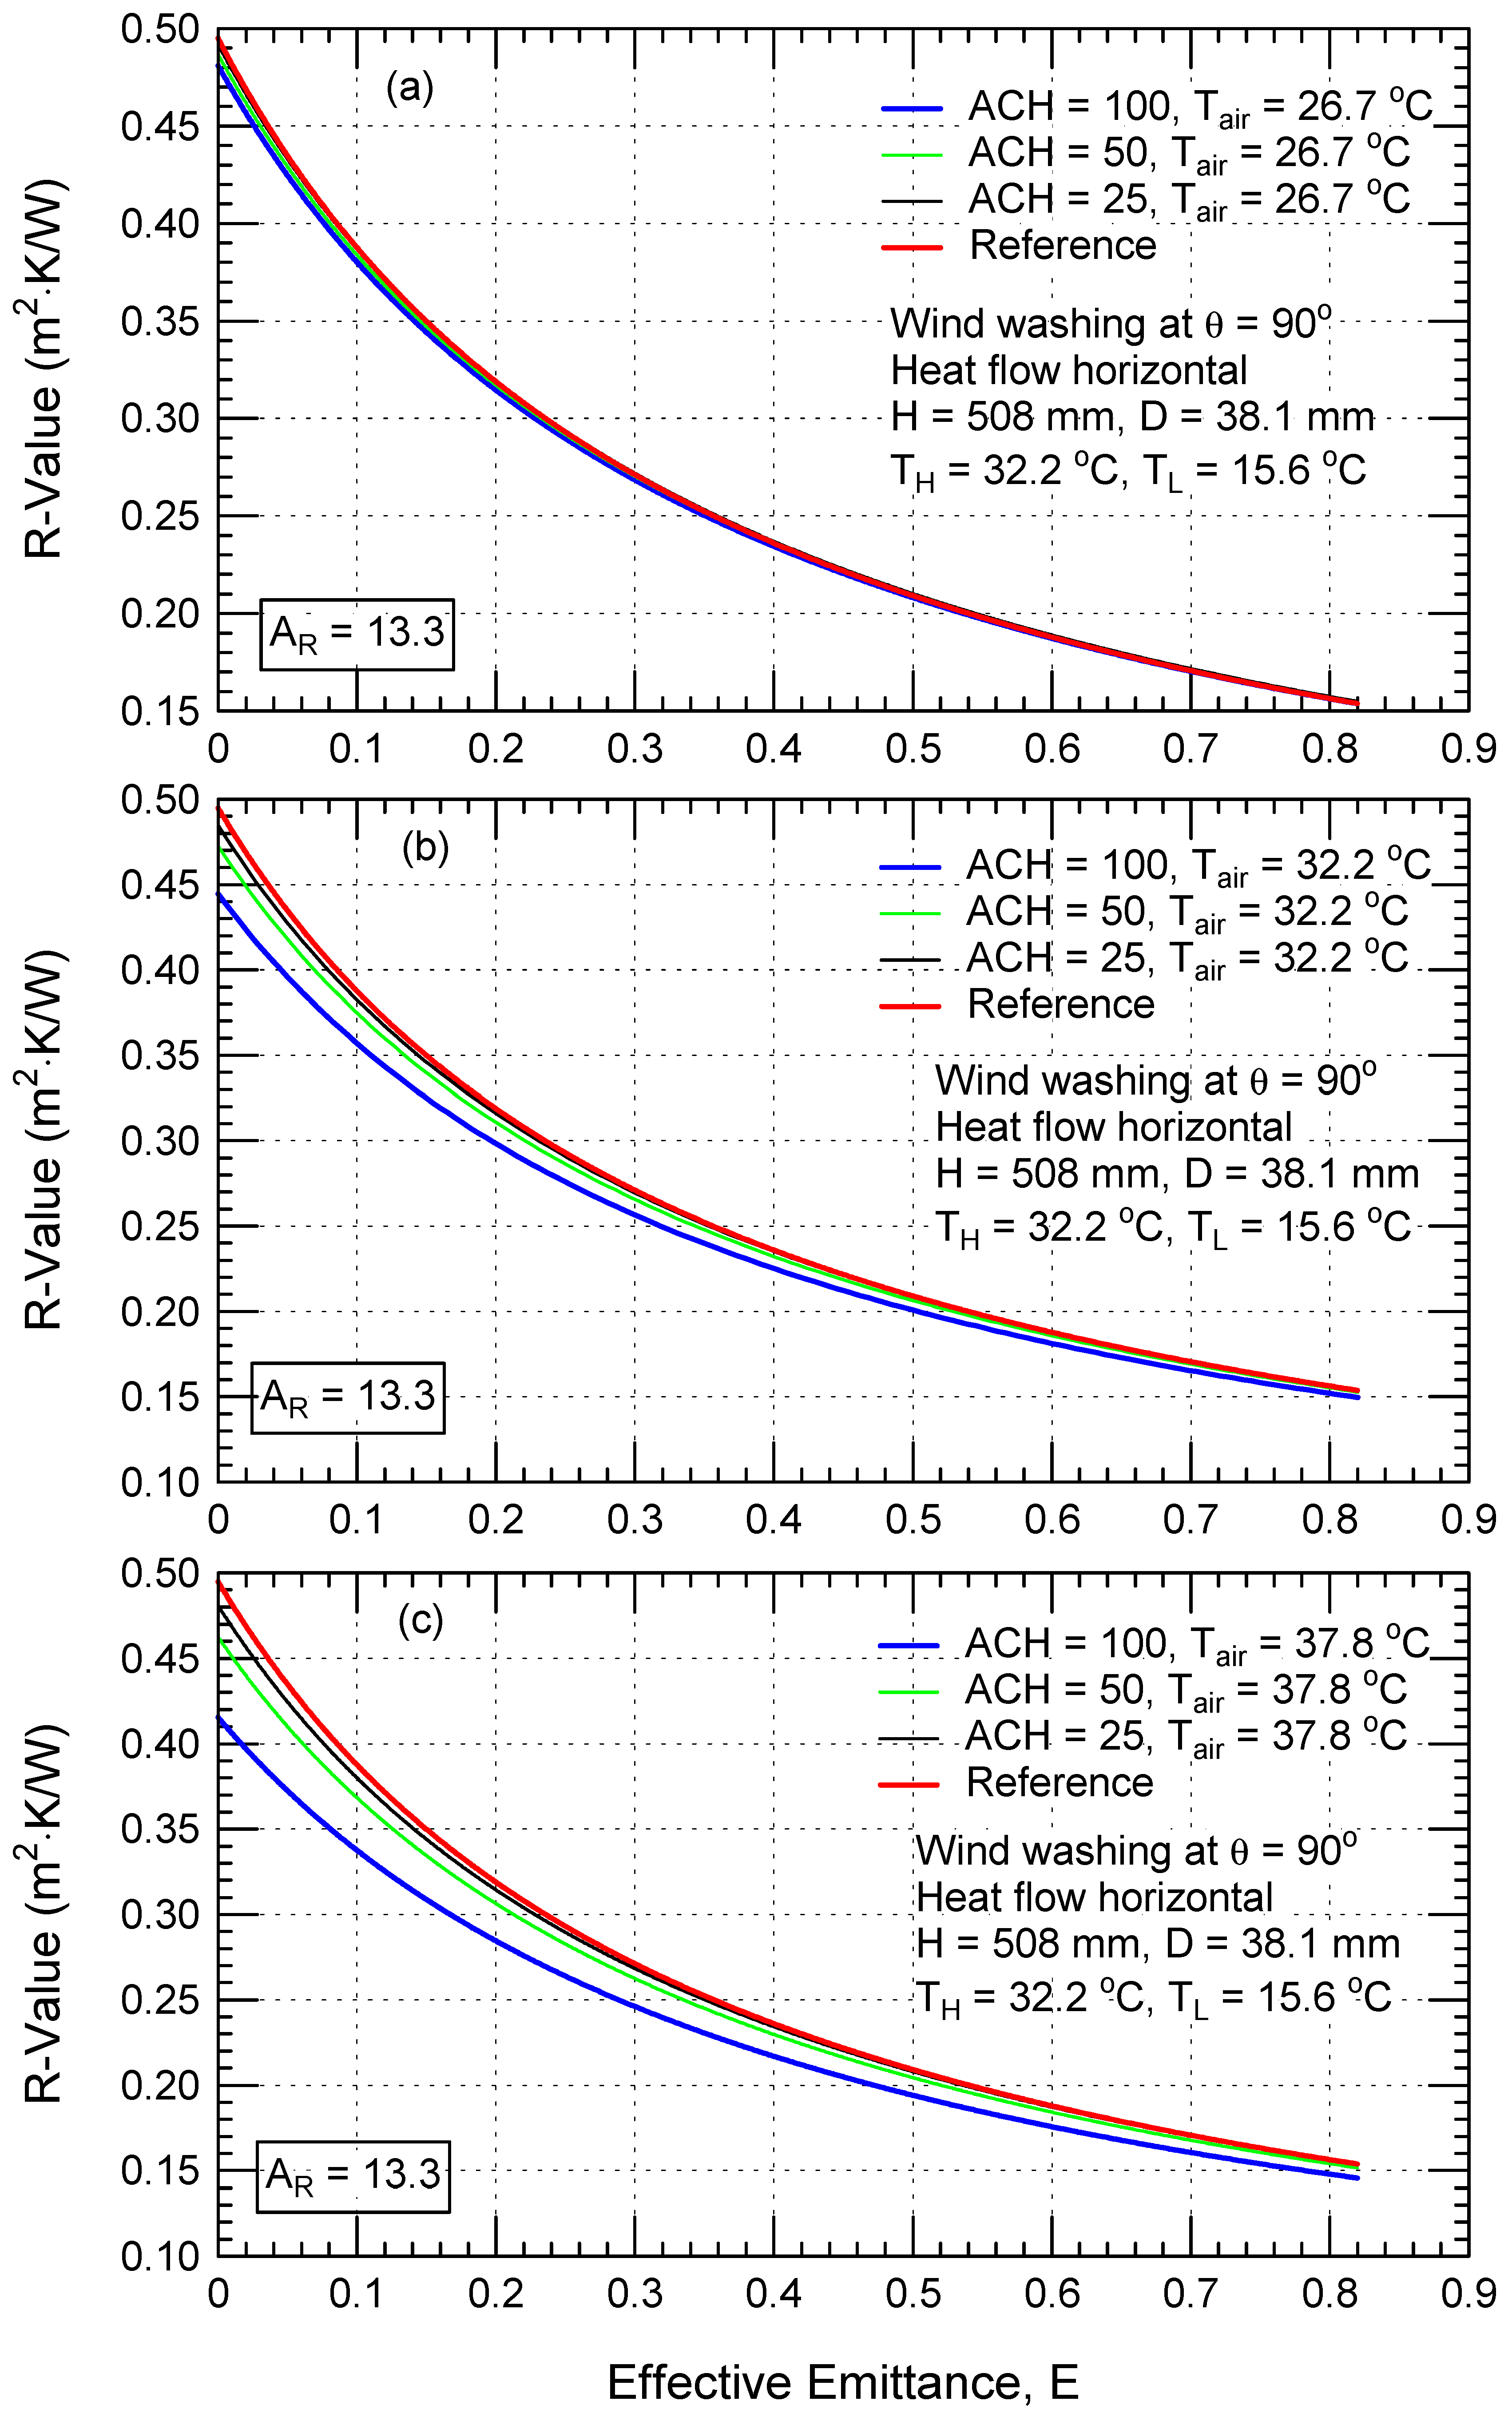
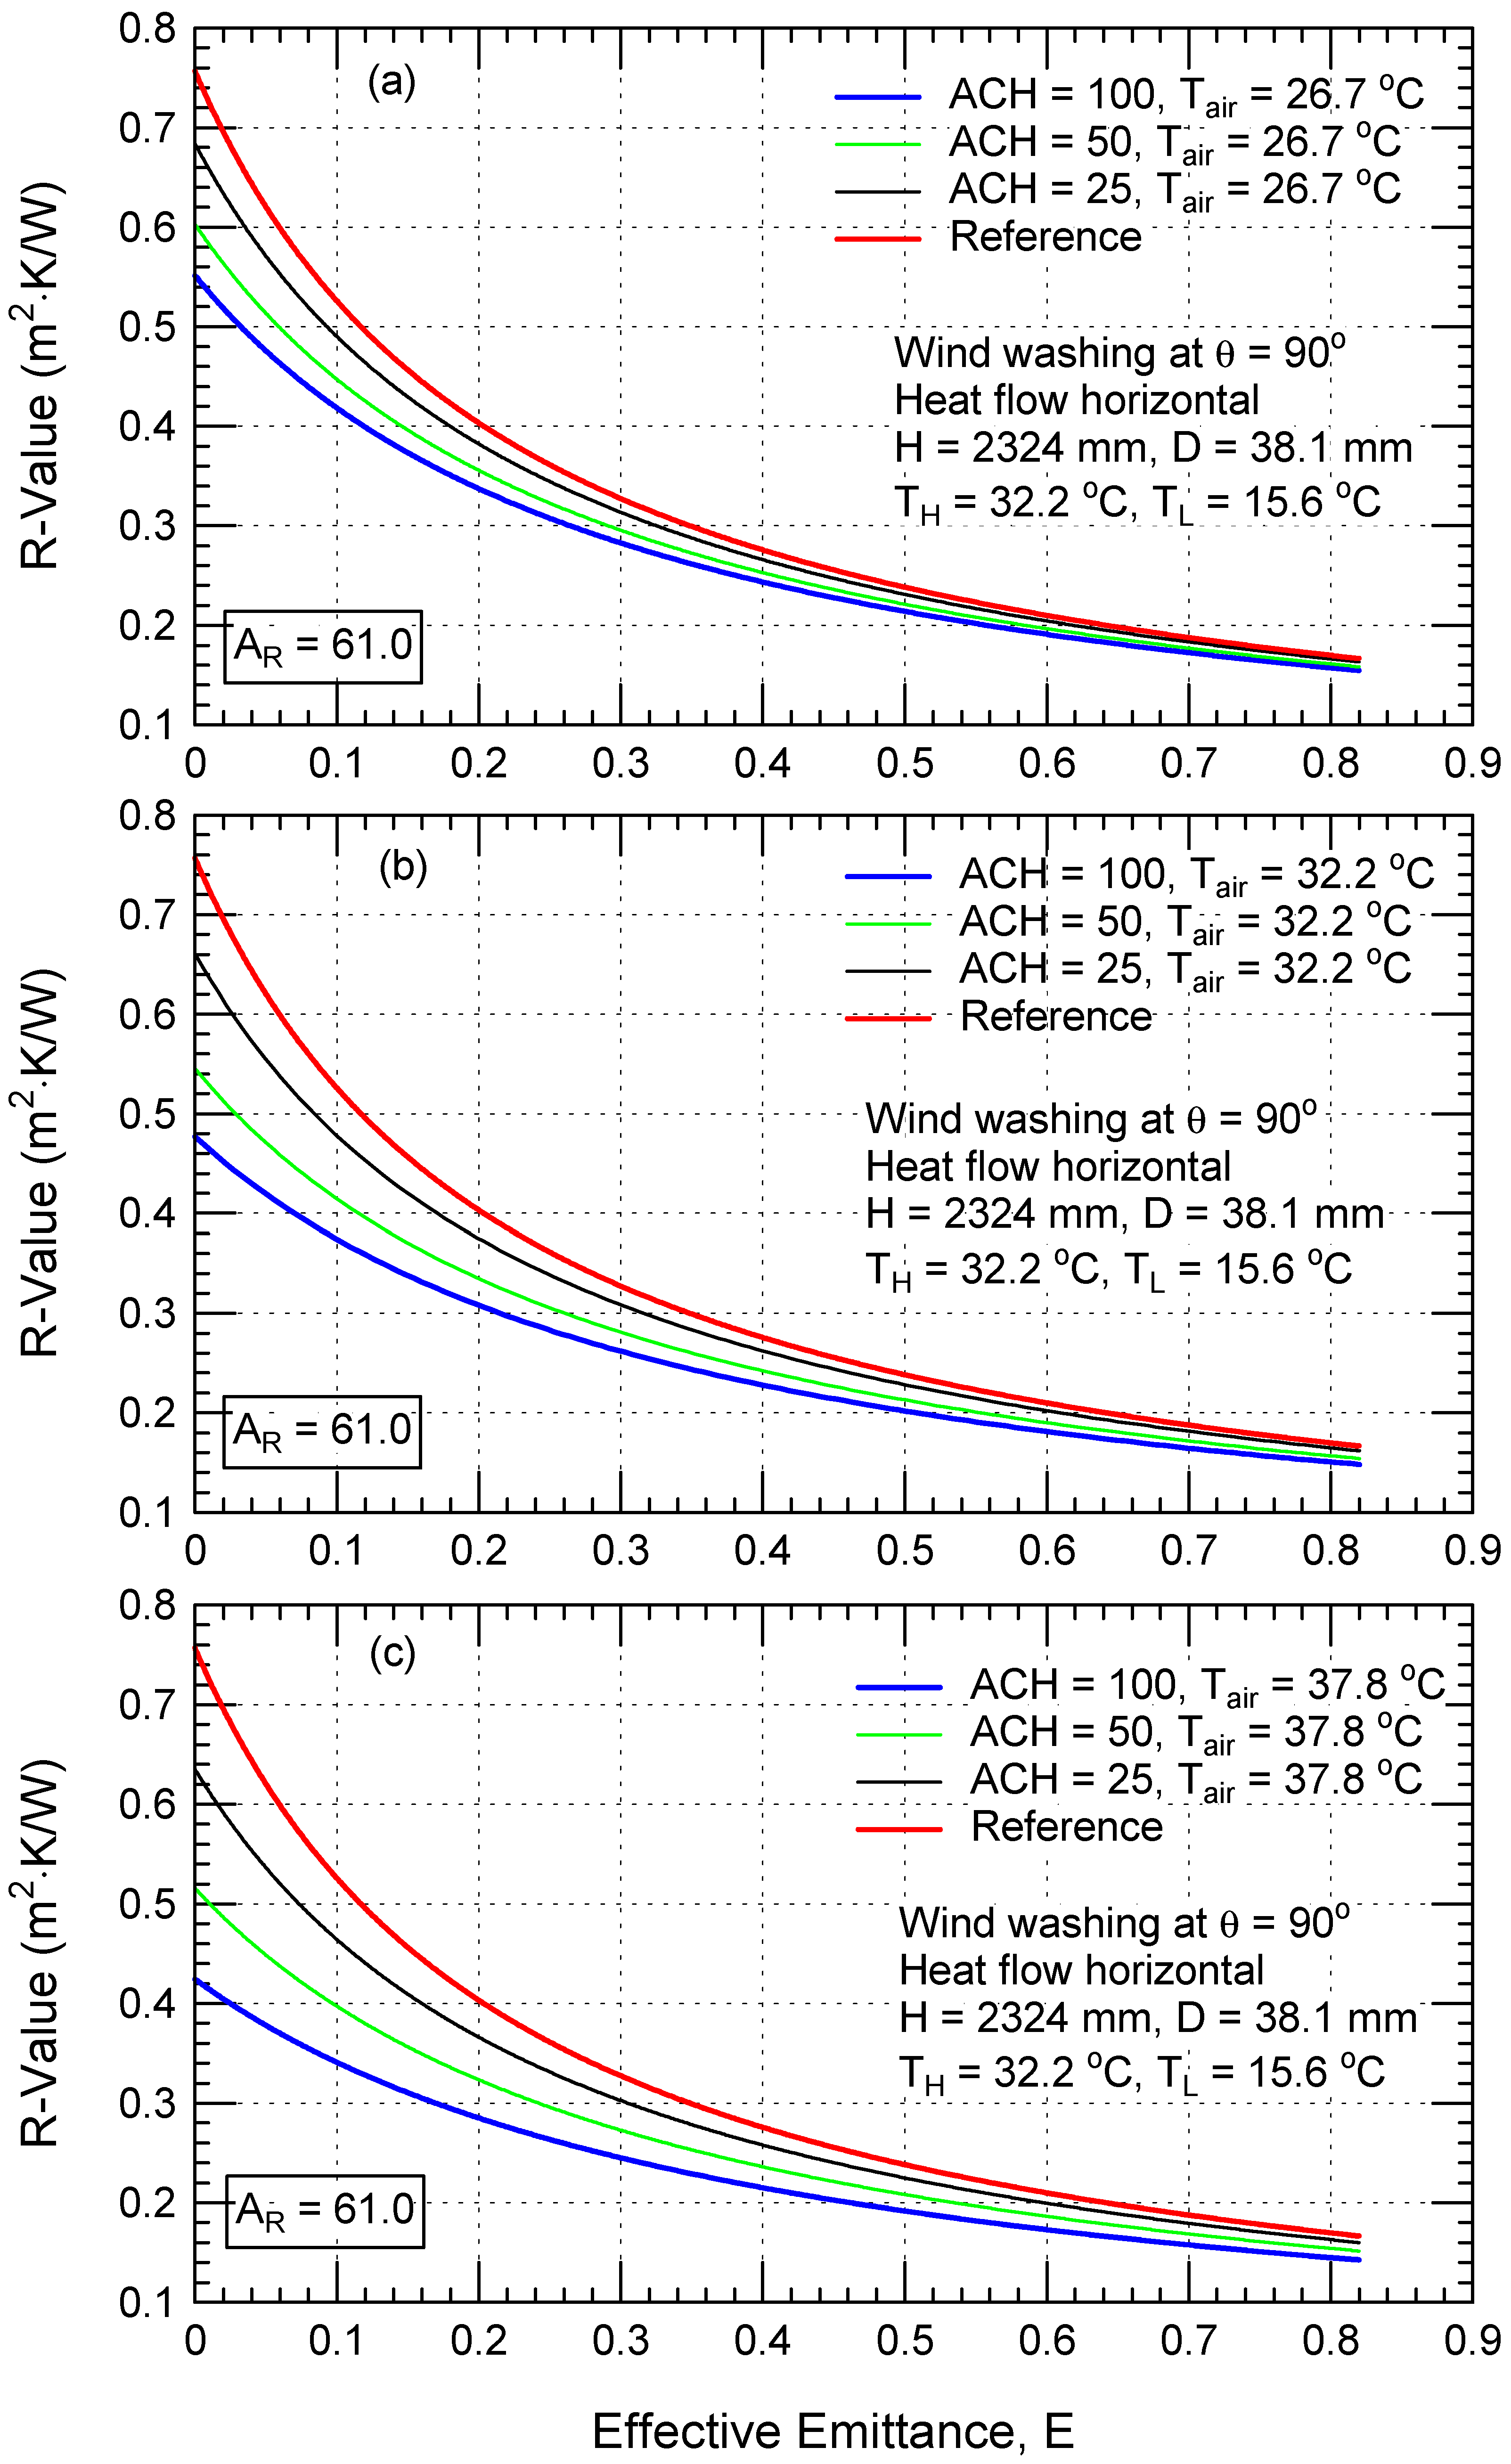
4.1. R-Values of Reflective Insulation Assemblies with Wind Washing

For a wide range of effective emittance (E = 0.0 to 0.82) in reflective insulation assemblies of D = 38.1 mm, Figure 6 and Figure 7, respectively, show the dependence of the R-value on the exterior air temperature (Tair) when assemblies of H = 508 mm (AR = 13.3) and H = 2324 mm (AR = 60.0) are subjected to wind washing condition (Figure 5b). The corresponding results for reflective insulation assemblies of D = 88.9 mm are shown in Figure 8 (H = 508 mm, AR = 5.7) and Figure 9 (H = 2324 mm, AR = 26.1). The results in these figures are provided for air-flow rates given in terms of ACH (25, 50,, and 100) for exterior air temperatures of 26.7 °C (<TH), 32.2 °C (=TH), and 37.8 °C (>TH). The reference curve in these figures is for ACH = 0 (Figure 5a). The average temperature in the cavity without exterior air flow is 23.9 °C (TH = 32.2 °C and TL = 15.6 °C, see Figure 5).
For various values of ACH, the reductions in the R-values due to wind washing for exterior air temperature Tair at 26.7 °C (<TH), in relation to the reference case of no air intrusion (see Figure 6a and Figure 7a for D = 38.1 mm, and Figure 8a and Figure 9a for D = 88.9 mm), are smaller than that for exterior air temperature Tair of 32.2 °C (same at TH, see Figure 6b and Figure 7b for D = 38.1 mm, and Figure 8b and Figure 9b for D = 88.9 mm) and for exterior air temperature Tair of 37.8 °C (>TH, see Figure 6c and Figure 7c for D = 38.1 mm, and Figure 8c and Figure 9c for D = 88.9 mm). In the case without low-emittance foil or coating installed in the assemblies (i.e., E = 0.82 at which ε1 = ε2 = 0.9 [24]), Figure 6, Figure 7, Figure 8 and Figure 9 show insignificant reductions in the R-values at various ACH values relative to the reference case. These reductions, however, increase with decreasing effective emittance. In addition, these figures show that a greater reduction in R-value in relation to the reference case occurs for the case of exterior air at 37.8 °C, which is warmer than the hot surface temperature of the cavity (TH = 32.2 °C). In other words, the incoming warmer air increases the heat transfer rate across the cavity region, thereby reducing the thermal resistance based on a temperature difference (TH − TL) of 16.6 °C. However, when the incoming air is cooler than the hot surface temperature, then there could be an increase in the apparent thermal resistance of the cavity. As the use of ventilated cavities has already been made a requirement by some building codes (e.g., National Building Code of Canada [45]) where ventilated cavities exist in brick walls [46] and wood framing systems [47], the results provided in this paper are applicable for these wall systems with and without reflective insulations. For these wall systems with configurations different than that used in this paper, however, the numerical model used in this study would be useful for modeling ventilated wall designs that result in energy savings.
Reflective insulations have effective emittance with E < 0.1, with many having effective emittances of 0.03 or 0.05 [26]. Thus, the discussions of the results are focused on effective emittance values of 0.03 or 0.05, whereas the results at other values of effective emittance shown in the figures of this study would provide the expected performance in the case of contamination and/or water vapor condensation on the low-emittance surfaces, which would lead to an increase in the effective emittance. The results of the reductions in the R-values due to wind washing in relation to the reference case at E of 0.03 and 0.05 are summarized in Table 2. In addition, the R-values for the reference cases without air intrusion are provided in Table 2 at values of effective emittance of 0.03 and 0.5. Thus, the reader can use the percentage reductions in the R-values along with the reference R-values to estimate the R-values of the reflective insulation assemblies: (a) at various wind washing conditions presented in this section, and (b) at various air infiltration conditions presented in the next section (see the footnote in Table 2). For the same values of the reflective insulation assembly dimensions, ACH, and exterior air temperatures, Table 2 shows that the reductions in the R-values at E = 0.03 are greater than that at E = 0.05.
For various ACH values of the exterior air entering the reflective insulation assembly from the hot side with temperature TH of 32.2 °C, Figure 6a for the case of Tair of 26.7 °C (<TH) for an assembly with D = 38.1 mm and H = 508 mm shows insignificant reductions in the R-values relative to the reference case of no air intrusion (e.g., reductions by only 0.46%, 1.45%, and 2.61% for ACH of 25, 50, and 100, respectively, at E = 0.03; see Table 2). As indicated earlier, for the same ACH and D values, the volumetric flow rate of the air entering the assembly ( Q ˙ ) is greater for a long assembly than for a short assembly. This has resulted in more reductions in the R-value for a long assembly than for a short assembly. For example, at ACH of 100 for reflective insulation assembly of H = 2324 mm and D = 38.1 mm at Tair of 26.7 °C (<TH), Figure 7a and Table 2 show that the reductions in R-values are 32.86% at E = 0.03 and 30.35% at E = 0.05, which are about ten times more than for short assembly of H = 508 mm (2.61% and 2.36% at E of 0.03 and 0.05, respectively; see Figure 6a and Table 2). At Tair of 32.2 °C (the same as TH), the corresponding reductions in the R-values for the long assembly (H = 2324 mm) are 51.58% at E = 0.03 and 47.98% at E = 0.05 (Figure 7b), compared to 10.33% and 9.74% for the short assembly (H = 508 mm; see Figure 6b). In addition, the reductions in the R-values for a long assembly (H = 2324 mm) at Tair of 37.8 °C (>TH) are 69.06% at E = 0.03 and 63.81% at E = 0.05 (Figure 7c and Table 2), and these reductions are greater than those for the short assembly with H = 508 mm (17.58% and 16.69%; see Figure 6c and Table 2).
For a reflective insulation assembly of 88.9 mm thickness and 508 mm length at Tair of 26.7 °C (<TH), Figure 8a and Table 2 show that the small ACH values of 25 and 50 have resulted in insignificant reductions in the R-values in relation to the reference case, whereas the reduction in the R-value at ACH of 100 is 18.34% at E = 0.03 and 17.41% at E = 0.05. For this assembly (D = 88.9 mm) at E = 0.03, as an example, the reductions in the R-values at Tair of 32.2 °C (same as TH) for ACH values of 25, 50, and 100, respectively, are 4.80%, 12.65%, and 39.06% (Figure 8b), which are about three times more than for the same assembly with a smaller thickness of D = 38.1 mm (1.84%, 4.26%, and 10.33%, Figure 6b). In addition, at E = 0.03, the reductions in the R-value for the assembly of 88.9 mm thickness at Tair of 37.8 °C (>TH) are 7.65%, 24.65%, and 51.23% (Figure 8c), whereas these reductions are about three times more than that for the same assembly but with smaller thickness of D = 38.1 mm (2.61%, 6.40%, and 17.58%; see Figure 6c and Table 2). Therefore, for given Tair, ACH, E, and H values, the reductions in the R-values for an assembly of large thickness are more than those for an assembly of small thickness.
Due to wind washing in reflective insulation assemblies of different dimensions, the exterior temperature Tair of the air entering the assembly from the hot side at TH resulted in a significant effect of the R-value. As shown in Figure 7, Figure 9, and Table 2, the reductions in the R-values in relation to the reference case (i.e., no air intrusion, Figure 5a) for Tair > TH are more than those for Tair < TH. For example, at E = 0.03 and ACH of 100 for a long reflective insulation assembly (H = 2324 mm) of 88.9 mm and 38.1 mm thickness at Tair of 26.7 °C (<TH), the reductions in the R-values are 43.12% (Figure 9a and Table 2) and 32.86%, respectively (Figure 7a and Table 2). At Tair = 32.2 °C (same as TH), the corresponding reductions in the R-values are 77.12% for D = 88.9 mm (Figure 9b) and 51.58% for D = 38.1 mm (Figure 7b). Additionally, the corresponding reductions in the R-values at Tair of 37.8 °C (>TH) are 115.27% for D = 88.9 mm (Figure 9c and Table 2) and 69.06% for D = 38.1 mm (Figure 7c and Table 2). The corresponding reductions in the R-values for these assemblies at E = 0.05 are provided in Table 2.
In summary, for given values of ACH, H, D, and E, the sensitivity of the air intrusion entering the reflective insulation assembly at high Tair has resulted in greater reductions in the R-values in relation to the reference case than at low Tair. As provided above for the same value of ACH and the same value of D, the reduction in the R-value is greater for the long assembly than for the short assembly. This is due to the volumetric flow rate of the air entering the reflective insulation assembly ( Q ˙ ) at the same values of ACH and D being greater for the long assembly than for the short assembly, where the value of Q ˙ for H of 2324 mm (Figure 7 and Figure 9 and Table 2) is 4.575 times the value of Q ˙ for H of 508 mm (Figure 6 and Figure 8). Additionally, for the same values of ACH and H, the reduction in the R-value is larger for a thick assembly than for a thin assembly. This is also because the volumetric flow rate of the air entering the reflective insulation assembly at the same values of ACH and H is greater for a thicker assembly than for a thinner assembly, whereas the value of Q ˙ for D of 88.9 mm (Figure 7 and Figure 9) is 2.333 times the value of Q ˙ for D of 38.1 mm (Figure 6 and Figure 8 and Table 2). For the same volumetric flow rate of the air entering the reflective insulation assembly at which the ACH values are different for various assembly dimensions, comparisons of R-values are discussed later in Section 4.3.2 for reflective insulation assemblies of various dimensions and subjected to different operating conditions.

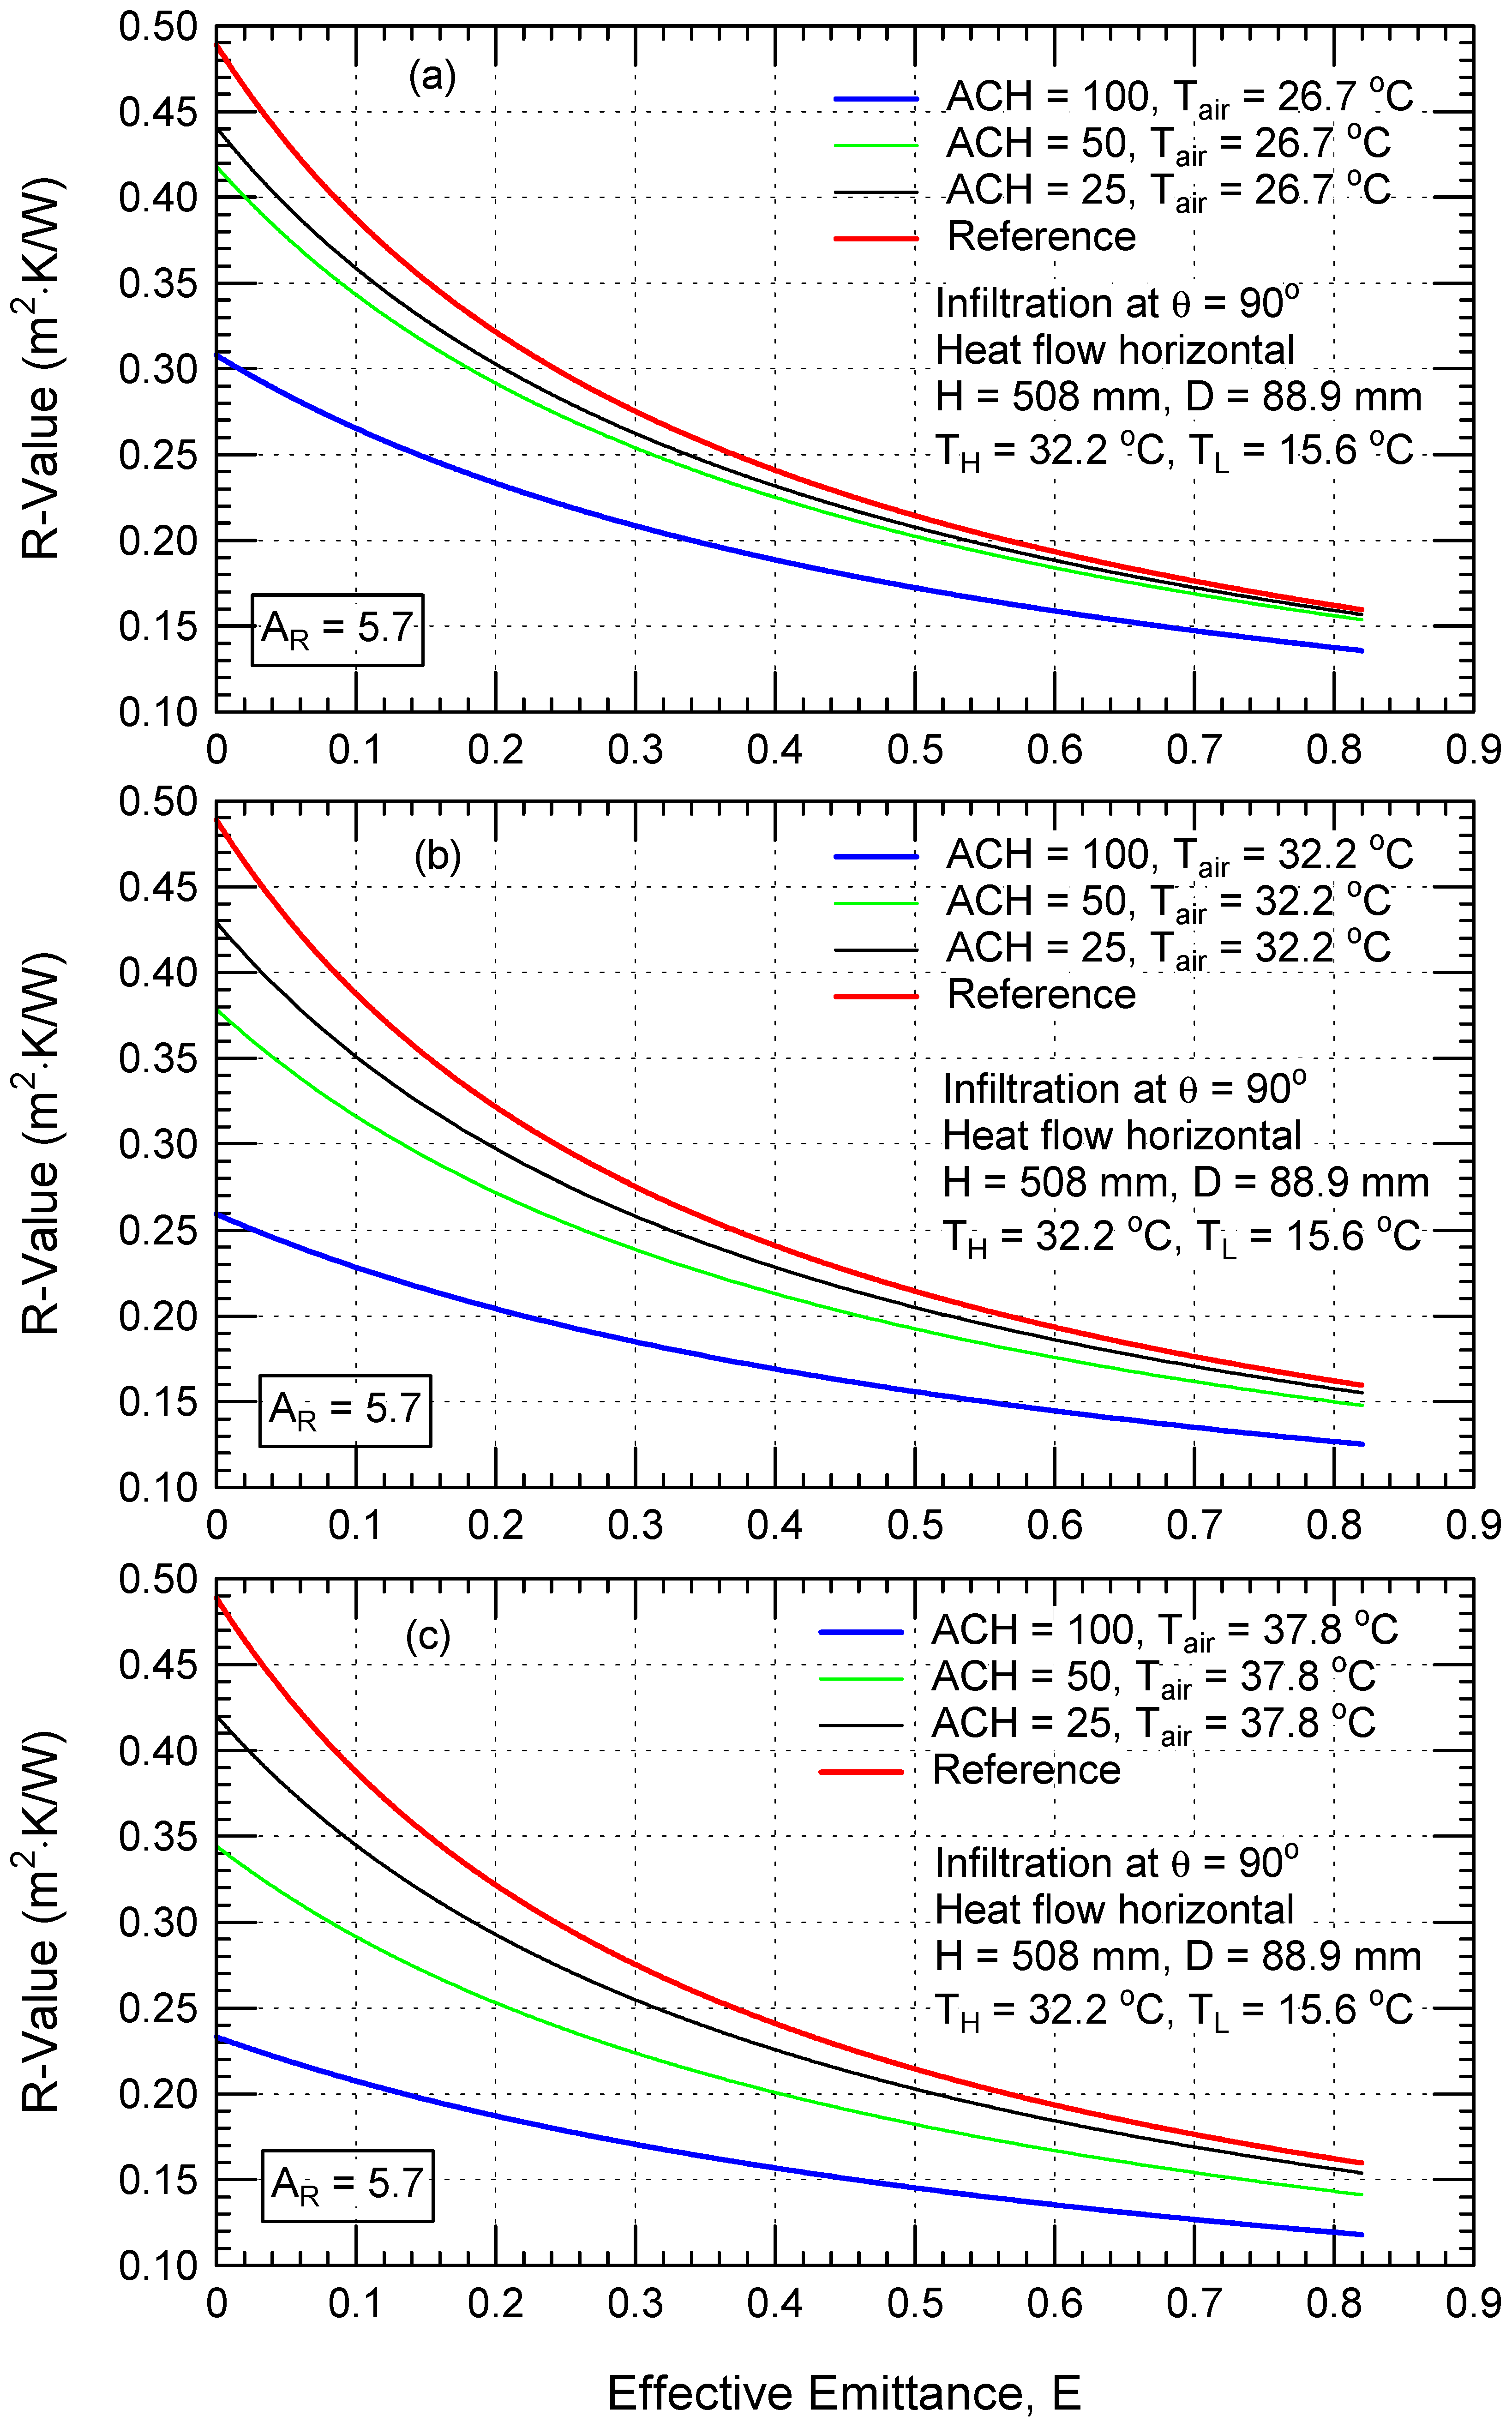
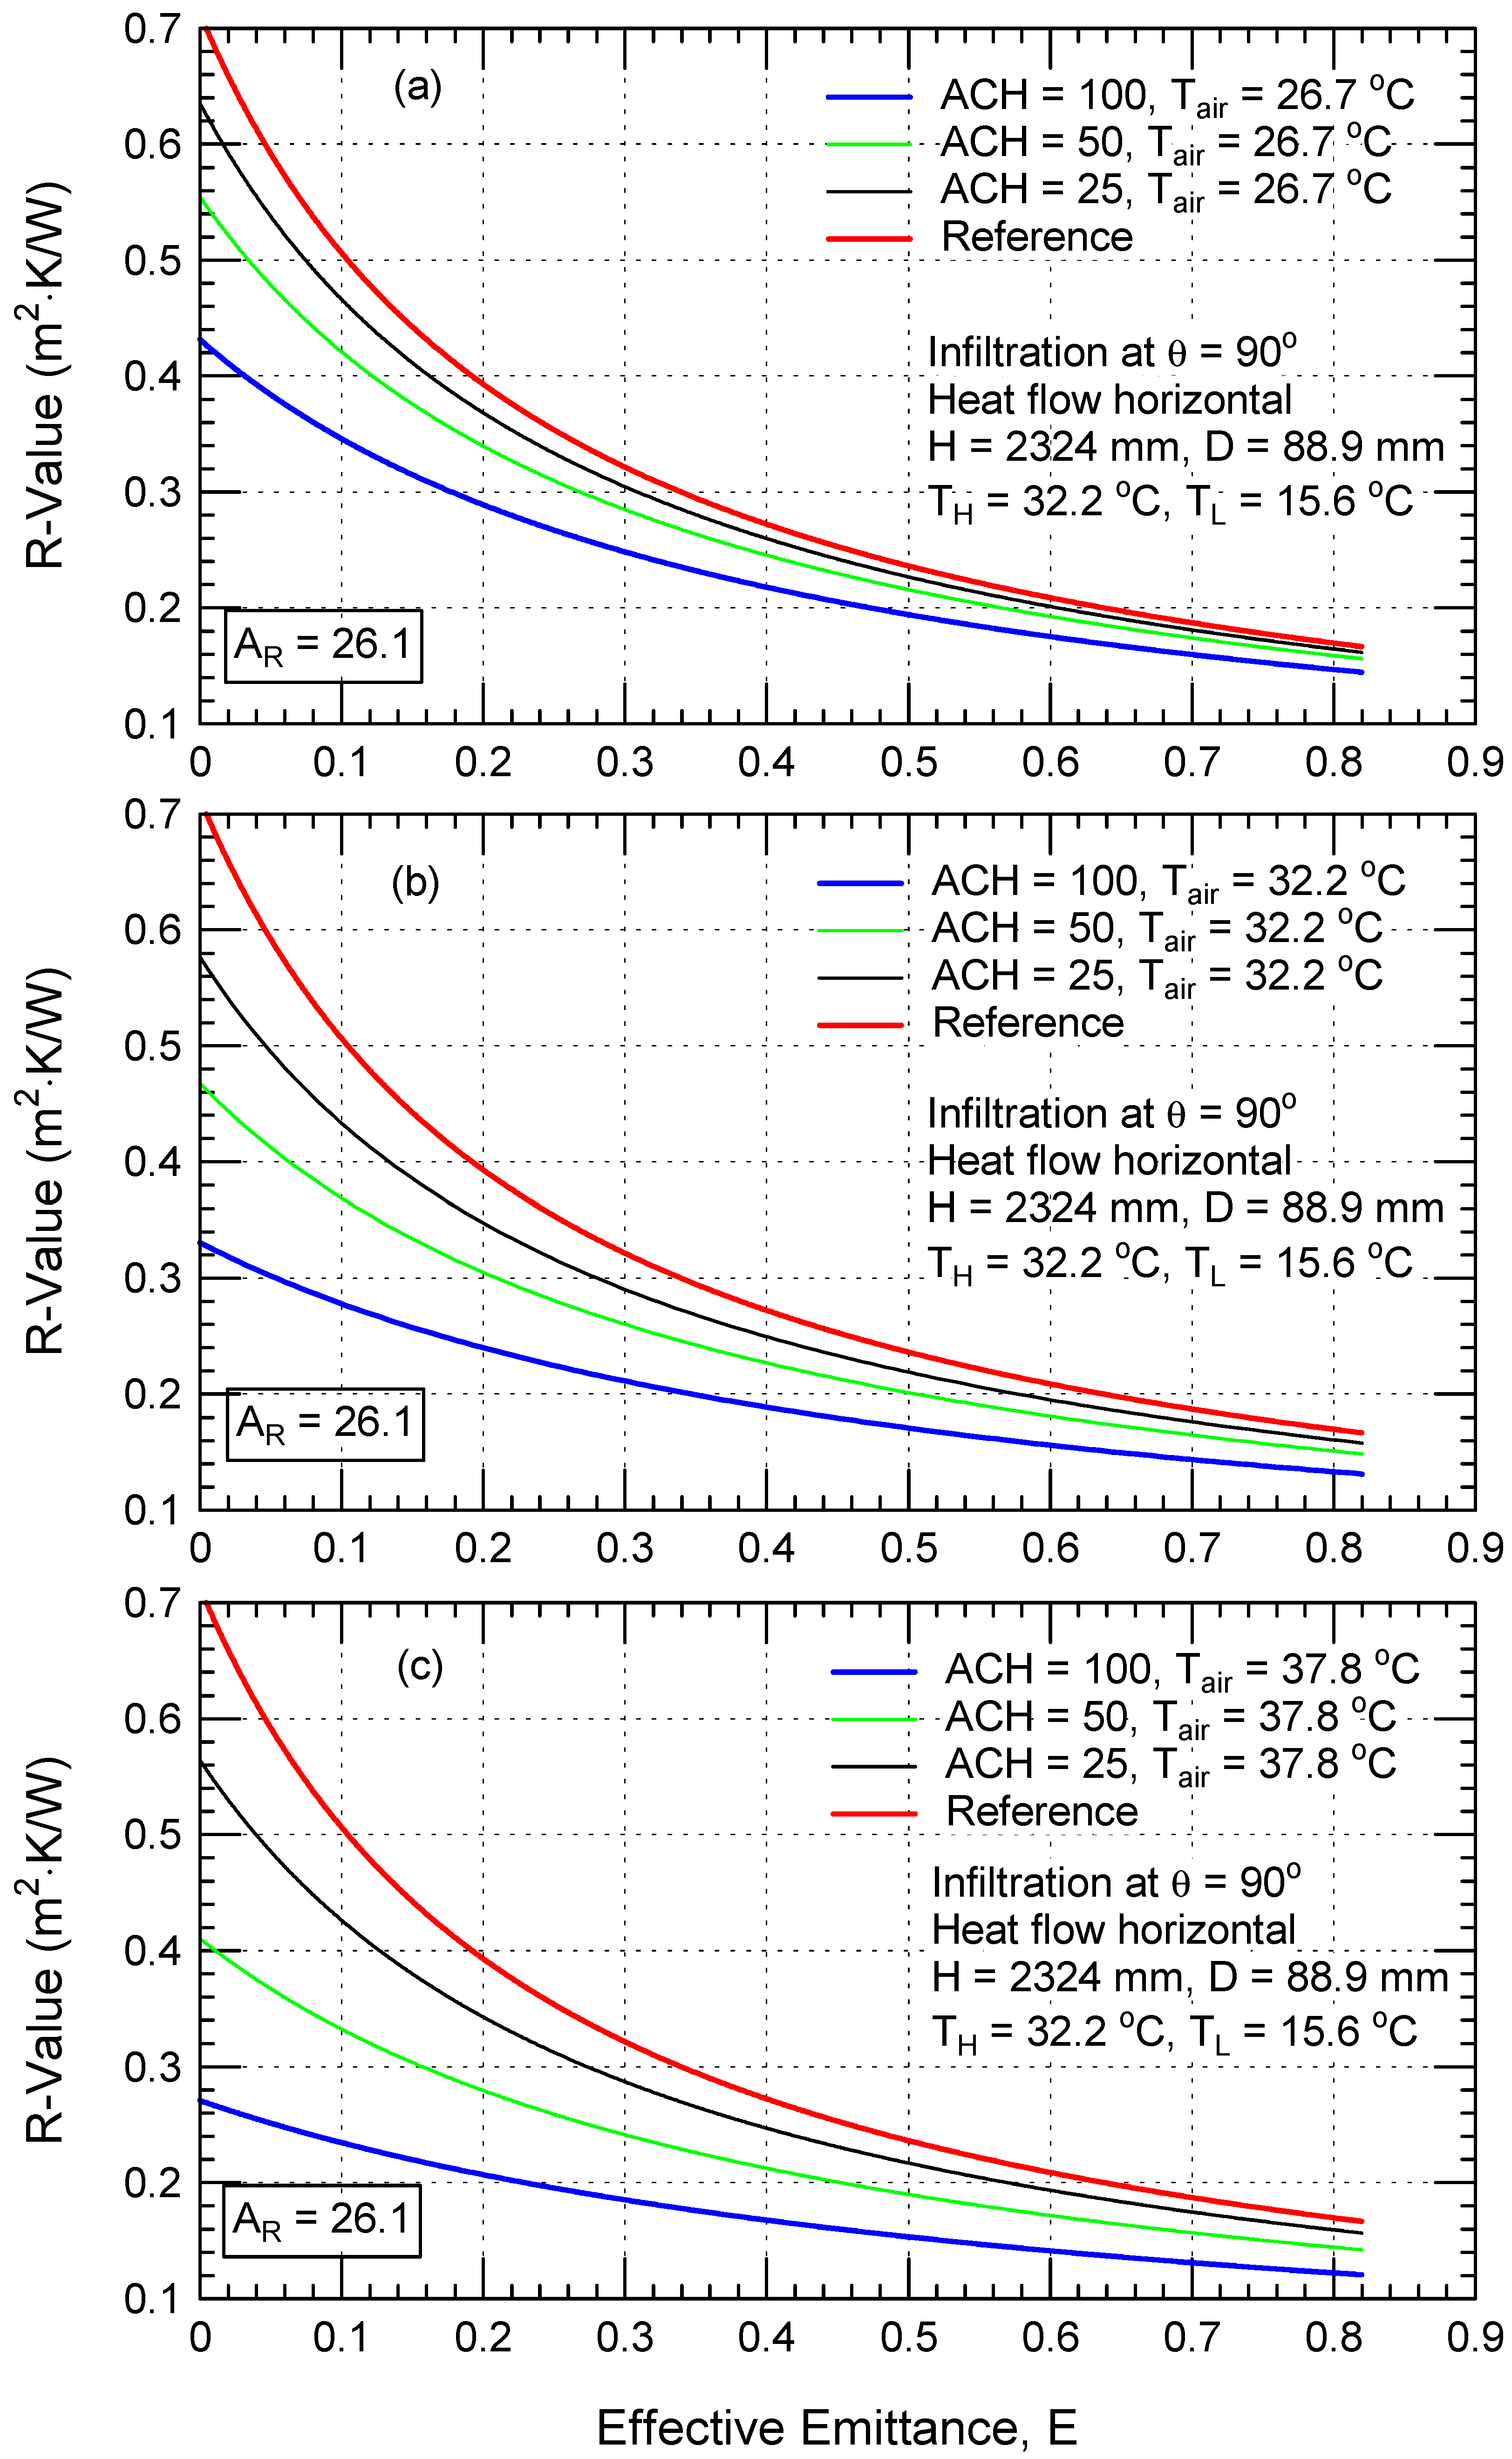
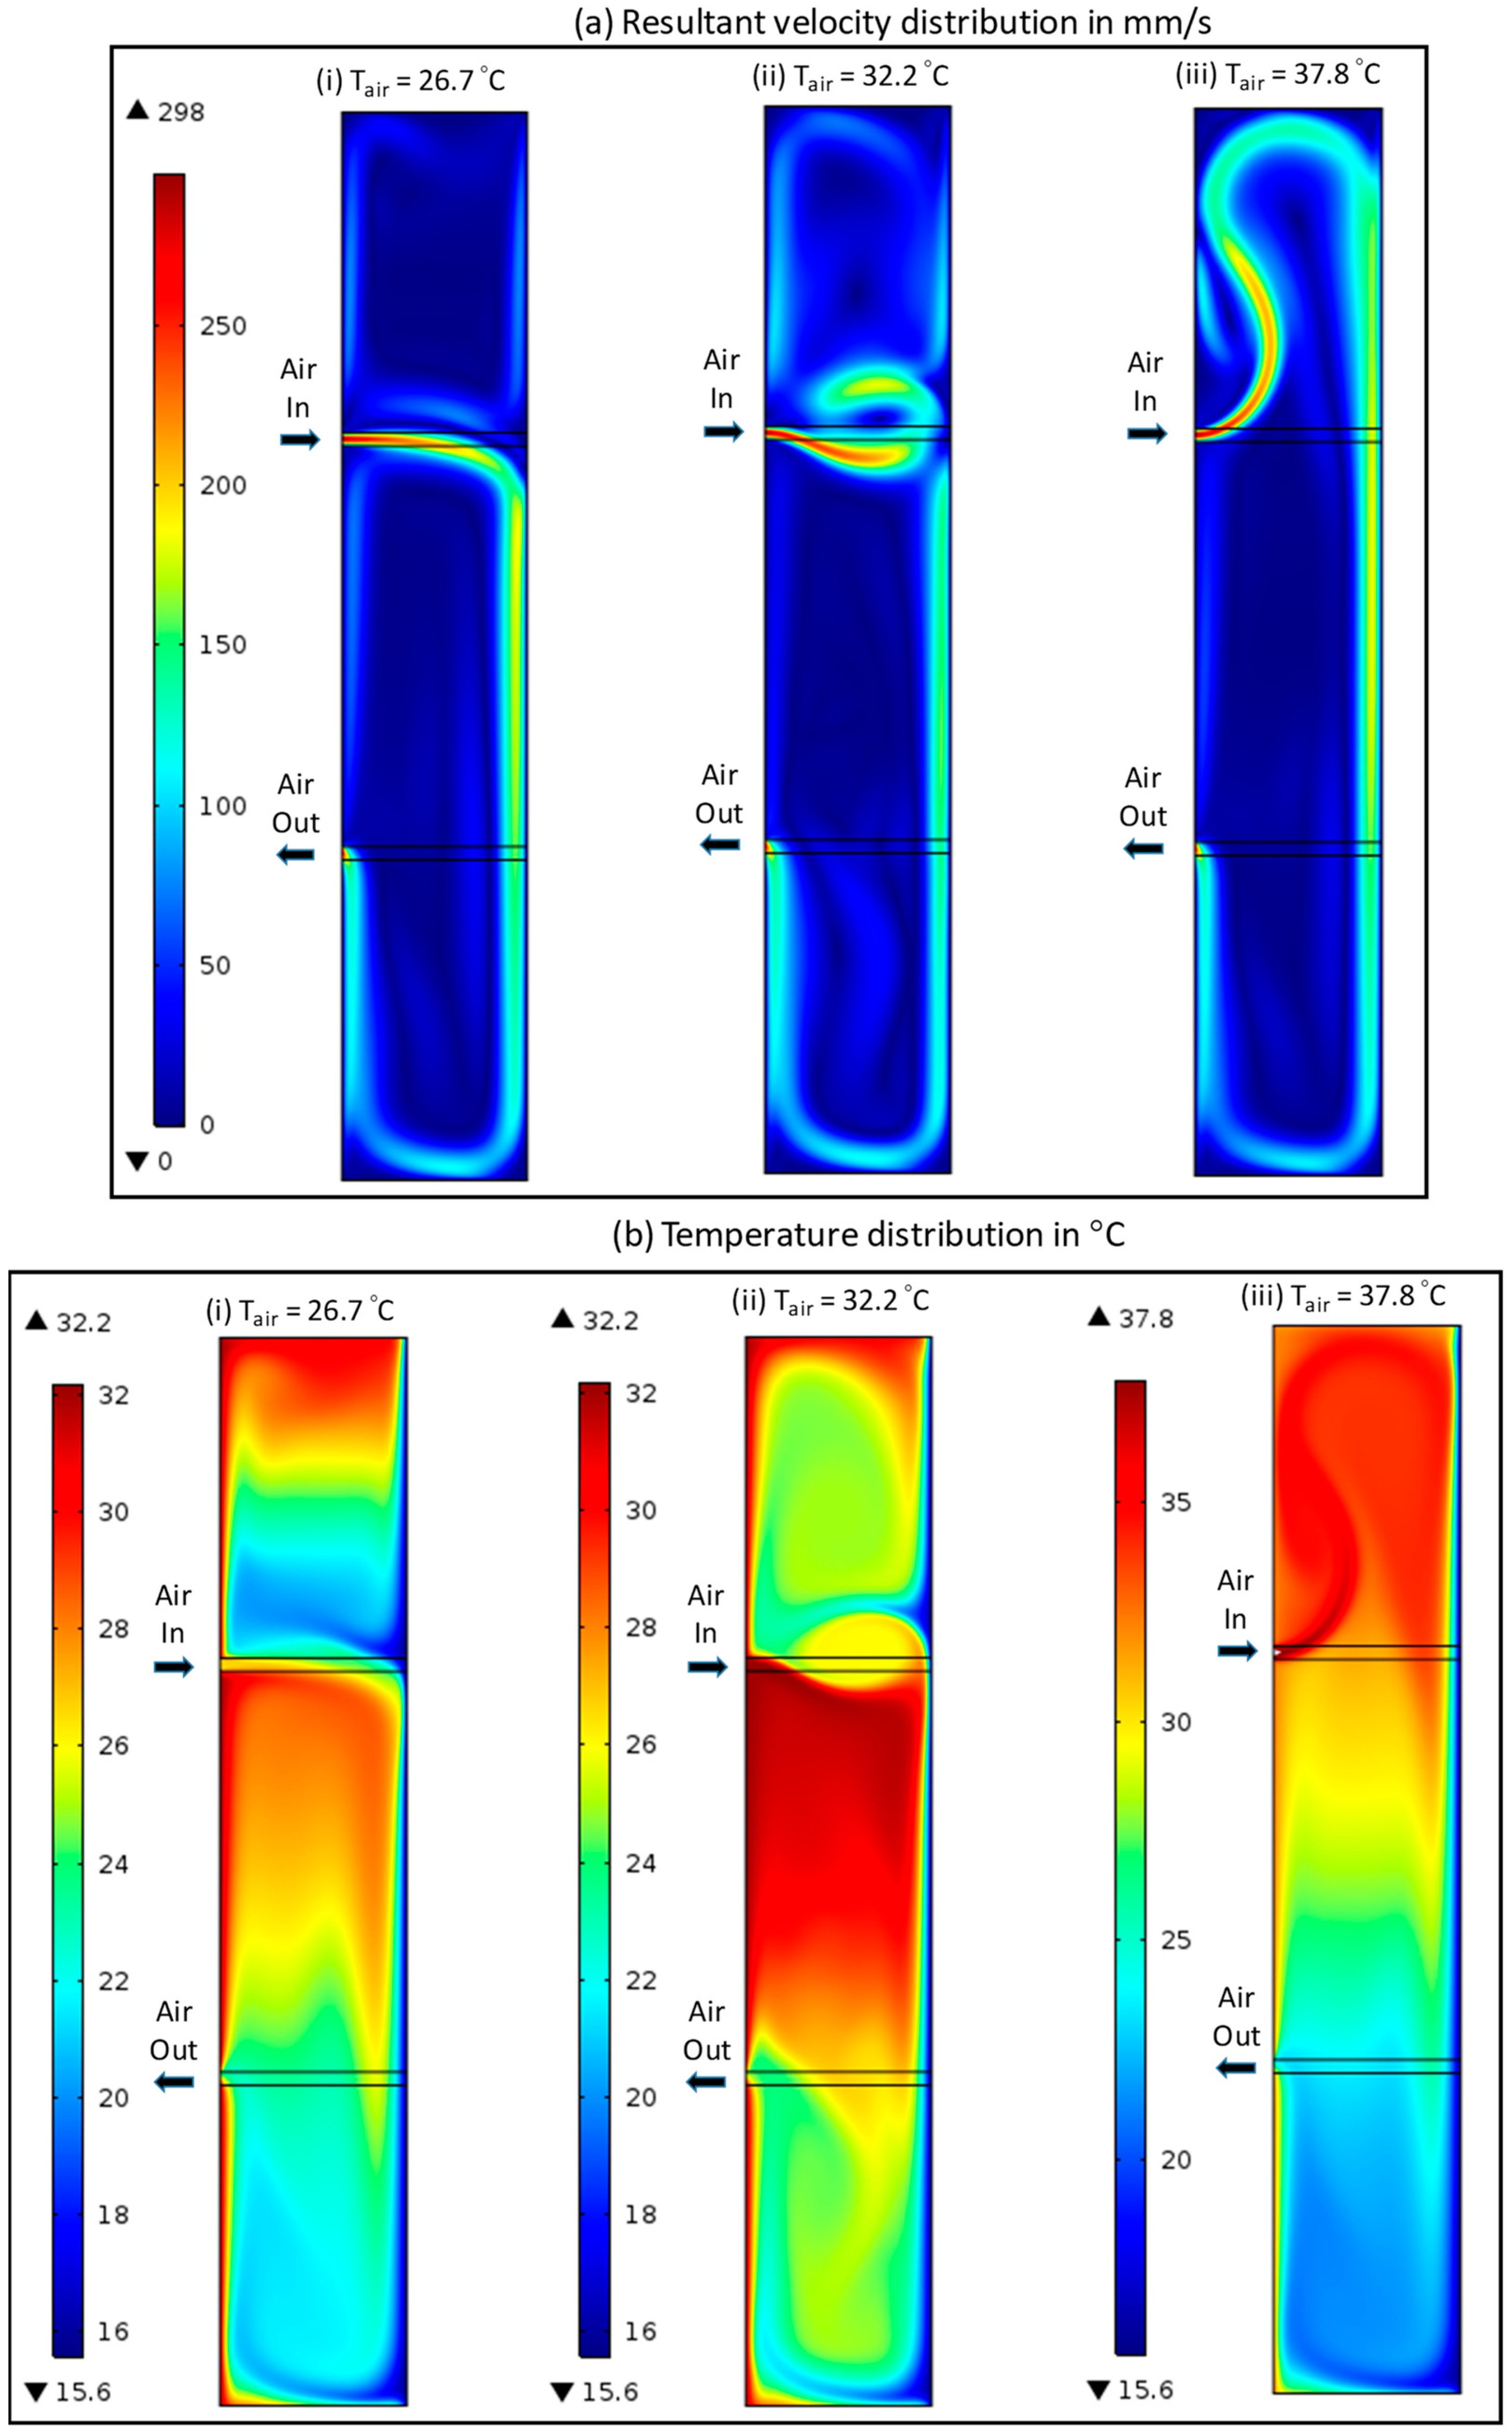
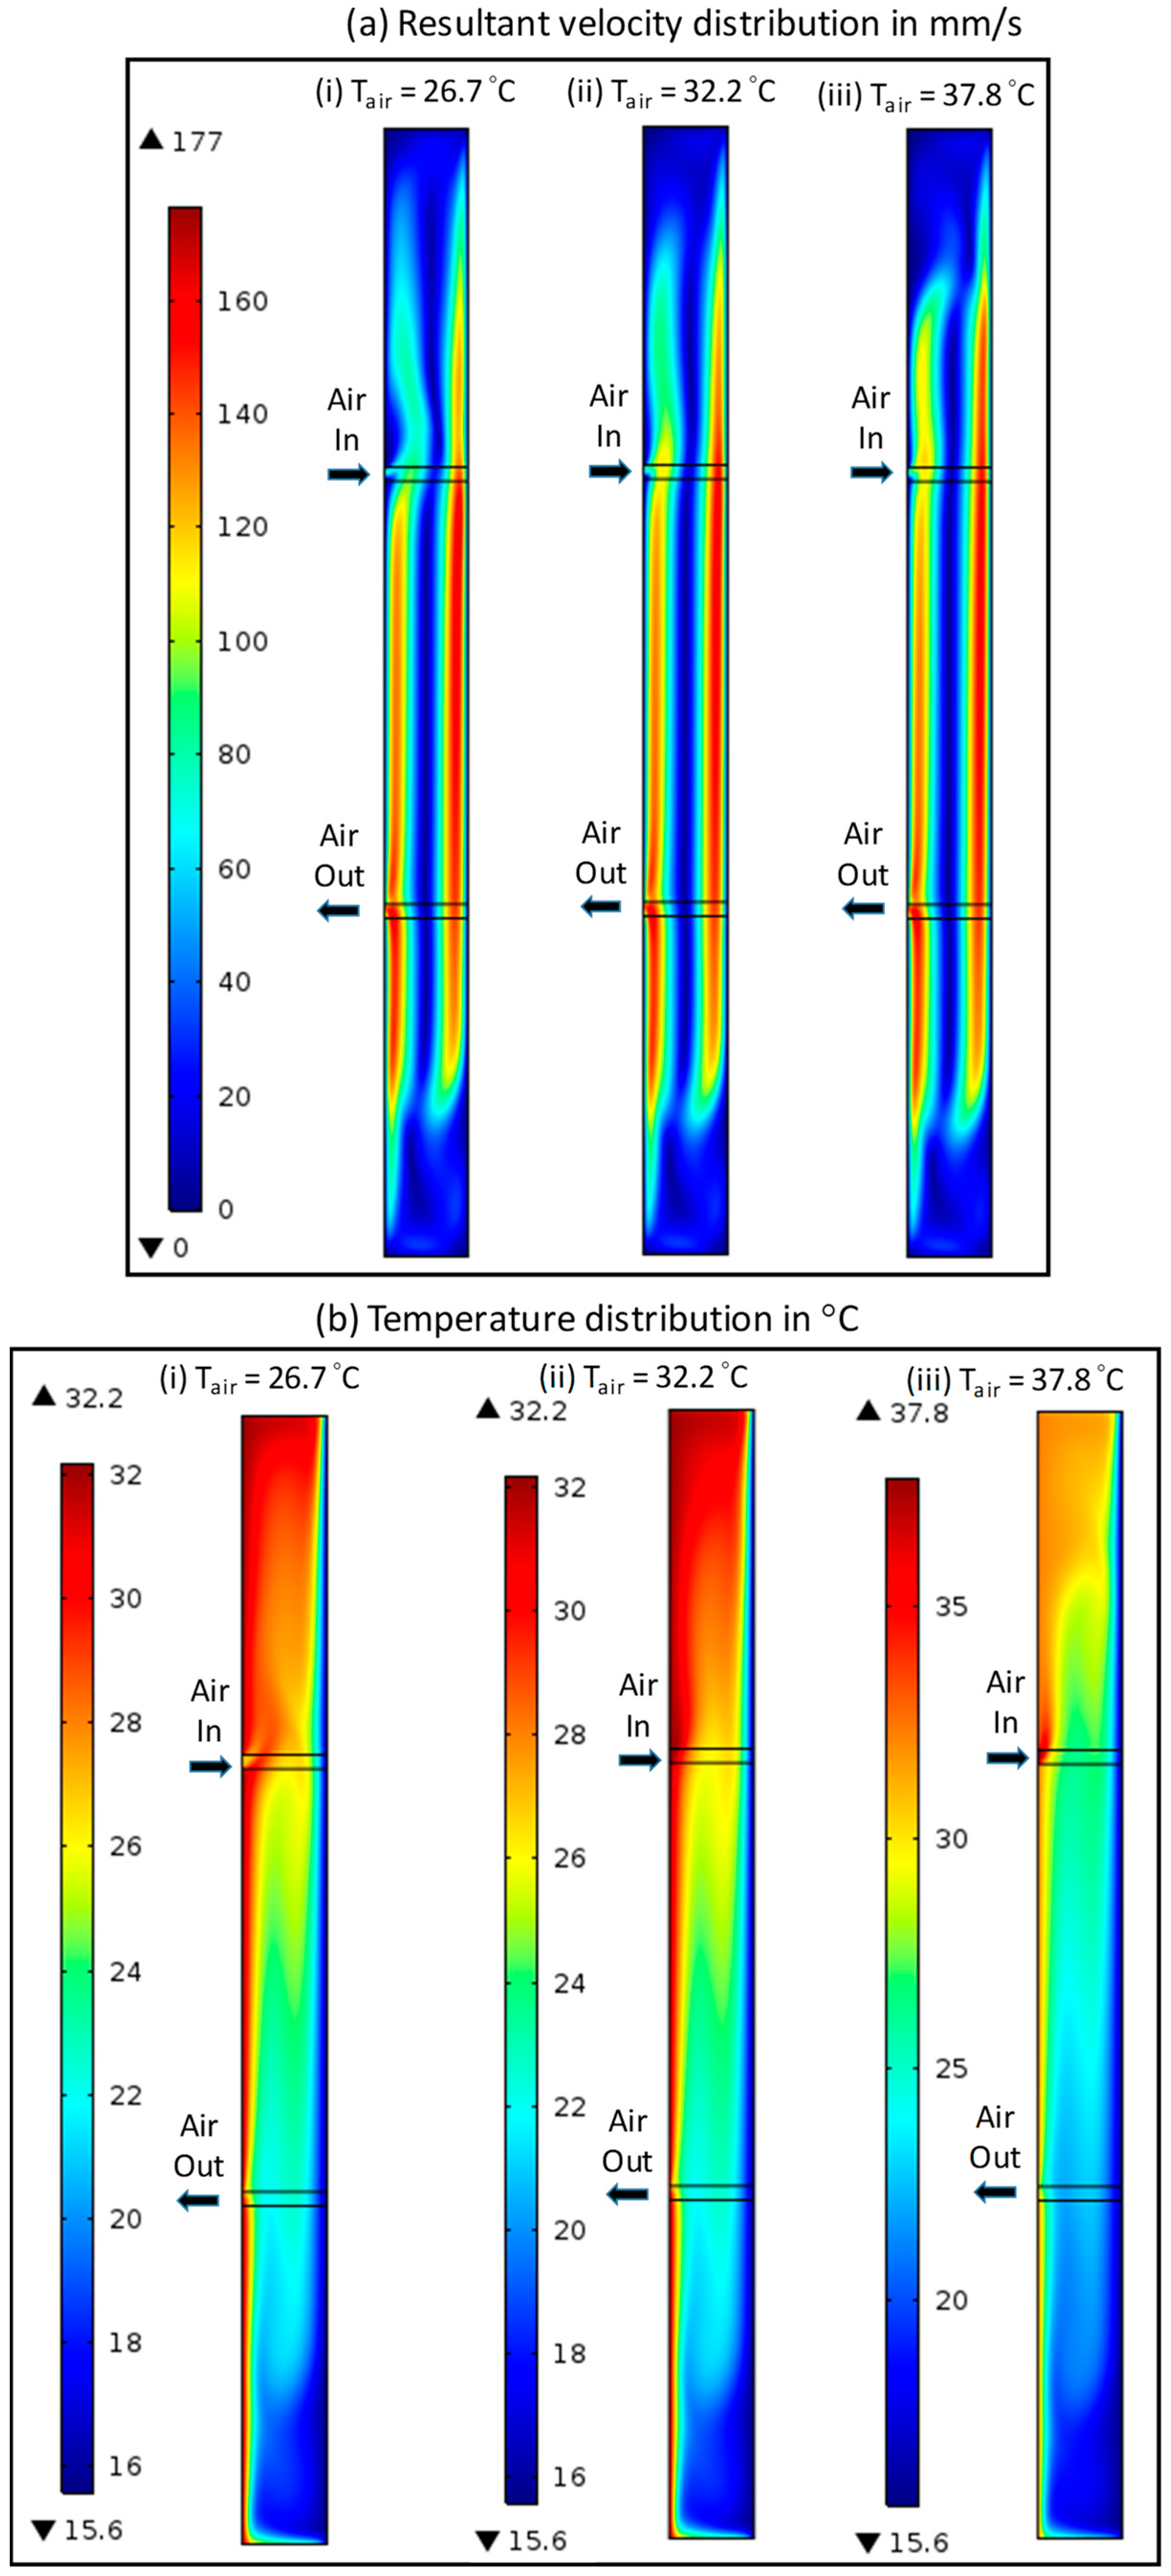
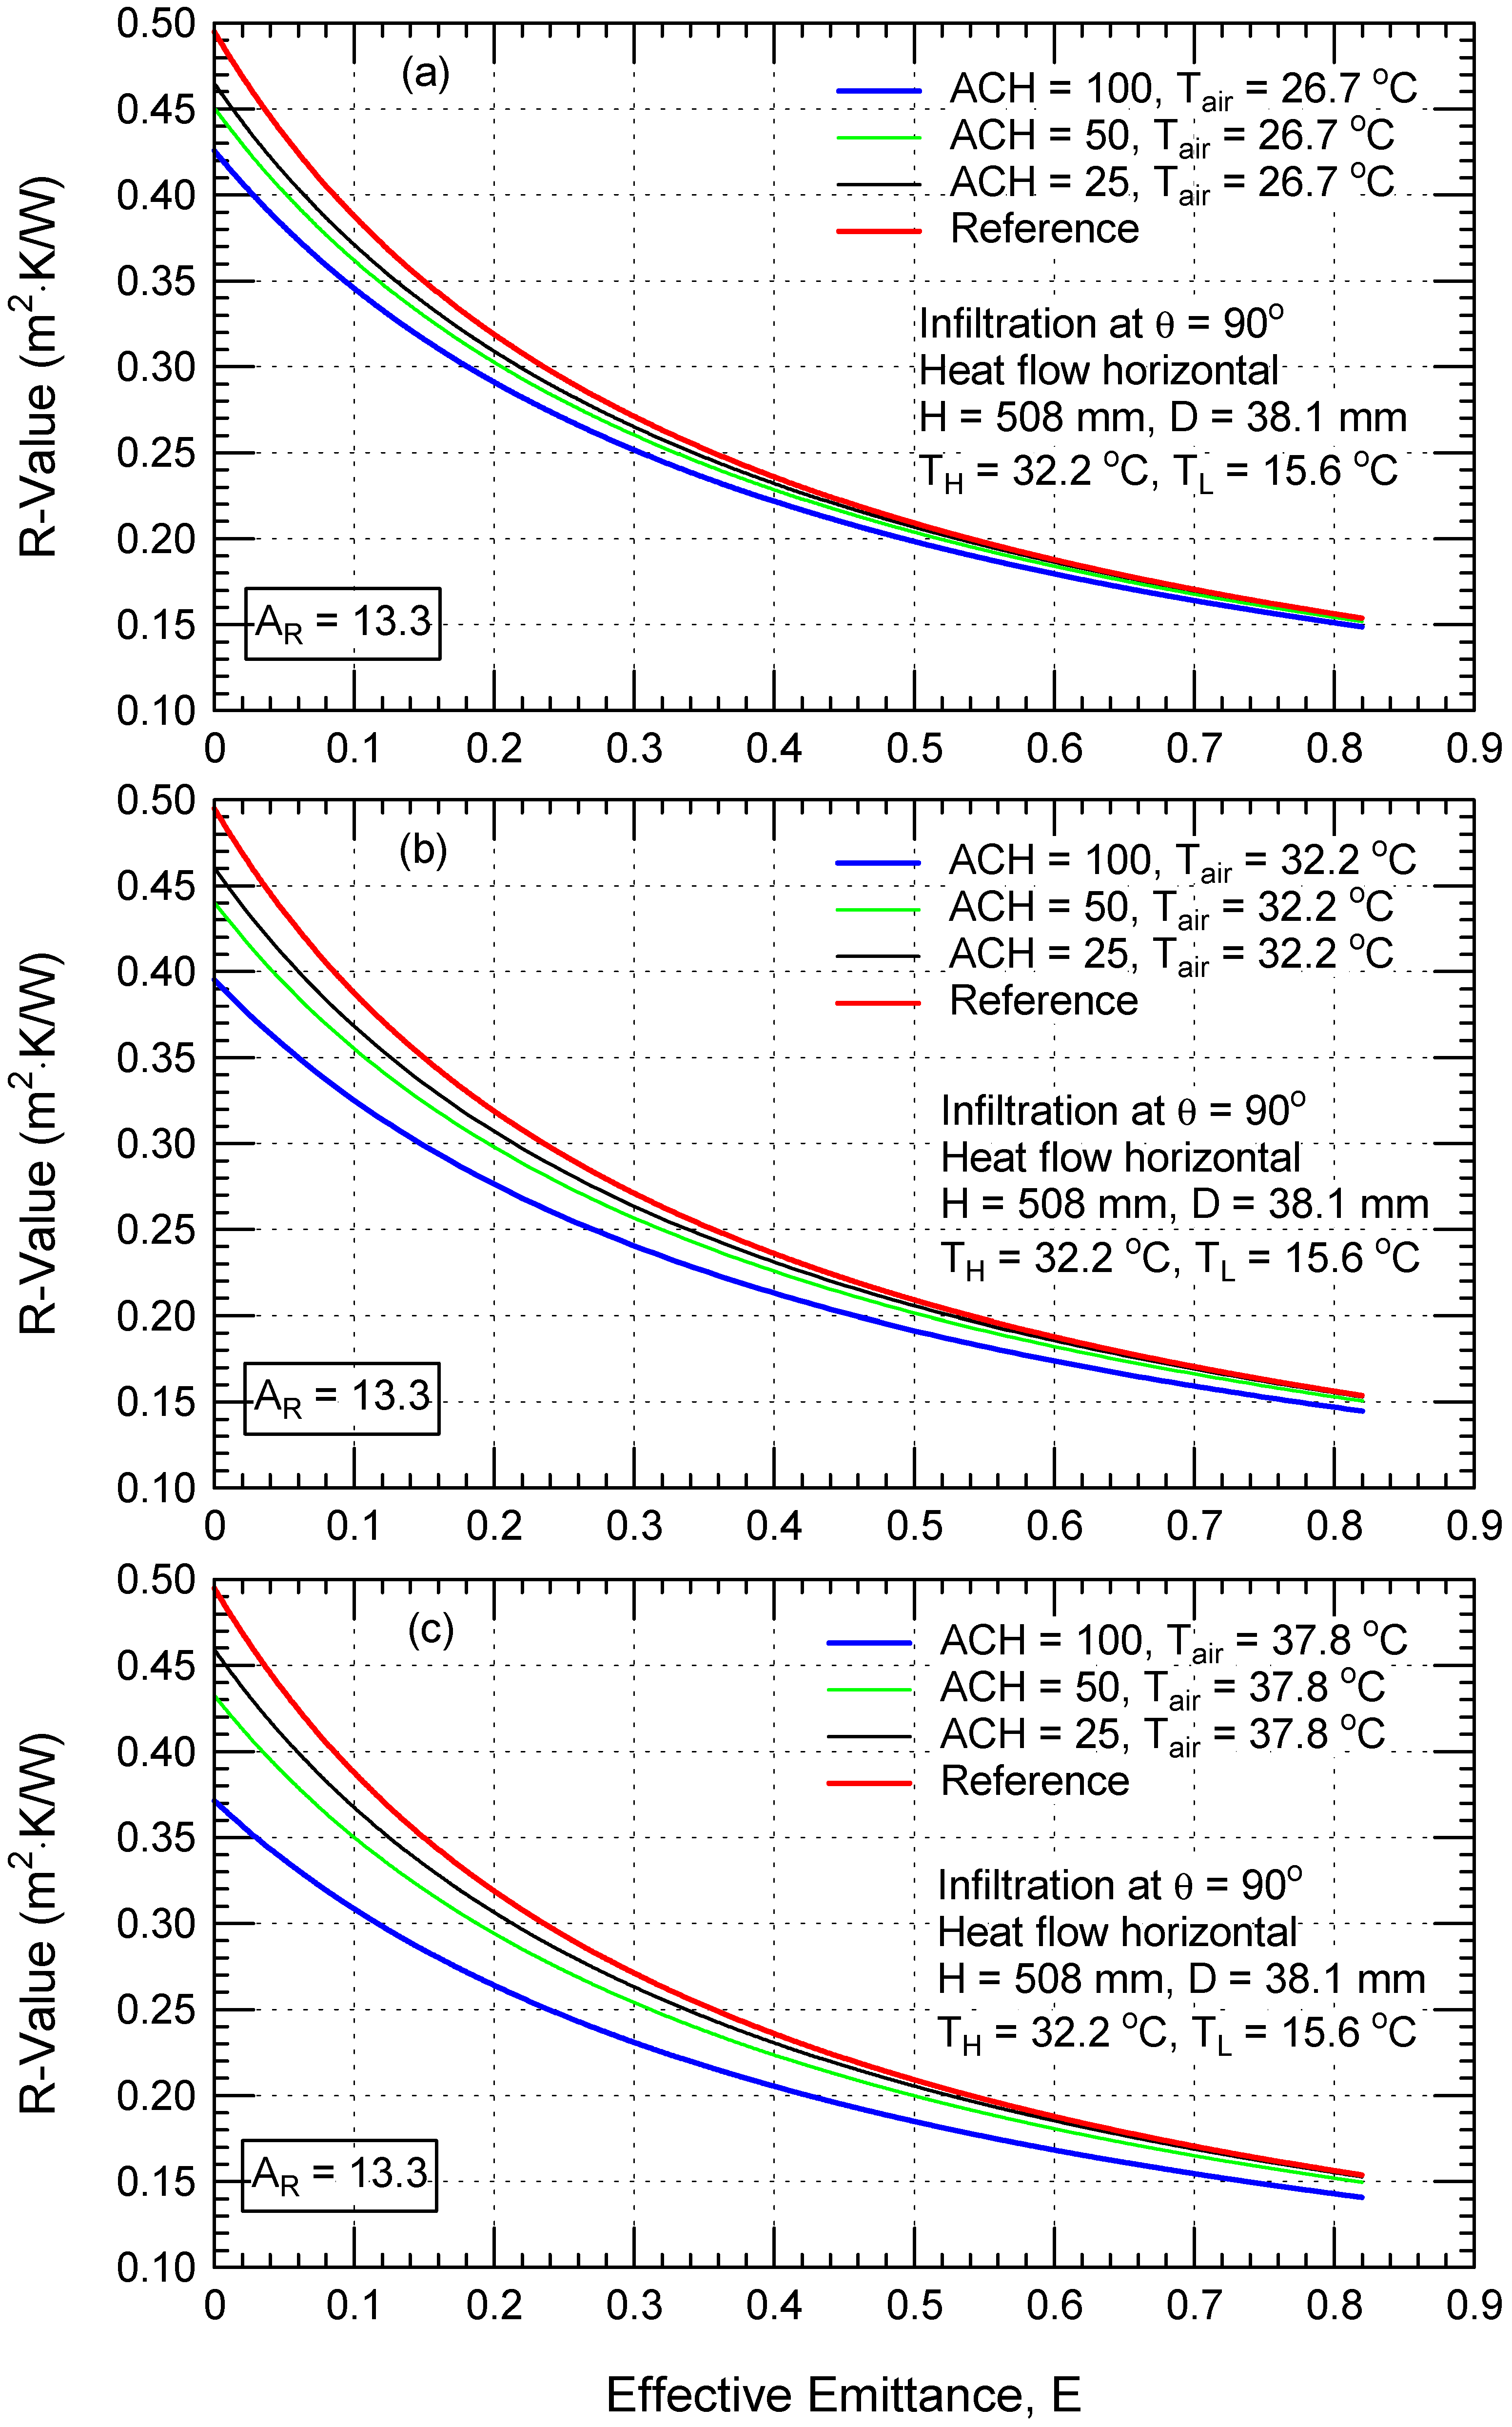
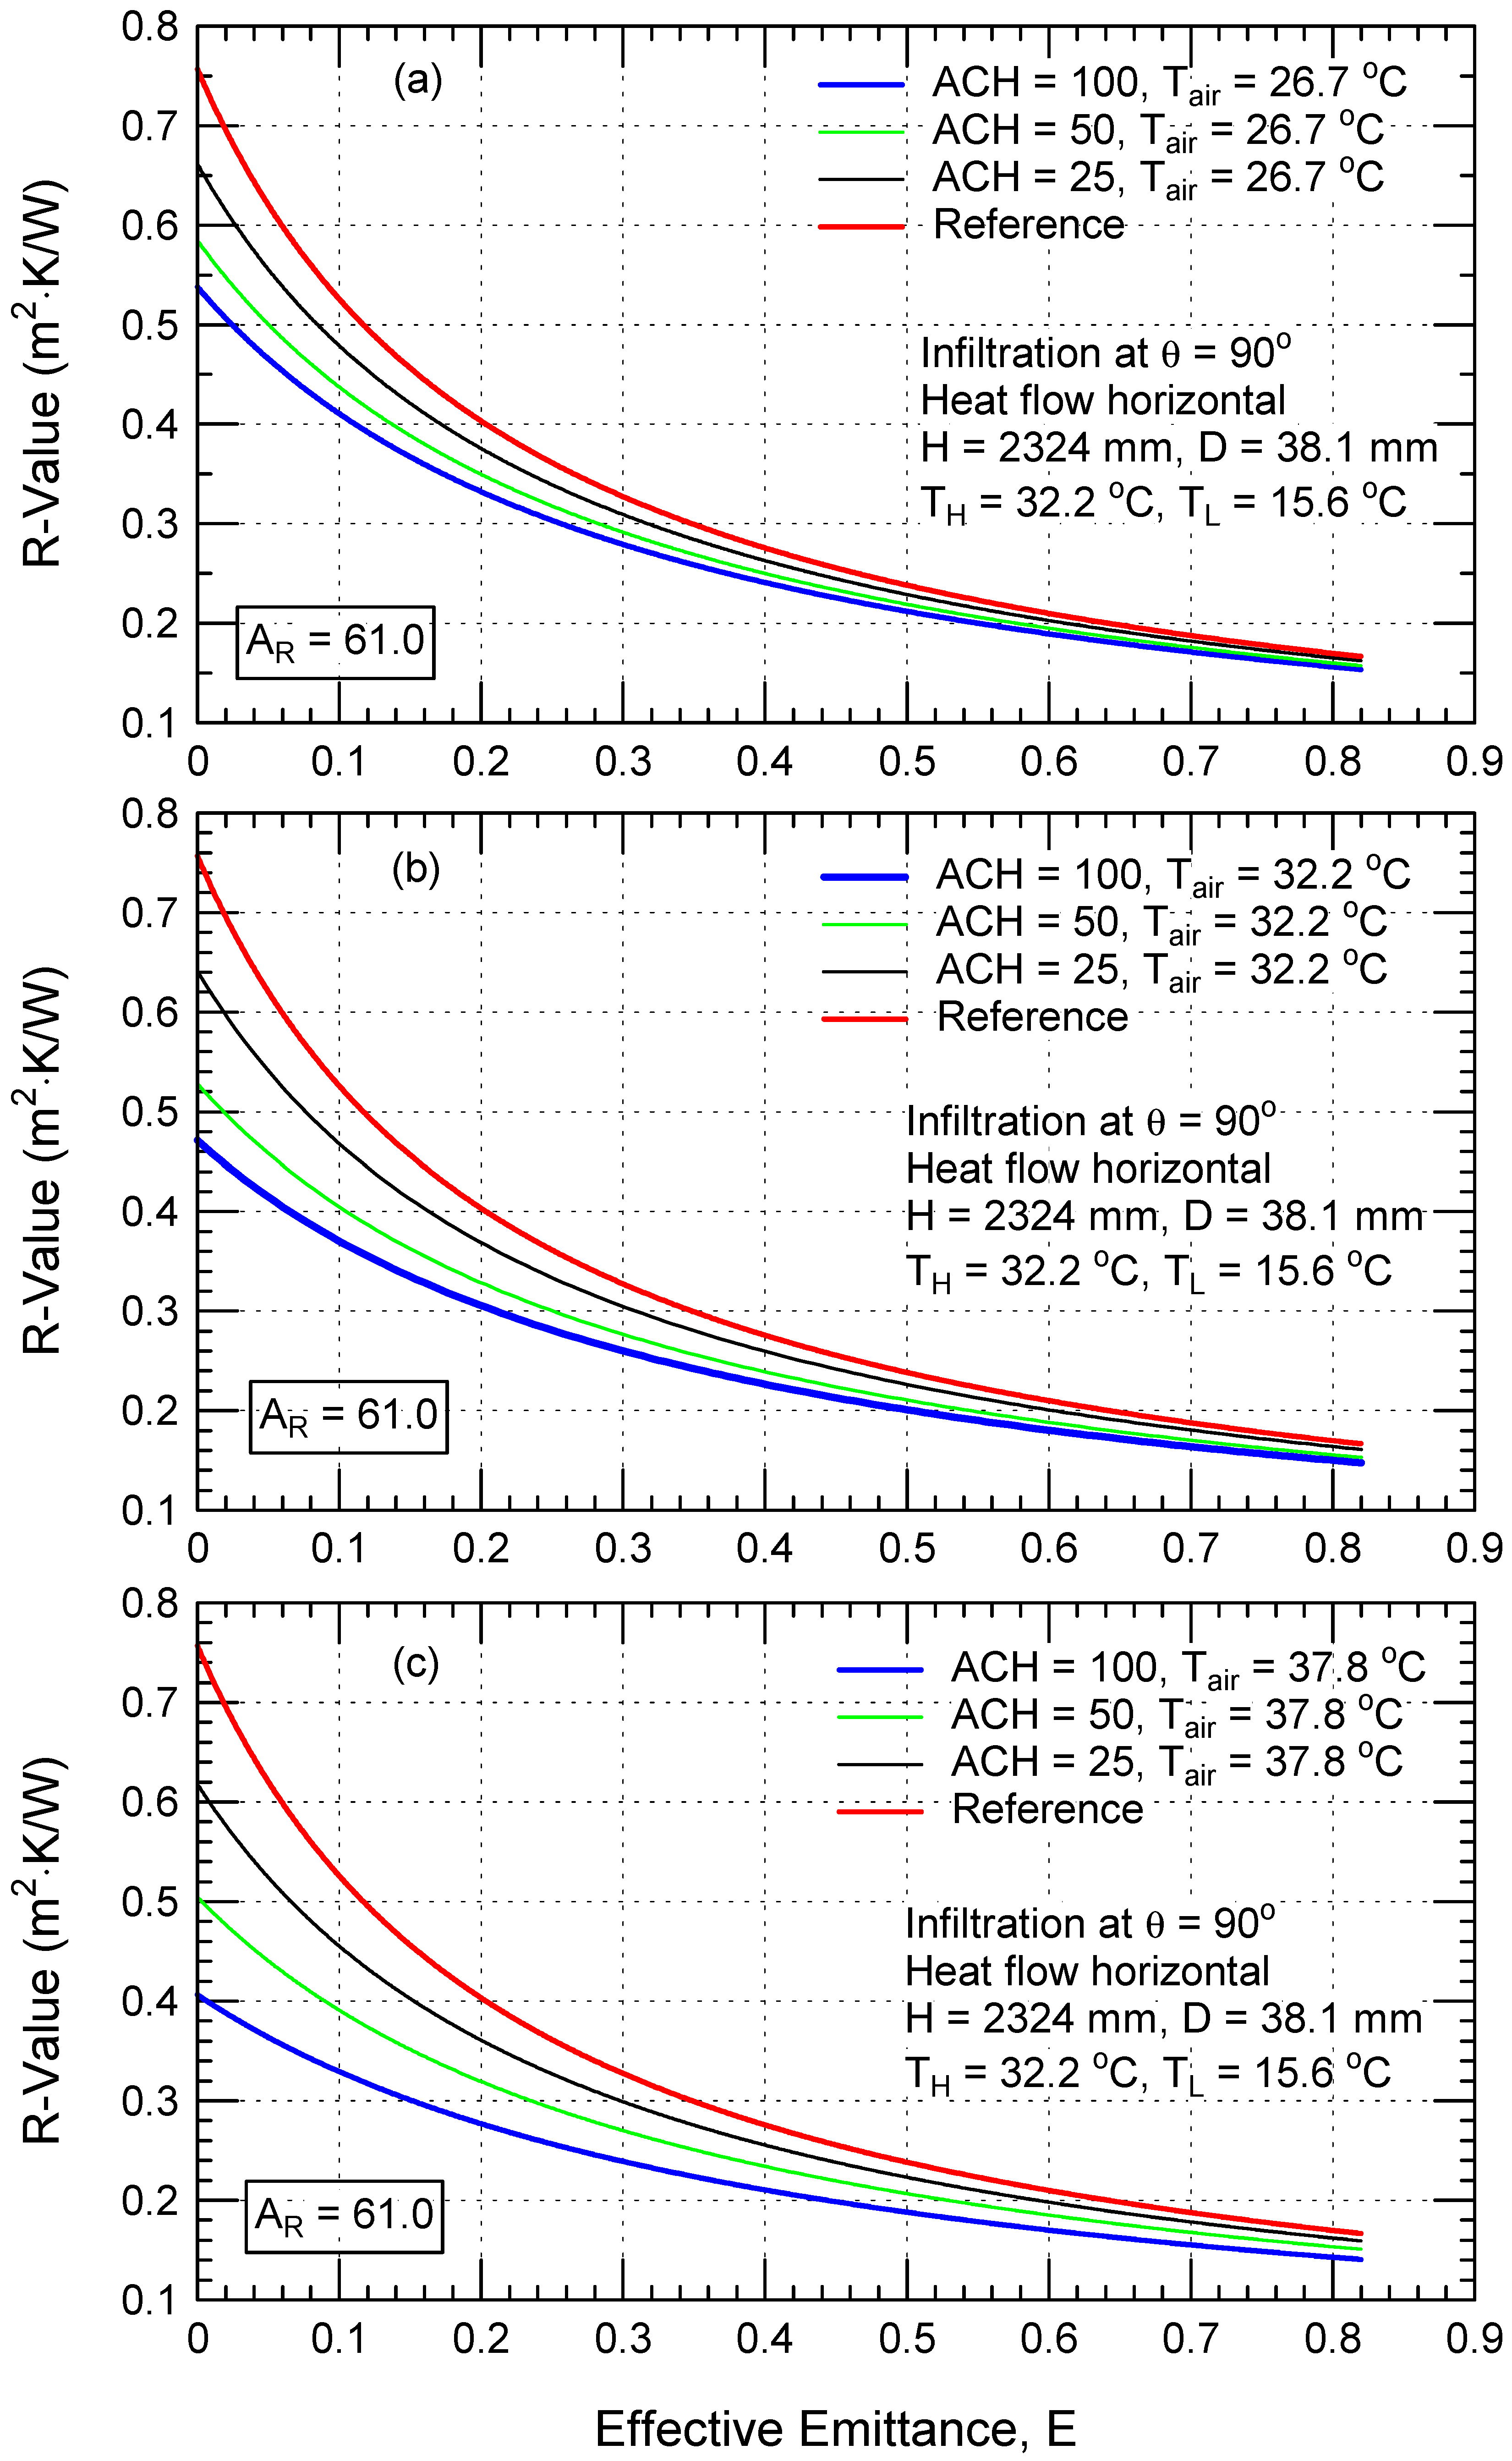
4.2. R-Values of Reflective Insulation Assemblies with Infiltration

To investigate the sensitivity of the R-values to air infiltration of various ACH values at different exterior air temperatures Tair, numerical simulations were completed for two cases. The first case represents a reflective insulation assembly of 508 mm and 2324 mm length and 38.1 mm thickness (i.e., AR = 13.3 and 61.0), subjected to hot surface temperature TH of 32.2 °C and cold surface temperature TL of 15.6 °C (Figure 5c). The second case is the same as the first case but with 88.9 mm thickness, and aspect ratio values of 5.7 and 26.1. To determine the amount of the reductions in the R-values due to air infiltration at various conditions, a reference case (i.e., ACH = 0; see Figure 5a) is simulated to provide the performance of the reflective insulation assembly without air infiltration. Similar to the case of wind washing condition, the average of the hot surface temperature and cold surface temperature for the simulated cases is 23.9 °C, while the incoming air temperatures from the exterior hot side of the reflective insulation assembly Tair are 26.7 °C (<TH), 32.2 °C (the same as TH) and 37.8 °C (>TH). Note that for a given climatic condition, the exterior air temperature Tair could happen to be less than TH, equal to TH, and greater than TH during the same day.
For a wide range of E from 0.0 to 0.82 at various ACH values, Figure 10a–c shows the effect of the exterior air temperature Tair on the R-value of assemblies with H = 508 mm and D = 38.1 mm. Similar to the wind washing condition, the impact of the infiltration condition on the R-value increases as the difference between the temperature of the incoming air Tair and the undisturbed temperature of the cavity increases. The impact of the infiltration condition also increases as the rate of infiltration (in terms of ACH) increases. As shown in Figure 10a–c for various ACH values at different Tair, the reduction in R-value for an assembly with effective emittance E > 0.5 is insignificant. Furthermore, this reduction increases with decreasing effective emittance. At E = 0.03 for the case of ACH 100 at Tair of 26.7 °C (<TH), the reduction in the R-value for a reflective insulation assembly of D = 38.1 mm and H = 508 mm under infiltration condition is 14.82% (Figure 10a and Table 2) versus only 2.61% for the same assembly under wind washing condition (Figure 6a and Table 2). The corresponding reduction in the R-value at Tair of 32.2 °C (same as TH) for the infiltration condition is 23.10% (Figure 10b and Table 2) versus 10.33% for the same assembly under wind washing condition (Figure 6b and Table 2). Additionally, the corresponding reduction in the R-value at Tair of 37.8 °C (>TH) for the infiltration condition is 30.53% (Figure 10c and Table 2) compared to 17.58% for the same assembly under wind washing condition (Figure 6c and Table 2).
For a reflective insulation assembly 2324 mm long and 38.1 mm thick, Figure 11a–c show the effect of infiltration at various ACH values and different values of Tair on the R-values. For the same values of ACH, Tair, D, and E, these figures show that the R-value for the long assembly (H = 2324 mm) is greater than for the short assembly (H = 508 mm; see Figure 10a–c), but the reduction in the R-value for the long assembly is more than that for the short assembly. For example, at E = 0.03 and ACH = 100 for an assembly of D = 38.1 mm, the reduction in the R-value for the long assembly (H = 2324 mm) at Tair of 26.7 °C (<TH) is 35.80% (Figure 11a and Table 2), which is more than that for the short assembly of H = 508 mm (14.82%, Figure 10a and Table 2). The corresponding reduction in the R-value for the long assembly at Tair of 32.2 °C (same as TH) is 53.41% (Figure 11b and Table 2) versus 23.10% for the short assembly (Figure 10b and Table 2). Additionally, for the long assembly at Tair of 37.8 °C (>TH), the corresponding reduction in the R-value is 76.11% (Figure 11c and Table 2), which is about 2.5 times the R-value reduction for the short assembly (30.53%, Figure 10c and Table 2).
For the full range of effective emittance in a thick reflective insulation assembly with D = 88.9 mm, Figure 12 and Figure 13, respectively, show the effect of infiltration of various values of ACH at different exterior air temperatures for assemblies of H = 508 mm and H = 2324 mm. As shown in these figures, the trends/shapes of the curves showing the dependence of the R-value on the effective emittance for a reflective insulation assembly of large thickness are similar to those for the assembly of small thickness (see Figure 10 and Figure 11 for D = 38.1 mm). As indicated earlier, for the same values of ACH and D, the long assembly would have a larger amount of the volumetric flow rate of the air entering the assembly, resulting in a greater reduction in the R-value compared to the short assembly. For example, for the long assembly (H = 2324 mm) of D = 88.9 mm and E = 0.03 with exterior temperature 26.7 °C (<TH) and ACH of 100, the reduction in the R-value is 58.11% (Figure 13a and Table 2) compared to 54.32% for the short assembly (H = 508 mm, Figure 12a and Table 2). At Tair of 32.2 °C (same as TH), the corresponding reduction in the R-value for the long assembly is 103.04% (Figure 13b and Table 2) versus 81.78% for the short assembly (Figure 12b and Table 2). Furthermore, at Tair of 37.8 °C (>TH), the corresponding reduction in the R-value for the long assembly is 145.28% (Figure 13c and Table 2); this reduction is greater than that for short assembly (101.57%, Figure 12c and Table 2).
The results of the reductions in the R-values for reflective assemblies of different dimensions and various ACH values under infiltration condition at effective emittance of 0.03 and 0.05 are summarized in Table 2, along with those for the cases under wind washing condition. As shown in this table for reflective insulation assemblies with the same values of ACH, Tair, H, D, and E, the reductions in the R-values due to the infiltration condition are greater than those due to the wind washing condition. As an example, for a reflective insulation assembly 508 mm long and 88.9 mm thick with ACH values of 25, 50, and 100, respectively, at Tair of 32.2 °C, the reductions in the R-values due to the infiltration condition are 12.60%, 26.80%, and 81.78% at E = 0.03, and 12.00%, 25.45%, and 77.90% at E = 0.05 (Figure 12b and Table 2), which are about twice those for the same assembly due to wind washing condition (4.80%, 12.65%, and 39.06% at E = 0.03, and 4.51%, 12.05%, and 37.23% at E = 0.05; Figure 8b and Table 2). For wall systems with reflective insulations, the rate of air intrusion from the exterior side to the interior side (i.e., infiltration condition) depends mainly on the characteristics of the air barrier systems. As the air infiltration, sometimes called air leakage, could result in a significant reduction in the R-value, it is important to ensure the continuity in the air barrier systems in order to reduce the air leakage rate, and thus minimize the reductions in the R-values of wall systems with reflective insulations.
In closing, the results for the effect of the infiltration condition on the R-value (Figure 10, Figure 11, Figure 12 and Figure 13 and Table 2) and those in the previous section for the effect of the wind washing condition on the R-value (Figure 6, Figure 7, Figure 8 and Figure 9 and Table 2) show that the reduction in the R-value due to the infiltration condition is greater than that due to the wind washing condition for the reflective insulation assemblies with the same parameters (i.e., same ACH, Tair, H, D, and E values). Additionally, the results for the effects of both the infiltration condition and wind washing condition on the R-value showed that:
(a)
The reductions in the R-values increase with increasing ACH value for assemblies with the same values of Tair, H, D, and E.
(b)
The reductions in R-values increase with increasing value of the exterior air temperature for assemblies with the same values of ACH, H, D, and E.
(c)
The reductions in the R-values increase with increasing length of assemblies with the same values of ACH, Tair, D, and E.
(d)
The reductions in R-values increase with increasing thickness of assemblies with the same values of ACH, H, Tair, and E.
Next, the results showing the sensitivity to the aspect ratio of the R-value of reflective insulation assemblies subjected to both the infiltration condition and the wind washing condition are discussed.

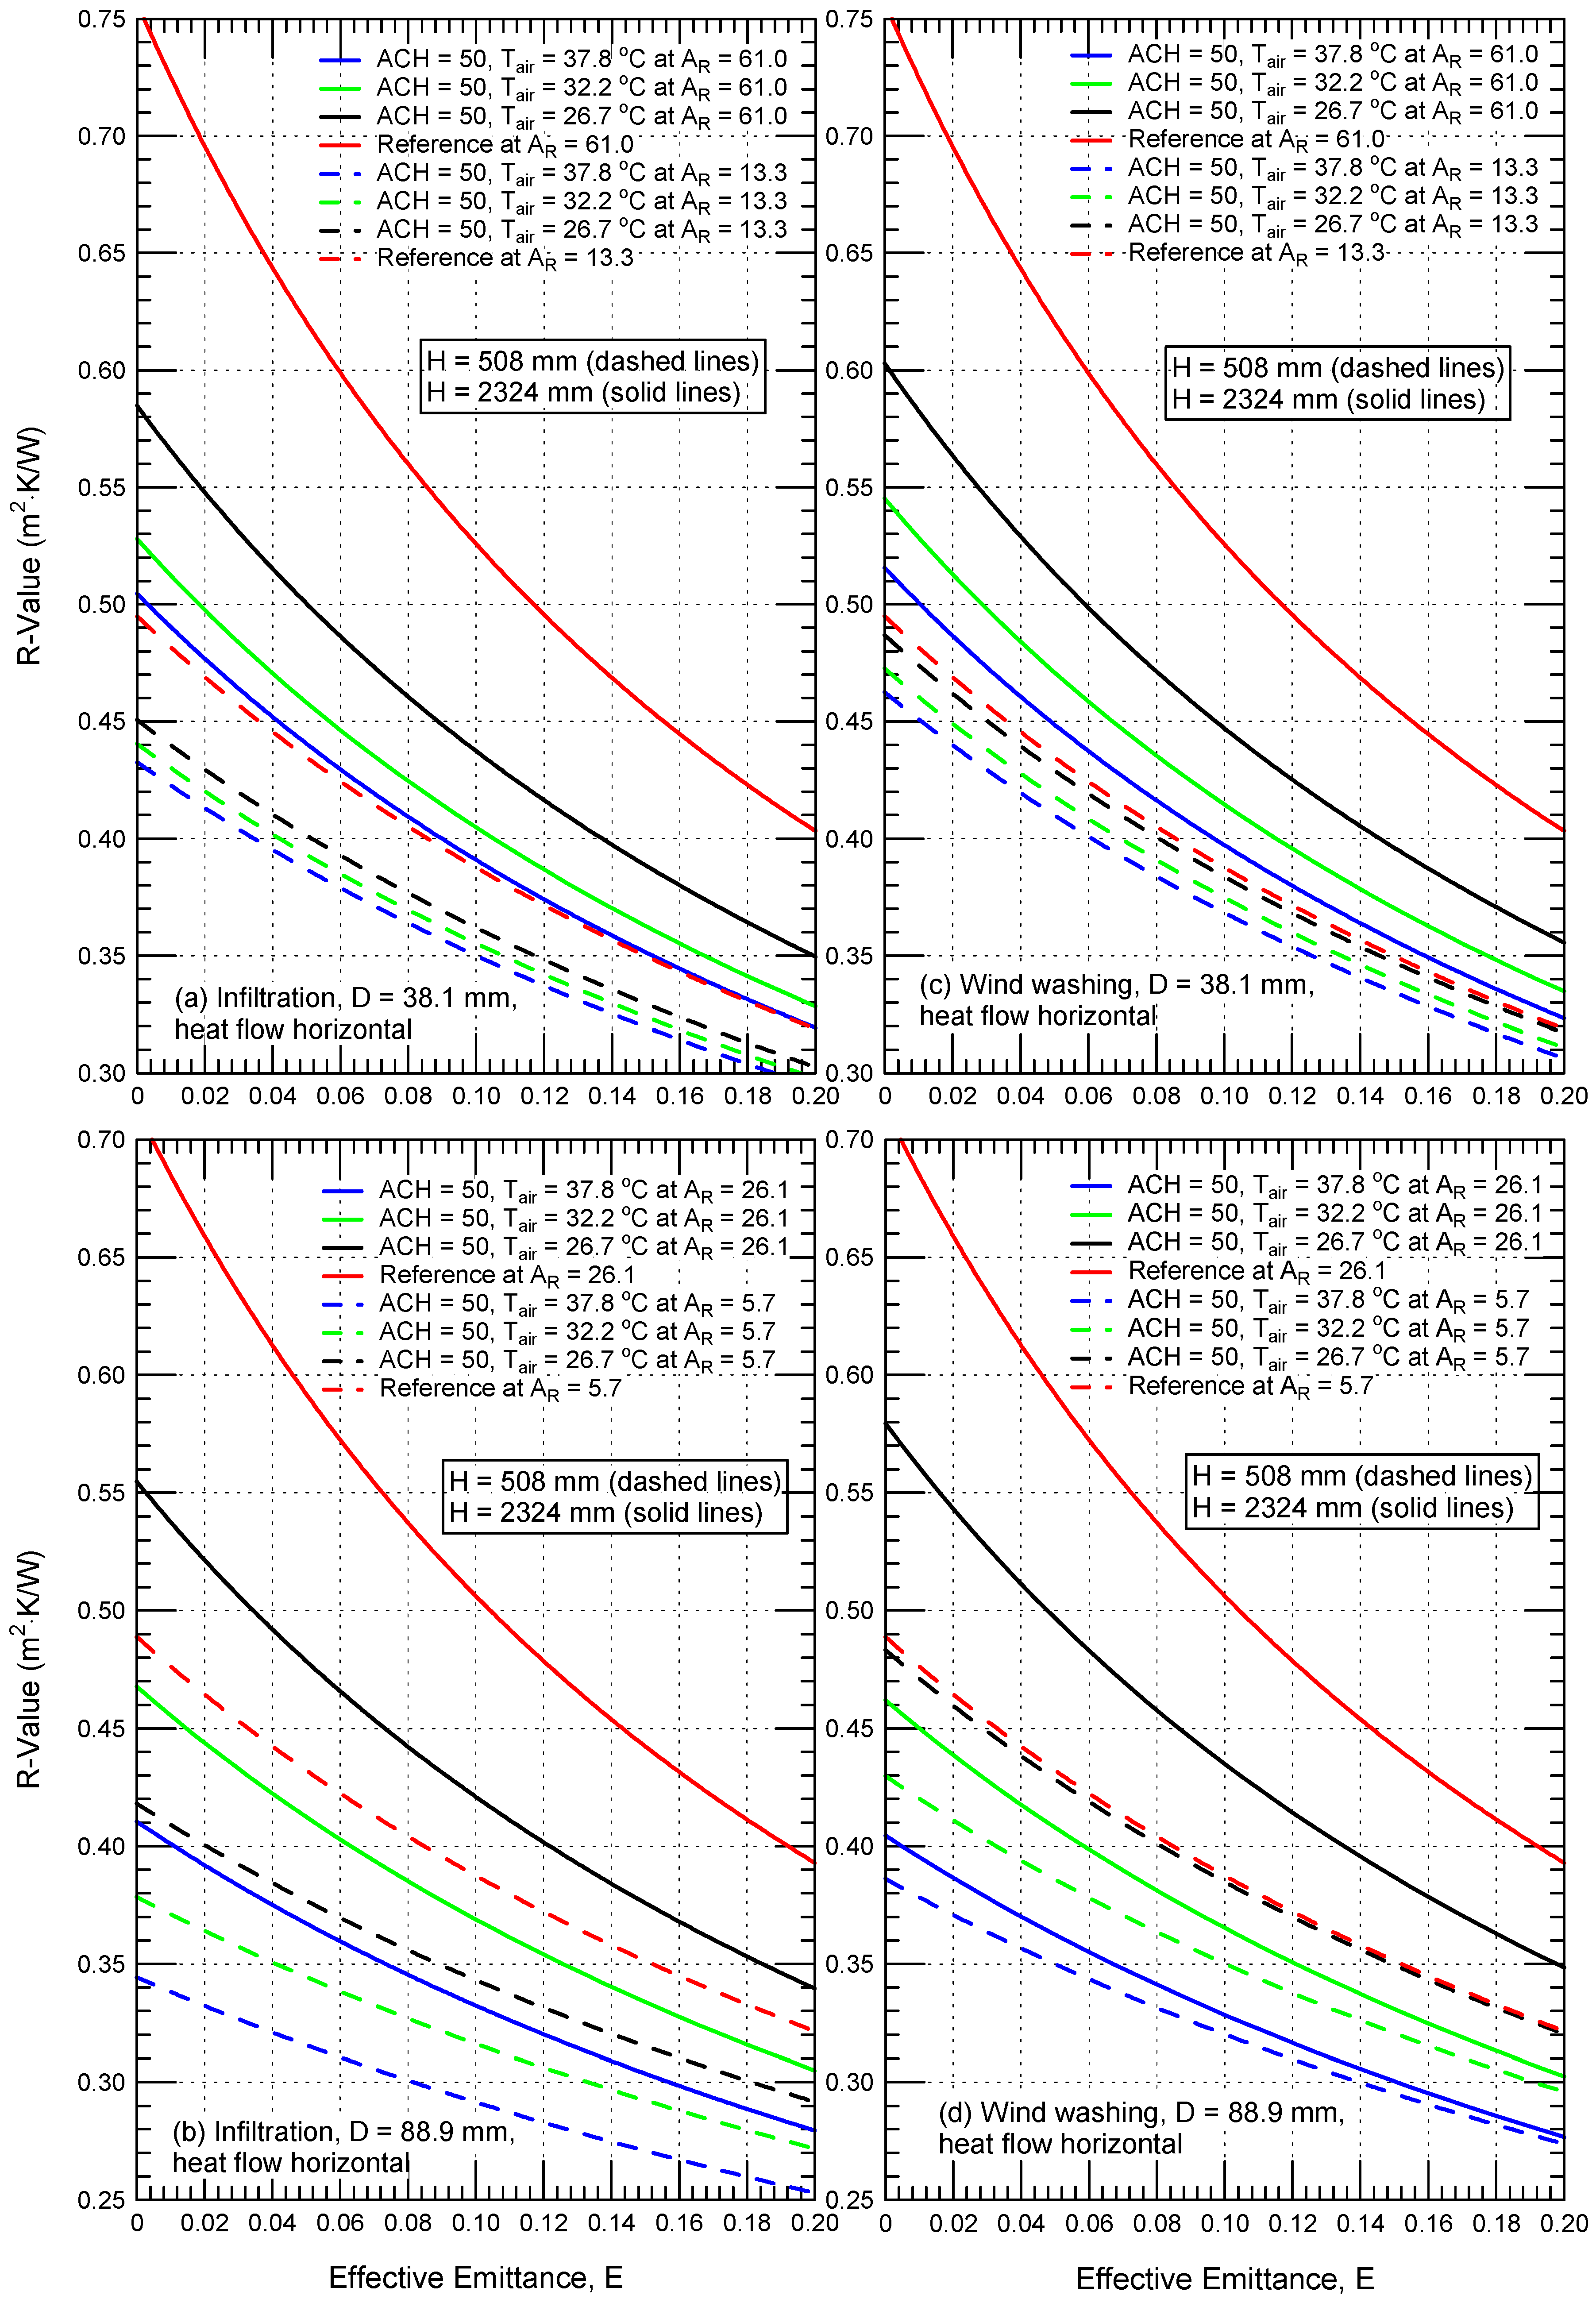
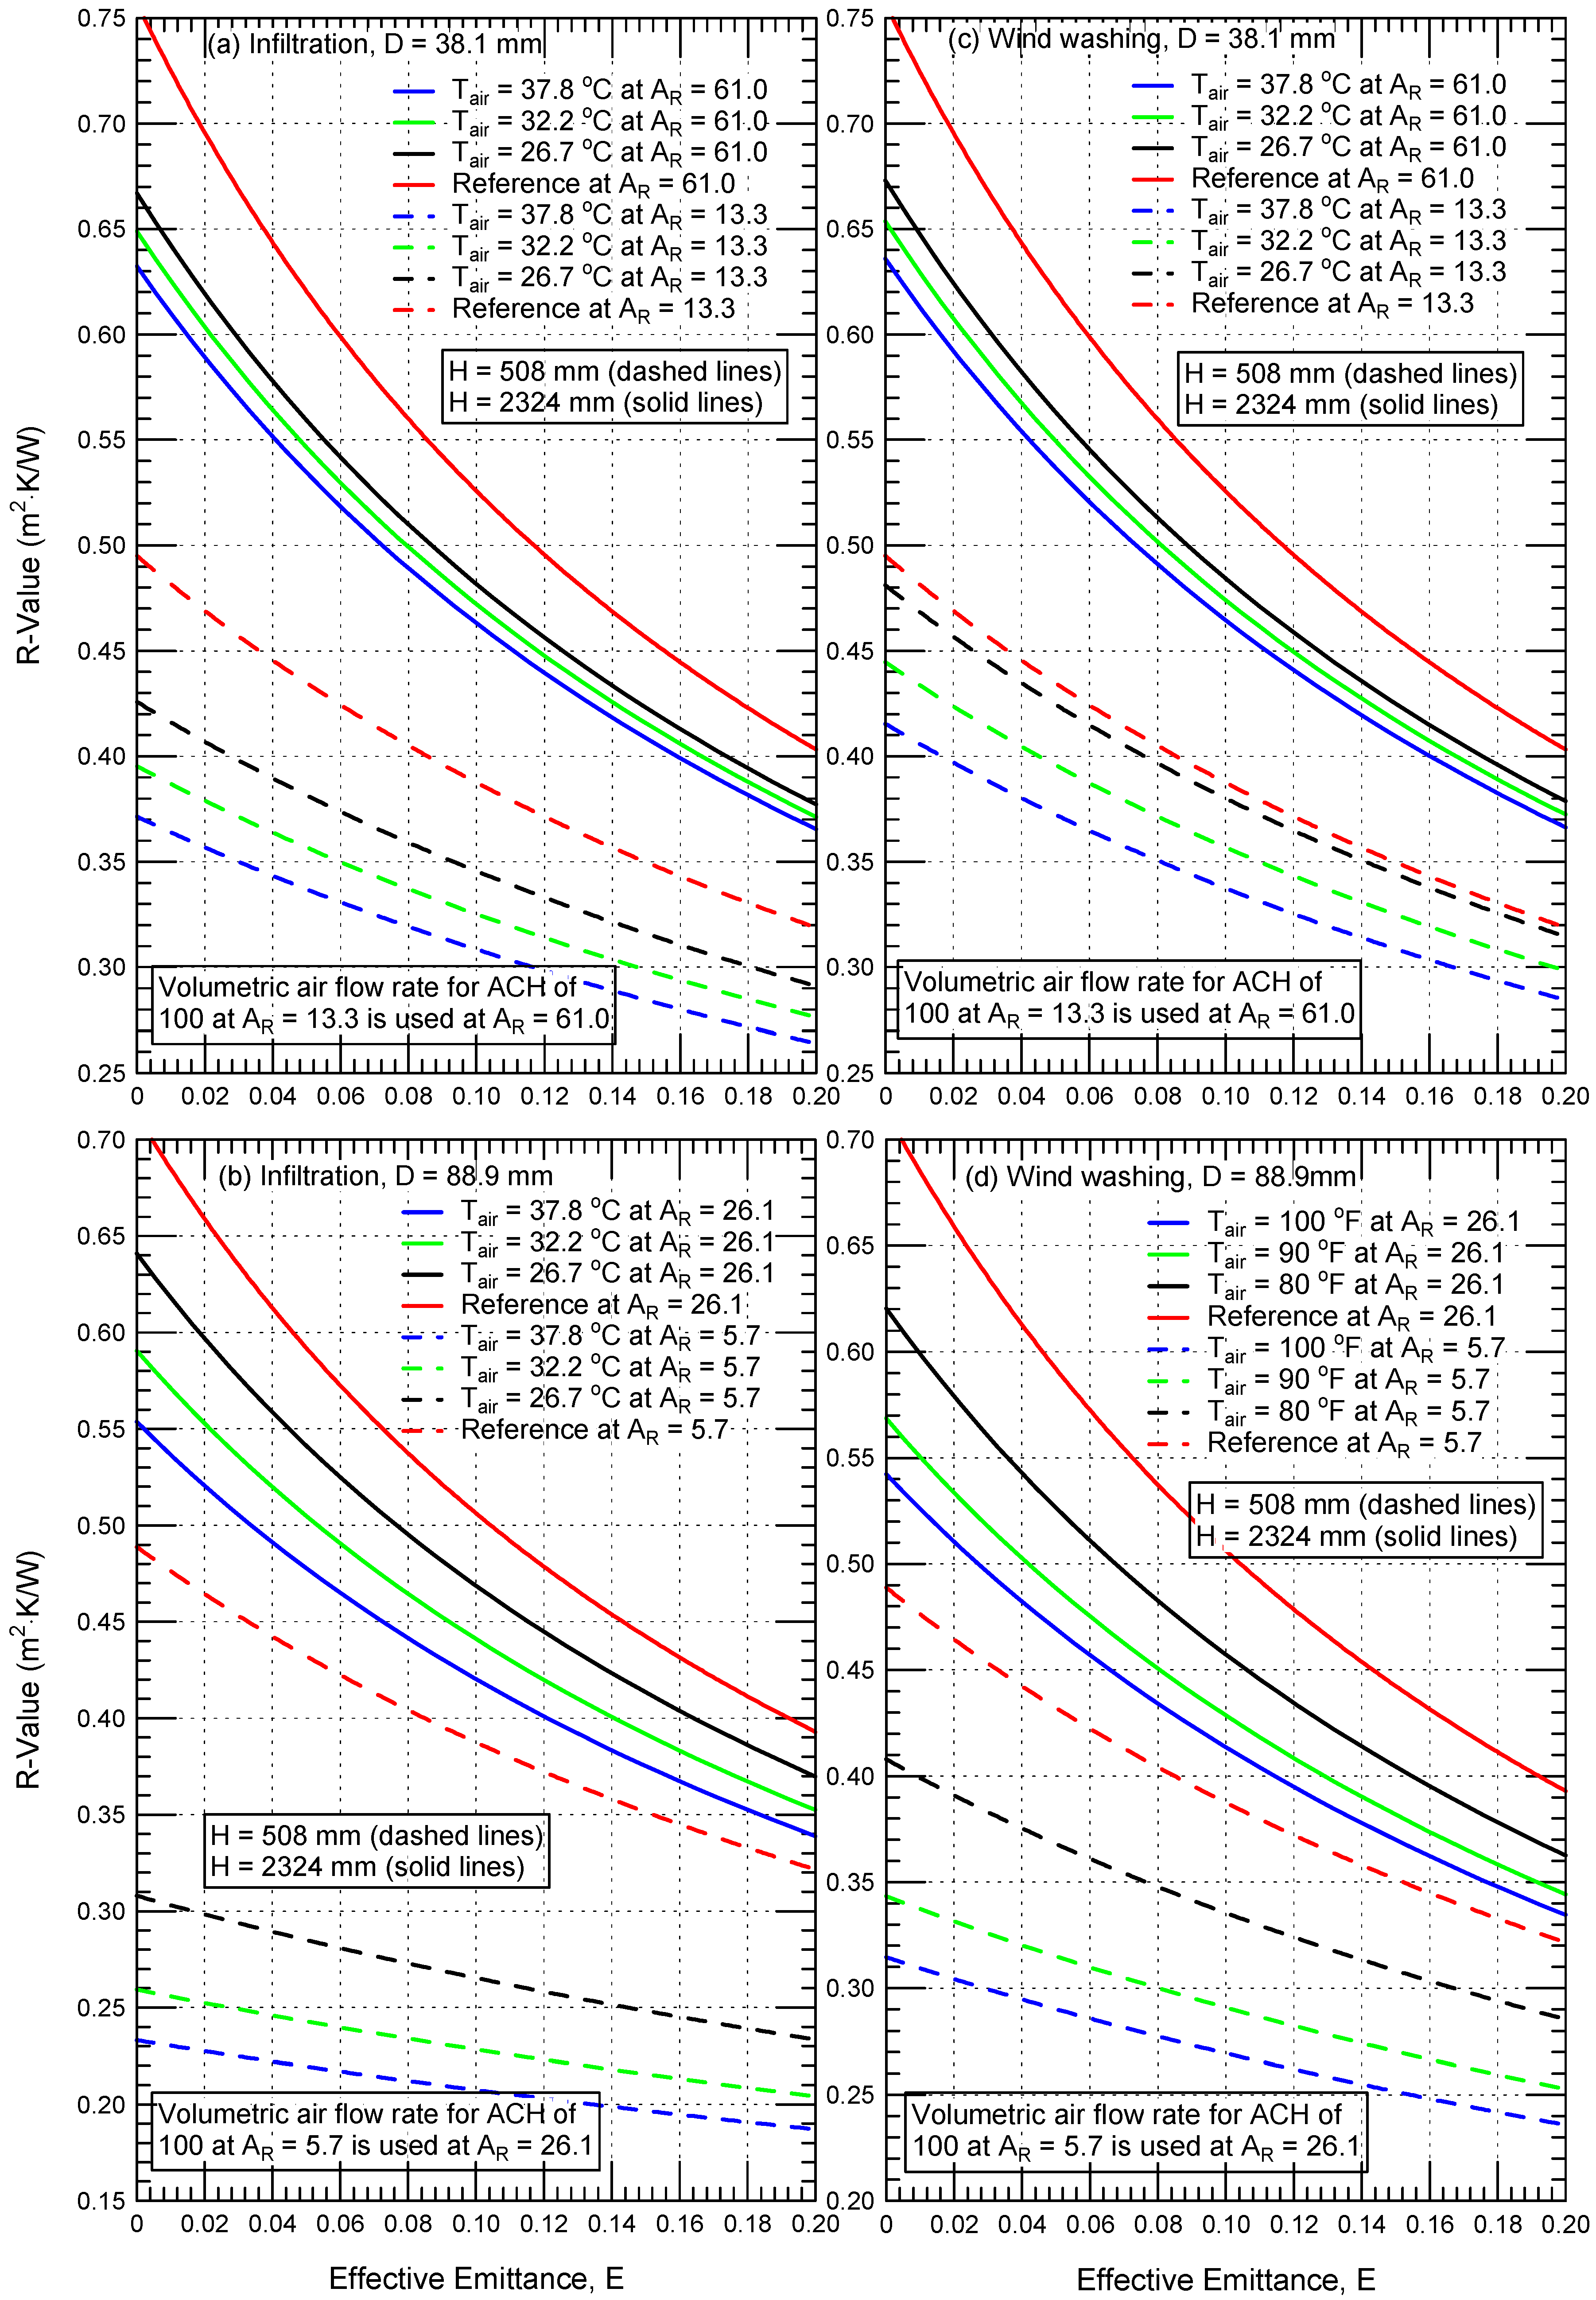
4.3. Effect of Aspect Ratio on R-Values

This section discusses the sensitivity to the aspect ratio, AR (AR = H/D, where H and D, respectively, are perpendicular and parallel to the heat flow direction; see Figure 5), of the R-values of reflective insulation assemblies subjected to both infiltration and wind washing conditions for two cases. The first case presents reflective insulation assemblies performing with the same value of ACH. The second case is for reflective insulation assemblies with the same value of volumetric flow rate of the air entering the assembly ( Q ˙ ). For hot surface temperature of TH = 32.2 °C and cold surface temperature of TL = 15.6 °C at different temperatures of the air from the exterior (Tair), the results of the numerical simulations provided in this section are for reflective insulation assemblies with: (a) H = 508 mm and 2324 mm at D = 38.1 mm, which results in the aspect ratios of 13.3 and 61.0; and (b) H = 508 mm and 2324 mm at D = 88.9 mm, which results in the aspect ratios of 5.7 and 26.1.

4.3.1. Reflective Insulation Assemblies with Same ACH Value

For the case in which ACH = 50, Figure 14a,b and Figure 14c,d, respectively, show the effect of the aspect ratio on the R-values of reflective insulation assemblies due to infiltration and wind washing. In these figures, the solid lines represent large AR values, and the dashed lines represent small AR values. For reflective insulation assemblies of the same thickness (D) and same ACH value, the rate of the air intrusion entering the assembly (i.e., Q ˙ given in Equation (2)) with H = 2324 mm is 4.575 times that for the assembly with H = 508 mm. Additionally, for reflective insulation assemblies of the same values of H and ACH, the rate of the air intrusion entering the assembly of 88.9 mm thickness is 2.333 times that for the assembly of 38.1 mm thickness.
For small values of E and no air intrusion through the reflective insulation assembly (i.e., ACH = 0.0, Figure 5a), Figure 14 shows that the R-values for large AR are significantly greater than those for small AR. For example, Figure 14a,c show that at effective emittance E of 0.03, the R-value at AR of 61.0 is 0.669 m2·K/W. This R-value is 46.23% greater than that at AR of 13.3, which is 0.458 m2·K/W. In addition, for E = 0.03, Figure 14b,d show that the R-value at AR = 26.1 (0.635 m2·K/W) is 40.13% greater than that at AR of 5.7, which is 0.453 m2·K/W. The above examples support the statement that the R-value increases with increasing aspect ratio at ACH = 0. The R-values for various aspect ratios for the case of no air intrusion at effective emittance values of 0.03 and 0.05 are listed in Table 2 in order to be used for determining the R-values of reflective insulations assemblies at various aspect rations and operating conditions from the percentage reductions in the R-values for assemblies subjected to wind washing or air infiltration.
For the infiltration condition with ACH of 50 and various Tair, Figure 14a shows that the R-values for a reflective insulation assembly of a 38.1 mm thickness at effective emittance of 0.03 and aspect ratio of 61.0 (0.531 m2·K/W at Tair = 26.7 °C, 0.484 m2·K/W at Tair = 32.2 °C, and 0.464 m2·K/W at Tair = 37.8 °C) are 26.56% at Tair = 26.7 °C, 17.75% at Tair = 32.2 °C, and 14.86% at Tair = 37.8 °C greater than those for an aspect ratio of 13.3. The corresponding R-values for D = 88.9 mm at E of 0.03 and aspect ratio of 26.1 (0.506 m2·K/W at Tair = 26.7 °C, 0.433 m2·K/W at Tair = 32.2 °C, and 0.384 m2·K/W at Tair = 37.8 °C) are 29.14% at Tair = 26.7 °C, 21.23% at Tair = 32.2 °C, and 17.53% at Tair = 37.8 °C greater than those for an aspect ratio of 5.7 (Figure 14b). The above examples support a statement that R-values increase with increasing aspect ratio at air intrusion of ACH of 50.
For values of effective emittance E ≤ 0.2, ACH of 50, and various Tair values, the R-values for reflective insulation assembly of 38.1 mm and 88.9 mm thickness with wind washing condition are shown in Figure 14c (AR = 13.3 and 61.0) and Figure 14d (AR = 5.7 and 26.1). At effective emittance of 0.03, for example, Figure 14c shows that the R-values for the 38.1 mm thick assembly, for AR of 61.0 (0.546 m2·K/W at Tair = 26.7 °C, 0.498 m2·K/W at Tair = 32.2 °C, and 0.473 m2·K/W at Tair = 37.8 °C), are 21.15% at Tair = 26.7 °C, 13.66% at Tair = 32.2 °C, and 10.21% at Tair = 37.8 °C greater than those for AR of 13.3. Again at E = 0.03, Figure 14d shows that the R-values for the assembly of 88.9 mm thickness for AR of 26.1 (0.527 m2·K/W at Tair = 26.7 °C, 0.428 m2·K/W at Tair = 32.2 °C, and 0.379 m2·K/W at Tair = 37.8 °C) are 17.42% at Tair = 26.7 °C, 6.39% at Tair = 32.2 °C, and 4.12% at Tair = 37.8 °C greater than those for AR of 5.7.

4.3.2. Reflective Insulation Assemblies with the Same Volumetric Air Flow Rate

For the hot surface temperature TH of 32.2 °C and cold surface temperature TL of 15.6 °C, the R-values presented in this section are for reflective insulation assemblies with aspect ratios of 13.3 for an assembly of 38.1 mm thickness and 5.7 for an assembly of 88.9 mm thickness, when these assemblies have ACH of 100 and air exterior temperatures Tair of 26.7 °C (<TH), 32.2 °C (same as TH), and 37.8 °C (>TH). The values of volumetric flow rates of the air entering the assemblies ( Q ˙ ) of these aspect ratios (5.7 and 13.3) at ACH of 100 were used to conduct numerical simulations in order to determine the R-values of reflective insulation assemblies of large aspect ratios of AR = 61.0 for an. assembly of 38.1 mm thickness and AR = 26.1 for an assembly of 88.9 mm thickness. In other words, the value of Q ˙ for an aspect ratio of 5.7 is the same as that for an aspect ratio of 26.1. In addition, the value of Q ˙ for an aspect ratio of 13.3 is the same as that for an aspect ratio of 61.0. Consequently, the effect of the aspect ratio on the R-values of reflective insulation assemblies shown in Figure 15 represent the scenario of the same volumetric flow rate of the air entering the assemblies from the hot surface (Figure 5). For these reflective insulation assemblies at effective emittance values of 0.03 and 0.05, Table 3 lists the R-values and the reductions in these values in relation to the reference case of no air intrusion due to both wind washing condition and infiltration condition.
For infiltration into a 38.1 mm thick assembly at effective emittance of 0.03, Figure 15a shows that the R-value for large AR of 61.0 at Tair of 26.7 °C (0.598 m2·K/W, Table 3) is 50.27% higher than that for small AR of 13.3. At this value of effective emittance (0.03) and Tair of 32.2 °C, the R-value for large AR of 61.0 (0.584 m2·K/W, Table 3) is 57.02% higher than that for small AR of 13.3, whereas at Tair of 37.8 °C, the R-value for large AR of 61.0 (0.570 m2·K/W, Table 3) is 62.73% higher than that for small AR of 13.3.
As shown in Figure 15b for the assembly of 88.9 mm thickness with infiltration at effective emittance of 0.03, the R-value for large AR of 26.1 at Tair of 26.7 °C (0.577 m2·K/W, Table 3) is 96.52% higher than that for small AR of 5.7. At Tair of 32.2 °C, the corresponding R-value for large AR of 26.1 (0.536 m2·K/W, Table 3) is 114.97% higher than that for small AR of 5.7. In addition, at Tair of 37.8 °C, the R-value for large AR of 26.1 (0.506 m2·K/W, Table 3) is 124.90% higher than that for small AR of 5.7 (Figure 15b).
At the same volumetric flow rate of exterior air entering the reflective insulation assembly under wind washing condition, Figure 15c (D = 38.1 mm) and Figure 15d (D = 88.9 mm) show the effect of the aspect ratio on R-value. For effective emittance of 0.03 at Tair of 26.7 °C for the assembly of 38.1 mm thickness, Figure 15c shows that the R-value for large AR of 61.0 (0.603 m2·K/W, Table 3) is 35.35% higher than that for small AR of 13.3. In addition, for E of 0.03 at Tair of 32.2 °C, the R-value for large AR of 61.0 (0.587 m2·K/W, Table 3) is 41.75% higher than that for small AR of 13.3, whereas at Tair of 37.8 °C, the R-value for large AR of 61.0 (0.573 m2·K/W, Table 3) is 47.30% higher than that for small AR of 13.3 (Figure 15c).
Figure 15d shows that for the reflective insulation assembly of 88.9 mm thickness under wind washing condition at Tair of 26.7 °C (<TH) and E of 0.03, the R-value for large AR of 26.1 (0.561 m2·K/W, Table 3) is 46.30% higher than that for small AR of 5.7. In addition, at Tair of 32.2 °C (the same as TH) and E of 0.03, the R-value for large AR of 26.1 (0.518 m2·K/W, Table 3) is 58.83% higher than that for small AR of 5.7. Finally, at Tair of 37.8 °C (>TH) and E of 0.03, the R-value for large AR of 26.1 (0.496 m2·K/W) is 65.45% higher than that for small AR of 5.7 (Figure 15d). The corresponding R-values at effective emittance of 0.05 are listed in Table 3.
In summary, with and without air intrusion, the results showed that the airspace aspect ratio has a significant effect on the R-values. The results for reflective insulation assemblies subjected to the same volumetric flow rate of the air entering the assemblies at different conditions show that the impact of the infiltration condition of the exterior air of various temperatures Tair of 26.7 °C (<TH), 32.2 °C (same as TH), and 37.8 °C (>TH) have resulted in the R-values for large aspect ratios (26.1 and 61.0) being in the range of 50%–125% (at effective emittance of 0.03) and 47–118% (at effective emittance of 0.05) greater than that at small aspect ratios (5.7 and 13.3). Additionally, the impact of the wind washing condition of the exterior air at various temperatures has also resulted in the R-values for large aspect ratios (26.1 and 61.0) being in the range of 35–65% (at effective emittance of 0.03) and 33%–62% (at effective emittance of 0.05) greater than that at small aspect ratios (5.7 and 13.3).

5. Conclusions

Results for the thermal resistance (R-value) of reflective insulation assemblies have been presented for a wide range of effective emittance (E) from highly reflective (E~0.02) to non-reflective (E~0.82). These results have been obtained using a numerical model that simultaneously solves the energy equation, surface-to-surface radiation equation, and the momentum equation for a compressible fluid in different reflective insulation assemblies, subjected to various operating conditions. In previous studies, this model was validated by comparing its predictions with test data obtained using a guarded hot box in accordance with ASTM C1363 and heat flow meter in accordance with the ASTM C518. For single- and double-enclosed airspaces of a wide range of effective emittance, from 0.0 to 0.82, and subjected to heat flow in the up, down, and horizontal directions, the model was validated in this study by comparing its predictions for the R-values with the R-values from the U.S. National Bureau of Standards for the thermal resistance of airspaces (HRP 32). The results showed that the model predictions were in good agreement with the test data to within −7% to +4% for a range of R-values from ~0.2 to 2.5 m2·K/W. Thereafter, this model was used to investigate the sensitivity of the airspace aspect ratio with and without air intrusion due to infiltration and wind washing at various operating conditions (air changes per hour and exterior air temperatures) on the thermal performance of vertical reflective insulation assemblies subjected to horizontal heat flow that represent the applications of reflective insulations in wall systems.
The results in this paper provide quantitative evaluation of the performance of reflective insulation assemblies of various geometries with and without the exchange of air from outside the assemblies. Because many reflective insulations have effective emittance of 0.03 or 0.05, the results of the R-values and the corresponding reductions in these values for reflective insulation assemblies under different operating conditions with and without air intrusions at E of 0.03 and 0.05 are summarized in Table 2 and Table 3. On the other hand, the results at other E values shown in the figures of this study would provide the expected R-values in the case of contamination and/or water vapor condensation occurring on the low-emittance surfaces, which would lead to an increase in the effective emittance, resulting in the obtaining of lower R-values. The results of this study showed that:
  • The impact of infiltration and wind washing conditions on R-values of reflective insulation assemblies increases as: (a) the difference between the temperature of the incoming air and the undisturbed temperature of the cavity increases, (b) the rate of air intrusion increases, and (c) the aspect ratio decreases.
  • The impact of infiltration at different conditions results in R-values for large aspect ratios that are 50%–125% at E = 0.03 and 47%–118% at E = 0.05 greater than that with small aspect ratios.
  • The impact of wind washing under different conditions results in R-values for large aspect ratios that are 35%–65% at E = 0.03 and 33%–62% at E = 0.05 greater than that with small aspect ratios.
  • Under various operating conditions, the reduction in the R-value due to infiltration condition is greater than that due to wind washing condition.
  • The reductions in the R-values for reflective insulation assemblies with the same exterior air temperature, dimensions, and effective emittance increase with increasing ACH.
  • The reductions in R-values for reflective insulation assemblies with the same ACH, dimensions, and effective emittance increase when increasing the exterior air temperature entering the assemblies.
  • The reductions in R-values for reflective insulation assemblies of the same thickness and with the same ACH, exterior air temperature, and effective emittance increase with increasing assembly length.
  • The reductions in R-values for reflective insulation assemblies of the same length and with the same ACH, height, exterior air temperature, and effective emittance increase with increasing assembly thickness.
  • R-values for reflective insulation assembly without air intrusion increase as the aspect ratio increases.
Finally, the results obtained in this research provide motivation for the sealing of seams and locations likely to admit airflow across the building components in order to minimize the reductions in the R-values.

Author Contributions

Conceptualization, H.H.S. and D.W.Y.; methodology, H.H.S. and D.W.Y.; software, H.H.S.; validation, H.H.S.; formal analysis, H.H.S. and D.W.Y.; investigation, H.H.S. and D.W.Y.; resources, D.W.Y.; data curation, H.H.S. and D.W.Y.; writing—original draft preparation, H.H.S. and D.W.Y.; writing—review and editing, H.H.S. and D.W.Y.; visualization, H.H.S. and D.W.Y.; supervision, H.H.S. and D.W.Y.; project administration, H.H.S.; funding acquisition, D.W.Y. All authors have read and agreed to the published version of the manuscript.

Funding

This research received no external funding.

Data Availability Statement

Not applicable.

Conflicts of Interest

The authors declare no conflict of interest.

Appendix A

At an effective emittance E of 0.05 for reflective insulation assemblies of 508 mm length, and 38.1 mm and 88.9 mm thickness, Appendix A provides a set of figures that show the impact of air intrusion of different exterior air temperatures (26.7 °C, 32.2 °C, and 37.8 °C) from the hot surface with a temperature TH of 32.2 °C into the assemblies of the cold-surface temperature TL of 15.6 °C with an equal amount of air expelled to the interior side for the case of infiltration (see Figure A1 and Figure A2 for assembly of 38.1 mm thickness, and Figure A5 and Figure A6 for assembly of 88.9 mm thickness), and with an equal amount of air expelled to the exterior side for the case of wind washing (see Figure A3 and Figure A4 for assembly of 38.1 mm thickness, and Figure A7 and Figure A8 for assembly of 88.9 mm thickness). Figure A1, Figure A2, Figure A3, Figure A4, Figure A5, Figure A6, Figure A7 and Figure A8 show the resultant velocity and temperature distributions, where the air intrusion from the exterior side of different temperatures has caused a disturbance on the convective transport in the reflective insulation assembly that is further altered thermally by the difference in temperature between the exterior air and the reflective assembly temperature.
Figure A1. Resultant velocity and temperature distribution in reflective insulation assembly with infiltration at E = 0.05, ACH = 50, H = 508 mm, and D = 38.1 mm (TH = 32.2 °C, TL = 15.6 °C).
Buildings 13 02461 g0a1
Figure A2. Resultant velocity and temperature distribution in reflective insulation assembly with infiltration at E = 0.05, ACH = 100, H = 508 mm, and D = 38.1 mm (TH = 32.2 °C, TL = 15.6 °C).
Buildings 13 02461 g0a2
Figure A3. Resultant velocity and temperature distribution in reflective insulation assembly with wind washing at E = 0.05, ACH = 50, H = 508 mm, and D = 38.1 mm (TH = 32.2 °C, TL = 15.6 °C).
Buildings 13 02461 g0a3
Figure A4. Resultant velocity and temperature distribution in reflective insulation assembly with wind washing at E = 0.05, ACH = 100, H = 508 mm, and D = 38.1 mm (TH = 32.2 °C, TL = 15.6 °C).
Buildings 13 02461 g0a4
Figure A5. Resultant velocity and temperature distribution in reflective insulation assembly with infiltration at E = 0.05, ACH = 50, H = 508 mm, and D = 88.9 mm (TH = 32.2 °C, TL = 15.6 °C).
Buildings 13 02461 g0a5
Figure A6. Resultant velocity and temperature distribution in reflective insulation assembly with infiltration at E = 0.05, ACH = 100, H = 508 mm, and D = 88.9 mm (TH = 32.2 °C, TL = 15.6 °C).
Buildings 13 02461 g0a6
Figure A7. Resultant velocity and temperature distribution in reflective insulation assembly with wind washing at E = 0.05, ACH = 50, H = 508 mm, and D = 88.9 mm (TH = 32.2 °C, TL = 15.6 °C).
Buildings 13 02461 g0a7
Figure A8. Resultant velocity and temperature distribution in reflective insulation assembly with wind washing at E = 0.05, ACH = 100, H = 508 mm, and D = 88.9 mm (TH = 32.2 °C, TL = 15.6 °C).
Buildings 13 02461 g0a8

Appendix B

The present model was used in several previous studies to assess the thermal performance, moisture performance, and risk of condemnation and mold growth in building assemblies subjected to different operating and climatic conditions. This model simultaneously solves the moisture transport equation, the energy equation, the surface-to-surface radiation equation and surface-to-ambient radiation equation, and the air transport equation in the material layers present in building assemblies. The Navier–Stokes equation is used for the airspace layers, while the Darcy equation for Darcy numbers (DN) < 10−6 and the Brinkman equation for DN > 10−6 are used for porous material layers.
The full details of the energy equation, momentum equation (Navier–Stokes equation, Darcy equation, Brinkman equation), surface-to-surface radiation equation, and surface-to-ambient radiation equation are available in [37]. These equations were discretized using the finite element method (FEM). The use of the FEM is important as it permits the modelling of complicated geometries with fewer discretizing errors. The model has been validated for a number of building applications involving full-scale and small-scale building assemblies with and without reflective insulations (e.g., see [37] for more details). In this study, no moisture transport as well as no energy transport and no air transport in porous materials were considered. As this study focuses on the energy performance of reflective insulation assemblies, only the needed governing equations are briefly described in this section.

Appendix B.1. Governing Equations

In an airspace, the contribution of heat transfer by convection is obtained by solving the continuity, and momentum equations (Navier–Stokes equation) for the air velocity field ( v a ) . These equations are [48]:
ρ a t = ρ a v a , and
ρ a v a t + ρ a v a v a = p + μ a v a + ( v a ) T 2 3 μ a v a I + ρ a g ,
where I is the unit matrix, μa is air the dynamic viscosity (Pa.s), g is the vector of gravitational acceleration (m2/s), ρ a is the air density (kg/m3), p is the air pressure (Pa), and t is the time (s).
The energy equation for the airspace layers is given as [48]:
ρ a C p a T t = ρ a C p a ( v a T ) convection + ( k a T ) conduction + μ a v a + ( v a ) T 2 3 v a I : v a viscous   heating T ρ a ρ a T p P t Pressure   work + q s o u r c e / sin k .
where k a is the air thermal conductivity (W/(m·K)) and C p a is the air specific heat capacity at constant pressure (J/(kg·K)). The term q s o u r c e / sin k in Equation (A3) represents the volumetric heat source/sink, for example, due to moisture condensation/evaporation, which is neglected since no moisture transport is considered in this study as indicated earlier. However, for solid layers (e.g., low-emittance foil), the energy equation is the heat conduction equation, which is given as [48]:
ρ s C p s T t = ( k s T ) ,
where ρ s is the solid density (kg/m3), C p s is the solid specific heat capacity (J/(kg·K)), and k s is solid thermal conductivity (W/(m·K)).
To account for heat transfer by radiation inside enclosed or open airspaces, the surface-to-surface heat radiation equation is solved simultaneously with the energy equation listed above. At every point on a radiative surface, the contribution of the net inward radiative heat source (qRAD) is added, which is given as [37]:
q R A D = ε q i r r σ T 4 ,   where   q i r r = G m + F a m b σ T a m b 4 .
In Equation (A5), qirr is the total irradiation (W/m2), Famb is the ambient view factor, Tamb is the ambient temperature (K), σ is the Stefan–Boltzmann constant (5.67 × 10⁻⁸ W/(m2.K4)), and ε is the surface emittance. As an example, for enclosure, ε is equal to εA, εB, εC, and εD, respectively, for all points on the surfaces “Surf. A”, “Surf. B”, “Surf. C”, and “Surf. D” shown in Figure 4. The parameter Gm in Equation (A5) represents the mutual irradiation coming from other radiative surfaces, which is a function of the radiosity q r a d i .
The general expression for the radiosity q r a d i was derived in a previous publication [37]. For every point on the surface boundaries (3D geometry) or every point on the line boundaries (2D geometry) that participate in surface-to-surface radiation, the final expression for the radiosity q r a d i is given as [37]:
q r a d i = 1 ε G m + F a m b σ T a m b 4 + ε σ T 4 .
To avoid repetition, the detailed expressions for Gm and Famb and their associated kernel functions for both 3D geometry and 2D geometry are available in [37]. Equation (A6) is applicable to all points on the surface/line boundaries that participate in surface-to-surface radiation, which forms a system of equations in radiosity q r a d i . This system of equations is solved simultaneously with the energy equation (Equations (A3) and (A4)) for the temperature T and radiosity q r a d i .

Appendix B.2. Boundary Conditions and Simulation Parameters for the Reflective Insulation Assemblies of the Present Study

This study focusses on determining the R-values of the reflective insulation assemblies that are shown in Figure 5a–c. These R-values must be calculated under steady-state condition. Thus, the model is used to simultaneously solve the two-dimensional versions of the momentum equation (Equation (A2)), energy equation (Equations (A3) and (A4)), and surface-to-surface radiation equation (Equation (A6)) under steady-state condition. The reference pressure (Pref) and reference temperature (Tref) used for both energy and momentum equations are 1.0 atm and 20 °C, respectively. The coupling of these equations forms a nonlinear system. The ultimate objective of this study is to determine the R-value of a reflective insulation assembly only, with and without air intrusion; as such, very thin solid layers (no air flow and no heat transfer by radiation occurred inside these layers) were used to bound the airspace of the assembly. The thickness of the solid layers (δw) used in this study is 0.1 mm (see Figure 4). In building assemblies that use reflective insulations, however, those airspaces are typically bounded by layers made of different materials and dimensions such as wood, EPS, XPS, gypsum, and so on (e.g., see [37] for more details).
The surface-to-surface radiation occurs on all surfaces of the thin solid layers that bound the airspace (i.e., solid surface–air interfaces, Figure 4). As shown in Figure 4, the surface-to-surface radiation equation is subjected to different emittance values (εA, εB, εC, and εD). In this study, εB = ε1 = 0.0–0.9. The other surfaces (εA, εC, and εD) have emittance of 0.9 [24]. For the reflective insulation assemblies shown in Figure 4a for reference assembly (i.e., without air intrusion), Figure 4b for assembly with wind washing and Figure 4c for assembly with infiltration, the boundary conditions that are used to solve the energy equation are:
(a)
Isothermal condition on the exterior right surface of the assembly with low temperature (TL) and on the exterior left surface of the assembly with high temperature (TH).
(b)
Adiabatic condition (i.e., no heat transport) on the exterior top and bottom surfaces of the assembly. Note that applying adiabatic condition on the top and bottom surfaces permits calculation of the R-values of reflective insulation assemblies. In addition, due to the conservation of energy, using adiabatic condition on the top and bottom surfaces must result in the total energy entering the assembly from the hot side (i.e., left boundary) being equal the total energy leaving the assembly from the cold side (i.e., right boundary). As provided below, this total energy is used to determine the R-values of the reflective insulation assemblies.
(c)
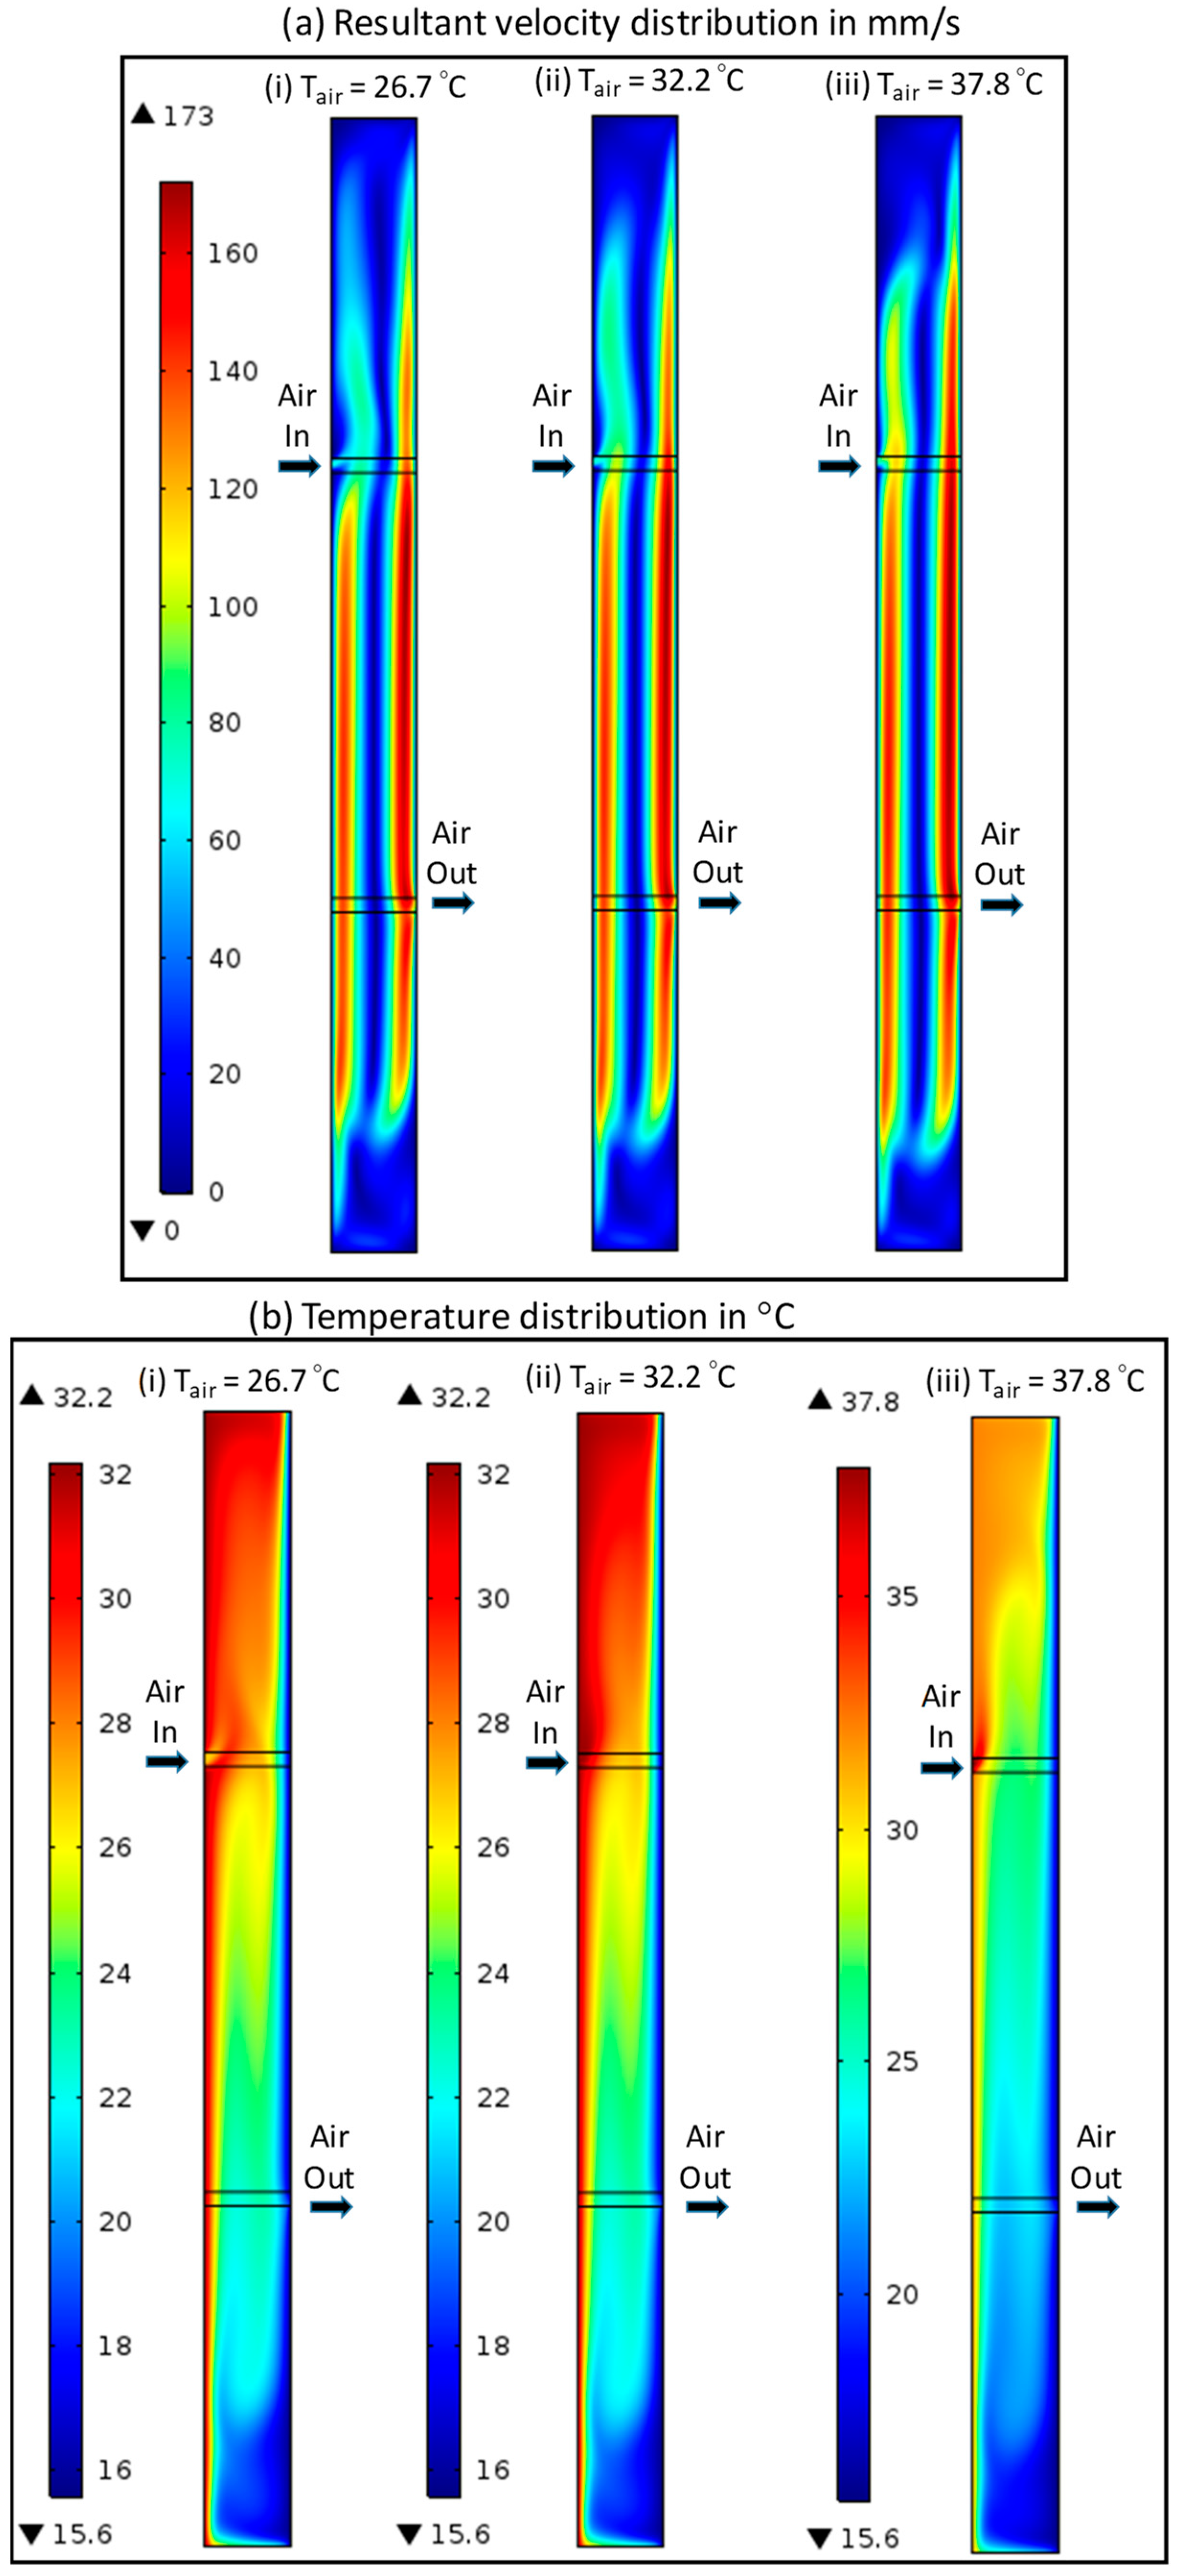
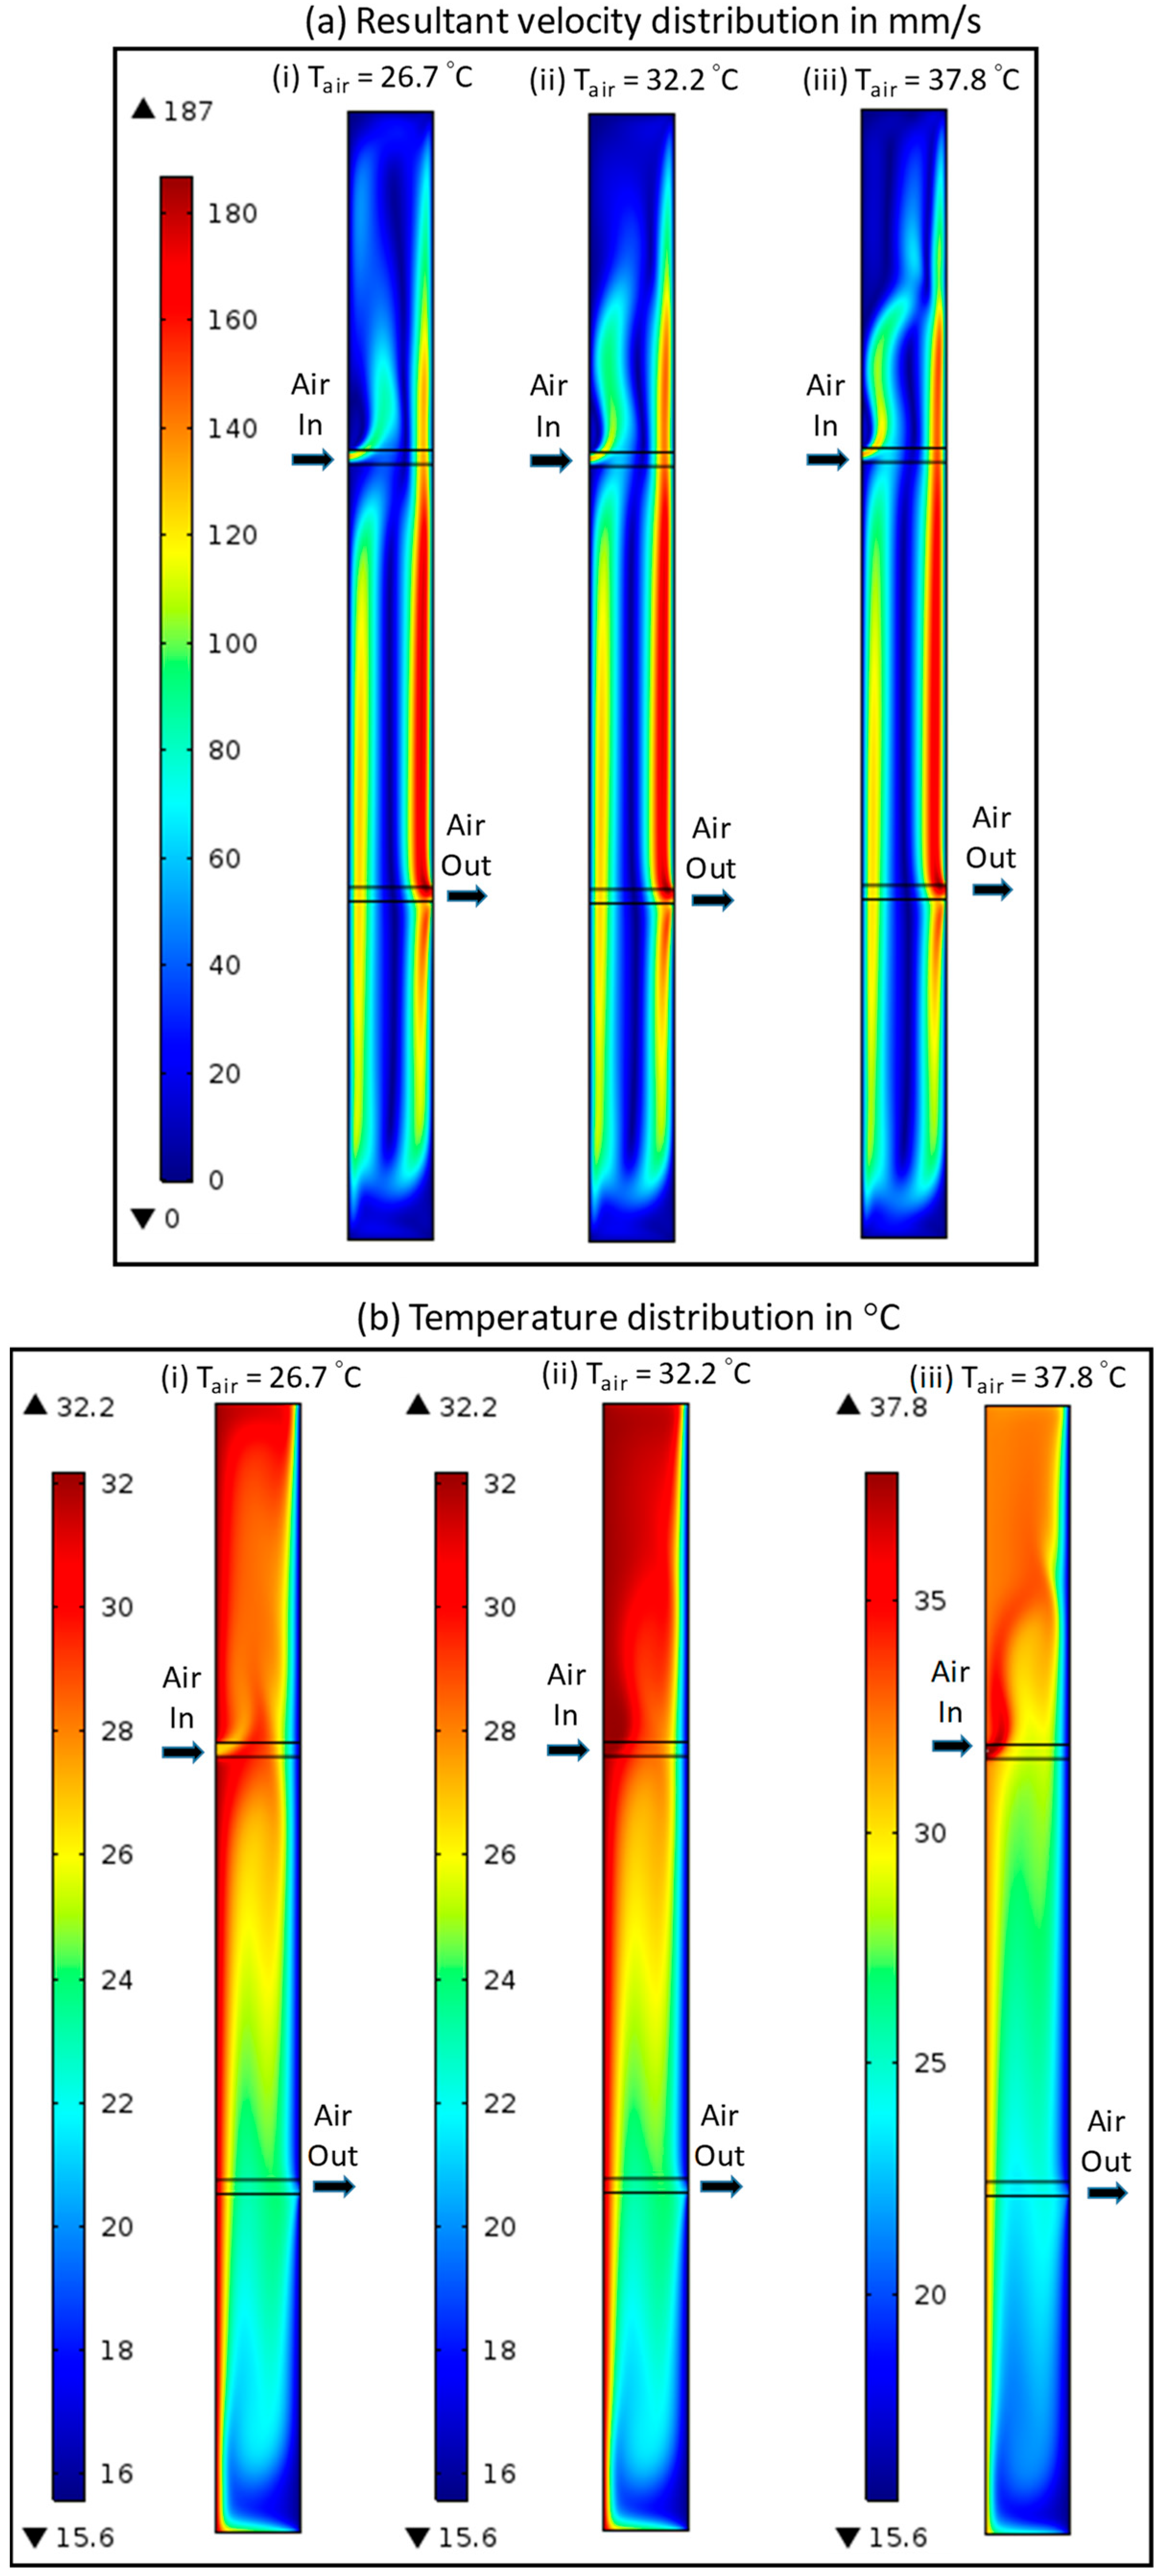
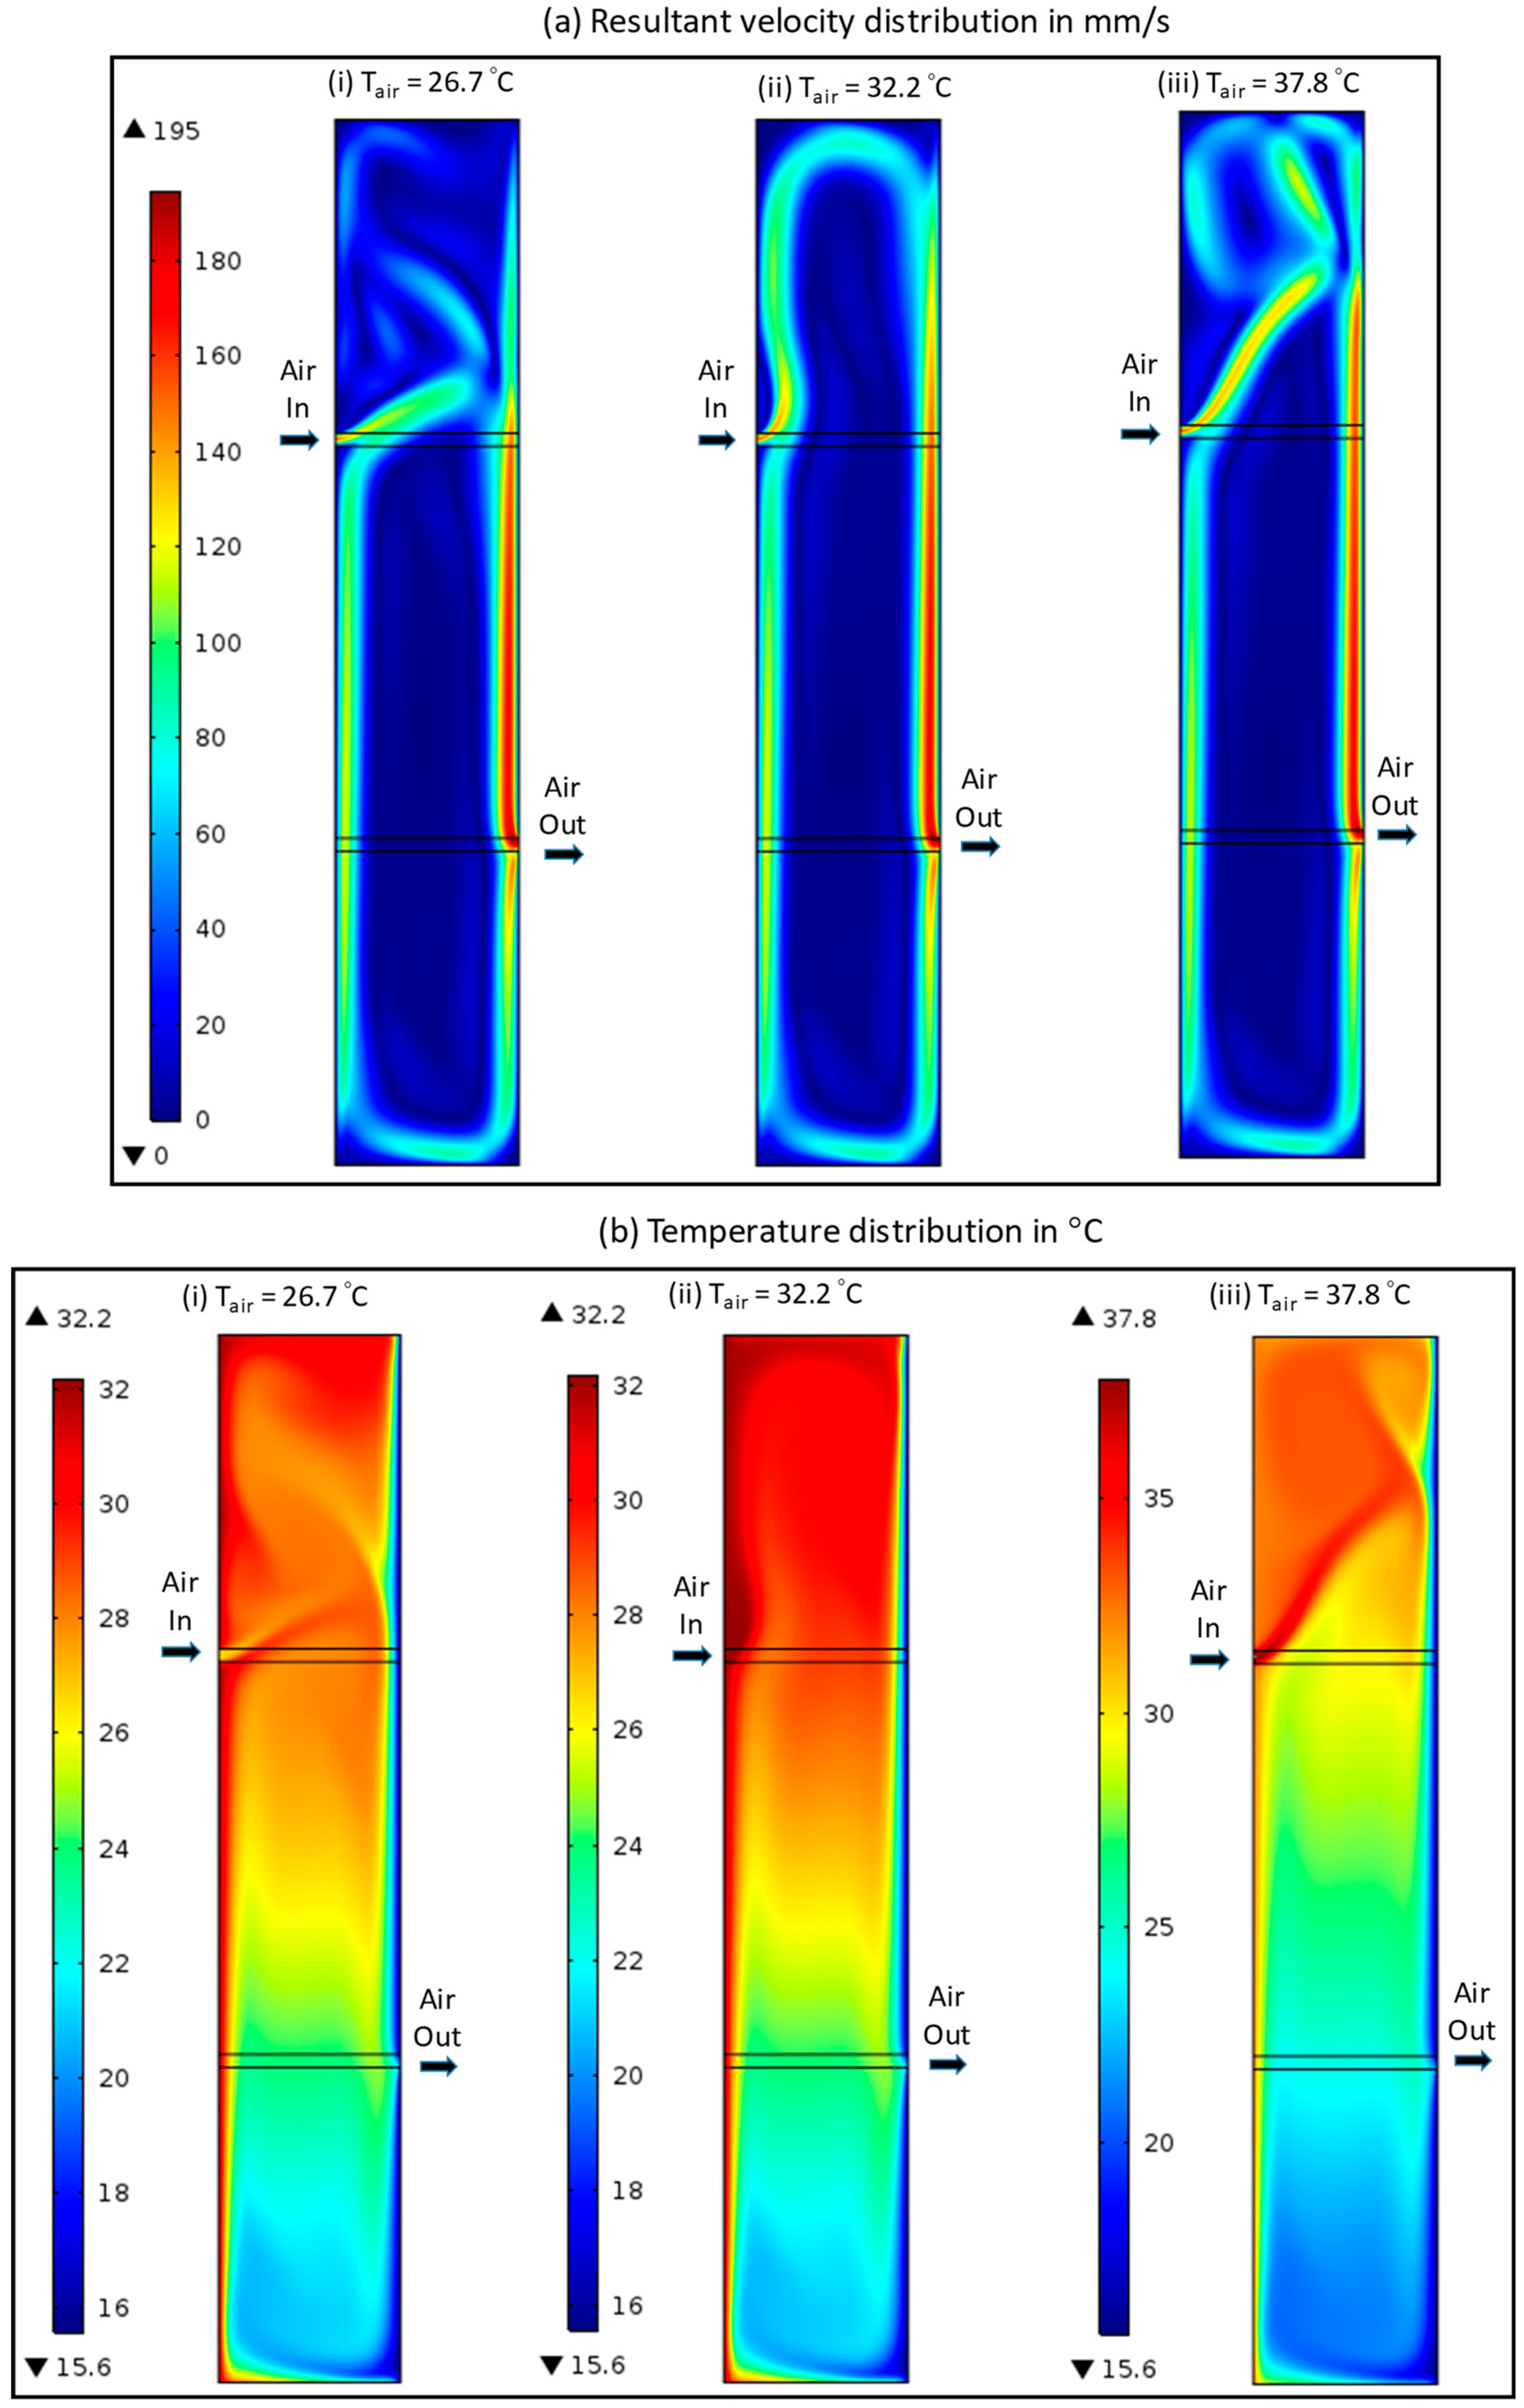
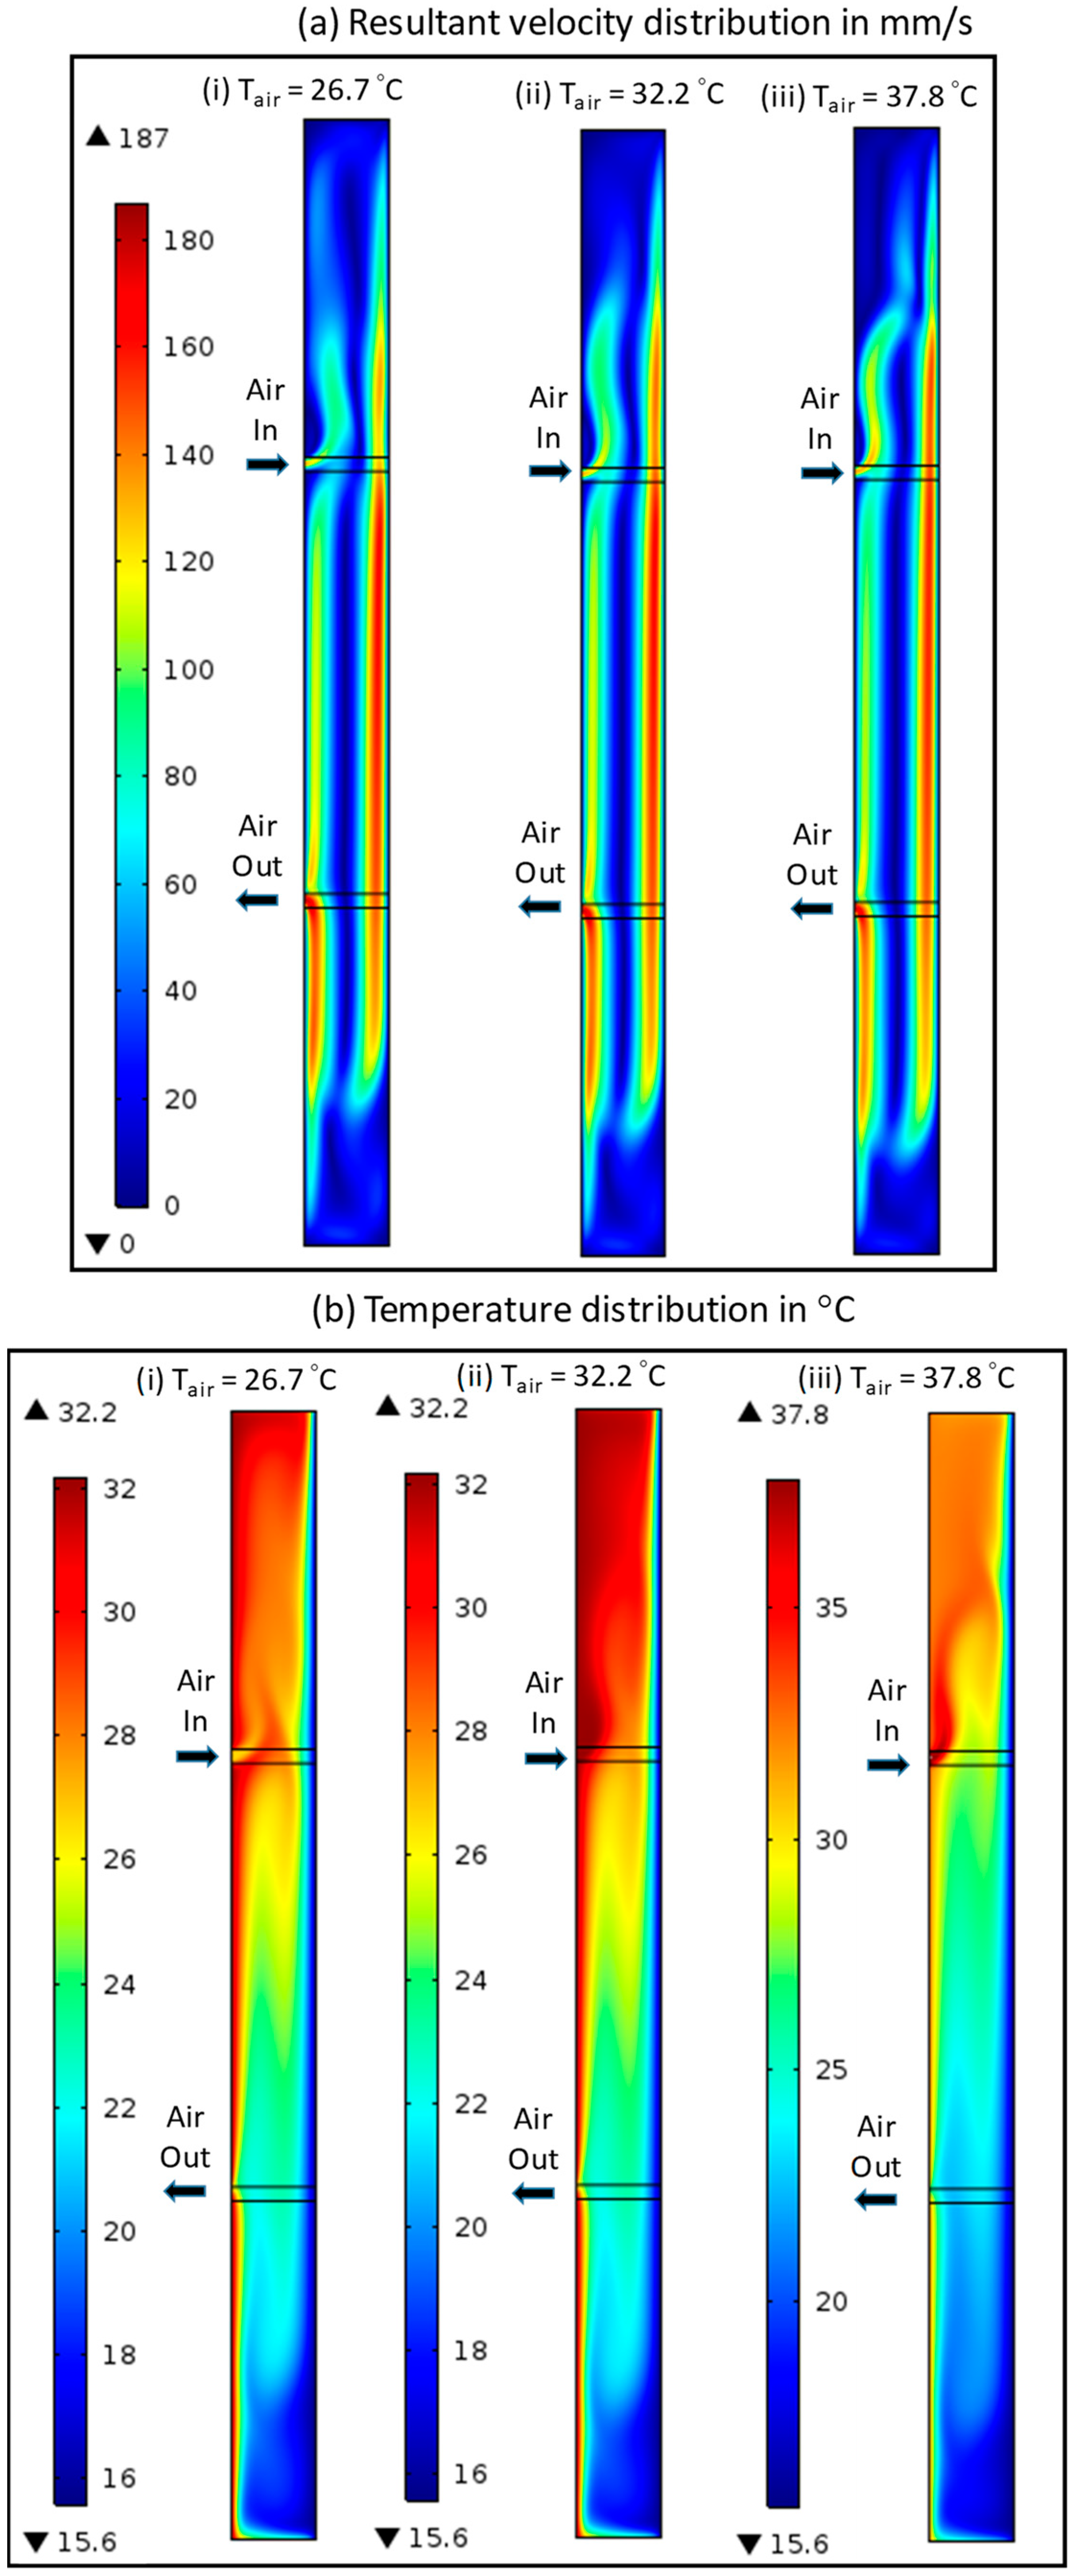
For the reflective insulation assembly with air intrusion, the exterior surface of the opening boundary called “Air Inlet” is subjected to a specified temperature T, which is equal to exterior air temperature Tair. To investigate the effect of exterior air temperature on the R-values, the values of Tair used in this study are 26.7 °C (greater than TH), 32.2 °C (same as TH), and 37.8 °C (greater than TH).
(d)
At the other opening boundary called “Air Exit” for the reflective insulation assembly with air intrusion, heat transfer by convection dominates. This implies that the heat transfer occurring across the exterior surface of the opening boundary “Air Exit” is by convection. Under this condition, the temperature gradient normal to the exterior surface of the opening boundary “Air Exit” is zero. As per the definitions of the coordinate system shown in Figure 4, the boundary condition on the exterior boundary “Air Exit” is T / x = 0.0 . Note that the opening boundary “Air Exit” is located on the right side of the assembly for the wind washing condition (Figure 5b) and on the left side of the assembly for the infiltration condition (Figure 5c).
The boundary conditions that are used to solve the momentum equation are:
(a)
No-slip condition ( v x = v y = 0 ) on all interior surfaces of the solid-layers (i.e., solid-air interfaces of the airspaces, Figure 4).
(b)
For the reflective insulation assembly with air intrusion for both wind washing and infiltration conditions, the exterior surface of the opening boundary “Air Inlet” is subjected to the specified velocity conditions v x = v ¯ i n and v y = 0 , where for an specified air change per hour (ACH) value, the expression for v ¯ i n is given by Equation (3) of Section 3. The corresponding mass flow rate entering the assembly ( m ˙ a , i n ) is then calculated as m ˙ a , i n = ρ a v ¯ i n b   W , where W is the depth of the reflective airspace assembly, which is taken to be equal to 1.0 m in this study (i.e., m ˙ a , i n is the mass flow rate per unit depth, which is needed to check for the mass balance as shown below).
(c)
For the reflective insulation assembly with air intrusion for both wind washing and infiltration conditions, the exterior surface’s opening boundary “Air Exit” is subjected to a pressure condition (i.e., the tangential stress to the boundary is equal to zero, and the normal stress to the boundary is equal to the pressure) at specified pressure of p = ρ a g y or ρ a g y , where g is the acceleration of gravity (9.81 m2/s).
Note that the dependences of the physical properties of the air that filled the airspace (density, dynamic viscosity, specific heat capacity at constant pressure, and thermal conductivity) on the temperature are included. Per unit depth (W = 1.0 m) for the reflective insulation assemblies shown in Figure 4, without and with air intrusion at various exterior temperatures (26.7 °C, 32.2 °C, or 37.8 °C) and ACH values, numerical simulations were conducted for hot surface temperature (TH) of 32.2 °C, cold surface temperature (TL) of 15.6 °C, assembly thickness (D) of 38.1 and 88.9 mm, assembly height (H) of 508 and 2324 mm, and a wide range of effective emittance (E = 0.0–0.82). In all simulations, both the mass conservation and energy conservation were checked.
For the mass conservation, the mass flow rate of the air entering the assembly at the exterior surface of the opening boundary “Air Inlet” ( m ˙ a , i n = ρ a v ¯ i n b   W ) with height “b” of 6.4 mm was checked against the mass flow rate of the air exiting the assembly at the exterior surface of the opening boundary “Air Exit” ( m ˙ a , o u t ) with height “c” of 6.4 mm. The m ˙ a , o u t is calculated as:
m ˙ a , o u t = y = b y = b + c ρ a v x W d y at   x = 0 for the wind washing condition, and
m ˙ a , o u t = y = b y = b + c ρ a v x W d y at   x = D  for the infiltration condition.
In all simulations, the estimated error in the mass balance due to the difference between m ˙ a , i n (specified at various ACH values in this study) and the calculated m ˙ a , o u t using Equation (A7) was less ≤ 0.01%.
For the energy conversation, since the boundary conditions at the exterior surfaces of the top and bottom of the assembly are adiabatic, the total energy entering the assembly from the hot side must equal the total energy exiting the assembly from the cold side. For the reflective insulation assemblies shown in Figure 4, the total energy flux on the exterior surfaces of the right and left boundaries ( e t o t ) is the sum of:
(a)
Convective heat flux ( ρ a v E ), where E is the internal energy, which is ( h p / ρ a ) and h is the enthalpy.
(b)
Convective kinetic energy ( 0.5 ρ a v v v ).
(c)
Conductive heat flux ( q ), where the conductive heat flux in the x-direction is q x = k T / x , and the conductive heat flux in the y-direction is q y = k T / y .
Thus, the total energy flux on the exterior surfaces of the boundaries can be written as:
e t o t = ρ a v h p ρ a + 1 2 v v + q .
Using the above expression for total energy flux and as per the definitions of the coordinate system shown in Figure 4, the total energy entering and exiting the exterior boundaries of the reflective insulation assemblies is calculated as:
E t o t = y = 0 y = H ρ a v x h p ρ a + 1 2 v x 2 k T x d y ,
where v x = 0 in all locations at the exterior boundaries except the locations at the opening parts of the boundaries. Preforming the integration given by Equation (A9) at the exterior surface of the hot side (i.e., x = 0 ) has led to estimating the total energy entering the assembly ( E t o t , H ). Additionally, preforming the integration given by Equation (A9) at the exterior surface of the cold-side (i.e., x = D ) has led to estimating the total energy exiting the assembly ( E t o t , L ). Similar to the conservation of mass, the estimated error in the energy balance due to the difference between E t o t , H and E t o t , L was ≤ 0.01% for all numerical simulations conducted in this study.
The ultimate goal of this research study is to investigate the effect of the aspect ratio on the R-values for reflective insulation assemblies without and with air intrusion due to wind washing and infiltration and subjected to horizontal heat flow. Thus, for each numerical simulation conducted in this study, the R-value is calculated as:
R v a l u e = Δ T e t o t , a v g .
In Equation (A10), e t o t , a v g is total average energy flux on the exterior hot surface or the exterior cold surface of the reflective insulation assembly. The value of e t o t , a v g is equal E t o t , H / H or E t o t , L / H (due to the energy balance as provided above), where E t o t , H and E t o t , H are calculated from Equation (A9). The temperature difference across the assembly Δ T in Equation (A10) is equal to T H T L for the reference reflective insulation assembly (i.e., no air intrusion). However, for the assembly with air intrusion under both wind washing and infiltration conditions, Δ T is calculated as:
Δ T = 1 H y = 0 y = H T · d y at x = 0 1 H y = 0 y = H T · d y at x = D

References

  1. Feng, G.; Sha, S.; Xu, X. Analysis of the Building Envelope Influence to Building Energy Consumption in the Cold Regions. Procedia Eng. 2016, 146, 244–250. [Google Scholar] [CrossRef]
  2. Kurt, H. The Usage of Air Gap in the Composite Wall for Energy Saving and Air Pollution. Environ. Prog. Sustain. Eng. 2010, 30, 450–458. [Google Scholar] [CrossRef]
  3. Hasan, A. Optimizing Insulation Thickness for Buildings Using Life Cycle Cost. Appl. Energy 1999, 63, 115–124. Available online: https://ideas.repec.org/a/eee/appene/v63y1999i2p115-124.html (accessed on 13 April 2023). [CrossRef]
  4. U.S. Department of Energy. Building Energy Data Book. Energy Efficiency and Renewable Energy; U.S. Department of Energy: Baltimore, MD, USA, 2011; Available online: https://ieer.org/wp/wp-content/uploads/2012/03/DOE-2011-Buildings-Energy-DataBook-BEDB.pdf (accessed on 2 March 2023).
  5. Yarbrough, D.W.; Toor, I.A. Effect of Air Movement on Thermal Resistance of Loose-Fill Thermal Insulations. In Thermal Insulation, Materials, and System Systems for Energy Conservation in the ‘80s, ASTM STP 789; Govan, F.A., Greason, D.M., McAllister, J.D., Eds.; American Society for Testing and Materials: West Conshohocken, PA, USA, 1983; pp. 529–541. [Google Scholar]
  6. Powell, F.J. Session Summary: Convection and Air Infiltration Effects. In Thermal Insulation, Materials, and System Systems for Energy Conservation in the ‘80s, ASTM STP 789; Govan, F.A., Greason, D.M., McAllister, J.D., Eds.; American Society for Testing and Materials: West Conshohocken, PA, USA, 1983; pp. 559–560. [Google Scholar]
  7. Henning, G.N. Energy Conservation with Air Infiltration Barriers. In Thermal Insulation, Materials, and System Systems for Energy Conservation in the ‘80s, ASTM STP 789; Govan, F.A., Greason, D.M., McAllister, J.D., Eds.; American Society for Testing and Materials: West Conshohocken, PA, USA, 1983; pp. 551–560. [Google Scholar]
  8. Joy, F.A. Improving attic space insulating values. ASHAE Trans. 1958, 64, 351. [Google Scholar]
  9. Table 5 “Effective Thermal Resistance of Ventilated Attics (Summer Conditions)”. In ASHRAE Handbook—Fundamentals; ASHRAE: Peachtree Corners, GA, USA, 1989; p. 22.11.
  10. Nash, G.D.; Comrie, J.; Broughton, H.F. The Thermal Insulation of Buildings—Design Data and How to Use; Her Majesty’s Stationery Office: London, UK, 1955. [Google Scholar]
  11. Medina, M.A. A Comprehensive Review of Radiant Barrier Research Including Laboratory and Field Experiments. ASHRAE Trans. 2012, 118, 400–408. [Google Scholar]
  12. Rahiminejad, M.; Khovalyg, D. Impact of Air-Flow on Thermal Performance of Air-Spaces behind Cladding. ASHRAE 1759-TRP; Final Report; ASHRAE: Peachtree Corners, GA, USA, 2020. [Google Scholar]
  13. Rahiminejad, M.; Khovalyg, D. Thermal Resistance of Ventilated Air-Spaces behind External Claddings; Definitions and Challenges (ASHRAE 1759-RP). Sci. Technol. Built Environ. 2021, 27, 788–805. [Google Scholar] [CrossRef]
  14. Table 3—Footnote. In ASHRAE Handbook—Fundamentals; ASHRAE: Peachtree Corners, GA, USA, 2009; p. 26.3.
  15. Saber, H.H.; Yarbrough, D.W. Advancements in the Evaluation of Reflective Insulation Assemblies. Constr. Specif. 2022, 75, 20–27. [Google Scholar]
  16. Addendum AC to ANSI/ASHRAE/IES Standard 90.1; ASHRAE: Peachtree Corners, GA, USA, 2013; Section A 9.4.2; p. 27.
  17. Goss, W.P.; Miller, R.G. Literature Review of Measurement and Predictions of Reflective Building Insulation System Performance: 1900–1989. ASHRAE Trans. 1989, 95, 651–664. [Google Scholar]
  18. Rainieri, S.; Bozzoli, F.; Pagliarini, G. Characterization of an Uncooled Infrared Thermographic system Suitable for the Solution of the 2-D Inverse Heat Conduction Problem. Exp. Therm. Fluid Sci. 2008, 32, 1492–1498. [Google Scholar] [CrossRef]
  19. Baldinelli, G. A Methodology for Experimental Evaluations of Low-e Barriers Thermal Properties: Field Tests and Comparison with Theoretical Models. Build. Environ. 2010, 45, 1016–1024. [Google Scholar] [CrossRef]
  20. Falk, J.; Sandin, K. Ventilated Rainscreen Cladding: Measurements of Cavity Air Velocities, Estimation of Air change Rates and Evaluation of Driving Forces. Build. Environ. 2013, 59, 164–176. [Google Scholar] [CrossRef]
  21. Siegel, R.; Howell, J.R. Thermal Radiation Heat Transfer; McGraw Hill Book Company: New York, NY, USA, 1972; Example 8.1; pp. 240–241. [Google Scholar]
  22. Robinson, H.E.; Powlitch, F.J. The Thermal Insulating Value of Airspaces; Housing Research Paper 32; U.S. National Bureau of Standards: Gaithersburg, MD, USA, 1956. [Google Scholar]
  23. Thermal Conductances and Resistances of a Plane Air Space. In ASHRAE Handbook—Fundamentals; ASHRAE: Peachtree Corners, GA, USA, 1972; Chapter 20, Tables 2 A,B,C; pp. 358–359.
  24. Effective Thermal Resistance of Plane Air Spaces. In ASHRAE Handbook—Fundamental; ASHRAE: Peachtree Corners, GA, USA, 2021; Chapter 26, Table 3; pp. 26.14–26.15.
  25. Desjarlais, A.O.; Tye, R.P. Research and Development Data to Define the Thermal Performance of Reflective Materials Used to Conserve Energy in Building Applications; ORNL/Sub/88-SA835/1; Oak Ridge National Laboratory: Oak Ridge, TN, USA, 1990. [Google Scholar]
  26. Saber, H.H.; Yarbrough, D.W. Advanced Modeling of Enclosed Airspaces to Determine Thermal Resistance for Building Applications. Energies 2021, 14, 7772. [Google Scholar] [CrossRef]
  27. ASTM C1363; Standard Test Method for Thermal Performance of Building Materials and Envelope Assemblies by Means of a Hot Box Apparatus. American Society for Testing and Materials: West Conshohocken, PA, USA, 2021; pp. 792–836.
  28. Robinson, H.E.; Cosgrove, L.A.; Powell, F.J. Thermal Resistance of Airspaces and Fibrous Insulations Bounded by Reflective Surfaces; Building Materials and Structures Report 152; U.S. National Bureau of Standards: Gaithersburg, MD, USA, 1957. [Google Scholar]
  29. ISO 6946; Building Components and Building Elements—Thermal Resistance and Thermal Transmittance—Calculation Methods. International Organization for Standardization: Geneva, Switzerland, 2017; Annex E. Calculation of the Thermal Transmittance of Components with Tapered Layers.
  30. ASTM C1224; Standard Specification for Reflective Insulation for Building Applications. American Society for Testing and Materials: West Conshohocken, PA, USA, 2021; pp. 706–710.
  31. SANS 1381; Africa Thermal Insulation. Materials for the Insulation of Buildings. SABS Standards Division: Pretoria, South Africa, 2007.
  32. MS 2095; Radiant Barrier and Reflective Insulation Building Materials—Specification. Department of Standards Malaysia: Selangor, Malaysia, 2014.
  33. AS/NZS 4859; Thermal Insulation Materials for Buildings. Standards Australia: Sydney, Australia, 2018.
  34. AS/NZS 4859; Materials for the Thermal Insulation of Buildings. Standards Australia: Sydney, Australia; Standards New Zealand: Wellington, New Zealand, 2006.
  35. Calabrese, L.; Bozzoli, F.; Bochicchio, G.; Tessadri, B.; Rainieri, S.; Pagliarini, G. Thermal Characterization on Intumescent Fire Retardant Paints. J. Phys. Conf. Ser. 2014, 547, 012005. [Google Scholar] [CrossRef]
  36. ASTM C518; Standard Test Method for Steady-State Heat Flux Measurements and Thermal Transmission Properties by Means of the Heat Flow Meter Apparatus. ASTM—International: West Conshohocken, PA, USA, 2021; pp. 163–178.
  37. Saber, H.H.; Maref, W.; Swinton, M.C.; St-Onge, C. Thermal Analysis of Above-Grade Wall Assembly with Low Emissivity Materials and Furred-Airspace. Build. Environ. 2011, 46, 1403–1414. [Google Scholar] [CrossRef]
  38. ASTM C236; Standard Test Method for Steady-State Thermal Performance of Building Assemblies by Means of a Guarded Hot Box. ASTM: Philadelphia, PA, USA, 1993. Available online: https://www.scribd.com/document/425124036/ASTM-C236 (accessed on 8 August 2023).
  39. Pagliarini, L.; Cattani, L.; Mameli, M.; Filippeschi, S.; Bozzoli, F.; Rainieri, S. Global and Local Heat Transfer Behaviour of a Three-Dimensional Pulsating Heat Pipe: Combined Effect of the Heat Load, Orientation and Condenser Temperature. Appl. Therm. Eng. 2021, 195, 117144. [Google Scholar] [CrossRef]
  40. Saber, H.H. Overview of Thermal Performance of Air Cavities and Reflective Insulations. In Thermal Insulation and Radiation Control Technologies for Buildings (Green Energy and Technology); Kośny, J., Yarbrough, D.W., Eds.; Green Energy and Technology; Springer: Cham, Switzerland, 2022; pp. 55–82. [Google Scholar] [CrossRef]
  41. Saber, H.H.; Alshehri, S.A.; Yarbrough, D.W. Innovative evaluation, optimization and design tool for assessing enclosed reflective airspace performance. In Proceedings of the 2022 Buildings XV Conference on Thermal Performance of the Exterior Envelopes of Whole Buildings, Clearwater Beach, FL, USA, 5–8 December 2022; pp. 1–9. [Google Scholar]
  42. Saber, H.H.; Yarbrough, D.W. Determining the Thermal Resistance of Enclosed Reflective Airspace. Buildings 2023, 13, 662. [Google Scholar] [CrossRef]
  43. Bekkouche, S.M.A.; Benouaz, T.; Cherier, M.K.; Hamdani, M.; Yaiche, M.R.; Benamrane, N. Thermal Resistances of Air in Cavity Walls and Their Effect Upon the Thermal Insulation Performance. Int. J. Energy Environ. 2013, 4, 459–466. [Google Scholar]
  44. Rahiminejad, M.; Khovalyg, D. Review on Expected Ventilation Rates in the Ventilated Cavity behind Traditional Cladding Systems. Build. Environ. 2021, 190, 107538. [Google Scholar] [CrossRef]
  45. National Research Council of Canada. National Building Code of Canada, 12th ed.; National Research Council of Canada: Ottawa, ON, Canada, 2005.
  46. Buratti, C.; Palladino, D.; Moretti, E.; Di Palma, R. Development and Optimization of a New Ventilated Brick Wall: CFD Analysis and Experimental Validation. Energy Build. 2018, 168, 284–297. [Google Scholar] [CrossRef]
  47. Tariku, F.; Iffa, E. Empirical Model for Cavity Ventilation and Hygrothermal Performance Assessment of Wood Frame Wall Systems: Experimental Study. Build. Environ. 2019, 157, 112–126. [Google Scholar] [CrossRef]
  48. Bird, R.B.; Stewart, W.E.; Lightfoot, E.N. Transport Phenomena; John Wiley & Sons, Inc.: Hoboken, NJ, USA, 1960. [Google Scholar]
Figure 1. Single-enclosed airspace with horizontal heat flow (H = 813 mm, D = 88.9 mm, TH = 32.2 °C, TL = 15.6 °C): (a) temperature and resultant velocity distribution for E of 0.05, and (b) comparison of simulation results with data from HRP 32 for a wide range of E.
Buildings 13 02461 g001
Figure 2. Double-enclosed airspace with horizontal heat flow (H = 813 mm, D = 88.9 mm, TH = 32.2 °C, TL = 15.6 °C): (a) temperature and resultant velocity distribution for E of 0.05, and (b) comparison of simulation results with data from HRP 32 for a wide range of E.
Buildings 13 02461 g002
Figure 3. Temperature and resultant velocity distribution at E of 0.05 for single- and double-enclosed airspaces with heat flow up and down (H = 813 mm, D = 88.9 mm, TH = 32.2 °C, TL = 15.6 °C).
Buildings 13 02461 g003
Figure 4. A comparison of model predictions for R-values with HRP 32 R-values [22] for six heat flow configurations of enclosed airspaces with a wide range of E (H = 813 mm, D = 88.9 mm, TH = 32.2 °C, TL = 15.6 °C).
Buildings 13 02461 g004
Figure 5. Schematics of simulated cases: (a) reference, (b) wind washing, and (c) infiltration where a = d = 152 mm, b = c = 6.4 mm, H = 508 mm or 2324 mm, D = 38.1 mm or 88.9 mm, δw (wall thickness of all solid layers that bound the airspace) = 0.1 mm, TH = 32.2 °C, TL = 15.6 °C, and Tair = 25.7 °C, 32.2 °C, or 37.8 °C.
Buildings 13 02461 g005
Figure 6. Dependence of R-value due to wind washing of various Tair on ACH and E for reflective insulation assembly with horizontal heat flow (H = 508 mm and D = 38.1 mm). (a) Tair = 26.7 °C, (b) Tair = 32.2 °C, and (c) Tair = 37.8 °C.
Buildings 13 02461 g006
Figure 7. Dependence of R-value due to wind washing of various Tair on ACH and E for reflective insulation assembly with horizontal heat flow (H = 2324 mm and D = 38.1 mm). (a) Tair = 26.7 °C, (b) Tair = 32.2 °C, and (c) Tair = 37.8 °C.
Buildings 13 02461 g007
Figure 8. Dependence of R-value due to wind washing of various Tair on ACH and E for reflective insulation assembly with horizontal heat flow (H = 508 mm and D = 88.9 mm). (a) Tair = 26.7 °C, (b) Tair = 32.2 °C, and (c) Tair = 37.8 °C.
Buildings 13 02461 g008
Figure 9. Dependence of R-value due to wind washing of various Tair on ACH and E for reflective insulation assembly with horizontal heat flow (H = 2324 mm and D = 88.9 mm). (a) Tair = 26.7 °C, (b) Tair = 32.2 °C, and (c) Tair = 37.8 °C.
Buildings 13 02461 g009
Figure 10. Dependence of R-value due to infiltration of various Tair on ACH and E for reflective insulation assembly with horizontal heat flow (H = 508 mm and D = 38.1 mm). (a) Tair = 26.7 °C, (b) Tair = 32.2 °C, and (c) Tair = 37.8 °C.
Buildings 13 02461 g010
Figure 11. Dependence of R-value due to infiltration of various Tair on ACH and E for reflective insulation assembly with horizontal heat flow (H = 2324 mm and D = 38.1 mm). (a) Tair = 26.7 °C, (b) Tair = 32.2 °C, and (c) Tair = 37.8 °C.
Buildings 13 02461 g011
Figure 12. Dependence of R-value due to infiltration of various Tair on ACH and E for reflective insulation assembly with horizontal heat flow (H = 508 mm and D = 88.9 mm). (a) Tair = 26.7 °C, (b) Tair = 32.2 °C, and (c) Tair = 37.8 °C.
Buildings 13 02461 g012
Figure 13. Dependence of R-value due to infiltration of various Tair on ACH and E for reflective insulation assembly with horizontal heat flow (H = 2324 mm and D = 88.9 mm). (a) Tair = 26.7 °C, (b) Tair = 32.2 °C, and (c) Tair = 37.8 °C.
Buildings 13 02461 g013
Figure 14. Dependence of R-value due to infiltration (a,b) and wind washing (c,d) on Tair, AR, and E for a reflective insulation assembly with horizontal heat flow (ACH = 50, TH = 32.2 °C, TL = 15.6 °C).
Buildings 13 02461 g014
Figure 15. At the same volumetric air flow rate for different aspect ratios, dependence of R-value due to infiltration (a,b) and wind washing (c,d) on Tair, AR, and E for a reflective insulation assembly with horizontal heat flow (ACH = 100 for AR of 5.7 and 13.3, TH = 32.2 °C, TL = 15.6 °C).
Buildings 13 02461 g015
Table 2. Reductions in the R-values due to wind washing (Figure 5b) and infiltration (Figure 5c) at various ACH and Tair values in relation to the reference case (Figure 5a) (D = 38.1 mm and 88.9 mm, H = 508 mm and 2324 mm, E = 0.03 and 0.05).
D (mm)H (mm)Reference R-Value (m2·K/W) (see Figure 5a)Tair (°C)ACHPercentage Reduction in R-Value (%) *
Wind Washing
(see Figure 5b, Figure 6, Figure 7, Figure 8 and Figure 9)
Infiltration
(see Figure 5c, Figure 10, Figure 11, Figure 12 and Figure 13)
At E = 0.03At E = 0.05At E = 0.03At E = 0.05At E = 0.03At E = 0.05
38.15080.4580.43526.7250.46%0.37%5.79%5.34%
501.45%1.27%8.90%8.25%
1002.61%2.36%14.82%13.89%
32.2251.84%1.61%6.70%6.24%
504.26%3.96%11.23%10.52%
10010.33%9.74%23.10%21.82%
37.8252.61%2.41%7.01%6.47%
506.40%6.01%13.12%12.28%
10017.58%16.69%30.53%28.94%
23240.6690.62026.7259.36%8.64%12.64%11.60%
5022.52%20.78%25.90%23.93%
10032.86%30.35%35.80%33.11%
32.22512.80%11.88%15.90%14.54%
5034.22%31.66%38.22%35.41%
10051.58%47.98%53.41%49.55%
37.82516.87%15.55%19.82%18.23%
5041.26%38.17%44.10%40.71%
10069.06%63.81%76.11%70.47%
88.95080.4530.43326.7250.94%0.93%9.91%9.31%
501.29%1.20%15.58%14.67%
10018.34%17.41%54.32%51.64%
32.2254.80%4.51%12.60%12.00%
5012.65%12.05%26.80%25.45%
10039.06%37.23%81.78%77.90%
37.8257.65%7.21%14.91%14.13%
5024.65%23.49%38.83%36.85%
10051.23%48.88%101.57%96.71%
23240.6350.59326.72514.72%13.61%10.84%10.05%
5020.55%19.13%25.45%23.64%
10043.12%40.07%58.11%54.05%
32.22522.97%21.45%21.11%19.72%
5048.42%44.96%46.61%43.47%
10077.12%72.02%103.04%95.59%
37.82526.60%24.88%23.77%21.76%
5067.81%63.33%65.58%60.91%
100115.27%107.72%145.28%135.50%
* Percentage reduction in R-value = (reference R-value/R-value – 1) × 100.
Table 3. At the same volumetric air flow rate ( Q ˙ ), comparisons of R-values and the reductions in these values in relation to the reference case (Figure 5a) due to wind washing (Figure 5b–d) and infiltration (Figure 5c and Figure 15a,b) at various Tair (ACH = 100 for AR of 5.7 and 13.3, Q ˙ at AR = 26.1 is the same as that at AR = 5.7, and Q ˙ at AR = 61.0 is the same as that at AR = 13.3).
D (mm)H (mm)ARTair (°C)R-Value (m2·K/W)Percentage Reduction in R-Value (%) *
Wind WashingInfiltrationWind WashingInfiltration
E = 0.03E = 0.05E = 0.03E = 0.05E = 0.03E = 0.05E = 0.03E = 0.05
38.150813.326.70.4460.4250.3990.3822.61%2.36%14.82%13.89%
32.20.4140.3960.3720.35710.33%9.74%23.10%21.82%
37.80.3890.3730.3500.33717.58%16.69%30.53%28.94%
232461.026.70.6030.5640.5980.55910.98%10.07%11.84%10.96%
32.20.5870.5500.5840.54613.91%12.87%14.59%13.59%
37.80.5730.5370.5700.53516.79%15.49%17.32%16.05%
88.95085.726.70.3830.3680.2940.28618.34%17.41%54.32%51.64%
32.20.3260.3150.2500.24339.06%37.23%81.78%77.90%
37.80.2990.2910.2250.22051.23%48.88%101.57%96.71%
232426.126.70.5610.5260.5770.54113.28%12.65%10.13%9.55%
32.20.5180.4900.5360.50522.67%21.11%18.60%17.35%
37.80.4960.4700.5060.47828.05%26.20%25.62%23.97%
* Percentage reduction = (reference R-value/R-value – 1) × 100, where reference R-values with no air intrusion are listed in Table 2.
Disclaimer/Publisher’s Note: The statements, opinions and data contained in all publications are solely those of the individual author(s) and contributor(s) and not of MDPI and/or the editor(s). MDPI and/or the editor(s) disclaim responsibility for any injury to people or property resulting from any ideas, methods, instructions or products referred to in the content.

