Article

Exploring the Acceptance of the Technical Disclosure Method Based on 3D Digital Technological Process by Construction Workers through the Perspective of TAM

1
School of Infrastructure Engineering, Nanchang University, Nanchang 330047, China
2
Zhongmei Engineering Grouping, Nanchang 330001, China
*
Author to whom correspondence should be addressed.
Buildings 2023, 13(10), 2419; https://doi.org/10.3390/buildings13102419
Submission received: 15 August 2023 / Revised: 11 September 2023 / Accepted: 21 September 2023 / Published: 22 September 2023
(This article belongs to the Section Construction Management, and Computers & Digitization)

Abstract

:
Effective pre-control methods for construction workers during the construction phase are important means to ensure the final quality of the construction product. The 3D digital technological process introduces model-based definition (MBD) to the construction industry and enhances construction process management to some extent by combining it with building information modeling (BIM). However, the proper application of the 3D digital technological process requires a good knowledge of the factors associated with its acceptance. This study introduced the 3D digital technological process into technical disclosure and further explored the factors that may influence its acceptance among the construction worker population. Several new extrinsic variables, cognitive level, subjective norms, technology anxiety, and enjoyment, were added and evaluated in the technology acceptance model (TAM), and a total of 314 data samples were collected to verify the hypothesized paths. The results showed that the proposed model was effective in predicting the attitude of the worker population towards this method.

1. Introduction

As one of the largest industries in the world, the construction industry still faces many serious issues, such as construction safety, costs, and quality control. It is well known that quality is paramount to the success of a construction project [1]. Fragmented and sloppy construction modes are a major cause of poor building product quality reflected in all phases of the project process, of which the construction phase has the most significant impact on the overall quality of the engineering entity [2]. Therefore, it is important to adopt effective quality control methods for this phase.
Building quality is a collaborative effort involving many parties. From this perspective, quality can be expressed as the degree of refinement of deliverables accomplished within a fixed time and cost and measured against recognized standards and the needs of the various parties involved [1]. The nature of the construction project determines that quality management is a key aspect throughout the project. Previous research explored the applicability and possibility of a variety of technological approaches in promoting quality management in the construction industry, such as Total Quality Management (TQM) [3] and ISO 9000 quality management system [4]. However, the aforementioned research [3,4,5] on quality management mainly centered on the implementation possibilities and challenges, with a lack of targeted application and case validation during the construction phase. In addition, with the continuous improvement of quality management theory, the focus of its attention has gradually shifted from after-control to in- and before-control [6]. Real-time monitoring and assessment of project quality [7], acquisition and management of quality inspection data [8], and monitoring and alarming of workers’ safety behavior [9] are currently hot topics in the field of in-process control. Moreover, it is worth noting that workers are the actual executors of engineering projects, and the processes and details of workers’ operations during the construction process directly determine the final quality of the project [6].
At present, the research on the standardization of construction workers’ processes during construction is still in its infancy [10]. Compared with the time-consuming and labor-intensive real-time monitoring of the quality of the project in the construction process, it is more advisable to adopt effective pre-control measures for workers to fundamentally improve construction quality. A complete construction process consists of a number of construction sections in series, each of which is divided into a number of steps. The latter is also regarded as a refinement of each construction section. The standardized implementation of each section is an important guarantee of the construction quality of the project. However, in practice, due to inefficient training methods and outdated quality management tools, etc., it is often difficult for workers to accurately understand and realize quality control requirements, which, in turn, leads to eventual quality defects. It is not hard to find that current research on pre-control in the construction industry is mainly focused on innovation and validation of the effectiveness of safety training methods, and in particular, on the use of VR [11,12]. The research on training in construction techniques and technological process training for workers is relatively limited. Therefore, it is necessary to further explore more effective process quality control methods at the pre-process stage in order to deepen the workers’ understanding of the techniques and thus improve the quality of construction.
In recent years, digital technology has flourished and is of broad application prospect. In the construction industry, digital technologies, such as blockchain, IoT, and BIM, have been widely used to remove information barriers in various segments of construction and to optimize facility management [13,14]. Although digital design technology in the construction industry has become increasingly mature with the popularity of various types of 3D building design software based on BIM, the 3D digital process technology of construction products still lags behind and deserves further research [15]. MBD [16], first applied to the aerospace industry, is a digital definition method that integrates the design and manufacturing information of a product through a 3D model. This method gives full play to the advantages of intuitive visualization of the 3D model and organizes the information on design, manufacturing, and quality requirements in a modeled form to contain both the final state of the product and the intermediate state of the production phase of the product, which can intuitively reflect the dynamics of the process. MBD is now widely used in the representation and digital management of processes in the manufacturing industry. Wang [17] explored a non-rotational part modeling method based on MBD and Pro/ENGINEER; Zhang [18] investigated MBD-based integrated product design techniques for complex and customized products to achieve efficient collaboration of different business activities; Geng [19] proposed a method for issuing 3D instructions for lightweight assembly of complex products by combining MBD techniques with lightweight models. It is evident that the effectiveness of MBD as a digital technology to assist process management and quality control has been well proven in the manufacturing industry. Though the construction industry is similar to the manufacturing industry, the research on the application of MBD in the construction industry is still in its infancy. Liu [15] introduced MBD into the construction process management and proposed a method for 3D digital technological process of construction products in combination with BIM to deepen the workers’ understanding, which provided a new approach to process management and process quality management in the construction industry. Figure 1 illustrates the flow of the technological process digitization proposed by Liu. However, the research on the acceptance of this technology among the construction worker population and the relevant influence factors is very limited.
With the acceleration of the process of scientific development, various types of information and communications technologies (ICTs) have been constantly innovated and evolved. Multiple theories and models have been used to assess the acceptance and dissemination of these technologies in different industries. The commonly used ones include the technology acceptance model (TAM) [20,21], the unified theory of adoption and utilization of technology (UTAUT) [22,23], the innovation diffusion theory (IDT) [24], the technology-organization-environment (TOE) framework [25,26], and the task-technology fit (TTF) model [27]. Among these, TAM has been widely used in studies to explore user acceptance of computer information technology and is considered to be a concise model for explaining user technology adoption behavior [28,29]. Its prediction of user acceptance can be as high as 50% [30]. Meanwhile, there have been studies [31,32,33] applying TAM to explore technology adoption in the construction industry. Therefore, TAM was chosen as the theory framework of this research. Based on the theory of reasoned action, Davis [30] proposed the technology acceptance model (TAM) to explain people’s acceptance of information technology and identified perceived usefulness (PU) and perceived ease of use (PEU) as the two main variables that determined users’ attitudes towards technology and were also directly influenced by some external variables. Several scholars have introduced a variety of factors to improve and extend the model mentioned above to explore the acceptance of different technological systems by different populations in various fields. For example, Abdullah [34] explored the impact of several of the most common factors, such as self-efficacy as well as subjective norms, on students’ use of e-portfolio systems; Ahmad [35] investigated the role of factors such as perceived irreplaceability and perceived trustworthiness in the willingness of elderly diabetic patients to continue using wearable devices. Moreover, TAM has also been widely used in the construction industry. Zhang [36] investigated the factors influencing low acceptance of VR technology by combining perceived price value, self-efficacy, and perceived playability as external variables with TAM and found that perceived ease of use had the most significant effect on intention to use; Park [31] used an extended TAM to investigate the determinants of acceptance of web-based training by professionals in the construction industry and found that user satisfaction was the most prominent indicator; Billanes [32] used TAM as the theory framework to study the acceptance of residents towards the adoption of smart energy technologies in their residential buildings. From these studies, it can be inferred that the use of TAM has provided a valuable reference for the adoption and dissemination of different ICTs in the construction industry. In these studies, the research subjects were mostly employees of construction companies, construction students, engineers, and members of trade associations, etc., while few centered on the group of construction workers. Moreover, at present, much of the research on this group focuses on areas such as personal protective equipment and wearable devices. For example, Wong [37] introduced safety management practice factors into the TAM model and investigated construction workers’ attitudes toward personal protective equipment (PPE); Man [38] built a PPE acceptance model for construction workers (PAMCW) by integrating the theory of planned behavior with TAM. Technical disclosure is an important pre-control of the project quality [39]. Traditional technical disclosure has the problems of formalization and inefficiency, and the introduction of information technology into technical disclosure has become a new tendency. Xu [39] applied BIM to technical disclosure and confirmed its advantages in improving the quality of this process by discussing real cases; Wu [40] proposed a method for automatic generation of technical disclosure documents based on the knowledge element model, which helped to reduce the workload of managers. The 3D digital technological process is an emerging technology based on MBD, but there have been few attempts to combine it with technical disclosure. Therefore, our study mainly introduced the 3D digital technological process into construction technical disclosure, aiming to explore the factors affecting workers’ acceptance of this new method through TAM. Specifically, cognitive level, subjective norms, technology anxiety, and enjoyment were set as antecedent variables for PU and PEU. Structural equation modeling (SEM) was used to identify the supporting or hindering role of the aforementioned factors in the acceptance of this approach by the construction worker group. The results of this study provided valuable information for predicting the acceptance of 3D digital technological process by construction workers in technical disclosure and technical training and may provide a relevant theoretical basis for further study of the PU and PEU in the group of construction workers.

2. Research Model and Hypotheses

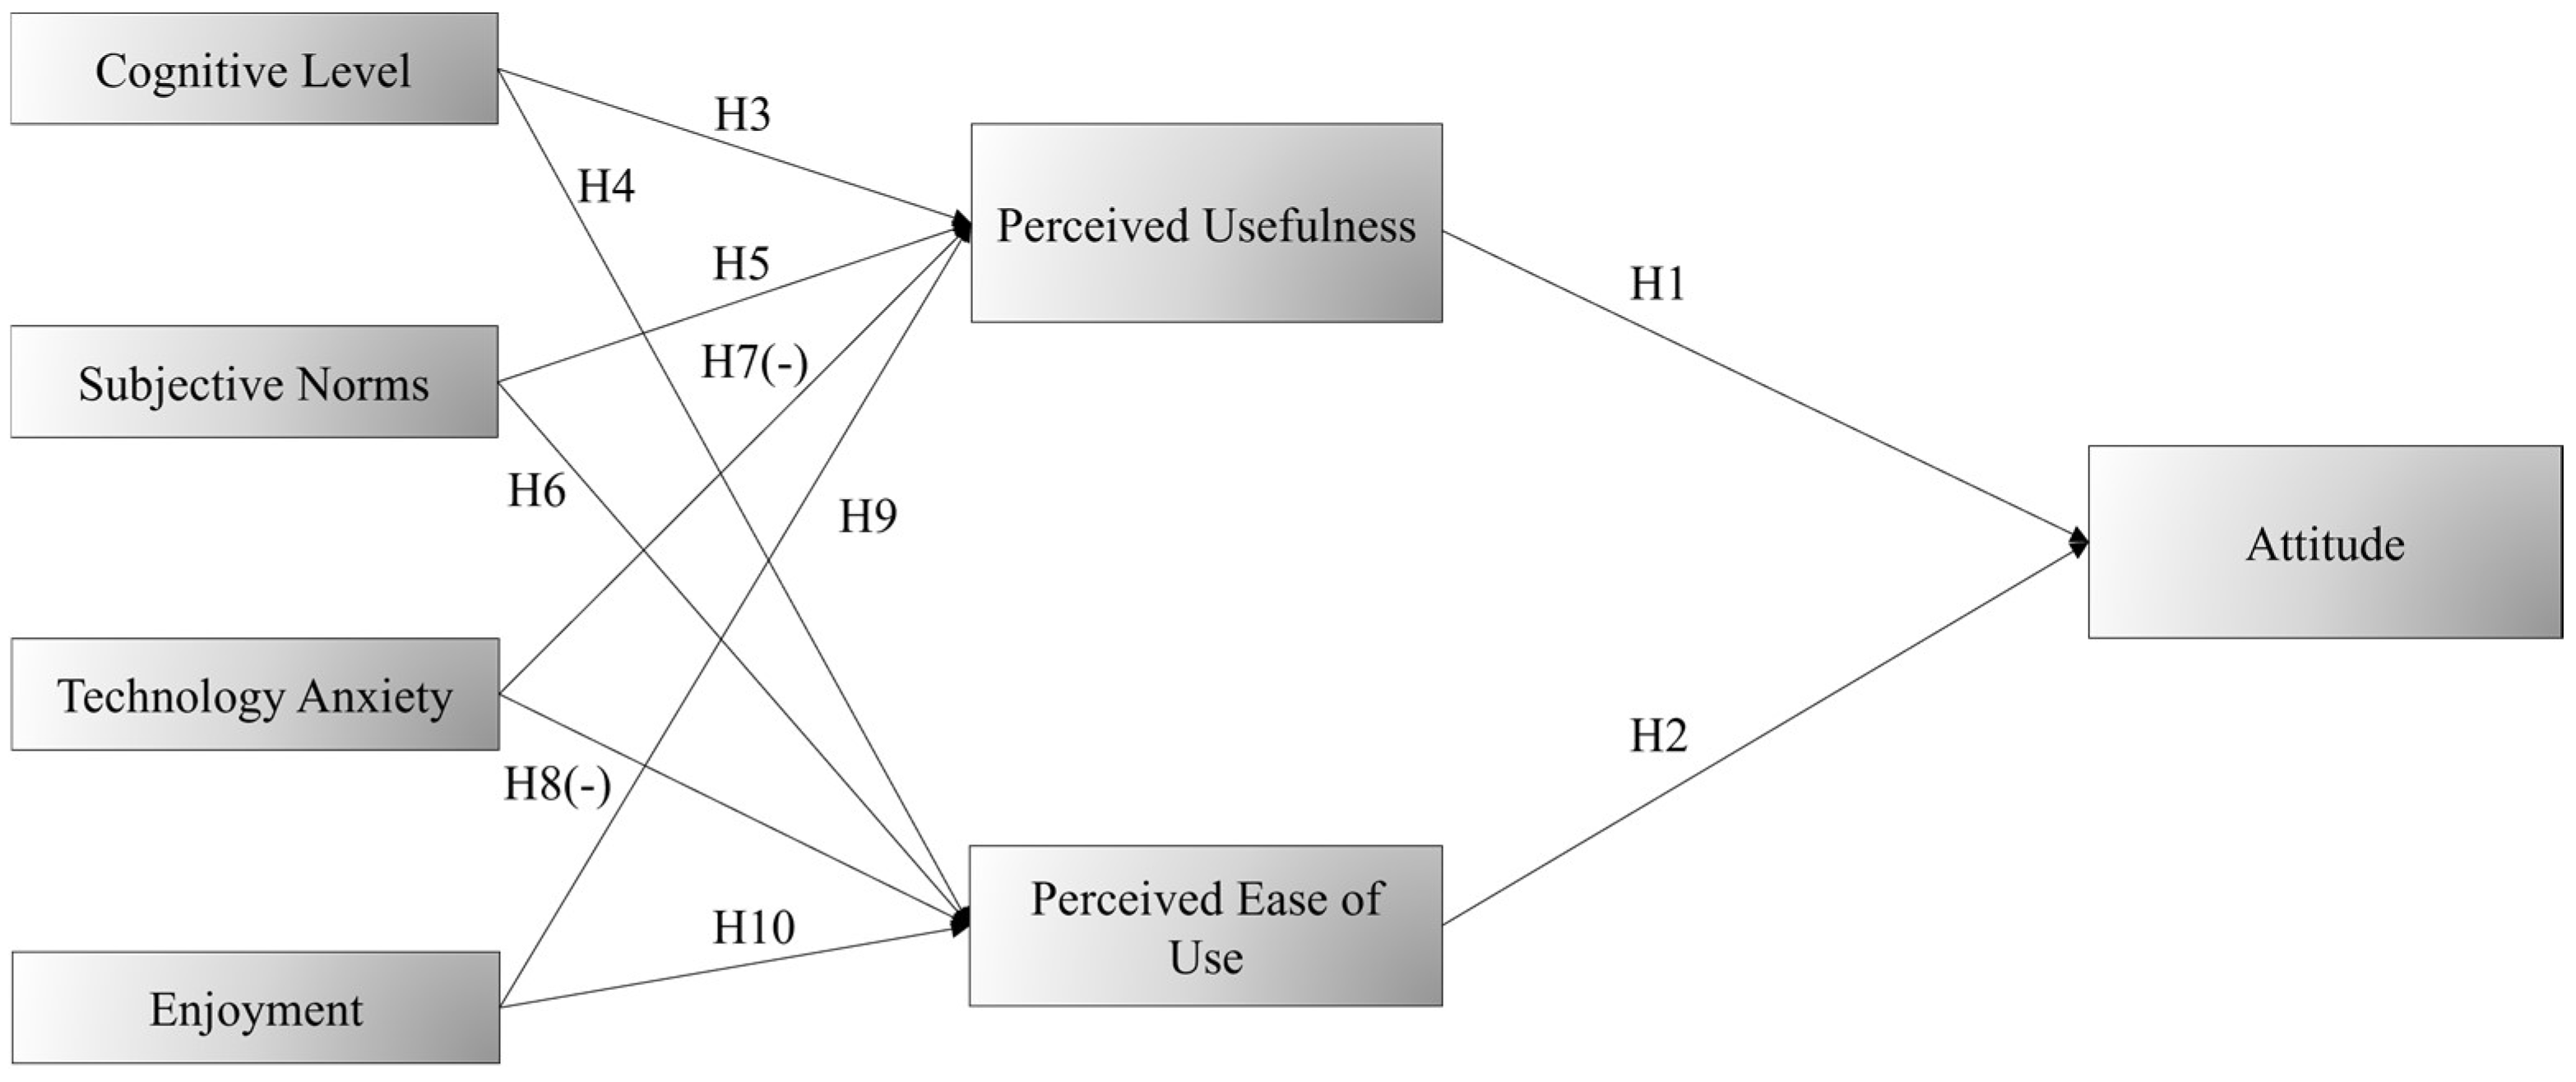
The research model in this study was extended based on TAM. In TAM, PU and PEU are the two most important factors and are affected by external variables. The key to explaining user acceptance of a technology is to understand the antecedents of the core structure of TAM, which are external factors [41]. TAM with external factors can give researchers and developers specific help in technology upgradation while predicting the adoption of the technology [42]. Therefore, many scholars have extended TAM with different external factors to explain the acceptance or adoption of various technologies [21,29,31,43,44]. Among them, in studying the acceptance of web-based training (WBT) by construction professionals, Park [31] considered the external variables associated with WBT acceptance from four perspectives: individual, social, organizational support, and system issues. Herein, organizational support is understood as a personal perception of the importance of the system perceived by the organization, involving senior leadership value and resource allocation. This paper followed a similar pattern. However, since the hardware and resource part and system issue are more related to the technology than to the people themselves, we have excluded related factors. In addition to this, the management value part and social influence can be summarized as the environmental pressures exerted by others on individuals when they choose to engage in or avoid a behavior. Therefore, these two issues can be considered in combination with the external variable of subjective norms. On this basis, the emotional and practical experience of the technical disclosure was considered from the perspective of the construction workers themselves, and technical anxiety and enjoyment were chosen as external variables accordingly. In addition, the percentage of young people entering the industry has been declining due to the negative aspects of the job, which has led to a significant problem of an aging workforce in the construction industry. Ranasinghe [45] stated that increasing age directly affected a person’s cognitive level and learning ability. At the same time, the education level of the construction worker group is relatively low. Nguyen [46], in the study on the impediments to live-streaming among tea farmers, pointed out that knowledge and experience were key barriers to technology adoption and that tea farmers with higher education were more likely to be interested in adopting new technologies. Since age and education level could not be measured directly in SEM, cognitive level was added as a corresponding external variable. The research model is shown in Figure 2.

2.1. Technology Acceptance Model

Four constructs were included in the original TAM model: PU, PEU, attitude (ATT), and behavioral intention (BI). Among them, PU and PEU had been identified as key factors influencing the acceptance and continued use of technology [47]. PU described the extent to which users deem a particular technology helpful in their work [30], and PEU was defined as the extent to which users accept or use a particular technology without expending too much effort [31]. In this study, PU referred to how construction workers perceived the benefits brought to them by technical disclosure based on the 3D digital technological process, and PEU referred to the level of effort made by construction workers to participate in this technical disclosure. In addition, ATT referred to the extent to which construction workers were willing to accept this form of technical disclosure. Previous studies have shown that PU and PEU were closely related to people’s attitudes towards new technologies [36,48]. Therefore, the following hypotheses were proposed:
H1: 
PU positively affects construction workers’ attitudes toward 3D digital technological process-based technical disclosure.
H2: 
PEU positively affects construction workers’ attitudes toward 3D digital technological process-based technical disclosure.

2.2. Cognitive Level

In this study, cognitive level referred to the extent to which construction workers understood as well as were willing to try out the technical disclosure method based on the 3D digital technological process. Nguyen [46] pointed out that the lack of relevant knowledge and experience was a significant deterrent to the PU and PEU of a technology. The more people become knowledgeable about the technology and the use of the associated equipment, the more they understand the benefits that this technology can bring. On the contrary, in the case of insufficient cognitive level, people’s attitudes are more hesitant [49]. This will particularly be the case in the increasingly aging construction industry, where age affects people’s perception, learning ability, and cognitive level [50]. Older people may be less familiar with the operation of new technologies and have a lower level of awareness of new technologies than younger people, leading to a more difficult acceptance of new technologies. Therefore, the following hypotheses were proposed:
H3: 
Cognitive level positively affects PU.
H4: 
Cognitive level positively affects PEU.

2.3. Subjective Norms

Subjective norms are a kind of passive factors promoting action. Several past studies have shown that subjective norms are an important factor in explaining people’s adoption of a technology [29,33,34,41,51]. Possessing social characteristics, each individual is not independent and is in constant interaction with others. In this research, subjective norms were defined as the extent to which the individual perceived that other people, such as his workmates as well as supervisors, who exerted a significant influence on his behavior, believed that he should accept this new way of technical disclosure, which was a form of pressure and influence from others. The importance of subjective norms is more significant when the information technology to which people are exposed is completely new and if the adoption of this technology is mandatory, just as the acceptance of technical disclosure based on the new technology leaves little room for refusal for the workers [29,41]. If those around them are more supportive of a technical disclosure based on the 3D digital technological process, then the workers themselves will be more inclined to adopt an optimistic and positive attitude. Therefore, the following hypotheses were proposed:
H5: 
Subjective norms positively affect PU.
H6: 
Subjective norms positively affect PEU.

2.4. Technology Anxiety

Technical anxiety is a negative emotional response that refers to the emotions such as nervousness and helplessness that workers feel when faced with this new way of technical disclosure [52]. When individuals are exposed to new technologies, those with high levels of anxiety are prone to “absent-minded” behaviors, leading to a decrease in PU [53]. By analyzing patient acceptance of a home telecare system, Rahimpour [52] found that technology anxiety affected people’s assessment of PU and PEU. Currently, the files of the 3D digital technological process can only be presented in exe file form. While this format is free from the limitations of the CATIA platform, it still requires a computer environment to view the complete technological process. This may cause workers who are not familiar with computer operations to feel uneasy or anxious due to the fear that they may not be able to understand or use it well, thus negatively affecting the PU and PEU. Therefore, the following hypotheses were proposed:
H7: 
Technical anxiety negatively affects PU.
H8: 
Technical anxiety negatively affects PEU.

2.5. Enjoyment

Emotions have an important influence on the acceptance of new technology by individuals. This variable measured the degree of pleasure and interest aroused by the new technical disclosure method to the workers. The role of enjoyment in technology acceptance has been investigated in many studies [31,34,44,54]. The results suggest that higher levels of enjoyment lead to the promotion of better acceptance of a technology. Enjoyment reduces the perceived burden and anxiety of using new technology and influences people’s assessment of ease of use through increasing their sense of experience [55]. Park [31] confirmed the positive relationship between enjoyment and PU and PEU when investigating the influencing factors affecting the acceptance of web-based training in the construction industry. In the context of this study, workers who experience more fun from this new approach may also have higher PU and PEU. Therefore, the following hypotheses were proposed:
H9: 
Enjoyment positively affects PU.
H10: 
Enjoyment positively affects PEU.

3. Research Method

3.1. Survey Design and Data Collection

Since masonry structure is one of the most commonly used structural forms in the construction industry due to its advantages of easy material extraction, low cost, and excellent thermal insulation, and heat preservation performance, the infilled masonry wall was chosen as the research example for this study. Firstly, the researchers generated the files of the 3D digital technological process for the infill masonry wall based on the technical route proposed by Liu [15] and then contacted the project managers and builders involved in the research. Before the formal experiment, the researchers sent them the files and asked for their opinions on the content. Their suggestions led to a more rigorous linguistic description in the expression of the technology. During the experiment, the workers began by viewing the files through a projection device in a conference room, a process that lasted about 10 min. Afterwards, workers were provided with free time to use the computer. Using the interactivity of the exported files, workers could select different sections to view on their own. At the same time, the corresponding model of each process could be adjusted by using the right mouse button and long press to change the view angle, which allowed workers to fully observe the model according to their own needs, thus deepening their understanding of the technological process and especially the details of the practice. This process lasted about 15 min. The workers were then asked to fill out a questionnaire, and upon completion, the workers were thanked and dismissed.
In order to collect data for the study of the model, a two-part questionnaire was designed, consisting of a background survey of the workers interviewed and questions corresponding to the extended TAM structure. In the first part, participants were asked to inform about their gender, age, level of education, and years of participation in the workforce. In the second part, participants would answer a total of 21 questions related to the seven constructs to explore their acceptance of the technical disclosure based on the 3D digital technological process. These questions referred to the previous literature and were modified descriptively to fit the research context of this study, as shown in Table 1. Each question was measured using a five-point Likert scale, with 1 indicating strong disagreement and 5 indicating strong agreement.
The final data samples came from workers in a total of ten projects under construction under two construction organizations in Nanchang, Jiangxi Province, China. The survey lasted from 30 June 2023 to 20 July 2023, and a total of 337 questionnaires were collected. After excluding 23 incomplete questionnaires and invalid questionnaires with exactly the same answers to the questions, a final total of 314 questionnaires were used for analysis. The majority of respondents, 84.4%, were male. More than half of the respondents were older than 40, with the largest number of workers in the 40–50 age range at 40.1%. Overall, the respondents had a low level of education, with 66.6% of the workers receiving only junior high school education or less. Meanwhile, 51.2% of the respondents had more than 10 years of working experience, indicating that the majority of the respondents had relatively rich working experience. The demographics are presented in Table 2.

3.2. Digital Technological Process of the Infilled Masonry Wall

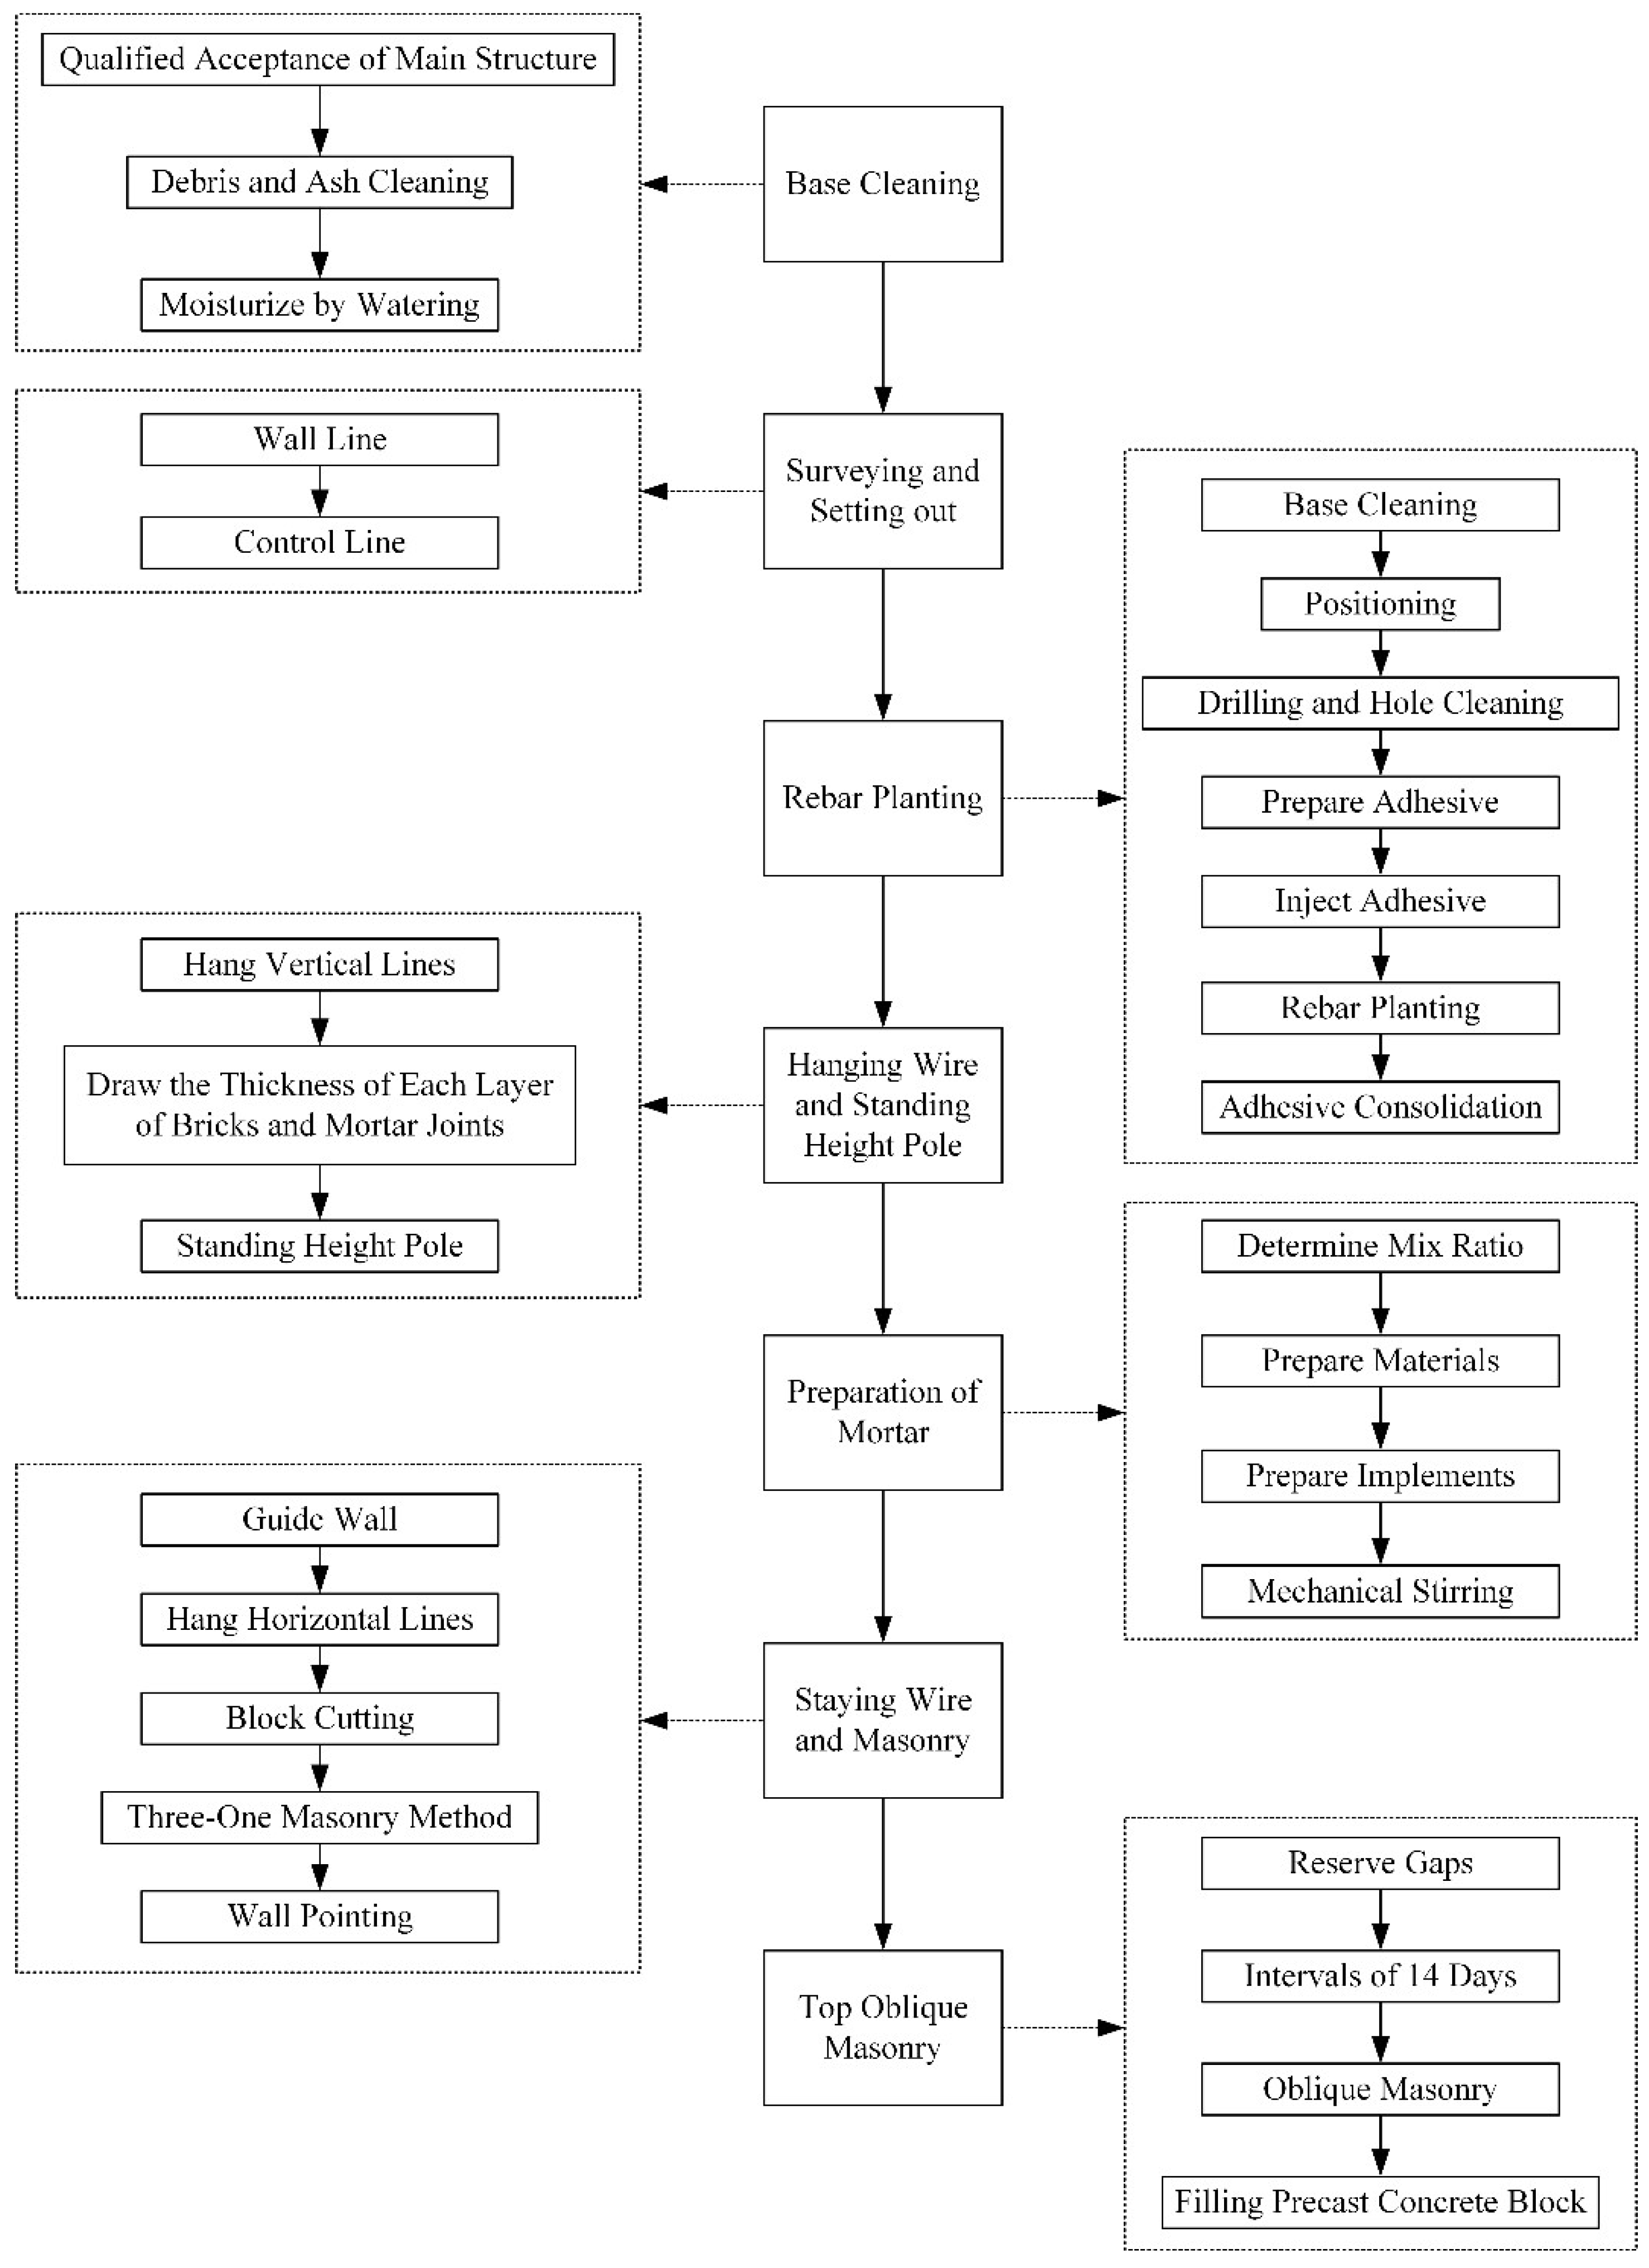
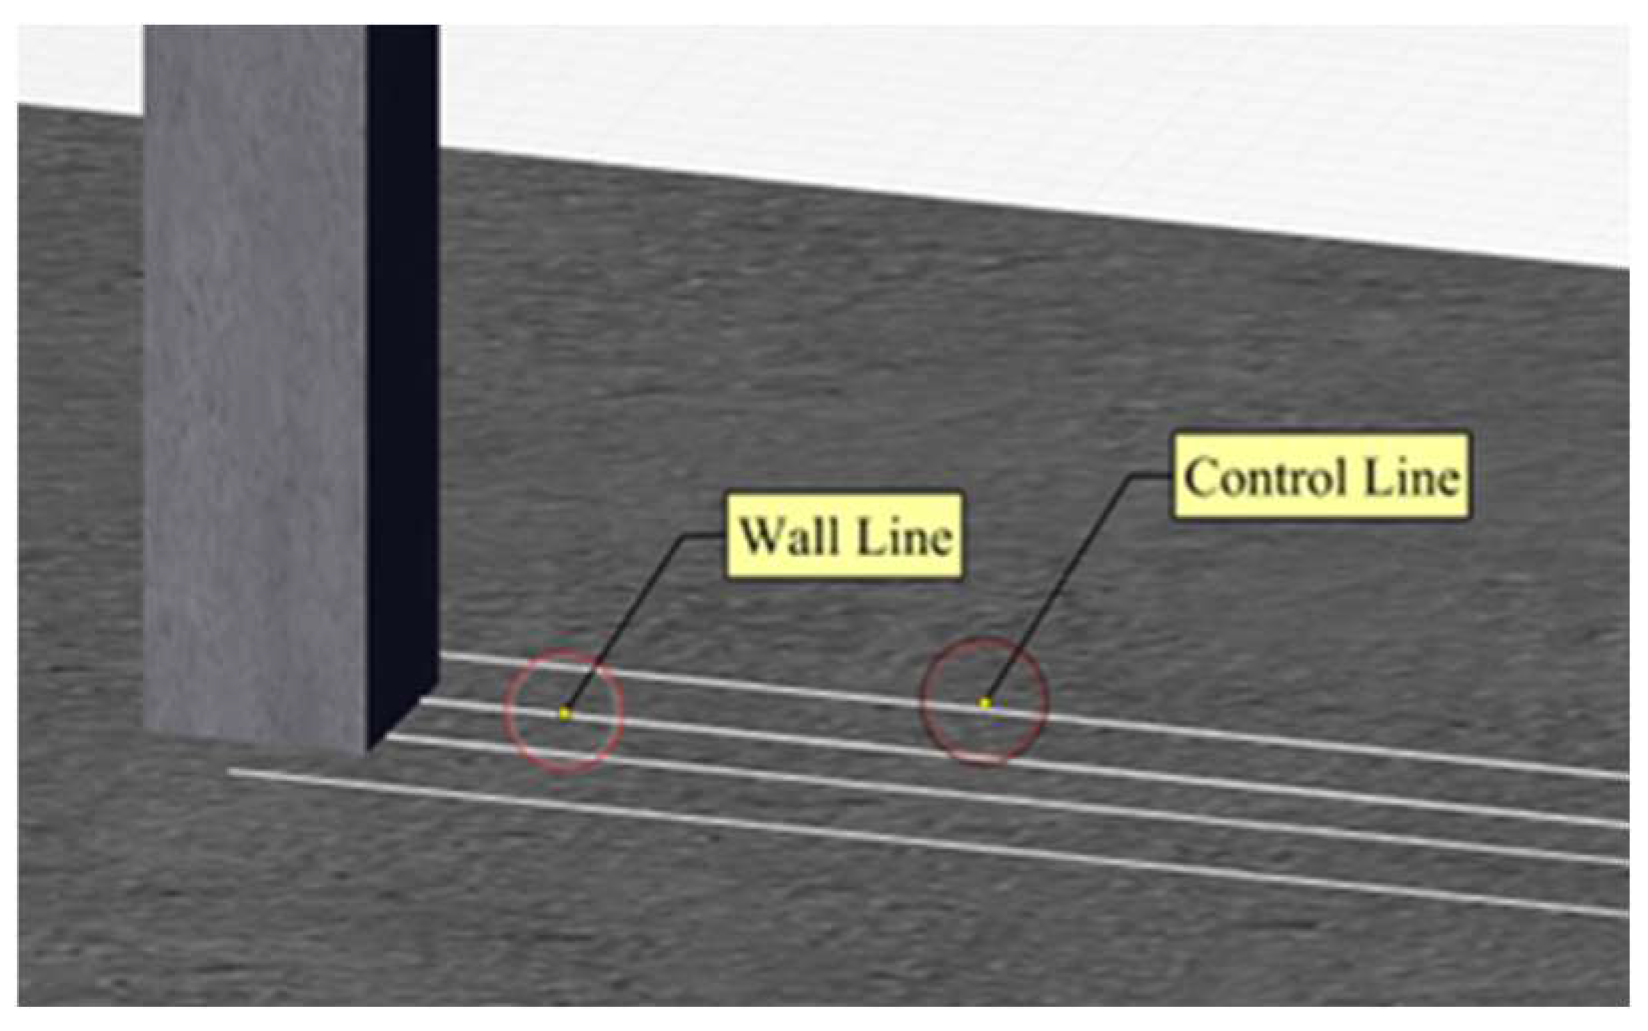
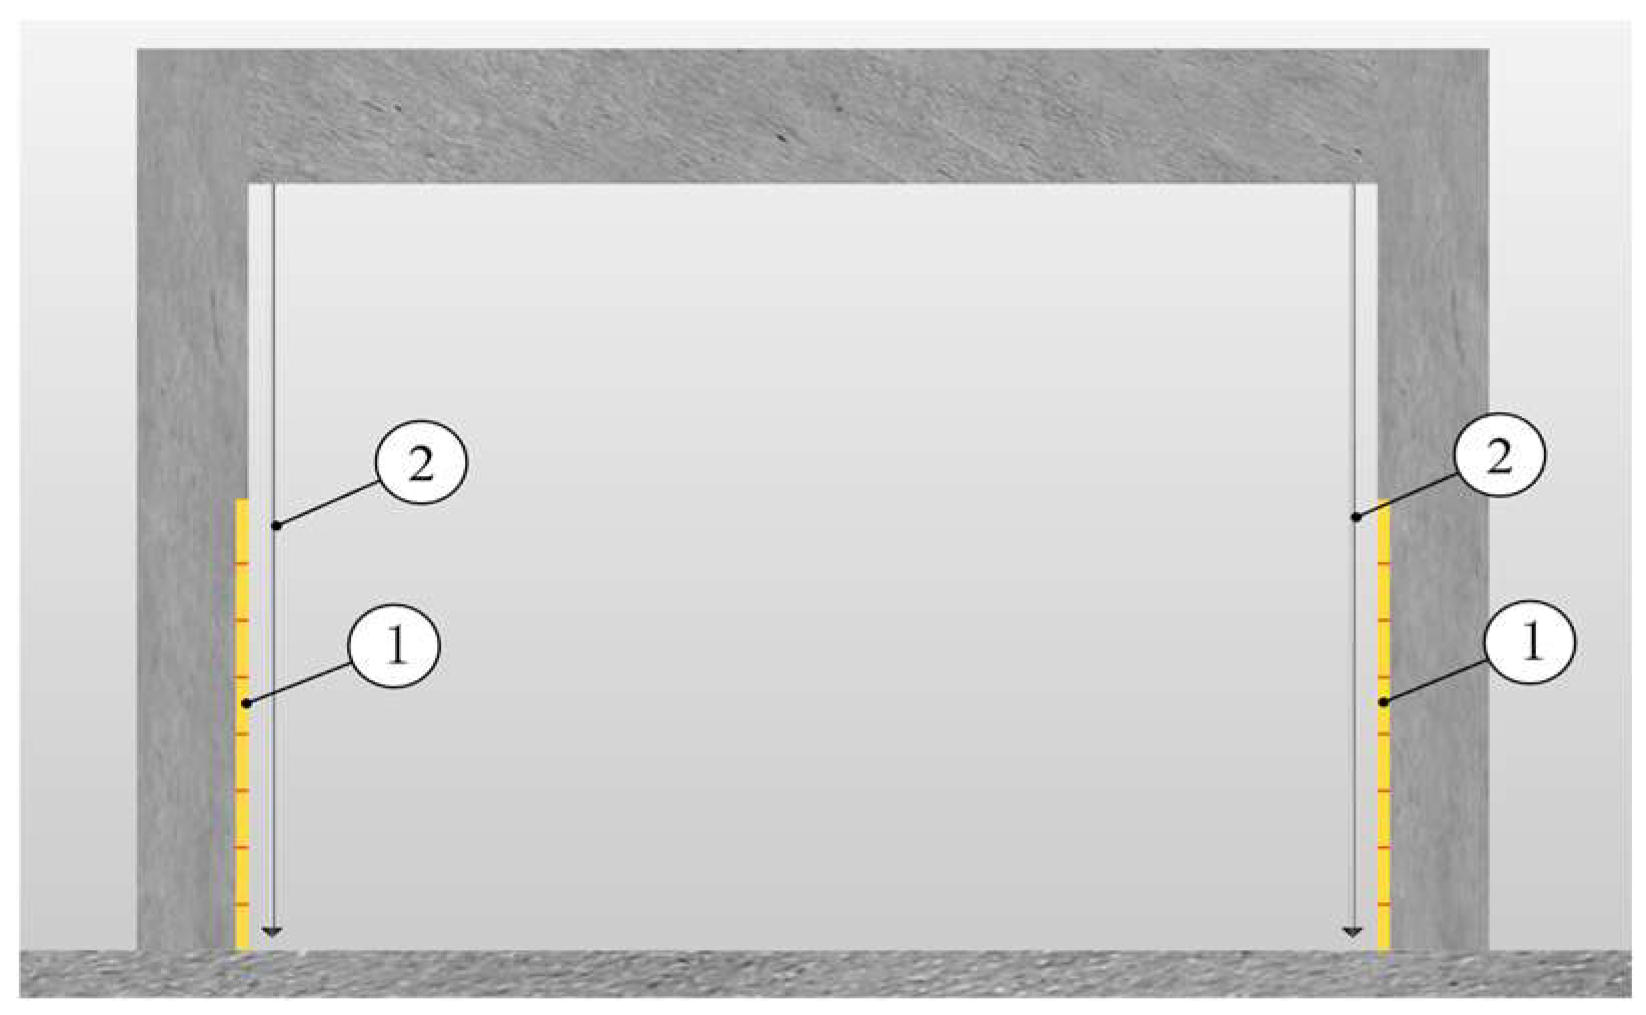
According to the 3D digital technological process route proposed by Liu (Figure 1), firstly, the process of infilled masonry walls was refined in the form of a flow chart. To ensure scientific accuracy, the main sections were sorted out according to a masonry construction program provided by a construction company, including base cleaning, surveying and setting out, rebar planting, hanging wire and standing height pole, preparation of mortar, staying wire and masonry and top oblique masonry. The above major sections were then divided into work steps, as shown in Figure 3, and the quality and technical control points were sorted out to form the process information model. Then, each parameterized unit, including floor slabs, structural beams, structural columns, bottom lime-sand bricks, concrete plus blocks, horizontal and vertical lime joints, height pole, and top oblique bricks was created based on the Revit platform from Autodesk [15]. On this basis, the construction-oriented process design model for the construction was created in the order of the main sections. The process design model consisted of four parts: the front model, the auxiliary process model, the key process model, and the process detail model. In this case, the front model contained the beams, columns, and floor slabs where the masonry infilled walls were located. The auxiliary process model contained the steps of drawing wall lines and control lines (as in Figure 4), hanging vertical lines and standing height poles (as in Figure 5), and hanging horizontal lines. These units would not be in the final infilled masonry wall but were very necessary during construction. The key process model expressed the quality and technical control points, such as masonry planting practices, hanging line considerations, and top oblique masonry practices. The process detail model showed specific operations in the masonry process, such as the out-and-in bond method for the bottom lime-sand bricks (as in Figure 6) and the ‘three-one masonry method’ (one brick, one shovel of mortar and one rub masonry method) for the concrete plus blocks. Afterwards, using the CATIA Composer 2021 of Dassault, the process design model was first lightened, and then, through the view function, different views of the same process were created by changing the visibility of the components in the model, thus achieving a dynamic representation of the process. Finally, the mapping from the process information model to the process design model was completed by adding the corresponding process information to the created view through text boxes, labels, and other functions. Figure 7a,b illustrates this mapping relationship using the top oblique masonry as an example. After completing the above tasks, we exported the created key views as an exe file, which could run directly in Windows without the assistance of the CATIA platform [15]. This exe file provided a complete representation of the technological process for the infilled masonry wall.

4. Results

The analysis of the collected data consisted of two main processes. First, confirmatory factor analysis (CFA) was applied to test the reliability, convergent validity, and discriminant validity of the measurement model. After the results of the measurement model met the requirements, the structural equation model was applied to test the proposed hypotheses.

4.1. Measurement Model

Tests of reliability, convergent validity, and discriminant validity of the measurement model were conducted. The results of the CFA are shown in Table 1. The basic statistical information of the questionnaire data is shown in Table 3. The reliability was assessed based on Cronbach’s α coefficient, and the value for each construct was greater than 0.7, indicating that the reliability was acceptable. Moreover, the factor loadings for each item exceeded the threshold of 0.7, indicating good item reliability [58]. Convergent validity was assessed by composite reliability (CR) and average variance extracted (AVE). In the model of this study, the results of CR values ranged from 0.894 to 0.958, which exceeded the acceptable level proposed by Fornell et al. [59]. All AVE values exceeded the recommended requirement of 0.5 [58]. Finally, discriminant validity was analyzed by comparing the square root of the AVE for each construct with the correlation coefficient between the corresponding construct and the others. If the former was greater than the latter, it indicated that there was sufficient discriminant validity between the different constructs. As shown in Table 4, the values on the diagonal, the square root of the AVE for each construct, were greater than the correlation coefficients between the constructs, indicating acceptable discriminant validity.

4.2. Structural Model

The structural model was verified by using the structural equation model (SEM) to test the fit between the model and the data collected. Tests were conducted using AMOS 26. In this study, a total of six fit indices were tested, including chi-square normalized by degrees of freedom (χ2/df), incremental fit index of improved NFI (CFI), goodness-of-fit index (GFI), adjusted GFI (AGFI), the normalized fit index (NFI), and root-mean-square error of approximation (RMSEA). The criteria for a good fit of these six indexes and the corresponding calculated values are given in Table 5. The results showed that the fit between the structural model and the data was acceptable.
Hypothesis testing was analyzed using AMOS 26 based on the data collected, and the results of the path analysis are shown in Table 6. PU (β = 0.497, p < 0.001) and PEU (β = 0.370, p < 0.001) were both significantly positive for the attitude, which supported Hypothesis 1 and Hypothesis 2. Subsequently, the hypothesized paths of influence of external variables on the basic structure of TAM were all confirmed. The cognitive level had a significant positive effect on PU (β = 0.202, p < 0.01) and PEU (β = 0.225, p < 0.001), which supported Hypothesis 3 and Hypothesis 4. Similarly, subjective norms had a positive and significant impact on both PU (β = 0.142, p = 0.009) and PEU (β = 0.204, p < 0.001), which provided support for Hypothesis 5 and Hypothesis 6. Technology anxiety significantly and negatively affected both PU (β = −0.151, p = 0.01) and PEU (β = −0.284, p < 0.001), which confirmed Hypothesis 7 and Hypothesis 8. The results also indicated a positive and significant path between enjoyment and PU (β = 0.327, p < 0.001) and PEU (β = 0.21, p = 0.002), supporting Hypothesis 9 and Hypothesis 10. The total variance (R2) was used to measure the explanatory power of the model for the variables [60]. In this model, external variables explained 44% of the variance in PU and 52% of the variance in PEU, respectively, while PU and PEU explained 56% of the variance in the attitude.

4.3. Analysis

By simultaneously extending the TAM structure and using the SEM method, the factors influencing workers’ acceptance of the technical disclosure method based on 3D digital technological process were analyzed. The results showed that, on the one hand, both PU and PEU had a positive effect on the workers’ attitudes, while the effect of PU was stronger than that of PEU. On the other hand, with PU and PEU as mediating variables, the three external factors (cognitive level, subjective norms, and enjoyment) all had a positive effect on workers’ attitudes. In addition to this, the effect of technology anxiety on PU and PEU of the workers was significantly negative.
Consistent with the results of previous studies [31,34,44,54], enjoyment was an important determinant of PU and PEU. This indicated that when workers deem this technical disclosure method as being pleasurable, their feelings of its ease of use and usefulness will correspondingly increase, making them more likely to accept it. At the same time, the study found that cognitive level had a direct impact on PU and PEU, which was easy to understand. The technical disclosure method based on the 3D digital technological process is a new concept for workers, and without the guidance of an experienced person, it is difficult for them to identify the specific benefits that can be brought to them. When people are exposed to a new concept without understanding it, their opinions are often passive. In addition, the impact of the length of service of the workers should also be paid attention to. The majority of respondents’ length of service was concentrated in the 5–20-year range (58.6%). The experience accumulated over a long period of time in the field will lead to the formation of stereotypes in the minds of the workers. When confronted with a new method of technical disclosure, workers often easily feel that they already know it very well and will not be willing to spend time and become impatient. At the same time, workers also lack a basic comprehension of the 3D digital technological process, which is not conducive to the promotion of the technical disclosure method based on the 3D digital technological process. Our results also confirmed a positive correlation between subjective norms and PU and PEU, but the path coefficients of subjective norms were smaller than those of enjoyment and cognitive level. One possible reason for this is that technical disclosure, as a part of technology management, is mostly carried out in different forms of training. In this process, workers are passive recipients with no choice of the training form. At the same time, this kind of training is often mandatory, and there is no room for workers to refuse. This status may result in workers being pressured by their superiors to accept and participate in the technical disclosure, but it does not actually affect their perception of the usefulness and ease of use of the technical disclosure method to any significant extent.
Meanwhile, in this study, it was also found that technology anxiety was a significant negative influencer of PU and PEU, suggesting that when anxiety levels are high, workers are less likely to have a positive attitude towards the technical disclosure method based on the 3D digital technological process. This might be due to the fact that the technical disclosure documents were presented and manipulated on the computer during the experiment. Aging in the construction industry is currently a problem that cannot be ignored. In the interviewed group, 56.9% of the workers were over 40 years of age, and many of them might never have had access to a computer, which was particularly evident in the second phase of the experiment. We observed that even simple mouse clicks and long presses required constant invitations from the researchers before any workers were willing to try, and often, it was only when a few workers succeeded that the rest of the workers gradually let go of their concerns and participated. Chen [57] pointed out that increasing age reduced cognitive abilities, such as memory and attention, so older people were relatively less receptive to new things. Another possible reason is that self-efficacy assumes the role of a mediating variable between technology anxiety and PU and PEU, which means that, to some extent, technology anxiety affects the self-efficacy of a person when exposed to something new. Self-efficacy refers to an individual’s confidence in overcoming difficulties and accomplishing specific behaviors [61]. Because of unfamiliarity with computer operations, workers were less confident in accepting this new method of technical disclosure, which led to a decrease in their PU and PEU.

5. Conclusions

The aim of this article was to systematically investigate construction workers’ acceptance of a technical disclosure method based on the 3D digital technological process and to investigate the factors influencing acceptance through an extended TAM model.
It was found that the proposed TAM model, which integrated cognitive level, subjective norms, technology anxiety and enjoyment, could be used to explain and predict how construction workers accept this type of technical disclosure. In particular, enjoyment was a key factor influencing workers’ perceived usefulness, so their perceived level of pleasure should be emphasized in order to promote positive attitudes. In terms of workers’ PEU, cognitive level played a more important predictive role than other external variables. This confirmed the importance of workers’ knowledge and familiarity with new things. How to actively promote the dissemination of the technical disclosure method based on the 3D digital technological process is an issue that deserves the attention of the management of the construction industry. In this process, the effectiveness and practicability of this technical disclosure method should be fully explained. In addition, the cognitive learning ability of the workers’ group needs to be taken into account, and more appropriate as well as reasonable methods of dissemination and guidance should be chosen accordingly. Although subjective norms played a relatively smaller role in PU and PEU, it was still a significant antecedent. The management should encourage and motivate workers to participate. Furthermore, technology anxiety was the only negative factor found in this study’s model, suggesting a need for management to provide some organizational support, such as through specialized teaching tutorials and introductory computer training, to alleviate construction workers’ technological anxiety. In order to promote and successfully apply the technical disclosure method based on the 3D digital technological process in the construction industry, in addition to the diversification of export forms, 3D digital technological process developers and designers should recognize the limitation of the computer terminal view and pay more attention to the mobile phone interface and online apps, which are not subject to the aforementioned limitations and easier to use. Good interface design and clear instructions in development are very important to improve the PEU for workers. Moreover, perceived usefulness was also a key determinant of workers’ acceptance of this new technical disclosure method. Therefore, during the ensuing development and diffusion process, developers and the management group should keep frequent contact with the workers to obtain their dynamic feedback on optimization and take both timely and appropriate adjustment measures to continually improve the acceptability of this technical disclosure method. In addition, there are still relatively few construction processes that are digitally handled. How to make the 3D digital technological process fit more accurately with the construction program of different projects, especially in the detailed operation of the process, in order to apply it more efficiently in the technical disclosure also needs to be further explored.
Although this study provided some insights into the acceptance of the technical disclosure method based on the 3D digital technological process by the construction worker community, there were still some limitations. Firstly, this study only focused on the hypothesized relationships between the selected variables and never investigated moderating effects, such as gender, age, and education level, on pathways. Secondly, this study was cross-sectional, measuring perceptions and attitudes at a static point in time. A longitudinal approach should be more appropriate for the dynamics research of workers’ acceptance as they continue to learn more about and become familiar with this method of technical disclosure. Finally, this study was carried out in China and focused on the infilled masonry wall process as a case study, so the generality of the conclusions needs to be further verified.

Author Contributions

Conceptualization, Y.M. and H.W.; methodology, Y.M.; software, Y.M., J.L. (Jianqiang Liu) and J.L. (Jing Lv); validation, Y.M., L.J. and H.W.; formal analysis, Y.M.; investigation, Y.M. and J.L. (Jing Lv); resources, J.L. (Jianqiang Liu), J.L. (Jing Lv) and L.J.; data curation, Y.M.; writing—original draft preparation, Y.M.; writing—review and editing, L.J. and H.W.; visualization, J.L. (Jianqiang Liu) and J.L. (Jing Lv); supervision, J.L. (Jianqiang Liu), L.J. and H.W.; project administration, J.L. (Jianqiang Liu) and L.J.; funding acquisition, L.J. All authors have read and agreed to the published version of the manuscript.

Funding

This work was supported by the Science and Technology Plan Project of Jiangxi Geological Bureau [grant numbers 2023JXDZKJKY07]; the Science and Technology Plan Project of Jiangxi Geological Bureau [grant numbers 2021JXDZ70001]; and the Science and Technology Plan Project of Jiangxi Coalfield Geology Bureau [grant numbers 2020JXMD70003].

Data Availability Statement

Not applicable.

Acknowledgments

The authors thank all the personnel who either provided technical support or helped with data collection. We also acknowledge all the reviewers for their useful comments and suggestions.

Conflicts of Interest

The authors declare no conflict of interest.

References

  1. Riaz, H.; Iqbal Ahmad Khan, K.; Ullah, F.; Bilal Tahir, M.; Alqurashi, M.; Badr Alsulami, T. Key factors for implementation of total quality management in construction Sector: A system dynamics approach. Ain Shams Eng. J. 2023, 14, 101903. [Google Scholar] [CrossRef]
  2. Huang, X. Research on Digitization of Construction Process Based on MBD. Master’s Thesis, Nanchang University, Nanchang, China, 2021. [Google Scholar]
  3. Haupt, T.C.; Whiteman, D.E. Inhibiting factors of implementing total quality management on construction sites. TQM Mag. 2004, 16, 166–173. [Google Scholar] [CrossRef]
  4. Chini, A.R.; Valdez, H.E. ISO 9000 and the U.S. Construction Industry. J. Manag. Eng. 2003, 19, 69–77. [Google Scholar] [CrossRef]
  5. Ullah, F.; Thaheem, M.J.; Siddiqui, S.Q.; Khurshid, M.B. Influence of Six Sigma on project success in construction industry of Pakistan. TQM J. 2017, 29, 276–309. [Google Scholar] [CrossRef]
  6. Luo, H.B.; Ling, L.; Chen, K.; Fordjour, A.-A.M.; Chen, L.J. Digital technology for quality management in construction: A review and future research directions. Dev. Built Environ. 2022, 12, 100087. [Google Scholar] [CrossRef]
  7. Han, C.J.; Tang, F.L.; Ma, T.Y.; Gu, L.H.; Tong, Z. Construction quality evaluation of asphalt pavement based on BIM and GIS. Autom. Constr. 2022, 141, 104398. [Google Scholar] [CrossRef]
  8. Sheng, D.; Ding, L.Y.; Zhong, B.T.; Love, P.E.D.; Luo, H.B.; Chen, J.G. Construction quality information management with blockchains. Autom. Constr. 2020, 120, 103373. [Google Scholar] [CrossRef]
  9. Hong, S.K.; Yoon, J.; Ham, Y.; Lee, B.; Kim, H. Monitoring safety behaviors of scaffolding workers using Gramian angular field convolution neural network based on IMU sensing data. Autom. Constr. 2023, 148, 104748. [Google Scholar] [CrossRef]
  10. Ma, Z.L.; Cai, S.Y.; Mao, N.; Yang, Q.L.; Feng, J.G.; Wang, P.Y. Construction quality management based on a collaborative system using BIM and indoor positioning. Autom. Constr. 2018, 92, 35–45. [Google Scholar] [CrossRef]
  11. Rokooei, S.; Shojaei, A.; Alvanchi, A.; Azad, R.K.; Didehvar, N. Virtual reality application for construction safety training. Saf. Sci. 2023, 157, 105925. [Google Scholar] [CrossRef]
  12. Adami, P.; Rodrigues, P.B.; Woods, P.J.; Becerik-Gerber, B.; Soibelman, L.; Copur-Gencturk, Y.; Lucas, G.M. Effectiveness of VR-based training on improving construction workers’ knowledge, skills, and safety behavior in robotic teleoperation. Adv. Eng. Inform. 2021, 50, 101431. [Google Scholar] [CrossRef]
  13. Fang, W.L.; Ma, L.; Love, P.E.D.; Luo, H.B.; Ding, L.Y.; Zhou, A. Knowledge graph for identifying hazards on construction sites: Integrating computer vision with ontology. Autom. Constr. 2020, 119, 103310. [Google Scholar] [CrossRef]
  14. Hilal, M.; Maqsood, T.; Abdekhodaee, A. A scientometric analysis of BIM studies in facilities management. Int. J. Build. Pathol. Adapt. 2019, 37, 122. [Google Scholar] [CrossRef]
  15. Liu, Y.; Jia, L.; Wu, H.; Huang, X. Research on 3D Digital Technological Process of Construction Products with Model-Based Definition. Appl. Sci. 2022, 12, 8585. [Google Scholar] [CrossRef]
  16. Zhu, H.H.; Li, J. Research on three-dimensional digital process planning based on MBD. Kybernetes 2018, 47, 816–830. [Google Scholar] [CrossRef]
  17. Wang, L.X.; Guo, Y.; Guo, M.Y. Exploration of Non-Revolved Parts Modeling based on MBD and Pro/Engineer. Adv. Mater. Res. 2013, 712, 1171–1174. [Google Scholar] [CrossRef]
  18. Zhang, Y.F.; Shi, L.C.; Ren, S.; Zhang, D. A model-driven dynamic synchronization mechanism of lifecycle business activity for complicated and customized products. Procedia CIRP 2019, 83, 748. [Google Scholar] [CrossRef]
  19. Geng, J.H.; Zhang, S.M.; Yang, B. A Publishing Method of Lightweight Three-Dimensional Assembly Instruction for Complex Products. J. Comput. Inf. Sci. Eng. 2015, 15, 031004. [Google Scholar] [CrossRef]
  20. Liu, D.; Lu, W.; Niu, Y. Extended Technology-Acceptance Model to Make Smart Construction Systems Successful. J. Constr. Eng. Manag. 2018, 144. [Google Scholar] [CrossRef]
  21. Lee, S.; Yu, J.; Jeong, D. BIM Acceptance Model in Construction Organizations. J. Manag. Eng. 2015, 31, 04014048. [Google Scholar] [CrossRef]
  22. Cai, L.; Yuen, K.F.; Wang, X. Explore public acceptance of autonomous buses: An integrated model of UTAUT, TTF and trust. Travel Behav. Soc. 2023, 31, 120–130. [Google Scholar] [CrossRef]
  23. Andrews, J.E.; Ward, H.; Yoon, J. UTAUT as a Model for Understanding Intention to Adopt AI and Related Technologies among Librarians. J. Acad. Librariansh. 2021, 47, 102437. [Google Scholar] [CrossRef]
  24. Shahid, M. Exploring the determinants of adoption of Unified Payment Interface (UPI) in India: A study based on diffusion of innovation theory. Digit. Bus. 2022, 2, 100040. [Google Scholar]
  25. Somya, G.; Wafa, G.; Dharen, K.P.; Sah, G.P. Artificial intelligence adoption in the insurance industry: Evidence using the technology-organization-environment framework. Res. Int. Bus. Financ. 2022, 63, 101757. [Google Scholar]
  26. Al Hadwer, A.; Tavana, M.; Gillis, D.; Rezania, D. A Systematic Review of Organizational Factors Impacting Cloud-based Technology Adoption Using Technology-Organization-Environment Framework. Internet Things 2021, 15, 100407. [Google Scholar] [CrossRef]
  27. Wang, H.Y.; Luo, X.T.; Yu, X.D. Exploring the role of IoT in project management based on Task-technology Fit model. Procedia Comput. Sci. 2021, 199, 1052–1059. [Google Scholar] [CrossRef]
  28. Sorce, J.; Issa, R.R.A. Extended technology acceptance model (tam) for adoption of information and communications technology (ICT) in the US construction industry. J. Inf. Technol. Constr. 2021, 2, 227–248. [Google Scholar] [CrossRef]
  29. Son, H.; Lee, S.; Kim, C. What drives the adoption of building information modeling in design organizations? An empirical investigation of the antecedents affecting architects’ behavioral intentions. Autom. Constr. 2015, 49, 92–99. [Google Scholar] [CrossRef]
  30. Davis, F.D. Perceived Usefulness, Perceived Ease of Use, and User Acceptance of Information Technology. MIS Q. 1989, 13, 319–340. [Google Scholar] [CrossRef]
  31. Park, Y.; Son, H.; Kim, C. Investigating the determinants of construction professionals’ acceptance of web-based training: An extension of the technology acceptance model. Autom. Constr. 2012, 22, 377–386. [Google Scholar] [CrossRef]
  32. Billanes, J.; Enevoldsen, P. Influential factors to residential building Occupants? acceptance and adoption of smart energy technologies in Denmark. Energy Build. 2022, 276, 112524. [Google Scholar] [CrossRef]
  33. Son, H.; Park, Y.; Kim, C.; Chou, J.-S. Toward an understanding of construction professionals’ acceptance of mobile computing devices in South Korea: An extension of the technology acceptance model. Autom. Constr. 2012, 28, 82–90. [Google Scholar] [CrossRef]
  34. Abdullah, F.; Ward, R.R.; Ahmed, E. Investigating the influence of the most commonly used external variables of TAM on students’ Perceived Ease of Use (PEOU) and Perceived Usefulness (PU) of e-portfolios. Comput. Hum. Behav 2016, 63, 75–90. [Google Scholar] [CrossRef]
  35. Ahmad, A.; Rasul, T.; Yousaf, A.; Zaman, U. Understanding Factors Influencing Elderly Diabetic Patients’ Continuance Intention to Use Digital Health Wearables: Extending the Technology Acceptance Model (TAM). J. Open Innov. Technol. Mark. Complex. 2020, 6, 81. [Google Scholar] [CrossRef]
  36. Zhang, M.; Shu, L.; Luo, X.W.; Yuan, M.Q.; Zheng, X.Z. Virtual reality technology in construction safety training: Extended technology acceptance model. Autom. Constr. 2022, 135, 104113. [Google Scholar] [CrossRef]
  37. Wong, T.K.; Man, S.S.; Chan, A.H.S. Exploring the acceptance of PPE by construction workers: An extension of the technology acceptance model with safety management practices and safety consciousness. Saf. Sci. 2021, 139, 105239. [Google Scholar] [CrossRef]
  38. Man, S.S.; Alabdulkarim, S.A.; Chan, A.H.S.; Zhang, T. The acceptance of personal protective equipment among Hong Kong construction workers: An integration of technology acceptance model and theory of planned behavior with risk perception and safety climate. J. Saf. Res. 2021, 79, 329–340. [Google Scholar] [CrossRef]
  39. Xu, N.; Wang, L. Study on Technical Disclosure in Construction Based on BIM. Appl. Mech. Mater. 2013, 438, 1698–1701. [Google Scholar] [CrossRef]
  40. Wu, J.; Guo, Y.; Gao, C.; Sun, J. An automatic text generation algorithm of technical disclosure for catenary construction based on knowledge element model. Adv. Eng. Inform. 2023, 56, 101913. [Google Scholar] [CrossRef]
  41. Venkatesh, V.; Davis, F.D. A theoretical extension of the technology acceptance model: Four longitudinal field studies. Manag. Sci. 2000, 46, 186–204. [Google Scholar] [CrossRef]
  42. Davis, F.D.; Bagozzi, R.P.; Warshaw, P.R. User acceptance of computer technology: A comparison of two theoretical models. Manag. Sci. 1989, 35, 982–1003. [Google Scholar] [CrossRef]
  43. Abdullah, F.; Ward, R. Developing a General Extended Technology Acceptance Model for E-Learning (GETAMEL) by analysing commonly used external factors. Comput. Hum. Behav. 2016, 56, 238–256. [Google Scholar] [CrossRef]
  44. Mun, Y.Y.; Hwang, Y. Predicting the use of web-based information systems: Self-efficacy, enjoyment, learning goal orientation, and the technology acceptance model. Int. J. Hum.-Comput. Stud. 2003, 59, 431–449. [Google Scholar]
  45. Ranasinghe, U.; Tang, L.M.; Harris, C.; Li, W.; Montayre, J.; de Almeida Neto, A.; Mark, A. A systematic review on workplace health and safety of ageing construction workers. Saf. Sci. 2023, 167, 106276. [Google Scholar] [CrossRef]
  46. Doanh, N.K.; Do Dinh, L.; Quynh, N.N. Tea farmers’ intention to participate in Livestream sales in Vietnam: The combination of the Technology Acceptance Model (TAM) and barrier factors. J. Rural. Stud. 2022, 94, 408–417. [Google Scholar] [CrossRef]
  47. Davis, F.D. A Technology Acceptance Model for Empirically Testing New End-User Information Systems: Theory and Results. Ph.D. Dissertation, Massachusetts Institute of Technology, Cambridge, MA, USA, 1986. [Google Scholar]
  48. Özdemir-Güngör, D.; Camgöz-Akdag, H. Examining the effects of technology anxiety and resistance to change on the acceptance of breast tumor registry system: Evidence from Turkey. Technol. Soc. 2018, 54, 66–73. [Google Scholar] [CrossRef]
  49. Paltasingh, K.R.; Goyari, P. Impact of farmer education on farm productivity under varying technologies: Case of paddy growers in India. Agric. Food Econ. 2018, 6, 7. [Google Scholar] [CrossRef]
  50. Chen, F.; Jiao, H.; Han, L.; Shen, L.; Du, W.; Ye, Q.; Yu, G. Real-time monitoring of construction quality for gravel piles based on Internet of Things. Autom. Constr. 2020, 116, 103228. [Google Scholar] [CrossRef]
  51. Lee, Y.H.; Hsieh, Y.C.; Ma, C.Y. A model of organizational employees’ e-learning systems acceptance. Knowl.-Based Syst. 2011, 24, 355–366. [Google Scholar] [CrossRef]
  52. Rahimpour, M.R.; Lovell, N.H.; Celler, B.G.; McCormick, J. Patients’ perceptions of a home telecare system. Int. J. Med. Inform. 2008, 77, 486–498. [Google Scholar] [CrossRef] [PubMed]
  53. Brosnan, M.J. Modeling technophobia: A case for word processing. Comput. Hum. Behav. 1999, 15, 105–121. [Google Scholar] [CrossRef]
  54. Holdack, E.; Lurie-Stoyanov, K.; Fromme, H.F. The role of perceived enjoyment and perceived informativeness in assessing the acceptance of AR wearables. J. Retail. Consum. Serv. 2022, 65, 102259. [Google Scholar] [CrossRef]
  55. Sun, H.; Zhang, P. The role of moderating factors in user technology acceptance. Int. J. Hum. Comput. Stud. 2006, 64, 53–78. [Google Scholar] [CrossRef]
  56. Türker, C.; Altay, B.C.; Okumuş, A. Understanding user acceptance of QR code mobile payment systems in Turkey: An extended TAM. Technol. Forecast. Soc. Chang. 2022, 184, 121968. [Google Scholar] [CrossRef]
  57. Chen, T.; Chen, J.; Or, C.K.; Lo, F.P. Path analysis of the roles of age, self-efficacy, and TAM constructs in the acceptance of performing upper limb exercises through immersive virtual reality games. Int. J. Ind. Ergon. 2022, 91, 103360. [Google Scholar] [CrossRef]
  58. Hair, J.F.; Black, W.C.; Babin, B.J.; Anderson, R.E. Multivariate Data Analysis, 7th ed.; Pearson: London, UK, 2009. [Google Scholar]
  59. Fornell, C.; Larcker, D.F. Evaluating Structural Equation Models with Unobservable Variables and Measurement Error. J. Mark. Res. 1981, 18, 39–50. [Google Scholar] [CrossRef]
  60. Estriegana, R.; Medina-Merodio, J.-A.; Barchino, R. Student acceptance of virtual laboratory and practical work: An extension of the technology acceptance model. Comput. Educ. 2019, 135, 1–14. [Google Scholar] [CrossRef]
  61. Bandura, A. Self-efficacy mechanism in human agency. Am. Psychol. 1982, 37, 122. [Google Scholar] [CrossRef]
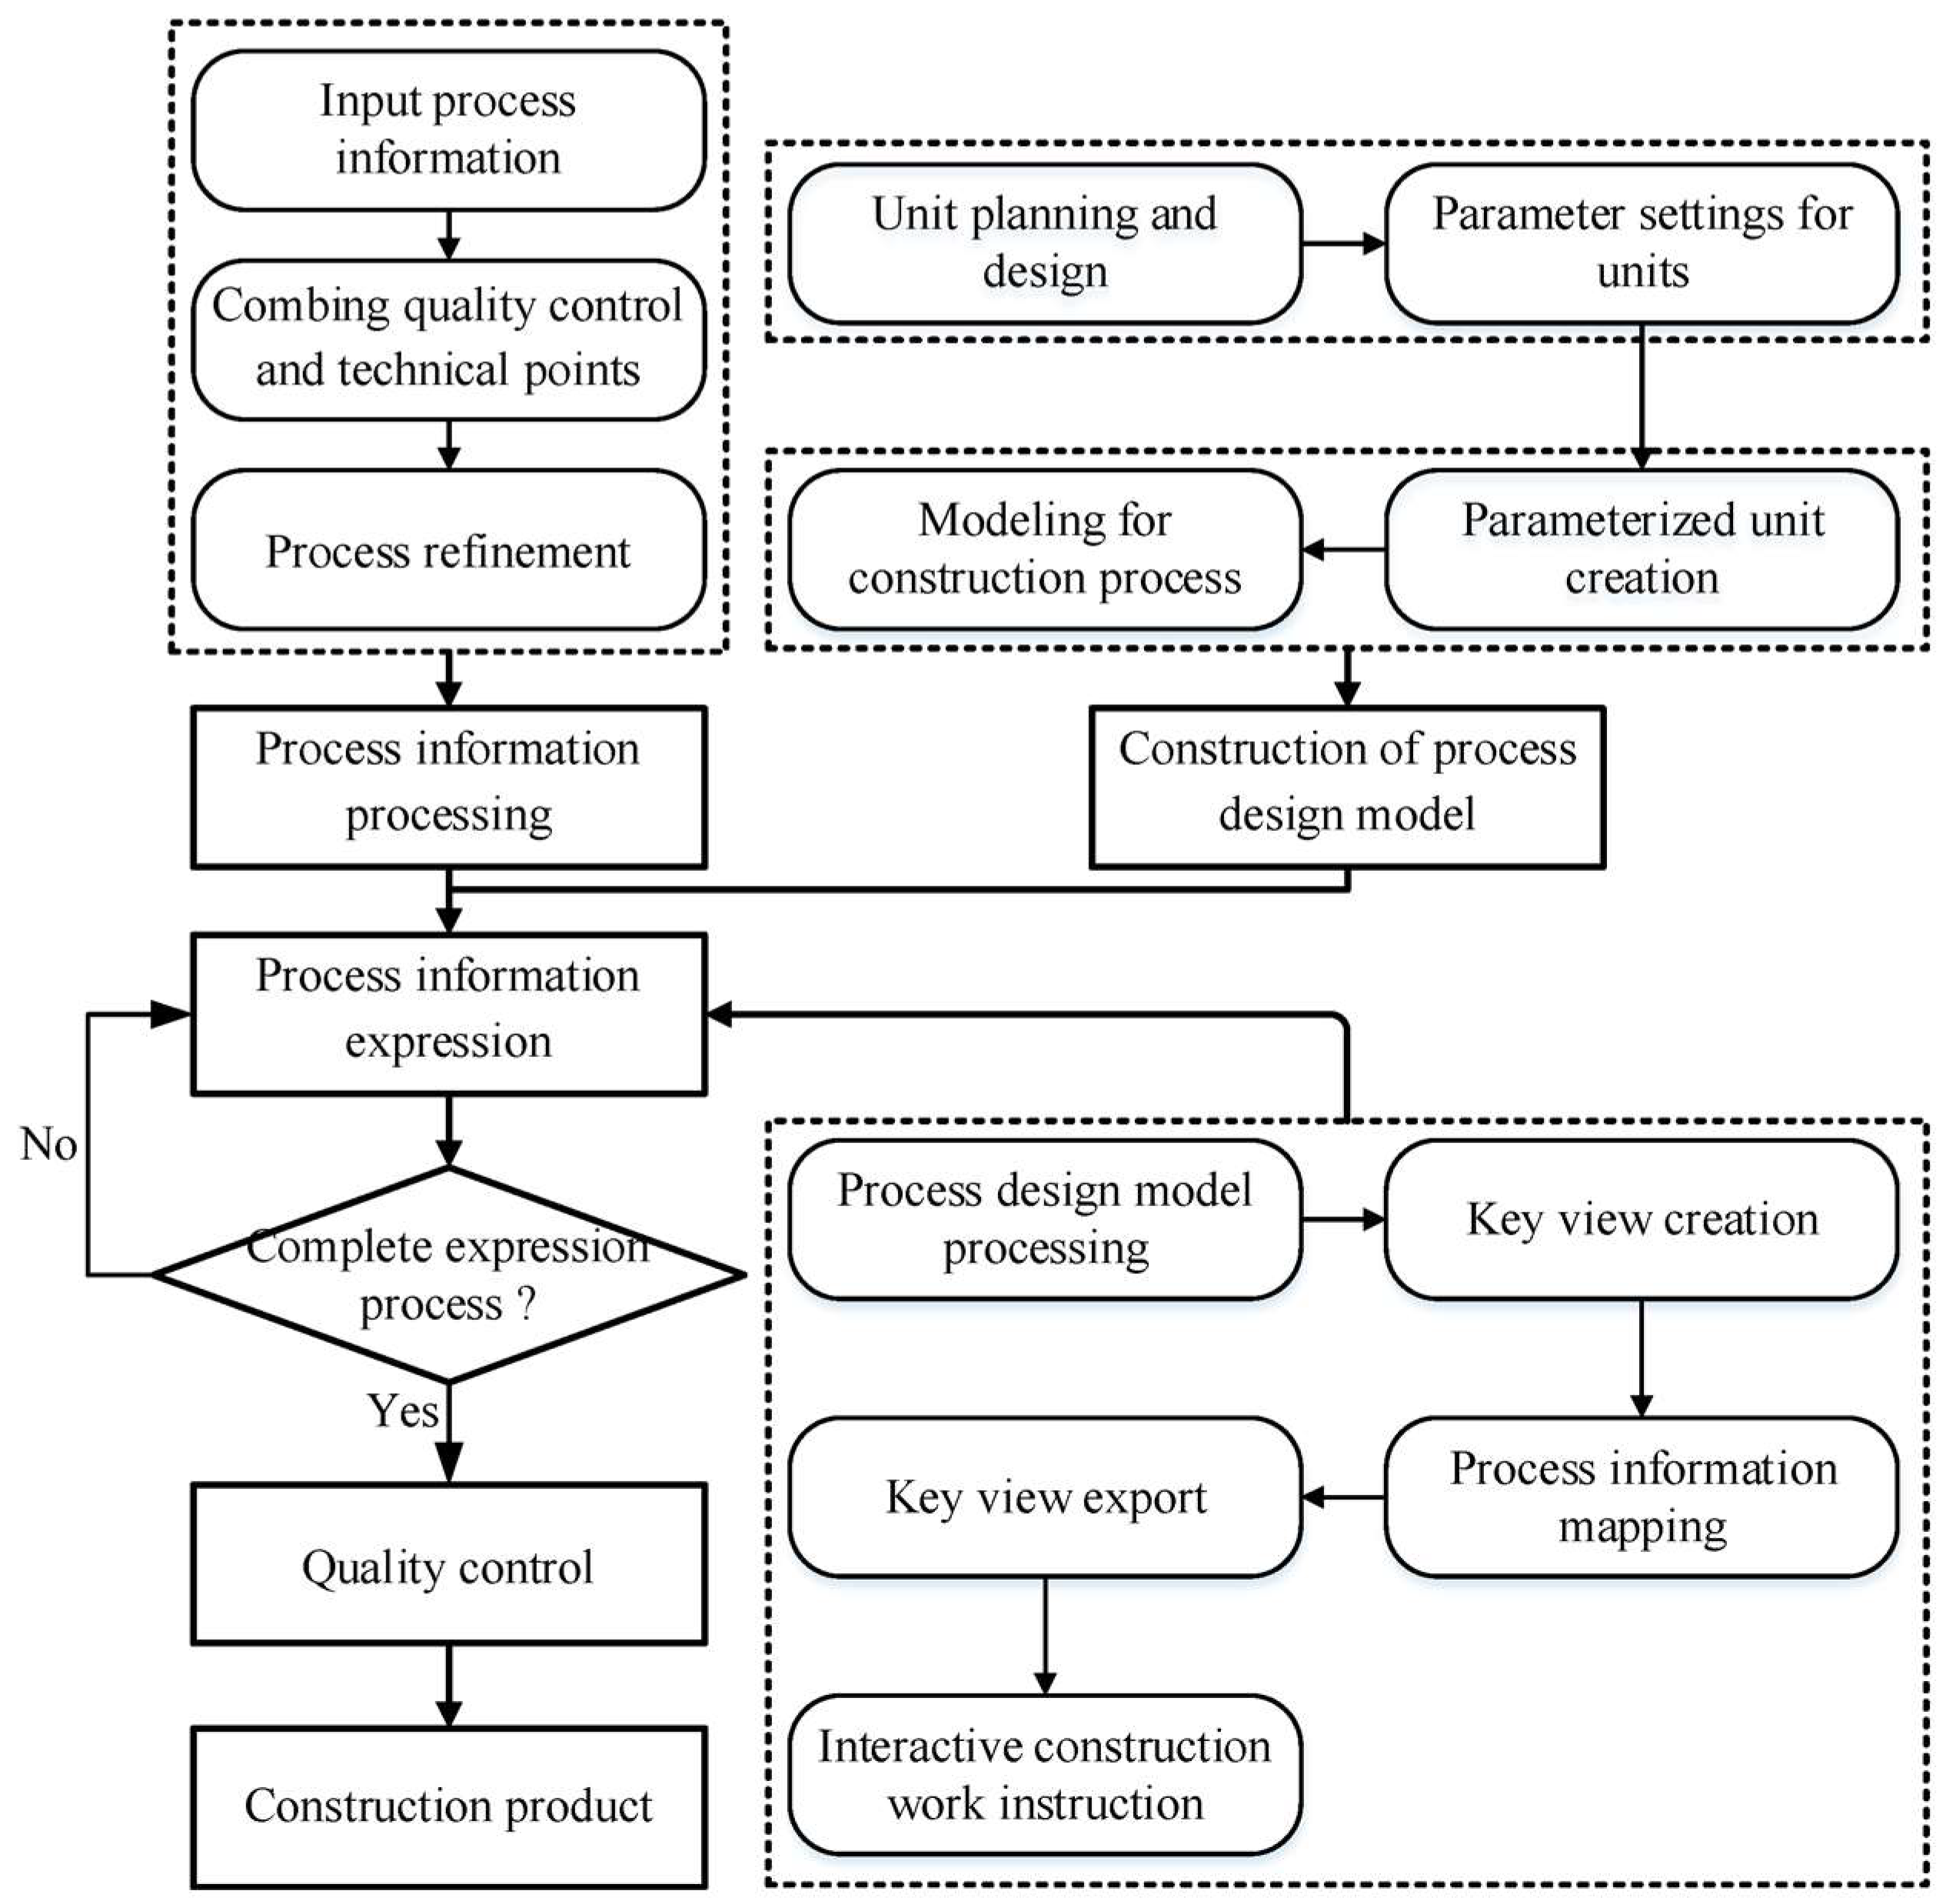
Figure 1. 3D digital method of construction technological process [15].
Buildings 13 02419 g001
Figure 2. Research model.
Buildings 13 02419 g002
Figure 3. The technological process of the infilled masonry wall.
Buildings 13 02419 g003
Figure 4. Wall lines and double control lines.
Buildings 13 02419 g004
Figure 5. Hanging height poles and vertical lines. ① height pole ② vertical line.
Buildings 13 02419 g005
Figure 6. Standard out-and-in bond: (a) header bricks; (b) stretcher bricks; (c) the result.
Buildings 13 02419 g006
Figure 7. Mapping of the top oblique masonry section. (a) Intervals of 14 days, (b) Oblique masonry and filling precast concrete block.
Buildings 13 02419 g007
Table 1. CFA results of the measurement model.
ConstructItemLoadingCRAVEReferences
Cognitive Level (Cronbach’s α = 0.906) 0.9070.764[34,46]
CL1I don’t know much about 3D digital technological process0.911
CL2I don’t know the benefits of participating in technical disclosure based on 3D digital technological process0.861
CL3I am willing to accept or attempt technical disclosure based on 3D digital technological process0.849
Subjective Norms (Cronbach’s α = 0.910) 0.9100.772[31,34,56]
SN1My colleagues think that I should try this technical disclosure method0.904
SN2My superiors think that I should try this technical disclosure method0.846
SN3People who are important to me think that I should try this technical disclosure method0.885
Technology Anxiety (Cronbach’s α = 0.899) 0.9030.758[31]
TA1This technical disclosure method makes me feel anxious0.846
TA2This technical disclosure method makes me feel confused0.831
TA3This technical disclosure method makes me feel confused0.931
Enjoyment (Cronbach’s α = 0.940) 0.9400.840[31,34]
ENJ1I think this technical disclosure method is novel0.923
ENJ2I think this technical disclosure method is interesting0.886
ENJ3I think this technical disclosure method makes me willing to participate0.939
PU (Cronbach’s α = 0.956) 0.9580.883[30,31,57]
PU1This technical disclosure method allows me to have a more direct understanding of the technological process0.938
PU2Compared to other methods, this technical disclosure method is more efficient0.908
PU3Compared to other methods, this technical disclosure method is more targeted and clearer0.972
PEU (Cronbach’s α = 0.895) 0.8940.738[46,57]
PEU1This technical disclosure method is convenient0.867
PEU2This technical disclosure method is easy to understand0.876
PEU3The computer operation required to learn this technical disclosure method is not difficult0.834
Attitude (Cronbach’s α = 0.931) 0.9310.819[31,36]
ATT1I think this technical disclosure method is a wise choice0.903
ATT2I am satisfied with the results of this technical disclosure method0.886
ATT3Compared to other methods, I prefer this technical disclosure method0.925
Table 2. Demographics of the surveyed workers.
FrequencyPercentage (%)
Gender
Male26584.4
Female4915.6
Age
≤25134.1
25–303611.5
30–408627.4
40–5012640.1
50–604915.6
60–6541.3
Education
Primary school or below6621.0
Junior high school14345.5
High school5417.2
Junior college or above5116.2
Length of Service
<5 years5718.2
5–10 years9630.6
10–20 years8828.0
20–30 years6019.1
>30 years134.1
Table 3. Basic statistical information.
Mean ValueMedianStandard Deviation
CL13.32831.108
CL23.29931.126
CL33.29031.157
TA12.88231.124
TA22.90431.139
TA32.90831.138
SN13.03531.054
SN23.07031.074
SN33.08931.021
ENJ13.35730.997
ENJ23.41131.031
ENJ33.34131.041
PU13.42031.032
PU23.42731.020
PU33.42431.020
PEU13.08331.156
PEU23.15631.172
PEU33.12131.142
ATT13.23931.014
ATT23.24831.032
ATT33.24231.028
Table 4. Correlation matrix and discriminant validity.
AVECLSNTAENJPUPEUATT
CL0.7640.874
SN0.7720.3830.879
TA0.758−0.487−0.3400.871
ENJ0.8400.6140.473−0.5490.917
PU0.8830.5310.426−0.4780.6010.940
PEU0.7380.5700.486−0.5780.6000.4680.859
ATT0.8190.4750.391−0.4510.5210.6700.6030.905
CL (Cognitive Level), SN (Subjective Norms), TA (Technological Anxiety), ENJ (Enjoyment), PU (Perceived Usefulness), PEU (Perceived Ease of Use), ATT (Attitude). The numbers in bold are the square root of the AVE for each structure.
Table 5. Model fit results.
Fit IndexRecommended ValueStructural Model
χ2/df<31.498
GFI>0.80.929
AGFI>0.80.905
CFI>0.90.986
NFI>0.90.958
RMSEA<0.080.040
Table 6. Hypothesis testing.
HypothesisRelationshipStandardized Path CoefficientC.R. (t-Value)Result
H1PU→ATT0.4979.729supported (p < 0.001)
H2PEU→ATT0.3707.002supported (p < 0.001)
H3CL→PU0.2023.169supported (p < 0.01)
H4CL→PEU0.2253.497supported (p < 0.001)
H5SN→PU0.1422.618supported (p < 0.01)
H6SN→PEU0.2043.707supported (p < 0.001)
H7TA→PU−0.151−2.578supported (p < 0.05)
H8TA→PEU−0.284−4.724supported (p < 0.001)
H9ENJ→PU0.3274.786supported (p < 0.001)
H10ENJ→PEU0.2103.071supported (p < 0.01)
Disclaimer/Publisher’s Note: The statements, opinions and data contained in all publications are solely those of the individual author(s) and contributor(s) and not of MDPI and/or the editor(s). MDPI and/or the editor(s) disclaim responsibility for any injury to people or property resulting from any ideas, methods, instructions or products referred to in the content.