
Metamodel-Based Hyperparameter Optimization of Optimization Algorithms in Building Energy Optimization


Abstract
1. Introduction
1.1. Background
1.2. Literature Review
1.2.1. The Efficacy of Optimization Algorithms in BEO
1.2.2. Methods of Setting Algorithm Hyperparameters in BEO
1.2.3. Summary of the Literature Review
1.3. Research Outline
- A metamodel-based methodology for hyperparameter optimization of algorithms applied in BEO is introduced;
- A total of 15 benchmark BEO problems with different properties are constructed for numerical experiments;
- The HPSs of four commonly used algorithms are optimized.
2. Methodology
2.1. Step 1: Constructing the Specific BEO Problem
2.2. Step 2: Developing the Metamodel of the BEO Problem
- Sampling input variables and using detailed building simulation tools to calculate the corresponding energy consumption of each sample to form a database for metamodel training;
- Based on the sample database, training the metamodel by ANN;
- Hyperparameter optimization of ANN and verifying the accuracy of the metamodel.
2.3. Step 3: Hyperparameter Optimization of Algorithms
3. Numerical Experiments
3.1. Step 1: Constructing 15 Benchmark BEO Problems with Different Properties
3.1.1. Benchmark Buildings
3.1.2. Design Variables
3.1.3. Optimization Objectives
3.2. Step 2: Developing Metamodels of the Benchmark BEO Problems
3.2.1. Creating ANN Modeling Datasets
3.2.2. ANN Training and Validation
3.3. Step 3: Hyperparameter Optimization of the Test Algorithms
3.3.1. Test Algorithms and Hyperparameters
3.3.2. Performance Evaluation Criteria of the Test Algorithms
3.3.3. Method for Identifying the Specific Optimal HPS from the Pareto Front of NSGA-II
4. Results and Discussion
4.1. Numerical Experiment Results
4.2. Comparison with the Default HPSs in MATLAB
4.3. Efficacy Comparison between the Test Algorithms
5. Conclusions
5.1. Achievements
- In terms of the two conflicting criteria, namely, the optimal design quality and the computing time, the efficiency of the four test algorithms was greatly improved when using the optimal HPSs compared with the default ones in MATLAB. For the BEO problems with similar complexity to the 15 benchmark problems, Table 5, Table 6, Table 7 and Table 8 are recommended for setting the hyperparameters of the GA, PSO, SA, and the MOGA, respectively;
- Practically, among the four test algorithms, the MOGA benefited the most from hyperparameter optimization in terms of the quality of the obtained optimum, while PSO benefited the least. In terms of the computing time, the PSO benefited the most, especially for the optimization problem containing 10 design variables;
- For the three single-objective optimization algorithms, i.e., the GA, PSO, and SA, PSO performed the best in general on the benchmark problems which can found a better design with a small computing time, so it is preferentially recommended for solving BEO problems;
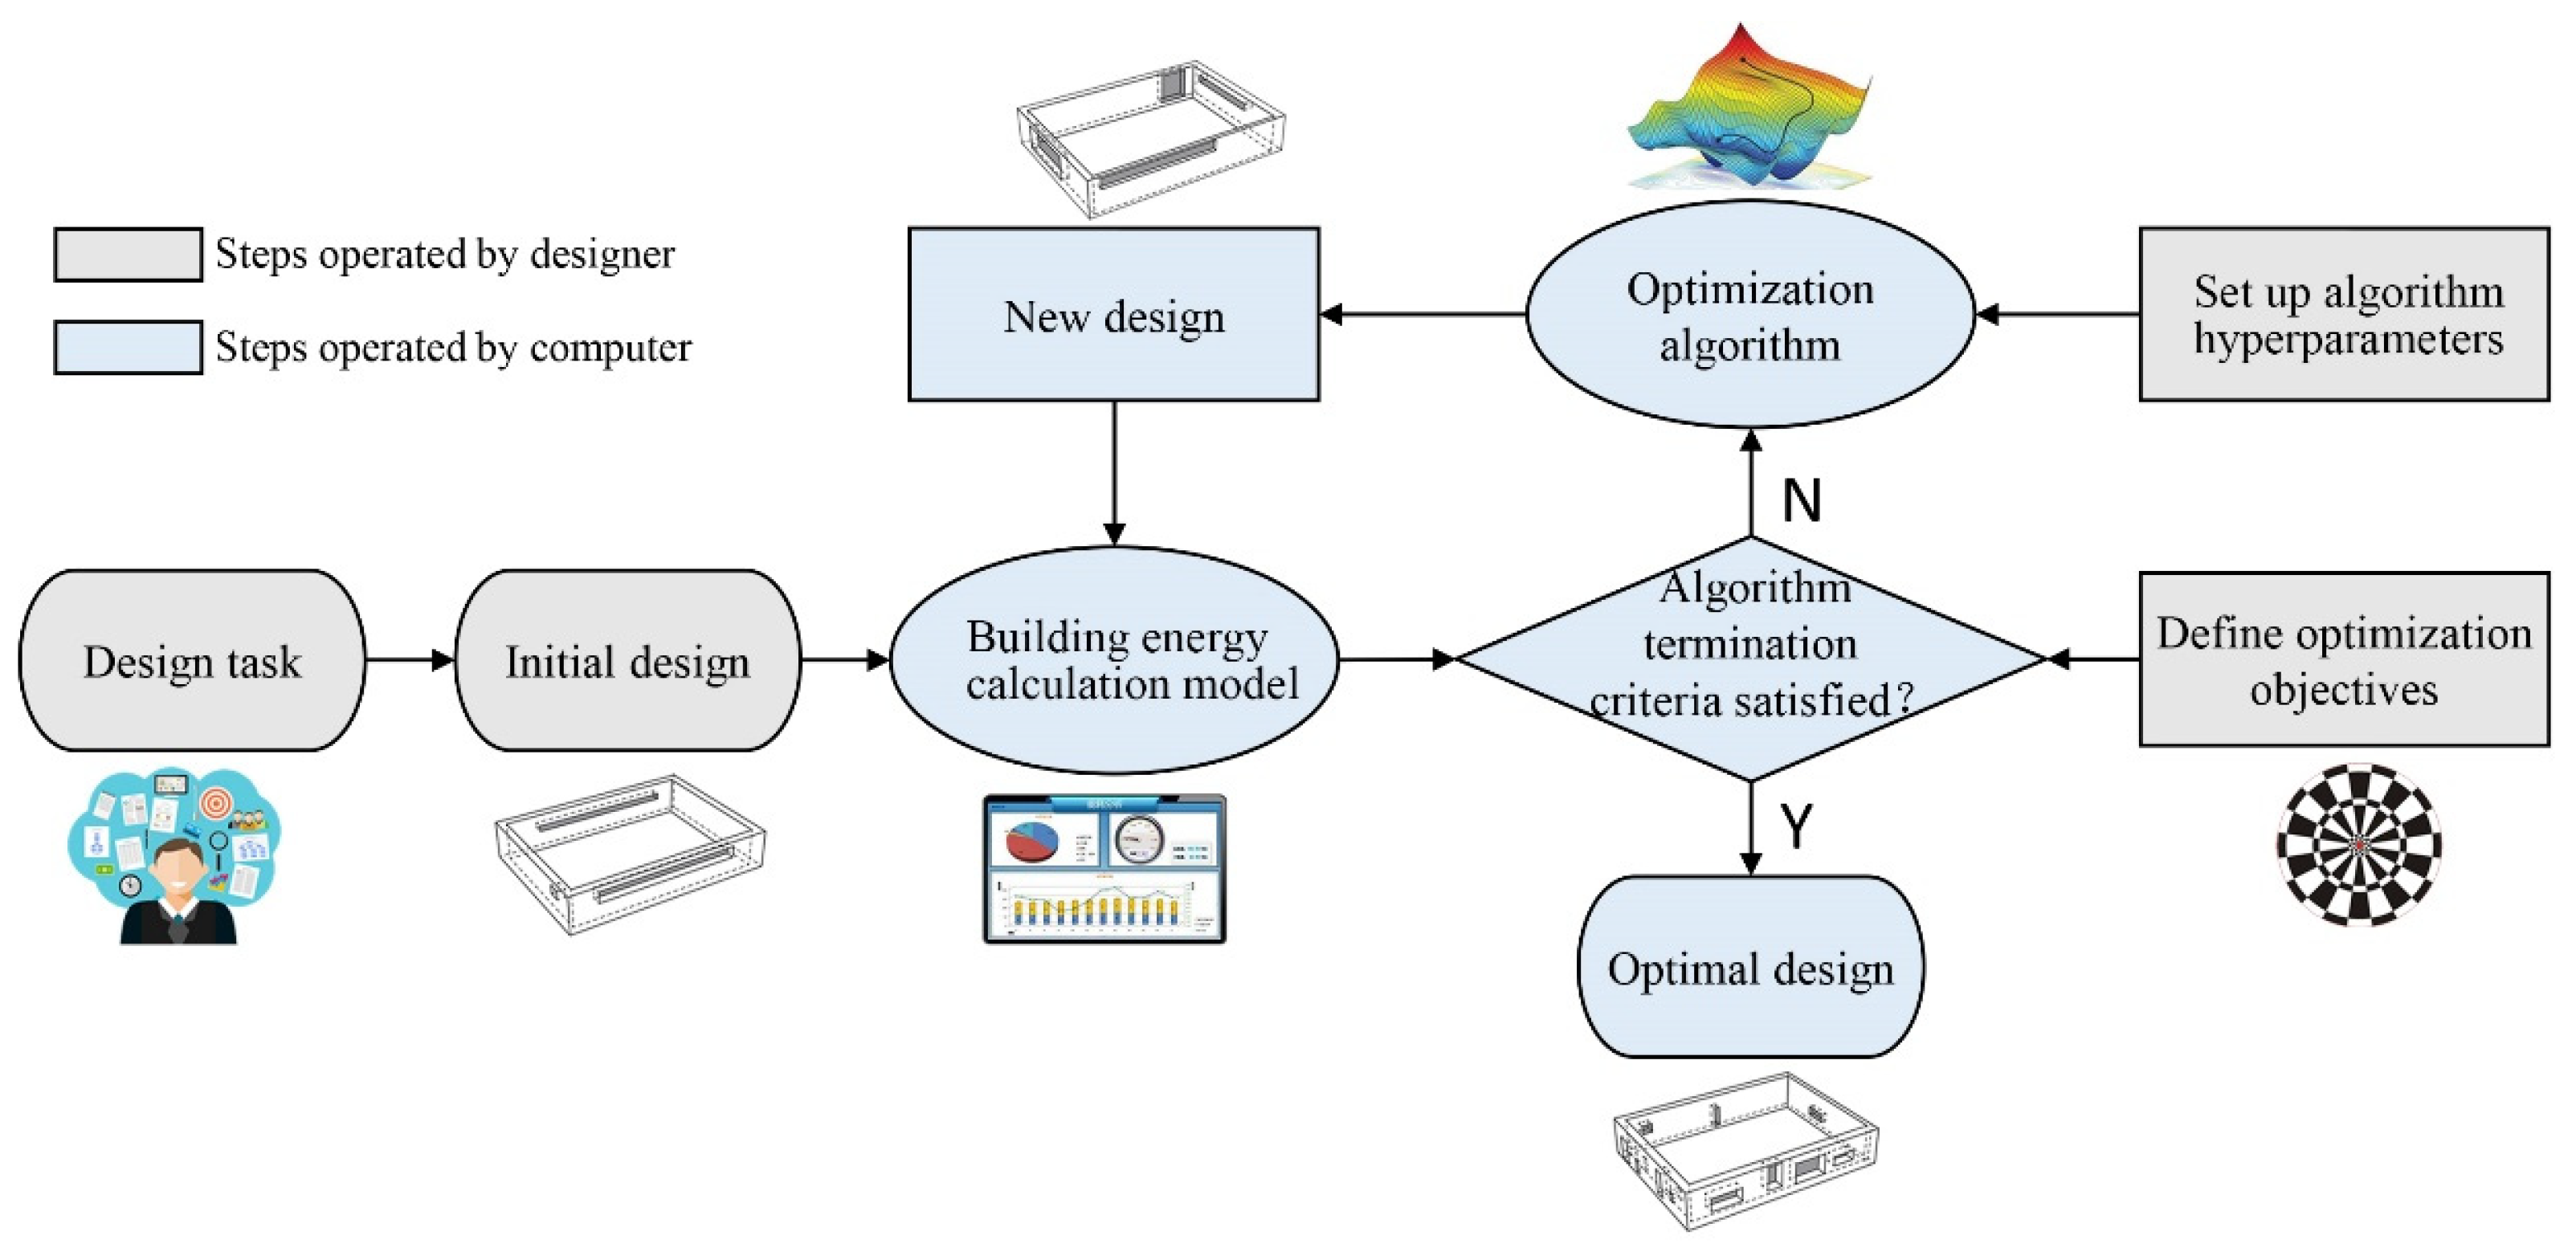
- The proposed metamodel-based methodology for hyperparameter optimization of algorithms in BEO is universal. When a BEO problem arises in which the optimization algorithms applied and the efficacy evaluation criteria of the algorithms concerned differ from those used in this paper, the method illustrated in Figure 3 is also applicable to maximize the efficacy of the algorithm on specific evaluation criteria by optimizing the HPSs of the algorithm.
5.2. Challenges and Future Works
Author Contributions
Funding
Data Availability Statement
Conflicts of Interest
Appendix A

| Small office_10 Variables | Small office_20 Variables | Small office_30 Variables | |
|---|---|---|---|
| GA |  |  |  |
| PSO |  |  |  |
| SA |  |  |  |
| MOGA |  |  |  |
| Medium office_10 variables | Medium office_20 variables | Medium office_30 variables | |
| GA |  |  |  |
| PSO |  |  |  |
| SA |  |  |  |
| MOGA |  |  |  |
| Large office_10 variables | Large office_20 variables | Large office_30 variables | |
| GA |  |  |  |
| PSO |  |  |  |
| SA |  |  |  |
| MOGA |  |  |  |
| Primary school_10 variables | Primary school_20 variables | Primary school_30 variables | |
| GA |  |  |  |
| PSO |  |  |  |
| SA |  |  |  |
| MOGA |  |  |  |
| Large hotel_10 variables | Large hotel_20 variables | Large hotel_30 variables | |
| GA |  |  |  |
| PSO |  |  |  |
| SA |  |  |  |
| MOGA |  |  |  |
References
- IEA. World Energy Statistics and Balances 2018; IEA: Paris, France, 2018. [Google Scholar]
- Wetter, M.; Wright, J. Comparison of a generalized pattern search and a genetic algorithm optimization method. In Proceedings of the 8th International Building Performance Simulation Association Conference, Eindhoven, The Netherlands, 11–14 August 2003; pp. 1401–1408. [Google Scholar]
- Barber, K.A.; Krarti, M. A review of optimization based tools for design and control of building energy systems. Renew. Sustain. Energy Rev. 2022, 160, 112359. [Google Scholar] [CrossRef]
- Tian, Z.; Zhang, X.; Jin, X.; Zhou, X.; Si, B.; Shi, X. Towards adoption of building energy simulation and optimization for passive building design: A survey and a review. Energy Build. 2018, 158, 1306–1316. [Google Scholar] [CrossRef]
- Shi, X.; Tian, Z.; Chen, W.; Si, B.; Jin, X. A review on building energy efficient design optimization from the perspective of architects. Renew. Sustain. Energy Rev. 2016, 65, 872–884. [Google Scholar] [CrossRef]
- Chen, X.; Yang, H.; Sun, K. Developing a meta-model for sensitivity analyses and prediction of building performance for passively designed high-rise residential buildings. Appl. Energy 2017, 194, 422–439. [Google Scholar] [CrossRef]
- Yu, W.; Li, B.; Jia, H.; Zhang, M.; Wang, D. Application of multi-objective genetic algorithm to optimize energy efficiency and thermal comfort in building design. Energy Build. 2015, 88, 135–143. [Google Scholar] [CrossRef]
- Wright, J.; Alajmi, A. The robustness of genetic algorithms in solving unconstrained building optimization problems. In Proceedings of the 9th IBPSA Conference: Building Simulation, Montréal, QC, Canada, 15–18 September 2005; pp. 1361–1368. [Google Scholar]
- Delgarm, N.; Sajadi, B.; Kowsary, F.; Delgarm, S. Multi-objective optimization of the building energy performance: A simulation-based approach by means of particle swarm optimization (PSO). Appl. Energy 2016, 170, 293–303. [Google Scholar] [CrossRef]
- Kim, J.; Hong, T.; Jeong, J.; Koo, C.; Jeong, K. An optimization model for selecting the optimal green systems by considering the thermal comfort and energy consumption. Appl. Energy 2016, 169, 682–695. [Google Scholar] [CrossRef]
- Eisenhower, B.; O’Neill, Z.; Narayanan, S.; Fonoberov, V.A.; Mezić, I. A methodology for meta-model based optimization in building energy models. Energy Build. 2012, 47, 292–301. [Google Scholar] [CrossRef]
- Pang, Z.; O’Neill, Z.; Li, Y.; Niu, F. The role of sensitivity analysis in the building performance analysis: A critical review. Energy Build. 2020, 209, 109659. [Google Scholar] [CrossRef]
- Westermann, P.; Evins, R. Surrogate modelling for sustainable building design—A review. Energy Build. 2019, 198, 170–186. [Google Scholar] [CrossRef]
- Thrampoulidis, E.; Mavromatidis, G.; Lucchi, A.; Orehounig, K. A machine learning-based surrogate model to approximate optimal building retrofit solutions. Appl. Energy 2021, 281, 116024. [Google Scholar] [CrossRef]
- Elbeltagi, E.; Wefki, H. Predicting energy consumption for residential buildings using ANN through parametric modeling. Energy Rep. 2021, 7, 2534–2545. [Google Scholar] [CrossRef]
- Dagdougui, H.; Bagheri, F.; Le, H.; Dessaint, L. Neural network model for short-term and very-short-term load forecasting in district buildings. Energy Build. 2019, 203, 109408. [Google Scholar] [CrossRef]
- D’Amico, A.; Ciulla, G. An intelligent way to predict the building thermal needs: ANNs and optimization. Expert Syst. Appl. 2022, 191, 116293. [Google Scholar] [CrossRef]
- Razmi, A.; Rahbar, M.; Bemanian, M. PCA-ANN integrated NSGA-III framework for dormitory building design optimization: Energy efficiency, daylight, and thermal comfort. Appl. Energy 2022, 305, 117828. [Google Scholar] [CrossRef]
- Prada, A.; Gasparella, A.; Baggio, P. A comparison of three evolutionary algorithms for the optimization of building design. Appl. Mech. Mater. 2019, 887, 140–147. [Google Scholar] [CrossRef]
- Waibel, C.; Wortmann, T.; Evins, R.; Carmeliet, J. Building energy optimization: An extensive benchmark of global search algorithms. Energy Build. 2019, 187, 218–240. [Google Scholar] [CrossRef]
- Chegari, B.; Tabaa, M.; Simeu, E.; Moutaouakkil, F.; Medromi, H. Multi-objective optimization of building energy performance and indoor thermal comfort by combining artificial neural networks and metaheuristic algorithms. Energy Build. 2021, 239, 110839. [Google Scholar] [CrossRef]
- Si, B.; Tian, Z.; Jin, X.; Zhou, X.; Tang, P.; Shi, X. Performance indices and evaluation of algorithms in building energy efficient design optimization. Energy 2016, 114, 100–112. [Google Scholar] [CrossRef]
- Si, B.; Wang, J.; Yao, X.; Shi, X.; Jin, X.; Zhou, X. Multi-objective optimization design of a complex building based on an artificial neural network and performance evaluation of algorithms. Adv. Eng. Inform. 2019, 40, 93–109. [Google Scholar] [CrossRef]
- Si, B.; Tian, Z.; Jin, X.; Zhou, X.; Shi, X. Ineffectiveness of optimization algorithms in building energy optimization and possible causes. Renew. Energy 2019, 134, 1295–1306. [Google Scholar] [CrossRef]
- Hamdy, M.; Nguyen, A.T.; Hensen, J.L. A performance comparison of multi-objective optimization algorithms for solving nearly-zero-energy-building design problems. Energy Build. 2016, 121, 57–71. [Google Scholar] [CrossRef]
- Yang, M.-D.; Lin, M.-D.; Lin, Y.-H.; Tsai, K.-T. Multiobjective optimization design of green building envelope material using a non-dominated sorting genetic algorithm. Appl. Therm. Eng. 2017, 111, 1255–1264. [Google Scholar] [CrossRef]
- Chen, X.; Yang, H.; Zhang, W. Simulation-based approach to optimize passively designed buildings: A case study on a typical architectural form in hot and humid climates. Renew. Sustain. Energy Rev. 2018, 82, 1712–1725. [Google Scholar] [CrossRef]
- Futrell, B.J.; Ozelkan, E.C.; Brentrup, D. Optimizing complex building design for annual daylighting performance and evaluation of optimization algorithms. Energy Build. 2015, 92, 234–245. [Google Scholar] [CrossRef]
- Ascione, F.; Bianco, N.; De Stasio, C.; Mauro, G.M.; Vanoli, G.P. A new methodology for cost-optimal analysis by means of the multi-objective optimization of building energy performance. Energy Build. 2015, 88, 78–90. [Google Scholar] [CrossRef]
- Cubukcuoglu, C.; Ekici, B.; Tasgetiren, M.F.; Sariyildiz, S. OPTIMUS: Self-Adaptive Differential Evolution with Ensemble of Mutation Strategies for Grasshopper Algorithmic Modeling. Algorithms 2019, 12, 141. [Google Scholar] [CrossRef]
- Ramallo-González, A.P.; Coley, D.A. Using self-adaptive optimisation methods to perform sequential optimisation for low-energy building design. Energy Build. 2014, 81, 18–29. [Google Scholar] [CrossRef]
- Ekici, B.; Chatzikonstantinou, I.; Sariyildiz, S.; Tasgetiren, M.F.; Pan, Q.-K. A multi-objective self-adaptive differential evolution algorithm for conceptual high-rise building design. In Proceedings of the 2016 IEEE Congress on Evolutionary Computation (CEC), Vancouver, BC, Canada, 24–29 July 2016; pp. 2272–2279. [Google Scholar]
- Si, B.; Tian, Z.; Chen, W.; Jin, X.; Zhou, X.; Shi, X. Performance assessment of algorithms for building energy optimization problems with different properties. Sustainability 2018, 11, 18. [Google Scholar] [CrossRef]
- Vukadinović, A.; Radosavljević, J.; Đorđević, A.; Protić, M.; Petrović, N. Multi-objective optimization of energy performance for a detached residential building with a sunspace using the NSGA-II genetic algorithm. Sol. Energy 2021, 224, 1426–1444. [Google Scholar] [CrossRef]
- Ghaderian, M.; Veysi, F. Multi-objective optimization of energy efficiency and thermal comfort in an existing office building using NSGA-II with fitness approximation: A case study. J. Build. Eng. 2021, 41, 102440. [Google Scholar] [CrossRef]
- Andersson, M.; Bandaru, S.; Ng, A.H.C. Towards optimal algorithmic parameters for simulation-based multi-objective optimization. In Proceedings of the 2016 IEEE Congress on Evolutionary Computation (CEC), Vancouver, BC, Canada, 24–29 July 2016; pp. 5162–5169. [Google Scholar]
- Torcellini, P.; Deru, M.; Griffith, M.; Benne, K. DOE Commercial Building Benchmark Models. National Renewable Energy Laboratory. 2008. Available online: http://www.nrel.gov/docs/fy08osti/43291.pdf (accessed on 6 January 2023).
- Fanger, P.O. Thermal Comfort: Analysis and Applications in Environmental Engineering; McGraw-Hill Book Company: New York, NY, USA, 1972; pp. 1–244. [Google Scholar]
- McKay, M.D. Sensitivity and uncertainty analysis using a statistical sample of input values. In Uncertainty Analysis; Ronen, Y., Ed.; CRC Press: Boca Raton, FL, USA, 1988; pp. 145–186. [Google Scholar]
- Asadi, E.; Silva, M.G.D.; Antunes, C.H.; Dias, L.; Glicksman, L. Multi-objective optimization for building retrofit: A model using genetic algorithm and artificial neural network and an application. Energy Build. 2014, 81, 444–456. [Google Scholar] [CrossRef]
- Shahin, M.A.; Maier, H.R.; Jaksa, M.B. Data division for developing neural networks applied to geotechnical engineering. J. Comput. Civ. Eng. 2004, 18, 105–114. [Google Scholar] [CrossRef]
- Li, L.; Fu, Y.; Fung, J.C.H.; Qu, H.; Lau, A.K. Development of a back-propagation neural network and adaptive grey wolf optimizer algorithm for thermal comfort and energy consumption prediction and optimization. Energy Build. 2021, 253, 111439. [Google Scholar] [CrossRef]
- Ye, Z.; Kim, M.K. Predicting electricity consumption in a building using an optimized back-propagation and Levenberg–Marquardt back-propagation neural network: Case study of a shopping mall in China. Sustain. Cities Soc. 2018, 42, 176–183. [Google Scholar] [CrossRef]
- Khayatian, F.; Sarto, L. Application of neural networks for evaluating energy performance certificates of residential buildings. Energy Build. 2016, 125, 45–54. [Google Scholar] [CrossRef]
- Ascione, F.; Bianco, N.; De Stasio, C.; Mauro, G.M.; Vanoli, G.P. Artificial neural networks to predict energy performance and retrofit scenarios for any member of a building category: A novel approach. Energy 2017, 118, 999–1017. [Google Scholar] [CrossRef]
- Kheiri, F. A review on optimization methods applied in energy-efficient building geometry and envelope design. Renew. Sustain. Energy Rev. 2018, 92, 897–920. [Google Scholar] [CrossRef]


| Building Type | Form | HVAC | |||||||||
|---|---|---|---|---|---|---|---|---|---|---|---|
| Building Shape | Aspect Ratio | Number of Floors | Floor to Ceiling Height (m) | Floor to Floor Height (m) | Total Floor Area (m2) | Number of Conditioned Zones | System Type | Heating Type | Cooling Type | Fan Control | |
| Small Office | Rectangle | 1.5 | 1 | 3.1 | - | 511 | 5 | PSZ-AC 1 | Gas furnace | Unitary DX 2 | Constant volume |
| Medium Office | Rectangle | 1.5 | 3 | 2.7 | 4.0 | 4982 | 15 | MZ-VAV 3 | Gas furnace and electric reheat | PACU 4 | Variable |
| Large Office | Rectangle | 1.5 | 12 plus basement | 2.74 | 3.96 | 46,320 | 61 | MZ-VAV | Gas boiler | 2 water cooled chillers | Variable |
| Primary School | “E” Shape | - | 1 | 4 | - | 6871 | 25 | CAV 5, PSZ-AC (gym, kitchen, & cafeteria) | Gas boiler, gas furnace (gym, kitchen, & cafeteria) | PACU | Constant |
| Large Hotel | Rectangle | 3.8 1st floor, 5.1 other floors | 6 plus basement | 3.96 1st floor, 3.05 other floors | 3.96 1st floor, 3.05 other floors | 11,345 | 195 | FCU 6 in rooms, CV 7 ventilation, MZVAV 8 in common areas | Gas boiler | 2 air cooled chillers | Variable |
| Categories | Description of Design Variables | Symbol | Unit | Properties | Range | Step Size |
|---|---|---|---|---|---|---|
| Building orientation | Building long axis azimuth | x1 | ° | Discrete | 0–180 | 1 |
| Thermostats set-points | Cooling set-point temperature | x2 | °C | Discrete | 22–29 | 1 |
| Heating set-point temperature | x3 | °C | Discrete | 15–22 | 1 | |
| Roof insulation properties | Roof insulation conductivity | x4 | W/m·K | Continuous | 0.03–0.06 | 0.001 |
| Roof insulation thickness | x5 | m | Continuous | 0.01–0.15 | 0.001 | |
| Opaque wall insulation conductivity | South wall insulation conductivity | x6 | W/m·K | Continuous | 0.03–0.06 | 0.001 |
| East wall insulation conductivity | x7 | W/m·K | Continuous | 0.03–0.06 | 0.001 | |
| North wall insulation conductivity | x8 | W/m·K | Continuous | 0.03–0.06 | 0.001 | |
| West wall insulation conductivity | x9 | W/m·K | Continuous | 0.03–0.06 | 0.001 | |
| Exterior wall insulation thickness | South wall insulation thickness | x10 | m | Continuous | 0.01–0.15 | 0.001 |
| East wall insulation thickness | x11 | m | Continuous | 0.01–0.15 | 0.001 | |
| North wall insulation thickness | x12 | m | Continuous | 0.01–0.15 | 0.001 | |
| West wall insulation thickness | x13 | m | Continuous | 0.01–0.15 | 0.001 | |
| Window size | South window upper position | x14 | m | Continuous | 1–2.7 | 0.01 |
| East window upper position | x15 | m | Continuous | 1–2.7 | 0.01 | |
| North window upper position | x16 | m | Continuous | 1–2.7 | 0.01 | |
| West window upper position | x17 | m | Continuous | 1–2.7 | 0.01 | |
| Window U-value | South window U-value | x18 | W/m2·K | Continuous | 1–7 | 0.01 |
| East window U-value | x19 | W/m2·K | Continuous | 1–7 | 0.01 | |
| North window U-value | x20 | W/m2·K | Continuous | 1–7 | 0.01 | |
| West window U-value | x21 | W/m2·K | Continuous | 1–7 | 0.01 | |
| Window SHGC | South window SHGC | x22 | - | Continuous | 0.1–0.9 | 0.01 |
| East window SHGC | x23 | - | Continuous | 0.1–0.9 | 0.01 | |
| North window SHGC | x24 | - | Continuous | 0.1–0.9 | 0.01 | |
| West window SHGC | x25 | - | Continuous | 0.1–0.9 | 0.01 | |
| Window external shading | South window overhang depth | x26 | m | Continuous | 0.02–2 | 0.01 |
| East window overhang depth | x27 | m | Continuous | 0.02–2 | 0.01 | |
| North window overhang depth | x28 | m | Continuous | 0.02–2 | 0.01 | |
| West window overhang depth | x29 | m | Continuous | 0.02–2 | 0.01 | |
| Shading transmittance | x30 | - | Continuous | 0–1 | 0.01 |
| Building Type | Number of Design Variables | Number of Hidden Neurons | Sampling Size | Sampling Time (h) | ANN Training Results | |||||
|---|---|---|---|---|---|---|---|---|---|---|
| Training | Validation | Testing | ||||||||
| MSE | R | MSE | R | MSE | R | |||||
| Small office | 10 | 10 | 1000 | 6.6 | 0.019 | 0.9999 | 0.025 | 0.9999 | 0.027 | 0.9999 |
| 20 | 10 | 2000 | 13.3 | 0.032 | 0.9999 | 0.075 | 0.9999 | 0.086 | 0.9999 | |
| 30 | 20 | 3000 | 20 | 0.037 | 0.9999 | 0.093 | 0.9999 | 0.113 | 0.9999 | |
| Medium office | 10 | 10 | 1000 | 9.7 | 0.019 | 0.9999 | 0.03 | 0.9999 | 0.021 | 0.9999 |
| 20 | 20 | 2000 | 19.4 | 0.048 | 0.9999 | 0.103 | 0.9999 | 0.1 | 0.9999 | |
| 30 | 26 | 3000 | 29.1 | 0.073 | 0.9999 | 0.231 | 0.9999 | 0.255 | 0.9999 | |
| Large office | 10 | 10 | 1000 | 11.9 | 0.046 | 0.9999 | 0.062 | 0.9999 | 0.056 | 0.9999 |
| 20 | 25 | 2000 | 23.9 | 0.21 | 0.9999 | 0.518 | 0.9999 | 0.59 | 0.9999 | |
| 30 | 30 | 3000 | 35.8 | 0.986 | 0.9999 | 1.923 | 0.9998 | 1.813 | 0.9998 | |
| Primary school | 10 | 15 | 1000 | 16.4 | 0.083 | 0.9999 | 0.133 | 0.9999 | 0.115 | 0.9999 |
| 20 | 25 | 2000 | 32.8 | 0.038 | 0.9999 | 0.184 | 0.9999 | 0.156 | 0.9999 | |
| 30 | 25 | 3000 | 49.2 | 0.142 | 0.9999 | 0.382 | 0.9999 | 0.478 | 0.9999 | |
| Large hotel | 10 | 10 | 1000 | 21.1 | 0.084 | 0.9999 | 0.098 | 0.9999 | 0.021 | 0.9999 |
| 20 | 20 | 2000 | 42.2 | 0.048 | 0.9999 | 0.154 | 0.9999 | 0.164 | 0.9999 | |
| 30 | 30 | 3000 | 63.3 | 0.097 | 0.9999 | 0.199 | 0.9999 | 0.225 | 0.9999 | |
| Algorithms | Hyperparameters | Description | Minimum | Maximum | Default |
|---|---|---|---|---|---|
| GA | PopulationSize | Number of individuals in each generation. | 5 | 200 | 200 |
| EliteRate | Positive integer specifying the proportion of individuals from the current generation surviving to the next. EliteCount = cell(EliteRate×PopulationSize) | 0.01 | 0.99 | 0.05 | |
| CrossoverFraction | The fraction of the population at the next generation created by the crossover function, excluding elite children. Mutation produces the remaining individuals in the next generation. | 0 | 1 | 0.8 | |
| MaxStallGenerations | The algorithm stops if the average relative change in the best fitness function value over MaxStallGenerations generations is equal to or less than FunctionTolerance. | 2 | 200 | 50 | |
| PSO | SwarmSize | Number of particles in the swarm. | 5 | 200 | min(100, 10 × nvars), where nvars is the number of variables |
| InertiaRange_LowerLimit | The lower bound of the adaptive inertia. | 0 | 1 | 0.1 | |
| InertiaRange_UpperLimit | The upper bound of the adaptive inertia. | 1 | 2 | 1.1 | |
| MinNeighborsFraction | Minimum adaptive neighborhood size. | 0 | 1 | 0.25 | |
| SelfAdjustmentWeight | The weight of the best position of each particle when adjusting velocity. | 0 | 2 | 1.49 | |
| SocialAdjustmentWeight | The weight of the best position of neighborhood when adjusting velocity. | 0 | 2 | 1.49 | |
| MaxStallIterations | Number of iterations over which the relative change in best objective function value is less than options.FunctionTolerance. | 2 | 200 | 20 | |
| SA | ReannealInterval | The number of points to accept before reannealing. | 1 | 200 | 100 |
| InitialTemperature | The temperature at the beginning of the run. | 1 | 200 | 100 | |
| MaxStallIterations | Number of iterations over which average change in objective function value at current point is less than options.FunctionTolerance | 2 | 4000 | 500 × number of variables | |
| MOGA | PopulationSize | Number of individuals in each generation. | 5 | 200 | 200 |
| CrossoverFraction | The fraction of the population at the next generation created by the crossover function, excluding elite children. Mutation produces the remaining individuals in the next generation. | 0 | 1 | 0.8 | |
| MaxStallGenerations | Number of stall generations over which the average relative change in the best fitness function value is less than or equal to FunctionTolerance. | 2 | 200 | 100 |
| Building Type | Number of Design Variables | Ideal HPS | Optimal Design with the Optimal HPS | Optimal Design with the Default HPS | |||||
|---|---|---|---|---|---|---|---|---|---|
| Population Size | Elite Rate | Crossover Fraction | MaxStall Generations | AEC | NS | AEC | NS | ||
| Small office | 10 | 43 | 0.208 | 0.545 | 61 | 112.078 | 2838 | 112.784 | 3000 |
| 20 | 15 | 0.183 | 0.736 | 197 | 100.999 | 2985 | 103.239 | 3000 | |
| 30 | 23 | 0.011 | 0.705 | 93 | 98.941 | 2415 | 103.755 | 3000 | |
| Medium office | 10 | 32 | 0.09 | 0657 | 64 | 129.339 | 2144 | 130.303 | 3000 |
| 20 | 12 | 0.12 | 0.595 | 109 | 111.188 | 1572 | 112.733 | 3000 | |
| 30 | 23 | 0.078 | 0.636 | 85 | 111.053 | 2783 | 118.060 | 3000 | |
| Large office | 10 | 30 | 0.053 | 0.674 | 70 | 134.869 | 2160 | 134.917 | 3000 |
| 20 | 25 | 0.09 | 0.66 | 91 | 125.019 | 2325 | 125.744 | 3000 | |
| 30 | 24 | 0.129 | 0.545 | 97 | 120.357 | 2424 | 124.123 | 3000 | |
| Primary school | 10 | 38 | 0.209 | 0.63 | 64 | 148.317 | 2546 | 148.975 | 3000 |
| 20 | 13 | 0.038 | 0.673 | 121 | 129.829 | 2288 | 134.101 | 3000 | |
| 30 | 64 | 0.027 | 0.662 | 21 | 128.399 | 2752 | 139.556 | 3000 | |
| Large hotel | 10 | 31 | 0.11 | 0.562 | 77 | 376.323 | 2449 | 376.711 | 3000 |
| 20 | 11 | 0.069 | 0.691 | 162 | 371.637 | 1804 | 372.689 | 3000 | |
| 30 | 37 | 0.17 | 0.464 | 69 | 354.797 | 2849 | 370.098 | 3000 | |
| Building Type | Number of Design Variables | Optimal HPS | Optimal Design with the Optimal HPS | Optimal Design with the Default HPS | ||||||||
|---|---|---|---|---|---|---|---|---|---|---|---|---|
| Swarm Size | Inertia Range_Lower Limit | Inertia Range_Upper Limit | Min Neighbors Fraction | Self Ajustment Weight | Social Adjustment Weight | MaxStall Iterations | AEC | NS | AEC | NS | ||
| Small office | 10 | 6 | 0.32 | 1.66 | 0.39 | 0.4 | 0.87 | 2 | 111.774 | 48 | 111.774 | 2600 |
| 20 | 11 | 0.54 | 1.35 | 0.55 | 1.71 | 1.14 | 51 | 98.902 | 1155 | 99.242 | 3000 | |
| 30 | 19 | 0.6 | 1.88 | 0.5 | 0.39 | 0.94 | 35 | 93.935 | 2983 | 96.412 | 3000 | |
| Medium office | 10 | 5 | 0.38 | 1.66 | 0.34 | 0.44 | 0.96 | 12 | 128.461 | 115 | 128.461 | 2600 |
| 20 | 7 | 0.59 | 1.49 | 0.38 | 0.27 | 1.23 | 18 | 107.375 | 322 | 107.375 | 3000 | |
| 30 | 40 | 0.49 | 1.36 | 0.18 | 1.41 | 1.84 | 20 | 107.285 | 3000 | 111.771 | 3000 | |
| Large office | 10 | 6 | 0.5 | 1.66 | 0.07 | 0.12 | 0.84 | 34 | 134.751 | 384 | 134.758 | 3000 |
| 20 | 13 | 0.27 | 1.71 | 0.33 | 1.53 | 1 | 65 | 124.315 | 2197 | 125.005 | 3000 | |
| 30 | 13 | 0.53 | 1.84 | 0.5 | 0.42 | 0.84 | 36 | 118.499 | 2119 | 122.805 | 3000 | |
| Primary school | 10 | 6 | 0.48 | 1.67 | 0.55 | 1.08 | 0.86 | 34 | 148.026 | 288 | 148.027 | 2700 |
| 20 | 17 | 0.55 | 1.98 | 0.55 | 1.63 | 0.7 | 35 | 123.162 | 2397 | 126.351 | 3000 | |
| 30 | 20 | 0.54 | 1.52 | 0.01 | 0.92 | 0.96 | 60 | 125.131 | 2940 | 131.892 | 3000 | |
| Large hotel | 10 | 5 | 0.51 | 1.38 | 0.41 | 0.41 | 0.86 | 5 | 376.117 | 35 | 376.117 | 2300 |
| 20 | 10 | 0.46 | 1.99 | 0.53 | 1.02 | 0.81 | 130 | 371.178 | 1940 | 371.436 | 3000 | |
| 30 | 18 | 0.54 | 1.99 | 0.53 | 0.11 | 0.86 | 50 | 345.59 | 2232 | 350.763 | 3000 | |
| Building Type | Number of Design Variables | Optimal HPS | Optimal Design with the Optimal HPS | Optimal Design with the Default HPS | ||||
|---|---|---|---|---|---|---|---|---|
| Reanneal Interval | Initial Temperature | MaxStall Iterations | AEC | NS | AEC | NS | ||
| Small office | 10 | 73 | 153 | 798 | 112.437 | 1181 | 113.032 | 3000 |
| 20 | 195 | 172 | 2050 | 103.655 | 2407 | 105.460 | 3000 | |
| 30 | 46 | 185 | 1005 | 101.926 | 1341 | 106.408 | 3000 | |
| Medium office | 10 | 73 | 146 | 1142 | 128.548 | 1958 | 130.689 | 3000 |
| 20 | 92 | 183 | 1814 | 114.657 | 2899 | 126.053 | 3000 | |
| 30 | 98 | 178 | 569 | 120.539 | 1150 | 128.539 | 3000 | |
| Large office | 10 | 106 | 150 | 514 | 134.997 | 1904 | 135.371 | 3000 |
| 20 | 105 | 141 | 1038 | 126.399 | 1795 | 129.199 | 3000 | |
| 30 | 121 | 134 | 1026 | 123.8 | 1413 | 127.724 | 3000 | |
| Primary school | 10 | 97 | 154 | 514 | 148.658 | 802 | 149.523 | 3000 |
| 20 | 30 | 73 | 516 | 134.275 | 886 | 145.251 | 3000 | |
| 30 | 97 | 178 | 694 | 136.297 | 2986 | 143.401 | 3000 | |
| Large hotel | 10 | 124 | 172 | 514 | 376.663 | 1120 | 383.958 | 3000 |
| 20 | 117 | 164 | 520 | 372.553 | 1341 | 381.068 | 3000 | |
| 30 | 108 | 171 | 2058 | 360.193 | 2327 | 371.517 | 3000 | |
| Building Type | Number of Design Variables | Optimal HPS | Optimal Design with the Ideal HPS | Optimal Design with the Default HPS | ||||||
|---|---|---|---|---|---|---|---|---|---|---|
| Population Size | Crossover Fraction | MaxStall Generations | AEC | AAPPD | NS | AEC | AAPPD | NS | ||
| Small office | 10 | 9 | 0.181 | 124 | 136.216 | 14.29 | 1144 | 137.114 | 14.460 | 3000 |
| 20 | 13 | 0.416 | 178 | 123.319 | 12.974 | 2354 | 125.394 | 14.343 | 3000 | |
| 30 | 11 | 0.476 | 43 | 116.407 | 11.584 | 2278 | 121.165 | 14.401 | 3000 | |
| Medium office | 10 | 9 | 0.392 | 197 | 145.916 | 12.382 | 1801 | 146.672 | 12.924 | 3000 |
| 20 | 14 | 0.119 | 5 | 127.41 | 4.854 | 2773 | 134.193 | 8.643 | 3000 | |
| 30 | 17 | 0.359 | 149 | 106.728 | 5.652 | 2585 | 128.215 | 8.450 | 3000 | |
| Large office | 10 | 59 | 0.272 | 38 | 138.832 | 11.657 | 2892 | 138.832 | 11.659 | 3000 |
| 20 | 37 | 0.177 | 52 | 126.688 | 5.375 | 2443 | 131.168 | 8.356 | 3000 | |
| 30 | 6 | 0.459 | 16 | 126.814 | 6.719 | 2317 | 130.538 | 8.672 | 3000 | |
| Primary school | 10 | 41 | 0.802 | 66 | 160.077 | 9.632 | 2830 | 160.687 | 9.886 | 3000 |
| 20 | 27 | 0.103 | 91 | 141.412 | 6.997 | 2566 | 156.687 | 8.667 | 3000 | |
| 30 | 39 | 0.553 | 39 | 126.718 | 6.933 | 1912 | 151.296 | 8.613 | 3000 | |
| Large hotel | 10 | 23 | 0.276 | 33 | 386.818 | 15.644 | 2301 | 387.896 | 16.562 | 3000 |
| 20 | 14 | 0.71 | 135 | 382.304 | 14.014 | 2045 | 385.635 | 15.941 | 3000 | |
| 30 | 45 | 0.243 | 2 | 378.843 | 13.796 | 2971 | 384.560 | 14.435 | 3000 | |
| Building Type | Number of Design Variables | GA | PSO | SA | MOGA | |||||
|---|---|---|---|---|---|---|---|---|---|---|
| AEC | NS | AEC | NS | AEC | NS | AEC | AAPPD | NS | ||
| Small office | 10 | −0.63% | −5.40% | 0 | −98.15% | −0.53% | −60.63% | −0.65% | −1.18% | −61.87% |
| 20 | −2.17% | −0.50% | −0.34% | −61.50% | −1.71% | −19.77% | −1.65% | −9.54% | −21.53% | |
| 30 | −4.64% | −19.50% | −2.57% | −0.57% | −4.21% | −55.30% | −3.93% | −19.56% | −24.07% | |
| Medium office | 10 | −0.74% | −28.53% | 0 | −95.58% | −1.64% | −34.73% | −0.52% | −4.19% | −39.97% |
| 20 | −1.37% | −47.60% | 0 | −89.27% | −9.04% | −3.37% | −5.05% | −43.84% | −7.57% | |
| 30 | −5.94% | −7.23% | −4.01% | 0 | −6.22% | −61.67% | −16.76% | −33.11% | −13.83% | |
| Large office | 10 | −0.04% | −28.00% | −0.01% | −87.20% | −0.28% | −36.53% | 0% | −0.02% | −3.60% |
| 20 | −0.58% | −22.50% | −0.55% | −26.77% | −2.17% | −40.17% | −3.42% | −35.67% | −18.57% | |
| 30 | −3.03% | −19.20% | −3.51% | −29.37% | −3.07% | −52.90% | −2.85% | −22.52% | −22.77% | |
| Primary school | 10 | −0.44% | −15.13% | 0 | −89.33% | −0.58% | −73.27% | −0.38% | −2.57% | −5.67% |
| 20 | −3.19% | −23.73% | −2.52% | −20.10% | −7.56% | −70.47% | −9.75% | −19.27% | −14.47% | |
| 30 | −7.99% | −8.27% | −5.13% | −2.00% | −4.95% | −0.47% | −16.24% | −19.51% | −36.27% | |
| Large hotel | 10 | −0.10% | −18.37% | 0 | −98.48% | −1.90% | −62.67% | −0.28% | −5.54% | −23.30% |
| 20 | −0.28% | −39.87% | −0.07% | −35.33% | −2.23% | −55.30% | −0.86% | −12.09% | −31.83% | |
| 30 | −4.13% | −5.03% | −1.47% | −25.60% | −3.05% | −22.43% | −1.49% | −4.43% | −0.97% | |
| Building Type | Number of Design Variables | Ranking | ||
|---|---|---|---|---|
| GA | PSO | SA | ||
| Small office | 10 | 2 | 1 | 3 |
| 20 | 2 | 1 | 3 | |
| 30 | 2 | 1 | 3 | |
| Medium office | 10 | 3 | 1 | 2 |
| 20 | 2 | 1 | 3 | |
| 30 | 2 | 1 | 3 | |
| Large office | 10 | 2 | 1 | 3 |
| 20 | 2 | 1 | 3 | |
| 30 | 2 | 1 | 3 | |
| Primary school | 10 | 2 | 1 | 3 |
| 20 | 2 | 1 | 3 | |
| 30 | 2 | 1 | 3 | |
| Large hotel | 10 | 2 | 1 | 3 |
| 20 | 2 | 1 | 3 | |
| 30 | 2 | 1 | 3 | |
| Building Type | Number of Design Variables | Ranking | ||
|---|---|---|---|---|
| GA | PSO | SA | ||
| Small office | 10 | 3 | 1 | 2 |
| 20 | 3 | 1 | 2 | |
| 30 | 2 | 3 | 1 | |
| Medium office | 10 | 3 | 1 | 2 |
| 20 | 2 | 1 | 3 | |
| 30 | 2 | 3 | 1 | |
| Large office | 10 | 3 | 1 | 2 |
| 20 | 3 | 2 | 1 | |
| 30 | 3 | 2 | 1 | |
| Primary school | 10 | 3 | 1 | 2 |
| 20 | 2 | 3 | 1 | |
| 30 | 1 | 2 | 3 | |
| Large hotel | 10 | 3 | 1 | 2 |
| 20 | 2 | 3 | 1 | |
| 30 | 3 | 1 | 2 | |
Disclaimer/Publisher’s Note: The statements, opinions and data contained in all publications are solely those of the individual author(s) and contributor(s) and not of MDPI and/or the editor(s). MDPI and/or the editor(s) disclaim responsibility for any injury to people or property resulting from any ideas, methods, instructions or products referred to in the content. |
© 2023 by the authors. Licensee MDPI, Basel, Switzerland. This article is an open access article distributed under the terms and conditions of the Creative Commons Attribution (CC BY) license (https://creativecommons.org/licenses/by/4.0/).
Share and Cite
Si, B.; Liu, F.; Li, Y. Metamodel-Based Hyperparameter Optimization of Optimization Algorithms in Building Energy Optimization. Buildings 2023, 13, 167. https://doi.org/10.3390/buildings13010167
Si B, Liu F, Li Y. Metamodel-Based Hyperparameter Optimization of Optimization Algorithms in Building Energy Optimization. Buildings. 2023; 13(1):167. https://doi.org/10.3390/buildings13010167
Chicago/Turabian StyleSi, Binghui, Feng Liu, and Yanxia Li. 2023. "Metamodel-Based Hyperparameter Optimization of Optimization Algorithms in Building Energy Optimization" Buildings 13, no. 1: 167. https://doi.org/10.3390/buildings13010167
APA StyleSi, B., Liu, F., & Li, Y. (2023). Metamodel-Based Hyperparameter Optimization of Optimization Algorithms in Building Energy Optimization. Buildings, 13(1), 167. https://doi.org/10.3390/buildings13010167