Article

A System Dynamics Approach for Evaluating the Synergy Degree of Social Organizations Participating in Community and Home-Based Elderly Care Services

1
School of Transportation and Civil Engineering, Nantong University, Nantong 226007, China
2
Zachry Department of Civil and Environmental Engineering, Texas A&M University, College Station, TX 77843, USA
*
Author to whom correspondence should be addressed.
Buildings 2022, 12(9), 1491; https://doi.org/10.3390/buildings12091491
Submission received: 8 August 2022 / Revised: 16 September 2022 / Accepted: 16 September 2022 / Published: 19 September 2022
(This article belongs to the Section Architectural Design, Urban Science, and Real Estate)

Abstract

:
As the number of elderly continues to increase in China, anxiety about related problems has encouraged special care for the elderly. Social organizations participating in community and home-based elderly care services (SO-CHECS) seem to be a promising way to address these problems, but it also raises new challenges, such as uncoordinated cooperation among stakeholders, which would lead to low elderly care service quality and hinder the active participation of social organizations. However, synergetic development can be introduced to enhance the participation of social organizations and to improve social welfare. Thus, this study utilizes system dynamics (SD) to investigate how the overall synergy degree of the SO-CHECS system is affected by the dynamic interactions of main elements/subsystems of this system. It also provides a practical tool through which the effectiveness of various management measures in improving the synergy degree of SO-CHECS could be simulated in advance so that the key factors that restrict the development of SO-CHECS can be analyzed and potential effective policies can be designed. In this way, knowledge of the synergic development of the SO-CHECS system will help managers or policy makers to form optimal cooperative relationships among collaborative stakeholders, improve satisfaction for the elderly, and achieve high-efficient resource utilization for the whole city.

1. Introduction

The increase in the aging population has become a truly global phenomenon. Most developing countries have already faced this bewildering situation, including China [1]. The aging population in China reached 267 million by the end of 2021, accounting for 18.9% of the total population. Moreover, it is estimated that in approximately 2050, China’s aging population will reach a peak of 487 million, constituting 34.9% of the total population, which is notably higher than the world average [2]. As the number of elders continues to rise, anxiety about these problems has bred special care for the elderly, such as community and home-based elderly care services, which have begun to rise to offer an alternative for disabled, living-alone elders, and empty nesters [3]. However, the demand for elderly care services in China is diversified and complicated due to the astonishingly large number in the elderly population, rendering the government unable to meet the needs of diversity and therefore provide high-quality and efficient elderly care services [3,4]. The practice has also proved that it is arduous for the government alone to deal with all elderly care issues [5]. As this is the case, the increasing elderly care burden has prompted the government to explore new approaches of payment and of providing long-term care for elders [6].
Thus, social organizations (i.e., non-government organizations and non-profit organizations) are gradually being facilitated by the government to co-provide elderly care service since they tend to take full advantage of the donations and fund providing market-needed services to cater for the elderly [7]. In this way, social organizations can be viewed as the optimal choice for elderly service delivery, as they have achieved effective allocation of resources, they promote supply efficiency, and they offer a viable solution to the failure of China’s welfare economy [4].
In the current community and home-based elderly care services with the participation of social organizations, the stakeholders are complex, often consisting of the government, the community, social organizations, and the elderly [3,6]. However, the mode of social organizations participating in community and home-based elderly care services (SO-CHECS) in China is still in the exploratory stage, meaning they are not prioritized by favorable systems and policies as there is no definite guidance at present and the relevant policies and regulations are fragmented [6]. In practice, there are pronounced problems of synergism in a SO-CHECS system from various aspects, such as excessive government intervention and insufficient autonomy of social organizations, the barrier of information flow, mismatch between supply and demand information, and an army of inefficient and ineffective supply phenomena [4,6,8]. Apparently, the lack of synergism of the SO-CHECS system is highly possible to lower elderly care service quality and hinder the active participation of social organizations. Therefore, how to coordinate all the multi-stakeholders in SO-CHECS to provide efficient and convenient service is urgent for the time being.
However, as aforementioned, the SO-CHECS system is such a complicated and relatively disordered system due to various stakeholders and the unsophisticated operation mechanism that the coordination among these stakeholders is intractable. Naturally, the idea of synergetic development has been considered as a promising approach to improve the current position of SO-CHECS. This concept comes from the synergy theory proposed by Hakon [9], who first offered that a complex and disordered system can achieve order and sustainable development through the interactions among different subsystems involved, and synergetic development assessment can be a framework and help to figure out the routes to realize sustainable development of the SO-CHECS [10,11].
From the perspective of synergetic development, this study utilizes system dynamics (SD) to clarify how the overall synergy degree of a SO-CHECS system is affected by the dynamic interactions of main elements/subsystems of this system. This paper makes important contributions to SO-CHECS research through disclosing the dynamic nature of main elements affecting the synergic development of SO-CHECS and major influences of element interactions on the overall synergic development of SO-CHECS. It also provides a practical tool to simulate the effectiveness of various management measures in improving the synergy degree of SO-CHECS, so that the key factors confining the development of SO-CHECS can be screened out and the suggested policies can be designed. In this way, the relevant outcome of the synergic development of the SO-CHECS system will help the managers or policy makers to optimize the cooperative relationships among collaborative stakeholders, improve satisfactions for the elderly, and achieve high-efficient resource utilization for the whole city.

2. Literature Review

2.1. Social Organizations Involved in Community and Home-Based Elderly Care Services

With the market-oriented reform and the transition of government functions from leader to guider, social organizations sprouted and gradually developed, which are known as non-governmental organizations, non-profit organizations, and independent and civil society organizations [12,13]. Social organizations are born from society and perform vital functions especially for humanitarian-oriented activities, and they have a solid mass foundation and are the important carriers of public opinions [14]. Social organizations are the citizen organizations outside of the government, which are not for profit, undertake certain social responsibilities, and voluntarily provide public services and public goods for society [15]. In certain developed countries, such as Sweden and Finland, social organizations are involved in home-based elderly care services and have significantly contributed to elderly care services [16,17].
The concept of “home-based elderly care” is coined with the severely aging population in western countries, which is typically termed “community care for the elderly” [17]. Facing the diversified, high-quality, and complex needs of elderly care services, the government is circumscribed by its ability, energy, resources, knowledge, and interests, and it is hard to properly cater for the needs of elders. In co-production and co-creation theories, SO-CHECS targets to realize the public interest so as to increase the quantity and quality of elderly services and to promote the equality of elderly care service consumption and customer satisfaction [18,19]. This new personalized, user-centered, and flexible approach has brought greater independent decision-making power to citizens who need elderly care services. For aging China, by providing high-quality home-based elderly care services, social organizations play an irreplaceable role in addressing the elderly care dilemma [6].
However, due to the operation mechanism, service mode and management measures of the SO-CHECS, there are still many problems to be tackled in practice. Recent studies on the sustainability and accountability of SO-CHECS have raised significant concerns, including insufficient communication between stakeholders, lack of trust in social organizations from government, heavy reliance on government funding, a shortage of skilled workers, absence of supporting policy systems, and inadequate supervision [1,20,21]. In SO-CHECS, multiple stakeholders have formed a cooperative relationship, and other internal and external factors (such as financial management, elderly care facilities, and service quality) can also affect the collaborative relationships in the SO-CHECS system as well [4]. In prior studies, the relationships between the determinants (i.e., the subsystems, including resource allocation, information sharing, stakeholder engagement, institutional climate, supervision capability, and cooperation mechanism) and the synergetic development of SO-CHECS system have been proposed [22]. However, to coordinate the SO-CHECS and to achieve sustainable development of this system, it is of paramount importance to make clear how its subsystems compete, cooperate, and finally demonstrate their relatively stable macroscopic structure [23]. The synergetic view literally helps to clarify the internal mechanisms and rules of complex systems contributing to perceived sustainability. To measure the synergic degree and sustainable development, prior studies have applied the synergetic theory in complex systems of urban rivers, public transit, urban traffic, urban development, etc. [10,11,24,25,26]. A synergy assessment for a SO-CHECS system is also essential for the long-term collaborative relationships for governments, communities, social organizations, the elderly, and all stakeholders.

2.2. System Dynamics Approach and Its Application

System dynamics (SD) approach is attempted for figuring out the complex systems [27]. Different from sequential models, SD highlights the inherent complexity, nonlinearity, and causal feedback loop between system variables [28,29]. SD can also clarify unspecified or unexpected results of decisions and help us understand complex systems [30]. In addition, SD is an effective tool of evaluating a system’s ability to adjust to changes and to test new decisions that must be made for a more effective decision-making process. Therefore, SD has become a mature modeling technique to explain the main properties/elements for complex systems and to explore their causality [31,32]. Coincidentally, SO-CHECS belongs to the complex dynamic systems. Such systems have characteristics as follows: (1) extremely complex, including various interdependent elements; (2) highly dynamic; (3) multiple feedback processes are involved; (4) nonlinear relationships among elements; and (5) have quantitative and qualitative data [27,33,34].
The SD approach has been applied in a wide range of issues in complex social and economic systems, such as estimating the performance in construction projects [34], labor productivity in industries [35], assessing seismic resilience of hospitals methodology [36], and the contractual relationship analysis between owner and contractor [37].These studies, among many others, have clearly shown the capability of SD for better understanding the complex and dynamics of systems. Moreover, with the aid of SD scenario simulations, several individuals measures or policies and their different combinations can be explored through extensive simulation to analyze their effects on the dynamics of the overall system [32,37]. In this way, SD allows the decision maker to simulate and test proposed measures or policies to see long-term outcomes of implementing each measure or policy before making the final decisions [38].
Researchers have also applied the SD approach to evaluate the synergic degree and sustainable development of complex systems. For example, Ma et al. (2022) employed SD to describe how the synergy between technology management and technological capability affects new product development [39]. Yang et al., (2015) proposed a SD model to quantitatively assess the water resources carrying capacity through a simulation of the internal coupling effects of the entire system [40]. Bastan et al., (2017) presented an integrated and systemic SD model to analyze the existent dynamics in sustainable development of agriculture. Through the SD model, a set of scenarios have been generated and tested through simulation to achieve a much-improved understanding of the system’s dynamic behavior [41].
All previous literature demonstrates that SD has great potential in dealing with the endogenous and dynamic relations of complex synergetic systems. Thus, it is appropriate to apply this theory in this study for investigating the complicated subsystems of SO-CHECS and their coupling effects on the synergic development of SO-CHECS, thus selecting and implementing the most proper solutions for a sustainable SO-CHECS system.

3. Research Methodology

The SO-CHECS is a complex system consisting of six subsystems and these subsystems are: resource allocation (RA), information sharing (IS), stakeholder engagement (SE), institutional climate (IC), supervision capability (SC), and cooperation mechanism (CM), as proposed in a prior study [22]. The coordination and evolution between these subsystems and factors belonging to subsystems tend to increase the synergy of the service system. This paper aims to simulate so as to evaluate the synergy degree of the SO-CHECS system and realize the optimized analysis of the synergy degree through establishing a system dynamics model.
The research framework for research methods and procedures was illustrated in Figure 1. The research methodology of this paper was divided into two main parts. Firstly, this research identified factors of SO-CHECS from the six subsystems according to the literature review and drew causal-loop and stock-flow diagrams. Then, this study defined the model variables and the functions of the system dynamics model to denote the synergy degree of SO-CHECS. Meanwhile, 100 questionnaires were distributed, and 81 valid questionnaires were collected to run and validate the built SD model to obtain the simulation results. Moreover, taking the SD model as a platform, this study examined and evaluated the model results under different strategies termed sensitivity analysis to determine the practical implications.

4. SD Model Development

4.1. Model Description

There are two divisions for the SD model development of evaluating the synergy degree of SO-CHECS. One is to identify the factors and establish causal-loop diagrams and stock-flow diagrams to describe the influence relations between the factors and the synergy degree, and the other is to examine the sensitivity of the synergy degree through specific indicators [28,42].
First, this paper identified 25 factors from 6 subsystems as the variables and constants of the SD model, based on literature review and the prior studies by the authors [4,22], and established the relationships between these variables or constants quantitively according to questionnaires. The causal-loop diagrams were then used to describe the variables qualitatively and the stock-flow diagram was as the SD model. A series of equations were employed to represent the six sub-indicators in accordance with the logistic function and the final indicator was calculated by combining value of these subsystems. Finally, we conducted the sensitivity analysis to give implications to the practices of SO-CHECS.

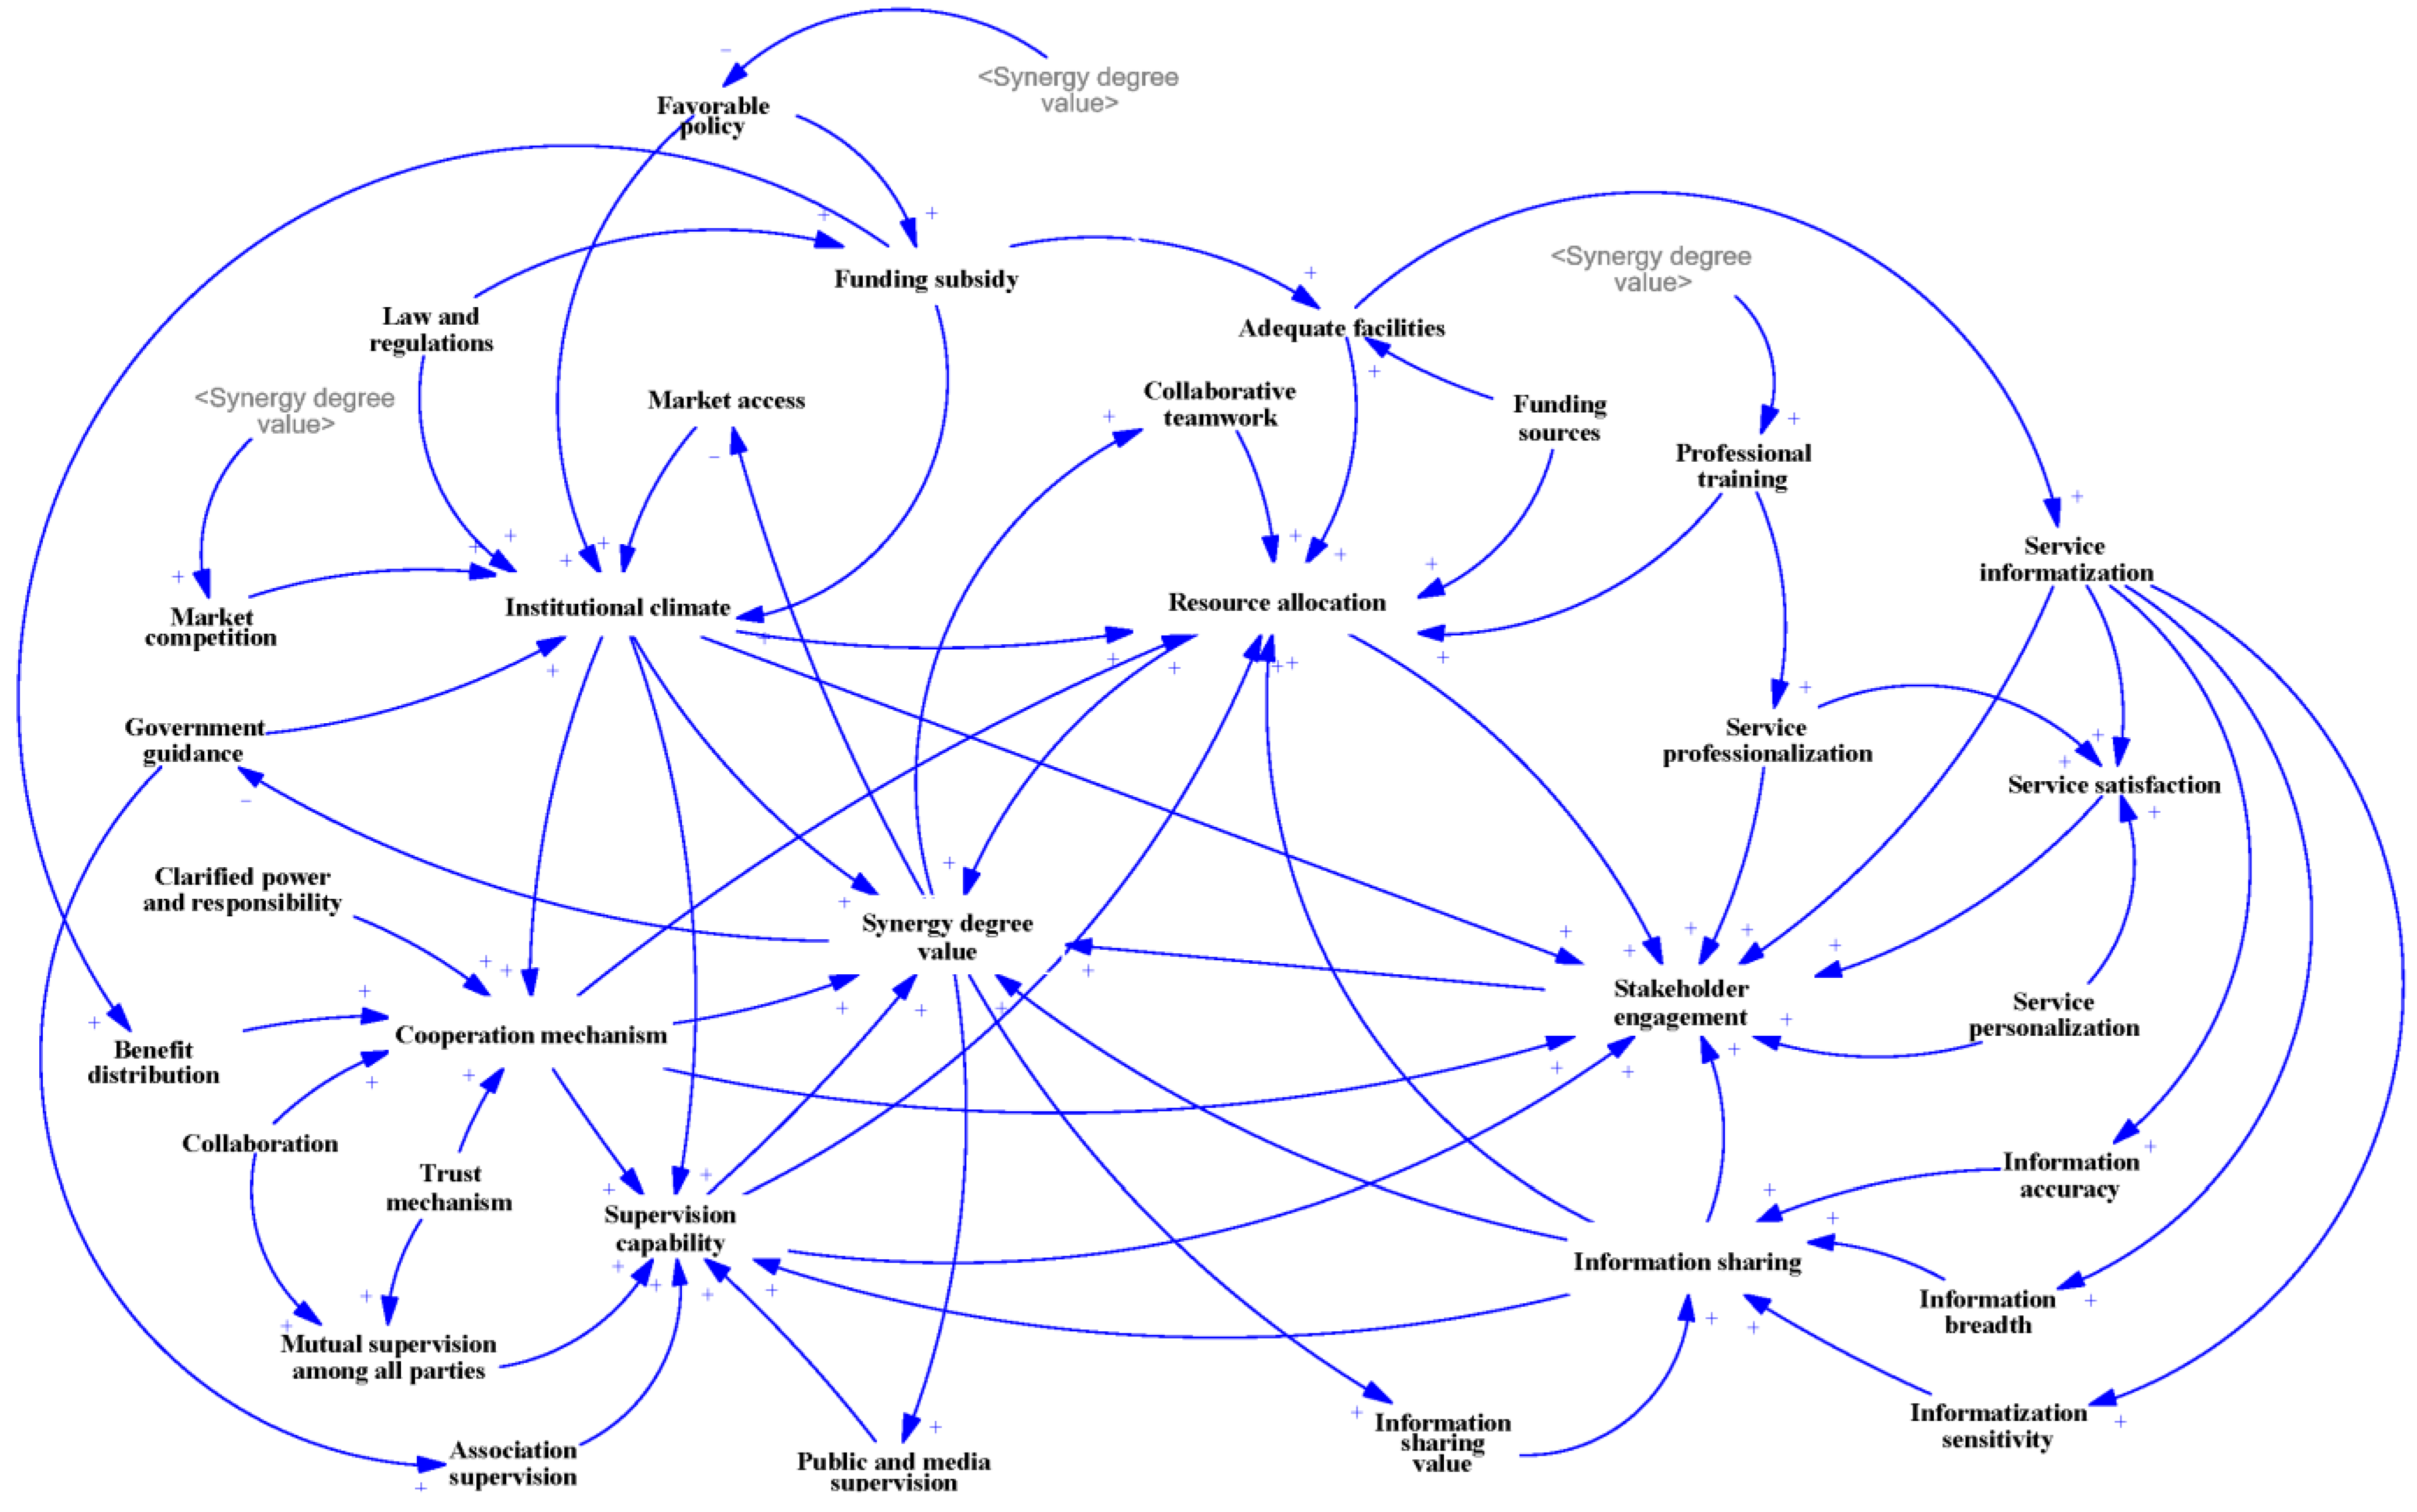
4.2. Causal-Loop Diagrams

The causal-loop diagram can qualitatively indicate the causal relationships among variables in a SD model and describe the positive or negative feedback [32].
To analyze the synergetic degree of SO-CHECS, it is prioritized to develop six determinants that influence the synergy based on the theory of collaborative governance proposed by Anselll and Gash [43]. This concept is defined as that non-state stakeholders formally take part in the affairs or the implementation of public policies belonging to the public sectors in a collaborative way [43]. In the theoretical framework, Anselll and Gash [43] believed that institutional climate, such as basic laws and regulations, and facilitative leadership, such as supervision, would affect the process of collaborative governance. In collaborative governance, there are both state and non-state stakeholders responsible for the outcomes or performance of the collaboration. In addition, information sharing, resource allocation, and the cooperation mechanism among stakeholders are also critical to facilitate the success of collaboration. Therefore, this paper draws these six variables that have notable impact on the synergy degree of SO-CHECS: institutional climate, supervision capability, stakeholder engagement, information sharing, resource allocation, and cooperation mechanism. According to the primary analysis of SO-CHECS, we drew the causal-loop diagrams to represent how the six factors affected the synergy of SO-CHECS as the following statements. These factors are described as six subsystems of the synergy of SO-CHECS in the SD model. Causal-loop diagrams depicting the six subsystems are built through Vensim PLE (Version 9.2.3, Ventana Systems, Inc., Harvard, Massachusetts, USA) to qualitatively represent the mechanism of different modules.
  • The causal-loop diagram of institutional climate (IC)
The institutional climate is a macro-social environment that can be divided into two parts: government and market [44,45]. The synergy of IC mainly refers to the adaptation and coordination of all the multiple stakeholders of SO-CHECS under the government policies and market mechanisms [46]. The government as an authority whose power is from people can provide more resources for social organizations through measures, such as law and regulations [47], favorable policies [48], funding subsidies [49], and government guidance [50]. Apart from the government climate, the market also plays a crucial role in supplying CHECS. Different market participants could be filtered through setting the standard of market access [51], and market competition can improve quality and efficiency of the aging service [52]. So, these six factors positively promote the synergy of IC, where favorable policies have a positive effect on funding subsidies. Through the above analysis, the causal-loop diagram of IC is shown in Figure 2;
  • The causal-loop diagram of cooperation mechanism (CM)
Cooperation mechanism refers to the constraints and incentives in the healthcare service to promote participants to achieve set goals [53]. CM mainly has the responsibility mechanism and benefit mechanism to effectively prevent stakeholders from deviating from the goal of synergy and to avoid operation disorder [54]. Clarified power and responsibility [55] and benefit distribution [56] are needed to determine the boundaries among different stakeholders, which would have positive impacts on the supervision of participants. Simultaneously, the collaboration [56] and trust mechanism [57] are required to promote cooperation. In addition, IC can help to realize the responsibility mechanism and the benefit mechanism [22], meaning IC has a positive effect on CM (see Figure 3);
  • The causal-loop diagram of information sharing (IS)
Information sharing, which serves as a key in CHECS, refers to demand and supply of information among different stakeholders [57,58]. In SO-CHECS, the stakeholders form the information flow by information exchange and sharing [59,60]. Accurate information, as well as sensitivity of information could improve the matching degree of information in the aging service market [61]. In addition, information sharing value and breadth of information in providing the aging service can determine the transmission of information [62]. So, to better provide stakeholders with information, this paper takes sensitivity, accuracy, sharing value, and breadth of information into consideration (see Figure 4);
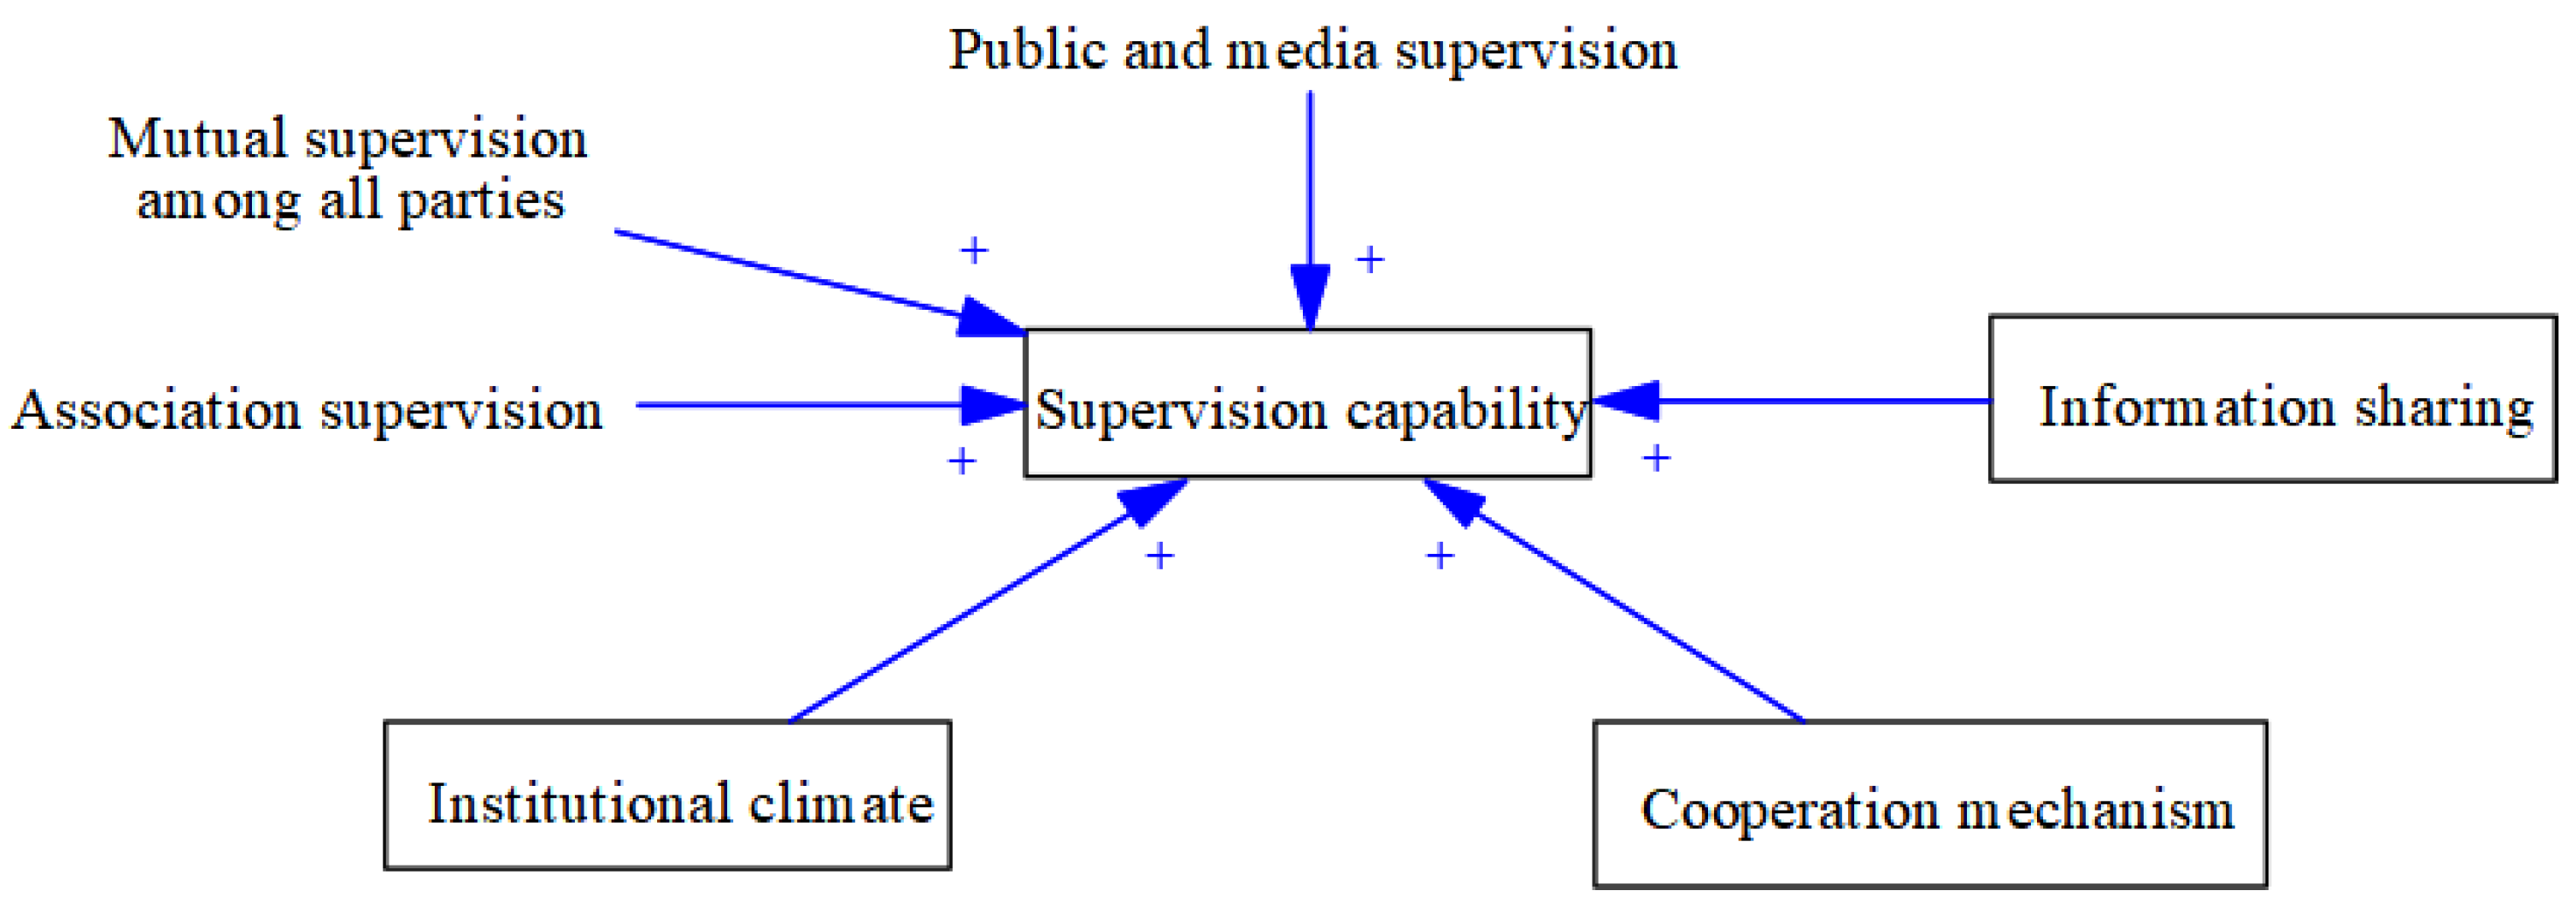
  • The causal-loop diagram of supervision capability (SC)
SO-CHECS requires resource and information exchange among the government, funding, feedback of elders, and third-party agencies to ensure that the elderly effectively have fair access to aging services [63]. Supervision of CHECS can be divided into three cohorts, including public and media supervision, mutual supervision among all parties, and association supervision [64,65]. Furthermore, IS could improve the transparency of the aging service network, which has a positive impact on supervision [66]. As aforementioned, IC can guarantee the rights of supervision through law and regulations [67]. CM clarifies the power and responsibilities of different participants, and this promotes supervision. Therefore, Figure 5 shows the relationships between the factors and SC, as well as IC, CM, and IS [22];
  • The causal-loop diagram of resource allocation (RA)
The resources of CHECS include the human resources, facilities, and equipment resources, and funding resources [68], which are significant for the aging service. All the multiple stakeholders of SO-CHECS integrate the resources to meet the overall requirements of the synergy of SO-CHECS [69]. Specific variables about human resources are professional training [70] and collaborative teamwork [71]. Only if more human resources are input into aging service can the synergy of SO-CHECS be improved. Facilities and equipment resources mean that adequate facilities should be input [72], and funding resources means more funding sources [73,74]. If there were inadequate facilities and funding, the elderly with a low income is deterred from access to healthcare services. Additionally, other subsystems, including IC, SE, CM, and IS also have positive effects on RA, according to reference [22]. As mentioned in the IC section, the government readily controls most healthcare resources and a good IC can create an equal environment for different participants to make sure of a fair RA [75]. Different stakeholders engaging in the aging service would claim their requirements of a fair RA [50], which means stakeholder engagement has positive effects on RA. CM and IS could increase the transparency of providing aging service to require more equal RA. The causal-loop diagram of RA is shown in Figure 6, and all four factors, as well as IC, SE, CM, and IS, have positive effects on RA;
  • The causal-loop diagram of stakeholder engagement (SE)
Stakeholder engagement of SO-CHECS aims to meet the needs of the elderly and improve their satisfaction through uniting multiple stakeholders with different advantages and providing diversified, differentiated, and specialized services [76]. Stakeholder engagement describes involvement and connection among stakeholders in CHECS. Traditionally, government provides aging services, including the production, supply, and supervision of service. This approach could decrease the efficiency of service, while different stakeholders participating in CHECS could increase the flow of resources and information [77]. SE will be promoted for sustainable development with the introduction of RA, CM, and IS [78]. By setting clear standards of market access, more stakeholders can engage the aging service, and the aim is to improve the service. Therefore, service informatization [79], service satisfaction of the elderly [80], service professionalization [81], and service personalization [82] are proposed as the factors of SE. The remaining five subsystems also have positive effects on SE [22] (see Figure 7).
According to the above analysis, this paper combined the casual-loop diagrams of six subsystems into a whole casual-loop diagrams, shown in Figure 8, to express the relationships between different variables and subsystems through connections. With the connections of different subsystems, this paper draws that there are 11 main loops in the diagram. Among them, six loops (R1 to R6) are reinforcing loops in which the change of variables would have positive feedback on themselves, and the remainder (B1 to B5) are balancing loops in which the change of an odd number of variables would have negative feedback. The R1 loop demonstrates the positive effect of market competition on the synergy degree. According to Hartley [83], competition will motivate the innovation of agencies while private sectors (such as social organizations) are more innovative than public sectors, which would result in the cooperation among different stakeholders and more stakeholders to participate in the supply of service or products to increase the collaboration. In SO-CHECS, the institutional climate is influenced by market competition, and increasing the market competition could further enhance cooperation between governments and social organizations, which would increase the stakeholder engagement and then improve the synergy degree. According to the relationship between competition and cooperation [84], the market competition will increase in turn due to the positive effect of synergy when the synergy is improved. The R2 loop reflects the relationship between collaborative teamwork and synergy. More collaborative teamwork will allocate the resources among different organizations and promote the motivation of social organizations to participate in CHECS to enhance the synergy degree [68,85]. Training on interdisciplinary teamwork will promote the synergy of healthcare [86], so the R3 loop describes the impact of professional training on the synergy degree. Professional training will improve the skills of service staff to enhance the service professionalization. Moreover, more service professionalization will increase the service satisfaction to enhance the stakeholder engagement [87,88], which corresponds to the R4 loop. Effective public and media supervision could bind governments and social organizations and improve their involvement in the service to increase the synergy [89], which is reflected in the R5 loop. As for the R6 loop, the higher value of information sharing means that the information is good for stakeholder engagement [62], which can increase the synergy degree. As it tells the high value of synergy degree and proves that the information sharing is valuable.
B1 to B5 loops describe the impacts of government measures on the synergy degree. The measures from the government, such as favorable policies, funding subsidies, market access, and government guidance aim to promote the development of synergy, and they will decrease and even quit support of elderly care services when the synergy is improved [43,90,91]. So, these measures as variables in their casual-loops function as negative impacts, which forms five main balancing loops.

4.3. Stock-Flow Diagram

The casual-loop diagram merely measures the interactions of variables and subsystems of SO-CHECS qualitatively and it needs to be quantified by the stock-flow diagram [92]. System dynamics software called Vensim PLE (Version 9.2.3, Ventana Systems, Inc., Harvard, Massachusetts, USA) was employed to convert the casual-loop diagram (Figure 8) into a stock-flow diagram (see Figure 9). The stock-flow diagram corresponds to the casual-loop diagram completely, including six routes of IC, RA, SE, CM, SC, and IS, as mentioned above in the causal-loop diagrams. State variables (flow), rate variables (stock), auxiliary variables, and constants were used to represent different functions in a stock-flow diagram [93]. All detailed descriptions of these variables are shown in Table 1, and Table 2 shows the equations of these variables in the stock-flow diagram.

4.4. Model Variables and Definitions of the Final Evaluation Indicator

The model variables of the SD model are based on the identified factors. According to the requirements of a SD model, there are stock, flow, auxiliary variables, and constants. We divided the factors into constant or different types of variables as shown in Table 1 and explained the definition of variables and constants.
The SD model needs equations to build dependence between variables and express the stocks and the final evaluation indicator. The final evaluation indicator is the synergy degree value of SO-CHECS, which consists of six sub-indicators. We referred to the results of previous studies by the authors to determine the coefficients [4,22]. The following statements are the main equations of the SD model and more detailed descriptions are shown in Table 2.
In the SD model, there are six state variables (SV) which are institutional climate (IC), resource allocation (RA), stakeholder engagement (SE), cooperation mechanism (CM), supervision capability (SC), and information sharing (IS), and six rate variables (RV) which are changing of institutional climate (CIC), changing of resource allocation (CRA), changing of stakeholder engagement (CSE), changing of cooperation mechanism (CCM), changing of supervision capability (CSC), and changing of information sharing (CIS). The function to describe the relationship between state variables and rate variables is shown in Equation (1)
SV ( t ) = SV ( t 0 ) + t 0 t RV ( t ) dt
where SV ( t ) is the synergetic degree of state variables in year t ; SV ( t 0 ) is the initial value of the synergetic degree of state variables; RV ( t ) is also the rate variables and represents the increment of state variables in year t , which is related to the factors of different state variables.
RV ( t ) is represented by logistic function, which is shown in Equation (2)
F ( x ) = K 1 + a e b x
where K is the limit of F ( x ) ; a and b are the parameters. The logistic function is a mathematics model created to explain the population growth [94]. Now, the logistic function has been applied in different research areas including economics and sociology, which has a strong ability to describe problems in human society [95]. Problems applying the logistic function have a common feature called self-limiting growth due to limited resources [94]. There are three stages of the spread of certain things: the spread is difficult at the beginning; it gets into the exponential growth stage when resources are input at the second stage; the spread curve is similar to the logarithmic curve when things become mature [96]. The three-stage theory also corresponds to the product life cycle except for the decline stage of a product [97]. Therefore, this study selects the logistic function to describe the state variables. The variables and constants of this study are all dimensionless quantities, so this study sets the range of F ( x ) as (−1, 1) and adds a bias to the function, shown in Equation (3).
F ( x ) = 2 1 + e x 1
The specific equations of the six rate variables are shown in Table 2.
Table 2. The functions of main variables in the SD model.
NamesFunctionsDescriptionsSources
Funding subsidydelay (favorable policy, 1, 0.3) × law and regulations × synergy degree valueThe favorable policy has a delayed effect on the funding subsidy. The delay time is year 1, and initial value is 0.3, which are confirmed through the Delphi method.The government will not make decisions to provide funding subsidies for social organizations after implementing favorable policies, which may result in a delay in the practice [98]. So, the delay function is used in the variable [99].
Market competitionnormal (0, 1, 0.5, 1) × synergy degree valueThe market competition conforms to normal distribution where the minimum is 0, the maximum is 1, the average value is 0.5, and the variance is 1. It is confirmed by the Delphi method.The competition In matching markets has the characteristic of random heterogeneous preferences [100], so this paper assumes that market participation of SO-CHECS follows the random normal distribution.
Adequate facilitiesMax (0.5 + 0.23 × funding source + 0.34 × funding subsidy, 1)The initial value of adequate faculties is 0.5 and the maximum value is 1.The input of facilities needs funding, so this variable is affected by funding source and funding subsidy [101].
Collaborative teamworkramp (0.025, 0, 10) × synergy degree valueThe collaborative teamwork is represented by the slope function. The slope is 0.025 from year 0 to year 10.With the development of SO-CHECS, there will be more and more collaborative teamwork in a steady trend [102], so this paper takes the slope function of RAMP [103].
Trust mechanismdelay (0.8, 1, 0.3)The trust mechanism is a delay function influenced by the fix value 0.8. The delay time is year 1, and initial value is 0.3.There is a delay in the trust among stakeholders due to time used in mutual understanding [104], so this paper takes the delay function to describe trust mechanism [99].
Information sharing value0.2 + ramp (0.040, 0, 10) × synergy degree valueThe information sharing value is represented by the slope function. The slope is 0.025 from year 0 to year 10. The initial value is 0.2 confirmed by the Delphi method.The value of information sharing will rise over time with the impacts of synergy degree value, so the slope function of RAMP is used [103].
Changing of IC 2 1 + e ( 0.18 C 11 + 0.16 C 12 + 0.17 C 13 + 0.18 X 14 + 0.16 C 15 + 0.15 X 16 ) 1 These are obtained by deformation of the logistic function.The basic function is from [94], which is called as logistic function.
Changing of RA 2 1 + e ( 0.24 C 21 + 0.26 X 22 + 0.25 X 23 + 0.25 X 24 + 0.63 IC ( t ) + 0.25 CM ( t ) + 0.25 SC ( t ) + 0.26 IS ( t ) ) 1
Changing of SE 2 1 + e ( 0.26 X 31 + 0.23 X 32 + 0.24 C 33 + 0.27 X 34 + 0.58 IC ( t ) + 0.34 RA ( t ) + 0.33 CM ( t ) + 0.31 SC ( t ) + 0.35 IS ( t ) ) 1
Changing of CM 2 1 + e ( 0.24 X 41 + 0.24 C 42 + 0.24 X 43 + 0.26 X 44 + 0.52 IC ( t ) ) 1
Changing of SC 2 1 + e ( 0.32 X 51 + 0.33 X 52 + 0.35 C 53 + 0.47 IC ( t ) + 0.28 CM ( t ) + 0.37 IS ( t ) ) 1
Changing of IS 2 1 + e ( 0.24 X 61 + 0.25 X 62 + 0.25 X 63 + 0.26 X 64 ) 1

5. Model Application

5.1. Data Collection and Data Input

The actual data for the SD model was collected through the survey and then was input into the model after it was developed. For the data collection, we selected the situation of SO-CHECS in Nanjing as the case study. A survey was conducted in September 2020 to collect data from the participating parties of SO-CHECS in Nanjing and scholars from universities. The participating parties included local government employees, elderly services association staff, and workers from organizations for elderly services. The survey included two sections, questions about the background information and the constants mentioned in Table 1. Fundamental information is related to gender, age, education, and others. A Likert five-point scale method from 1 (“strongly disagree”) to 7 (“strongly agree”) was utilized to measure the level of elderly care in Nanjing to acquire the value of constants. A total of 100 questionnaires were distributed, and 81 valid questionnaires were collected, with an effective response rate of 81%. Among these valid questionnaires, 31 questionnaires were from scholars accounting for 38.27%, and the remainder were from the participants of SO-CHECS in Nanjing. More than 92% of the respondents have more than two years of work or research experience, ensuring the credibility and reliability of the questionnaires.

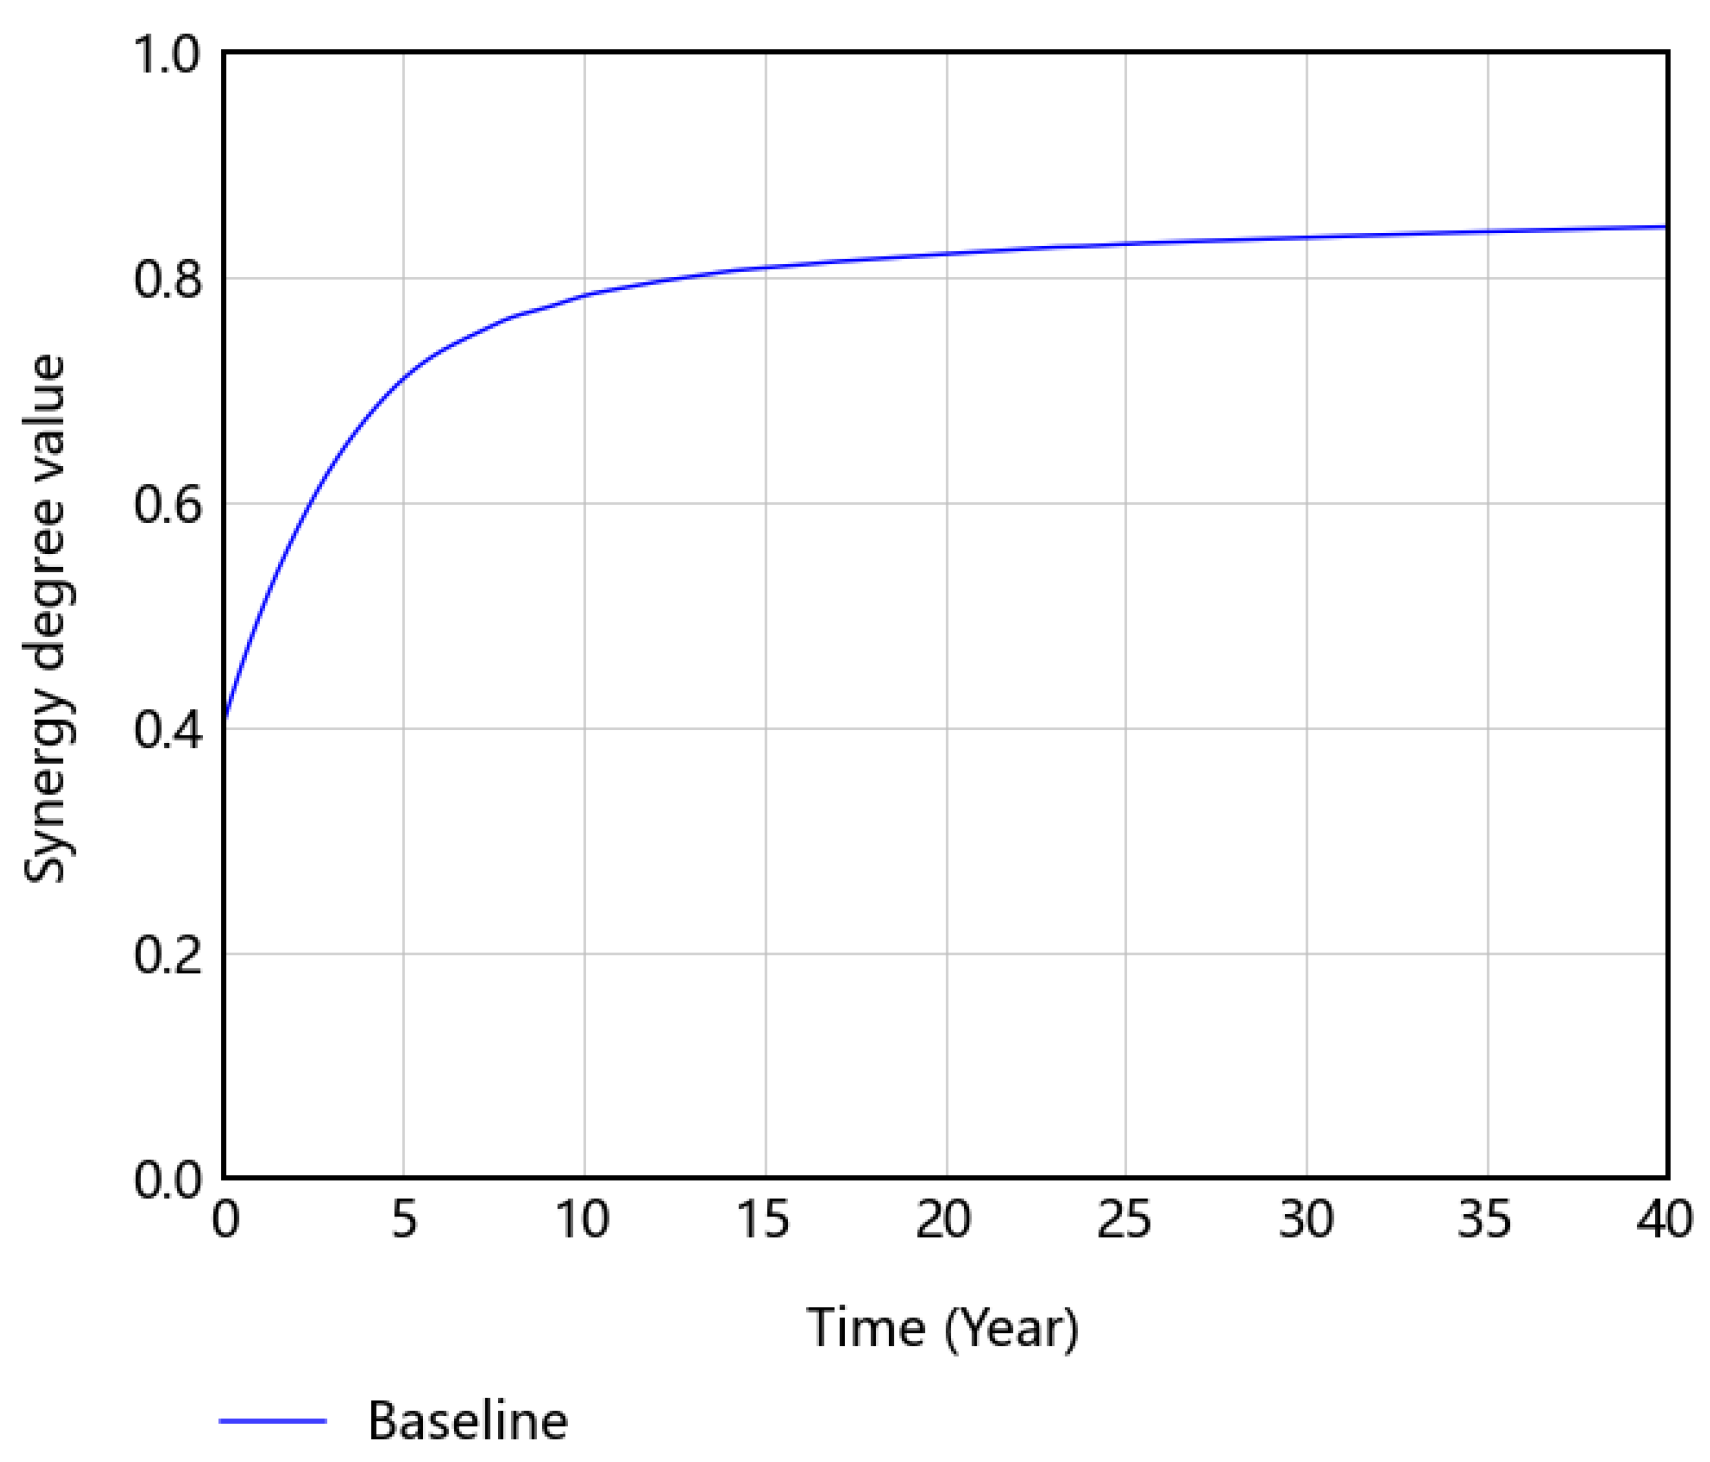
5.2. Simulation Results

The above system dynamics model was established in Vensim software where the step of the simulation was set as 1 year, and the total simulation time was set as 40 years. The temporal trends of synergy degree value are shown in Figure 10. It can be observed from Figure 10 that synergy degree raises consistently with time from year 0 to year 20, while the growth rate of synergy declines. The synergy degree value reaches its peak in year 20 and keeps steady at approximately 0.844 afterwards. Literally, the results correspond to the actual situation. Initially, Figure 10 demonstrates the low-level degree of synergy because favorable policies and funding subsidies obtained from governments by social organizations are not sufficient. Then, the value of six state variables has continuously improved along with attention and support of different participants on SO-CHECS. In the first 5 years, it has great potential for the synergy degree value due to the low synergy with different participants inputting resources into CHECS, impelling fast growth in the synergy degree value. In the second 5 years, different participants have a consensus on SO-CHECS due to the astonishing development of synergy in the prior 5 years. So, the growth of synergy degree value slows. After year 10, the factors of SO-CHECS are developed due to the high identity from all different participants, thereby leading to a growth rate close to 0.

5.3. Model Validation

Before the analysis of the SD model, model validation that can examine the model’s performance should be completed. Quantitative tests were proposed for validation of SD models [105]. Two types of validity tests, including structure and behavior, are mostly used to examine validity of the overall model [105,106]. The structure validation test aims to ensure the equations or functions of the model consistent with the theory and the real situation, which has been conducted in the SD model development section. The behavior validation examines whether the results predicted through the model are closed to or share a similar trend as the actual situation. This step is not completed yet, which needs the historical data and simulated data through the SD model. The SD model selects Nanjing as the case, so the authors established an evaluation model to calculate the synergy degree of SO-CHECS in Nanjing from 2016 to 2020 [107]. Many social organizations started to participate in CHECS since 2016 in Nanjing, so this paper selected the year 2016 as the initial year of SO-CHECS in Nanjing. The historical data from 2016 to 2020, also the actual data, is shown in Figure 11, with the simulated data of the first four years of the SD model. The simulated data fits well with the historical data, which means the SD model has a good performance in simulating the real situation of SO-CHECS in Nanjing. Apart from the direct observation of the results, this paper also conducts statistical analysis to evaluate the relationship between simulated data and actual data quantitively through some metrics, such as R2 and the root mean square error (RMSE), which have a strong confidence [108]. Table 3 shows the value of R2, 0.8, as excellent [109] and the value of RMSE is acceptable. The good performance of R2 and RMSE means that a sound correlation between the actual and simulated data and the SD model is suitable for the description of SO-CHECS in Nanjing.

6. Scenarios and Policy Analysis

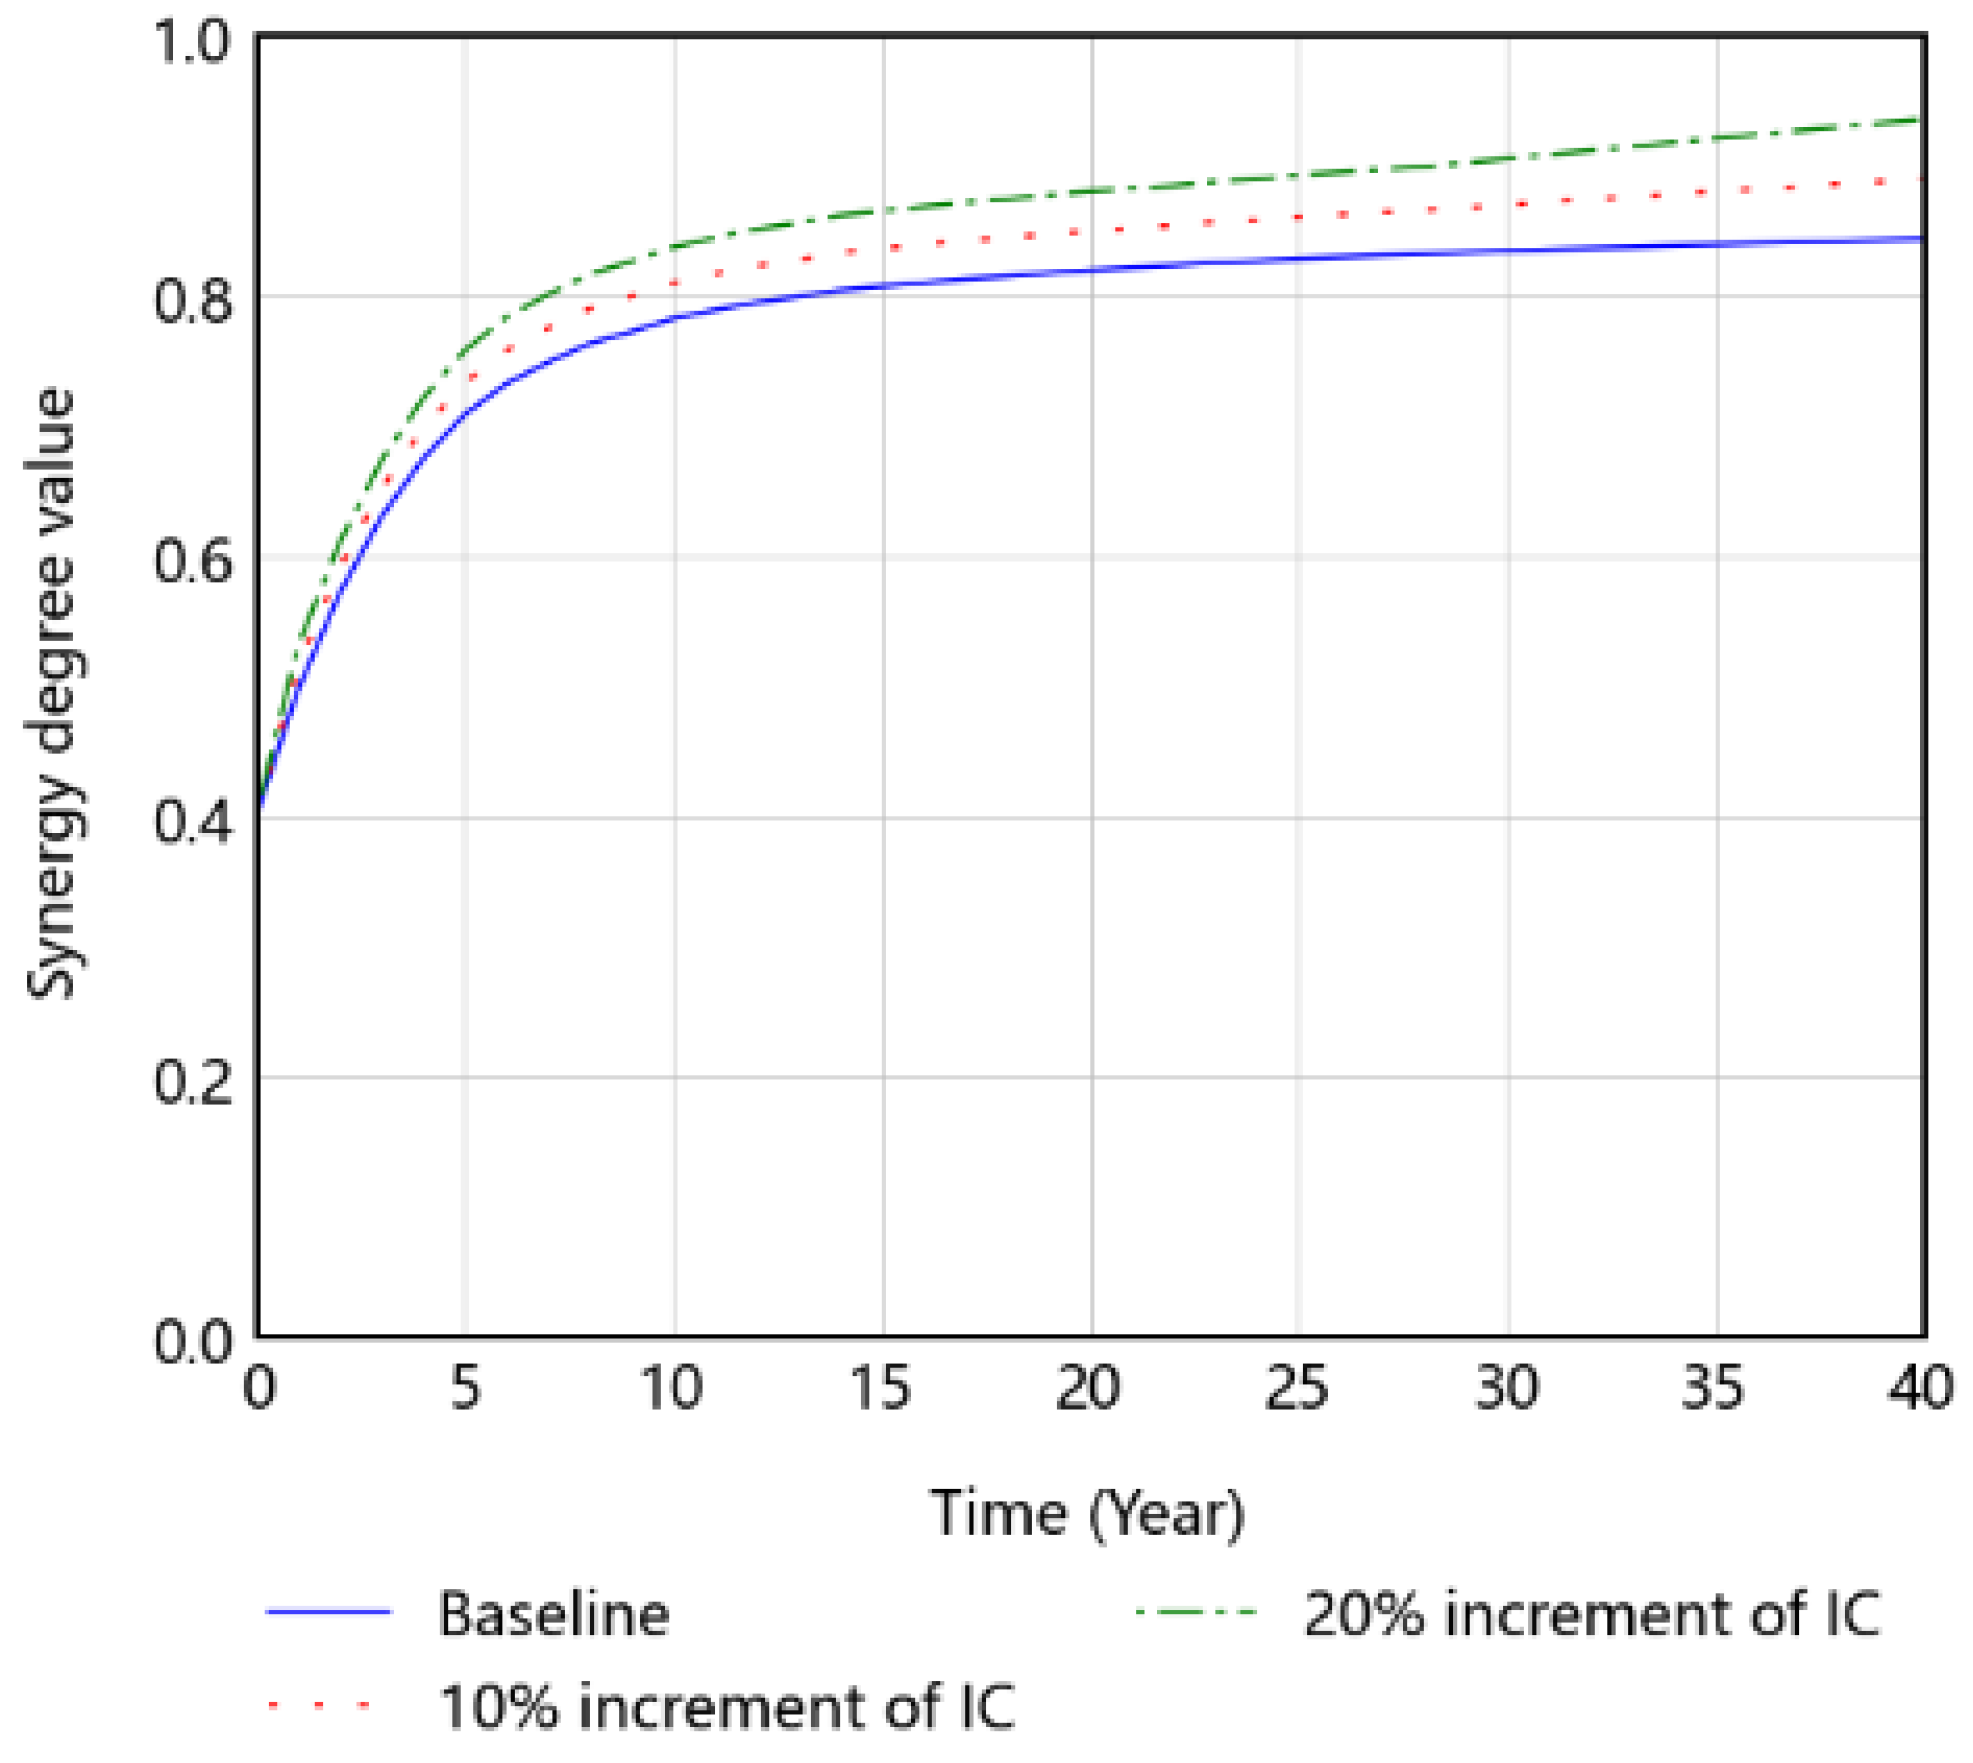
6.1. Single Management Policy

According to the path analysis of SEM model for SO-CHECS in a prior study [22], institutional climate (IC), supervision capability (SC), and information sharing (IS) have a significant influence on the synergy degree of SO-CHECS. The major work of this study was to analyze management or policy effects for promoting synergy for the SO-CHECS system. In this study, management or policy measure analysis involved investigating and comparing the changes of system behavior under various scenarios, which can help the managers or government concerned achieve a better understanding of issues from synergetic development of SO-CHECS and make informed decisions. Therefore, the institutional climate, the supervision capability, and the information sharing were increased to investigate their effects on improving the synergy and to separately conduct single-factor sensitivity analysis.
  • Single management policy analysis of institutional climate (IC)
Institutional climate is affected by factors, such as law and regulations, government guidance, favorable policy, funding subsidy, market access, and market competition. The funding subsidy, market access, and market competition are changing with the law and regulations, government guidance, and favorable policy, which are constants and whose values are obtained through the Delphi method. A 10% and a 20% increment of these factors were used to represent different degrees of IC to analyze sensitivity to the synergy degree value. The results are shown in Figure 12.
In Figure 12, the increment of IC has no significant influence on the synergy degree in the first 2 years. In other words, the synergy degree is not sensitive to the IC. This is that the market and social organizations cannot make adjustment to the changes of IC. However, the policies and market environments become important from year 3. The 10% and 20% increments of IC significantly improve the synergy. Compared with the initial value of synergy degree of 0.844 in year 40, the synergy degree value is 0.877 under the 10% increment with a 3.96% increase in the synergy degree and is 0.911 under a 20% increment with a 7.92% increase in the synergy degree. It proves that the policies and market environment have a notable function in the middle and late period of SO-CHECS. Therefore, the government should make policy standards to clarify the entry and exit mechanism of social organizations, which provide a favorable institution environment for the synergic development of SO-CHECS and ensure the provision of high-quality home-based elderly care services. In addition, to smooth the participation of social organizations and achieve sustainable development of SO-CHECS, the favorable institutional environment with clear formulation of the power, responsibility, and benefit distribution between the government and the social organizations and the service standards of SO-CHECS is required;
2.
Single management policy analysis of supervision capability (SC)
Supervision capability is influenced by the association supervision, mutual supervision among all parties, and public and media supervision. Figure 13 shows the sensitivity analysis to the synergy degree value under 10% and 20% increments of factors of SC.
In Figure 13, the increment of SC has significant influence on the synergy degree. The increment of SC can improve the synergy degree noticeably at the beginning, compared with the effects of increasing IC. However, the synergy degree value is 0.901 under the 10% increment with a 6.8% increase in the synergy degree and is 0.873 under 20% increment only with a 3.4% increase in the synergy degree in year 40. This means that the effects of increments of SC are less than that of IC in the late period. Meanwhile, Figure 13 shows that the growth of synergy under 20% increment of SC is less than that under 10% increment. This is that more supervision will reduce the market vitality which has a direct influence on the synergy. Therefore, the government should develop a balanced and reasonable supervision policy according to the situation of the local social organizations and communities, as inappropriate supervision is detrimental to the synergic development of SO-CHECS;
3.
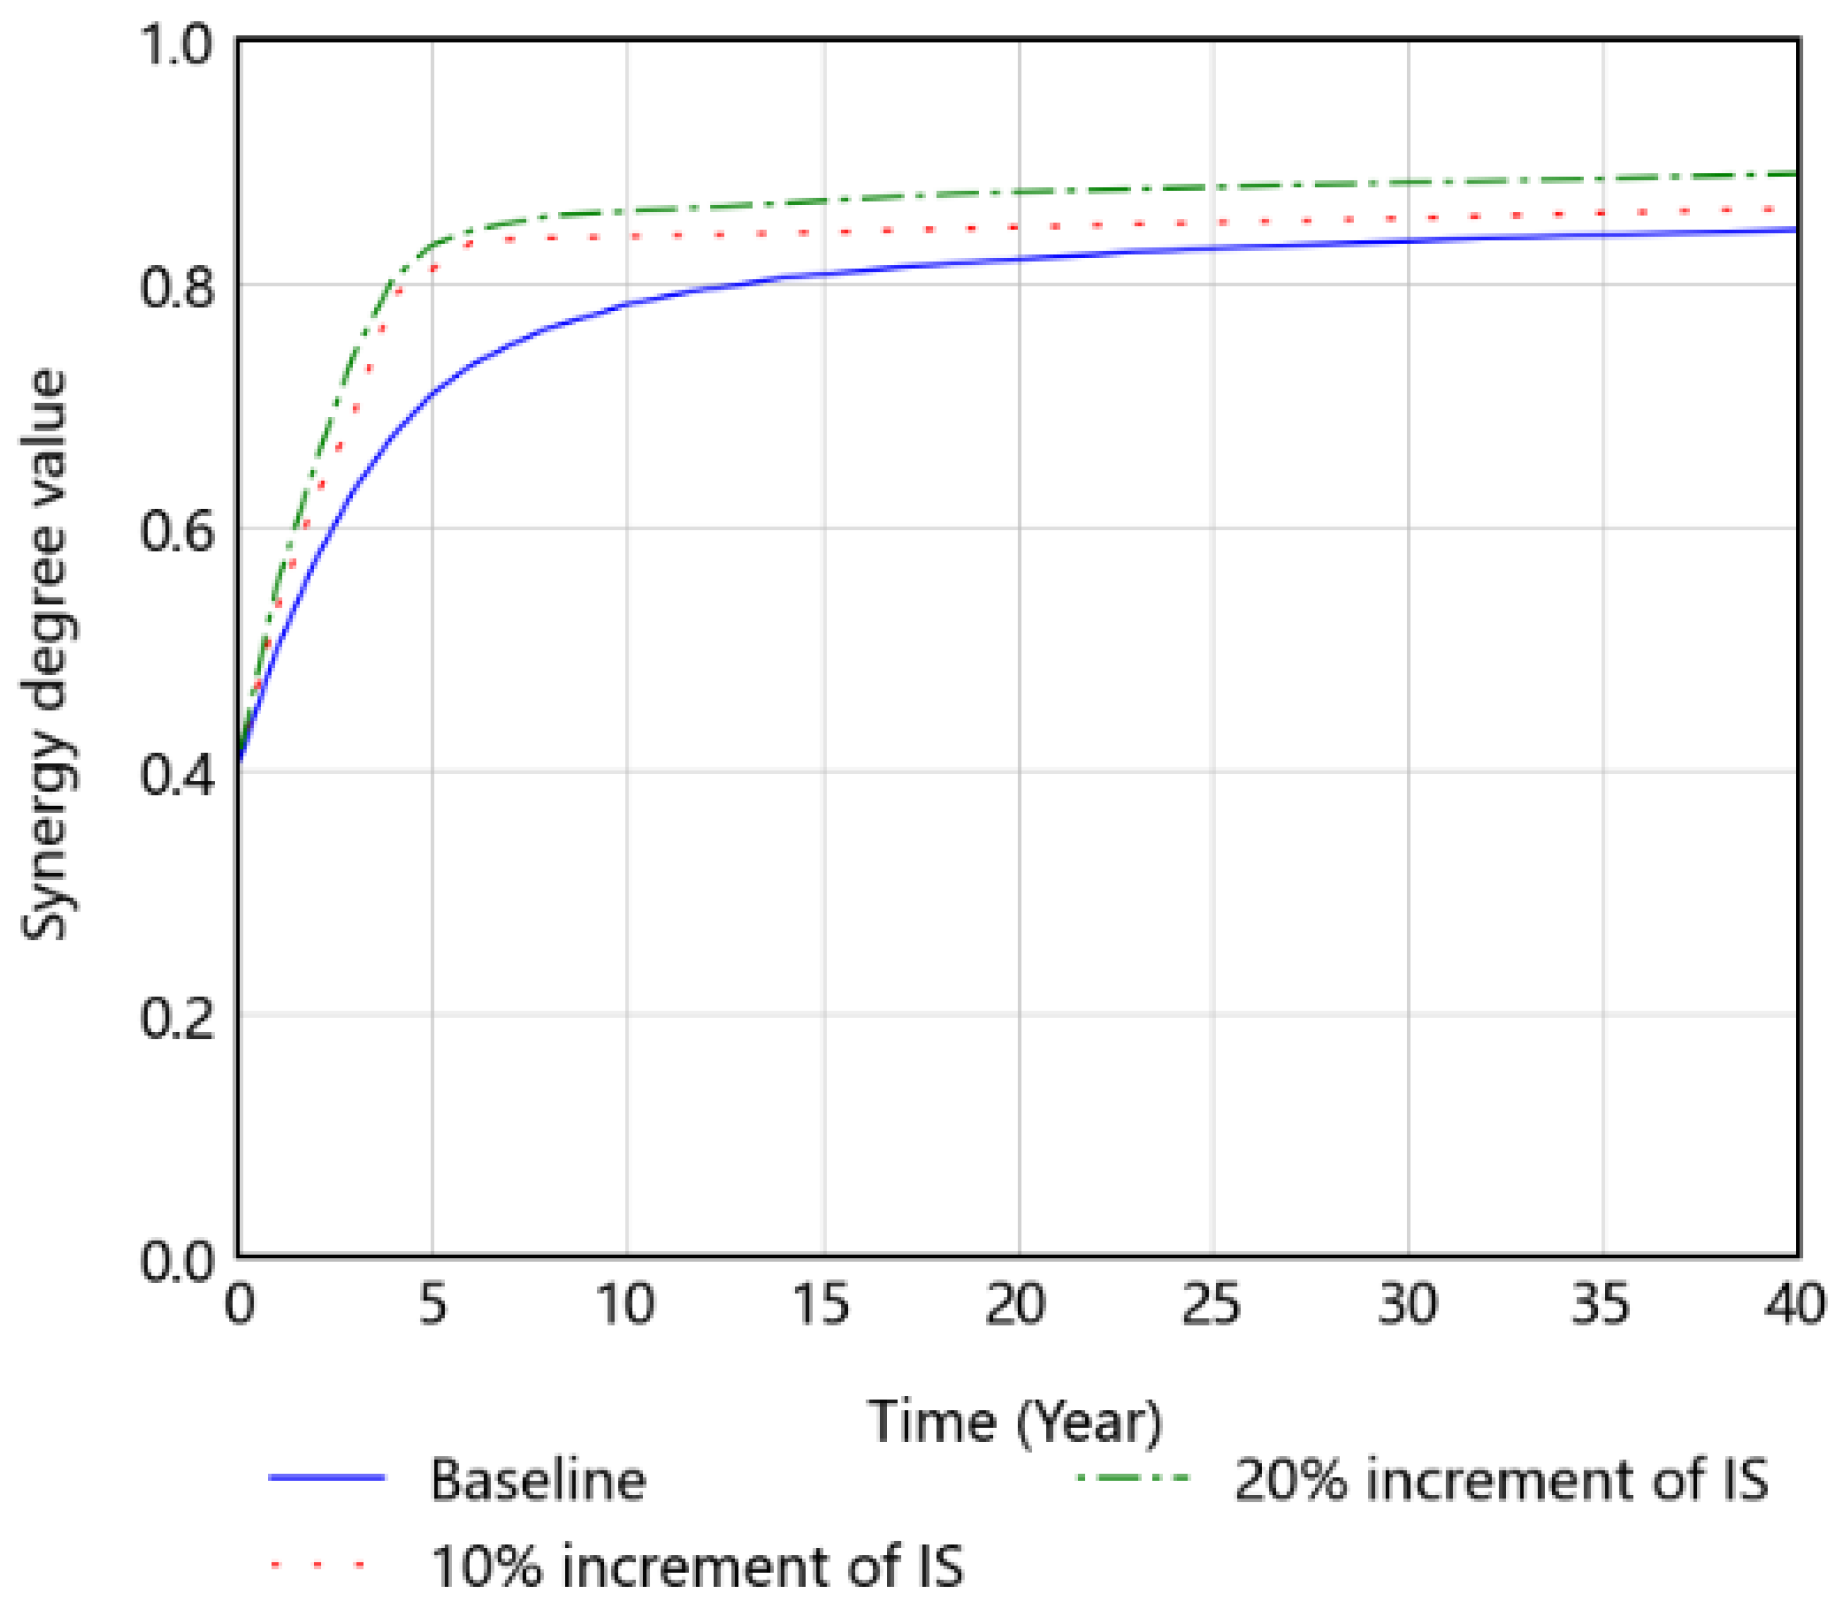
Single management policy analysis of information sharing (IS)
Information sharing is influenced by information breadth, information accuracy, informatization sensitivity, and information sharing value. According to the causal-loop diagram, the first three impact factors are influenced by the service informatization, while the service informatization also influences stakeholder engagement. To take into account IS only, information sharing value is selected as the sensitivity analysis object.
In the first five years, the synergy degree value has significant growth under a 10% and a 20% increment of IS compared with that of IC or SC, which reaches 0.811 and 0.831, respectively (see Figure 14). After year 5, the synergy shows a steady trend. The synergy degree value increases from 0.833 to 0.861 between year 6 and year 40 under the 10% increment of IS, and from 0.843 to 0.890 between year 6 and year 40 under the 20% increment. It means that increasing IS has no notable effect on synergy than increasing IC and SC in the middle and late period. During the early period, the demand gap is rather huge, so the demand for information can be passed to the market timely and accurately. The government can make policies and standards according to the information, and social organizations and communities can provide corresponding services based on this information. Therefore, the synergy within this period can be significantly improved. However, in the middle and late period of the simulation, the demand of elders is mostly met and the information sharing value has no significant effect on the synergy. Nevertheless, it is meaningful to increase IS because it improves the synergy degree overall. For the government and managers concerned, building and promoting a smart aging platform is a possible measure to help different participants strengthen the ability of IS and enhance the information value.
The observed results show that increasing IS effectively improves the synergy degree of social organizations’ participation in aging in place. Each subject should strengthen the information sharing ability of aging in place and enhance the effective information value. At present, due to the constraints of the policy system and information platform, information sharing among subjects still needs to be improved. In the future, IS is expected to be carried out with the help of a smart elderly care platform.
Overall, increasing IC, SC, or IS improves the synergy of SO-CHECS. It can be seen in Figure 15 that increasing IS brings significant improvement of the synergy in the early stage, while increasing IC has an obvious impact on the synergy over this period in question. This means, appropriate market climates and policies are not only effective in the long term but also bring continuous benefits. In addition, excessive or long-term supervision is less helpful to the synergy.

6.2. Multiple Management Policy

The single management policy only changes one factor of synergy degree of social organizations participating in SO-CHECS and leaves the others constant. It ignores the chain reactions of changing one factor on other factors, which cannot reflect the change of the synergy in the simulation model. However, the multiple management policy analysis makes up the limitation. The multiple management policy analysis refers to a method in which different combinations of management measures or policies are changed to measure their contributions to the synergy at a time, while other factors remain unchanged. This section will conduct the multiple management policy analysis to provide better strategies to improve the synergy by combining the institutional climate, the supervision capability, and the information sharing;
4.
Two-management policy combinations: institutional climate (IC) and supervision capability (SC)
The law and regulations, government guidance, favorable policy, funding subsidy, market access, and market competition belonging to the institutional climate and the association supervision, mutual supervision among all parties, and public and media supervision belonging to the supervision capability were selected to measure the contributions of IC and SC. A 10% and a 20% increment of these factors represented different degrees of IC and SC to analyze the sensitivity to synergy. The results are shown in Figure 16.
As seen in Figure 16, IC and SC simultaneously have a significant increase on the synergy. The increase rate of the synergy under the change of IC and SC is greater than that under the change of either factor of IC or SC, indicating that the increment of IC and SC reinforces the synergy compared with increasing IC or SC alone. The synergy degree value is 0.892 under the 10% increment with a 5.7% increase of the synergy and is 0.940 under the 20% increment, with a 11.4% increase in year 40, which is greater than either IC or SC. Therefore, in this way, for governments and managers, to increase IC and SC is predicted to diversify information acquisition channels, enhance elderly rights to know, and optimize the market and law environment to improve synergy;
5.
Two-management policy combinations: institutional climate (IC) and information sharing (IS)
In total, 10% and 20% increments of the institutional climate and the information sharing was used to analyze the sensitivity to synergy under different degrees of IC and IS. Figure 17 shows that increasing IC and IS significantly improves the synergy in the early period, which is different from increasing IC or IS only. The implementation of policies and laws through the information dissemination and information sharing enables the government, social organizations, communities, and the elderly to quickly make adjustments. The synergy degree value in year 40 under the increments of IC and IS is greater than that under the increments of IS, meaning that the favorable policies and law and regulations can increase the upper limit compared with that IS increases as a single factor. Therefore, IS has a positive effect on IC to promote the synergy of SO-CHECS;
6.
Two-management policy combinations: supervision capability (SC) and information sharing (IS)
In total, 10% and 20% increments of the association supervision, mutual supervision among all parties, and public and media supervision belonging to the supervision capability and the information sharing value belonging to the information sharing were used to simulate the synergy of social organizations participating in SO-CHECS. The results are shown in Figure 18;
Increasing SC and IS significantly improves the synergy throughout the period (see Figure 18) compared with the single management policy in Figure 13 and Figure 14. The synergy degree value is 0.908 under the 10% increment with a 7.6% increase of the synergy and is 0.917 under 20% increment with an 8.6% increase in year 40. The reason is that the increment of IS means a strong information media and a smooth information transmission mechanism, which helps to form a synergistic development environment of mutual supervision and promotion among the government, social organizations, and the elderly. The supervision among different parties requires and promotes the construction of an informatized and intelligent SO-CHECS system;
7.
Three-management policy combinations: institutional climate (IC), supervision capability (SC), and information sharing (IS)
This sector combined three subsystems to conduct the multiple management policy analysis as was done above. According to Figure 19, increasing IC, SC, and IS greatly improves the synergy compared with the management policy analysis of two factors from year 1 to year 40. The synergy degree value is 0.946 under the 10% increment with a 12.1%increase of the synergy and is 0.962 under 20% increment with a 14.1% increase in year 40. The above factors of the synergy complement each other to form a model for SO-CHECS in which the government promotes policies and standards development, social organizations provide services and conduct supervision, and the elderly have easy access to the information.
The SD model developed is helpful for improving the synergy of SO-CHECS. Firstly, this SD model has flexible simulation capacities to examine the effects of various management measures, which is clearly presented by the model application and sensitivity analysis process. In this way, practical synergy management effectiveness is expected to be enhanced with the model as it allows concerned governments and managers to critically examine the effects of policies and management measures in advance. Through this, appropriate policies and effective measures can be subsequently developed to improve the synergy of SO-CHECS. Furthermore, the SD model is intuitive, making it easier and more convenient for concerned governments and managers to apply it in practical cases. Admittedly, in some practical cases, there are elements/influencing factors that are not considered in the model. The structure and parameters of this model can be easily fine-tuned to reflect the real situation. In these cases, the governments or the managers can add these elements/influencing factors to the current SD model by determining the interrelationships with the current elements/influencing factors in the SO-CHECS system. In addition, the single and multiple management policy analysis with the comparison of two clusters of simulations helps to deepen the understanding of influencing factor interactions of governments and practitioners, as well as how such interrelations would affect the synergic development of SO-CHECS. Through this method, the awareness of governments and practitioners of the significance of a dynamic influencing factor (i.e., institutional climate (IC), supervision capability (SC), and information sharing (IS)) interactions will be improved.

7. Conclusions

This paper examined dynamic interactions between main elements/subsystems affecting the synergy degree of SO-CHECS and evaluated the synergy degree of a SO-CHECS system. The findings show that there are six main elements/subsystems for the synergic development of a SO-CHECS system, including: resource allocation (RA), information sharing (IS), stakeholder engagement (SE), institutional climate (IC), supervision capability (SC), and cooperation mechanism (CM). A simulation model was developed through the SD approach that can evaluate the synergy degree of SO-CHECS with the effects of six subsystems. With the aid of the SD model, this paper reveals the dynamic nature of these subsystems affecting the synergic development of SO-CHECS and major influences of subsystem interactions on the overall synergic development of SO-CHECS.
Empirical analysis was also utilized to measure the effects of IC, SC, and IS on the overall synergetic degree of SO-CHECS. Findings of the single management policy show that these three measures can effectively improve the synergy of SO-CHECS. However, IS brings significant improvement of the synergy in the early stage, while increasing IC has noticeable impact from across the period in question. Moreover, excessive or long-term supervision is less helpful to the synergic development of SO-CHECS. In addition, a two-policy combination set of IC, SC, and IS achieves a higher level of synergy degree of SO-CHECS than either single policy. Finally, the findings from the three-policy analysis evidently propose the overall policy combination of IC, SC, and IS that improves the synergy degree of SO-CHECS to a larger extent. The empirical results of this study prove that it is critical to consider management measure interactions when evaluating the synergy degree of SO-CHECS.
The core contribution of this work is threefold and is of relevance to academics and practice to (1) enhance the understanding and formalize the modeling of the SO-CHECS system and the six relevant subsystems; (2) develop a robust model that can be used to evaluate the synergy degree of SO-CHECS with the effects of its main elements; and (3) simulate and test the potential management measures or policies for improving the synergy degree of SO-CHECS to see long-term outcomes before making final decisions by concerned managers or government authorities.
For future research, the proposed SD model can be combined with other systems, such as case-based reasoning or big data systems, to offer more empirical data and to provide suggestive support for managers or government authorities.

Author Contributions

Conceptualization, methodology, software, validation, writing—original draft preparation, Q.S.; Data curation, investigation, writing—review and editing, J.M.; Supervision, project administration, writing—review and editing, S.Z. All authors have read and agreed to the published version of the manuscript.

Funding

This research received no external funding.

Data Availability Statement

Not applicable.

Conflicts of Interest

The authors declare no conflict of interest.

References

  1. Sumini; Sukamdi; Pangaribowo, E.H.; Keban, Y.T.; Darwin, M. Elderly Care: A Study on Community Care Services in Sleman, DIY, Indonesia. J. Aging Res. 2020, 2020, 3983290. [Google Scholar] [CrossRef] [PubMed]
  2. Xiao, S.; Xusheng, L.; Feng, L.; Yu, T.; Yingshi, S. Comprehensive Evaluation of Different Scale Cities’ Sustainable Development for Economy, Society, and Ecological Infrastructure in China. J. Clean. Prod. 2017, 163, S329–S337. [Google Scholar]
  3. Yuan, J.; Li, L.; Wang, E.; Skibniewski, M.J. Examining Sustainability Indicators of Space Management in Elderly Facilities—A Case Study in China. J. Clean. Prod. 2019, 208, 144–159. [Google Scholar] [CrossRef]
  4. Shao, Q.; Yuan, J.; Lin, J.; Huang, W.; Ma, J.; Ding, H. A SBM-DEA Based Performance Evaluation and Optimization for Social Organizations Participating in Community and Home-Based Elderly Care Services. PLoS ONE 2021, 16, e0248474. [Google Scholar]
  5. Zhou, J.; Walker, A. The Need for Community Care among Older People in China. Aging Soc. 2016, 36, 1312–1332. [Google Scholar] [CrossRef]
  6. Yi, J.; Lu, D.; Deng, Y. The Future of Social Elderly Care in China: From the Perspective of Service-Oriented Government. J. Serv. Sci. Manag. 2016, 9, 211. [Google Scholar] [CrossRef]
  7. Onunkwor, O.F.; Al-Dubai, S.A.R.; George, P.P.; Arokiasamy, J.; Yadav, H.; Barua, A.; Shuaibu, H.O. A Cross-Sectional Study on Quality of Life among the Elderly in Non-Governmental Organizations’ Elderly Homes in Kuala Lumpur. Health Qual. Life Outcomes 2016, 14, 6. [Google Scholar] [CrossRef]
  8. Teets, J.C. Reforming Service Delivery in China: The Emergence of a Social Innovation Model. J. Chin. Polit. Sci. 2012, 17, 15–32. [Google Scholar] [CrossRef]
  9. Haken, H. Synergetics. IEEE Circuits Devices Mag. 1977, 28, 412–414. [Google Scholar]
  10. Zhang, J.; Yang, C.H.; Qin, X.H.; Du, W. The Comprehensive Evaluation for the Synergetic Development of Urban Traffic System Based on DEA Model; Emerald Insight: Bingle, UK, 2007. [Google Scholar]
  11. Qiao, J.; Wang, M.; Zhang, D.; Ding, C.; Wang, J.; Xu, D. Synergetic Development Assessment of Urban River System Landscapes. Sustainability 2017, 9, 2145. [Google Scholar] [CrossRef]
  12. Moczulska, M.; Seiler, B.; Stankiewicz, J. Coopetition in For-Profit and Non-Profit Organizations—Micro Level. Management 2019, 23, 2. [Google Scholar] [CrossRef]
  13. Mevlja, B.; Kavi, K. Impact of Stakeholders on the Development of Non-Governmental Organisations in Slovenia. Ekon. Pregl. 2019, 70, 236–258. [Google Scholar] [CrossRef]
  14. Pape, U.; Brandsen, T.; Pahl, J.B.; Pieliński, B.; Baturina, D.; Brookes, N.; Chaves-Ávila, R.; Kendall, J.; Matančević, J.; Petrella, F. Changing Policy Environments in Europe and the Resilience of the Third Sector. Volunt. Int. J. Volunt. Nonprofit Organ. 2019, 31, 238–249. [Google Scholar] [CrossRef]
  15. Nanthagopan, Y.; Williams, N.; Thompson, K. Levels and Interconnections of Project Success in Development Projects by Non-Governmental Organisations (NGOs). Int. J. Manag. Proj. Bus. 2018, 12, 487–511. [Google Scholar] [CrossRef]
  16. Soysa, I.B.; Jayamaha, N.P.; Grigg, N.P. Operationalising Performance Measurement Dimensions for the Australasian Nonprofit Healthcare Sector. TQM J. 2016, 28, 954–973. [Google Scholar] [CrossRef]
  17. Theobald, H.; Luppi, M. Elderly Care in Changing Societies: Concurrences in Divergent Care Regimes–A Comparison of Germany, Sweden and Italy. Curr. Sociol. 2018, 66, 629–642. [Google Scholar] [CrossRef]
  18. Pestoff, V. Co-Production and Third Sector Social Services in Europe: Some Concepts and Evidence. Volunt. Int. J. Volunt. Nonprofit Organ. 2012, 23, 1102–1118. [Google Scholar] [CrossRef]
  19. Osborne, S.P.; Radnor, Z.; Strokosch, K. Co-Production and the Co-Creation of Value in Public Services: A Suitable Case for Treatment? Public Manag. Rev. 2016, 18, 639–653. [Google Scholar] [CrossRef]
  20. Galina, Z.; Andrey, L.; Nemec, J. Arrangements for the Transfer of Social-Services Delivery to Non-Governmental Providers (Regional Practices, Russia). NISPAcee J. Public Adm. Policy 2019, 12, 251–274. [Google Scholar]
  21. Yalegama, S.; Chileshe, N.; Ma, T. Critical Success Factors for Community-Driven Development Projects: A Sri Lankan Community Perspective. Int. J. Proj. Manag. 2016, 34, 643–659. [Google Scholar] [CrossRef]
  22. Shao, Q.; Id, J.Y.; Ma, J.; Ding, H.; Huang, W. Exploring the Determinants of Synergetic Development of Social Organizations Participating in Home-Based Elderly Care Service: An SEM Method. PLoS ONE 2020, 15, e0244880. [Google Scholar] [CrossRef] [PubMed]
  23. Xiaohua, F. Research on the Self-Organization of Sustainable Development System in China with the View of Synergetics. J. Syst. Dialectics 2004, 1, 50–55. [Google Scholar]
  24. Lu, X. The Synergy of Urban Development and Transport Infrastructure: An Example of the Shanghai Hongqiao Transportation Hub. In ICCREM 2014: Smart Construction and Management in the Context of New Technology; ASCE Library: New York, NY, USA, 2014; pp. 1480–1487. [Google Scholar]
  25. Jiang, Y. Research on the Sustainable Development of Subway Station Based on Synergetic Theory. In Resilience and Sustainable Transportation Systems; American Society of Civil Engineers: Reston, VA, USA, 2020; pp. 648–655. [Google Scholar]
  26. Wu, Y.; Chen, J.; He, P. Synergetic Analysis of the Public Transit System and Urban Form for Small-and Medium-Sized Cities. In ICTE 2015; ASCE Library: New York, NY, USA, 2015; pp. 2002–2010. [Google Scholar]
  27. Bayer, R.B.S. Business Dynamics: Systems Thinking and Modeling for a Complex World. Interfaces 2004, 34, 324–326. [Google Scholar]
  28. Yuan, H.; Yang, B. System Dynamics Approach for Evaluating the Interconnection Performance of Cross-Border Transport Infrastructure. J. Manag. Eng. 2022, 38, 4022008. [Google Scholar] [CrossRef]
  29. Jiang, Z.; Fang, D.; Zhang, M. Understanding the Causation of Construction Workers’ Unsafe Behaviors Based on System Dynamics Modeling. J. Manag. Eng. 2015, 31, 4014099. [Google Scholar] [CrossRef]
  30. Khoshneshin, F.; Bastan, M. Analysis of Dynamics of Crisis Management in the Earthquake and Performance Improvement Using System Dynamics Methodology. In Proceedings of the 10th International Conference on Industrial Engineering (IIEC 2014), Tehran, Iran, 27–28 January 2014. (In Persian). [Google Scholar]
  31. Machowski, J.; Lubosny, Z.; Bialek, J.W.; Bumby, J.R. Power System Dynamics: Stability and Control; John Wiley & Sons: New York, NY, USA, 2020; ISBN 1119526345. [Google Scholar]
  32. Sterman, J.; Oliva, R.; Linderman, K.W.; Bendoly, E. System Dynamics Perspectives and Modeling Opportunities for Research in Operations Management. J. Oper. Manag. 2015, 39, 40. [Google Scholar] [CrossRef]
  33. John, D.S. System Dynamics Modeling: Tools for Learning in a Complex World. Calif. Manag. Rev. 2001, 43, 8–25. [Google Scholar]
  34. Leon, H.; Osman, H.; Georgy, M.; Elsaid, M. System Dynamics Approach for Forecasting Performance of Construction Projects. J. Manag. Eng. 2018, 34, 4017049. [Google Scholar] [CrossRef]
  35. Nasirzadeh, F.; Nojedehi, P. Dynamic Modeling of Labor Productivity in Construction Projects. Int. J. Proj. Manag. 2013, 31, 903–911. [Google Scholar] [CrossRef]
  36. Li, Z.; Li, N.; Cimellaro, G.P.; Fang, D. System Dynamics Modeling-Based Approach for Assessing Seismic Resilience of Hospitals: Methodology and a Case in China. J. Manag. Eng. 2020, 36, 4020050. [Google Scholar] [CrossRef]
  37. Nasir, M.K.; Hadikusumo, B.H.W. System Dynamics Model of Contractual Relationships between Owner and Contractor in Construction Projects. J. Manag. Eng. 2019, 35, 4018052. [Google Scholar] [CrossRef]
  38. Bastan, M.; Abdollahi, F.; Shokoufi, K. Analysis of Iran’s Dust Emission with System Dynamics Methodology. Technol. J. Eng. Appl. Sci. 2013, 3, 3515–3524. [Google Scholar]
  39. Ma, Q.; Wu, W.; Liu, Y.; Liang, Z.; Kou, L. Impact of the Synergy between Technology Management and Technological Capability on New Product Development: A System Dynamics Approach. J. Syst. Eng. Electron. 2022, 33, 105–119. [Google Scholar] [CrossRef]
  40. Yang, J.; Lei, K.; Khu, S.; Meng, W. Assessment of Water Resources Carrying Capacity for Sustainable Development Based on a System Dynamics Model: A Case Study of Tieling City, China. Water Resour. Manag. 2015, 29, 885–899. [Google Scholar] [CrossRef]
  41. Bastan, M.; Khorshid-Doust, R.R.; Sisi, S.D.; Ahmadvand, A. Sustainable Development of Agriculture: A System Dynamics Model. Kybernetes 2017, 47, 142–162. [Google Scholar] [CrossRef]
  42. Hassan, M.N.; Hawas, Y.E.; Ahmed, K. A Multi-Dimensional Framework for Evaluating the Transit Service Performance. Transp. Res. Part A Policy Pract. 2013, 50, 47–61. [Google Scholar] [CrossRef]
  43. Ansell, C.; Gash, A. Collaborative Governance in Theory and Practice. J. Public Adm. Res. Theory 2008, 18, 543–571. [Google Scholar] [CrossRef]
  44. Du, Z. A Literature Review on Institutional Environment and Technological Innovation. Am. J. Ind. Bus. Manag. 2018, 8, 1941–1950. [Google Scholar] [CrossRef] [Green Version]
  45. Peng, M.W.; Sun, S.L.; Pinkham, B.; Chen, H. The Institution-Based View as a Third Leg for a Strategy Tripod. Acad. Manag. Perspect. 2009, 23, 63–81. [Google Scholar] [CrossRef]
  46. Mor, V.; Zinn, J.; Angelelli, J.; Teno, J.M.; Miller, S.C. Driven to Tiers: Socioeconomic and Racial Disparities in the Quality of Nursing Home Care. Milbank Q. 2004, 82, 227–256. [Google Scholar] [CrossRef]
  47. Genet, N.; Boerma, W.G.W.; Kringos, D.S.; Bouman, A.; Francke, A.L.; Fagerström, C.; Melchiorre, M.G.; Greco, C.; Devillé, W. Home Care in Europe: A Systematic Literature Review. BMC Health Serv. Res. 2011, 11, 207. [Google Scholar] [CrossRef] [PubMed]
  48. Wang, H.-H.; Tsay, S.-F. Elderly and Long-Term Care Trends and Policy in Taiwan: Challenges and Opportunities for Health Care Professionals. Kaohsiung J. Med. Sci. 2012, 28, 465–469. [Google Scholar] [CrossRef] [PubMed]
  49. Roquebert, Q.; Tenand, M. Pay Less, Consume More? The Price Elasticity of Home Care for the Disabled Elderly in France. Health Econ. 2017, 26, 1162–1174. [Google Scholar] [CrossRef] [PubMed]
  50. Bamford, C.; Heaven, B.; May, C.; Moynihan, P. Implementing Nutrition Guidelines for Older People in Residential Care Homes: A Qualitative Study Using Normalization Process Theory. Implement. Sci. 2012, 7, 106. [Google Scholar] [CrossRef]
  51. Roblin, B.; Deber, R.; Kuluski, K.; Silver, M.P. Ontario’s Retirement Homes and Long-Term Care Homes: A Comparison of Care Services and Funding Regimes. Can. J. Aging/La Rev. Can. Vieil. 2019, 38, 155–167. [Google Scholar] [CrossRef]
  52. Forder, J.; Allan, S. The Impact of Competition on Quality and Prices in the English Care Homes Market. J. Health Econ. 2014, 34, 73–83. [Google Scholar] [CrossRef]
  53. Zhou, S.; Ng, S.T.; Li, D.; Zhang, J.; Fan, J.; Yang, Y. Characterizing Stakeholders of Aging-in-Place through Social Network Analysis: A Study of Nanjing, China. Sustainability 2019, 11, 6722. [Google Scholar] [CrossRef]
  54. Zhang, R.; Zhang, Z.; Peng, Y.; Zhai, S.; Zhou, J.; Chen, J. The Multi-Subject Cooperation Mechanism of Home Care for the Disabled Elderly in Beijing: A Qualitative Research. BMC Prim. Care 2022, 23, 186. [Google Scholar] [CrossRef]
  55. Jacobs, G. Patient Autonomy in Home Care: Nurses’ Relational Practices of Responsibility. Nurs. Ethics 2019, 26, 1638–1653. [Google Scholar] [CrossRef]
  56. Tieman, J.; Mitchell, G.; Shelby-James, T.; Currow, D.; Fazekas, B.S.; O’Doherty, L.J.; Hegarty, M.; Eriksson, L.; Brown, R.; Reid-Orr, D. Integration, Coordination and Multidisciplinary Approaches in Primary Care: A Systematic Investigation of the Literature; Australian Primary Health Care Research Institute: Canberra, ACT, Australia, 2017. [Google Scholar]
  57. Guan, Z.; Zhang, X.; Zhou, M.; Dan, Y. Demand Information Sharing in Competing Supply Chains with Manufacturer-Provided Service. Int. J. Prod. Econ. 2020, 220, 107450. [Google Scholar] [CrossRef]
  58. Osei-Frimpong, K.; Wilson, A.; Lemke, F. Patient Co-Creation Activities in Healthcare Service Delivery at the Micro Level: The Influence of Online Access to Healthcare Information. Technol. Forecast. Soc. Chang. 2018, 126, 14–27. [Google Scholar] [CrossRef]
  59. Kanai, H.; Kumazawa, A. An Information Sharing System for Multi-Professional Collaboration in the Community-Based Integrated Healthcare System. Int. J. Inform. Inf. Syst. Comput. Eng. 2021, 2, 1. [Google Scholar] [CrossRef]
  60. Shimizu, N.; Kotani, K. Health Information Exchange in Relation to Point-of-Care Testing in Home Care: Issues in Japan. Clin. Chim. Acta 2022, 532, 10–12. [Google Scholar] [CrossRef] [PubMed]
  61. Woodward, C.A.; Abelson, J.; Tedford, S.; Hutchison, B. What Is Important to Continuity in Home Care: Perspectives of Key Stakeholders. Soc. Sci. Med. 2004, 58, 177–192. [Google Scholar] [CrossRef]
  62. Yamashita, N.; Kuzuoka, H.; Kudo, T.; Hirata, K.; Aramaki, E.; Hattori, K. How Information Sharing about Care Recipients by Family Caregivers Impacts Family Communication. In Proceedings of the 2018 Chi Conference on Human Factors in Computing Systems, Montreal, QC, Canada, 21–26 April 2018; pp. 1–13. [Google Scholar]
  63. Levenson, S.A. The Impact of Laws and Regulations in Improving Physician Performance and Care Processes in Long-Term Care. J. Am. Med. Dir. Assoc. 2004, 5, 268–277. [Google Scholar] [CrossRef]
  64. Nielsen, J.A.; Mathiassen, L. Interpretive Flexibility in Mobile Health: Lessons from a Government-Sponsored Home Care Program. J. Med. Internet Res. 2013, 15, e236. [Google Scholar] [CrossRef]
  65. Plugaru, A.; Ponea, S. Evaluation of Supervision Practice of the Social Services Provided to Elderly in Home Care Centre. Postmod. Open. 2010, 3, 49–70. [Google Scholar]
  66. Liu, Y.; Zhang, L.; Yang, Y.; Zhou, L.; Ren, L.; Wang, F.; Liu, R.; Pang, Z.; Deen, M.J. A Novel Cloud-Based Framework for the Elderly Healthcare Services Using Digital Twin. IEEE Access 2019, 7, 49088–49101. [Google Scholar] [CrossRef]
  67. Costa, A.; Yelshyna, A.; Moreira, T.C.; Andrade, F.C.P.; Julián, V.; Novais, P. A Legal Framework for an Elderly Healthcare Platform: A Privacy and Data Protection Overview. Comput. Law Secur. Rev. 2017, 33, 647–658. [Google Scholar] [CrossRef]
  68. Owili, P.O.; Hsu, Y.-H.E.; Chern, J.-Y.; Chiu, C.-H.M.; Wang, B.; Huang, K.-C.; Muga, M.A. Perceptions and Attitudes of Health Professionals in Kenya on National Health Care Resource Allocation Mechanisms: A Structural Equation Modeling. PLoS ONE 2015, 10, e0127160. [Google Scholar] [CrossRef]
  69. Schiavone, F.; Mancini, D.; Leone, D.; Lavorato, D. Digital Business Models and Ridesharing for Value Co-Creation in Healthcare: A Multi-Stakeholder Ecosystem Analysis. Technol. Forecast. Soc. Chang. 2021, 166, 120647. [Google Scholar] [CrossRef]
  70. Stone, R.I.; Bryant, N.S. The Future of the Home Care Workforce: Training and Supporting Aides as Members of Home-based Care Teams. J. Am. Geriatr. Soc. 2019, 67, S444–S448. [Google Scholar] [CrossRef] [PubMed]
  71. Ploylearmsang, C.; Tongsiri, S.; Pirikannont, M.; Srisaknok, T. Effects of Home-Based Care Inter-Professional Education on Students’ Outcomes: Mahasarakham University Experiences. Med. Sci. Educ. 2021, 31, 677–685. [Google Scholar] [CrossRef] [PubMed]
  72. Ogundele, B.O.; Olafimihan, H.O. Facilities and Equipment as Predictors of Effective Health Care Delivery Services in Selected State Government Hospitals in Oyo State, Nigeria. Anthropology 2009, 11, 181–187. [Google Scholar] [CrossRef]
  73. Glendinning, C. Home Care in England: Markets in the Context of Under-funding. Health Soc. Care Community 2012, 20, 292–299. [Google Scholar] [CrossRef]
  74. Kang’ethe, S.M.; Mangwiro, V.P. Exploring the Effectiveness of Community Home-Based Care (CHBC) Programs in Africa with Examples from Some African Countries. Stud. Ethno-Med. 2015, 9, 219–226. [Google Scholar] [CrossRef]
  75. Mustapha, A.B.; Malah, B.J.; Daluma, M.S. Institutions and Resource Allocation Towards Understanding Economic Efficiency. Afr. J. Manag. 2017, 2, 201–202. [Google Scholar]
  76. Moon, T. How to Start a Home-Based Senior Care Business; Library Journal: New York, NY, USA, 2011. [Google Scholar]
  77. Dahan, S.; Bourque, C.J.; Reichherzer, M.; Ahmed, M.; Josée, P.; Mantha, G.; Labelle, F.; Janvier, A. Beyond a Seat at the Table: The Added Value of Family Stakeholders to Improve Care, Research, and Education in Neonatology. J. Pediatr. 2019, 207, 123–129. [Google Scholar] [CrossRef]
  78. Ehrenhard, M.; Kijl, B.; Nieuwenhuis, L. Market Adoption Barriers of Multi-Stakeholder Technology: Smart Homes for the Aging Population. Technol. Forecast. Soc. Chang. 2014, 89, 306–315. [Google Scholar] [CrossRef]
  79. Kuo, M.-H.; Wang, S.-L.; Chen, W.-T. Using Information and Mobile Technology Improved Elderly Home Care Services. Health Policy Technol. 2016, 5, 131–142. [Google Scholar] [CrossRef]
  80. Busetto, L.; Luijkx, K.; Vrijhoef, H.J.M. Development of the COMIC Model for the Comprehensive Evaluation of Integrated Care Interventions. Int. J. Care Coord. 2016, 19, 47–58. [Google Scholar] [CrossRef]
  81. Brown, H.; Green, M. At the Service of Community Development: The Professionalization of Volunteer Work in Kenya and Tanzania. Afr. Stud. Rev. 2015, 58, 63–84. [Google Scholar] [CrossRef]
  82. Vergados, D.D. Service Personalization for Assistive Living in a Mobile Ambient Healthcare-Networked Environment. Pers. Ubiquitous Comput. 2010, 14, 575–590. [Google Scholar] [CrossRef]
  83. Hartley, J.; Sørensen, E.; Torfing, J. Collaborative Innovation: A Viable Alternative to Market Competition and Organizational Entrepreneurship. Public Adm. Rev. 2013, 73, 821–830. [Google Scholar] [CrossRef]
  84. Snow, C.C. Organizing in the Age of Competition, Cooperation, and Collaboration. J. Leadersh. Organ. Stud. 2015, 22, 433–442. [Google Scholar] [CrossRef]
  85. Salas, E.; Rico, R.; Passmore, J. The Psychology of Teamwork and Collaborative Processes. In The Wiley Blackwell Handbook of the Psychology of Team Working and Collaborative Processes; Wiley: Hoboken, NJ, USA, 2017; Volume 22, pp. 433–442. [Google Scholar]
  86. Newhouse, R.P.; Spring, B. Interdisciplinary Evidence-Based Practice: Moving from Silos to Synergy. Nurs. Outlook 2010, 58, 309–317. [Google Scholar] [CrossRef]
  87. Haddad, C.R.; Ayala, D.H.F.; Maldonado, M.U.; Forcellini, F.A.; Lezana, Á.G.R. Process Improvement for Professionalizing Non-Profit Organizations: BPM Approach. Bus. Process Manag. J. 2016, 22, 634–658. [Google Scholar] [CrossRef]
  88. Garg, L.; McClean, S.; Meenan, B.; Millard, P. A Non-Homogeneous Discrete Time Markov Model for Admission Scheduling and Resource Planning in a Cost or Capacity Constrained Healthcare System. Health Care Manag. Sci. 2010, 13, 155–169. [Google Scholar] [CrossRef]
  89. Xie, J.; Shen, W. Collaborative Public Management: A Technological Solution Framework on Urban Outdoor Advertising Media Supervision in China. In Proceedings of the 2010 International Conference on Management Science & Engineering 17th Annual Conference Proceedings, Melbourne, VIC, Australia, 24–26 November 2010; IEEE: Piscataway, NY, USA, 2010; pp. 1911–1917. [Google Scholar]
  90. Emerson, K.; Nabatchi, T.; Balogh, S. An Integrative Framework for Collaborative Governance. J. Public Adm. Res. Theory 2012, 22, 1–29. [Google Scholar] [CrossRef]
  91. Kim, H.; Lee, C.W. Efficiency Analysis for Nonprofit Organizations Using DEA: Focused on Humanitarian Assistance Organizations in South Korea. Asia Pacific J. Innov. Entrep. 2018, 12, 165–180. [Google Scholar] [CrossRef]
  92. Binder, T.; Vox, A.; Belyazid, S.; Haraldsson, H.; Svensson, M. Developing System Dynamics Models from Causal Loop Diagrams. In Proceedings of the 22nd International Conference of the System Dynamic Society, Oxford, UK, 22–26 July 2004; pp. 1–21. [Google Scholar]
  93. Bala, B.K.; Arshad, F.M.; Noh, K.M. System Dynamics. In Modelling and Simulation; Springer: Singapore, 2017; pp. 1–274. [Google Scholar] [CrossRef]
  94. Cramer, J.S. The Origins of Logistic Regression; Tinbergen Institute: Amsterdam, The Netherlands, 2002. [Google Scholar]
  95. Mood, C. Logistic Regression: Why We Cannot Do What We Think We Can Do, and What We Can Do about It. Eur. Sociol. Rev. 2010, 26, 67–82. [Google Scholar] [CrossRef]
  96. Barry, A.; Thrift, N. Gabriel Tarde: Imitation, Invention and Economy. Econ. Soc. 2007, 36, 509–525. [Google Scholar] [CrossRef]
  97. Cao, H.; Folan, P. Product Life Cycle: The Evolution of a Paradigm and Literature Review from 1950–2009. Prod. Plan. Control 2012, 23, 641–662. [Google Scholar] [CrossRef]
  98. Akortsu, M.A.; Abor, P.A. Financing Public Healthcare Institutions in Ghana. J. Health Organ. Manag. 2011, 25, 128–141. [Google Scholar] [CrossRef] [PubMed]
  99. Špicar, R. System Dynamics Archetypes in Capacity Planning. Procedia Eng. 2014, 69, 1350–1355. [Google Scholar] [CrossRef]
  100. Ashlagi, I.; Kanoria, Y.; Leshno, J.D. Unbalanced Random Matching Markets: The Stark Effect of Competition. J. Polit. Econ. 2017, 125, 69–98. [Google Scholar] [CrossRef]
  101. Zhan, H.J.; Liu, G.; Guan, X.; Bai, H. Recent Developments in Institutional Elder Care in China: Changing Concepts and Attitudes. J. Aging Soc. Policy 2006, 18, 85–108. [Google Scholar] [CrossRef]
  102. Morley, L.; Cashell, A. Collaboration in Health Care. J. Med. Imaging Radiat. Sci. 2017, 48, 207–216. [Google Scholar] [CrossRef]
  103. Liu, S.; Triantis, K.P.; Sarangi, S. Representing Qualitative Variables and Their Interactions with Fuzzy Logic in System Dynamics Modeling. Syst. Res. Behav. Sci. 2011, 28, 245–263. [Google Scholar] [CrossRef]
  104. Jahansoozi, J. Organization-stakeholder Relationships: Exploring Trust and Transparency. J. Manag. Dev. 2006, 25, 942–955. [Google Scholar] [CrossRef]
  105. Barlas, Y. Multiple Tests for Validation of System Dynamics Type of Simulation Models. Eur. J. Oper. Res. 1989, 42, 59–87. [Google Scholar] [CrossRef]
  106. Senge, P.M.; Forrester, J.W. Tests for Building Confidence in System Dynamics Models. Syst. Dyn. TIMS Stud. Manag. Sci. 1980, 14, 209–228. [Google Scholar]
  107. Shao, Q. Evaluation, Optimization and Improvement Study of Synergistic Degree of Home and Community-Based Elderly Care Involving Non-Profit Organization; Southeast University: Nanjing, China, 2021. [Google Scholar]
  108. Xu, T.; Birchfield, A.B.; Overbye, T.J. Modeling, Tuning, and Validating System Dynamics in Synthetic Electric Grids. IEEE Trans. Power Syst. 2018, 33, 6501–6509. [Google Scholar] [CrossRef]
  109. Akoglu, H. User’s Guide to Correlation Coefficients. Turkish J. Emerg. Med. 2018, 18, 91–93. [Google Scholar] [CrossRef]
Figure 1. Research framework for research methods and procedures.
Buildings 12 01491 g001
Figure 2. The causal-loop diagram of IC.
Buildings 12 01491 g002
Figure 3. The causal-loop diagram of CM.
Buildings 12 01491 g003
Figure 4. The causal-loop diagram of IS.
Buildings 12 01491 g004
Figure 5. The causal-loop diagram of SC.
Buildings 12 01491 g005
Figure 6. The causal-loop diagram of RA.
Buildings 12 01491 g006
Figure 7. The causal-loop diagram of SE.
Buildings 12 01491 g007
Figure 8. The whole causal-loop diagram.
Buildings 12 01491 g008
Figure 9. The stock-flow diagram.
Buildings 12 01491 g009
Figure 10. The changing curve of degree of synergy.
Buildings 12 01491 g010
Figure 11. Comparison of actual data and simulated data from 2016 to 2020.
Buildings 12 01491 g011
Figure 12. The effects of different degrees of IC on synergy.
Buildings 12 01491 g012
Figure 13. The effects of different degrees of SC on synergy.
Buildings 12 01491 g013
Figure 14. The effects of different degrees of IS on synergy.
Buildings 12 01491 g014
Figure 15. The effects of different strategies on synergy.
Buildings 12 01491 g015
Figure 16. The effects of different degrees of IC and SC on synergy.
Buildings 12 01491 g016
Figure 17. The effects of different degrees of IC and IS on synergy.
Buildings 12 01491 g017
Figure 18. The effects of different degrees of SC and IS on synergy.
Buildings 12 01491 g018
Figure 19. The effects of different degrees of IC, SC, and IS on synergy.
Buildings 12 01491 g019
Table 1. The definition of variables and constants.
TypesCodeNamesDescription
Stock variablesICInstitutional climateThe synergy degree of institutional climate of SO-CHECS controlled by variables of IC.
RAResource allocationThe synergy degree of resource allocation of SO-CHECS controlled by variables of RA.
CMCooperation mechanismThe synergy degree of cooperation mechanism of SO-CHECS controlled by variables of CM.
SEStakeholder engagementThe synergy degree of stakeholder engagement of SO-CHECS controlled by variables of SE.
SCSupervision capabilityThe synergy degree of supervision capability of SO-CHECS controlled by variables of SC.
ISInformation sharingThe synergy degree of information sharing of SO-CHECS controlled by variables of IS.
Flow variablesCICChanging of institutional climateThe rate of change in the synergy degree of institutional climate.
CRAChanging of resource allocationThe rate of change in the synergy degree of resource allocation.
CCMChanging of cooperation mechanismThe rate of change in the synergy degree of cooperation mechanism.
CSEChanging of stakeholder engagementThe rate of change in the synergy degree of stakeholder engagement.
CSCChanging of supervision capabilityThe rate of change in the synergy degree of supervision capability.
CISChanging of information sharingThe rate of change in the synergy degree of information sharing
Auxiliary variablesSDVSynergy degree valueThe whole synergy of SO-CHECS consisting of the synergy of IC, RA, CM, SE, SC, and IS.
GSGovernment guidanceThe government guidance refers to the guide provided by the government to regulate the behaviors of social organizations.
FSubFunding subsidyThe funding subsidy is the degree to which SO-CHECS receives preferential conditions for the investment from government and is influenced by favorable policies.
FPFavorable policyThe favorable policy refers to preferential policies about financing and taxes from the government to reduce expenses, save costs, and motivate social organizations.
MCMarket competitionThe market competition is the number of rivals of social organizations who want to participate in CHECS.
AFAdequate facilityThe adequate facility refers to the numbers and qualities of facilities for SO-CHECS.
BDBenefit distributionThe benefit distribution refers to the distribution of excess benefits among social organizations. The fair benefit distribution can improve CM.
CCollaborationThe collaboration is the model of collaboration between government, community, and social organizations.
TMTrust mechanismThe trust mechanism plays an important role in reducing transaction costs and disorders between different stakeholders.
SproService professionalizationThe service professionalization refers to the professional degree of service provided by service staff.
SIService informatizationThe service informatization refers to the application of IT, such as IoT, cloud computing and big to provide convenient and efficient services for the elderly.
SSService satisfactionThe service satisfaction is the degree of satisfaction of the elderly with the service.
ASAssociation supervisionThe association of CHECS is responsible for setting standards and supervises the social organizations.
MSPMutual supervision among all partiesThe mutual supervision among all parties is based on the trust and cooperation and is good for the improvement of the quality of services.
IBInformation breadthThe information breadth refers to the maximum extent of information flow in the process of information exchange and sharing between the social organizations.
ICInformation accuracyThe information accuracy refers to the accurate degree of information communication and access.
IZSInformatization sensitivityThe informatization sensitivity refers to the timeliness of information exchange, sharing, and access.
MCMarket accessThe market access refers to the degree of rationalization of threshold set for the social organizations.
PTProfessional trainingThe professional training refers to the professional degree of skills training for service workers.
CTCollaborative teamworkThe collaborative teamwork refers to the team collaboration of different professions.
ConstantsLRLaw and regulationsThe law and regulations refer to the laws and regulations set for the development of SO-CHECS.
FsouFunding sourcesThe funding sources refer to the diversification of financing channels
ISVInformation sharing valueThe information sharing value is the value of information sharing to the social organizations.
CPRClarified power and responsibilityThe clarified power and responsibility refer to clearly defining the legal responsibilities of stakeholders.
SperService personalizationThe service personalization refers to the service provided by social organizations that can meet the personal requirements of the elderly.
PMSPublic and media supervisionThe public and media supervision refers to unofficial public supervision in daily life, such social media in the network.
Table 3. The metrics for evaluating the SD model.
Indicator for EvaluationR2RMSE
Synergy degree value0.8680.137
Publisher’s Note: MDPI stays neutral with regard to jurisdictional claims in published maps and institutional affiliations.

