Article

Condition Assessment and Seismic Upgrading Strategy of RC Structures—A Case Study of a Public Institution in Croatia

1
Department for Structures, Faculty of Civil Engineering, University of Zagreb, 10000 Zagreb, Croatia
2
Energy Institute Hrvoje Požar, 10000 Zagreb, Croatia
*
Author to whom correspondence should be addressed.
Buildings 2022, 12(9), 1489; https://doi.org/10.3390/buildings12091489
Submission received: 6 July 2022 / Revised: 19 August 2022 / Accepted: 9 September 2022 / Published: 19 September 2022

Abstract

:
In 2020, Croatia was struck by two catastrophic earthquakes, resulting in more than 50,000 damaged structures. The majority of these are masonry buildings, but there are a number of reinforced concrete structures that suffered moderate to extensive damage. In this paper, the seismic condition assessment and upgrading of existing RC structures are presented with a case study building in Zagreb. The assessment procedure includes initial visual inspection, rapid preliminary evaluation, detailed in situ measurements, and non- and semi-destructive methods. New technologies were applied and followed by numerical modeling and verifications. Strengthening proposals are made that respect owner needs and the needs for the energy retrofitting of the existing RC building. As the integrated approach should be respected in the renovation of existing buildings, this case study can represent an example of good practice in the process of seismic and energy retrofitting.

1. Introduction

Southern Europe was recently struck by devastating earthquakes, and the same problems regarding the vulnerability of the building stock appeared in Italy [1,2], Albania [3], Greece [4], Turkey [5], and Croatia [6]. In 2020, Croatia was struck by two severe earthquakes. Since those earthquakes, the area of the City of Zagreb and its surroundings have been hit by a series of minor and moderate earthquakes. As the vast number of buildings in Croatia were built before any seismic norms, the mentioned earthquakes raised awareness of people related to seismic activities and the load-bearing capacity of the existing building stock. After the Zagreb earthquake, around 25,000 buildings were estimated to have been damaged, with most of them being in the historic city center. After the Petrinja earthquake, around 56,000 buildings were estimated to have been damaged, causing additional damage to the buildings in the historic city center of Zagreb. The World Bank estimated the total value of the financial damage from the Zagreb earthquake to be EUR 11.3 billion, and that from the Petrinja earthquake to be EUR 5.5 billion [7].
The majority of damaged objects are older masonry buildings that were built according to older codes without proper consideration of seismic loads [8,9,10]. Nevertheless, several reinforced concrete structures also suffered significant damage, as shown in Figure 1 and Figure 2. These are mainly buildings from the 1960s, which were built with plain bar reinforcement and lightly reinforced shear walls. Plastic hinges formed on RC frames without additional stirrups for the confinement of the reinforcement in the beam–column joint (Figure 1), resulting in the buckling of the longitudinal column reinforcement. Diagonal cracks are typical for lightly reinforced shear walls with non-symmetrical horizontal and vertical reinforcement (Figure 2).
In the report, Croatia Earthquake—Rapid Assessment of Damage and Needs 2020 [7], prepared for the World Bank, the Government of the Republic of Croatia emphasizes that the reconstruction process should be guided by the principles of “build back better,” i.e., repair and improve damaged buildings to reduce the risk of future earthquakes and enable functional improvements, including the application of energy efficiency principles.
In June 2020, the Croatian Technical regulation for building structures [11] was amended by a provision that more precisely regulates the reconstruction after an earthquake. The Technical regulation defines four renovation levels, depending on the degree of damage, intended use of the building, and the financial capabilities of the investor. Level 1 refers to re-establishing the initial resistance of the structure as it was before the earthquake, while levels 2, 3, and 4 achieve satisfactory earthquake resistance for the reference return period.
The highest level of seismic safety is achieved with Level 4. Accordingly, strengthening measures and their range must be tailored to achieve the mechanical resistance and stability of the building in relation to seismic action for a comparative probability of exceeding 10% in 50 years (return period 475 years).
The idea of this manuscript is to show the benefits of seismically upgrading existing building stocks to the “full Eurocode”, and to discuss assessment methods of RC structures and the implementation of new technologies in the assessment process. The processes are shown using a particular case study and the detailed plan of activities for the particular case study is given in Figure 3. The research is a part of a bigger scientific project that is dealing with both energy and seismic retrofitting of existing buildings. This paper is an introduction to the seismic assessment and upgrading of existing RC buildings.
Poor energy performance of public buildings in Croatia has been addressed in the key energy policy documents, the National Energy and Climate Plan (NECP) for period 2021–2030 (adopted at the end of 2019) [12] and the long-term strategy for energy renovation of national building stock until 2050 (adopted at the end of 2020) [13]. The latter document introduced the concept of comprehensive renovation, which not only includes energy renovation measures but also optimal measures to improve the overall regulatory requirements of the building. Instructions were published on how to assess the existing condition, and the measures that should be considered to increase fire safety, measures to ensure a healthy indoor climate, and measures to improve mechanical resistance and stability of the building, especially to reduce operational earthquake risk. This analysis was introduced as an obligatory document to be submitted for public grant application. It is up to the building owner to decide on the scope of refurbishment and the saving target. A higher saving target and a wider scope of improvements enables a higher investment cost funding percentage. This leads to one of the concerning issues in Croatia today that is impeding the nZEB renovation potential, which is how to efficiently transfer the respective regulations and the recently developed methodologies regarding nZEB standards to all the key stakeholders involved in the processes of renovation of the existing building stock. nZEB projects result in complex partnerships, where there is not only a single investor, but require active participation of the local government and the neighborhood community.
A comprehensive renovation pilot project of a public office building was initiated in 2021 to apply the nZEB standard (Figure 4). The entire process of development of design documentation, and the steps of the administrative approval process and the construction works, will be thoroughly documented and monitored by the group of experts, and have the role of a living lab for all stakeholder groups. The overall objective of the project is to enhance knowledge of the professionals dealing with buildings and raise the awareness among other respective stakeholders regarding all the aspects of the building renovation by adopting innovative technical solutions fitted to the nZEB requirements. This will be done by establishing the national training center for nZEB.

2. Materials and Methods

2.1. Case Study

2.1.1. Overview of the Building and Identification of the Process

The office building was built in 1975 and was refurbished for the first time in 2001. The total building area is 2471 m2 and the useful heated area is 2061 m2. It accommodates 85 employees and is used for 8 to 10 h a day during 5 days a week. The building has three structural and functional units, the northern and southern volumes in which the office spaces are located, and the central communication part with the staircase. The building consists of a basement, ground floor, and four floors.
Energy consumption, energy cost, and the related CO2 emission for the existing systems were analyzed. The specific annual electricity consumption is 90.51 kWh/m2, the district heating consumption is 65 kWh/m2, and the CO2 emission is 90 tCO2. Total annual energy cost is EUR 30,775 or 14.93 EUR/m2. All energy efficiency indicators show high energy and cost saving potential
A complete geometrical survey of the building with analyses of the existing documentation and previous construction phases should be undertaken. In addition to regular condition assessment methods, new technologies will be used. Laser scanning and photogrammetry inspection will be implemented in the traditional methods to obtain better insight into both material properties and the global behavior of the building. Detailed 2D drawings will be produced together with the BIM model of the current building. Point clouds and photogrammetry will be used for a better representation of the building and faults in the building.
A detailed energy study to define the energy refurbishment concept will be performed in the 2nd stage of the project. This will include building energy demand modeling, the energy performance assessment, and the identification and analyses of cost-effective and technically feasible energy efficiency measures and integration of renewable energy systems that are suitable to achieve the nZEB target. The maximum saving potential is estimated at 10 times lower energy consumption and CO2 emission, and five times lower energy consumption, compared to the current energy and cost balance of a building. Feasibility studies will be undertaken for specific technical systems (incl. subsystems) such as heating, ventilation, and air-conditioning (HVAC) systems, building digitalization, and energy storage systems.
Regarding the seismic performance of the case study, a condition assessment of the existing building should be performed—assessing and defining the condition of material characteristics with non-destructive and semi-destructive methods. Special attention should be given to the assessment of key structural and material properties (especially for main structural components and materials). Non-structural elements (i.e., masonry) should also be checked. The seismic behavior of buildings generally depends on several important factors, such as material properties, the geometry of the structure, additional non-linear effects, conceptual design, and stiffness properties. In addition to regular condition assessment, the estimation of the seismic resistance will be provided. Complex numerical modeling of the building should be obtained showing how the level of prior knowledge can lead to more economical and sustainable design.
It is assumed that the build back better (BBB) principle will be used in the rehabilitation and reconstruction of the building. The proposal of the structural reinforcement and upgrading of seismic resistance will be designed, which will also satisfy the state-of-the-art requirements in the field of seismic upgrading. As the building was constructed before the valid seismic codes, the new design project will comply with the new norms and standards (Eurocode 8). In other words, the strengthened building will meet the valid standards for new structures. Moreover, the project will comply with the law on the reconstruction of the city of Zagreb after the earthquakes which struck Zagreb on 22 March and 29 December 2020 [14].

2.1.2. Structural System

The case study building is divided into three structural sections, labeled as sections A to C. Each section is a structural system of its own, with a 7 cm joint between them, in accordance with the seismic joint condition, part 4.4.2.7. in EN 1998-1 [15]. The structural system of sections A and C is a combination of uncoupled shear walls and frames, while section B is comprised only of shear walls, as shown on the characteristic floorplan in Figure 5. Reinforced concrete walls are 20 cm thick (except in the basement where the walls are 30 cm thick), and the columns have a cross-section of 30 × 40 cm on which the beams with a height of 40 cm are supported. Floor structures are RC slabs, with a thickness of 14 cm. There are a total of six stories, including the basement and attic, with a total height of 18.53 m. The foundations are constructed as pad foundations for the columns and foundation beams for the shear walls.
Unfortunately, the original documentation and design projects were not available, but the assessment and strengthening projects (from 2000) were retrieved from the archives and were used for visual confirmation of the load-carrying elements.
During the seismic assessment, conducted in 2000, the analysis showed that sections A and C are lacking lateral stiffness in the direction of the frames (direction X in Figure 5). The addition of steel braces in the spans adjacent to Section B was chosen as a seismic mitigation measure. The braces are added on each floor except the attic, comprised of two steel tube profiles. In the basement and ground floor, the profiles are Ø 101.6 × 7.1, while on the remaining floors the profiles of Ø 88.9 × 7.1 are used. The characteristic section of the floor plan, along with steel braces, is given in Figure 6.
Although the case study building has been strengthened, the assessment and design procedures were conducted using older codes, in which the seismic loads were not taken into account as they are in the current Eurocode 8 design codes. Therefore, after the recent earthquakes in Croatia, small cracks and negligible damages occurred to the structure, and a new analysis was performed, as presented in Section 3. Preliminary visual inspection and overview of the 2000 seismic assessment procedure showed that the lateral stiffness of the frames (along with braces) is not satisfactory for the Peak Ground Acceleration (PGA) in Zagreb. As the idea is to BBB, the decision was made to strengthen the building to the requirements from EN1998 [15].

2.2. Assessment Procedure

2.2.1. Seismic Assessment of Existing RC Structures—Overview

The current European design codes, Eurocodes, cover the seismic design in the scope of EN 1998, which addresses both the design of new (EN 1998-1 [15]), and the assessment of existing (EN 1998-3 [16]), RC structures. In general, seismic evaluation is performed similarly to the design of new structures, but with a modified approach to analysis, target reliability, and partial factors. The most important step of the seismic assessment is the collection of the data about the structure, which includes both the review of existing available documentation, and various in situ and laboratory measurements and tests.
The seismic resilience of the RC structures is related to the ductility and capacity of its load-bearing elements (shear walls, frames, etc.), which are provided by sufficient reinforcement and adequate floor distribution of elements (to avoid torsional effects). Therefore, to perform a successful seismic assessment of the existing RC structure, the first step is to obtain the amounts and positions of the built-in reinforcement. This can be done using original design plans (if available), but it is necessary to validate them on-site. Unfortunately, for older structures, documentation is often not available, and both non-destructive and destructive testing methods are required. There are several available methods, such as Ground Penetrating Radar (GPR) or Profometer, which are described in more detail in Table 1.
When all available data are collected, the next step in the assessment is the selection of the analysis method, which can be divided into linear and non-linear types. Methods recommended in EN 1998-3 are given in Table 2 [17].
The selection of the analysis method is based on the complexity of the structure and the seismic demand it has to fulfill. Seismic demands for linear analysis are, in general, defined by the Peak Ground Acceleration (PGA), soil category, and behavior factor. For new structures, the PGA is defined for a return period of 475 years [15], while for the existing structures, it can be reduced to a minimum of 95 years, as detailed in [16]. Behavior factor is used for correction of elastic response spectrum and is calculated based on the prevailing failure mode of the inspected structure. For the torsional sensitive structures (such as the case study building), in which the lateral stiffness differs greatly for two main directions, it is taken as a minimum of 1.5.
By comparison, for non-linear analysis, the seismic demand is obtained based on the M–φ curve and target displacements. Therefore, to perform non-linear numerical analysis, it is necessary to model all built-in reinforcement and to define the expected locations of plastic joints.
When the assessment is performed, the engineers often develop a simple numerical model, in which the stiffness is reduced by 50% to take into account the cracking of the concrete, and perform a linear analysis based on the response spectrum. As a result, natural periods, eigenmodes, displacements, and lateral forces are obtained. If the displacements are lower than the threshold values (H/500), the load-bearing elements (walls, frames) are evaluated based on obtained lateral forces. If they do not have sufficient capacity, the analysis can be conducted again using a lower return period. If the structure is not validated in this step, the non-linear static analysis, based on the pushover method, can be performed, in order to obtain target displacements and capacity of the elements. In general, the time history and more sophisticated analysis methods are not often used in practice, as they require data sets from realistic earthquakes [17].

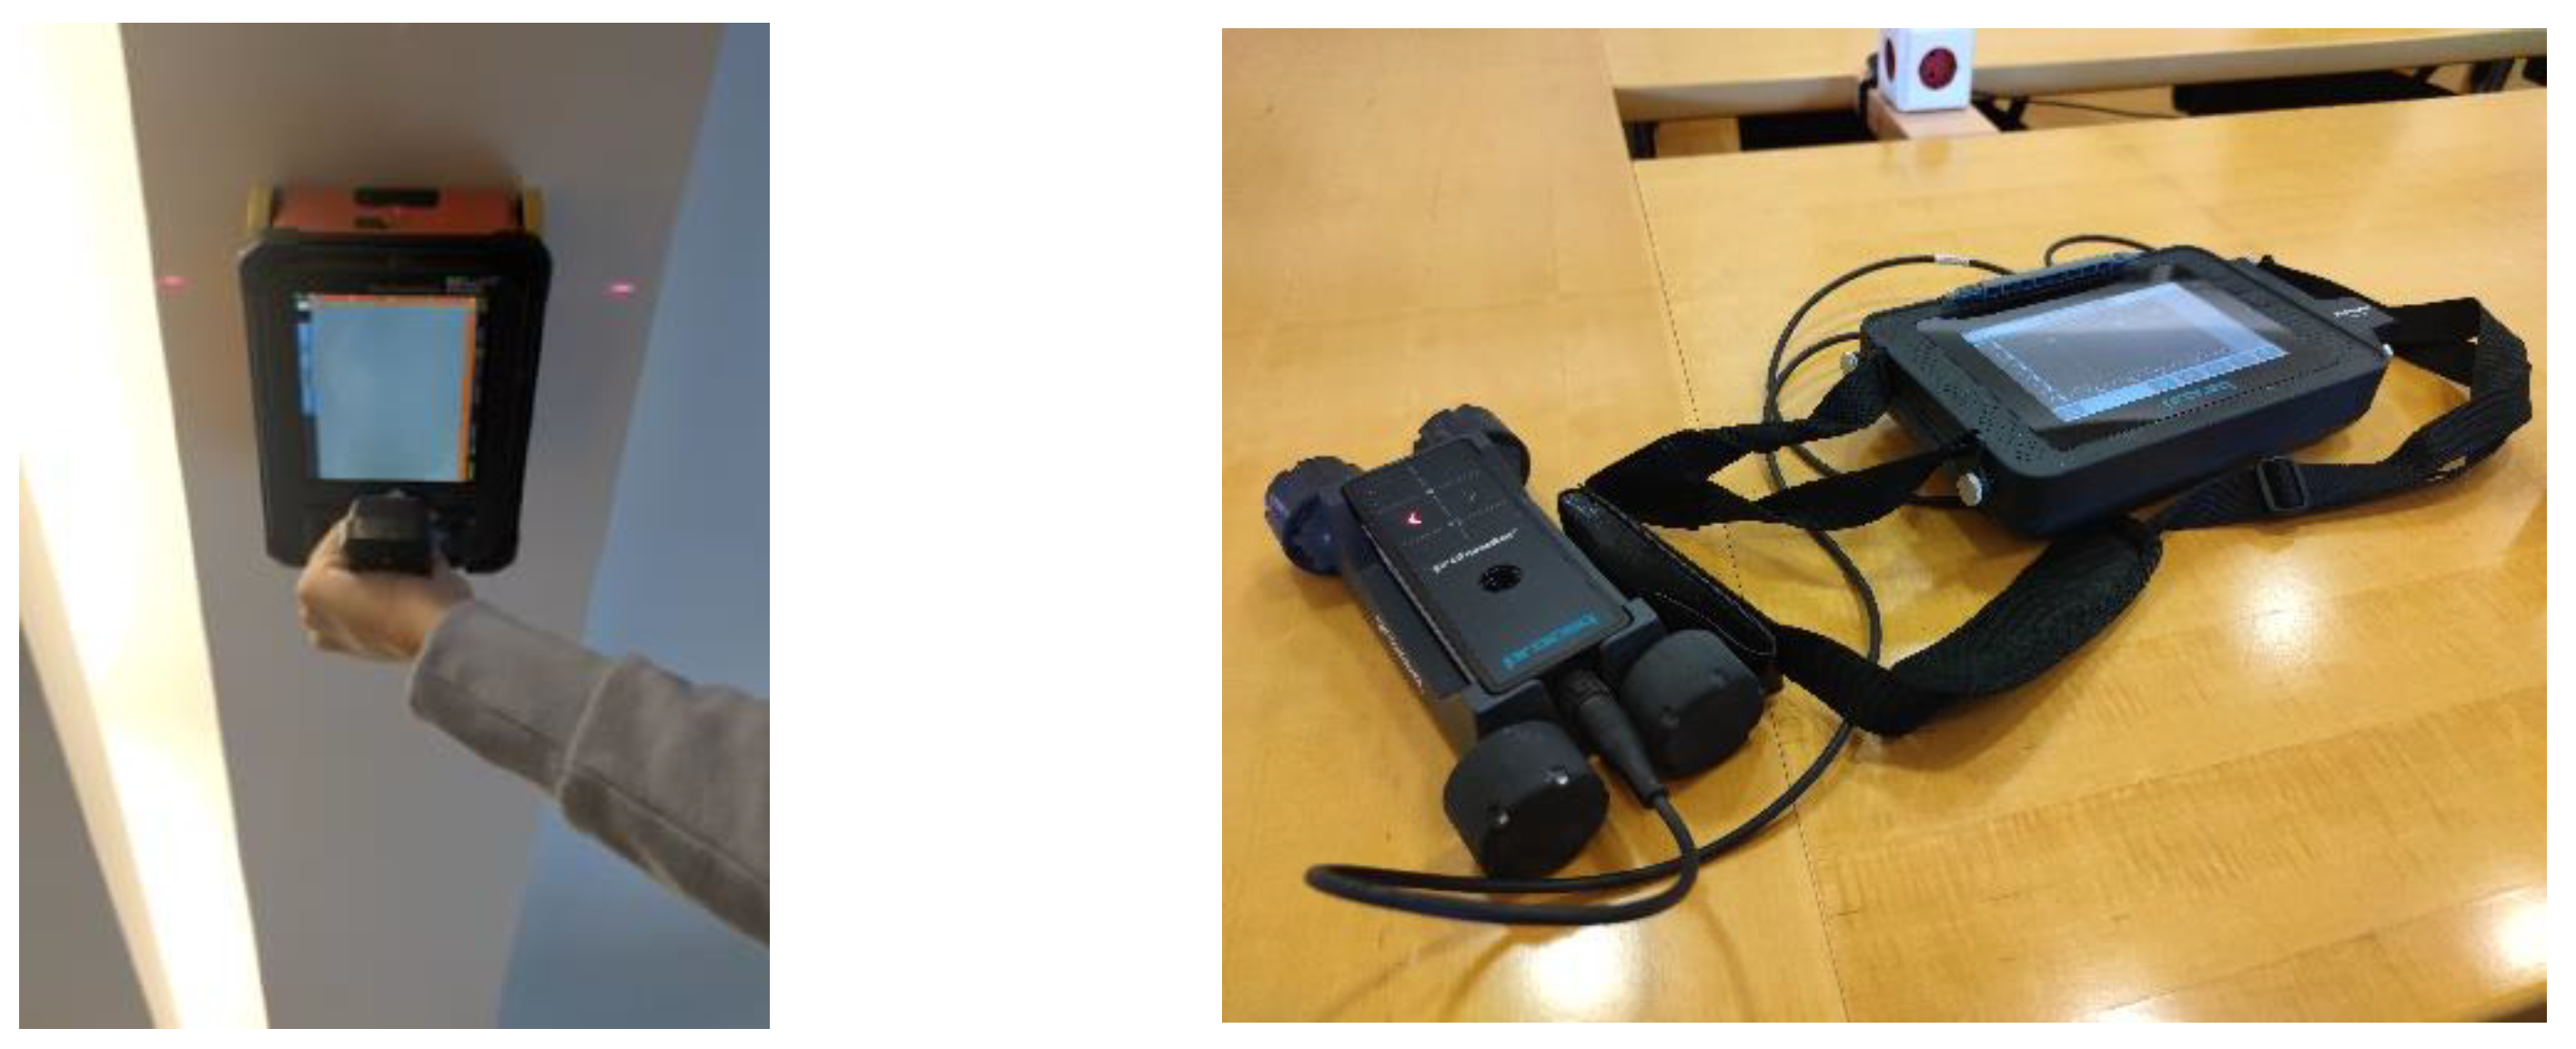
2.2.2. In Situ Measurements—Case Study Building
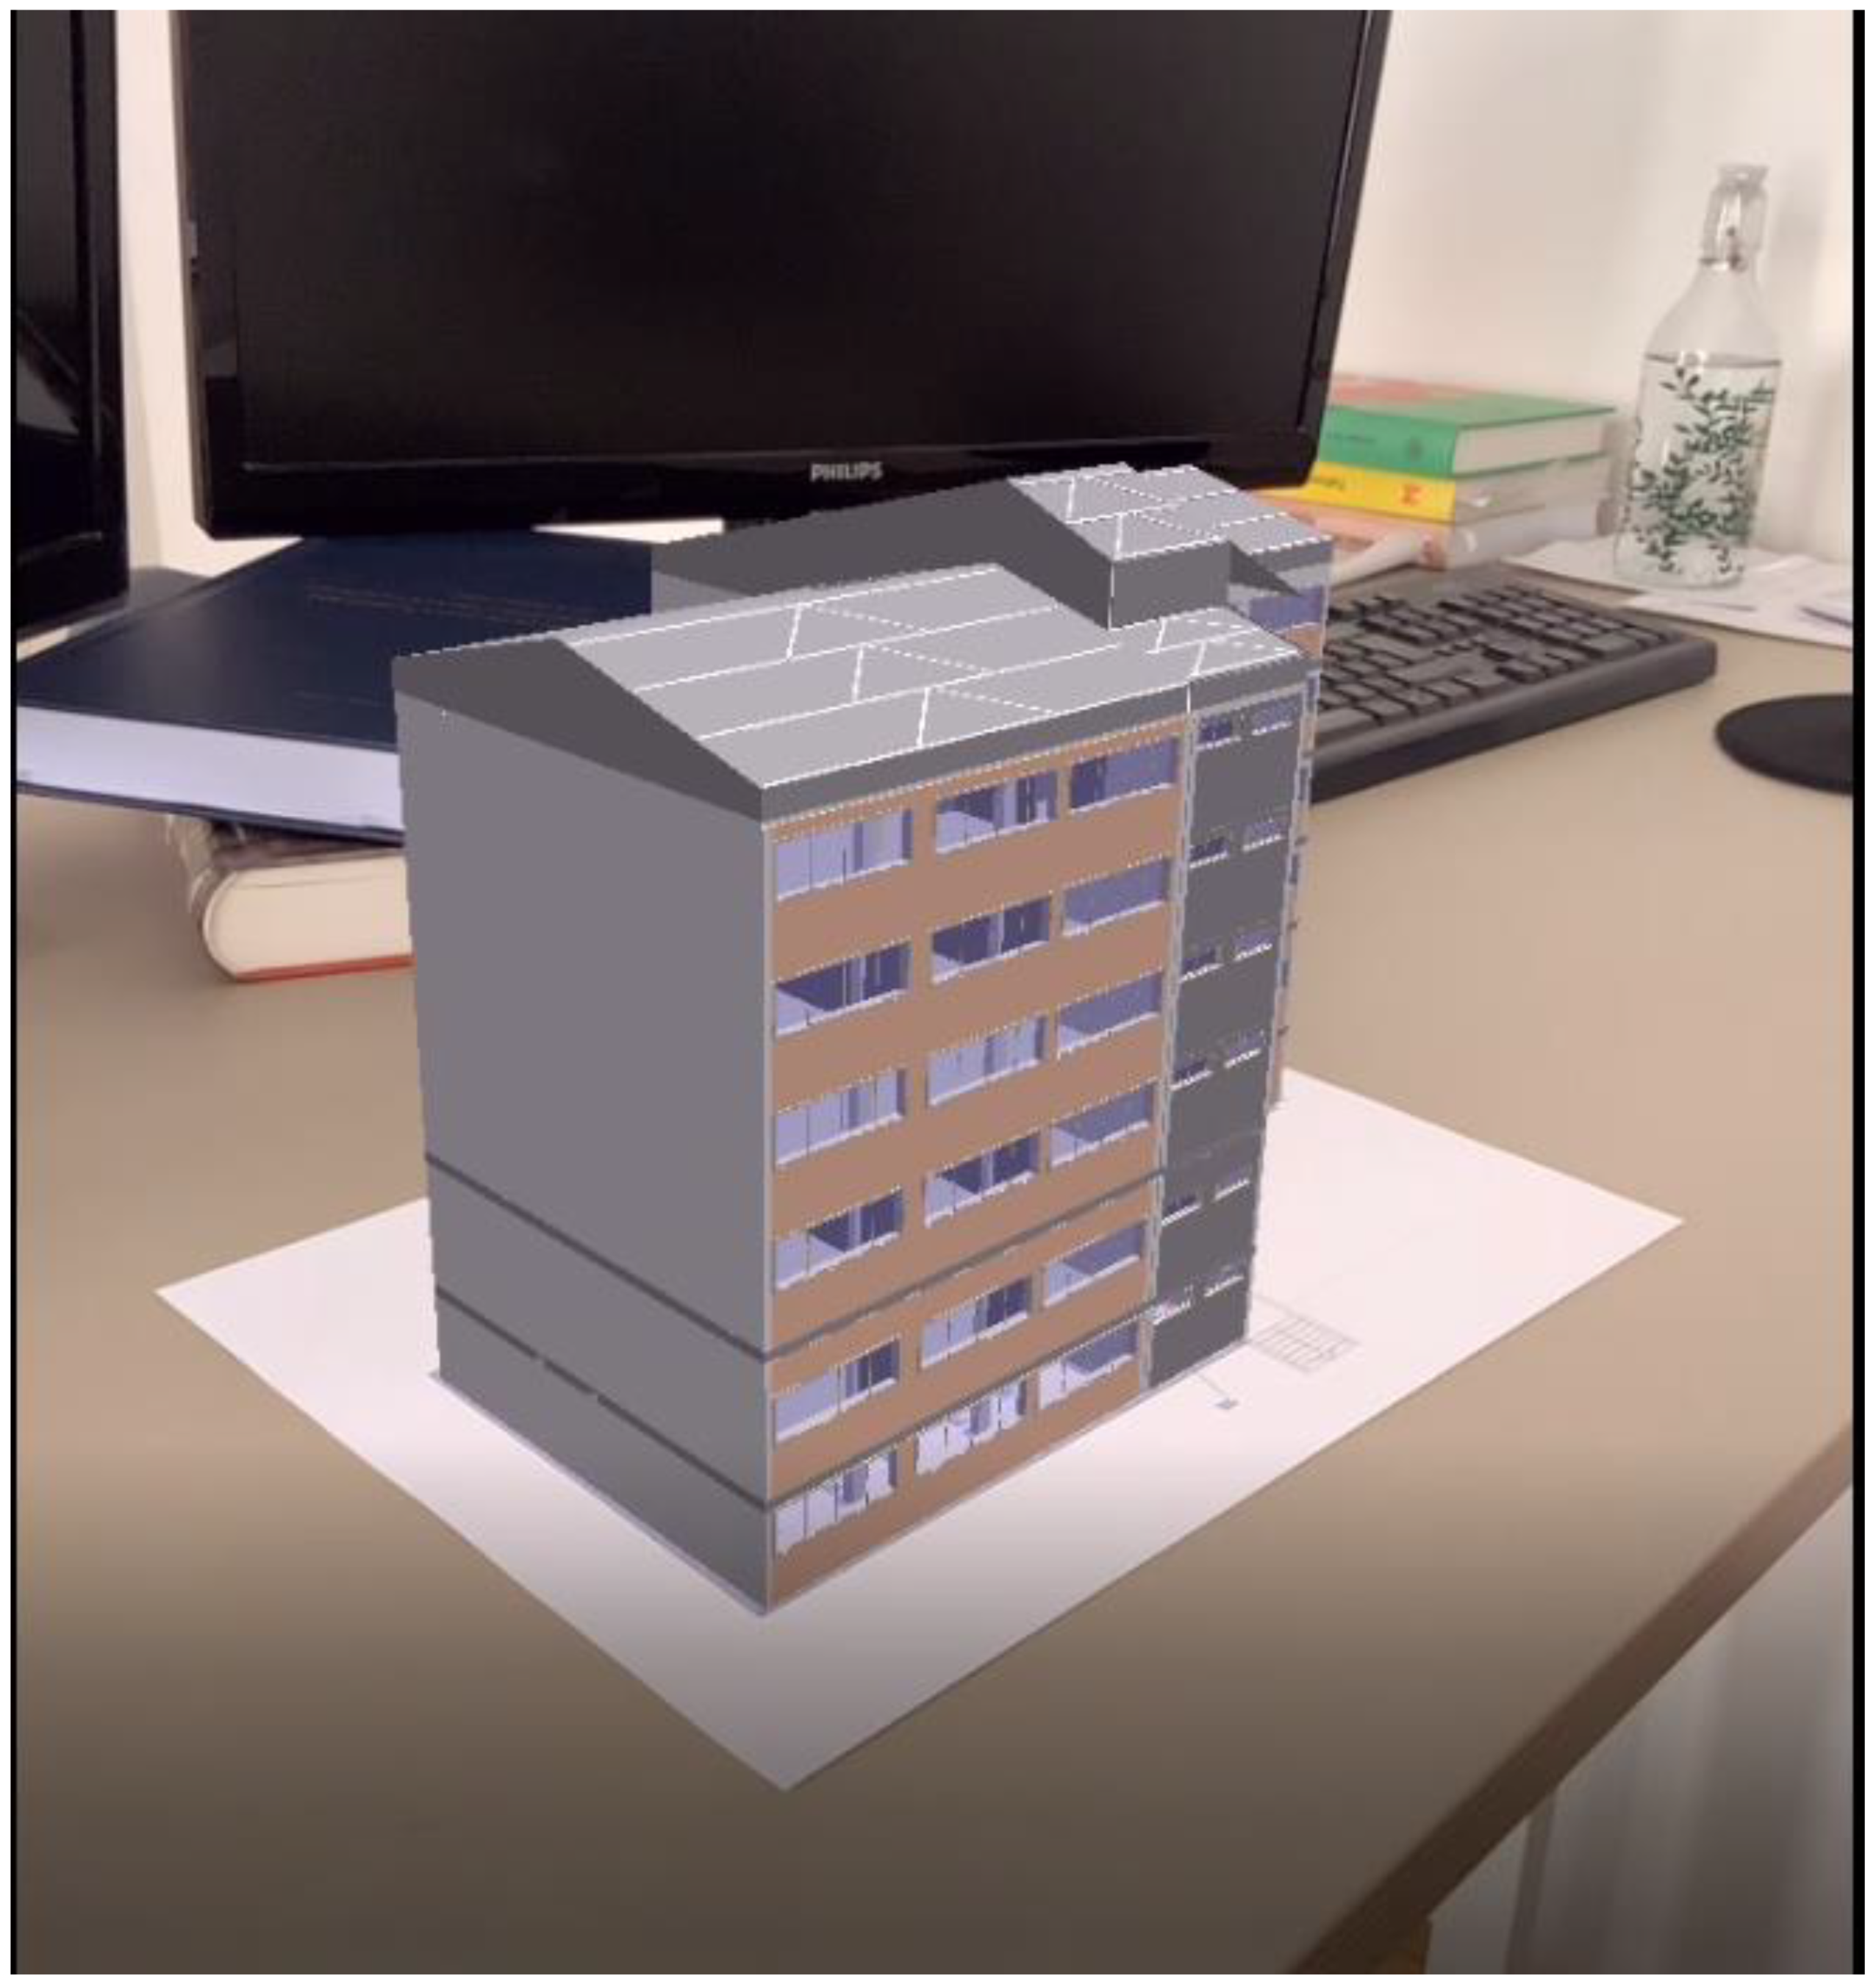
As part of the inspection of the building and determining the dimensions, the object was scanned in detail with a laser scanner and a preliminary cloud of points was created. Laser scanning was conducted over several weeks to create a 3D cloud of points inside and outside of the building. The laser scanner used was a compact Leica BLK360 3D imaging laser scanner with an integrated spherical imaging system and thermography panorama sensor system. Three-dimensional point clouds are delivered with an accuracy of 4 mm at a distance of 10 m with the help of three spherical, panoramic HDR cameras with a thermal imaging camera. To create a precise point cloud, it was necessary to perform one or more scans in each room of the building, i.e., several positions in large spaces such as the roof structure. The laser scanner created a point cloud of the inner part of the building and then a point cloud of the outer part of the building. Eventually, the two point clouds were merged through the Cyclone Field 360 and Register 360 software. To create a precise digital twin using LiDAR technology, the scanner captures 360,000 dots per second from multiple locations within each room with a certain percentage of overlap. With the help of laser scanning, the time spent on documenting and reviewing geometry, especially on large and complex buildings, is significantly shorter. The point cloud was further used to create an accurate 3D model, to create a precise 2D floor plan. To ensure the best results possible, it is favorable to avoid weather conditions for scanning such as rain, snow, fog, or even illumination by the sun. Moreover, highly reflective (polished metal, gloss paint), highly absorbent (black), and translucent (clear glass) surfaces are unfavorable for scanning and should be taped, powdered, or colored if necessary and possible. The whole procedure consists of several steps as seen in Figure 7. When creating point clouds in the field, the Cyclone Field 360 software stores the data, including a 360° image, laser scanning point cloud, and a thermal image. After two scans have been recorded in an adjacent or the same room, making sure that they overlap sufficiently, they should be automatically connected in the field software; if not, they are manually adjusted in the Cyclone Register software. When this step was repeated enough times in all the necessary positions, i.e., on all the floors (Figure 8) with a sufficient percentage of overlap, we obtained a point cloud for the whole building that we could use to create a BIM model. The final point cloud consisted of 225 scans and 2 billion and 300 million points. By obtaining point cloud data we were able to create a precise digital twin.
In order to determine the material mechanical properties of the constructive elements, a detailed visual inspection, and non-destructive and semi-destructive investigative works, were required.
Determination of the compressive strength of concrete was carried out with the standard test method for obtaining and testing drilled cylindrical specimens. The test was carried out in two positions: a concrete column on the ground floor (Figure 9a) and a reinforced concrete wall on the second floor (Figure 9b). Determination of the compressive strength of concrete was performed on extracted samples with a diameter of f100 mm (Figure 10a–c). Extraction, inspection, preparation, testing, and assessment of compressive strength of installed concrete were carried out in accordance with the current Croatian standards [27,28,29,30]. Results of the testing are seen in Table 3. In 2000, the building was tested, and 12 specimens were taken out. In this particular assessment in 2022, just two investigations were carried out and compared to the results from 2000. The results are the almost same. As the building is in heavy use, in consultations with the property owner it was decided that this number of specimens will be enough due to the higher number of specimens in 2000.
To determine the type and amount of reinforcement installed in reinforced concrete, parts of the structures were inspected. Two different methods were used: GPR and removing the concrete cover. Determination of the amount and location of reinforcement was performed with a Profometer 650 Al reinforcement tracker, manufactured by Proceq in Switzerland, and a StructureScan Mini XT georadar, manufactured by GSSI (Figure 11). The operation of the georadar is based on the emission of electromagnetic waves into the material, with the aim of determining the position of objects below the surface. It consists of a transmitting antenna that emits electromagnetic waves, which are then reflected when they encounter an object. The reflected wave is registered by the receiving antenna. A reinforcement finder is a device intended for localization of reinforcement in concrete. In the coil located in the probe of the device, an alternating current is induced which generates an alternating magnetic field. The presence of reinforcing steel in an alternating magnetic field results in the appearance of eddy currents, which also form a magnetic field. This leads to a change in the impedance of the coil, on the basis of which the thickness of the concrete cover and the diameter of the reinforcement are determined.
This method was used in six different positions: column on the ground floor, wall on the first floor, wall (two positions), column, and beam on the second floor. Locations of the reinforcement were detected with the GPR as seen in Figure 12. The spikes in the radargram indicate the location of reinforcements. Too much noise interfered with the detection of the diameter of reinforcement with the Profometer; so, to account for the uncertainty, another method was used to confirm the results.
In the columns on the ground floor and the second floor, and the reinforced concrete beam above, the second-floor concrete cover was removed to inspect the reinforcements (Figure 13).

2.3. BIM Model

Building Information Modeling (BIM) is an innovation that is driving a revolution in modern construction, architecture and engineering. This methodology brings together processes, policies, and technologies that enable collaborative building in virtual space. The implementation of BIM in buildings and infrastructure has been more favorable compared to the traditional procedure, allowing for a reduction in errors and alterations, and improved cost and time analysis. One of BIM’s biggest challenges is managing and sharing large amounts of information between numerous sides involved in a project. BIM allows an organized workflow during the different stages of the project: design, construction, operation, and demolition [31]. As a result, BIM maximizes coordination and, subsequently, productivity [32]. The economic crisis has affected many sectors, including the construction sector. This technology can also play a great role and give attention to adaptive reuse projects, in addition to conservation and restoration projects [33]. Energy efficient policies could also be implemented to modernize old structures with expected reductions in greenhouse gas emissions, energy, electricity and water consumption. The creation of the 3D model requires precise geometric data, which can be measured in a traditional way with tools such as measuring tapes, or in a modern way with advanced instruments and techniques. The most commonly used modern techniques are photogrammetry and laser scanning [34,35]. The use of huge laser scanning point clouds in BIM software is very attractive and has become a reality for software such as Autodesk Revit. With the additional plugins, editing time can be reduced for simple objects, such as walls, windows, beams, etc. One of the issues with BIM is that commercial packages are mostly developed for modern buildings having regular geometry, whereas historic buildings usually have a more complex geometry that cannot be perfectly reconstructed in BIM software. Additional issues concern the distribution of the model between the multiple stakeholders involved in the project. This requires the use of interoperable formats (e.g., IFC) that can provide missing data or smaller conflicts due to incorrect exchange of information.
Each building element must contain certain data and detail requirements to be included in the design, construction, and operation models. To create the most accurate BIM model in Revit (Figure 14 and Figure 15), we used data obtained by laser scanning of the building. The process of creating BIM from laser-scanned data is also known as scan-to-BIM. Although laser scanning shows substantial advantages over other techniques of acquiring a building’s geometry, a critical issue with scan-to-BIM is the large amounts (often millions to billions) of data points in laser scan data. For this reason, once the point clouds are acquired, methodical pre-processing operations are vital to ensure the point clouds finally are of high quality. The point cloud served as the basis for the architectural image combined with the available documentation that was collected and reviewed. One additional use of the BIM model can be in an emerging field of technology, augmented reality (AR). This is an interactive experience of a real-world environment where the computer-generated objects can be seen in the real world. It has continued to develop and has become more pervasive among a wide range of applications. With this technology we can easily monitor a building site in real-time.
The model can be scaled from a smaller size (Figure 16 to a real-size object that can be inspected and compared to an existing building.

3. Seismic Analysis and Assessment—Numerical Modeling

3.1. Development of the Numerical Model

The numerical model for the case study building was developed in the SCIA software [36] for static analysis, using the finite element method (FEM). All load-bearing elements were defined in the model, including RC shear walls, columns, beams, slabs, and the steel structure of the roof. Additional non-bearing elements, such as the façade, roof covers, and windows, were taken into account as an additional dead load (both in kN/m2 and kN/m’). The numerical model includes all three sections (A, B, and C), and is presented in Figure 17, but additional individual models were defined as the sections are structurally independent. The basement was also defined in the model, as it is only partially underground on the east facade, due to denivelation of the terrain.
Walls and slabs were defined as shell elements, with a mesh size of 20 × 20 cm, while the 1D elements were defined with corresponding cross-sections and divided into fragments based on their length to take into account the realistic behavior of the structure. Shear walls and columns were placed on rigid supports on the basement level, in accordance with the guidelines from EN 1998-1. Concrete class C25/30 was used, based on original documentation and in situ tests, with elasticity modulus reduced by 50% to take into account the cracking of existing concrete. All steel elements (roof and additional bracing) were modeled with a steel class of S235 without any modifications to the material properties (all steel elements were added in 2000). Steel braces were defined as “truss” elements, which transfer only axial loads.

3.1.1. Definition of Seismic Load

A total of four load groups were defined in the model, including permanent load (self-weight and additional dead load), soil pressure (on basement walls based on terrain level), variable loads (wind, snow, and variable imposed load for office buildings), and seismic loads. Over 50 load combinations were created for Ultimate Limit State (ULS), 30 combinations were created for Serviceability Limit State (SLS), and 8 seismic combinations were used.
Seismic load was defined with seismic response spectrums, developed using PGA and soil type. As there were no geotechnical measurements and available data, the soil category (according to EN 1998-1) was assumed as C, based on the previous experience and data sets for Zagreb. PGAs on the location were obtained using the seismic map of Croatia, for three different return periods as given in Table 4. For each of the three PGAs, the seismic response spectrum was defined, using behavior factor 1.00 for a 95-year return period, and 1.5 for 225- and 475-year return periods.
Linear modal analysis was performed for each of the three defined spectrums, taking into account 20 eigenmodes, using the Lanczos calculation method. The analysis was performed on each of the three individual models as the behavior of each section is independent (they are not physically connected). By doing so, the maximum displacement of each section was obtained, and could be used for validation of the seismic joint between them. The problem with this type of analysis is that it does not take into account the structures adjacent to the case study building,

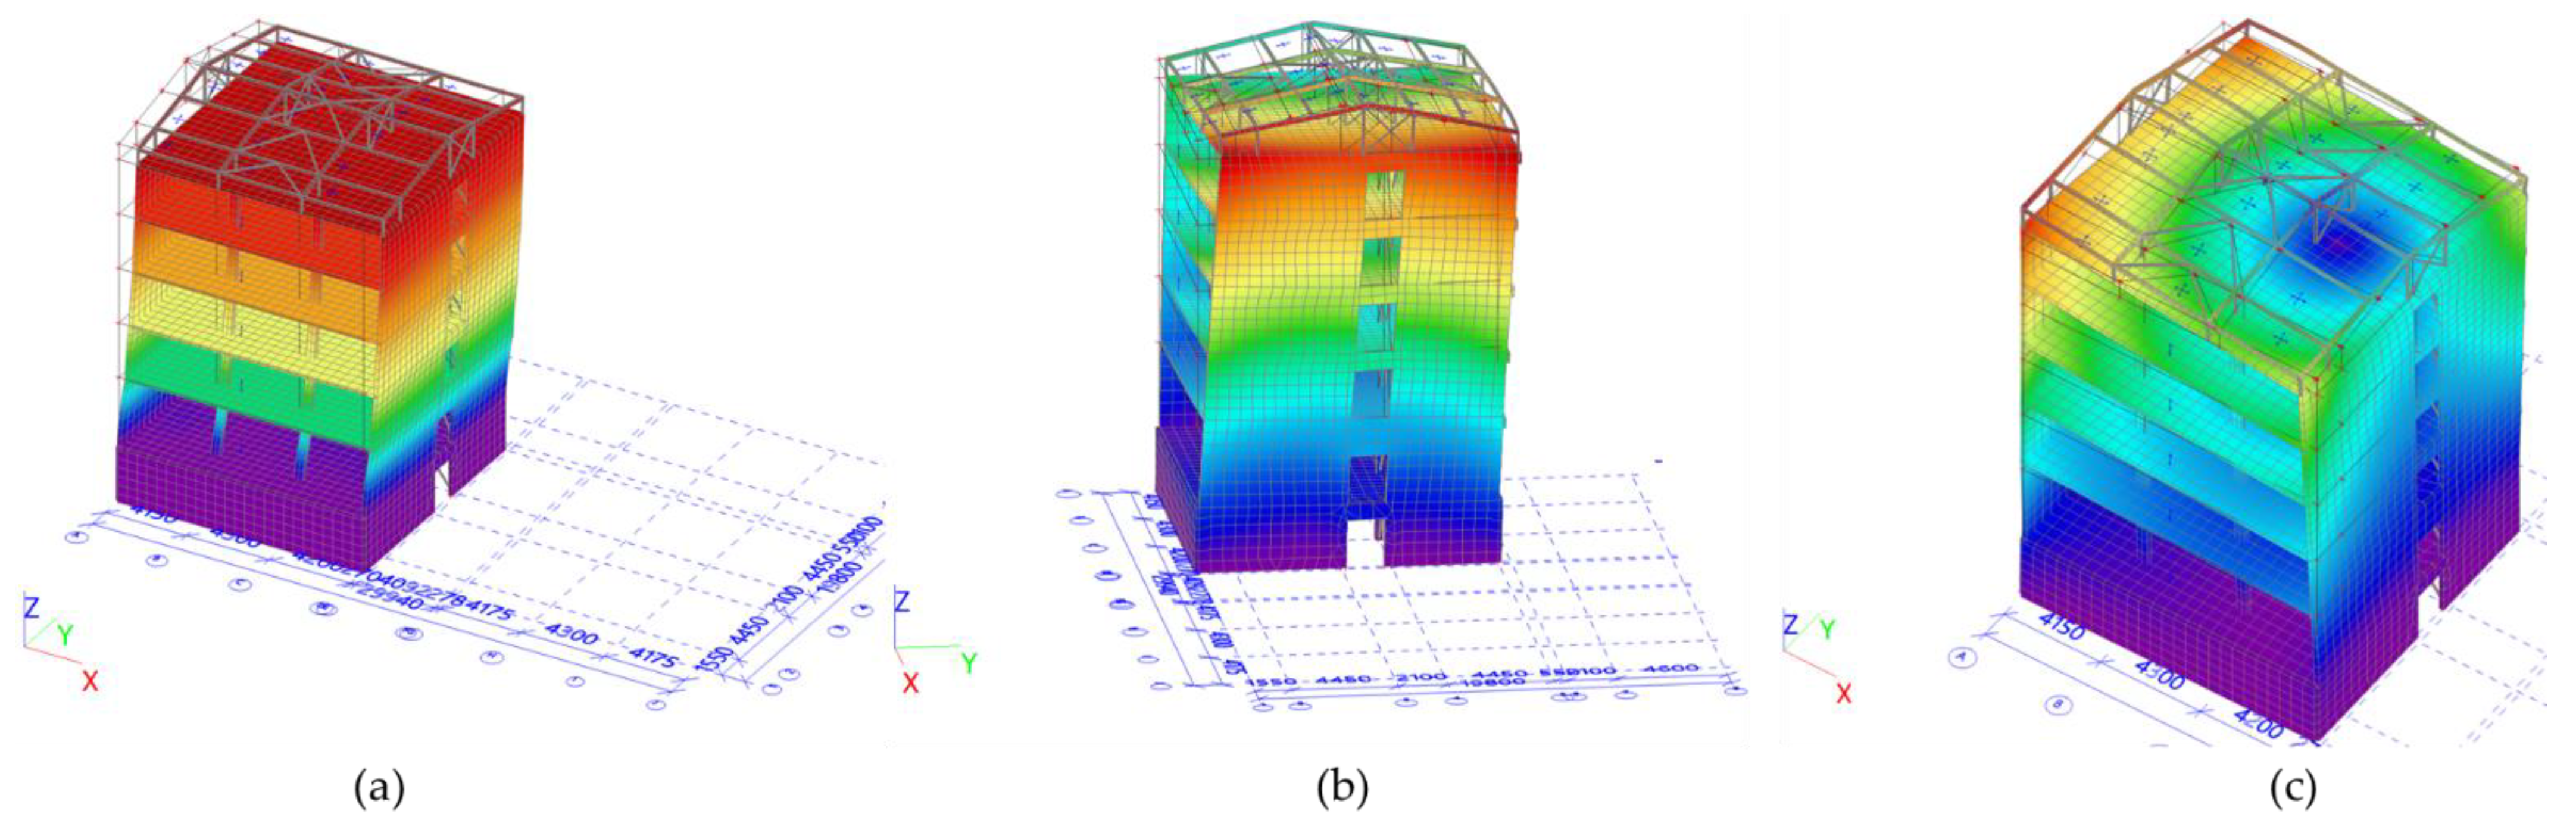
3.1.2. Modal Analysis—Eigenmodes and Displacements

Complete results of the modal analysis are not given, as they would exceed the scope of this paper. As Sections A and C are similar and have almost identical results, only sections A and B are presented with graphic representations of the eigenmodes. Figure 18 presents the three dominant modes for Section A, while Section B is given in Figure 19.
The results for Section A (similar to C) show that the first natural period is in the direction of the frames and steel braces (direction X). Section B consists only of shear walls, but those in direction Y are much longer and, therefore, its first period is also in direction X. These preliminary results prove the initial assumptions that all three sections have insufficient lateral stiffness in the dominant translational direction (X). The analysis for Sections A and C was performed without the steel braces to validate the numerical model. Results proved that the addition of the braces increased the lateral stiffness, but not enough to satisfy the requirements of EN 1998-3.
In addition to the analysis of eigenmodes and the behavior of the structure, the global analysis of displacements was conducted, using the response spectrum for 95 years and behavior factor 1. The results are given in Table 5, Table 6 and Table 7, for global displacements (EN 1990), inter-story drift (EN 1998), and seismic joints (EN 1998). All global validations regarding displacement for all three sections were verified.

3.1.3. Modal Analysis—ULS Verifications

Shear walls and frames (columns and beams) were validated using the obtained base shear forces induced by the seismic load in two main directions (X and Y). The verifications were conducted using the EN 1998-3 guidelines.
As the natural period in direction of shear walls is lower for Sections A and C, these walls transfer the majority of seismic forces to the foundations. Due to their dimensions, they could be assessed as squat walls (according to EN 1998-3), and were validated only for normalized axial force and shear failure. The described procedure was conducted on all walls, but only axis A (direction Y) is presented here. Obtained load effects for the wall in axis A, along with its material characteristics, are given in Table 8.
The condition for shear walls with middle ductility (DCM) is that the maximum normalized axial force should not be over 40%. If the amount is over the threshold, the ductility of the shear wall is reduced and needs to be taken into account in the assessment. The validation is given with Equation (1).
ν Ed = N Ed b w l w f cd = 4531.32 30 1255 1.667 = 0.046 = 4.60 % < 40 %
Required ductility of the wall ( μ ϕ ) can be obtained using the behavior factor (q0) and first period (T1):
μ ϕ = 1 + 2 q 0 1 T C T 1 = 1 + 2 1.5 1 · 0.60 0.50 = 2.20
As the reinforcing steel is plain bars with the steel class of GA 240/330, the required ductility is increased by 50% and is taken into account as 3.30.
Shear failure verification for squat walls was obtained using total shear resistance VRd,s, given in Equation (3) as the sum of Vdd, Vid, and Vfd, which represent the resistance of the vertical reinforcement, the resistance of the skewed reinforcement, and the resistance due to friction, respectively.
V Rd , s = V dd + V id + V fd V dd = m i n 1.3 A s j f c d f y d 0.25 f y d A s j V id = A s j f y d c o s φ V fd = m i n μ f A s j f y d + N Ed ξ + M Ed / z 0.5 η f c d ξ l w b w 0
In situ testing (Section 3.1.3.) showed that the shear walls are reinforced with an uneven mesh on each side of the wall, consisting of Ø8 bars spaced 15 cm in the vertical direction and 25 cm in the horizontal direction. It is assumed that the corners of each wall are reinforced with four Ø20 plain bars. The shear failure verification was conducted for each wall on each story, and an example of the results is given in Table 9 for axis A on the basement level. As the shear force VEd exceeds VRd,s, the wall was not validated as safe.
Results for other walls on all stories showed that for a PGA with a return period of 475 years, all walls were validated for the maximum normalized axial force, but not the shear failure (the majority of walls were validated only on the top two floors).
Validation of RC frames was conducted separately for columns and beams, which were assessed for both bending and hogging moment, shear, and axial force (only columns). Only the results for the frame in Section A are presented, as they are similar to those of Section C. Load effects were obtained from the calculation, as shown in Table 10. Built-in reinforcement was obtained from in situ measurements (Section 3.1.3.); columns are reinforced with 10 Ø25 plain bars in the basement and ground floor, and 4 Ø25 on upper floors, with Ø8 stirrups every 25 cm. As beams are connected to the slabs, only reinforcement in a lower zone was obtained, as 2 Ø25 bars with Ø8 stirrups ranging from 8 cm on the support to 25 cm in the middle of the span.
ULS verifications were conducted and are presented (Table 11) in the form of utilization [%] for each check; utilization for hogging moment on the beam is not given as the reinforcement in the upper zone was not available from the measurements. It is clear that the column lacks stirrups for the confinement of the longitudinal reinforcement, as the required spacing is around 14 cm while the measured value is 25 cm. For the beam, the shear force on the support is around the threshold, with the required spacing of 7.77 cm, while 8 cm was obtained with measurements.
Steel bracings in the edge spans of the frames were also validated, with the utilization of around 55%, proving that they can transfer the portion of the seismic force, but the strengthened frame still lacks adequate lateral stiffness.
The presented procedure for the ULV verifications was re-performed for PGA values obtained for both 225- and 95-year return periods. In accordance with Level 3 of the Croatian standard for post-earthquake reconstruction [14], the PGA for 225 years was chosen as the required seismic demand for the case study building.
The summary of the results showed that the shear failure of walls (basement and ground floor), and shear failure of columns, are the main issues that need to be addressed with the strengthening project. Additionally, global modal analysis proved that all three sections lack lateral stiffness in direction X.

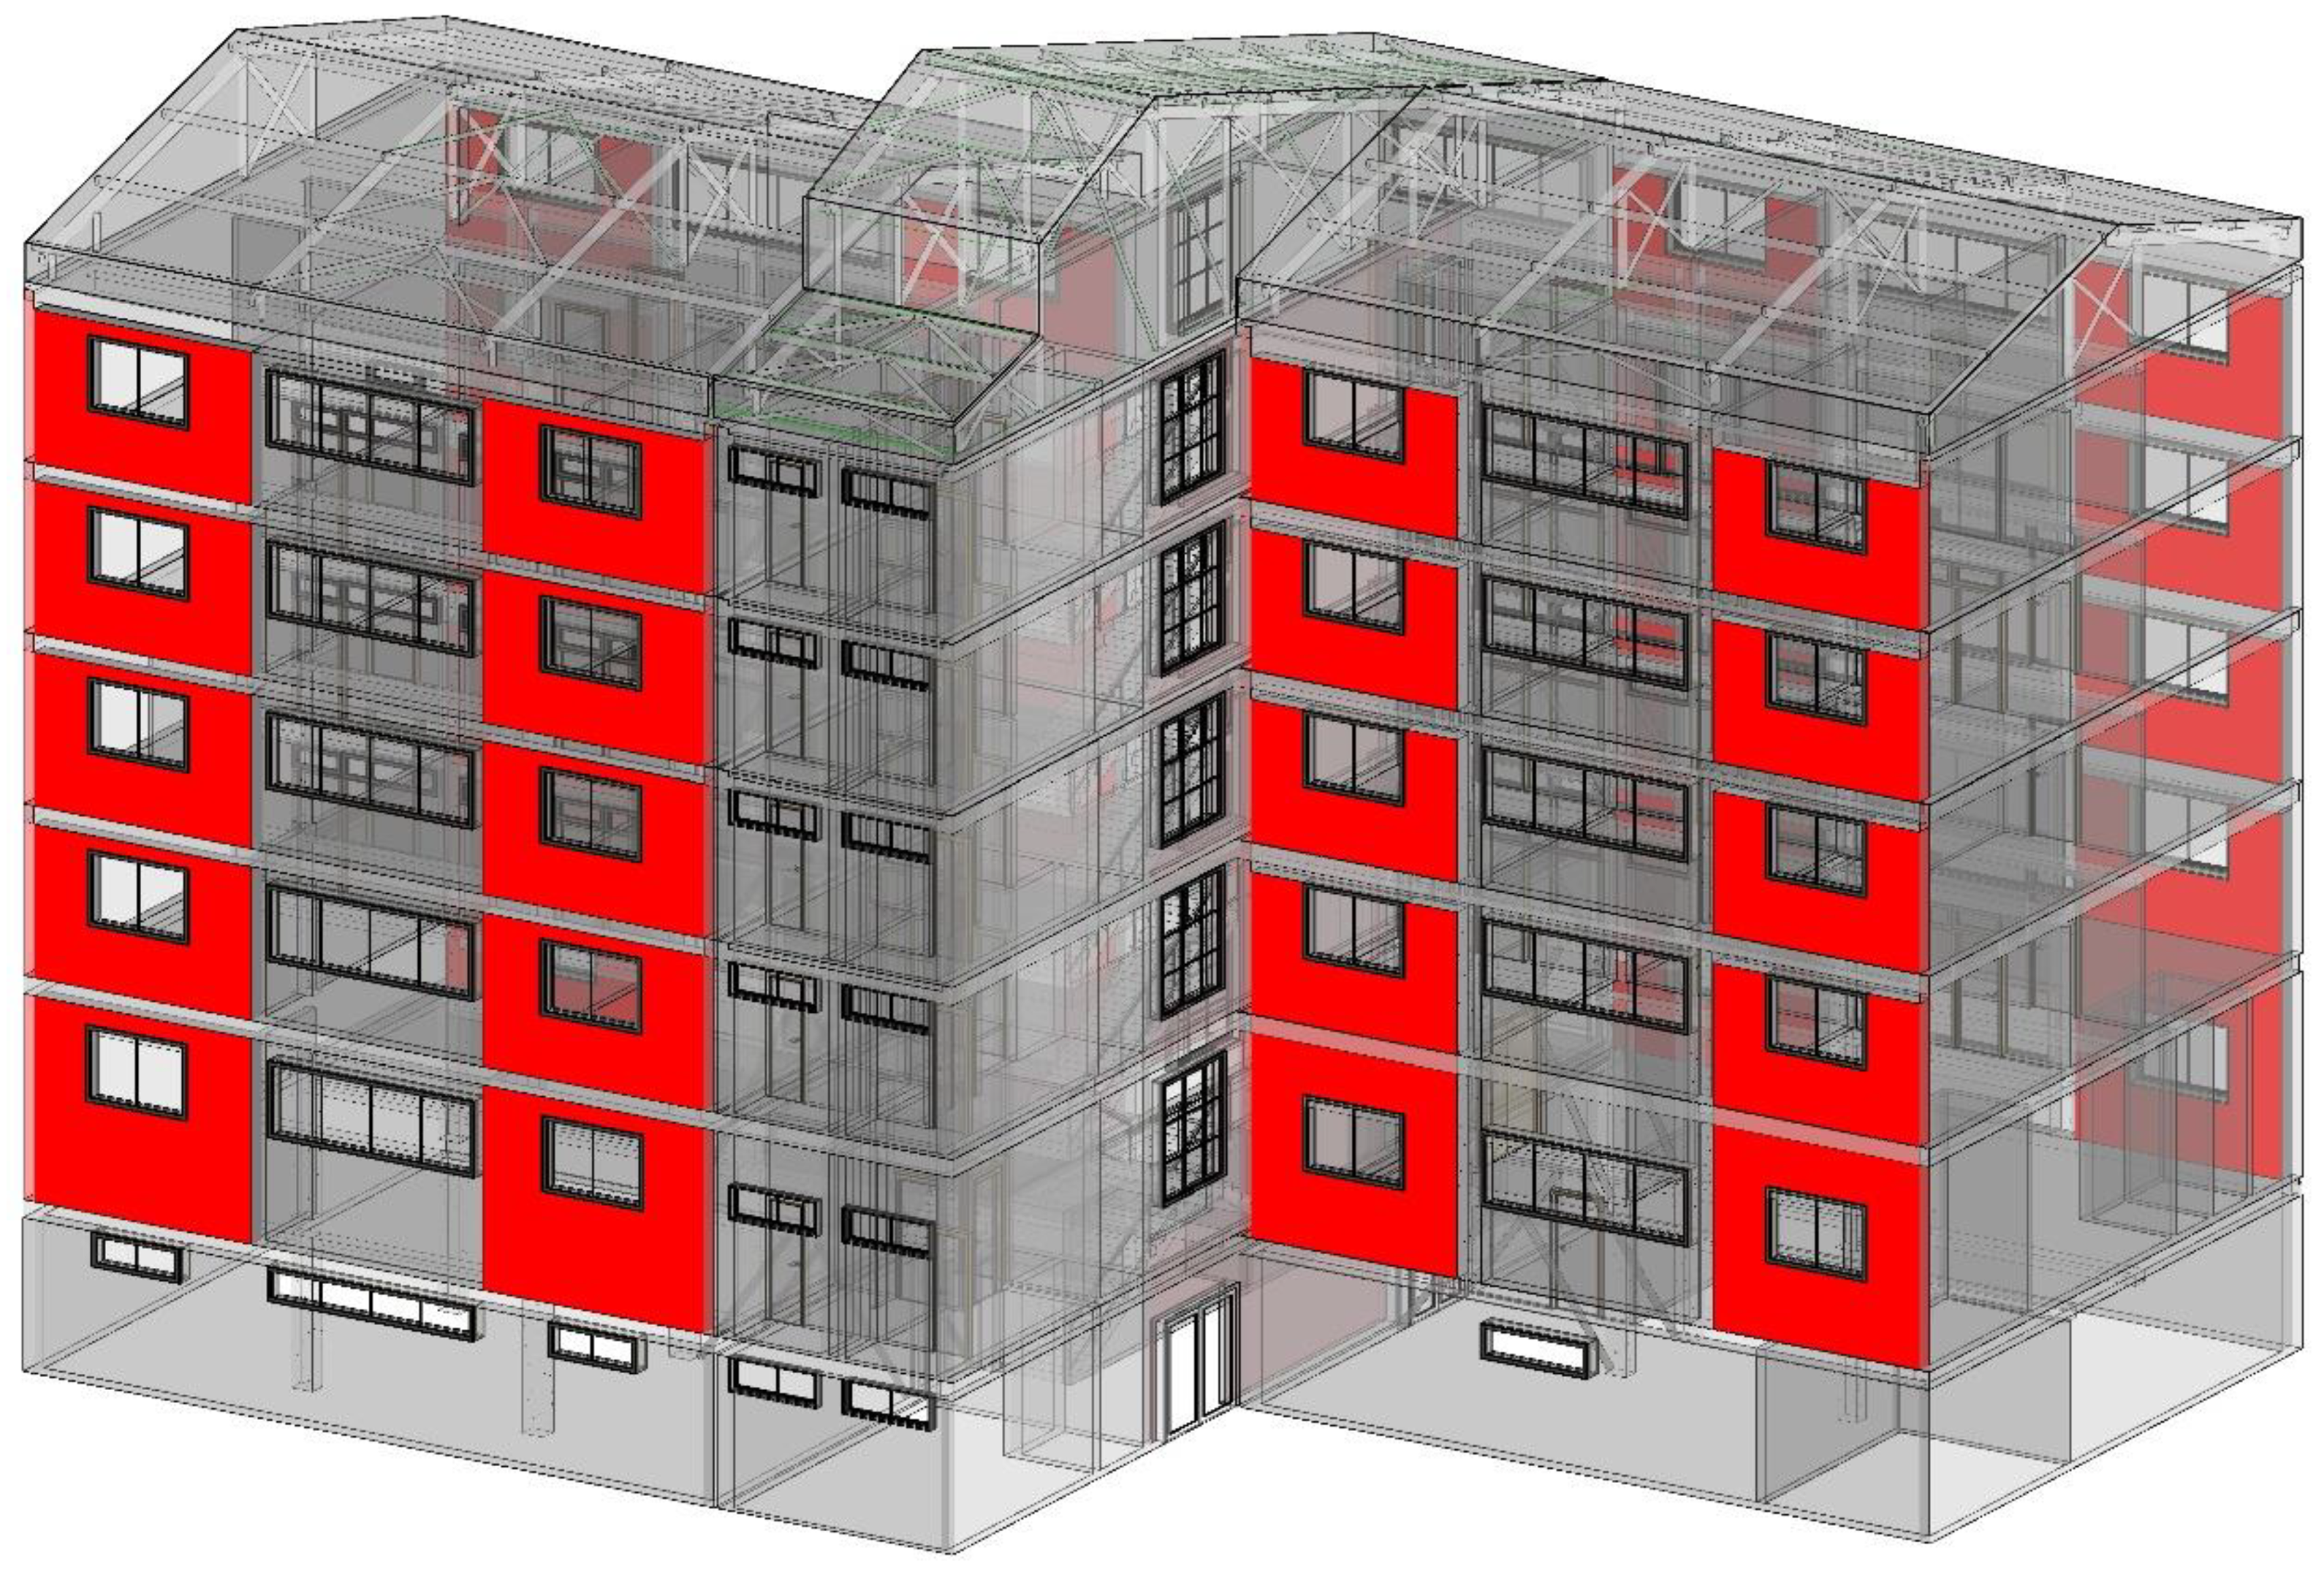
3.2. Strengthening Proposals—Case Study Building

In accordance with the results, several preliminary solutions for strengthening are given. The first solution, using FRP laminating [37] of beams and columns addresses only the local ULS verifications (beams and columns), while the global behavior of the structure remains the same. This solution is similar to FRP jacketing, which, unlike the RC or steel jacketing, does not influence the stiffness of the elements. An example of the FRP laminating of the existing R frames and beam–column joints is given in [38], along with experimental and analytical verifications. Frames that require FRP jacketing are presented in Figure 20. In addition to FRP, shear walls in the basement and ground floor also require strengthening, which can be done using shotcreting. This method is based on applying a new layer of reinforcement (mesh) on the face of the wall, anchoring the reinforcement both to the existing concrete and existing (or new) foundation. After the reinforcement is positioned, the concrete is applied to the wall using a high–pressure spray gun, typically with a thickness of 5 to 8 cm. By doing so, the cross-section and ductility of the shear wall are increased.
An alternative solution for strengthening is the installation of additional steel bracing in the RC frames. The bracing is defined similarly to the existing bracing, but in the opposite span, as presented in Figure 21. By doing so, both the global and local issues are addressed. The bracings increase the stiffness of the structure in direction X, while at the same time transferring the portion of the force to the foundations, and reducing the span of the beams. Nevertheless, preliminary calculations showed that the additional bracings should have stronger steel profiles than the existing bracing. In this solution, shear walls also require shotcrete strengthening.
In addition to the steel bracing used to transfer the seismic forces to the foundations, an alternative is to use dissipative bracings, which have the ability to dissipate the lateral forces using dampers. An example of dissipative bracings can be found in [39], where the fluid viscous dampers (FVDs) are used in braces on multistory timber structures. This solution requires more advanced non-linear analysis and will therefore be considered in the second phase of the project.
The only proposed solution which does not interfere with the interior is the construction of the new perimeter RC walls in direction X on all sections. In this approach, the global behavior of the structure would change completely, as the first natural period would now be in direction Y, due to the increased stiffness of direction X. By doing so, the structure would have more evenly distributed stiffness and the eigenmodes would be more regular. Furthermore, the perimeter RC walls (shown in Figure 22) would transfer the majority of the seismic force, and the existing frames would fulfill ULS verifications without any measures. However, this solution is the most expensive, as it requires total reconstruction of the east and west facade.
The final strengthening proposition can be compared to that with additional steel bracings, but it is based on the installation of the new steel frames within the existing RC frames. The visual representation is given in Figure 23. The main idea is to provide a steel exoskeleton that would transfer the majority of the lateral forces directly to the foundations. By doing so, the stiffness of the structure in direction X is increased, and the existing RC beams and columns transfer only vertical loads, meaning that they do not require any seismic verification. The challenge with this type of strengthening is the connection of steel frames along with the stories, as the connection should be constructed through the existing RC slab. New frames consist of two vertical columns, connected to the RC columns, one horizontal profile, connected to the RC beam, and steel tube bracings. Preliminary analysis shows that the approximate increase in stiffness is around 30% in direction X.

4. Discussion and Conclusions

Standards and codes for the design of RC structures have been continuously developing throughout history, and from a layman’s point of view, their evolution can be seen as increasingly strict structural requirements. This trend is most pronounced in the standards for seismic design. It was often the case that the seismic standards were revised and updated after catastrophic earthquakes, for example, in Japan after the Great Hanshin Earthquake, or in the USA after the Loma Prieta earthquake [17]. A similar trend is obvious in Croatia, an earthquake-prone region, and the case study building is an excellent example. It was designed and built in the 1970s, then revised and strengthened according to the updated codes from the end of the century. Finally, a new assessment showed that, even with the strengthening, it does not meet the requirements of the current design and assessment codes. In addition to the structural analysis, a preliminary cost–benefit analysis was conducted for each of the strengthening proposals, which are summarized in Table 12. Taking into account global and local effects, total costs, and availability of the structure during construction works, the proposal with new steel frames (No. 4 in Table 12) was chosen as the optimal solution for the case study building. This choice will be validated with a more complex analysis and detailed cost–benefit study in the next phase of the project.
With the use of modern technologies, condition assessment and seismic upgrading can become more cost beneficial than before. Laser scanning and BIM implementation have helped in decreasing the time spent on gathering information and, most importantly, will aid future strategies for renovation. In this project, scan-to-BIM was used to generate a digital twin, which was later used by multiple stakeholders involved in this project. Further possibilities in using modern technologies are developing cloud-to-BIM-to-FEM [40] or scan-to-FEM [41] software. They further reduce the time spent gathering information and designing. The idea is to use a semi-automatic procedure [42] which can be used to transform three-dimensional point clouds of complex objects into three-dimensional finite element models. The procedure aims to solve problems connected to generating finite element models of complex structures with a model ready to be used for structural analysis.
In addition to seismic upgrading, the nZEB target requires an integrated improvement of both the building elements and systems. The external walls will be insulated with additional thermal insulation from the inside. This will reduce the heating demand and the peak heating and cooling load, and thus contribute to energy cost saving. Decarbonized energy will be used, generated on-site from renewable sources. Heating and cooling energy will be generated in a heat pump using underground water, and electricity will be generated by photovoltaic system. A new LED lighting system will be installed and electric vehicle chargers will be available. All building systems will be fully digitalized, enabling smart building services. These are aimed at energy consumption and cost management, indoor comfort improvement, grid flexibility, and energy storage.
The presented integrated approach, which includes both seismic and energy consumption upgrading, should be used as a model approach when dealing with existing structures (both public and residential). From the structural point of view, the case study building did not suffer extensive damage during the recent earthquakes. However, it should be seen as a warning, because the City of Zagreb is located in a seismic area where stronger earthquakes can be expected in the future.
The first part of the seismic assessment procedure is presented in this paper, along with the numerical modeling based on laser scanning and BIM implementation. These are to be followed with more complex analyses, including the non-linear pushover method, and the strengthening proposals will be updated accordingly. The project team has been chosen and the design documentation for the specific building systems is under development. The design process has been documented, for use in the training of designers for nZEB refurbishments. The aim of this project is also to promote the nZEB standards to local government, so that the strategic value and environmental benefits of such projects can be recognized and the governance responsibility can be taken on, with local governments becoming initiators and stakeholders in improving the built environment.

Author Contributions

Conceptualization, M.S. and D.S.; methodology, M.S., D.S., K.O. and M.Z.; software, D.S. and K.O.; validation, M.S., D.S., K.O. and M.Z.; formal analysis, M.S., D.S., K.O. and M.Z.; investigation, M.S., D.S., K.O. and M.Z.; resources, M.S., D.S., M.Z. and M.V.; data curation, M.S., D.S. and K.O.; writing—original draft preparation, M.S., D.S., K.O. and M.Z.; writing—review and editing, M.S., D.S., K.O., M.Z. and M.V.; visualization, M.S., D.S., K.O. and M.Z.; supervision, M.S. and D.S.; project administration, M.S. and M.Z.; funding acquisition, M.S. All authors have read and agreed to the published version of the manuscript.

Funding

This research is funded by EEA Grants (Energy and Climate Change Programme) under the name: Establishment of the national training centre for nearly Zero Energy Buildings (nZEB). Also it was partially funded by Croatian Science Foundation, grant number UIP-2019-04-3749 (ARES project—Assessment and rehabilitation of existing structures—development of contemporary methods for masonry and timber structures).

Institutional Review Board Statement

Not applicable.

Informed Consent Statement

Not applicable.

Conflicts of Interest

The authors declare no conflict of interest.

References

  1. Penna, A.; Morandi, P.; Rota, M.; Manzini, C.F.; da Porto, F.; Magenes, G. Performance of Masonry Buildings during the Emilia 2012 Earthquake. Bull. Earthq. Eng. 2014, 12, 2255–2273. [Google Scholar] [CrossRef]
  2. Mazzoni, S.; Castori, G.; Galasso, C.; Calvi, P.; Dreyer, R.; Fischer, E.; Fulco, A.; Sorrentino, L.; Wilson, J.; Penna, A.; et al. 2016–2017 Central Italy Earthquake Sequence: Seismic Retrofit Policy and Effectiveness. Earthq. Spectra 2018, 34, 1671–1691. [Google Scholar] [CrossRef]
  3. Bilgin, H.; Shkodrani, N.; Hysenlliu, M.; Ozmen, H.B.; Isik, E.; Harirchian, E. Damage and Performance Evaluation of Masonry Buildings Constructed in 1970s during the 2019 Albania Earthquakes. Eng. Fail. Anal. 2022, 131, 105824. [Google Scholar] [CrossRef]
  4. Vlachakis, G.; Vlachaki, E.; Lourenço, P.B. Learning from Failure: Damage and Failure of Masonry Structures, after the 2017 Lesvos Earthquake (Greece). Eng. Fail. Anal. 2020, 117, 104803. [Google Scholar] [CrossRef]
  5. Cetin, K.O.; Altun, S.; Askan, A.; Akgün, M.; Sezerm, A.; Kıncal, C.; Özkan, C.Ö.; İpek, Y.; Unutmaz, B.; Gülerce, Z.; et al. The Site Effects in Izmir Bay of 30 October 2020, M7.0 Samos Earthquake. Soil Dyn. Earthq. Eng. 2022, 152, 107051. [Google Scholar] [CrossRef]
  6. Stepinac, M.; Lourenço, P.B.; Atalić, J.; Kišiček, T.; Uroš, M.; Baniček, M.; Šavor Novak, M. Damage Classification of Residential Buildings in Historical Downtown after the ML5.5 Earthquake in Zagreb, Croatia in 2020. Int. J. Disaster Risk Reduct. 2021, 56, 102140. [Google Scholar] [CrossRef]
  7. Government of the Republic of Croatia; The World Bank. The Croatia Earthquake—Rapid Damage and Need Assessment 2020; Government of Croatia: Zagreb, Croatia, 2020.
  8. Stepinac, M.; Kisicek, T.; Renić, T.; Hafner, I.; Bedon, C. Methods for the Assessment of Critical Properties in Existing Masonry Structures under Seismic Loads—The ARES Project. Appl. Sci. 2020, 10, 1576. [Google Scholar] [CrossRef]
  9. Vlašić, A.; Srbić, M.; Skokandić, D.; Ivanković, A.M. Post-Earthquake Rapid Damage Assessment of Road Bridges in Glina County. Buildings 2022, 12, 42. [Google Scholar] [CrossRef]
  10. Moretić, A.; Stepinac, M.; Lourenço, P.B. Seismic Upgrading of Cultural Heritage—A Case Study Using an Educational Building in Croatia from the Historicism Style. Case Stud. Constr. Mater. 2022, 17, e01183. [Google Scholar] [CrossRef]
  11. Republic of Croatia, Ministry of Physical Planning, Construction and State Assets. Croatian Technical Regulation for Building Structures; Official Gazette 17/17, 75/20, 7/22; Ministry of Physical Planning, Construction and State Assets: Zagreb, Croatia, 2022. (In Croatian)
  12. Goverment of Croatia. Integrated National Energy and Climate Plan for the Republic of Croatia for the Period 2021–2030; Government of Croatia: Zagreb, Croatia, 2019.
  13. Goverment of Croatia. Long-Term Strategy for Refurbishment of National Building Stock until 2050; Government of Croatia: Zagreb, Croatia, 2020.
  14. Law on the Reconstruction of Earthquake-Damaged Buildings in the City of Zagreb, Krapina-Zagorje County and Zagreb County (NN 102/2020). Available online: https://mpgi.gov.hr/naslovna-blokovi-133/singled-out/reconstruction-of-the-city-of-zagreb-and-krapina-zagorje-county/reconstruction-of-earthquake-damaged-buildings-in-the-city-of-zagreb-and-krapina-zagorje-county/13723 (accessed on 1 June 2022).
  15. EN 1998–1; Eurocode 8: Design of Structures for Earthquake Resistance—Part 1: General Rules, Seismic Actions and Rules for Buildings. European Committee for Normalization: Brussels, Belgium, 2004.
  16. EN 1998–3; Eurocode 8: Design of Structures for Earthquake Resistance—Part 3: Assessment and Retrofitting of Buildings. European Committee for Standardization: Brussels, Belgium, 2004.
  17. Skokandić, D.; Vlašić, A.; Kušter Marić, M.; Srbić, M.; Mandić Ivanković, A. Seismic Assessment and Retrofitting of Existing Road Bridges: State of the Art Review. Materials 2022, 15, 2523. [Google Scholar] [CrossRef]
  18. Penelis, G.G.; Penelis, G.G. Concrete Buildings in Seismic Regions; CRC Press: Boca Raton, FL, USA, 2018. [Google Scholar]
  19. Sajid, S.H.; Ali, S.M.; Carino, N.J.; Saeed, S.; Sajid, H.U.; Chouinard, L. Strength Estimation of Concrete Masonry Units Using Stress-Wave Methods. Constr. Build. Mater. 2018, 163, 518–528. [Google Scholar] [CrossRef]
  20. Mesquita, E.; Martini, R.; Alves, A.; Antunes, P.; Varum, H. Non-Destructive Characterization of Ancient Clay Brick Walls by Indirect Ultrasonic Measurements. J. Build. Eng. 2018, 19, 172–180. [Google Scholar] [CrossRef]
  21. Martini, R.; Carvalho, J.; Barraca, N.; Arêde, A.; Varum, H. Advances on the Use of Non-Destructive Techniques for Mechanical Characterization of Stone Masonry: GPR and Sonic Tests. Procedia Struct. Integr. 2017, 5, 1108–1115. [Google Scholar] [CrossRef]
  22. Wai-Lok Lai, W.; Dérobert, X.; Annan, P. A Review of Ground Penetrating Radar Application in Civil Engineering: A 30-Year Journey from Locating and Testing to Imaging and Diagnosis. NDT E Int. 2018, 96, 58–78. [Google Scholar] [CrossRef]
  23. Meola, C. Infrared Thermography of Masonry Structures. Infrared Phys. Technol. 2007, 49, 228–233. [Google Scholar] [CrossRef]
  24. Santini, S.; Forte, A.; Sguerri, L. The Structural Diagnosis of Existing Rc Buildings: The Role of Nondestructive Tests in the Case of Low Concrete Strength. Infrastructures 2020, 5, 100. [Google Scholar] [CrossRef]
  25. Kušter Marić, M.; Vlašić, A.; Ivanković, A.M.; Bleiziffer, J.; Srbić, M.; Skokandić, D. Assessment of Reinforcement Corrosion and Concrete Damage on Bridges Using Non-Destructive Testing. Gradjevinar 2019, 71, 843–862. [Google Scholar] [CrossRef]
  26. Carpinteri, A.; Lacidogna, G. Une Approche Fractale Pour La Détection de Dommages Aux Structures de Béton et de Maçonnerie Par Les Techniques d’ Émission Acoustique; Bruit: Paris, France, 2019. [Google Scholar]
  27. HZN HRN EN 12504–1:2019; Ispitivanje Betona u Konstrukcijama—1. Dio: Izvađeni Ispitni Uzorci—Uzimanje, Pregled i Ispitivanje Tlačne Čvrstoće. Croatian Standards Institute: Zagreb, Croatia, 2019.
  28. HZN HRN EN 12390–3:2019; Ispitivanje Očvrsnuloga Betona—3. Dio: Tlačna Čvrstoća Ispitnih Uzoraka. Croatian Standards Institute: Zagreb, Croatia, 2019.
  29. HZN HRN EN 13791:2019; Ocjena in-Situ Tlačne Čvrstoće u Konstrukcijama i Predgotovljenim Betonskim Dijelovima. Croatian Standards Institute: Zagreb, Croatia, 2019.
  30. HZN HRN EN 206:2016; Beton—Specifikacija, Svojstva, Proizvodnja i Sukladnost. Croatian Standards Institute: Zagreb, Croatia, 2016.
  31. Wang, X. BIM Handbook: A Guide to Building Information Modeling for Owners, Managers, Designers, Engineers and Contractors. Constr. Econ. Build. 2012, 12, 101–102. [Google Scholar] [CrossRef]
  32. Chelson, D.E. The Effects of Building Information Modeling on Construction Site Productivity. Ph.D. Thesis, University of Maryland, College Park, MD, USA, 2010. Volume 53. [Google Scholar]
  33. Shipley, R.; Utz, S.; Parsons, M. Does Adaptive Reuse Pay? A Study of the Business of Building Renovation in Ontario, Canada. Int. J. Herit. Stud. 2006, 12, 505–520. [Google Scholar] [CrossRef]
  34. Pepe, M.; Costantino, D.; Garofalo, A.R. An Efficient Pipeline to Obtain 3D Model for HBIM and Structural Analysis Purposes from 3D Point Clouds. Appl. Sci. 2020, 10, 1235. [Google Scholar] [CrossRef] [Green Version]
  35. Remondino, F. Heritage Recording and 3D Modeling with Photogrammetry and 3D Scanning. Remote Sens. 2011, 3, 1104–1138. [Google Scholar] [CrossRef]
  36. SCIA. SCIA—Structural Analysis & Design Software; SCIA: London, UK, 2021. [Google Scholar]
  37. Kisicek, T.; Stepinac, M.; Renic, T.; Hafner, I.; Lulic, L. Strengthening of Masonry Walls with FRP or TRM. J. Croat. Assoc. Civ. Eng. 2020, 72, 937–953. [Google Scholar] [CrossRef]
  38. Pampanin, S.; Bolognini, D.; Pavese, A. Performance-Based Seismic Retrofit Strategy for Existing Reinforced Concrete Frame Systems Using Fiber-Reinforced Polymer Composites. ASCE J. Compos. Constr. 2007, 11, 211–226. [Google Scholar] [CrossRef]
  39. Faggiano, B.; Iovane, G.; Salzillo, D.; Mazzolani, F.M.; Landolfo, R. Dissipative Bracing Systems for Seismic Upgrading of New and Existing Timber Structures. Int. J. Archit. Herit. 2021, 15, 289–312. [Google Scholar] [CrossRef]
  40. Barazzetti, L.; Banfi, F.; Brumana, R.; Gusmeroli, G.; Previtali, M.; Schiantarelli, G. Cloud-to-BIM-to-FEM: Structural Simulation with Accurate Historic BIM from Laser Scans. Simul. Model. Pract. Theory 2015, 57, 71–87. [Google Scholar] [CrossRef]
  41. Funari, M.F.; Hajjat, A.E.; Masciotta, M.G.; Oliveira, D.V.; Lourenço, P.B. A Parametric Scan-to-FEM Framework for the Digital Twin Generation of Historic Masonry Structures. Sustainability 2021, 13, 11088. [Google Scholar] [CrossRef]
  42. Castellazzi, G.; D’Altri, A.M.; Bitelli, G.; Selvaggi, I.; Lambertini, A. From Laser Scanning to Finite Element Analysis of Complex Buildings by Using a Semi-Automatic Procedure. Sensors 2015, 15, 18360–18380. [Google Scholar] [CrossRef] [Green Version]
Figure 1. Buckling of plain bar reinforcement on top of the RC piers.
Buildings 12 01489 g001
Figure 2. Diagonal cracks in the lightly reinforced RC shear wall.
Buildings 12 01489 g002
Figure 3. Obtained activities for the assessment of case study building (AR = augmented reality).
Buildings 12 01489 g003
Figure 4. nZEB vision.
Buildings 12 01489 g004
Figure 5. Characteristic floorplan of the case study building (all units in cm).
Buildings 12 01489 g005
Figure 6. Sectional plan of case study building with visible steel braces.
Buildings 12 01489 g006
Figure 7. Laser scanning workflow.
Buildings 12 01489 g007
Figure 8. Laser scanning locations by floors.
Buildings 12 01489 g008
Figure 9. Extracting concrete samples in the column on the ground floor (a) and a wall on the 2nd floor (b).
Buildings 12 01489 g009
Figure 10. Samples after removal (a), after preparation for testing (b), and after testing (c).
Buildings 12 01489 g010
Figure 11. GPR and Profometer used for measurements.
Buildings 12 01489 g011
Figure 12. Radargram of built-in reinforcement.
Buildings 12 01489 g012
Figure 13. Column on the ground floor (a), second floor (b), and a beam on the 2nd floor (c).
Buildings 12 01489 g013
Figure 14. BIM model of the case study building.
Buildings 12 01489 g014
Figure 15. Three different sections of the case study building.
Buildings 12 01489 g015
Figure 16. Scaled-down BIM model in augmented reality.
Buildings 12 01489 g016
Figure 17. Numerical FEM model of the case study building (each section is colorized differently).
Buildings 12 01489 g017
Figure 18. Eigenmodes of Section A: (a) translation X; (b) translation Y; (c) rotation (Z).
Buildings 12 01489 g018
Figure 19. Eigenmodes of Section B: (a) translation X; (b) translation Y; (c) rotation (Z).
Buildings 12 01489 g019
Figure 20. Concrete frames (red) that require FRP jacketing.
Buildings 12 01489 g020
Figure 21. Additional steel bracings: (a) both Sections A and C; (b) detail on Section A.
Buildings 12 01489 g021
Figure 22. Additional RC perimeter walls.
Buildings 12 01489 g022
Figure 23. New steel frames (red) installed as an infill of existing RC frames.
Buildings 12 01489 g023
Table 1. Available non-destructive testing (NDT) assessment methods for existing RC structures.
NDT MethodDevices/TestWhat Is Measured?How Is It Measured?References
Visual inspection/Damage degree, usability of the buildingWithout a device, using qualitative analysis and experiencePenelis and Penelis [18]
Reinforcement location and typeImpact drillLocation and type of reinforcementConcrete cover is removed till the reinforcement is visible/
Stress wave transmissionUltrasonic Pulse Velocity (UPV) test/Resonant frequency (RF) testCompressive strength of concreteUPV—two transducers are placed on two sides of the specimen after which the time of wave travel is measured; RF—a piezometric sensor is used with different attachment techniques to obtain resonant frequencySajid et al. [19]
Ultrasonic velocity testingImpact hammer and accelerometerCharacterization of wall homogeneity and variabilityOn opposite sides of the wall, an impact hammer and an accelerometer are placed. The mechanical impulse is generated by the hammer striking the material and the signal is then received by the accelerometer.Mesquita et al. [20]
Surface penetrating radarGround Penetrating Radar (GPR)Location (depth) of reinforcement, thickness of elements, position of voids and moisture contentThe device is placed on the measured surface and moved along a linear axis (with a calibration needed) transmitting radio wave signals into a structure and detecting echoesMartini et al. [21]
Wai-Lok Lai, Dérobert and Annan [22]
Infrared thermographyThermography cameras
Visual IR thermometers
Defects in the building envelope, the monitoring of reinforcing steel in concrete, the detection of moisture etc.The element is under thermal stimulation and its surface temperature variation is monitoredMeola [23]
Compression TestDrilling equipment, compression testing machineCompressive strengthCylindrical specimens are extracted from the structure and tested in the laboratory with the compression machineSantini et al. [24]
Tensile testDrilling equipment,
Tensile testing machine
Tensile test of steel reinforcementSteel reinforcement is extracted from the structure and tested in the laboratorySantini et al. [24]
Pull-out methodPull-out equipmentCubic compression strengthForce needed to extract a small conical concrete sample by the pull-out equipmentSantini et al. [24]
Half-cell potential measurement (Profometer)Open circuit potential measurement of reinforcing steelConcrete cover depth and location of the reinforcement; half cell potential (indicator for corrosion of reinforcement)The electrode is connected to the uncoated rebar, and the electrical circuit is completed with the saturated solution on the concrete surfaceKušter Marić et al. [25]
Wenner probeNon-destructive—on the surface of the concreteSurface electrical resistivity of concrete—used for evaluation of reinforcement corrosionThe device is based on the Wenner probe principle—four electrodes are in contact with the surface, closing the electrical circuitKušter Marić et al. [25]
Schmidt hammerNon-destructive—on the surface of the concreteThe compression strength of the concreteThe device is placed on the surface of the concrete and the rebound of the hammer is measured for the compression strength estimationKušter Marić et al. [25]
Acoustic emission The damage evolution and crack formation in concrete or masonryA group of transducers are set to record signals, then locate the precise area of their origin by measuring the time for the sound to reach different transducers.Carpintier et al. [26]
Table 2. Analysis methods for seismic assessment of existing RC structures.
Analysis MethodTypeAdvantagesDisadvantages
Response spectrum methodLinear analysisEasy to use
Provide periods and eigenmodes
Provides base shear
Conservative for regular structures
Does not take into account load redistribution after plastic hinges are formed
Fundamental mode method
Time series analysis
Pushover analysisNon–linear analysisProvide capacity of the structure
Provides limit displacements
Complex
Requires M- φ curve for each element
Does not define prevailing failure mode for higher eigenmodes
Time history analysis
Probabilistic and sampling methods
Table 3. Compressive strength of concrete in a column and a wall.
PositionBreaking Force [kN]Compressive Strength [Mpa]
Column ground floor238.5031.27
Wall second floor203.5026.75
Table 4. Peak Ground Acceleration for case study building location.
Return PeriodPGAExplanation
95 years0.12 gUsed for validation of displacements for new and existing structures.
225 years0.18 gUsed for seismic assessment based on Croatian standard for post-earthquake assessment and strengthening
475 years0.24 gUsed for ULS validation
Table 5. Validation of global displacements (EN 1990).
SectionDisplacement for 95 Years [mm]Limit Displacement = H/500 [mm]Utilization
A20.1834.7058%
B26.2275%
C22.7365%
Table 6. Validation of inter-story drift (EN 1998)—presented only for Section B.
StoryH [m]Ux [mm]Uy [mm]Utotal [mm]Ui-Ui-1 [mm]Ui/200 [mm]Utilization
00.000.000.000.00///
13.736.000.306.015.9118.6532%
26.6111.100.5011.115.1014.4035%
39.4916.600.7016.615.5014.4038%
412.3721.800.8021.815.2014.4036%
515.2526.221.2227.134.6114.4032%
Table 7. Validation of seismic joints (EN 1998).
SectionTotal Displacement U(i) [mm] U 2 A + U 2 B     [ mm ] U 2 B + U 2 C     [ mm ] Limitation [mm]Utilization
A20.1833.09 50.0066%
B26.2233.0934.7169%
C22.73 34.7169%
Table 8. Load effects and material characteristics for the shear wall in axis A.
NEd,max [kN]NEd,min [kN]FX,Ed [kN]FY,Ed [kN]MX,Ed [kNm]MY,Ed [kNm]
4531.322377.7543.511327.207455.0731.05
L [cm]b [cm]h [cm]d = 0.9 × L [cm]h/Lfcd [kN/cm2]
1255.0020.00 (30.00 in the basement)1840.001129.501.451.667
Table 9. Shear failure—validation for wall A on basement level.
fcd [kN/cm2]fyd [kN/cm2]l [cm]b [cm]z = 0.9 × d [cm]As [cm2]µUtilization
1.66723.481285.0030.001028.0098.690.60143%
NEd,min [kN]MX,Ed [kNm]Vdd [kN]Vid [kN]Vfd [kN]VRd,s [kN]VEd [kN]
1255.007455.07579.290.00346.95926.241327.20
Table 10. Load effects for validation of RC frame (Section A).
BeamBending Moment—Span
[kNm]
Hogging Moment—Support
[kNm]
Shear Force—Support
[kN]
71.61118.54118.32
ColumnAxial force
[kN]
Shear Force
[kN]
Bending moment
[kNm]
1348.8563.18122.83
Table 11. ULS verifications of the RC frame (Section A).
BeamBending Moment—SpanHogging Moment—SupportShear Force—Support
92%N/A103%
ColumnAxial forceShear ForceBending moment
63%173%52%
Table 12. Summary of the proposed strengthening methods.
Proposed MethodExplanationAdvantagesDisadvantages
FRP jacketing—RC beams and columnsIncrease in the cross-sectional capacity of existing RC frames, no effect on global stiffness distributionCost-effective;
does not require complete closure
No effect on lateral stiffness; majority of walls require shotcrete strengthening
Additional steel bracingSlight increase in the lateral stiffness, reduction in the load effects in beamsDoes not require complete closure;
similar to the previous strengthening
Dimension of the new bracing;
slight increase in stiffness; walls require shotcrete
New RC perimeter walls in direction XSignificant increase in the lateral stiffness, global behavior of the structure changed, reduction in load effects in RC framesComplete redistribution of stiffness;
no additional strengthening required
Very expensive;
requires new windows and façade;
requires new foundations
New steel frames connected to the existing RC framesSteel frames transfer complete lateral force to the foundations, RC frames do not require seismic verification, redistribution of global stiffnessLateral stiffness increased by 30%
cost-effective;
does not require heavy demolition work
Challenging connection through the RC slabs;
requires new foundation pads in the basement;
basement walls require shotcrete
Publisher’s Note: MDPI stays neutral with regard to jurisdictional claims in published maps and institutional affiliations.

