
Influence of Cooking Pollutant Diffusion Regularity by High-Rise Residential Inner-Courtyard Forms in Wuhan


Abstract
:1. Introduction
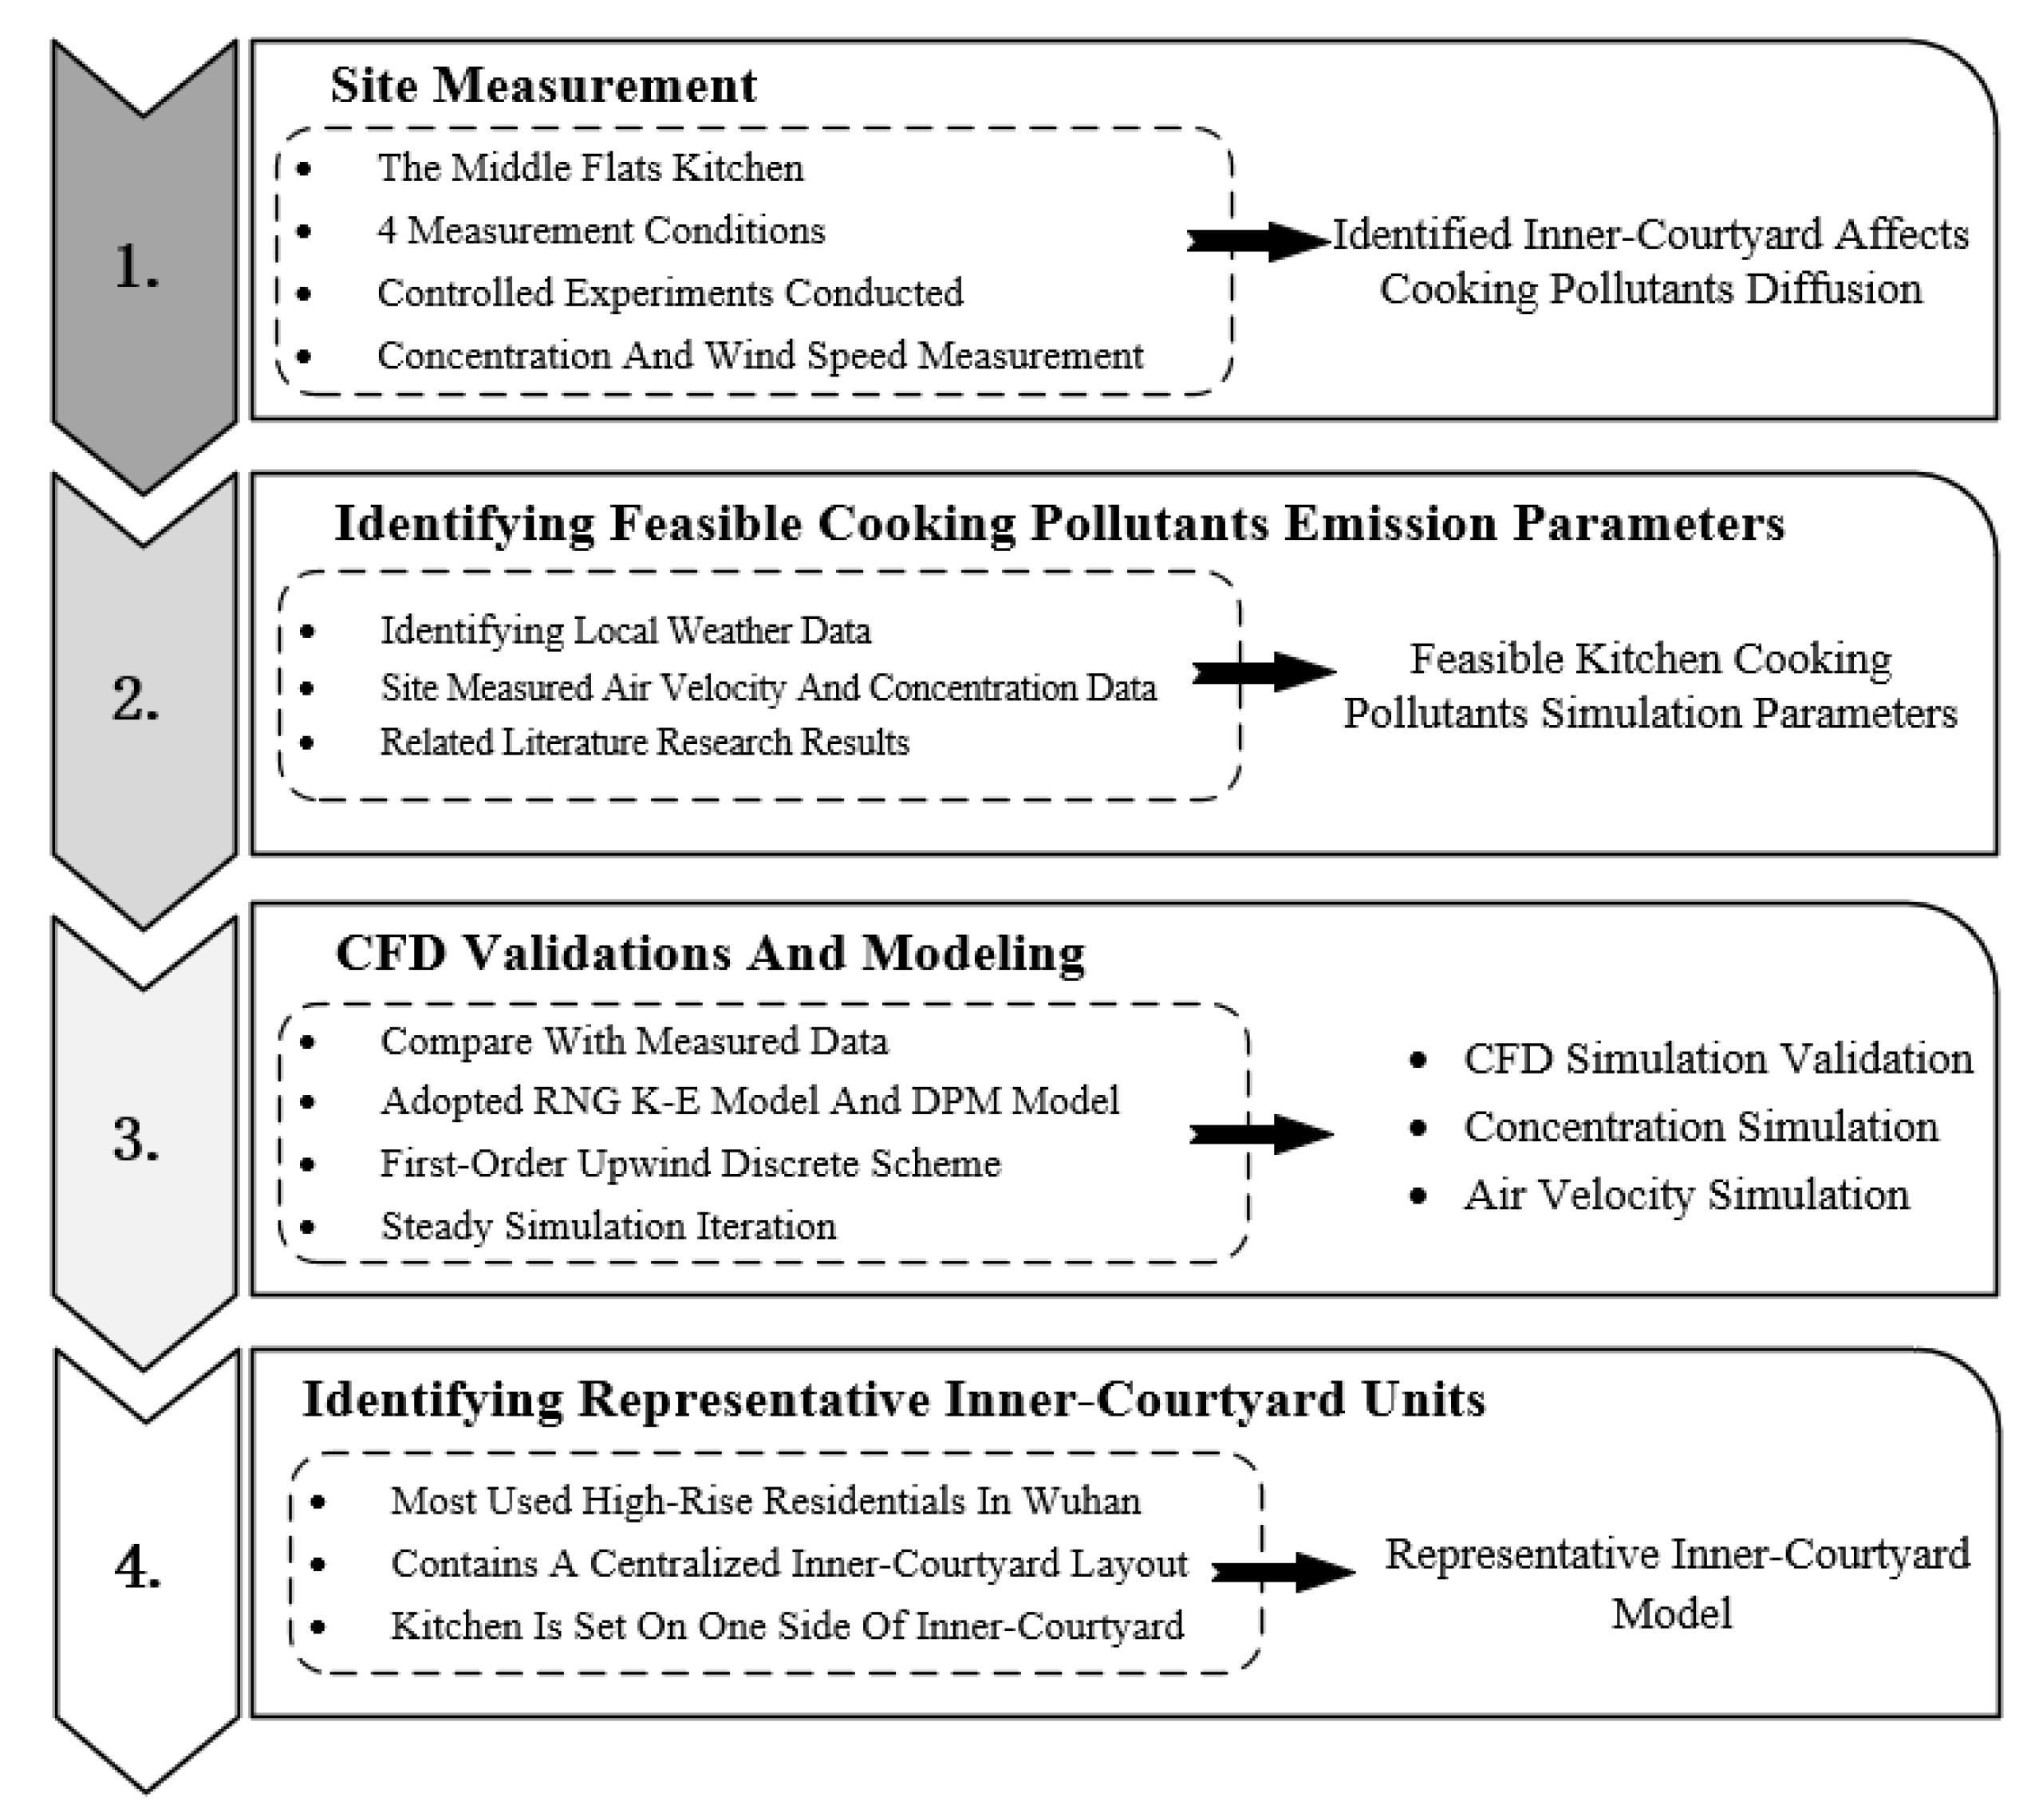
2. Methodology
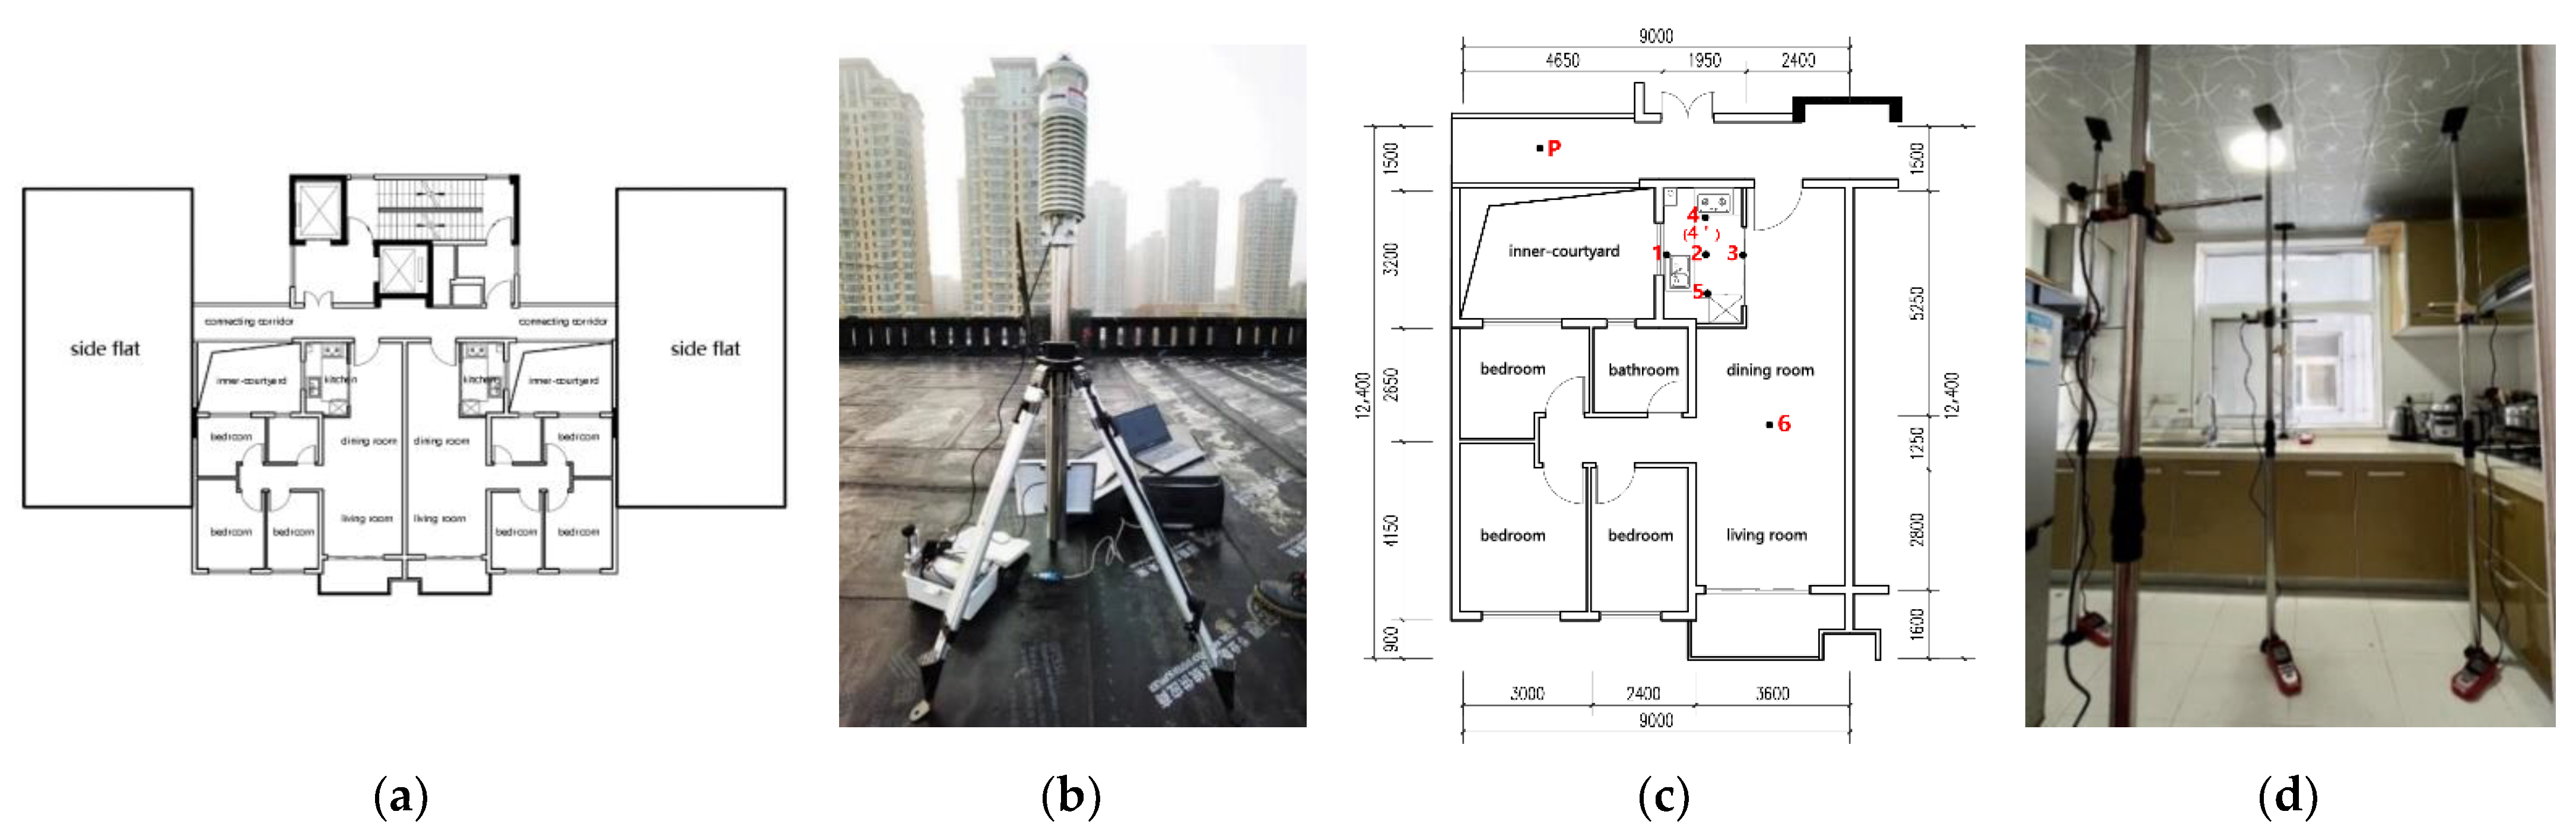
2.1. Measurement Description
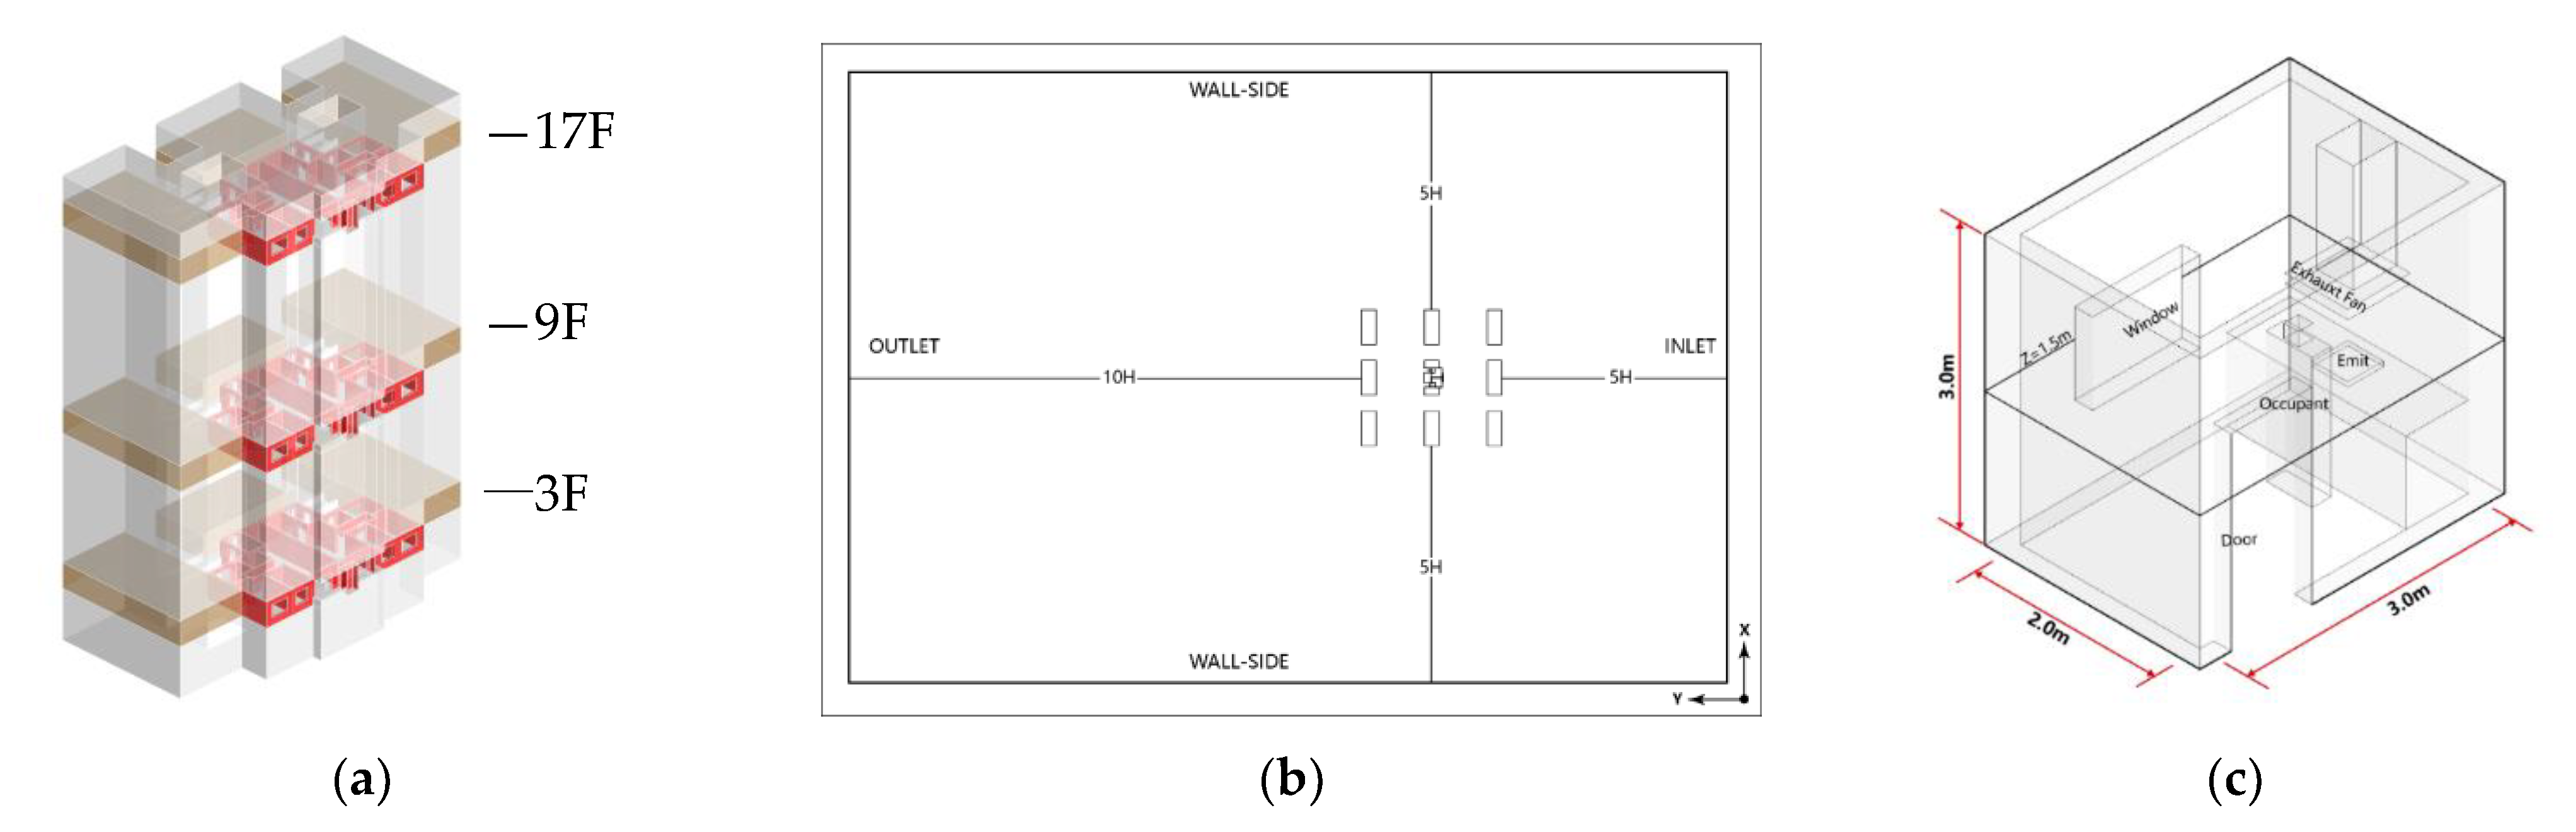
2.2. CFD Modeling and Simulation
2.2.1. Build Physical Models
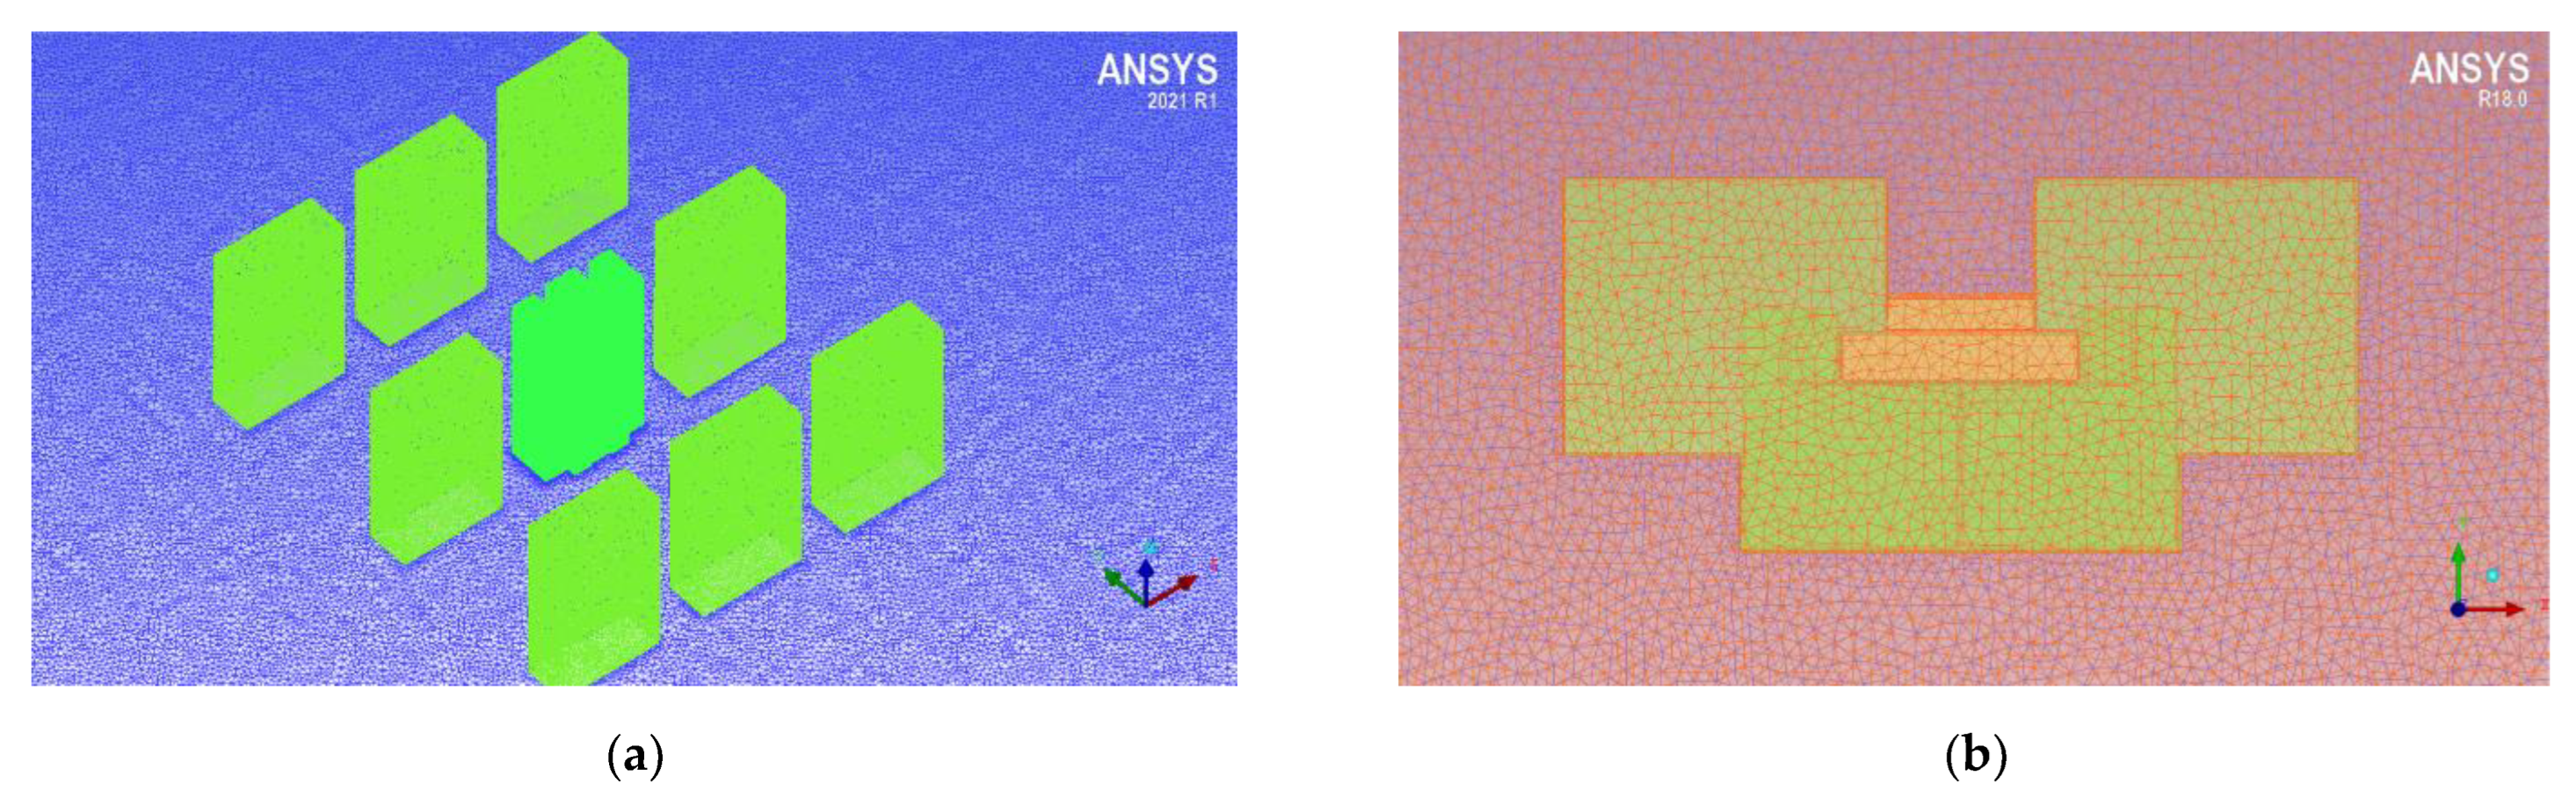
2.2.2. Model Meshing
2.2.3. Boundary Condition Setting
- Emission source: the kitchen stove surface is defined as the source of PM2.5 emission and heat source for the velocity-inlet boundary, and the velocity is set to 0.6 m/s [25]. The average temperature of the stove is taken as 150 °C for calculation in combination with relevant studies.
- Import and export: the doors and windows are all fully open, and the airflow flows into the room from outdoors through the doors and windows.
- Exhaust vent: use low-speed gear to exhaust, set exhaust negative pressure to 150 Pa [27].
- Wall surface: indoor and outdoor walls, operating tables, ground, etc., are adiabatic boundaries set as constant temperature wall boundaries.
2.2.4. Boundary Condition Setting
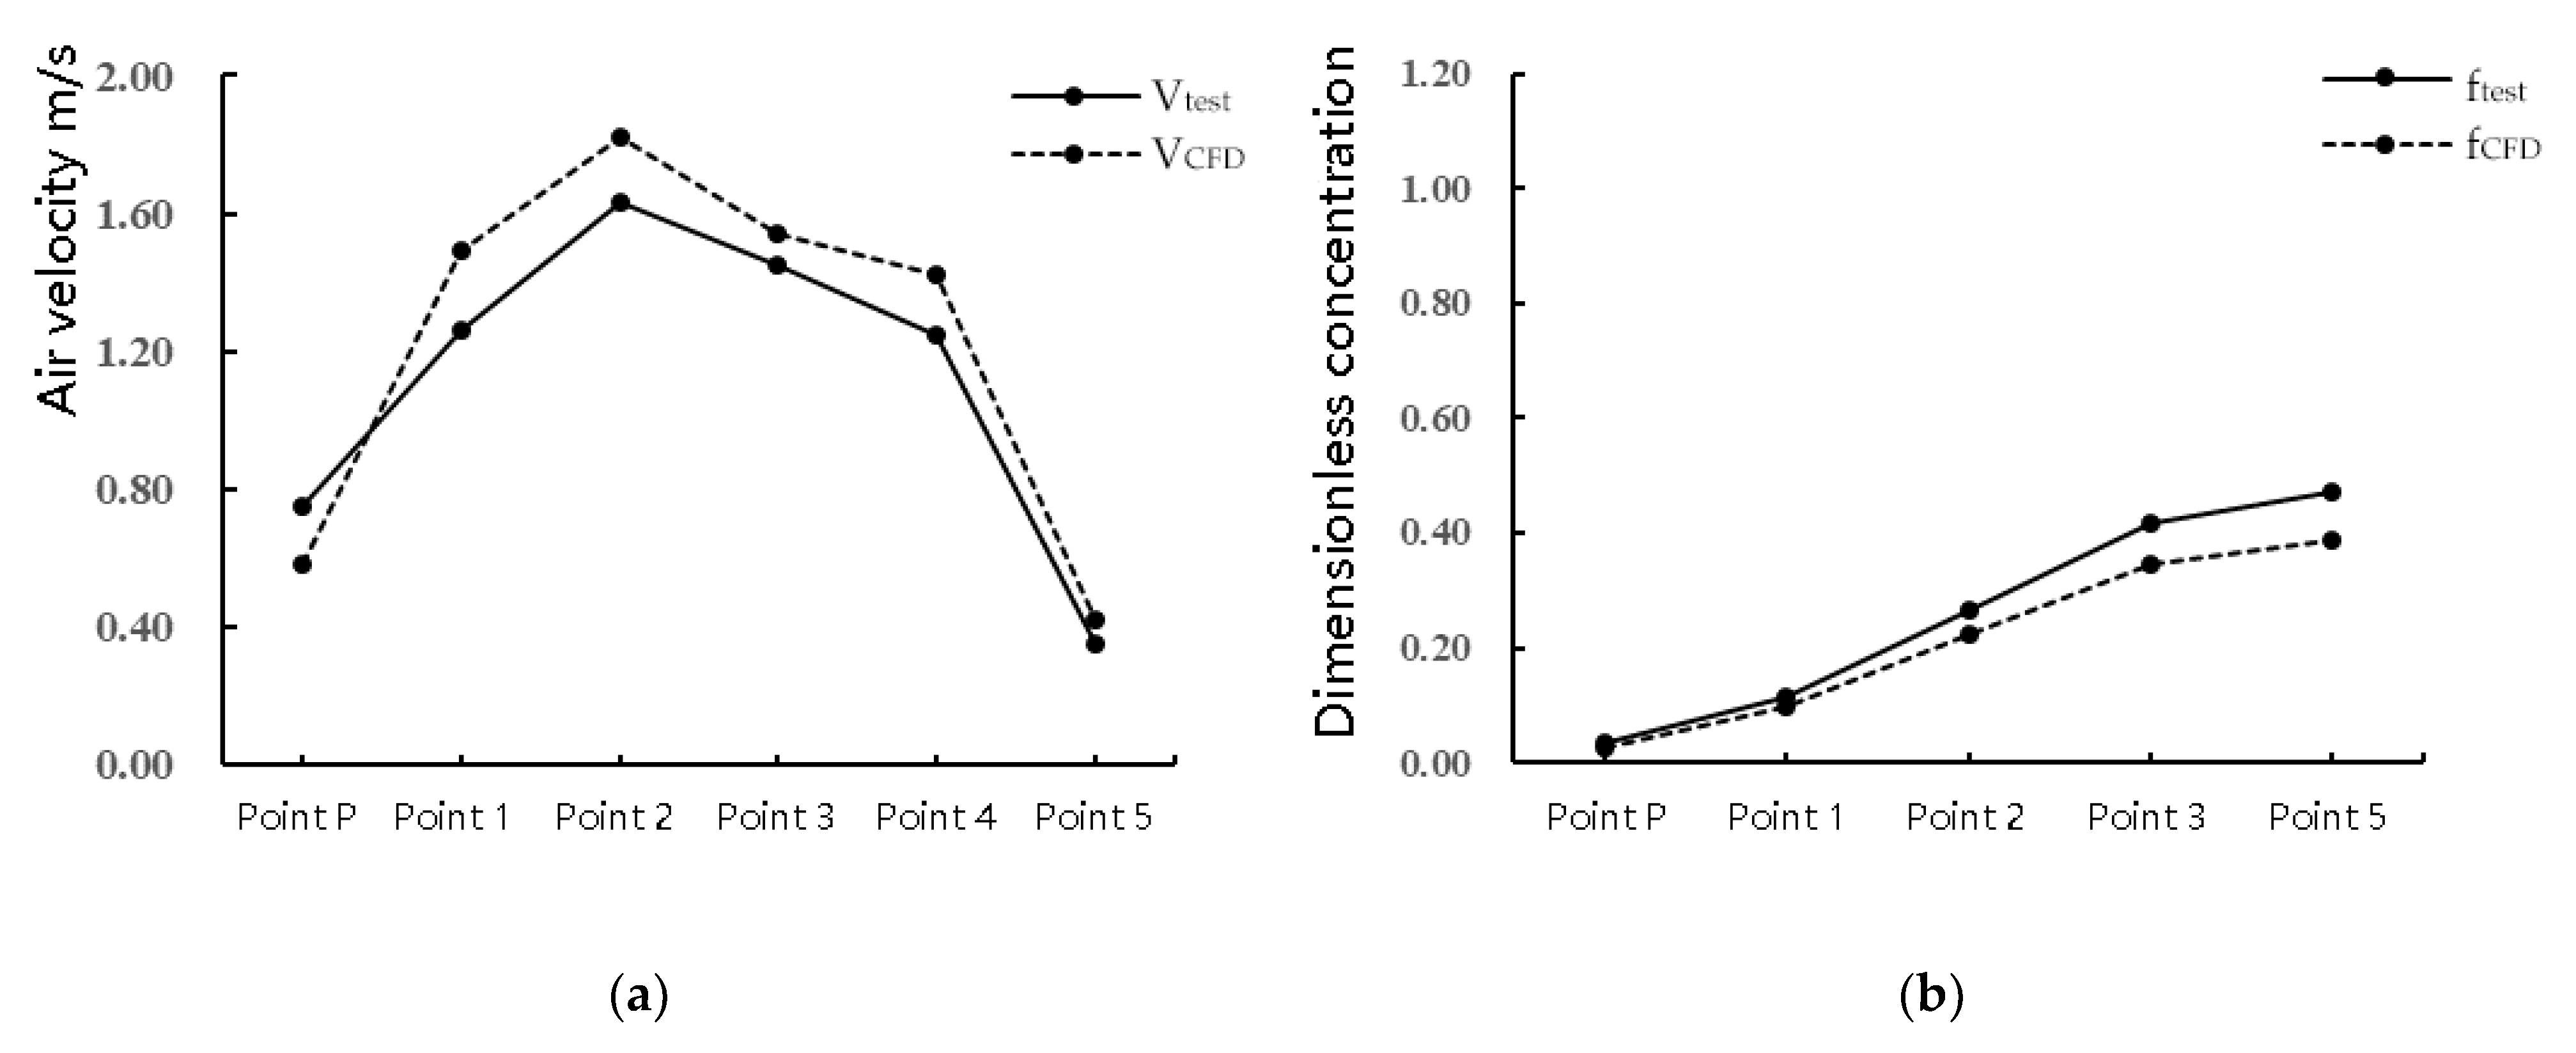
2.2.5. Model Validation and Correction
2.3. Inner-Courtyard Form Model
- Protruding parts of the building unrelated to the research object were simplified to the most basic form on the basis of not affecting the simulation results.
- For rooms not related to the kitchen, such as bedrooms, living rooms and bathrooms, their internal walls, windows and other layout structures were ignored and they were simplified into the entity spaces to reduce the influence of other factors on the research object.
- The kitchen size and form were kept the same. The north corridors were uniformly set to 1.5 m wide and the length depended on the type of flats. The area of the traffic space and the side household were set at the same size.
- In order to ensure the natural flow of wind field in the kitchen and the household during the simulation, ventilation windows were set on the south wall as the outlet of pressure flow, and only the kitchen windows were set on the north side. The doors and windows were all fully open by default to realize the natural wind flow.
- The side flats were simplified as non-ventilated entity spaces to reduce interference.
3. Results and Discussion
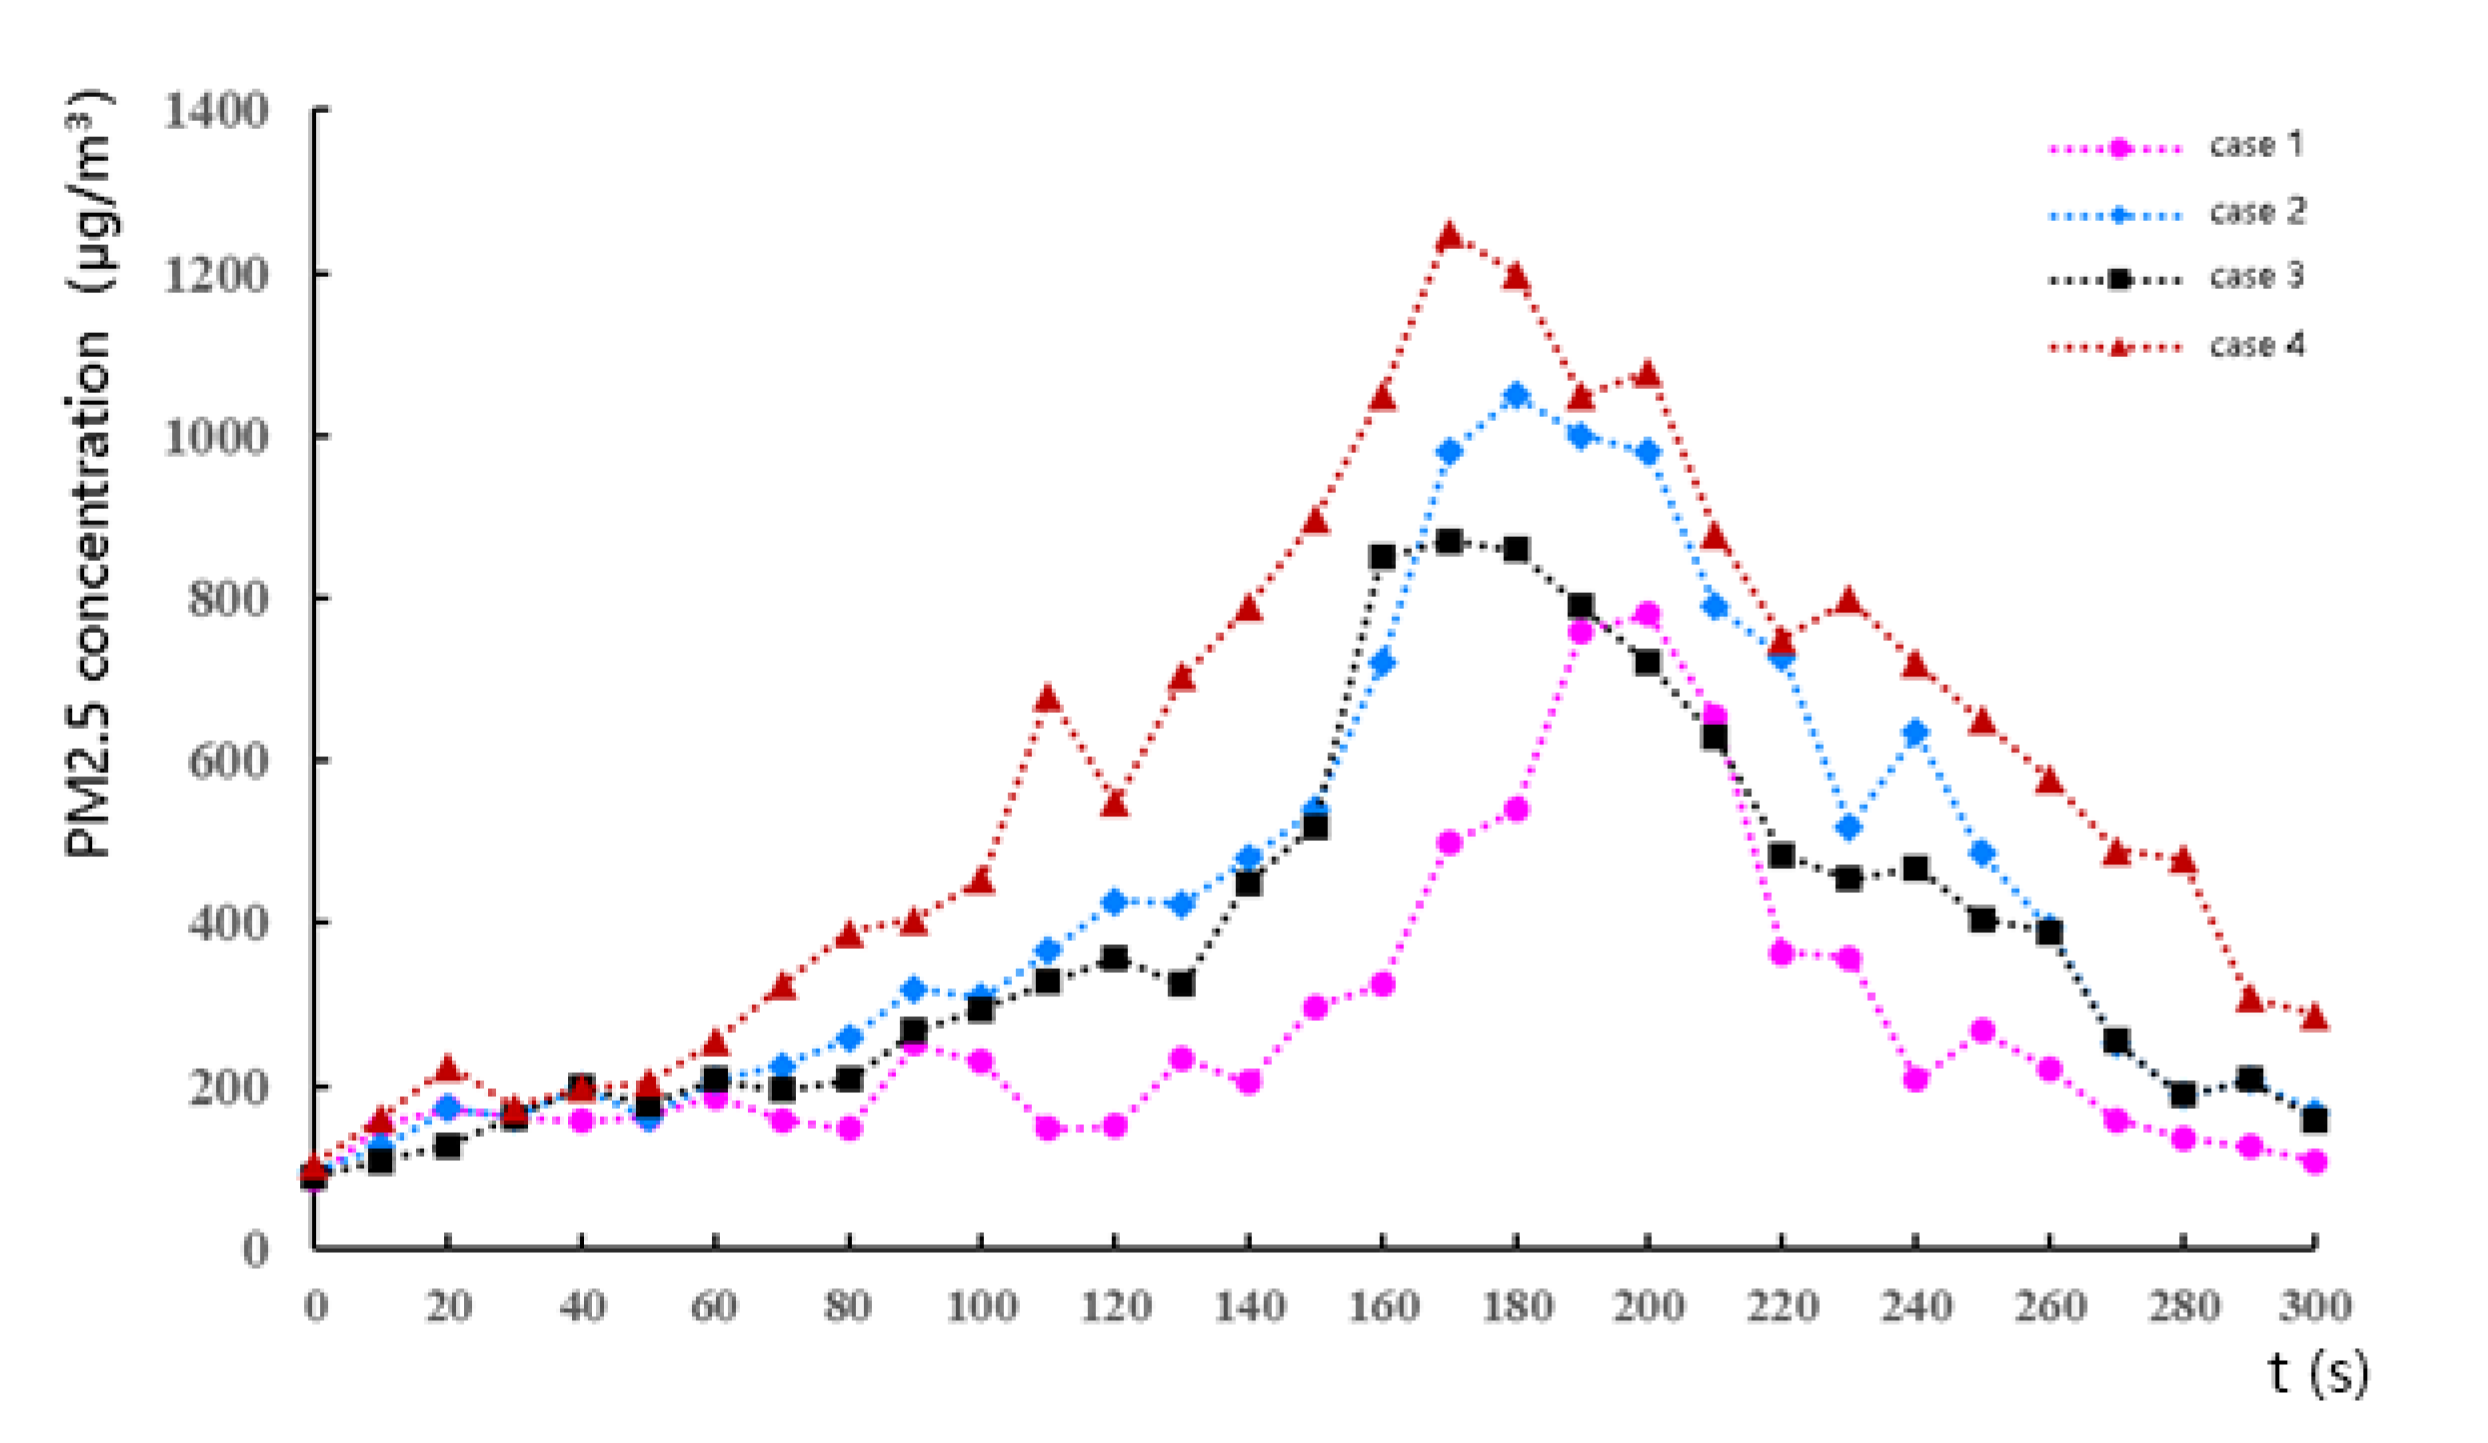
3.1. Measurement Results
3.2. Simulation Results
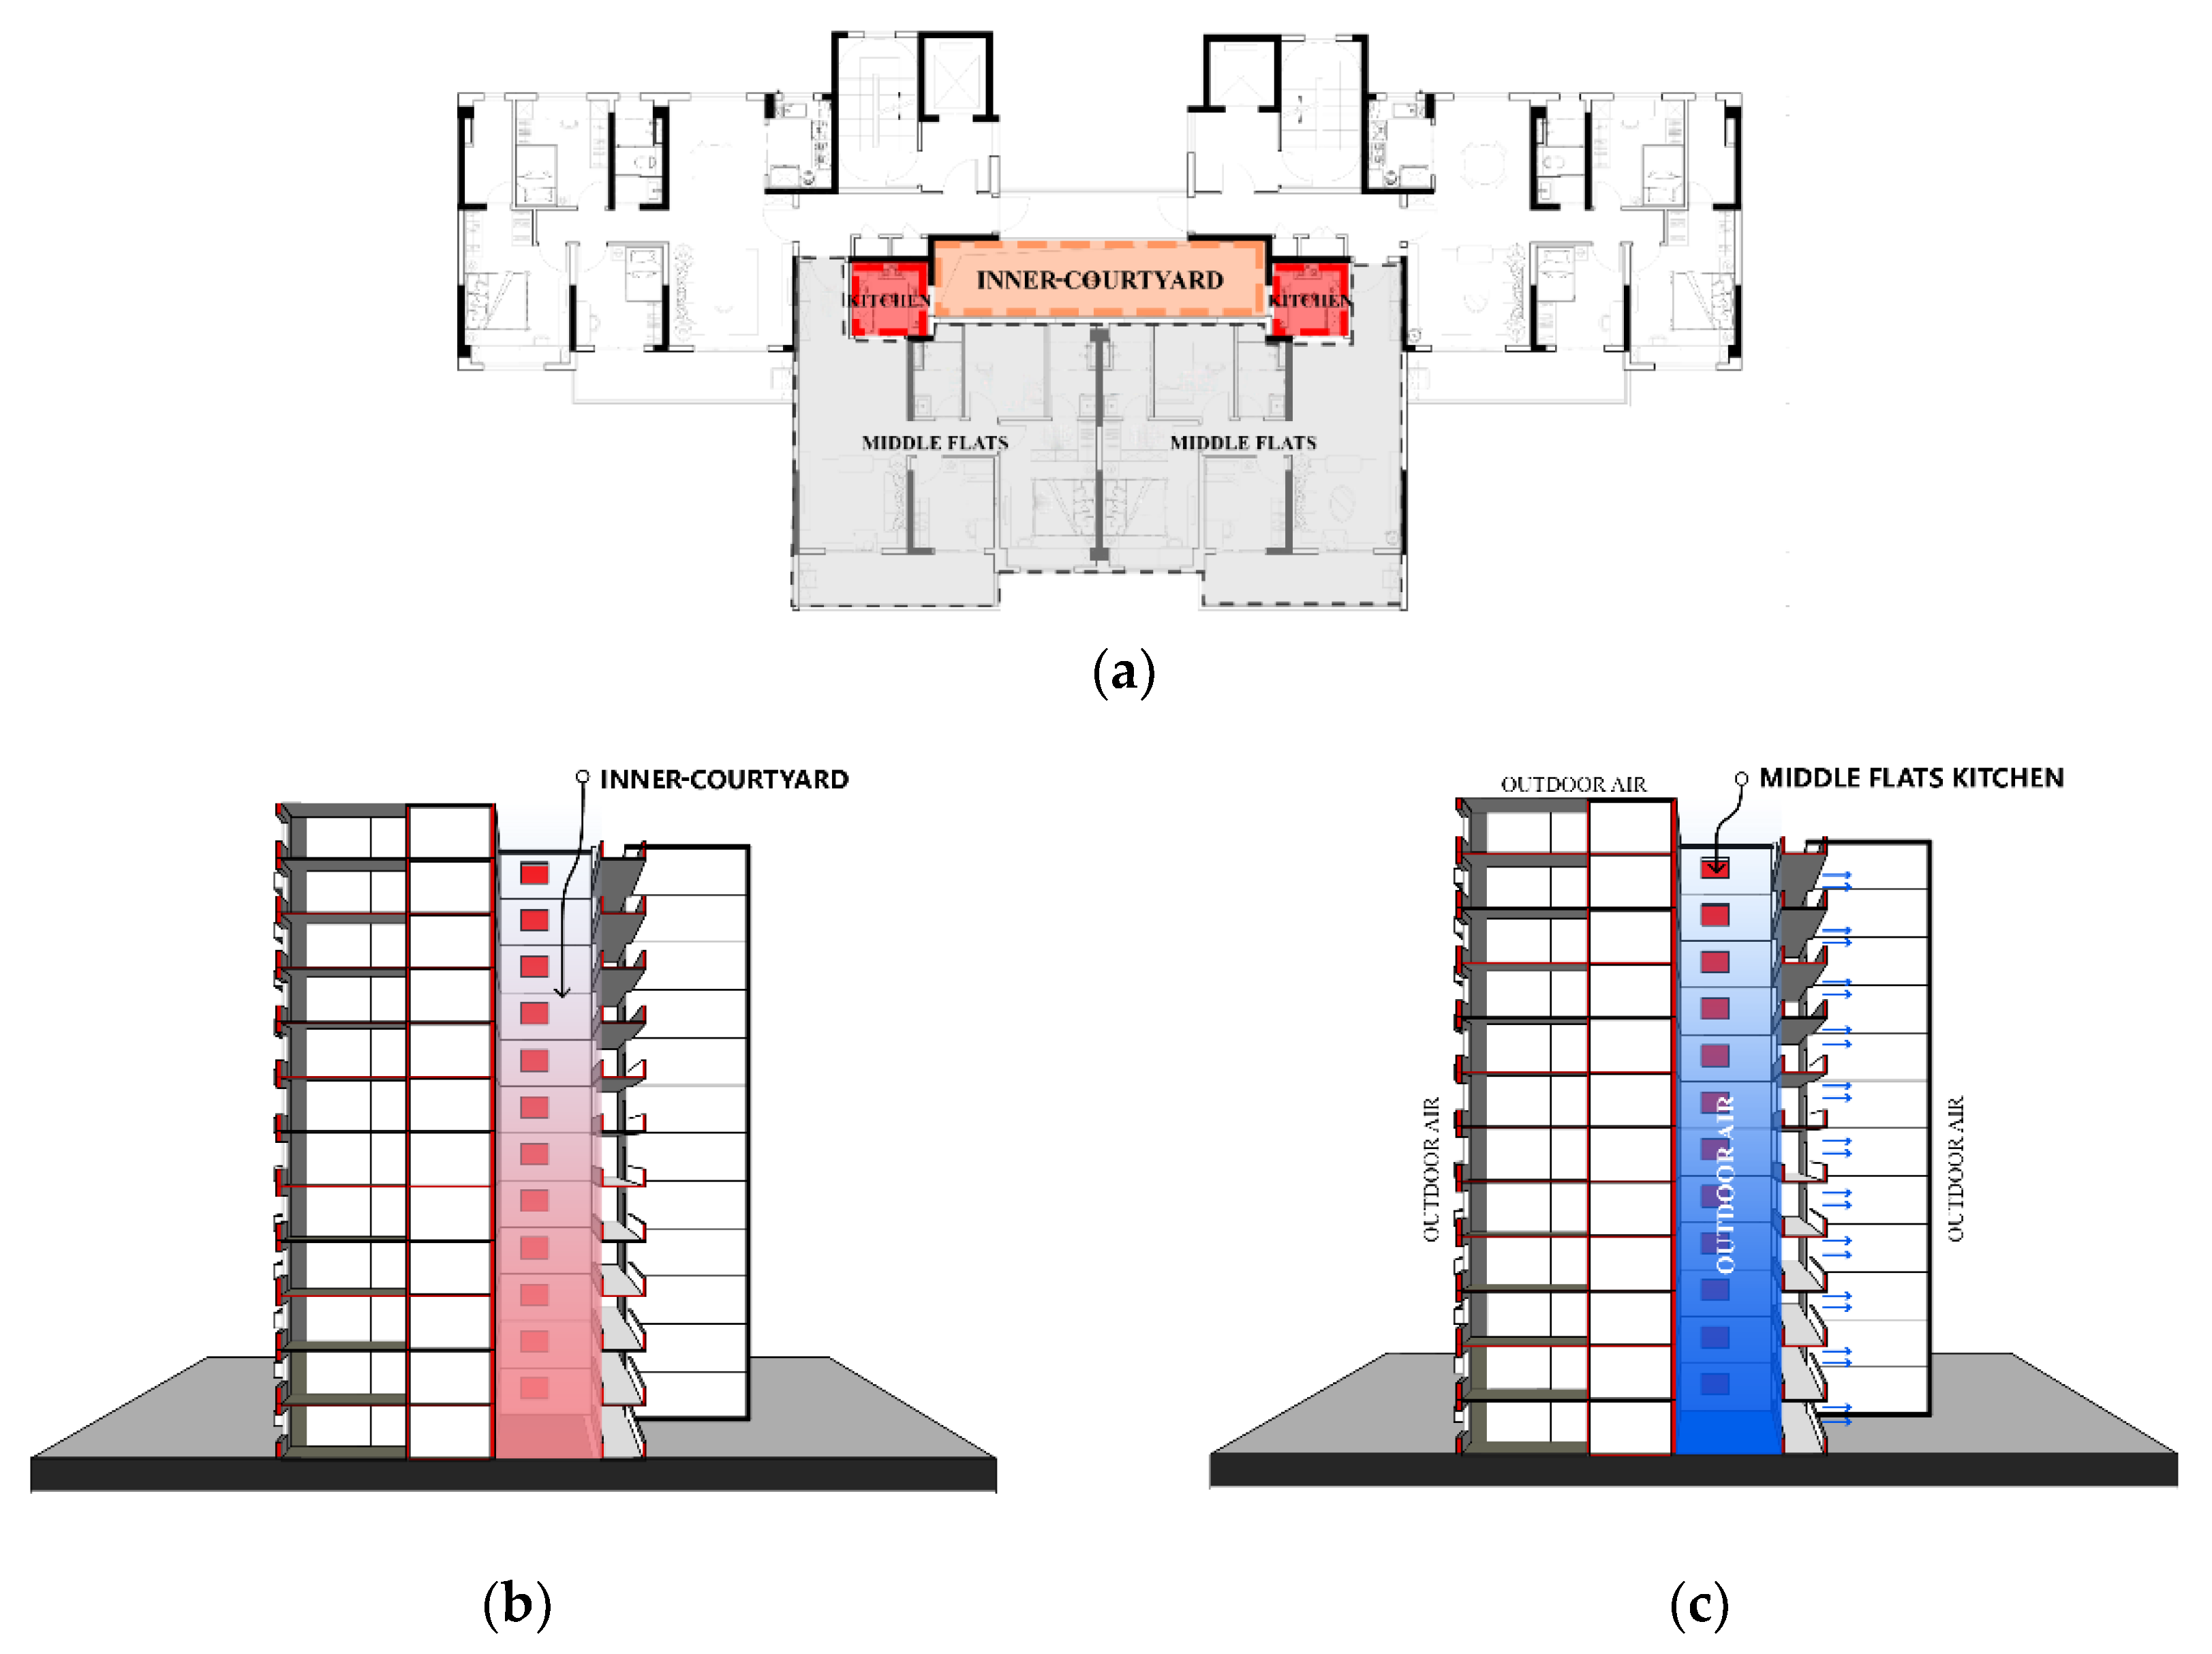
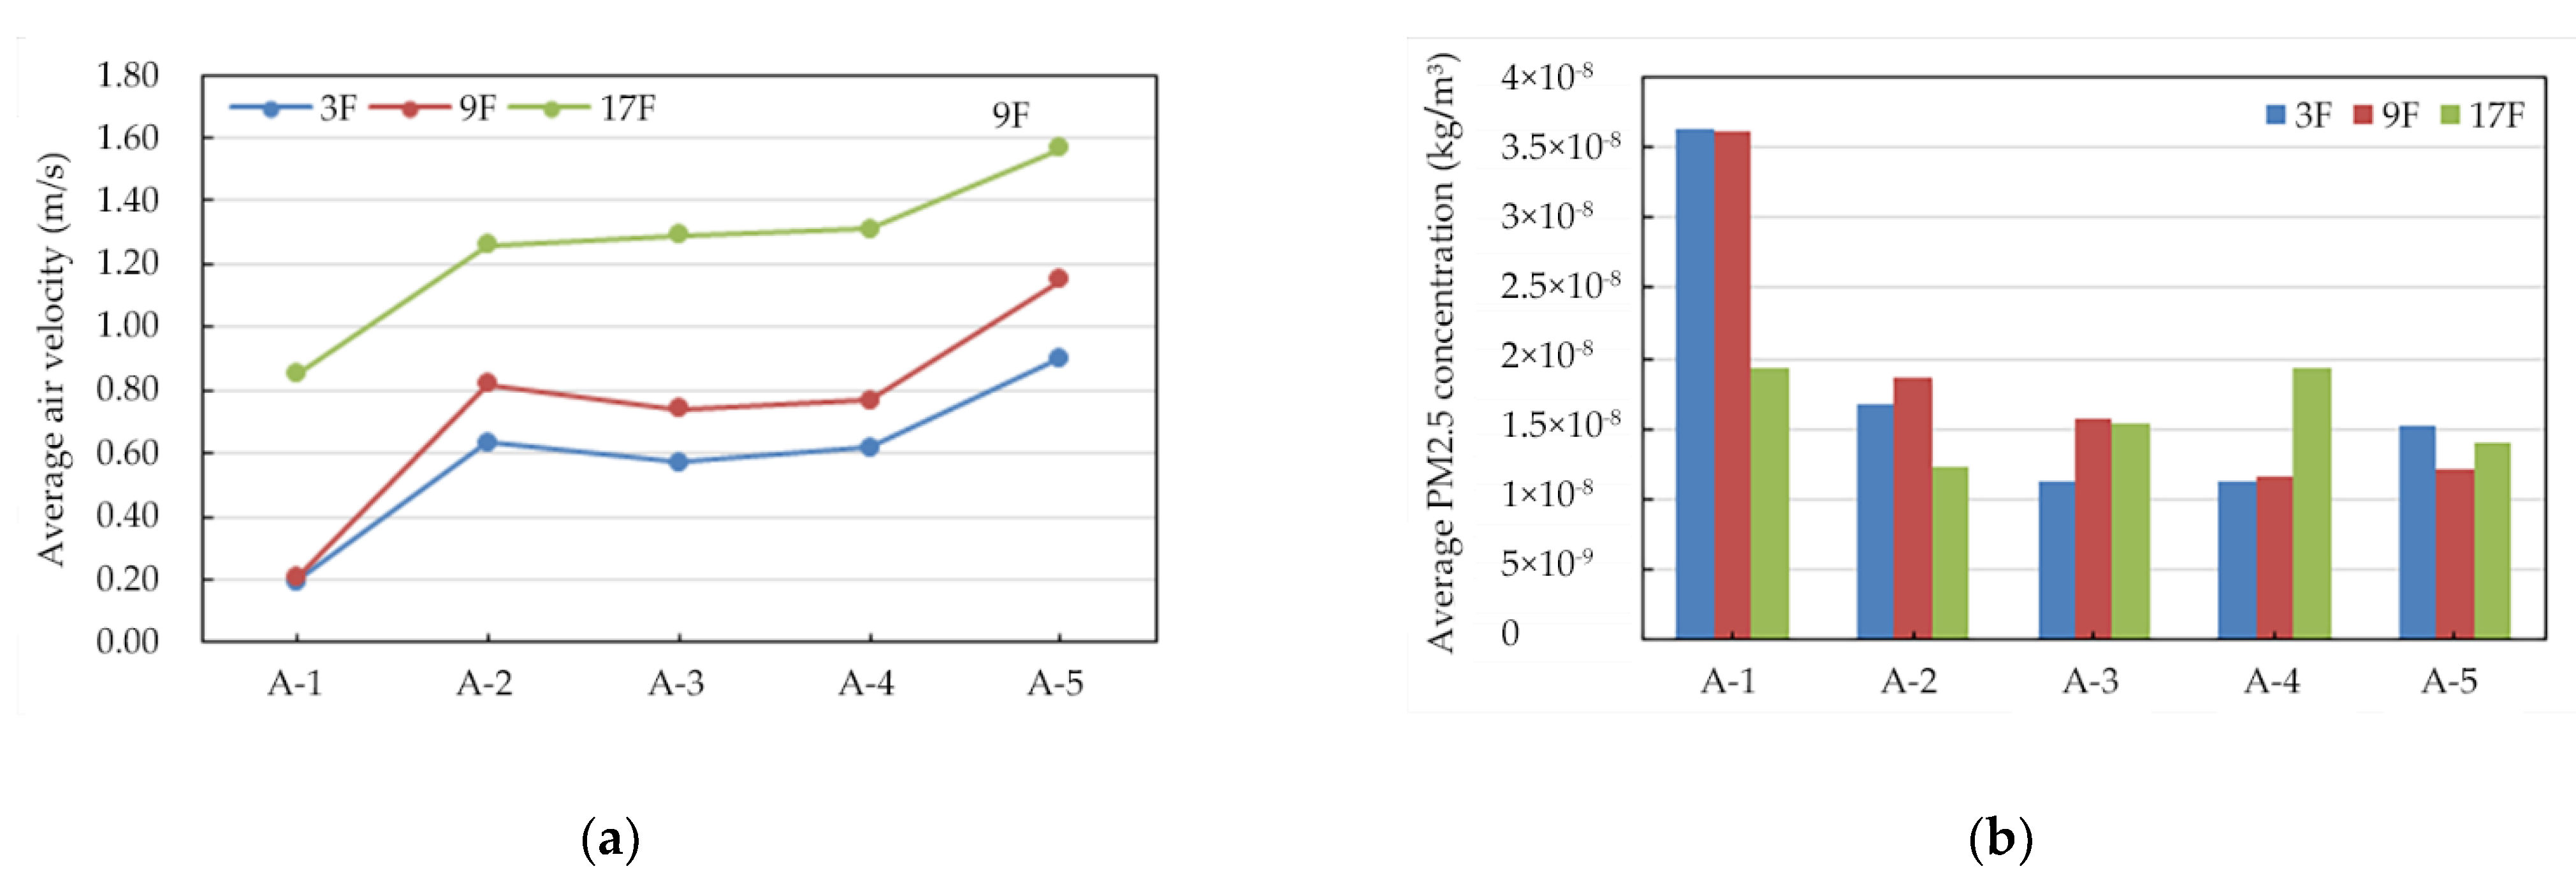
3.2.1. Influence of Inner-Courtyard on Cooking Pollutants Diffusion
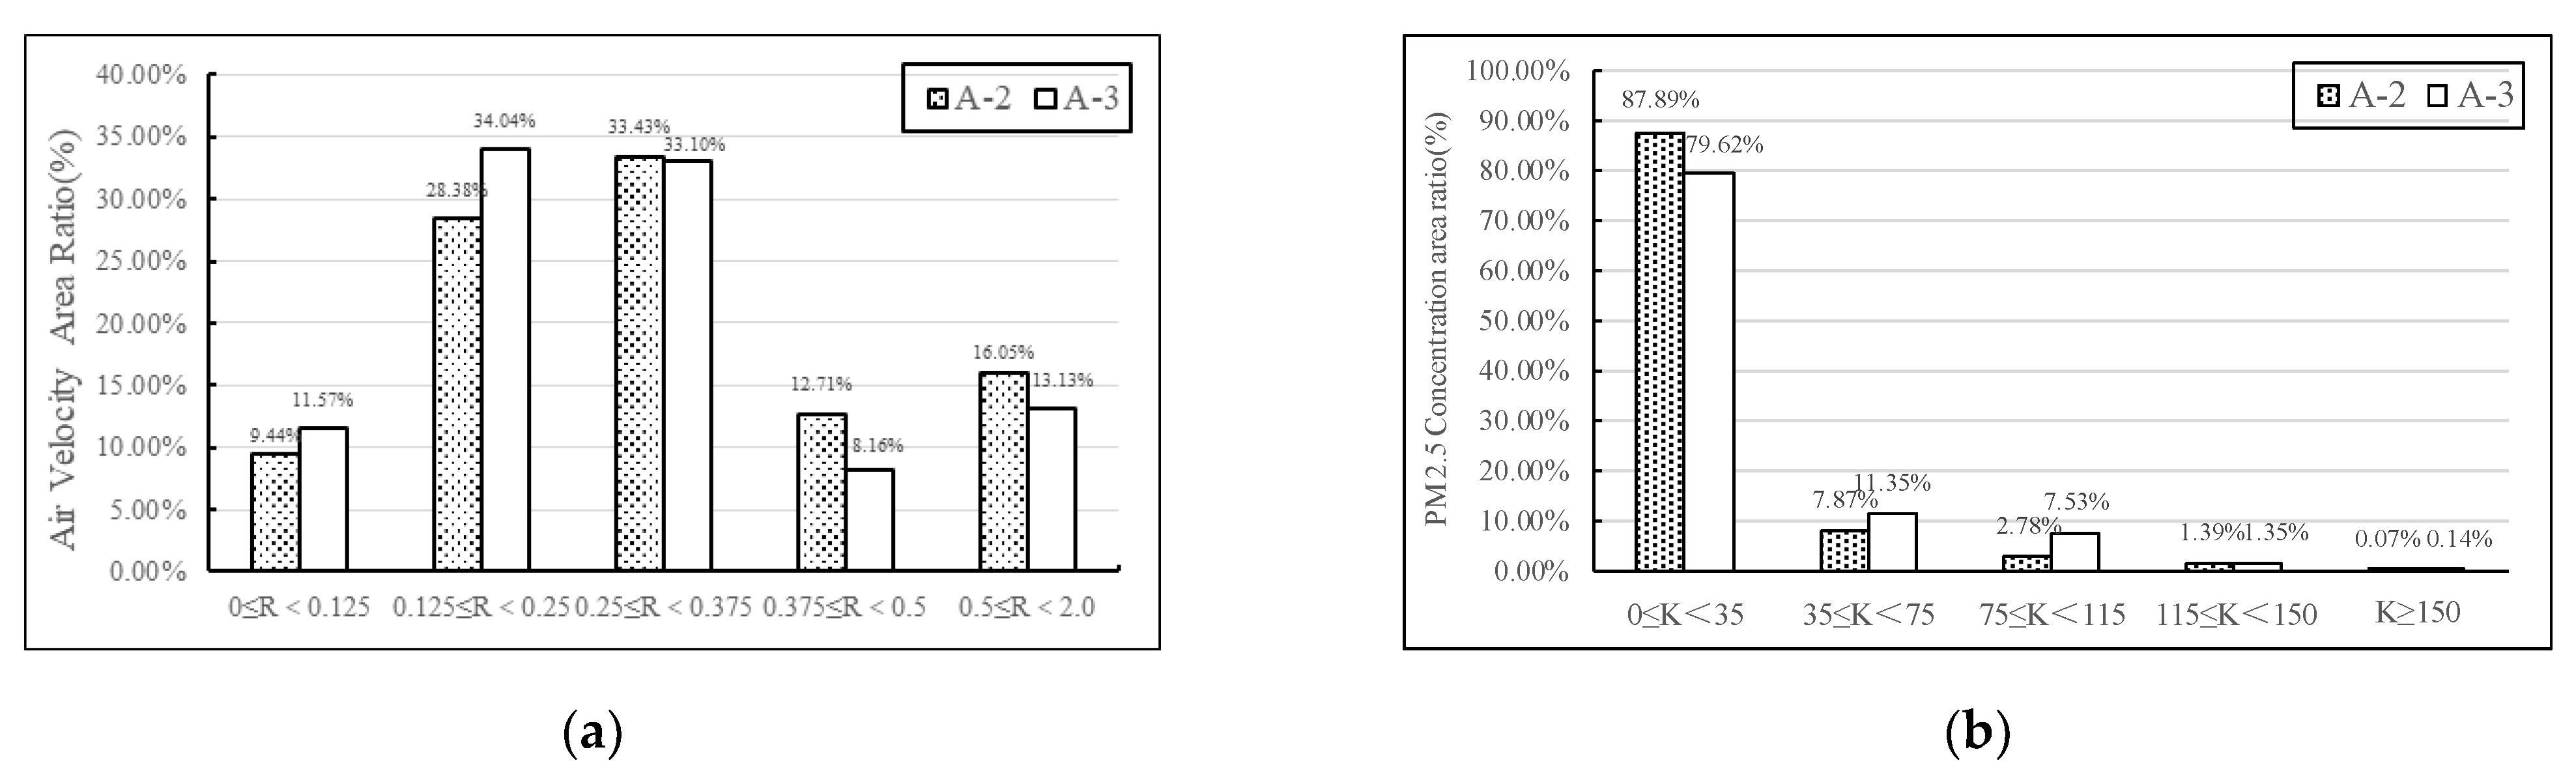
3.2.2. Influence of Inner-Courtyard Openness on Cooking Pollutants Diffusion
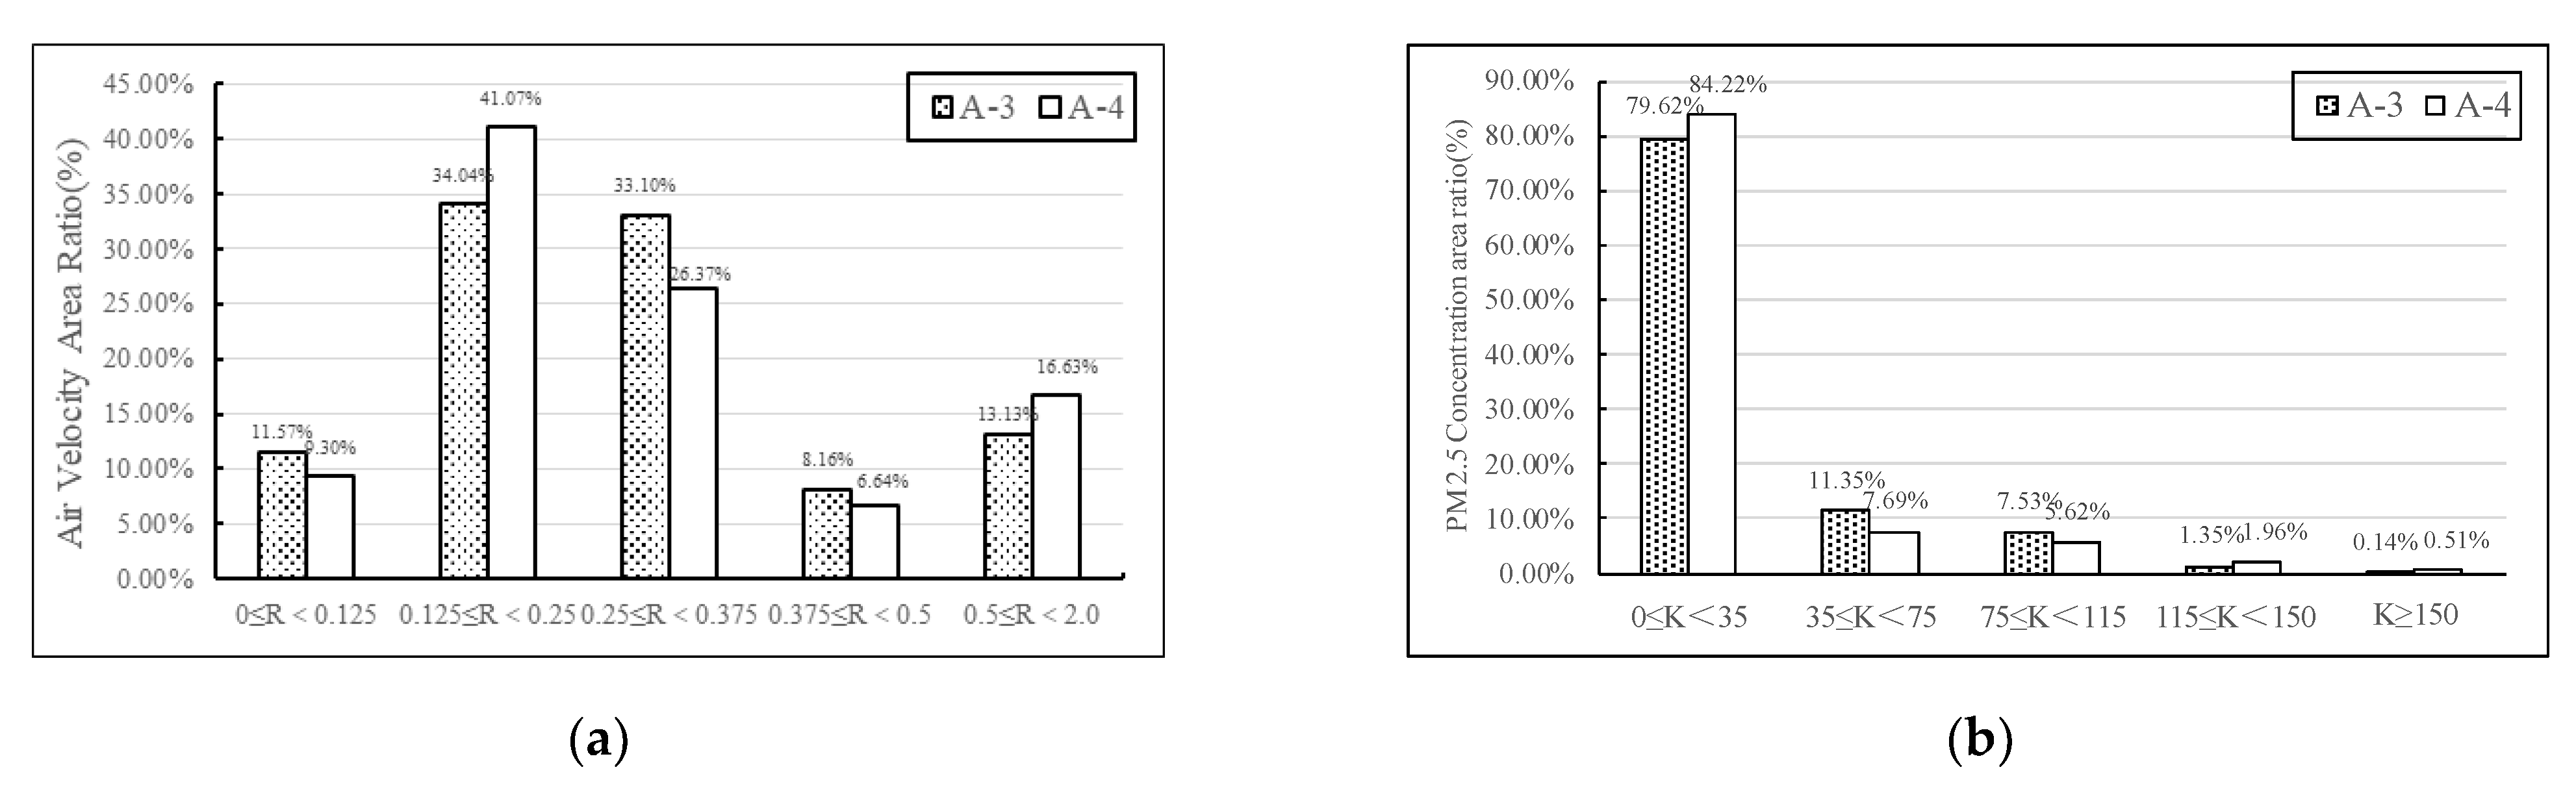
3.2.3. Influence of Inner-Courtyard Blocking Degree on Cooking Pollutants Diffusion
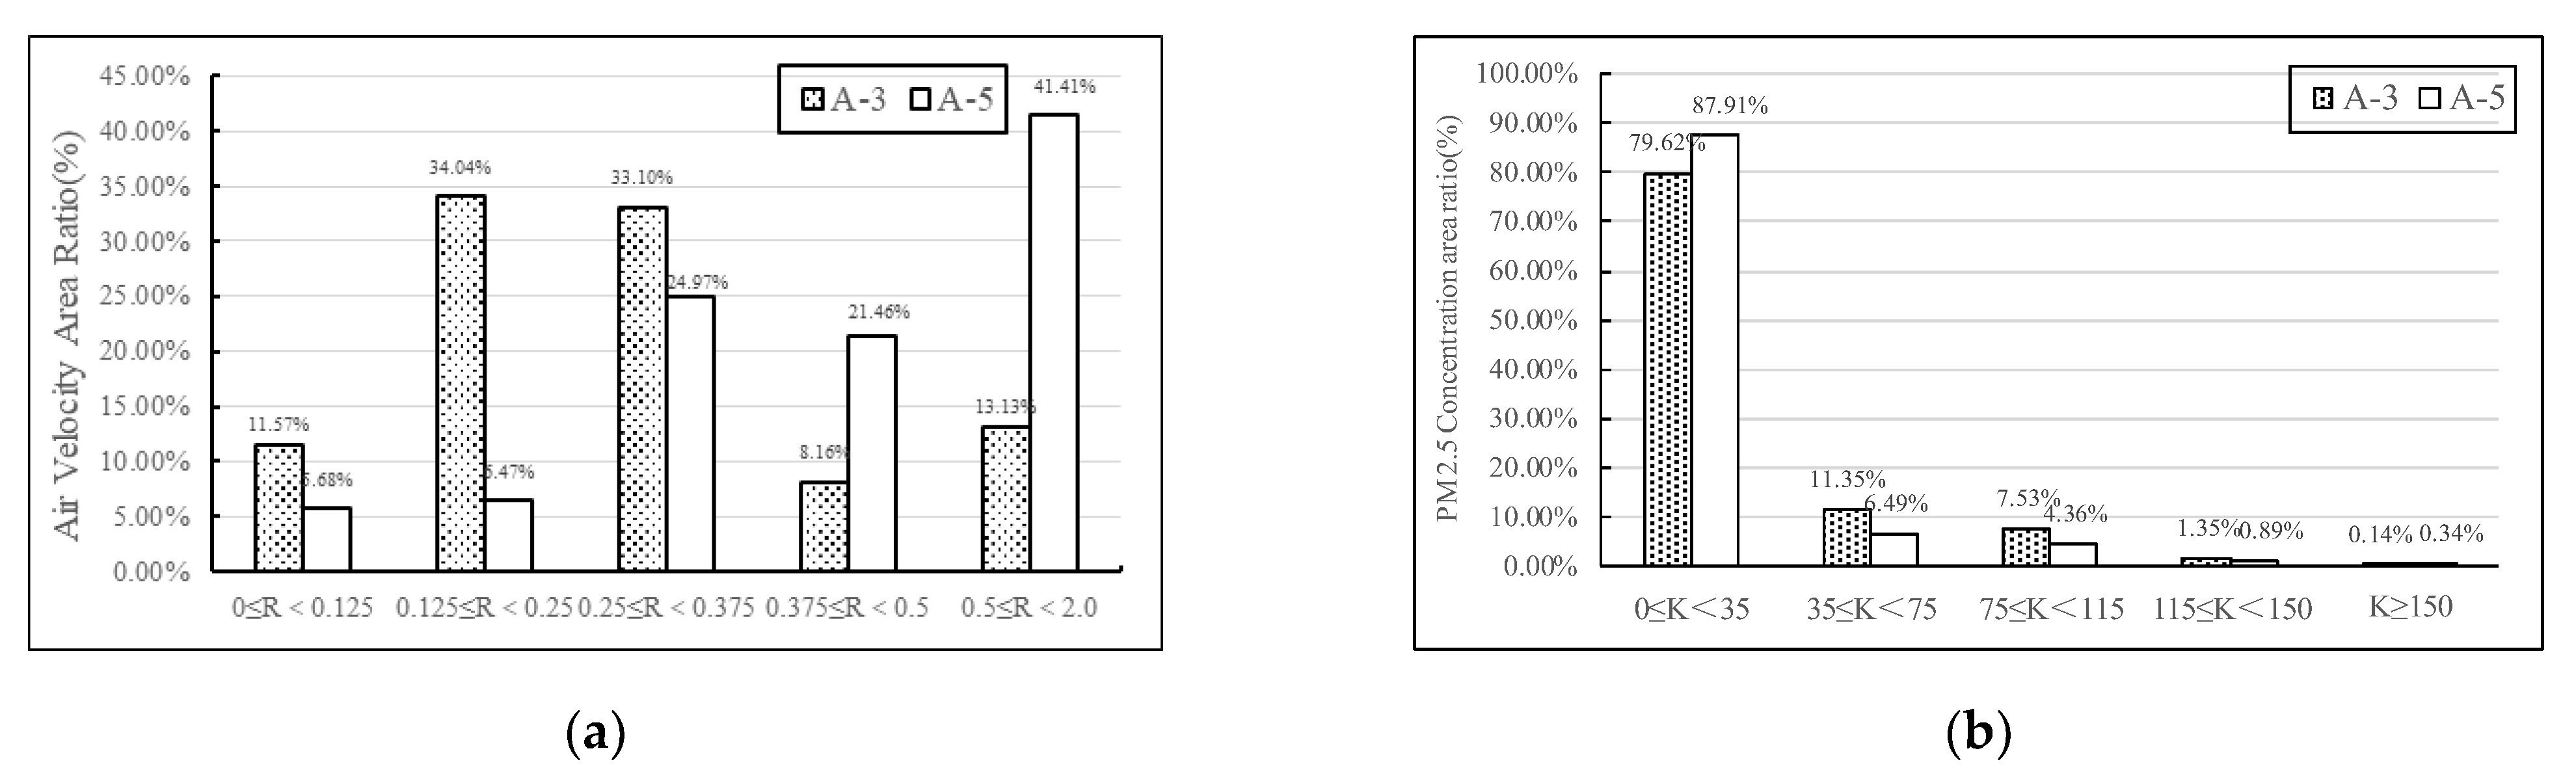
3.2.4. Influence of Inner-Courtyard Layout on Cooking Pollutants Diffusion
4. Conclusions
Author Contributions
Funding
Data Availability Statement
Acknowledgments
Conflicts of Interest
References
- Reumer, R.R.; Kusumaningrum, H.D. Kitchen hygiene in daily life. Int. Biodeterior. Biodegrad. 2003, 51, 299–302. [Google Scholar]
- Zhang, Y.; Wang, T.; Liu, X.; Zhu, Y.; Yang, Y. Simulation analysis and experimental study of the cooker hoods of high-rise residential buildings. Appl. Sci. 2018, 8, 777. [Google Scholar] [CrossRef]
- Zhang, Y.; Wang, Q.; Meng, C. Healthy Building: From Concept to Practice, 1st ed.; China Architecture & Building Press: Beijing, China, 2019. [Google Scholar]
- Wang, L.; Xiang, Z.; Stevanovic, S.; Ristovski, Z.; Salimi, F.; Gao, J.; Wang, H.; Li, L. Role of Chinese cooking emissions on ambient air quality and human health. Sci. Total Environ. 2017, 589, 173–181. [Google Scholar] [CrossRef] [PubMed]
- Géhin, E.; Ramalho, O.; Kirchner, S. Size distribution and emission rate measurement of fine and ultrafine particle from indoor human activities. Atmos. Environ. 2008, 42, 8341–8352. [Google Scholar] [CrossRef]
- Liao, C.; Chen, S.; Chen, J.; Liang, H. Contributions of Chinese-style cooking and incense burning to personal exposure and residential PM concentrations in Taiwan region. Sci. Total Environ. 2006, 358, 72–84. [Google Scholar] [CrossRef]
- Gautam, S.; Pillarisetti, A.; Yadav, A.; Singh, D.; Arora, N.; Smith, K. Daily average expo-sures to carbon monoxide from combustion of biomass fuels in rural households of Haryana, India. Environ. Dev. Sustain. 2019, 21, 2567–2575. [Google Scholar] [CrossRef]
- Zhang, H. The Research about Particle Pollution Transport Characteristics from Kitchen under Different Ventilation Modes. Masteral Dissertation, Tianjin University, Tianjin, China, 2018. [Google Scholar]
- Wang, M.; Zheng, Q.; Wang, X. The influence of windowsill height on the environment pollutants in the residential kitchen. Build. Energy Environ. 2016, 35, 34–36+41. [Google Scholar]
- Cao, C.; Lyu, L.P.; Gao, J.; Zeng, L.; Wu, Y.; Xie, W.; Chen, Y.; Zhang, J. Experimental study on capture efficiency of household range hoods. J. HV&AC 2019, 49, 24–30. [Google Scholar]
- Sharma, D.; Jain, S. Impact of intervention of biomass cookstove technologies and kitchen characteristics on indoor air quality and human exposure in rural settings of India. Environ. Int. 2019, 123, 240–255. [Google Scholar] [CrossRef]
- Ling, W.; Ge, L.; Hao, S.; Li, D.; Dong, J. Pollutant Simulation and Spatial Optimization Strategies of Enclosed Kitchen in Residential Buildings. Archit. J. 2021, 2, 56–61. [Google Scholar]
- Yang, X.; Ni, Y. Layout design of high-rise multi-family residence based on idea of traditional Chinese courtyard. South Archit. 2016, 03, 108–116. [Google Scholar]
- Hu, X.; Cai, L.; Ying, X. A study of the impact of inner courtyard layout on interior wind environment of middle flats of high-rise residential buildings with multiple flats sharing one staircase. Archit. J. 2015, 06, 58–62. [Google Scholar]
- Shi, F.; Zhuang, T. Simulation and analysis on interior wind environment of middle flats of high-rise residential buildings based on Xiamen area. Huazhong Archit. 2018, 36, 38–43. [Google Scholar]
- Ramponi, R.; Blocken, B. CFD simulation of cross-ventilation for a generic isolated building: Impact of computational parameters. Build. Environ. 2012, 53, 34–48. [Google Scholar] [CrossRef]
- Karava, P.; Stathopoulos, T.; Athienitis, A. Airflow assessment in cross ventilated buildings with operable façade elements. Build. Environ. 2011, 46, 266–279. [Google Scholar] [CrossRef]
- Zeng, L.; Du, B.; Lyu, L.; Gao, J.; Zhang, C.; Tong, L.; Liu, G. Occupant exposure and ventilation conditions in Chinese residential kitchens: Site survey and measurement for an old residential community in Shanghai. J. Build. Eng. 2020, 31, 101406. [Google Scholar] [CrossRef]
- Cao, C.; Gao, J.; Wu, L.; Ding, X.; Zhang, X. Ventilation improvement for reducing individual exposure to cooking-generated parti-cles in Chinese residential kitchen. Indoor Built Environ. 2017, 26, 226–237. [Google Scholar] [CrossRef]
- Kang, K.; Kim, H.; Kim, D.D.; Lee, Y.G.; Kim, T. Characteristics of cooking-generated PM10 and PM2.5 in residential buildings with different cooking and ventilation types. Sci. Total Environ. 2019, 668, 56–66. [Google Scholar] [CrossRef]
- Chen, C.; Zhao, Y.; Zhao, B. Emission Rates of Multiple Air Pollutants Generated from Chinese Residential Cooking. Environ. Sci. Technol. 2018, 52, 1081–1087. [Google Scholar] [CrossRef]
- Zhao, Y.; Chen, C.; Zhao, B. Emission characteristics of PM2.5-bound chemicals from residential Chinese cooking. Build. Environ. 2019, 149, 623–629. [Google Scholar] [CrossRef]
- Poon, C.; Wallace, L.; Lai, A. Experimental study of exposure to cooking emitted particles under single zone and two-zone environments. Build. Environ. 2016, 104, 122–130. [Google Scholar] [CrossRef]
- Xiang, J.; Hao, J.; Austin, E.; Shirai, J.; Seto, E. Residential cooking-related PM2.5: Spatial temporal variations under various intervention scenarios. Build. Environ. 2021, 201, 108002. [Google Scholar] [CrossRef]
- Gan, Y. Numerical Simulation and Control Research of PM2.5 Pollutant in Residential Kitchen. Masteral Dissertation, Guangdong University of Technology, Guangdong, China, 2019. [Google Scholar]
- Zhuang, Z.; Yu, Y.; Ye, H.; Tan, H.; Xie, J. Review on CFD Simulation Technology of Wind Environment around Buildings. Build. Sci. 2014, 30, 108–114. [Google Scholar]
- Liu, Y. Study and Analysis of Fine Particle Distribution and Occupant’s Exposure in a Northern residential Kitchen. Masteral Dissertation, Shenyang Jianzhu University, Shenyang, China, 2017. [Google Scholar]
- Li, T.; Cao, S.; Fan, D.; Zhang, Y.; Wang, B.; Zhao, X.; Leaderer, B.P.; Shen, G.; Zhang, Y.; Duan, X. Household concentrations and personal exposure of PM2.5 among urban residents using different cooking fuels. Sci. Total Environ. 2016, 548–549, 6–12. [Google Scholar] [CrossRef]
- Gao, J.; Cao, C.; Xiao, Q.; Xu, B.; Xiang, Z.; Xu, Z. Determination of dynamic intake fraction of cooking-generated particles in the kitchen. Build. Environ. 2013, 65, 146–153. [Google Scholar] [CrossRef]
- Yu, L.; Li, H.; Feng, G. Simulation of inhalable aerosol particle distribution generated from cooking by Eulerian approach with RNG k–epsilon turbulence model and pollution exposure in a residential kitchen space. Build. Simul. 2017, 10, 135–144. [Google Scholar]


| Measured Parameter | Test Apparatus | Type | Range | Precision |
|---|---|---|---|---|
| Air velocity and wind direction in the environment | Environmental monitor | PC-8 Series Sensor | 0~70 m/s 0~360° | ±0.5 m/s ±3° |
| Indoor air velocity | Hot-line anemometer | SENTRY ST-730 | 0~20 m/s | 0.01 m/s |
| PM2.5 concentration | BOHU portable air quality recorder [18] | B1, BOHU CO | 0~1999 μg/m3 | ±1 μg/m3 |
| Case | Cooking Method | Range Hood | Doors | Windows | Measurement Time |
|---|---|---|---|---|---|
| Case 1 | Frying an egg | Low speed | Open | Open | 12:00–12:05, October 24th |
| Case 2 | Frying an egg | Low speed | Open | Closed | 12:10–12:15, October 24th |
| Case 3 | Frying an egg | Low speed | Closed | Open | 12:20–12:25, October 24th |
| Case 4 | Frying an egg | Low speed | Closed | Closed | 12:30–12:35, October 24th |
| Boundary Name | Boundary Condition | DPM Boundary | Setting Content |
|---|---|---|---|
| INLET | Velocity-inlet | Escape | (1) Velocity-inlet: , 10 m, = 2.02 m/s (summer), = 0.22; (2) Turbulent kinetic energy and turbulent dissipation rate: , , , is Turbulent kinetic energy, is turbulent dissipation rate. |
| OUTLET | Pressure-outlet | Escape | Pressure-outlet |
| GROUND | No-Slip | Reflect | No-Slip |
| WALL-SIDE | Symmetry | — | Symmetry |
| WALL-UP | Symmetry | — | Symmetry |
| WALL-INNER | No-Slip | Reflect | No-Slip |
| Boundary Name | Boundary Condition | DPM Boundary | Temperature (K) | Setting Value |
|---|---|---|---|---|
| Stove top | Velocity-inlet | Wall-jet | 423.15 K | 0.60 m/s |
| Exhaust vent of cook hook | Exhaust | Escape | 313.15 K | −150 Pascal |
| Doors and windows | Interior | — | 293.15 K | — |
| Wall and ground/operating tables/human model, etc. | Wall | Reflect | 288.15 K | — |
| Indicators | Point P | Point 1 | Point 2 | Point 3 | Point 4 | Point 5 | |
|---|---|---|---|---|---|---|---|
| Air velocity (m/s) | Vtest | 0.75 | 1.26 | 1.63 | 1.45 | 1.25 | 0.35 |
| VCFD | 0.58 | 1.55 | 1.82 | 1.54 | 1.52 | 0.42 | |
| PM2.5 Concentration (μg/m3) | Ctest | 11.0 | 35.1 | 81.8 | 128.3 | 308.7 | 145.5 |
| ftest | 0.036 | 0.114 | 0.265 | 0.416 | 1 | 0.471 | |
| CCFD | 6.86 | 24.4 | 57.2 | 87.9 | 254.0 | 98.3 | |
| fCFD | 0.027 | 0.096 | 0.225 | 0.346 | 1 | 0.387 | |
| Case | Actual Flat Plan | Simplified Flat Plan |
|---|---|---|
| A-1(Control group) |  | 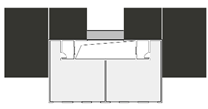 |
| A-2 | 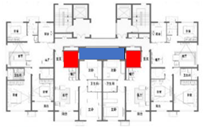 | 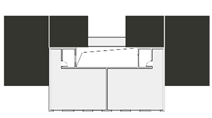 |
| A-3 | 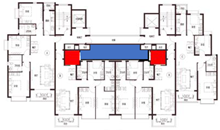 | 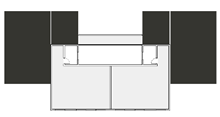 |
| A-4 | 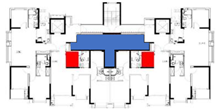 | 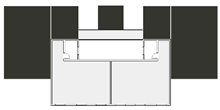 |
| A-5 | 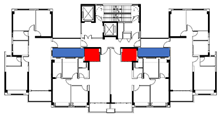 | 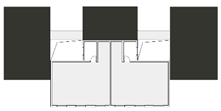 |
| Design Factor | Comparative Case | ||
|---|---|---|---|
| 1 | Inner-Courtyard Effectiveness | Case A-1 | Case A-2 |
| 2 | Inner-Courtyard Openness | Case A-2 | Case A-3 |
| 3 | Inner-Courtyard Blocking Degree | Case A-3 | Case A-4 |
| 4 | Inner-Courtyard Layout | Case A-3 | Case A-5 |
| Case | 3F | 9F | 17F | |
|---|---|---|---|---|
| A-1 |  | 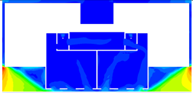 |  |  |
| A-2 |  | 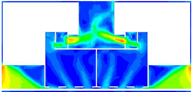 | 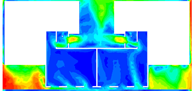 | |
| A-3 | 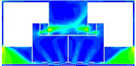 | 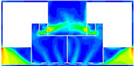 | 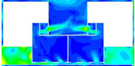 | |
| A-4 |  |  |  | |
| A-5 |  | 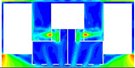 | 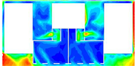 |
| Case | 3F | 9F | 17F | |
|---|---|---|---|---|
| A-1 |  | 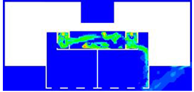 | 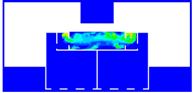 |  |
| A-2 |  |  |  | |
| A-3 | 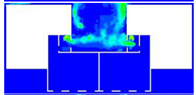 |  | 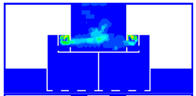 | |
| A-4 |  |  |  | |
| A-5 |  |  |  |
Publisher’s Note: MDPI stays neutral with regard to jurisdictional claims in published maps and institutional affiliations. |
© 2022 by the authors. Licensee MDPI, Basel, Switzerland. This article is an open access article distributed under the terms and conditions of the Creative Commons Attribution (CC BY) license (https://creativecommons.org/licenses/by/4.0/).
Share and Cite
You, J.; Wang, M.; Li, J.; Xu, S.; Cao, C.; Shao, S. Influence of Cooking Pollutant Diffusion Regularity by High-Rise Residential Inner-Courtyard Forms in Wuhan. Buildings 2022, 12, 1452. https://doi.org/10.3390/buildings12091452
You J, Wang M, Li J, Xu S, Cao C, Shao S. Influence of Cooking Pollutant Diffusion Regularity by High-Rise Residential Inner-Courtyard Forms in Wuhan. Buildings. 2022; 12(9):1452. https://doi.org/10.3390/buildings12091452
Chicago/Turabian StyleYou, Jieqi, Minghao Wang, Jianru Li, Shen Xu, Changsheng Cao, and Shuangquan Shao. 2022. "Influence of Cooking Pollutant Diffusion Regularity by High-Rise Residential Inner-Courtyard Forms in Wuhan" Buildings 12, no. 9: 1452. https://doi.org/10.3390/buildings12091452
APA StyleYou, J., Wang, M., Li, J., Xu, S., Cao, C., & Shao, S. (2022). Influence of Cooking Pollutant Diffusion Regularity by High-Rise Residential Inner-Courtyard Forms in Wuhan. Buildings, 12(9), 1452. https://doi.org/10.3390/buildings12091452