Abstract
A precast concrete deck-steel beam-connection concrete (PCSC) connector using ultra-high-performance concrete (UHPC) as post-cast concrete has been proposed to enable rapid on-site construction of assembled composite bridges. This paper aims to optimize the structure of PCSC connectors using the finite element (FE) model to maximize material utilization and economic efficiency. A refined FE model comprising the bond degradation at the steel–UHPC interface was developed based on the push-out experimental results of PCSC connectors. The shear mechanism of the PCSC connectors was analyzed. Subsequently, parametric analyses were performed to investigate the effects of stud diameter, height, spacing, and concrete strength on the mechanical properties of PCSC connectors. The results indicate that the bond at the steel–connection concrete interface positively affects the shear bearing capacity and stiffness of the PCSC connectors. When UHPC was used as connection concrete, it improved the bearing capacity by about 20% and the shear stiffness of the stud by about 16% compared with normal concrete, but the ductility was 38% lower. It was also found that increasing the compressive strength of the connection concrete increased the shear strength of specimens. However, when the compressive strength of UHPC exceeded 130 MPa, the additional UHPC strength did not significantly enhance the shear performance of specimens. In order to ensure the effective restraint of the connection concrete to studs, it is recommended that the minimum width and height of the connection concrete (UHPC) be determined based on the minimum horizontal spacing and height of the studs. Specifically, the length-to-diameter ratio of studs is greater than or equal to 3.18, the horizontal spacing of studs can be at least 2.82 d, and the clear distance between the outer stud shank and the edge of the UHPC cannot be less than 30 mm. The results are expected to provide a reference for the engineering design of PCSC connectors and a reference for conventional stud connectors with UHPC.
1. Introduction
In assembled steel–concrete composite structures, shear connectors connect the steel beams to the concrete slab and make them work together. The stud connectors have been widely used because of their geometrical simplicity, rapid installation, and ability to accommodate multi-directional shear forces [1]. Meanwhile, UHPC has been widely used in composite bridge decks and cast-in-place materials for its excellent compressive strength, tensile strength, ductility, durability, and fluidity [2]. UHPC, as cast-in-place material for assembled steel–concrete connectors, can provide more reliable connection strength, less reserved space, and simpler design of precast components, which can significantly simplify the construction process and improve the efficiency of bridge construction [3,4,5,6].
However, design details about composite beam bridges using UHPC are not contained in the current specifications. We investigated the studies related to the shear performance of studs embedded in UHPC by domestic and foreign scholars to optimize the design structures of the PCSC connectors proposed by our team [7], i.e., the design parameters such as stud length-to-diameter ratio and concrete thickness. Kim et al. [8] investigated the ultimate strength and slip of stud connectors embedded in UHPC decks through 15 push-out experiments. The results showed that thinner UHPC slabs were feasible compared to normal concrete (NC) slabs. The length-to-diameter ratio of the studs was reduced from 4 to 3.1 without a reduction in ultimate shear strength. The protective layer was reduced from 50 mm to 25 mm without the formation of splitting cracks in the UHPC slabs. Ali [9] conducted double shear tests to evaluate the static performance of UHPC shear pockets for composite bridges. The results indicate the stud arrangement had a negligible effect on the shear capacity, but it had a significant effect on the slip. The strains in the shear stud near its head were only 26% of the yield strain, which indicates the embedment length (208 mm) can be reduced. Moreover, the strength of the precast concrete plays an important role in the failure mode. Zachary [10] has developed two new types of deck-to-girder composite connections using UHPC. Both connections employed short shear studs to transfer load between the girder and the haunch but employed UHPC shear lug and rebar dowel to transfer load between the haunch and the deck, respectively. Based on large-scale testing, the interface shear strength of UHPC lugs could be as high as 47 MPa, and the minimum interface shear strength could be as low as 20 MPa. Long-headed studs within the haunch-to-deck connection enhanced the load-carrying capacity of the UHPC lug connection. For the rebar dowel connection, the ultimate behavior is influenced by the dowel embedment length. The embedment length of the rebar dowel has been suggested as being between 4 d and 6.5 d depending on the type and specified yield strength of the bars and the cover provided, and the horizontal shear friction resistance of the UHPC rebar dowel connection can be conservatively calculated using the provisions in AASHTO. Cao et al. [11] found that the damage mode of specimens with studs of the length-diameter ratio of 2.7 (35/13 mm) embedded in 50 mm thick UHPC plates was stud fracture, and the UHPC layer was not significantly damaged. This phenomenon confirms that the steel–UHPC composite structure is superior to the steel–NC composite structure in terms of crack resistance and failure mode. Fang et al. [12] explored the static behavior of cluster stud connectors in steel–UHPC composite structures through experiments with 18 push-out specimens. The authors recommend that the length-to-diameter ratio of studs embedded in 50 mm thick UHPC slabs should be greater than 1.84 to ensure the failure mode is stud fracture. Furthermore, it is conservatively recommended that the 5 d longitudinal stud spacing and 2.5 d transverse stud spacing specified in EC-4 be taken as the boundary of the stud arrangement for steel–prefabricated UHPC composite structures; otherwise, the group stud effect should be considered. Ding [13] investigated the effects of stud diameter, stud length-to-diameter ratio, and stud spacing on the shear properties of group stud connectors (GSC) embedded in UHPC. The damage mode of all push-out specimens was stud shear, with only localized damage in the UHPC slabs and no visible cracks in the concrete slabs. The reduction of the stud spacing from 4 d to 2.5 d leads to a decrease in the shear resistance of specimens. Meanwhile, the authors found that large diameter studs matched well with UHPC slabs and had a high resistance to deformation. Kruszewski [14] verified that the shear bearing capacity of the studs could be fully utilized even with a much smaller stud spacing, i.e., 2 d transverse spacing and 2 d longitudinal spacing. Moreover, the higher the compressive strength of UHPC, the higher the shear bearing capacity of the studs due to the load-bearing effect of the weld collar. However, as the compressive strength of UHPC increased, the ultimate slip of the specimen decreased, which indicated the loss of ductility of the connectors. Because of the higher strength, UHPC restrains the studs more effectively and minimizes the bending deformation of the stud. The above-mentioned experimental study found that the restraint of the studs was enhanced because of the ultra-high compressive strength of UHPC. Thus, the bearing capacity of the connectors was improved. Meanwhile, using UHPC as a connection material can reduce the length-to-diameter ratio and the minimum spacing of studs compared to normal concrete.
In push-out experiments, load-slip data are usually recorded, and failure modes are observed. However, the load transfer mechanism of stud connectors is not easily understood in depth by only experimental results, as some critical information is difficult to measure and quantify in experiments. Fine finite element (FE) analysis has been widely used to study the mechanical mechanisms and damage behavior of connectors, and the design of connectors can be optimized by parametric analysis. Kruszewski [15] developed a FE model based on physical material properties using ABAQUS. The model explicitly considers the effects of material damage, contact between the studs and UHPC, and the geometry of the weld collar of studs. The FE results matched well with the experimental results. Cao [16] investigated the shear behavior of studs embedded in UHPC and the damage process of the specimens using the FE model. Cao believed that the weld collar contributed to the shear strength of the studs embedded in UHPC. Therefore, he established two weld collar cross-sections (rectangular and 1 mm × 1 mm slope) for comparative analysis and considered three strengths of the weld collar. The results show that the weld collar shape had little effect on the results, and the simpler the rectangular cross-section, the more consistent the test and the lower the time cost. When the weld collar strength was not less than the stud strength, the predicted load-slip curves usually agreed with the test results; otherwise, the results were underestimated. Guan [17] et al. investigated the shear properties of short studs in steel–ECC composite structures based on validated finite element models. The results showed that interfacial bonding improved the initial shear stiffness of the push-out specimens. The difference between the specimens gradually decreased with the degradation of the bond. The increase in stud diameter and tensile strength significantly enhanced the shear strength of studs, while the stud height and compressive strength of ECC exhibited the opposite trend. The stud corrosion significantly reduced the shear strength and ductility of the studs. It was also found that the AASHTO LRFD code overestimated the shear strength of short-headed studs embedded in ECC, while the EC4 and Chinese codes were relatively conservative.
In addition to the mechanical properties of the studs, the bonding properties of the interface can have a positive effect on the shear performance of the connectors. Mostafa [18] presented a new deck-to-girder connection using UHPC. Double shear tests were conducted to evaluate the interface shear resistance of the connection. Test results indicated that interface shear resistance of the connection could be predicted using the AASHTO LRFD shear friction model with different cohesion and friction factors dependent on the UHPC compressive strength. Chang et al. [19] and Qu et al. [20] conducted push-out tests on circular concrete-filled steel tube (CFST) columns and rectangular CFST columns, respectively, which found that the higher strength of concrete could improve the bond strength of the steel–concrete interface. However, Yan et al. [21] found that the lower strength of concrete can improve the interfacial bond strength. As a result of the increased shrinkage caused by the higher-strength concrete, the physical bond between the concrete and the steel pipe might be weakened. Degee [22] investigated the contribution of studs to the bond strength at the steel–composite interface and found that studs significantly increased the interfacial bond strength. Therefore, the shear mechanical properties of steel–concrete connectors may be influenced by the above-mentioned variables.
The purpose of this paper is to optimize the structure of PCSC connectors by utilizing FE models. The fine FE model comprising the bond degradation at the steel–UHPC interface was developed based on a push-out experiment of PCSC connectors. PCSC connectors have a larger steel–concrete interface than cluster stud connectors, and the connection concrete adopts UHPC. Hence, it is necessary to study the effect of the steel–UHPC interface on the mechanical properties of the connectors. As an excellent tool, numerical analysis can reproduce complex mechanical transfer mechanisms and interface behavior. In this study, the FE model was used to predict the load-slip curve, stud shear strength, shear stiffness, degradation process of the interface, and damage process of each component of the specimen. Furthermore, the effects of stud diameter, stud height, stud spacing, and the strength of the connection concrete and precast concrete slab on the mechanical behavior of the PCSC connector were parametrically analyzed based on the experimentally validated FE model.
2. Overview of Push-Out Experiments
The load-slip behavior of PCSC connectors can be obtained by push-out experiments. A brief overview of the experimental parameters and failure modes for the PCSC connectors is presented in this section. For further parametric analysis, experimental results must be utilized to validate the accuracy of the FE model.
The parameters studied in the experiments included two different diameters of studs and two different materials for connection concrete. Figure 1 presents the specific geometric dimensions of all specimens. The design principle and the layout of the components are the same for all specimens. Compared to the specimen with a stud diameter of 22 mm, the specimen with a stud diameter of 13 mm differs only in geometry due to the geometry of each component being removed to match the load-bearing capacity of the specimen. SCM1-120 represents a standard specimen with a stud diameter of 22 mm, where S represents the standard specimen, CM represents the connection concrete material, and the number “120” represents the stud height of 120 mm. M1R1H1, M1R2H1, and M2R1H1 all represent specimens with a stud diameter of 13 mm, where M represents the connection concrete material; R represents shear connection reinforcement; the number “1” is the standard form, and the number “2” is the simplified form, as shown in Figure 1b. H represents the height of the connection concrete. The SCM1-120 specimen, with a 22 mm diameter of the studs, is taken as a representative specimen to investigate the shear behavior of the PCSC connectors as well as the parameter analysis. The specimen with a stud diameter of 13 mm is only used as the basis for the accuracy of the established finite element model. The detailed parameters of all specimens can be seen in Table 1.
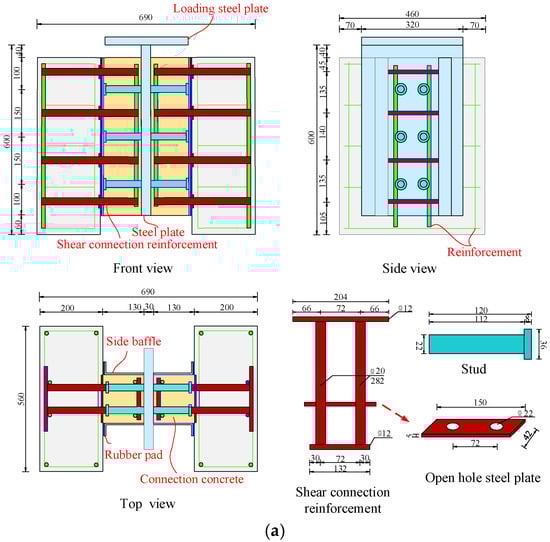
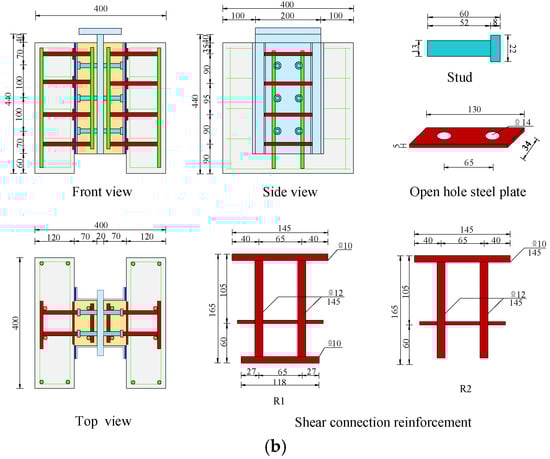
Figure 1.
Details of push-out specimens: (a) SCM1-120 soecimen; (b) Specimen with 13 mm diameter stud. (Unit: mm).

Table 1.
Summary of experiments details and parameters.
The steel–concrete interface of all specimens was naturally bonded. To ensure that the shear bearing capacity of the specimen is controlled by the studs, the product of the cross-sectional area and yield strength of shear connection reinforcements is greater than or equal to the product of the cross-sectional area and yield strength of all studs. The height and width of the connection concrete depend on the height and spacing of the studs. Specifically, the height of the connection concrete is equal to the height of the studs plus 10 mm of the protective layer thickness. The UHPC material used in this study was a commercially available product available in China. Mix proportions of precast concrete are listed in Table 2.
Table 2.
Mix ratio of precast concrete.
A 10,000 kN hydraulic was used to load the push-out test. The setup of the test loading device and slip measurement is shown in Figure 2. A layer of fine sand was evenly spread on the bottom of the specimen to ensure uniform contact between the specimen and the loading platform while reducing the friction effect. A steel plate was placed on top of the specimen to spread the loading force. Two dial indicators measured the slip at the precast concrete slab–connection concrete interface, while four dial indicators measured the slip at the steel–connection concrete interface. Three preloading were conducted prior to loading to confirm the effectiveness of each device. During loading, the loading rate did not exceed 5 kN/s. The data were recorded, and the formation of cracks was observed. When the loading entered the plastic phase, and significant slippage occurred, the loading rate was reduced to 0.01 mm/s, and the displacement increments of 0.1 mm were recorded as data points until failure. The test results revealed that the damage mode of PCSC connectors was stud fracture due to slippage at the steel–connection concrete interface.
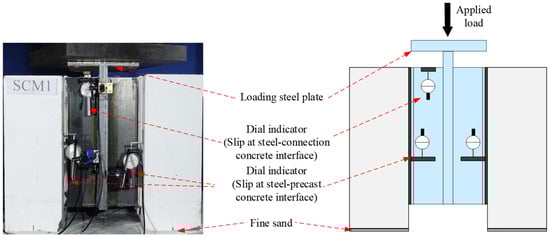
Figure 2.
Test setup and measuring point arrangement.
3. Modelling of Push-Out Tests
3.1. Geometry of Push-Out Specimens
The fine finite element (FE) model established by ABAQUS can fully study the mechanical properties of the PCSC connectors and the whole process of damage. In this paper, the calculation of the FE model of the push-out test was realized by the method of dynamic display. The dynamics display uses the central difference method to solve the nonlinear problem without iteration, so the model is more easily converged.
The push-out specimen consists of steel plate, stud, concrete slab, UHPC connection concrete, reinforcement, and shear connection reinforcement. SCM specimens are presented as representative specimens for detailed modeling steps due to the same component composition, interface parameters, and element type for all specimens. The finite element model is shown in Figure 3. Due to the structural symmetry of the specimen, only a quarter model was built to reduce the computational cost. For the ZX plane, the Y-plane symmetry constraint was used. For the ZY plane, the X-plane symmetry constraint was used. The degrees of freedom in all directions of the bottom surface of the supporting steel plate were constrained for simulating the ground.
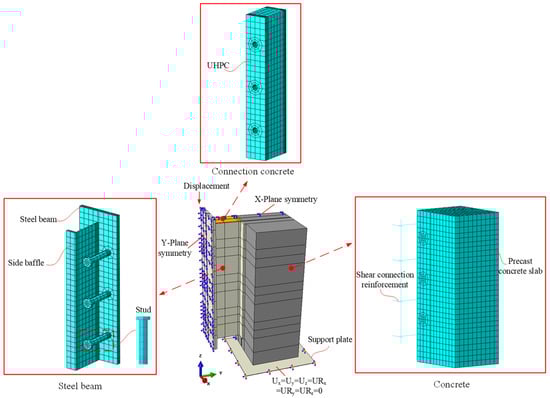
Figure 3.
FE model of push-out specimen.
Steel plates, studs, concrete, and support slabs were all meshed with the solid element C3D8R, which is an 8-node linear brick with reduced integration. Reinforcements and shear connection reinforcements were all meshed with the beam element B31, which is a 2-node linear beam in space. The FE model meshed with a global element size of 20 mm. The area around the stud root in the high-stress region meshed with a local element size of 4 mm. The finite element simulation was performed by displacement loading. Based on the test results, the displacement was set to 10 mm.
3.2. Interaction of Interface
The interactions between different components are a critical and difficult part of the push-out model. The interactions in this model include steel plate and UHPC, studs and UHPC, reinforcement and concrete, and precast concrete slab and UHPC. Reinforcements and shear connection reinforcements were embedded in the concrete. The damage state from the push-out test reveals that there was no slip at the interface between the precast concrete slab and UHPC, so a “tie” constraint was applied to this interface, as shown in Figure 4a. The interaction between the studs and UHPC and the concrete and the support slab adopted surface-to-surface contact. The contact properties include normal and tangential behavior. Normal behavior was adopted with “hard contact”, meaning that when the interacting surfaces are separated, the contact constraints of the corresponding nodes are removed. The tangential behavior was defined by the “penalty” function, where the interface friction coefficient was set to 0.6.
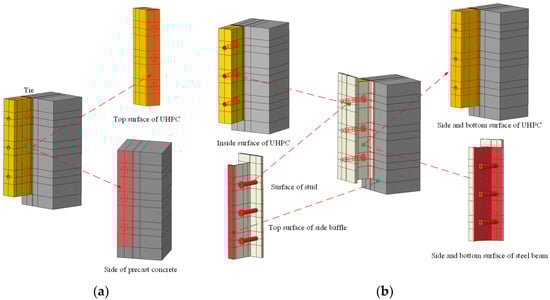
Figure 4.
Interaction between steel and UHPC: (a) interaction at precast concrete-UHPC interface; (b) interaction at steel–UHPC interface.
Due to the addition of side baffles, PCSC connectors have a larger steel–concrete interface than conventional stud connectors. Therefore, the steel–concrete interface was simulated by traction separation-based modeling for this structural feature of the PCSC connector. The cohesive law for the steel–concrete interface is described in Section 3.4. The steel–concrete interface behavior includes bonding and tangential friction. After the failure of the steel–concrete bond, friction ensues with the development of interface slip due to the lateral restraint provided by the side baffles for the connection concrete. The friction coefficient was set to 0.6.
3.3. Constitution Relationship of Material
3.3.1. Steel
The loading steel plate is considered an ideal elastic-plastic material in the push-out test. The steel plate steel grade was Q345, and the yield strength (fy) was 345 MPa. Figure 5a illustrates the stress–strain relationship of the steel plate. The trilinear stress–strain curve of reinforcements is shown in Figure 5b. The steel grade was HRB400, and the material properties were based on the results of the material properties test. The Poisson’s ratio was 0.3, the modulus of elasticity (Es) was 210 GPa, the yield strength (fy) was 416 MPa, and the ultimate strength (fu) was 564 MPa.
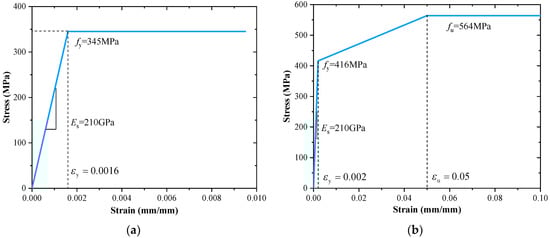
Figure 5.
Constitutive relationship of steel: (a) stress–strain curve of steel beam; (b) stress–strain curve of reinforcement.
The constitution relationships of the stud with two diameters are shown in Figure 6. The elastic modulus of the studs was equal to 205 GPa, and Poisson’s ratio was equal to 0.3. The yield strength (fy) of studs with a diameter of 22 mm was equal to 428 MPa, the corresponding yield strain was 0.0021, the ultimate strength (fu) was 480 MPa, and the corresponding plastic strain in the ultimate state was 0.006. The material parameters of the stud with a diameter of 13 mm were taken as follows: the value of yield strength (fy) was 430 MPa, the corresponding yield strain was 0.0021, the ultimate strength (fu) was equal to 500 MPa, and the corresponding plastic strain () in the ultimate state was 0.006. The above values are not significantly different from the material properties of the studs in the published literature [15,23]. The bearing capacity of the specimen depends on the studs because the failure mode of the specimen is stud fracture, according to the push-out test results. In this FE model, the stud fracture strain was defined as 0.2 to facilitate the observation of step at stud fracture.
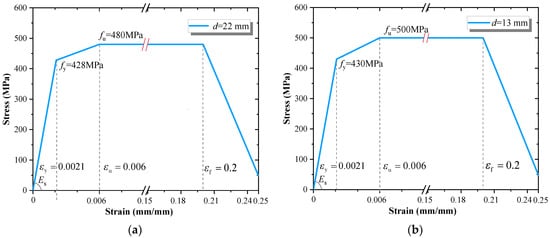
Figure 6.
Constitutive relationship of headed studs: (a) studs with 22 mm diameter; (b) studs with 13 mm diameter.
3.3.2. Normal Concrete
The material properties of the concrete were simulated using the concrete damaged plasticity (CDP) model provided in ABAQUS. The CDP model includes compression damage and tensile damage, which is suitable for simulating unrecoverable material degradation caused by damage. The degradation is mainly reflected in the difference in the tensile and compressive yield strengths of the material. The material enters the softening stage after tensile yielding, and the material undergoes a process of hardening followed by softening after compressive yielding. The uniaxial tensile and compressive stress–strain curves for normal concrete are shown in Figure 7. The compressive curve of concrete was divided into three parts; the elastic phase ended at 0.4fcm, the plastic phase curve was calculated according to Equation (1) [24], and the end point of the falling phase was 0.85fcm, corresponding to the ultimate strain () was 0.0035.
where denotes the compressive stress of the concrete and is 0.8 times the compressive strength of the concrete cube. k is the plasticity constant, which is defined as ; , denotes the compressive strain of concrete, is the peak strain, equal to 0.0023 [25]. Ec is the elastic modulus of concrete, and the value was 36 GPa.
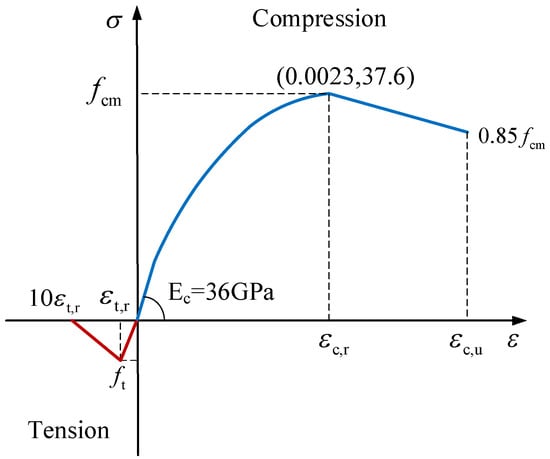
Figure 7.
Constitutive relationship of the normal concrete.
The concrete tensile curve consists of two lines, and the stress increases linearly with strain until the concrete cracks after reaching the tensile strength (ft) with a value of 3.06 MPa. denotes the tensile strain, which is defined as . The curve form of the stress drop after cracking of concrete can have a negligible effect on the simulation results of this push-out test model. Therefore, to improve the convergence speed of the model calculation, it is assumed that the stress decreases linearly after the concrete cracking in tension, and the ultimate tensile strain is defined as 10. Different damage factors were selected for tension and compression of concrete, which were defined as and [26].
3.3.3. UHPC
The material properties of UHPC are also simulated using the CDP model. Among the elastic parameters of UHPC, the elastic modulus was 43 GPa, and Poisson’s ratio was 0.3. Plasticity parameters include dilation angle, eccentricity, a ratio of biaxial and uniaxial compressive strength, K, and viscosity parameter, with values of 36°, 0.1, 1.16, 0.6667, and 0.0005. Yang et al. [27]. The compressive stress–strain curve proposed based on the uniaxial compressive of UHPC is shown in Figure 8a, and its calculation equation is given in Equation (2).
where fc is the uniaxial compressive strength of UHPC, which is 0.95 times the compressive strength of the cube, MPa. , Ec is the initial elastic modulus, and E0 is the secant modulus of the peak stress fc. is the strain corresponding to the peak stress, and the value was 0.0035.
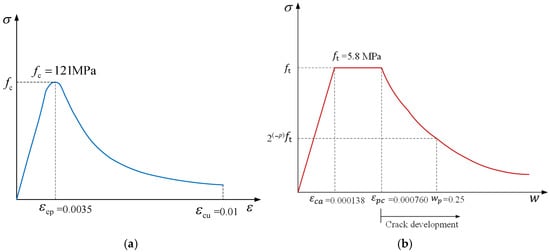
Figure 8.
Constitutive relationship of the UHPC: (a) compression; (b) tension.
Based on the direct tension test, Zhang et al. [28] proposed the tensile stress–strain curve (Figure 8b) and the calculation equation (Equation (3)) for UHPC. Compared with normal concrete, the stress–strain curve of UHPC includes the strain hardening stage and the fine crack width development stage.
where, ft is the tensile strength of UHPC, the value was 5.8 MPa. = 0.0002, = 0.001941, = 0.25 mm, = 0.95.
The tensile and compressive damage development curves of UHPC calculated from Equation (4) are shown in Figure 9.
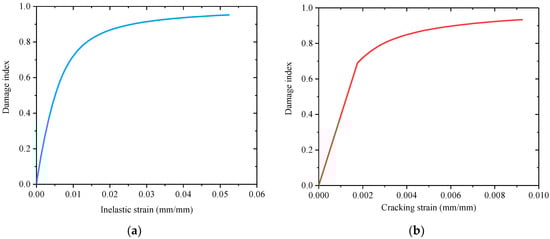
Figure 9.
Damaged index–strain curve of the UHPC: (a) compression; (b) tension.
3.4. Cohesive Law of Interface
Cohesive behavior is usually used to simulate bonded interfaces. Through the traction-separation relationship, the cohesive model reveals the complex failure process between two surfaces. There are two methods to simulate the cohesion behavior in ABAQUS, i.e., element-based and surface-based. In this study, the steel–concrete interface of the specimen simulated the interface behavior using a surface-based cohesive contact method. The cohesion law includes various forms, and the default bilinear relationship in ABAQUS was used in this paper, as shown in Figure 10.
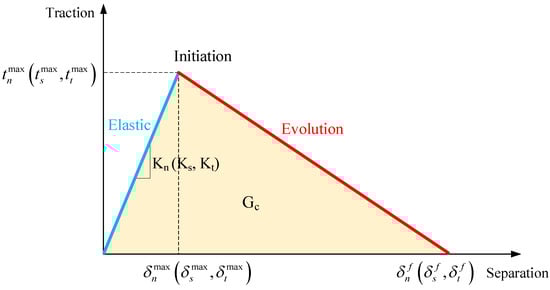
Figure 10.
Traction-separation relationship.
, , and denote the contact stresses in the normal, first shear direction, and second shear direction, respectively. , , and denote the stiffnesses in the normal and two tangential directions. , , and denote the separation at failure in the normal, first shear direction, and second shear direction, respectively, and their values are equal to the ratio of strength to stiffness in the corresponding directions. In this study, the cohesive contact parameters were determined by investigating previous studies [29,30,31] and combining the experimental results of the PCSC push-out test with the trial-and-error method. , , and of the steel–UHPC interface were set to 1.6 MPa, 1.4 MPa, and 1.4 MPa, respectively. , , and were set to 100 MPa/mm, 65 MPa/mm, and 65 MPa/mm, respectively. , , and of the steel–HSM interface were set to 1.2 MPa, 0.95 MPa, and 0.95 MPa, respectively, based on the experimental results of the steel–concrete interface parameters in the literature [32]. , , and were set to 65 MPa/mm, 45 MPa/mm, and 45 MPa/mm, respectively. The cohesive parameters of the interface were set so that stiffness and strength in the normal direction were greater than those in the tangential direction. This was performed because the ideal failure mode for the push-out test was shear failure.
Damage evolution can be defined by specifying the total fracture energy or displacement based on the effective separation at the damage time. The method of specifying the total fracture energy was adopted in this model. The total fracture energy Gc for the steel–UHPC interface was 4 N/mm, and Gc for the steel–HSM interface was 2 N/mm. The finite element model with the above values was in good agreement with the experimental results. The quadratic stress criterion in the damage criterion was adopted in this model. The degradation process was initiated when Equation (5) was satisfied. The Macaulay bracket < > indicates that normal compression would not initiate damage.
4. FE Model of Results
4.1. Validation of FE Models
In order to verify the validity and accuracy of the FE model, the comparison of load-slip curves of PCSC connectors based on FE analysis results and test results is shown in Figure 11. Overall, the load-slip curves calculated by the FE exhibit similar variation trends to those of the test results. The load-slip curve of PCSC connectors is divided into three stages: elastic, plastic, and damage descent. When P 0.5Pu, this stage is defined as the linear elastic stage. The dividing point between the elastic and plastic phases of the load-slip curve is usually taken as the secant point for the shear stiffness of the connectors. Johnson et al. [33] suggested the ratio of 0.5Pu to the corresponding slip at this point as the elastic shear stiffness of connectors. When 0.5Pu P Pu, this stage is defined as the plastic stage. The load begins to drop after the peak load, which is defined as the damage descent stage. According to EC4 [34], reduced to 0.9Pu is the characteristic load, and the corresponding slip is the characteristic maximum slip. As can be seen from Figure 11, the FE model predicts the ultimate load capacity of the push-out specimens well, and the calculated load-slip curves match well with the test curves in the elastic and plastic stages, but there is a discrepancy with the test curves in the descent stage. On the one hand, the tri-linear constitutive relationship of the studs adopted cannot perfectly reflect the real stresses of the studs because of the in-plane torsion of studs, and the higher residual stresses in the welded area of studs are not included. On the other hand, the phenomenon that the FE cannot be simulated, i.e., the fabrication and test error between each push-out specimen.
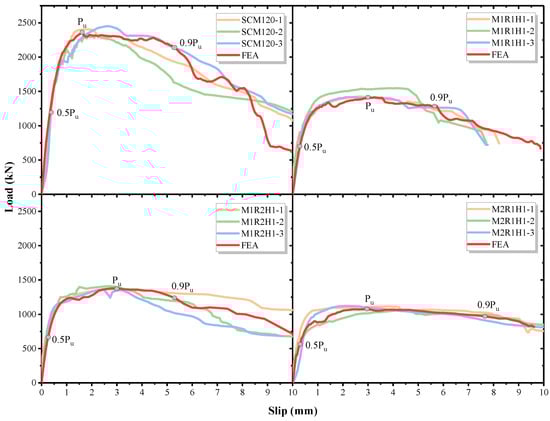
Figure 11.
Comparison of load-slip curves from tests and FE model.
Figure 12 compares the tensile damage (DAMAGET) contour map of the precast concrete slabs in the FE model with cracks that developed during the push-out tests. The results show that the crack development simulated by the FE model was basically consistent with the experimental results. To further verify the accuracy of the finite elements, quantitative comparisons of ultimate load, maximum interfacial slip, and elastic shear stiffness are shown in Table 3. The elastic shear stiffness can be regarded as an index to determine the deformation capacity of connectors under normal service limits. In conclusion, the FE model is reliable for investigating the failure mode and load transfer mechanism of PCSC connectors. This FE model can also be used for the parametric analysis of PCSC connectors.
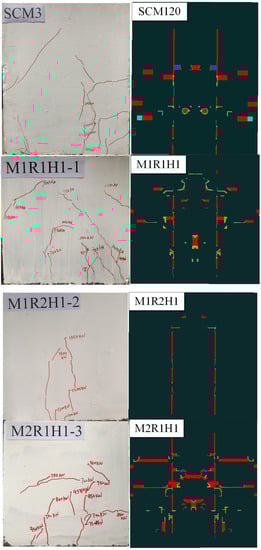
Figure 12.
Crack patterns on concrete slab obtained from push-out tests and FE models.
Table 3.
Comparison of FEA results with push-out tests.
4.2. Contribution of Interfacial Bond
One of the major features of PCSC connectors is that the steel–concrete interface area is larger than that of conventional stud connectors. Therefore, utilizing the FE model, this section will clarify the contribution of the steel–concrete interface bonding force to the shear bearing capacity and stiffness of connectors, as well as the interface damage process. Figure 13 shows the load-slip curves of the steel–concrete interface with and without the bond. It is observed from the figure that the steel–concrete interface bond can significantly increase the shear bearing capacity and elastic shear stiffness of the PCSC push-out specimens. The steel–concrete interface bonding increases the shear bearing capacity of SCM120, M1R1H1, and M2R1H1 specimens by 27.8%, 23.4%, and 19.2%. The increased value is dominated by the bond force () between UHPC and steel, which is equal to the product of the bond area (A) of the steel–concrete interface and the tangential bond strength of the interface (), i.e., . Where the bond strength () was selected according to Section 3.4. The steel–concrete interfacial bonding area for SCM120 specimens was 409,438 mm2 and for M1R1H1 and M2R1H1 specimens was 180,647 mm2.
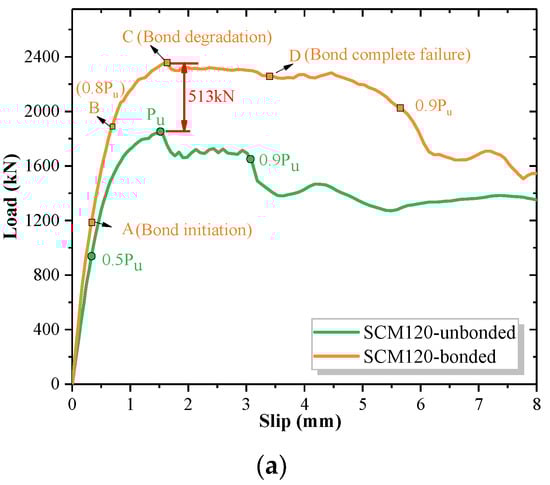
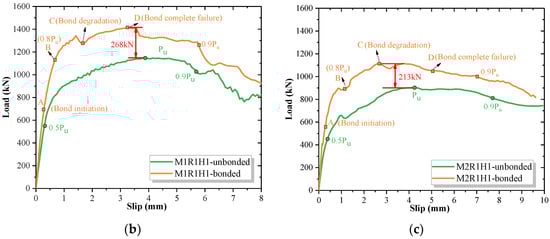
Figure 13.
Comparison of load slip curves between bonded and unbonded specimens: (a) SCM120 specimen; (b) M1R1H1 specimen; (c) M2R1H1 specimen.
The evolution of bond damage at the steel–concrete interface for various specimens is shown in Figure 14. The CSDMG represents the bond damage state with values between 0 to 1. where 0 indicates no damage at the interface and 1 indicates complete debonding at the interface. The following descriptions are based on the classification of different connection concrete materials. The steel–UHPC interface is present in SCM120 and M1R1H1 specimens, while the steel–HSM interface is present in M2R1H1 specimens. In the linear elastic stage at point 0–A (0.5Pu), the steel–UHPC interface was well-bonded, whereas the S-HSM interface was more damaged. As the load increased, the damage expanded toward the bottom along the load direction. When the load reached point B (0.87Pu), the load-slip curve showed a turning point, and the shear stiffness of the specimen decreased abruptly. When the load reached point B (0.87Pu), the load-slip curve showed a turning point, and the shear stiffness of the specimen decreased abruptly. This stage corresponds to the experimental phenomenon of clicking sounds from the specimen, which was considered debonding, and friction occurred at the interface between steel and concrete. The fact that the damaged area of D = 0.98 appeared earlier in the steel–HSM interface than in the steel–UHPC interface indicates that the bond between HSM and steel is weaker than that of UHPC. In the stage of points C–D, the completely damaged area of the interface (D > 0.98) gradually increased, and the chemical bond between the interfaces completely failed. The damage distribution of the interface corresponding to point D (Figure 14) shows that almost the steel–UHPC interface was completely damaged. In contrast, the area below the bottom studs of the steel–HSM interface did not. Due to the lower strength of HSM compared to UHPC, with the deformation of the studs, the damage within the HSM was insufficient to restrain the studs, which resulted in the HSM around the bottom studs still adhering to the steel plate until the specimen completely failed.
Figure 14.
Damage process of the bonded interface.
The above results show that the shear bearing capacity of the steel–concrete interface is mainly provided by the chemical bond between steel and concrete, static friction, and studs during the linear and nonlinear ascent stages. The bond between steel and concrete improves the shear bearing capacity and shear stiffness of the connectors, and the existence of interfacial bonding is beneficial in reducing the relative slip between the interfaces. The chemical bond between the interfaces degrades when the slip increases gradually. At this time, the shear bearing capacity is mainly borne by the studs and dynamic friction.
4.3. Damage Evolution and Failure Mode
The results of the push-out experiments of the PCSC connectors showed that the failure mode slipped at the steel–concrete interface, followed by stud fracture. To clarify the details of the static behavior of PCSC push-out specimens and the damage evolution of each component, the Mises stress and equivalent plastic strain (PEEQ) of the studs, concrete, and shear connection reinforcement at elastic, peak load, and damage stages were analyzed using SCM120 specimens as representatives. Where PEEQ reflects the plastic state of the structure, i.e., when the PEEQ values of cells are greater than zero, the element begins to yield. Figure 15 illustrates the Mises stress and PEEQ contour plots for the studs. When P 0.5Pu, the stress of studs was less than the yield stress, and the PEEQ value was 0, which indicated that the studs were in an elastic state. When P = Pu, the stress at the root of all studs was the largest, and the plastic strain at the root of 1# stud was the maximum and the first to bear the shear force. When the load dropped to 0.9Pu, the PEEQ of 1# stud exceeded 0.2, the stress decreased rapidly, and it was considered that 1# stud fractured. Meanwhile, 2# and 3# studs continued to share the shear stress. Specifically, the PEEQ of #2 stud reached 0.14 and was about to fracture, while the stress of #3 stud reached 460 MPa and was in the yield state. As the steel–UHPC interface slip continued to develop until the end of the load, 2# stud fractured, and 3# stud occurred shear deformation.
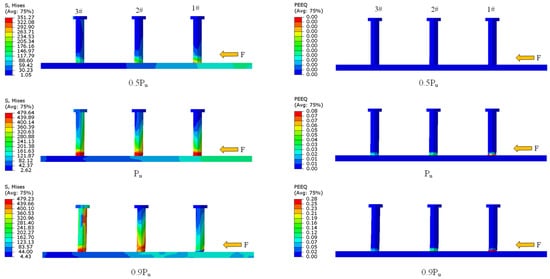
Figure 15.
Contour plots of Mises stress, PEEQ for studs.
The FE results of stress distribution and compressive and tensile damage of the precast concrete slab and connection concrete are shown in Figure 16. The compressive and tensile damage corresponds to DAMAGC and DAMAGT in the FE model, respectively, with the damage degrees in the 0–1 interval, where 0 indicates no damage and 1 indicates 100% damage. Internal damage and stress transfer paths can be observed that could not be seen in the experiments by cutting the connection concrete along the center of the stud. The red arrows in Figure 16a indicate the force transfer path. Because of the existence of the studs and the shear connection reinforcements, the compressive stresses in the concrete developed downward toward the outside in the direction of the red arrows. Moreover, the concrete damage developed first from the root of the stud, with compressive stresses in the concrete below the stud and tensile stresses in the concrete above the stud. Observation of the distribution of UHPC damage and stud stress and strain contour plots indicates that the 1# stud was close to pure shear damage, and only 4 mm thickness of UHPC below it was crushed. The 2# stud was subjected to the combined action of bend and shear where the shear was greater than the bend so that the root of the stud could reach the fracture strain and was sheared off. With the downward deformation of the stud, the UHPC suffered compressive damage to the extent of 8 mm in thickness. The 3# stud was not sheared, and the compressed area of the UHPC below the stud increased as the steel plate moved downward.
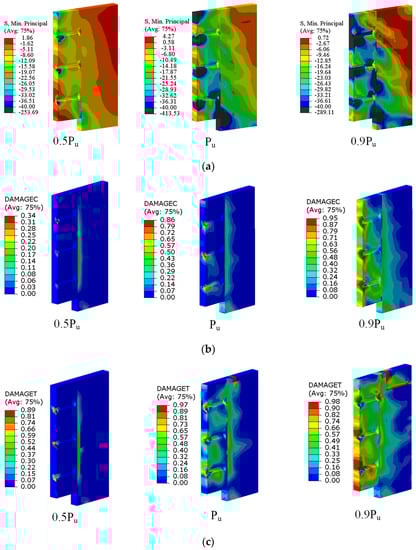
Figure 16.
Damage evolution of concrete (precast concrete−UHPC): (a) Stress distribution; (b) Compressive damage; (c) Tensile damage.
The stress development in the shear connection reinforcements is illustrated in Figure 17 illustrates. Up to the end of the load, none of the reinforcement has entered the yielding state. Because the precast concrete-UHPC interface bond was sufficiently strong to transfer the shear force between the precast slab and the connected concrete without slip, the shear connection reinforcements were all in the elastic stage. In conclusion, the FE model can accurately predict the force behavior of PCSC connectors. The shear force transfer path of the PCSC connectors is as follows: steel–UHPC interfacial bond + steel–UHPC interfacial friction + studs → connection concrete (UHPC) → precast concrete-UHPC interfacial bond + shear connection reinforcement → precast concrete slab. The damage mode of PCSC connectors is the stud fracture caused by the steel–UHPC interface slip.
Figure 17.
Contour plots of Mises stress for shear connection reinforcement.
5. Parametric Studies
To fully utilize the mechanical properties of UHPC, the experimentally validated FE model was used for the parametric analysis to optimize the PCSC connectors. Based on the SCM1-120 specimen, the model was established according to the modeling method introduced in Section 3. The studs, connection concrete, and shear connection reinforcements were taken as variables for parametric analysis, and the detailed parameters of all models are shown in Table 4.
Table 4.
Details of parametric analysis.
5.1. Parameter 1: Stud Diameter
The load-slip curves of specimens with different stud diameters are shown in Figure 18. The FE results include two types of specimens dealing with the steel–concrete interface, i.e., with and without interfacial bonding. The load-slip curves were divided into three stages: elastic, plastic, and damage descent and the shear bearing capacity of the specimens increased with the increase in stud diameter. The effects of stud diameter on the shear bearing capacity (Pu), elastic shear stiffness (k), and ductility (Sm) of a single stud in PCSC joints are shown in Figure 19. It was found that the shear bearing capacity and shear stiffness increased with the increase in the stud area when the cohesion at the steel–UHPC interface was not considered. When the stud area increased by 41.3% and 89.1%, respectively, from 201 mm2, the shear bearing capacity of a stud increased by 7.8% and 33.1%, and the shear stiffness increased by 9.8% and 15.7%. The maximum slip value of the specimen also showed a positive correlation with the stud area.
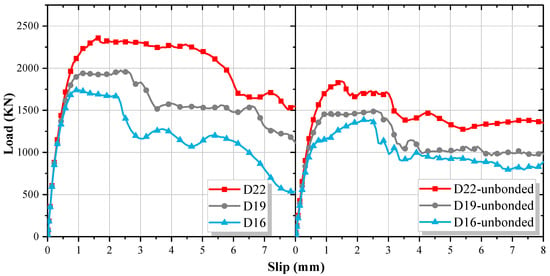
Figure 18.
Load-slip curves of specimens with different stud diameter.
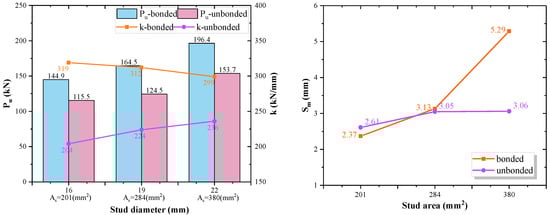
Figure 19.
Influence of stud diameter on yield strength, shear stiffness and slip.
When cohesion at the steel–UHPC interface was considered, the shear bearing capacity of the stud and maximum interfacial slip were also positively correlated with the stud area. Specifically, the cohesion contribution of the S-C interface to the bearing capacity increased with the increase in the stud area, which was 29.4 kN, 40.0 kN, and 42.7 kN, respectively. For the ductility of the stud, the larger diameter stud showed better performance. The 22 mm diameter stud increased the ductility by 72.9% compared to that without interfacial bonding, which indicates that the effect of interfacial bonding on enhancing the ductility of the specimen was more prominent in the larger diameter stud. However, the elastic shear stiffness exhibited a slight difference of 2.2% and a 6.3% decrease in elastic shear stiffness when the stud area was increased from 201 mm2 to 284 mm2 and 380 mm2, respectively. The elastic shear stiffness of the specimen includes the stud shear stiffness and the interfacial bond stiffness. The bond between steel and UHPC was intact in the elastic stage, so the interfacial bond stiffness played a dominant role. However, the bond area between steel and UHPC decreased as the cross-sectional area of the studs increased, so the elastic shear stiffness of the specimen slightly decreased with the increase in the stud area.
5.2. Parameter 2: Stud Height
EC4 [34] stipulates that the height of the studs should be greater than or equal to 3 d. GB50917-2013 [35] stipulates that the height of the studs should be between 4 d and 6 d, but the specification is for studs embedded in normal-strength concrete. There is no specification for the height of studs embedded in UHPC, which could theoretically be less than that specified for normal concrete due to the better restraint of studs by UHPC. Therefore, this section will discuss the minimum height of the studs applicable to PCSC connectors. Figure 20 shows the load-slip curves of specimens with different stud heights. The stud height has little effect on the elastic stage of the load-slip curve but has some effect on the plastic stage and the damage stage.
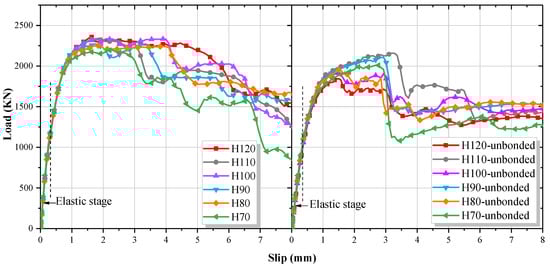
Figure 20.
Load-slip curves of specimens with different stud height.
The effect of stud height on the shear bearing capacity (Pu), elastic shear stiffness (k), and ductility (Sm) of a single stud can be directly observed in Figure 21. When cohesion at the steel–UHPC interface was considered, the shear bearing capacity of a stud decreased with height. Specifically, with the stud height decreasing from 5.45 d to 3.18 d, the shear bearing capacity of a stud was reduced by 6.7%. Because the steel–UHPC interfacial bond area decreased with the stud height and the steel–UHPC interfacial bond contributed greatly to the shear bearing capacity of the specimen, the effect of the steel–UHPC interfacial bond needed to be eliminated in the analysis of the effect of the stud height on the specimen. When the cohesion at the steel–UHPC interface was not considered, the shear bearing capacity of the stud did not show an orderly variation relationship with the stud height. When the stud height was between 3.18 d and 5.45 d, the bearing capacity of a stud was between 153.7–179.9 kN, with fluctuations that did not exceed 14.6%. Moreover, the maximum interfacial slip was in the range of 2.87–3.47 mm, with fluctuations that did not exceed 17.3%.
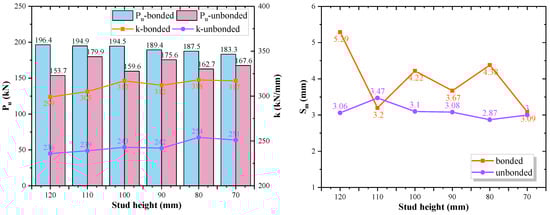
Figure 21.
Influence of stud height on ultimate strength, shear stiffness and slip.
The maximum shear stress occurs at the root of the stud, as shown in Figure 22. The contour plots of the shear stress of studs show that regardless of the total height of the stud, the effective force transfer zone of the stud (i.e., the range of shear stress greater than 40 MPa) was in the range of approximately 30 mm near the root. The remaining part of the stud was almost not subjected to shear, and the shear stress decreased as the distance from the root of the stud increased. Therefore, the effective shear ratio of short studs is greater than that of long studs.
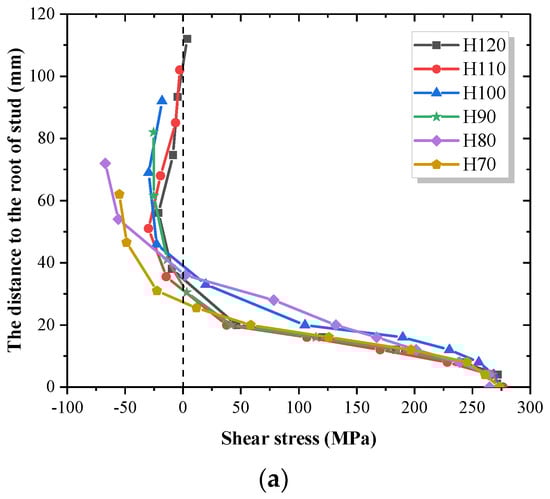
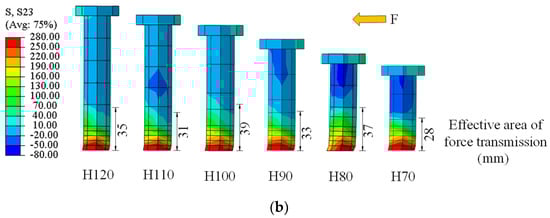
Figure 22.
Shear stress distribution along with the height of the studs: (a) curves of shear stress; (b) contour plots of shear stress.
In conclusion, the shear resistance of studs with a length-to-diameter ratio greater than or equal to 3.18 was not weakened due to the excellent restraint of the UHPC on the studs. However, because the height of the side baffle was lowered to match the 70 mm height of the stud, this caused a significant reduction in the bearing capacity contributed by the interface bonding. In real engineering, the design of stud height and connection concrete thickness can be based on this rule.
5.3. Parameter 3: Stud Horizontal Spacing
EC4 [34] recommends that the spacing between studs in the shear direction should not be less than 5 d and that the spacing between studs in the vertical direction of shear should not be less than 2.5 d in solid concrete slabs and not less than 4 d in other cases. GB50917-2013 [35] recommends that the clear distance between the edge of the outer stud shank and the edge of the steel beam flange should not be less than 30 mm and that the horizontal spacing of the stud should not be less than 4 d (88 mm). In order to investigate the minimum width of UHPC when used for connection concrete, this section will analyze the effect of the horizontal center spacing between studs and the clear protective layer thickness required for studs on the mechanical properties of PCSC connectors. Figure 23 shows the load-slip curves of the specimens with different stud spacing. In the legend, B represents the total width of the connection concrete, and (*+*+*) represents the horizontal distance between the center of the stud and the edge of the concrete + the horizontal distance between the centers of the two studs + the horizontal distance between the center of the stud and the edge of the concrete. It can be clearly seen that the mechanical properties of B124 were significantly weakened. The other widths of the connection concrete have little effect on the elastic and plastic stage curves of the specimens, but the descent stage after the peak load shows a great difference.
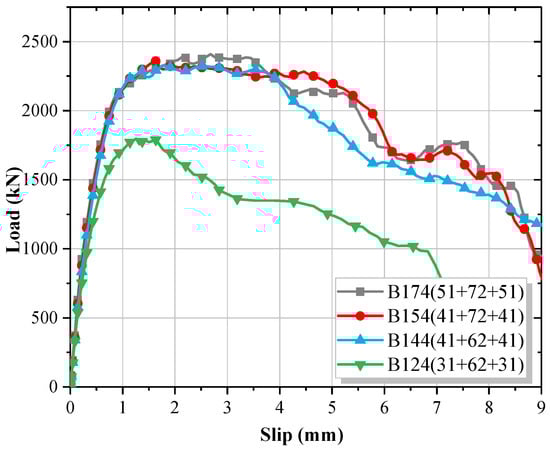
Figure 23.
Load-slip curves of specimens with different stud horizontal spacing.
Figure 24 reveals the effect of the horizontal spacing of the studs on the shear bearing capacity (Pu), elastic shear stiffness (k), and ductility (Sm) of a stud, where the shear bearing capacity of a stud was reduced significantly when the width of the connection concrete was reduced to 124 mm (5.64 d). The shear stiffness and shear bearing capacity of a stud showed a positive correlation with the width of the connection concrete. When the connection concrete width was reduced from 174 mm (7.9 d) to 154 mm (7 d), 144 mm (6.55 d), and 124 mm (5.64 d), respectively, the shear stiffness decreased by 4.1%, 6.1%, and 16.0% and the shear bearing capacity decreased by 3.1%, 2.2%, and 25.4%. It can be observed in Figure 25 that the height of plastic strain at the root of the stud decreased as the horizontal spacing of the studs increased, which indicates that a certain volume of UHPC is more effective in anchoring the studs.
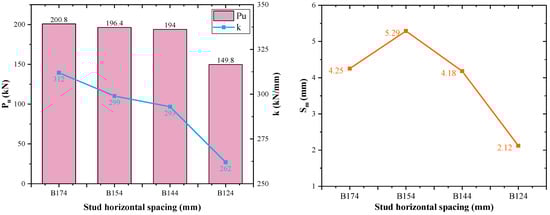
Figure 24.
Influence of horizontal stud spacing on ultimate strength and shear stiffness.
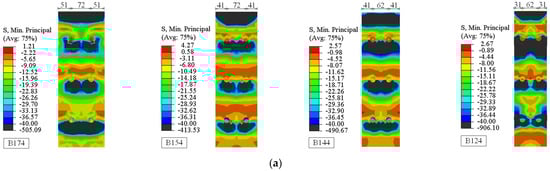
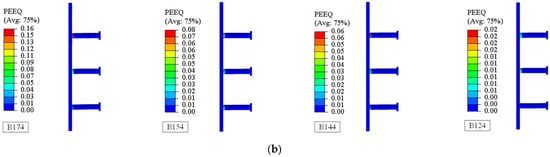
Figure 25.
Stress and strain distribution of the specimen at peak load: (a) stress distribution of UHPC; (b) PEEQ of studs.
When the horizontal distance between the stud and the edge of the concrete was 51 mm (i.e., the clear protective layer thickness of the studs was 30 mm), the gray area (stress ≥ 40 MPa) did not extend to the edge in the UHPC. However, when the distance between the center of the stud and the edge of the concrete was reduced to 31 mm (i.e., the thickness of the clear protective layer of the studs was 20 mm), the gray area in the UHPC increased. Due to the insufficient thickness of the outer UHPC to provide effective anchorage for the studs, the studs cannot shear fracture, resulting in a significant reduction in the mechanical properties of the PCSC connectors. When the central spacing of the studs was decreased from 72 mm (3.27 d) to 62 mm (2.82 d), the compressive stress of UHPC at the stud positions overlapped. However, the reduction of the central spacing of the stud had little effect on the shear bearing capacity and shear stiffness of the studs, and it had a slight effect on the ductility of connectors. To ensure that the failure mode of PCSC connectors is stud shear fracture, the horizontal distance of the stud center should be at least 2.82 d, and the clear distance between the outer stud edge and the edge of UHPC should be at least 30 mm.
5.4. Parameter 4: Compressive Strength of Connection Concrete
Past studies demonstrated that the mechanical behavior of studs in UHPC differs from that in NC. The load-slip curves of UHPC specimens with different compressive strengths, as well as NC specimens, are shown in Figure 26. CU110–150 represents UHPC with a compressive strength of 110–150 MPa for connection concrete, and CC60 represents normal concrete with a compressive strength of 60 MPa for connection concrete. The difference between CU150 and CU130 specimens in shear bearing capacity and shear stiffness was insignificant. As shown in Figure 27, when the compressive strength of UHPC was reduced from 130 MPa to 120 and 110 MPa, respectively, the shear capacity of the studs decreased by 6.3% and 10.1%. When C60 was used for the connection concrete, the shear bearing capacity and shear stiffness of a stud were reduced by 19.4% and 16.7%, respectively, compared with those of the CU130 specimen. However, the ductility of the normal concrete specimens was better than that of the UHPC specimens, which had a 62.3% higher average maximum interfacial slip value. Because UHPC has higher strength and stiffness than normal concrete, when the studs were embedded in UHPC, the minor damage in the compression area around the stud root led to less deformation space for the stud, which led to the reduction of the ductility of the connector.
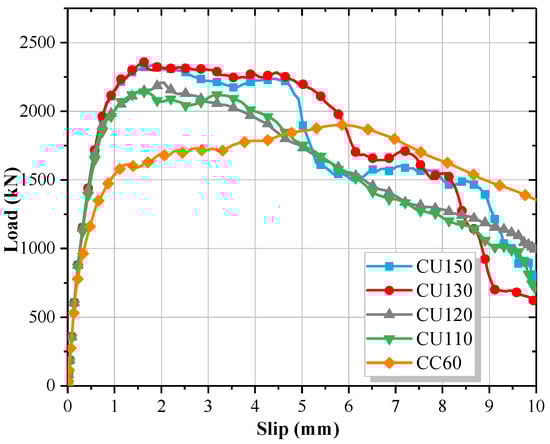
Figure 26.
Load-slip curves of specimens with different compressive strength of connection concrete.
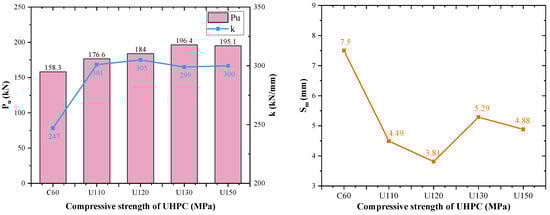
Figure 27.
Influence of compressive strength of connection concrete on ultimate strength and shear stiffness.
Figure 28 shows the compressive damage of concrete and the stress distribution of studs at the peak load. When UHPC was used for connection concrete, the maximum stress occurred at the root of the stud, while it was minimal near the cap. The reaction force transmitted by the stud to the UHPC led to local damage in the UHPC, and as the strength of the UHPC increased, the extent of compressive damage to the UHPC below the stud decreased. Therefore, the damage mode of the UHPC specimen was a complete shear fracture at the root of the stud. When the connection concrete was C60, because the concrete strength was insufficient to completely restrain the studs, the stress from the root of the stud to the cap exceeded 200 MPa. The studs are deformed by upturning, which results in compressive stresses from the studs on the concrete above and compressive damage to the concrete below as the studs move down.
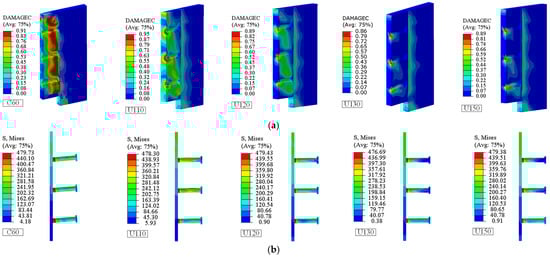
Figure 28.
Damage distribution of the specimen at peak load: (a) compressive damage of concrete; (b) mises stress of studs.
In conclusion, the shear bearing capacity of the specimen increases with the increase in compressive strength of the connection concrete. When the compressive strength of UHPC reaches or exceeds 130 MPa, however, the shear bearing capacity of the specimens is solely dependent on the material properties of the studs. Therefore, additional UHPC compressive strength above 130 MPa does not significantly enhance the shear strength of the specimens.
5.5. Parameter 5: Compressive Strength of Precast Concrete
The load-slip curves of the specimens with precast concrete slabs of different compressive strengths are illustrated in Figure 29. It can be seen from the curves that the difference between the specimens in the elastic stage is minor, whereas in the plastic stage they appear slightly different. As shown in Figure 30, the shear bearing capacity and shear stiffness of a stud increased slightly by 1–2% with each 10 MPa increase in the compressive strength of the precast concrete slab. The maximum interfacial slips of PC70 and PC60 specimens increased by 10.2% and 3.6%, respectively, compared to PC50 specimens. In conclusion, the increased compressive strength of the precast concrete slab has a positive effect on ductility.
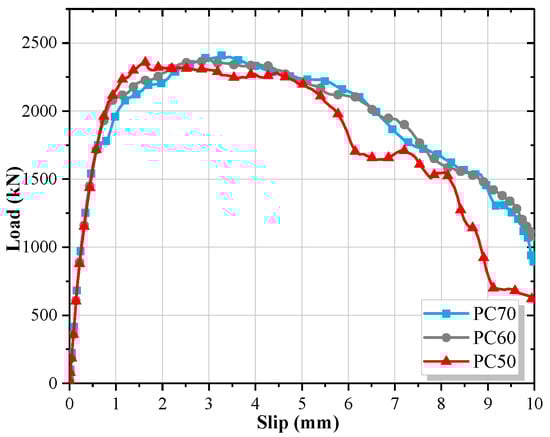
Figure 29.
Load-slip curves of specimens with different compressive strength of precast concrete.
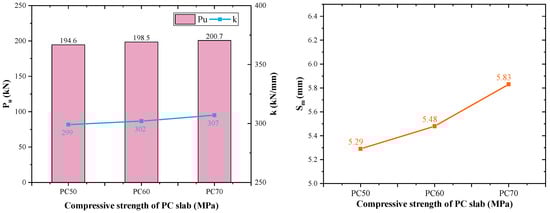
Figure 30.
Influence of compressive strength of precast concrete on ultimate strength and shear stiffness.
6. Conclusions
In this paper, the mechanical performance of PCSC connectors was investigated, and three-dimensional FE models were developed to evaluate the failure modes, damage processes, and interfacial degradation processes of the push-out specimens. The following main conclusions were obtained.
- The refined FE model, which incorporates the bonding behavior of the steel–concrete interface, was developed in order to accurately represent the load-slip behavior, damage mode, and damage evolution of PCSC connectors.
- The bond of the steel–concrete interface significantly improved the shear bearing capacity and elastic shear stiffness of push-out specimens due to a larger steel–concrete interface in PCSC connectors than in conventional stud connectors. Specifically, the steel–UHPC interface and the steel–HSM interface increased the shear bearing capacity of the specimens by approximately 25% and 20%, respectively. However, the steel–HSM interface showed damage earlier than the steel–UHPC interface.
- The shear bearing capacity of the PCSC push-out specimens increased with the increase in compressive strength of the connection concrete. Compared to normal concrete, UHPC as post-poured connection concrete increased the bearing capacity and shear stiffness of studs by about 20% and 16%, respectively, but the ductility was reduced by 38%. When the compressive strength of UHPC exceeded 130 MPa, however, the shear bearing capacity of connectors was only dependent on the material properties of studs. The additional UHPC strength would not significantly enhance the shear performance of connectors.
- The diameter of studs has a positive effect on the shear bearing capacity and shear stiffness. The maximum slip value of the specimen also correlated positively with the cross-sectional area of studs.
- The effective force transmission zone of studs is about 30 mm near the root, and the additional height of studs would not increase the shear bearing capacity of connectors. However, to ensure the effective restraint of UHPC on studs so that the shear resistance of the studs is not weakened, it is recommended that the length-to-diameter ratio of the studs be greater than or equal to 3.18.
- The shear bearing capacity and shear stiffness of the studs decreases with the decrease in the width of the connection concrete (stud spacing). To ensure the damage mode of PCSC connectors is stud shear fracture, it is recommended that the horizontal spacing of studs be greater than or equal to 2.82 d, and the clear distance from the outer side of the stud shank to the edge of UHPC should not be less than 30 mm.
Author Contributions
Conceptualization, Z.Z. (Zhixiang Zhou) and Y.Z.; methodology, J.G. and J.J.; software, J.G.; validation, J.G., Z.Z. (Zhixiang Zhou) and Y.Z.; investigation, J.G.; resources, Y.Z.; data curation, J.G.; writing—original draft preparation, J.G.; writing—review and editing, Z.Z. (Zhongya Zhang) and Y.Z.; visualization, J.G.; supervision, Z.Z. (Zhixiang Zhou); project administration, Z.Z. (Zhixiang Zhou); funding acquisition, Z.Z. (Zhixiang Zhou) and Y.Z. All authors have read and agreed to the published version of the manuscript.
Funding
This research was funded by the National Natural Science Foundation of China, grant number 52008066; the Major Science and Technology Projects in Hainan, grant number ZDKJ2021048; and the Science and technology projects in T.A.R., grant number XZ202001ZY0054G.
Institutional Review Board Statement
Not applicable.
Informed Consent Statement
Not applicable.
Data Availability Statement
The data presented in this study are available upon reasonable request from the corresponding author.
Conflicts of Interest
The authors declare no conflict of interest.
References
- Suzuki, A.; Kimura, Y. Mechanical performance of stud connection in steel-concrete composite beam under reversed stress. Eng. Struct. 2021, 249, 113338. [Google Scholar] [CrossRef]
- Roberti, F.; Cesari, V.F.; de Matos, P.R.; Pelisser, F.; Pilar, R. High- and ultra-high-performance concrete produced with sulfate-resisting cement and steel microfiber: Autogenous shrinkage, fresh-state, mechanical properties and microstructure characterization. Constr. Build. Mater. 2021, 268, 121092. [Google Scholar] [CrossRef]
- Fang, Z.; Fang, S.; Liu, F. Experimental and numerical study on the shear performance of short stud shear connectors in steel–UHPC composite beams. Buildings 2022, 12, 418. [Google Scholar] [CrossRef]
- He, Z.; Ou, C.; Tian, F.; Liu, Z. Experimental behavior of steel-concrete composite girders with UHPC-grout strip shear connection. Buildings 2021, 11, 182. [Google Scholar] [CrossRef]
- Farzad, M.; Shafieifar, M.; Azizinamini, A. Experimental and numerical study on bond strength between conventional concrete and ultra high-performance concrete (UHPC). Eng. Struct. 2019, 186, 297–305. [Google Scholar] [CrossRef]
- Kruszewski, D.; Wille, K.; Zaghi, A.E. Design considerations for headed shear studs embedded in ultra-high performance concrete as part of a novel bridge repair method. J. Constr. Steel Res. 2018, 149, 180–194. [Google Scholar] [CrossRef]
- Zou, Y.; Guo, J.C.; Zhou, Z.X.; Wang, X.D.; Yu, Y.J.; Zheng, K.D. Evaluation of shear behavior of PCSC shear connection for the construction of composite bridges with prefabricated decks. Eng. Struct. 2022, 257, 141–296. [Google Scholar] [CrossRef]
- Kim, J.; Kwark, J.; Joh, C.; Yoo, S.; Lee, K. Headed stud shear connector for thin ultrahigh-performance concrete bridge deck. J. Constr. Steel Res. 2015, 108, 23–30. [Google Scholar] [CrossRef]
- Semendary, A.A.; Stefaniuk, H.L.; Yamout, D.; Svecova, D. Static performance of stud shear connectors and UHPC in deck-to-girder composite connection. Eng. Struct. 2022, 255, 113917. [Google Scholar] [CrossRef]
- Haber, Z.B.; Graybeal, B.A.; Nakashoji, B. Ultimate behavior of deck-to-girder composite connection details using UHPC. J. Bridge Eng. 2020, 25, 04020038. [Google Scholar] [CrossRef]
- Cao, J.; Shao, X.; Lu, D.; Yidong, G. Static and fatigue behavior of short-headed studs embedded in a thin ultrahigh-performance concrete layer. J. Bridge Eng. 2017, 5, 4017001–4017005. [Google Scholar] [CrossRef]
- Fang, Z.C.; Fang, H.Z.; Huang, J.X.; Jiang, H.B.; Chen, G.F. Static behavior of grouped stud shear connectors in steel–precast UHPC composite structures containing thin full-depth slabs. Eng. Struct. 2022, 252, 113484. [Google Scholar] [CrossRef]
- Zhu, J.; Ding, J.; Wang, Y. Numerical and theoretical studies on shear behavior of steel-UHPC composite beams with waffle slab. J. Build. Eng. 2022, 47, 103913. [Google Scholar] [CrossRef]
- Kruszewski, D.; Wille, K.; Zaghi, A.E. Push-out behavior of headed shear studs welded on thin plates and embedded in UHPC. Eng. Struct. 2018, 173, 429–441. [Google Scholar] [CrossRef]
- Kruszewski, D.; Zaghi, A.E.; Wille, K. Finite element study of headed shear studs embedded in ultra-high performance concrete. Eng. Struct. 2019, 188, 538–552. [Google Scholar] [CrossRef]
- Cao, J.; Shao, X. Finite element analysis of headed studs embedded in thin UHPC. J. Constr. Steel Res. 2019, 161, 355–368. [Google Scholar] [CrossRef]
- Guan, Y.; Wu, J.; Sun, R.; Ge, Z.; Bi, Y.; Zhu, D. Shear behavior of short headed studs in steel-ECC composite structure. Eng. Struct. 2022, 250, 113423. [Google Scholar] [CrossRef]
- Abo El-Khier, M.; Morcous, G. Precast concrete deck-to-girder connection using ultra-high performance concrete (UHPC) shear pockets. Eng. Struct. 2021, 248, 113082. [Google Scholar] [CrossRef]
- Xu, C.; Chengkui, H.; Decheng, J.; Yuancheng, S. Push-out test of pre-stressing concrete filled circular steel tube columns by means of expansive cement. Constr. Build. Mater. 2009, 23, 491–497. [Google Scholar] [CrossRef]
- Qu, X.; Chen, Z.; Nethercot, D.A.; Gardner, L.; Theofanous, M. Push-out tests and bond strength of rectangular CFST columns. Steel Compos. Struct. 2015, 19, 21–41. [Google Scholar] [CrossRef]
- Yan, J.; Xie, W.; Zhang, L.; Lin, X. Bond behaviour of concrete-filled steel tubes at the arctic low temperatures. Constr. Build. Mater. 2019, 210, 118–131. [Google Scholar] [CrossRef]
- Degee, H.; Dan, D.; Bogdan, T.; Plumier, A. Transfer of the longitudinal shear at the steel-concrete interface in concrete members reinforced by steel profiles. In High Tech Concrete: Where Technology and Engineering Meet; Springer: Cham, Switzerland, 2017. [Google Scholar]
- Yan, J.; Li, Z.; Xie, J. Numerical and parametric studies on steel-elastic concrete composite structures. J. Constr. Steel Res. 2017, 133, 84–96. [Google Scholar] [CrossRef]
- Taerwe, L.; Matthys, S. Fib Model Code for Concrete Structures 2010; Wilhelm Ernst & Sohn, Verlag fur Architektur und technische Wissenschaften GmbH & Co. KG; Ernst & Sohn, Wiley: Berlin, Germany, 2013. [Google Scholar]
- Zhuang, B.Z.; Liu, Y.Q.; Yang, F. Experimental and numerical study on deformation performance of rubber-sleeved stud connector under cyclic load. Constr. Build. Mater. 2018, 192, 179–193. [Google Scholar] [CrossRef]
- Pavlović, M.; Marković, Z.; Veljković, M.; Buđevac, D. Bolted shear connectors vs. Headed studs behaviour in push-out tests. J. Constr. Steel Res. 2013, 88, 134–149. [Google Scholar] [CrossRef]
- Yang, J.; Fang, Z. Research on stress-strain relation of ultra high performance concrete. Concrete 2008, 7, 11–15. [Google Scholar]
- Zhang, Z.; Shao, X.D.; Wen-Guang, L.I.; Zhu, P.; Chen, H. Axial tensile behavior test of ultra high performance concrete. China J. Highw. Transp. 2015, 8, 50–58. [Google Scholar]
- Wang, X.L.; Liu, Y.Q.; Li, Y.X.; Lu, Y.C.; Li, X.F. Bond behavior and shear transfer of steel section-concrete interface with studs: Testing and modeling. Constr. Build. Mater. 2020, 264, 120251. [Google Scholar] [CrossRef]
- Wang, Z.; Nie, X.; Fan, J.S.; Lu, X.Y.; Ding, R. Experimental and numerical investigation of the interfacial properties of non-steam-cured UHPC-steel composite beams. Constr. Build. Mater. 2019, 195, 323–339. [Google Scholar] [CrossRef]
- Jurkiewiez, B.; Tout, F.; Ferrier, E. Push-out and bending tests of steel-concrete adhesively bonded composite elements. Eng. Struct. 2021, 231, 111717. [Google Scholar] [CrossRef]
- Huang, Y.; Zhao, P.; Lu, Y.; Zhang, H. Push-out tests of CFST columns strengthened with self-compacting and self-stressing concrete filled square steel tube. J. Constr. Steel Res. 2022, 193, 107263. [Google Scholar] [CrossRef]
- Johnson, R.P.; May, I.M. Partial-interaction design of composite beams. Struct. Eng. 1975, 53, 305–311. [Google Scholar]
- Eurocode 4. Design of Composite Steel and Concrete Structures; European Committee for Standardization: Brussels, Belgium, 2004. [Google Scholar]
- Mhurdoc (Ministry of Housing and Urban-Rural Development of China). Code for Design of Steel and Concrete Composite Bridges (gb50917-2013); China Planning Press: Beijing, China, 2013. [Google Scholar]
Publisher’s Note: MDPI stays neutral with regard to jurisdictional claims in published maps and institutional affiliations. |
© 2022 by the authors. Licensee MDPI, Basel, Switzerland. This article is an open access article distributed under the terms and conditions of the Creative Commons Attribution (CC BY) license (https://creativecommons.org/licenses/by/4.0/).