Abstract
The layout of an office significantly affects human health, well-being and productivity in multi-occupancy offices, while the relationship and prioritization of various office layout factors have not been clarified. This study conducts a thorough investigation of office layout factors on occupant satisfaction. Existing pieces of literature were deconstructed and reorganized to extract five office layout factors. For a comparative investigation, an analytic hierarchy process-based online survey and a post-occupancy evaluation-based field survey focusing on academic buildings were implemented in China. The influence mechanisms in the satisfied and dissatisfied groups were explored together with the demographic differences by introducing the Kano model. The influence mechanism differences of the office layout factors between the priori and posteriori processes are emphasized. The results indicate that in academic buildings, the influence of a workstation location on satisfaction tends to be overestimated in the design stage, while the influence of space size tends to be underestimated in the design stage. Workstation orientation is a significant factor that is easily overlooked. Generally, an office layout design should focus more on ensuring the basic needs of all employees rather than creating design highlights. This study provides a new perspective to examine the gaps between actual satisfaction and expected satisfaction, and the obtained results can be directly used to guide user-centered office interior design.
1. Introduction
Urban residents spend 85–90% of their time in an indoor environment, and this figure is even higher in developed countries [1]. The perceived comfort of the indoor environment can directly affect emotions and mental health and further affect well-being [2]. In addition, occupant satisfaction affects the quality of people’s daily activities. Studies have indicated that the indoor environment has a significant impact on learning [3], writing [4], environmental behavior [5] and other aspects. With improvements in quality of life and developments in science and technology, most of the current green building evaluation systems have added provisions related to comfort and user-centered environments [6]. As the core component of social sustainability [7], a comfortable and livable environment has gradually become an indispensable part of sustainable buildings.
With the gradual reopening of workplaces and an easing of COVID-19 lockdown restrictions, workplace environmental quality plays an even more critical role in human well-being [8]. At the same time, the popularity of activity-based workplaces could even be increased in the post-pandemic era [9]. Studies have confirmed that user involvement influences satisfaction and behavior in workplaces [10], which may further expand the scope of user-centered workplace research to a holistic process of developing and using. A workplace is a location where someone works for their employer or themselves [11]. A generalized workplace contains office space and other working places, such as factories, universities, hospitals and even homes [12]. With the transformation of the global economy, a large number of jobs have shifted to service- and knowledge-based sectors working in an office environment [13]. Compared with other space types, occupant satisfaction in office spaces can be considered an important indicator that measures the success of the organization for its significant influence on productivity [14]. This type of association raises the importance of a high-quality office environment from the individual dimension to the enterprise and organizational levels [15].
The office layout is a core component in an office’s early design, interior design and renovation stages. It has been proved to play a key role in the needs of privacy, concentration and communication [16] and to be one of the most significant factors affecting functional comfort, psychological comfort and employee behavior [17]. Over the past 20 years, multiple studies have discussed the impact of the office layout on occupant satisfaction. However, existing research has certain limitations. On the one hand, a part of the studies treated office types as the main research object of office layout [18,19,20], but the vague concepts of office types limited the generalizability of the research conclusions. For example, the difference between an enclosed office and an open-plan office cannot be quantitatively described. The division standards of office types were also not uniform in different studies, such as the conceptual overlaps between the enclosed office and cellular office. Meanwhile, the type of office as the research object weakens the influence of independent parameters, such as area, orientation, density, etc. On the other hand, a comparative investigation of various office layout factors is lacking. The existing studies mostly assess one office layout factor, such as a workstation’s location and juxtapose it with physical indicators, such as thermal comfort [21,22,23]. The coverage of the office layout factor was incomplete, and the relationships among different office layout factors were weakened.
Therefore, this study aims to conduct a detailed comparative investigation of the office layout factors, including the influence mechanisms of each factor on occupant satisfaction and their importance. Particularly, a two-stage survey was implemented to explore the influence mechanism differences between the priori and posteriori processes. The priori process here refers to the general opinions toward office layout factors, made based on subjective experience and knowledge without focusing on any real office, corresponding to the designer’s perspective; the posteriori process refers to the judgment made based on an actual perception in a real office, corresponding to the user’s perspective. The difference in the factor influence mechanisms between the priori and posteriori processes is the main reason for the performance gaps between expected and actual satisfaction. Recognizing and further eliminating them could extremely reduce the performance gaps.
The remainder of this paper is organized as follows. Section 2 conducts a systematic literature review to propose the characteristic network of office layout. Section 3 expounds upon the basic methods of the two-stage survey: the AHP-based first stage was conducted online to collect general opinions on five factors; the POE-based second stage was conducted in 24 academic buildings in China to collect user feedback. Section 4 thoroughly analyzes the factor influence mechanisms using the data of two survey stages, with the demographic variations explored at the same time. Section 5 integrates the results to discuss the difference between the priori and posteriori perspectives and states the consistencies and inconsistencies of the research findings. Section 6 summarizes the main conclusions.
2. Literature Review and Office Layout Characteristic Network
For the knowledge workers, the interaction between humans and their physical office environment can be divided into four dimensions from inside to outside: (1) Workstation: personal space, including working facilities, personal storage space, etc.; (2) room: the environment outside the personal workstation and inside the identified multi-person space; (3) building: the environment outside the room and inside the building, including other space-like meeting rooms, rest spaces, etc.; (4) urban space: the environment outside the building interacting through exterior windows, such as landscapes. The term office layout in this study means how the arrangement and boundaries of workspaces are laid out [17]. Thus, office layout contains two basic categories: workstation arrangement and space boundary. The relationship between the four interaction dimensions and office layout categories is shown in Figure 1. In order to further summarize the composition of the office layout characteristics, we conducted a round of literature reviews. The office layout keywords in the existing literature were extracted and classified twice, and an office layout characteristic network composed of three levels was constructed.
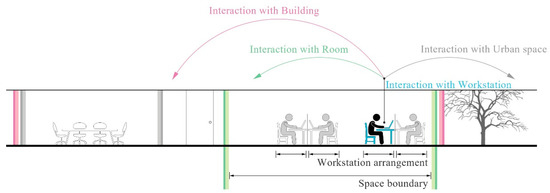
Figure 1.
Interaction dimensions between humans and office environment.
2.1. Literature Retrieval
The literature retrieval process first extracted the keywords and searched for relevant journal articles in the Web of Science, Google Scholar, ScienceDirect and Scopus databases. Multiple types of criteria were used, and the pieces of literature were required to meet all the following four conditions: (a) extended keywords include “office” or “workplace;” (b) subjects include “satisfaction” or “comfort”; (c) subjects include “building character*” or “layout” or “plan” and (d) the publication year was within the period from 2000 to 2022. The number of documents initially retrieved was 547. The literature was further screened by full-text reading, and only papers that met the following criteria were selected: (1) the paper had to include psychological satisfaction content (papers focusing only on physical comfort were excluded); (2) the paper had to draw relevant conclusions on the impact of the office layout characteristics on satisfaction; and (3) the paper had to be conducted from the perspective of the Architecture, Engineering & Construction (AEC) industry (papers that pertained solely to the fields of psychology and sociology were excluded). Ultimately, 55 quantitative research articles and four review articles were selected.
2.2. Network Construction
For the extraction of office layout factors in the existing works of literature, all the office layout-related words were sought out from the abstract section of the selected research and review articles. The initially collected words were subsequently reorganized to make them easy to understand. Office types were excluded from the word cloud when considering their multi-factor combination feature. This study finally summarized 20 words covering all the office layout characteristics in the literature abstracts. Among them, 14 words belonged to the workstation arrangement category, and 6 words belonged to the space boundary category. The frequency of word occurrence in the pieces of literature is shown in Figure 2.
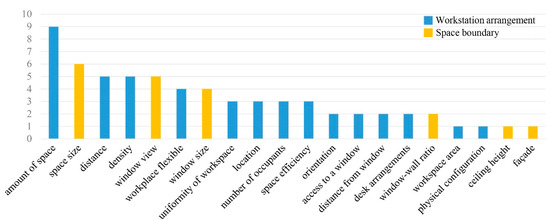
Figure 2.
Office layout words in the literature abstracts.
Based on the extracted office layout words, five office layout factors were subsequently identified. In terms of the workstation arrangement category, three factors were classified based on spatial topology relationships. Workstation location and workstation orientation describe the relationship between the workstation and room, and workstation density is used to describe the relationship between the workstation and other workstations. In terms of the space boundary category, space size describes the geometric space range defined by the space boundary, and window-wall layout represents the ontological properties of the envelope. The above five factors completely cover all the office layout contents in the literature. Through an intensive reading of the literature, the mentioned parameters belonging to each factor were extracted, and the reasonable parameters not mentioned in the literature were supplemented. Finally, an office layout characteristic network, as shown in Table 1, was constructed containing three levels. The proposed five office layout factors were treated as the main scope of this study.

Table 1.
Office layout characteristic network.
2.3. Factor Influence Mechanisms in Existing Literature
Based on the office layout characteristic network, the influence mechanisms that were explored in the existing pieces of literature were combined and summarized. The office layout factors’ appearance is noted in Table 2, together with the appearance of the IEQ indicators.
Table 2.
Basic information and factor coverage status of the selected articles.
The discussion frequency of workstation density (54.2%) is relatively high among the five factors. Many studies have confirmed that workstation density has the greatest effect among the physical environment indicators [21,37,62,63], which significantly affects the user experience of privacy, interaction and satisfaction [57,59]. The crowdedness on the floor has caused the most frequent complaints [18,24,28,34,40], but some studies indicated that an increase in the personal area might cause negative effects, mainly including a reduction in social interaction [51] and collaborative productivity [31]. Obviously, achieving an optimal workstation density requires a “privacy-communication” trade-off [24]. Several studies have analyzed the above user-needs balance from different perspectives. The confirmed influencing factors include a flexible workstation (mobile workers should take greater account of crowding and privacy issues [59]), office type (perceived density in an open-plan office is higher than the actual workstation density [64]), and working mode (collaborative work does not reduce employees’ need for visual and sound privacy [24]).
Very few studies have conducted research on workstation orientation (11.9%), but all the studies have achieved relevant conclusions. The influence of orientation on satisfaction mainly came from the two aspects of office orientation and workstation orientation. Some studies indicated that office orientation is a significant predictor of psychological satisfaction [39,41]. More specifically, studies have confirmed that an office orientation towards the north (including northwest [39] or northeast [27]) may lead to a higher degree of comfort than an orientation towards the south. In terms of workstation orientation, studies have found two factors particularly relevant to satisfaction and productivity: how many other desks someone permanently has in their line of sight and how much someone’s back is protected [31]. In short, workstation location and orientation together create a user’s sense of control over the room, which significantly impacts occupant satisfaction.
Workstation location appeared most frequently (66.1%) among the five office layout factors in the existing studies. Relevant discussions were carried out in two aspects: relative location and absolute location. The descriptions of absolute locations were usually associated with doors, windows, and walking routes [18,35]. Studies have confirmed the positive effects of teamwork for those workers with higher levels of control [31], and workstations in the room’s center (least visibility of the room) may cause significant dissatisfaction [52,53]. The window is another positive factor, and being closer to a window has been shown to improve occupant satisfaction [18,35] and focused work [31]. In an open-plan office, the desk, in relation to walking routes, appears to improve satisfaction [24]. In terms of relative location, workstation location also faces the problem of a “privacy-communication” trade-off. It is generally believed that being farther away from others increases privacy while being closer increases communication [30]. However, the perception of relative distance may vary according to other conditions, including the working mode (flexible workstation or fixed workstation) [59] and detailed configurations in office layout [64].
In terms of the literature mentioning the space size factor (32.2%), except for one study that demonstrated a satisfaction improvement caused by a ceiling height increase [50], all the discussions focused on plan dimensions only. Although several studies found that an increase in space size may help improve perceived satisfaction [35,37] and the sense of higher social standing [32], the relationship between space size and satisfaction is not linear. When the size of the office space is sufficient to meet employees’ daily needs, further improvement will not result in an increase in satisfaction [26]; instead, satisfaction remains unchanged, with costs increasing. For open-plan offices, larger open-plan areas even compromise satisfaction and concentrated work, for the oversized views negatively affect staff satisfaction with teamwork, focused work and perceived productivity [31]. Therefore, designing smaller and more intimate areas might be advisable, where the mode of cellular office with low partitions may achieve satisfaction [17,67]. If large areas are unavoidable, creating more sense of room control can mediate the negative effects [31].
The discussion frequency of window-wall layout is relatively low (20.3%). Most existing studies focused on the influences of a window-to-wall ratio (WWR) on user satisfaction, but they reached different conclusions. Some studies suggested that a WWR change does not affect satisfaction [39,56], while another article confirmed a higher WWR improves occupant satisfaction, especially when increasing it from 15% to 30% [23]. On the other hand, the internal space interface may also indicate a certain influence on satisfaction. Studies have shown that the flexible use of transparent and nontransparent interface materials to open connections between multiple spaces may achieve an improved sense of space and increased satisfaction [58], but until now, the discussions about internal walls have been very few.
In summary, abundant studies explored the impact mechanism of office layout on satisfaction from various perspectives. Although the generation mechanisms of psychological satisfaction are complex, some key points can be summarized from existing works of literature. Visual and sound privacy, as well as communication and teamwork, form a “privacy-communication” trade-off, which is an important issue in office layout design. A sense of control created by office layout also significantly influences occupant satisfaction. In addition, objective conditions, i.e., work modes and office types, usually affect people’s perceptions of office layout. However, the above-mentioned key points of satisfaction are jointly created by various office layout factors. For knowledge integration with the actual design process, it is still necessary to disassemble each independent factor and analyze its influence mechanisms. At present, the exploration of the influence mechanism of each independent office layout factor is limited, and there is a lack of comparative investigation of complete office layout factors.
3. Methodology
As shown in Figure 3, the whole methodology in this study consists of three salient components: a literature review, a two-stage survey process and discussions. To conduct a comparative investigation of the five office layout factors, a two-stage survey composed of an Analytic Hierarchy Process (AHP)-based online questionnaire survey and a post-occupancy evaluation (POE)-based field survey is introduced, with a survey scope focusing on the workplaces in Yangtze River Delta, China.
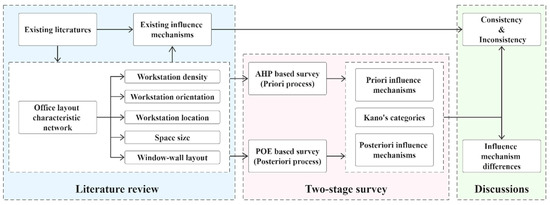
Figure 3.
Overall methodology framework.
3.1. Online Questionnaire Survey Based on AHP Method
An AHP-based questionnaire survey, as the first survey stage, was conducted online. The purpose of this survey stage was to collect people’s general opinions and psychological needs about office layout factors. Neither any real office rooms nor any restrictions on office types were involved in the survey. In addition, by screening AEC practitioners, this stage intended to explore the professional views on office layout design.
3.1.1. Material
This study introduced a classic method in multi-criteria decision-making: AHP [72]. The AHP method has been widely used in sustainable building research [73] and plays a leading role in the formulation of sustainable building evaluation systems [74]. A structured questionnaire was designed to collect users’ opinions. The questionnaire first asked five basic information questions, including the respondent’s gender, age, occupation type, daily working hours and office type. To examine the difference between our survey and a traditional expert survey, a question asking whether the responder belonged to the AEC practitioners’ organization was added at the end of the basic information questions.
The opinion questions were formulated with reference to AHP-method requirements. We used a pairwise comparison method to conduct the inquiry. The main question was, “In an ideal office environment, which of the following two factors is more important?”. The opinion collection process contained 10 questions in total, corresponding to the five factors compared with each other (C5, 2 = 10). The respondents selected one of the following options based on a 9-point Likert scale, as most closely reflecting their opinion: 1 (9) = Former (Latter) extremely important, 2 (8) = Former (Latter) very strongly important, 3 (7) = Former (Latter) strongly important, 4 (6) = Former (Latter) moderately important, 5 = Equally important.
3.1.2. Procedure and Participants
The questionnaire was compiled in an online questionnaire platform called WJX, and a scannable Quick Response (QR) code was generated to support mobile phone filling. The pairwise questions were disorganized randomly before each response. We spent two weeks publishing and promoting the two-stage questionnaires online. The questionnaires, located in China’s Yangtze River Delta region, were screened by querying the IP addresses. The acceptable answering time was set to 120–360 s. There were 766 valid questionnaires passing the data prescreening process.
According to the AHP method, the consistency tests of the questionnaires were carried out to select logically self-consistent responses. The consistency test process included: (1) establishing the judgment matrix; (2) normalizing the judgment matrix; (3) calculating the consistency index (CI); (4) selecting the random index (RI); and (5) calculating the consistency ratio (CR). The detailed calculation method has been included in the literature [72]. The study used CR < 0.1 as the screening criterion. The number of valid questionnaires was 176 after the consistency tests, with the basic information shown in Table 3.
Table 3.
Participants’ basic information in the AHP-based online questionnaire survey.
3.1.3. Data Analysis
Using the normalized judgment matrix of the self-consistent questionnaires, the importance weights from each questionnaire were calculated using the YAANP v2.1 platform. The importance weights were firstly analyzed using descriptive analysis to give mean values and several distribution description indicators. The mean value of the importance weights was regarded as a factor of general importance. In terms of demographic analysis, since the data did not follow a normal distribution, the Mann–Whitney (U test) and Kruskal–Wallis (H test) methods were adopted to assess the opinion differences according to demographics. Bonferroni correction, as a post hoc comparison method, was carried out to observe how the significant differences in demographic characters affect factor importance. The statistical analyses were carried out in the SPSS v22 platform.
3.2. Field Survey Based on POE Process
In the second survey stage, a POE-based field survey was subsequently conducted. Based on the general opinions collected in the first survey stage, the POE-survey stage focused on academic buildings in the Yangtze River Delta region of China and conducted field interviews with 1317 users in 24 buildings. The purpose of this stage was to collect users’ feedback on the real office environments and further explore the actual impact of the office layout factors on occupant satisfaction. The comparison of the influence mechanisms obtained by the two-stage survey reflects the difference between the psychological needs and actual perceptions, corresponding to the difference between the designer and user perspectives.
3.2.1. Material
The field survey was conducted in a real office environment by visiting the employees one by one. The users’ real-time feedback on their workplaces was collected. A structured questionnaire comprised five basic information questions and six satisfaction judgment questions. The basic information questions were mostly the same as the questions in the AHP-based survey. The satisfaction judgment questions collected the overall satisfaction and five office layout factors’ satisfaction, posing the question, “Are you satisfied with the [overall environment/workstation density/workstation orientation/workstation location/space size/window-wall layout] of your current office?”. The satisfaction opinions were assessed using a 7-point Likert scale: (−3) 3 = extremely (dis)satisfaction, (−2) 2 = strongly (dis)satisfaction, (−1) 1 = slightly (dis)satisfaction, 0 = neutral.
It is worth mentioning that we measured various office layout parameters of each room at the same time. The relevant content has been included in our previous research focusing on the office layout parameter level [75].
3.2.2. Procedure and Participants
The questionnaire was also compiled using the WJX platform. We first selected the buildings by an on-the-spot investigation in advance and by obtaining survey permissions. Then, we printed the QR code together with the survey instructions and hung it on the chest. When entering each office, we visited the available workstations one by one. The invited responder scanned the QR code and filled out the questionnaire on the mobile phone. There were 24 buildings in three universities evaluated in China’s Yangtze River Delta area. The buildings included the department buildings, as well as the administration buildings and office buildings, as shown in Table 4. The investigated rooms were all office spaces with traditional desk working patterns, excluding classrooms, laboratories, meeting rooms, etc. All the rooms were equipped with openable external windows, and the floor plans were approximately rectangular. It should be emphasized that the careful selection of rooms here is because university campus buildings often undertake multiple functions at the same time. The survey should ensure that all the target rooms are single-function offices to exclude the interference of other factors. The detailed room screening also helped screen the responders, excluding the learning tasks, i.e., self-study, experiments and classes. The survey was carried out from June 2021 to August 2021. We collected a total of 1317 valid respondents in total.
Table 4.
Evaluated buildings in the POE-based field survey.
A round of data cleaning was carried out based on the initial dataset. The valid answering time was set to 60–240 s, and the satisfaction opinions of five office layout factors cannot be all the same. After data cleaning, the dataset number was reduced to 887, with the basic information shown in Table 5. The reliability test was subsequently carried out on the satisfaction opinion data, indicating high reliability with Cronbach’s alpha = 0.884.
Table 5.
Participants’ basic information in the POE-based field survey.
3.2.3. Data Analysis
The Kano model was introduced to analyze the influence mechanisms in positive and negative attitudes independently. Noriaki Kano proposed the Kano model in the 1980s [76], which has been applied as an efficient evaluation method in recent research on generalized IEQ factors [63,77,78]. The Kano model classifies the product qualities into five categories, as shown in Figure 4. (1) Basic factors: These can be thought of as the minimum requirements. (2) Bonus factors: The impact on overall satisfaction, resulting from the positive performance being greater than that resulting from the negative performance. (3) Proportional factors: The occupant’s satisfaction level changes proportionally according to the performance of these factors. (4) Indifferent factors: Factors do not result in either satisfaction or dissatisfaction. (5) Reverse factors: A high degree of achievement resulting in dissatisfaction.
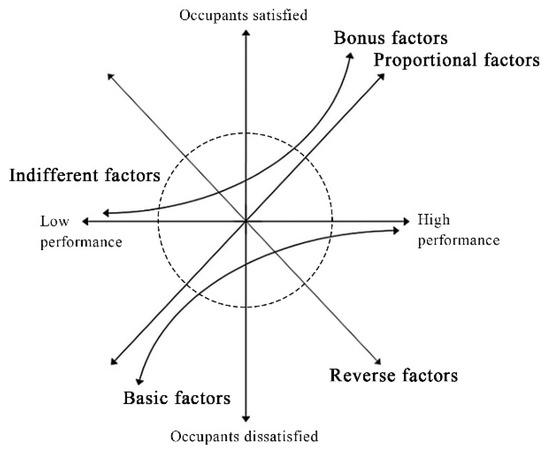
Figure 4.
Quality categories in the Kano model (adapted from reference [76]).
A linear regression-based evaluation process was implemented to locate the office layout factors into Kano’s categories. The collected satisfaction opinions were firstly divided into three groups: (1) Dissatisfied group: users who are distinctly dissatisfied with the factor (score = −3 or −2); (2) reference group: users who remain neutral on the IEQ factor performance (score = −1 or 0 or 1); and (3) satisfied group: users who are distinctly satisfied with the factor (score = +2 or +3). The data of each factor were transferred into two independent dummy variables with a binary coding (0 and 1) responding to the dissatisfied group and satisfied group. Five factors were transferred to ten dummy variables in total. Subsequently, multiple regressions with dummy variables were conducted toward the overall satisfaction, as shown in Equation (1). Further, a0 represents the overall satisfaction attitude in the questionnaires, which also helps to describe the general impact of the office layout factors in a quantitative way. R2 in the regression model represents the explanation degree of the five office layout factors towards overall satisfaction. The regression process generated two regression coefficients for each office layout factor: N, responding to the impact of the dissatisfied group (a1) and the satisfied group (a2). Normally, a1 should be negative, and a2 should be positive. Both the comparison of significance level and absolute value between a1 and a2 were used to identify a quality category of each factor in the Kano model.
- OS: Overall satisfaction score
- a0: average of overall satisfaction score of the reference groups
- a1.N: regression coefficient for the dissatisfied group of office layout factor N
- a2.N: regression coefficient for the satisfied group of office layout factor N
- X1.N: dummy variable for the dissatisfied group of office layout factor N
- X2.N: dummy variable for the satisfied group of office layout factor N
4. Results
A comprehensive evaluation was conducted based on the two-stage survey data to explore the influence mechanisms of each office layout factor on occupant satisfaction. The general importance, influence mechanisms, Kano’s categories and demographic variations of the factors were analyzed.
4.1. Factor Importance Weights Based on AHP Dataset
The opinions collected in the AHP survey are knowledge- and experience-oriented cognitions without considering any real environment. Based on the established judgment matrix, the importance weights for each respondent was calculated based on the AHP method. The statistics of the importance weights and the results of the Kolmogorov–Smirnov tests are shown in Table 6. The general importance was judged from the mean values of the importance weights. Coefficient of variation (CV), kurtosis and skewness are used to identify the distribution of importance weights.
Table 6.
Distribution statistics of importance weights in sub-factors.
Obviously, people generally believe the workstation arrangement factors to be more important than space boundary factors. At the same time, the CV values indicate that the data for the workstation arrangement factors are more concentrated on mean values, which shows that people have a relatively consistent cognition of the importance of workstation arrangement factors, while the attitude towards the space boundary factors often varies according to different respondent groups. Furthermore, it can be seen from the skewness values that more respondents believe that the space boundary factors should be more important than the existing mean values. Among the five office layout factors, the importance of workstation density was much higher than the other four factors. The personal space area has a direct impact on visual and acoustic privacy, and the relative area also plays a decisive role in employees’ positive self-perception. The importance of workstation orientation ranked second place and was much higher than the other three factors. Workstation orientation is also a significant factor affecting personal privacy, especially when considering other employees’ visibility of personal devices, such as computer screens, and its relationship with windows dominates in occupant visual comfort. Workstation location and space size were almost the same and ranked third and fourth place, with a window-wall layout ranking last.
Since the importance weights did not follow a normal distribution (p < 0.05 in the Kolmogorov–Smirnov test), nonparametric tests were used to judge the demographic differences. Additionally, the combinations with a significant difference were further extracted using the Bonferroni correction method. The results of the nonparametric analysis were enumerated, as shown in Table 7. Moreover, post hoc analysis and box-plot visualization were integrated to quantify the difference. The relationships between the demographic characters and importance weights are shown in Figure 5.
Table 7.
Nonparametric analysis results (p-value) of importance weights.
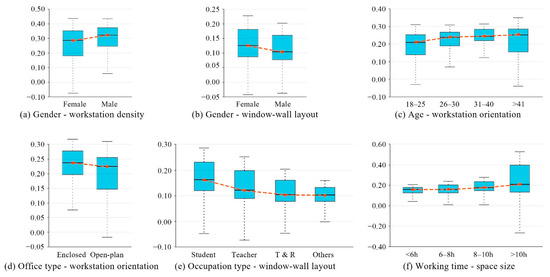
Figure 5.
Important weight distribution of the office layout factors in significant demographics.
Among the workstation arrangement factors, workstation density showed significant differences for gender. The importance weight of females was lower than that of males (Figure 5a), showing that males subjectively prefer to have enough personal space. The reason for this difference may be that males tend to care more about their personal status perception than females. The attitude toward workstation orientation indicated significant differences in age groups and office-type groups. The importance showed a consistent upward trend with an age increase (Figure 5c). This shows that the importance of workstation orientation is always overlooked among young people and is gradually recognized with the increase in working years. On the other hand, workstation orientation is more important to people working in an enclosed office than in an open-plan office (Figure 5d). In open-plan offices, workstation orientation is relatively fixed, that is, a determinant arrangement perpendicular to the adjacent windows. However, there are often a variety of angles between the workstations and windows in enclosed offices, which leads to more variations in satisfaction, resulting in higher importance.
In terms of the space boundary factors, the importance of space size increases slowly with the daily working hours (Figure 5f). An appropriate space size has a potential positive influence on an occupant’s satisfaction. The longer employees stay in the office environment, the more obvious it is to perceive this impact. The window-wall layout importance showed a significant difference for gender, showing that the importance of window-wall layout is higher among females (Figure 5b). Moreover, the most significant difference in window-wall layout appears in the comparison of academic occupations (students and teachers) with technical occupations (technique and research and other staff). Students and teachers generally believe a window-wall layout to be more important (Figure 5e). We found the reason for this trend in the POE-survey stage; that is, the workplaces on campus always have poor daylighting and poor interior shading control. Teachers and students are eager to have a better natural lighting environment, resulting in higher importance weights of the window-wall layout.
It should be mentioned that we asked if the responder belongs to AEC practitioners as an additional question. The question was asked in order to judge the opinion difference between the traditional expert survey and our survey process. Statistical analyses show that 71.59% of the final valid questionnaires came from AEC practitioners. The nonparametric and post hoc tests did not confirm any significant difference between the AEC practitioners and non-AEC practitioners, demonstrating that the collected opinions in this study are similar to the traditional expert survey.
4.2. Factor Influence Mechanisms Based on POE Dataset
The opinions collected in the POE survey correspond to the real-time user feedback in a real office environment. Further, the survey scope in this survey stage changed from a general office environment to academic building offices. In this stage, the influences of each factor in the satisfied and dissatisfied groups on overall satisfaction were evaluated using multiple regression analysis. The regression coefficients and significance level of each factor are shown in Figure 6. To identify each office layout factor in Kano’s quality categories, both the significance level and regression coefficient comparisons were conducted between the satisfied and dissatisfied groups. First, the significance level was considered as a primary criterion. Second, we set a 150% regression coefficient difference between satisfied and dissatisfied groups of one factor as a further judgment criterion. The quality categories in the Kano model were identified as follows: (1) Basic factors: The dissatisfied group indicates significance, while the satisfied group does not indicate significance. If both indicate significance, the absolute value of the regression coefficient in the dissatisfied group exceeds the absolute value in the satisfied group by over 150%. (2) Bonus factors: The satisfied group indicates significance, while the dissatisfied group does not indicate significance. If both indicate significance, the absolute value of the regression coefficient in the satisfied group exceeds the absolute value in the dissatisfied group by over 150%. (3) Proportional factors: Both satisfied and dissatisfied groups indicate significance, and the absolute value difference of the regression coefficients in the two groups does not exceed over 150%.
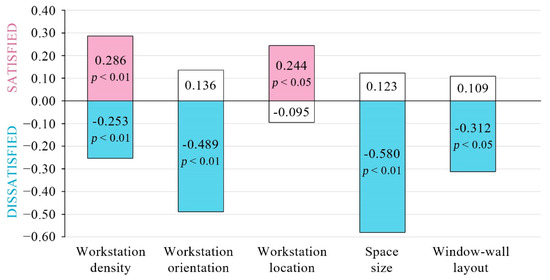
Figure 6.
Regression coefficients of office layout factors on overall satisfaction. The values attached to each bar represent regression coefficients for each office layout factor’s satisfied occupants (pink bar) and dissatisfied occupants (blue bar).
There were three office layout factors identified as basic factors: space size, workstation orientation and window-wall layout. One factor was identified as a bonus factor: workstation location; one factor was identified as a proportional factor: workstation density. For the positive influence in the satisfied groups, workstation density achieved the greatest improvement on overall satisfaction among the five factors, followed by workstation location. The influence of workstation orientation, space size and window-wall layout did not show a significant influence on the overall positive attitude. For the negative influence in dissatisfied groups, space size caused the most serious deterioration in overall satisfaction, followed by workstation orientation, window-wall layout and workstation density. The influence of the workstation location did not show a significant influence on the overall negative attitude.
To recognize the impact variations caused by the demographic characters, the study conducted group regression on five demographic characters separately. In each group, the dataset was divided into several parts according to the different character types. Linear regression was conducted repeatedly in the divided parts, and Cohen’s d value was used as an effect size to recognize the significant difference (p < 0.05) among the regression coefficients. The regression coefficients of significant factors in specific demographic characters are visualized in Figure 7, together with the coefficients of the entire dataset (data in Figure 6), which are shown in the dotted lines. Both the coefficients of satisfied and dissatisfied groups are illustrated in Figure 7, while only the significant factor groups are colored.
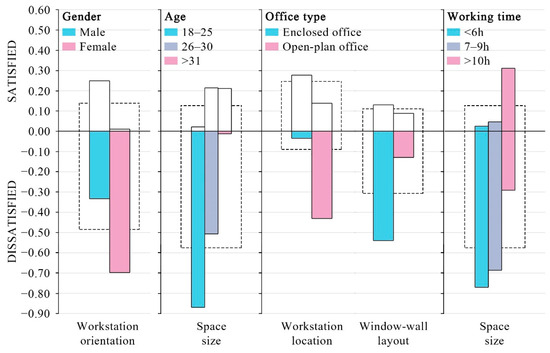
Figure 7.
Significant relationships between factor regression coefficients and demographic characters.
In terms of the workstation arrangement factors, workstation orientation was previously defined as a basic factor, but in the male group, negative effects decreased, and positive effects increased, resulting in a proportional factor. Correspondingly, unfavorable workstation orientation always led to a huge decrease in satisfaction in the female group. On the other hand, the influence of workstation location experienced a great change in the open-plan office group. People dissatisfied with their workstation location may lead to a significant decrease in overall satisfaction when working in an open-plan office, which leads to the workstation location being a basic factor. The overall impact of the workstation’s location is also greater in open-plan offices.
In terms of the space boundary factors, the negative impacts of space size significantly decreased following the age increase, which may indicate that younger people usually suffer a dissatisfied space size and complain about it, while such an issue does not exist among older people in higher positions. Working time was the only demographic characteristic that caused a significant difference in space size in both satisfied and dissatisfied groups. In general, people working for a short time usually treat space size as a basic factor, which will bring more complaints rather than satisfaction. People working long hours can perceive the benefits of space size more clearly, resulting in a proportional factor. There was no category change in the window-wall layout factor in different office types, but the impact of the window-wall layout in enclosed offices was significantly more than in open-plan offices.
Based on the overall analysis results, this study also found some interesting phenomena in academic buildings after separating the satisfied and dissatisfied groups. Generally, the decrease in satisfaction caused by worse qualities is often greater than the increase in satisfaction caused by better qualities. More importantly, when the overall impact of one factor increases significantly in a demographic group, the increase is often reflected in the satisfaction decline caused by worse quality, and the satisfaction increase caused by better quality is often not significantly different. The above trends indicate that the office layout factors are generally more inclined to be positioned on Kano’s basic factor.
5. Discussion
5.1. Influence Mechanism Differences between Priori and Posteriori Processes
This study conducted two survey stages from different perspectives to evaluate the influence of five office layout factors on occupant satisfaction. The AHP-based survey in the first stage belongs to the priori process. The survey asked for the general opinions of each office layout factor without setting any real scenario. The collected opinions were mainly generated from the background knowledge and personal experiences of the responders. The POE-based survey in the second stage belongs to the posteriori process. The collected opinions were generated based on the perception of a real office environment in academic buildings. Basically, we believe that the appearance of the differences between priori and posteriori processes is reasonable, and the exploration of such biases is necessary. Occupant satisfaction is an important part of social sustainability. The gap between expected and actual performance is a widespread problem in the built environment. Compared with other physical performances, such a gap in occupant satisfaction is not easy to calculate quantitatively. However, the difference between designer and user cognition is the main reason for the performance gap in psychological satisfaction. In this study, the AHP survey corresponds to the designer’s perspective, while the POE survey corresponds to the user’s perspective. By exploring the influence mechanism differences, the design deviations from user evaluation criteria in office design are extracted. Bridging these differences helps eliminate performance gaps in user-centered office environments.
To quantify the overall importance in the POE-survey stage, we performed a linear regression of five variables without dummy coding toward overall satisfaction. The regression coefficients were normalized for comparison with the AHP-importance weights. Table 8 illustrates the factor importance evaluated from the two-stage survey together with the differences between the priori and posteriori processes.
Table 8.
Factor importance comparison between priori process and posteriori process.
From the comparison results of the two-stage survey, it can be easily found that two factors, workstation location and space size, indicated relatively more influence mechanism differences. The actual influence of workstation location is smaller than the priori process, while the actual influence of space size is larger than expected. Therefore, designers should strengthen the guarantee of space size in the design of office layouts and avoid the excessive design of workstation locations in academic buildings.
On the whole, the actual influences of Kano’s basic factors (workstation orientation, space size and window-wall layout) always exceeded the expected influences, while the actual influences of the proportional factors (workstation density) and bonus factors (workstation location) were always less than our expectations. This trend also verifies the findings obtained in the previous section that office layout factors generally tend to be positioned on Kano’s basic factors. Furthermore, when combining the performance gaps with previously calculated factor influence in the satisfied group and dissatisfied group (data in Figure 6), a general finding for office layout factors was obtained. That is, the more a factor leans toward the basic factor, the more it will be underestimated at the design stage; the more a feature leans toward the bonus factor, the more it will be overestimated at the design stage. In other words, the positive effects of good qualities are exaggerated in the design stage, and the negative effects of bad qualities are ignored in the design stage. Considering the office layout design process, we believe that if no pre-research is conducted before the design commences, the homogeneous and minimum requirement guarantees are always more efficient than creating design highlights because satisfaction decrease caused by bad conditions always exceeds the satisfaction increase caused by good conditions.
In summary, there is a certain deviation between a priori knowledge and actual user feedback towards office layout factors, so it is recommended to conduct the necessary pre-research before starting the design process. We believe that designers should pay more attention to homogeneity and supportability when designing interior office environments in academic buildings. In particular, excessive consideration of workstation locations should be avoided, and space size should be given more attention in office interior design.
5.2. Factor Influence Mechanisms with Consistency and Inconsistency
In terms of the workstation arrangement factors, workstation density was confirmed to be the most important factor among the office layout factors in the priori process. The POE survey also indicated its significant influence on both satisfied and dissatisfied groups, which is consistent with most relevant studies [18,21,37,46]. This study identified workstation density as a proportional factor, which is inconsistent with Kim’s work (basic factor) [63]. Survey sample differences may be the main reason for this. Kim used the CBE database containing various office building types, mainly in the USA, while our work focused on the universities in eastern China. In addition, the study found that men care more about the amount of personal space. Workstation orientation is rarely mentioned in the previous works, while this study indicated that workstation orientation influence ranks first and second among the office layout factors in the two survey stages, and it has obvious basic factor characteristics. The importance of workstation orientation increases following an age increase and working in enclosed offices. Workstation location was identified as the only bonus factor in this study, but its overall influence is insignificant. The existing studies also reached inconsistent conclusions about the satisfactory location [18,35,39]. However, this study confirmed that the dissatisfying location causes more complaints in an open-plan office, which is consistent with the existing study [40,56].
In terms of the space boundary factors, the influence of space size is nonlinear and always leads to complaints, and thus was identified as a basic factor in this study, which is consistent with existing studies [26,28]. Additionally, the complaints about a dissatisfied space size decreased following an age increase. On the other hand, the same complaints decrease following the working time increase, and the praise of having a satisfactory space size increased thereupon. The actual importance of space size gradually approached the importance in priori cognition with an increased working time, which is consistent with the existing study [79]. The window-wall layout was identified as a basic factor in this study, with high negative impacts for those dissatisfied with the layout and low positive impacts on a satisfying layout, which is consistent with the recent study [23]. The student and female groups are found to care more about the window-wall layout. Moreover, in the enclosed office, the negative impacts of those with a dissatisfied window-wall layout significantly increase.
6. Conclusions
This study conducted a multi-perspective investigation focusing on the influences of office layout factors on occupant satisfaction. Existing pieces of literature are deconstructed and reorganized to establish an office layout characteristic network. The existing findings for the influence mechanisms are summarized by following five office layout factors in the network as a clue. For a comparative investigation of the office layout factors, two surveys from priori and posteriori perspectives were conducted in China’s Yangtze River Delta region. The online questionnaire survey was conducted based on the AHP method to evaluate and compare factor importance weights. The field survey was conducted based on the POE process to investigate the detailed influence mechanisms of office layout factors in academic buildings by introducing the Kano model. Finally, the influence mechanism differences between the priori and posteriori processes were extracted, and a discussion of consistency and inconsistency regarding the existing works of literature on factor influence mechanisms was drawn.
Office layout parameters are highly designable, and the cost of changes in the design stage is extremely low. This study constructed the interrelationships and design priorities of five office layout factors from multiple perspectives and provided the changing laws of the influence mechanisms based on different demographic characters. This study’s significant impacts on workstation density are confirmed from both positive and negative aspects. The results also confirmed the stable effects of workstation orientation in academic buildings, which is often ignored in existing office layout studies. In academic buildings, students have a significantly higher demand for windows than in other occupations. The obtained findings encourage designers to analyze the design of the office space further, resulting in higher productivity and social sustainability.
The difference between experience and real perception is another main point in this study. The comparisons indicated that interior design with homogeneity and supportability is always better than highlight designs. Workstation location is a widely exaggerated factor, and space size is an easily ignored office layout factor in our research scope. We believe that the comparisons are necessary to improve users’ psychological satisfaction in artificial environments. Furthermore, the gap between expected and actual satisfaction is widespread in the built environment, but it is difficult to quantify this performance gap using traditional methods. This study provides a new perspective to quantify the performance difference mechanism of psychological satisfaction by examining the difference between priori and posteriori cognition and further proposes principles to guide design practice. The proposed evaluation method can be generalized to various user-centered design processes, facilitating the alignment of user feedback with design expectations.
During the two-stage survey process, the first stage collected general opinions about the office environment, while the second stage focused on three Chinese universities. Therefore, the common phenomenon found in the POE survey is currently only applicable to academic buildings in China. However, we believe that the findings can reflect the general law of psychological satisfaction to a certain extent. Our future works will try to popularize the evaluation method towards other building types and regions to explore their application scopes. On the other hand, the Kano model, as the basic method for POE data analysis, emphasizes the exploration of nonlinear relationships between positive and negative aspects of factor influences. Our future works will attempt more data analysis methods to explore the influence mechanism laws hidden in the survey data.
The office layout factors, as the main research objects in this study, only cover a small section of the various factors affecting occupant satisfaction. In future works, we will attempt to expand the scope of the study gradually. First, considering the influence of the usage process and user participation, the time dimension will be added to explore the influence of the dynamic change process of spatial characteristics on user satisfaction. Second, in addition to the physical environment, modern workplace satisfaction is affected by elements of the digital layer, including the implementation of communication technologies, connectivity of information, etc., which will also be added to our future research.
Author Contributions
Conceptualization, X.S.; Formal analysis, D.Z.; Investigation, D.Z., X.Z. and Y.Y.; Methodology, D.Z.; Project administration, X.S.; Resources, X.Z., Y.Y. and V.J.L.G.; Supervision, X.S.; Visualization, D.Z. and V.J.L.G.; Writing—original draft, D.Z.; Writing—review and editing, V.J.L.G. and Y.Y. All authors have read and agreed to the published version of the manuscript.
Funding
This research was funded by the China Scholarship Council, grant number 202106090130.
Informed Consent Statement
Informed consent was obtained from all subjects involved in the study.
Data Availability Statement
The data presented in this study are available on request from the corresponding author. The data are not publicly available due to privacy restrictions.
Acknowledgments
Thanks to all issuers, respondents and facility managers who helped during the questionnaire survey process.
Conflicts of Interest
The authors declare no conflict of interest.
References
- Frontczak, M.; Wargocki, P. Literature survey on how different factors influence human comfort in indoor environments. Build. Environ. 2011, 46, 922–937. [Google Scholar] [CrossRef]
- Mansor, R.; Sheau-Ting, L. Criteria for occupant well-being: A qualitative study of Malaysian office buildings. Build. Environ. 2020, 186, 107364. [Google Scholar] [CrossRef]
- Bluyssen, P.M.; Kim, D.H.; Eijkelenboom, A.; Ortiz-Sanchez, M. Workshop with 335 primary school children in The Netherlands: What is needed to improve the IEQ in their classrooms? Build. Environ. 2020, 168, 106486. [Google Scholar] [CrossRef]
- Dobele, A.R.; Veer, E. My best writing space: Understanding academics self-professed writing spaces. High. Educ. 2019, 78, 345–364. [Google Scholar] [CrossRef]
- Zhou, X.; Ren, J.; An, J.; Yan, D. Predicting open-plan office window operating behavior using the random forest algorithm. J. Build. Eng. 2021, 42, 102514. [Google Scholar] [CrossRef]
- Zhuang, D.; Zhang, X.; Lu, Y.; Wang, C. A performance data integrated BIM framework for building life-cycle energy efficiency and environmental optimization design. Autom. Constr. 2021, 127, 103712. [Google Scholar] [CrossRef]
- Fatourehchi, D.; Zarghami, E. Social sustainability assessment framework for managing sustainable construction in residential buildings. J. Build. Eng. 2020, 32, 101761. [Google Scholar] [CrossRef]
- Anand, P.; Cheong, D.; Sekhar, C. A review of occupancy-based building energy and IEQ controls and its future post-COVID. Sci. Total Environ. 2022, 804, 150249. [Google Scholar] [CrossRef]
- Haapakangas, A.; Sirola, P.; Ruohomaki, V. Understanding user behaviour in activity-based offices. Ergonomics 2022, 1–13. [Google Scholar] [CrossRef]
- Budie, B.; Appel-Meulenbro, R.; Kemperm, A.; Weijs-Perree, M. Employee Satisfaction with the Physical Work Envirinment: The Importance of A Need based Approach. Int. J. Strateg. Prop. Manag. 2018, 23, 36–49. [Google Scholar] [CrossRef] [Green Version]
- Workplace. 2021. Available online: https://en.wikipedia.org/wiki/Workplace (accessed on 3 June 2022).
- Vischer, J.C. Towards an Environmental Psychology of Workspace: How People are Affected by Environments for Work. Archit. Sci. Rev. 2011, 51, 97–108. [Google Scholar] [CrossRef]
- Haynes, B.P. The impact of office layout on productivity. J. Facil. Manag. 2008, 6, 189–201. [Google Scholar] [CrossRef]
- Shafaghat, A.; Keyvanfar, A.; Ferwati, M.S.; Alizadeh, T. Enhancing staff’s satisfaction with comfort toward productivity by sustainable Open Plan Office Design. Sustain. Cities Soc. 2015, 19, 151–164. [Google Scholar] [CrossRef]
- Clements-Croome, D. Creative and productive workplaces: A review. Intell. Build. Int. 2015, 7, 164–183. [Google Scholar] [CrossRef]
- Kwon, M.; Remøy, H.; Dobbelsteen, A.V.D. User-focused office renovation: A review into user satisfaction and the potential for improvement. Prop. Manag. 2019, 37, 470–489. [Google Scholar] [CrossRef]
- Lee, Y.S. Office layout affecting privacy, interaction, and acoustic quality in LEED-certified buildings. Build. Environ. 2010, 45, 1594–1600. [Google Scholar] [CrossRef]
- Albuainain, N.; Sweis, G.; AlBalkhy, W.; Sweis, R.; Lafhaj, Z. Factors Affecting Occupants’ Satisfaction in Governmental Buildings: The Case of the Kingdom of Bahrain. Buildings 2021, 11, 231. [Google Scholar] [CrossRef]
- Hongisto, V.; Haapakangas, A.; Varjo, J.; Helenius, R.; Koskela, H. Refurbishment of an open-plan office – Environmental and job satisfaction. J. Environ. Psychol. 2016, 45, 176–191. [Google Scholar] [CrossRef]
- Chen, C.; Yilmaz, S.; Pisello, A.L.; Kim, A. The impacts of building characteristics, social psychological and cultural factors on indoor environment quality productivity belief. Build. Environ. 2020, 185, 107189. [Google Scholar] [CrossRef]
- Cheung, T.; Schiavon, S.; Graham, L.T.; Tham, K.W. Occupant satisfaction with the indoor environment in seven commercial buildings in Singapore. Build. Environ. 2021, 188, 107443. [Google Scholar] [CrossRef]
- Kim, J.; Candido, C.; Thomas, L.; Dear, R.D. Desk ownership in the workplace: The effect of non-territorial working on employee workplace satisfaction, perceived productivity and health. Build. Environ. 2016, 103, 203–214. [Google Scholar] [CrossRef]
- Hong, T.; Lee, M.; Yeom, S.; Jeong, K. Occupant responses on satisfaction with window size in physical and virtual built environments. Build. Environ. 2019, 166, 106409. [Google Scholar] [CrossRef]
- Appel-Meulenbroek, R.; Kemperman, A.; van de Water, A.; Weijs-Perrée, M.; Verhaegh, J. How to attract employees back to the office? A stated choice study on hybrid working preferences. J. Environ. Psychol. 2022, 81, 101784. [Google Scholar] [CrossRef]
- Sarita Tiara, A.G. The Correlation between Spatial Configuration and User Satisfaction: A Case Study of an Activity-based vs a Conventional Office. Int. J. Adv. Sci. Eng. 2021, 11, 648–655. [Google Scholar] [CrossRef]
- Agyekum, K.; Akli-Nartey, E.E.K.; Kukah, A.S.; Agyekum, A.K. Importance-performance analysis (IPA) of the indoor environmental quality (IEQ) of an EDGE-certified building in Ghana. Int. J. Build. Pathol. Adapt. 2021. [CrossRef]
- Yildirim, K.; Hidayetoglu, M.L.; Unuvar, S.S. The effects of location and layout of offices on perceptual evaluations of users. Facilities 2021, 40, 1–19. [Google Scholar] [CrossRef]
- Woo, J.; Rajagopalan, P.; Francis, M.; Garnawat, P. An indoor environmental quality assessment of office spaces at an urban Australian university. Build. Res. Inf. 2021, 49, 842–858. [Google Scholar] [CrossRef]
- Agyekum, K.; Hammond, S.F.; Salgin, B. Occupants’ perceived importance and satisfaction with the indoor environmental quality of a green building. Built Environ. Proj. Asset Manag. 2021, 11, 627–642. [Google Scholar] [CrossRef]
- Johnson, B.; Zimmermann, T.; Bird, C. The Effect of Work Environments on Productivity and Satisfaction of Software Engineers. IEEE Trans. Softw. Eng. 2021, 47, 736–757. [Google Scholar] [CrossRef]
- Sailer, K.; Koutsolampros, P.; Pachilova, R. Differential perceptions of teamwork, focused work and perceived productivity as an effect of desk characteristics within a workplace layout. PLoS ONE 2021, 16, e0250058. [Google Scholar] [CrossRef]
- Hopland, A.O.; Kvamsdal, S. Academics’ preferences for office spaces. Facilities 2021, 39, 350–365. [Google Scholar] [CrossRef]
- Tekce, I.; Ergen, E.; Artan, D. Structural Equation Model of Occupant Satisfaction for Evaluating the Performance of Office Buildings. Arab. J. Sci. Eng. 2020, 45, 8759–8784. [Google Scholar] [CrossRef]
- Sadick, A.; Kpamma, Z.E.; Agyefi-Mensah, S. Impact of indoor environmental quality on job satisfaction and self-reported productivity of university employees in a tropical African climate. Build. Environ. 2020, 181, 107102. [Google Scholar] [CrossRef]
- Riratanaphong, C.; Chaiprasien, B. The impact of workplace change of a private jet company on employee satisfaction. Facilities 2020, 38, 943–960. [Google Scholar] [CrossRef]
- Ko, W.H.; Schiavon, S.; Zhang, H.; Graham, L.T.; Brager, G.; Mauss, I.; Lin, Y.-W. The impact of a view from a window on thermal comfort, emotion, and cognitive performance. Build. Environ. 2020, 175, 106779. [Google Scholar] [CrossRef]
- Kim, A.; Wang, S.; McCunn, L.; Sadatsafavi, H. Impact of Office Modernization on Environmental Satisfaction: A Naturalistic Field Study. Front. Built Environ. 2020, 6, 58. [Google Scholar] [CrossRef]
- Khoshbakht, M.; Baird, G.; Rasheed, E.O. The influence of work group size and space sharing on the perceived productivity, overall comfort and health of occupants in commercial and academic buildings. Indoor Built Environ. 2021, 30, 692–710. [Google Scholar] [CrossRef]
- Kwon, M.; Remøy, H. Office employee satisfaction: The influence of design factors on psychological user satisfaction. Facilities 2019, 38, 1–19. [Google Scholar] [CrossRef]
- Gocer, O.; Kim, A.; Wang, S.; McCunn, L.; Sadatsafavi, H. Differences in Occupants’ Satisfaction and Perceived Productivity in High- and Low-Performance Offices. Buildings 2019, 9, 199. [Google Scholar] [CrossRef]
- Kwon, M.; Remoy, H.; van den Bogaard, M. Influential design factors on occupant satisfaction with indoor environment in workplaces. Build. Environ. 2019, 157, 356–365. [Google Scholar] [CrossRef]
- Candido, C.; Kim, A.; Wang, S.; McCunn, L.; Sadatsafavi, H. Designing activity-based workspaces: Satisfaction, productivity and physical activity. Build. Res. Inf. 2019, 47, 275–289. [Google Scholar] [CrossRef]
- Rasheed, E.O.; Khoshbakht, M.; Baird, G. Does the Number of Occupants in an Office Influence Individual Perceptions of Comfort and Productivity?-New Evidence from 5000 Office Workers. Buildings 2019, 9, 73. [Google Scholar] [CrossRef]
- Zhang, Z. The effect of library indoor environments on occupant satisfaction and performance in Chinese universities using SEMs. Build. Environ. 2019, 150, 322–329. [Google Scholar] [CrossRef]
- Groen, B.; Van Der Voordt, T.; Hoekstra, B.; Van Sprang, H. Impact of employee satisfaction with facilities on self-assessed productivity support. J. Facil. Manag. 2019, 17, 442–462. [Google Scholar] [CrossRef]
- Roskams, M.; Haynes, B. Predictive analytics in facilities management A pilot study for predicting environmental comfort using wireless sensors. J. Facil. Manag. 2019, 17, 356–370. [Google Scholar] [CrossRef]
- Middlehurst, G.; Yao, R.; Jiang, L.; Deng, J.; Clements-Croome, D.; Adams, G. A preliminary study on post-occupancy evaluation of four office buildings in the UK based on the Analytic Hierarchy Process. Intell. Build. Int. 2018, 10, 234–246. [Google Scholar] [CrossRef]
- Han, J.; Kang, H.; Kwon, G.H. A measurement for evaluating the environmental quality of advanced healthcare facilities: Intelligent healthscape quality for medical staff. Build. Environ. 2018, 144, 532–541. [Google Scholar] [CrossRef]
- Hartog, L.; Weijs-Perree, M.; Appel-Meulenbroek, R. The influence of personality on user satisfaction: Multi-tenant offices. Build. Res. Inf. 2018, 46, 402–416. [Google Scholar] [CrossRef]
- Hassanain, M.A.; Alnuaimi, A.K.; Sanni-Anibire, M.O. Post occupancy evaluation of a flexible workplace facility in Saudi Arabia. J. Facil. Manag. 2018, 16, 102–118. [Google Scholar] [CrossRef]
- Samani, S.A.; Rasid, S.Z.A.; Sofian, S. The Influence of Personal Control and Environmental Distraction in Open-Plan Offices on Creative Outcome. Perform. Improv. Q. 2017, 30, 5–28. [Google Scholar] [CrossRef]
- Choi, J.; Moon, J. Impacts of human and spatial factors on user satisfaction in office environments. Build. Environ. 2017, 114, 23–35. [Google Scholar] [CrossRef]
- Kang, S.; Ou, D.; Mak, C.M. The impact of indoor environmental quality on work productivity in university open-plan research offices. Build. Environ. 2017, 124, 78–89. [Google Scholar] [CrossRef]
- Chokor, A.; El Asmar, M.; Tilton, C.; Srour, I. Dual Assessment Framework to Evaluate LEED-Certified Facilities’ Occupant Satisfaction and Energy Performance: Macro and Micro Approaches. J. Archit. Eng. 2016, 22. [Google Scholar] [CrossRef]
- Herbig, B.; Schneider, A.; Nowak, D. Does office space occupation matter? The role of the number of persons per enclosed office space, psychosocial work characteristics, and environmental satisfaction in the physical and mental health of employees. Indoor Air 2016, 26, 755–767. [Google Scholar] [CrossRef] [PubMed]
- Sakellaris, I.A.; Saraga, D.E.; Mandin, C.; Roda, C.; Fossati, S.; De Kluizenaar, Y.; Carrer, P.; Dimitroulopoulou, S.; Mihucz, V.G.; Szigeti, T.; et al. Perceived Indoor Environment and Occupants’ Comfort in European “Modern” Office Buildings: The OFFICAIR Study. Int. J. Environ. Res. Public Health 2016, 13, 144. [Google Scholar] [CrossRef]
- Leder, S.; Newsham, G.R.; Veitch, J.A.; Mancini, S.; Charles, K.E. Effects of office environment on employee satisfaction: A new analysis. Build. Res. Inf. 2016, 44, 34–50. [Google Scholar] [CrossRef]
- Brunia, S.; de Been, I.; van der Voordt, T.J.M. Accommodating new ways of working: Lessons from best practices and worst cases. J. Corp. Real Estate 2016, 18, 30–47. [Google Scholar] [CrossRef]
- Keeling, T.; Clements-Croome, D.; Roesch, E. The Effect of Agile Workspace and Remote Working on Experiences of Privacy, Crowding and Satisfaction. Buildings 2015, 5, 880–898. [Google Scholar] [CrossRef]
- Kim, S.E.; Young, W.R. Office Characteristics and Perceived Behavioral Outcomes in a Public Agency An Empirical Study. Public Perform. Manag. Rev. 2014, 38, 76–99. [Google Scholar] [CrossRef]
- Schiavon, S.; Altomonte, S. Influence of factors unrelated to environmental quality on occupant satisfaction in LEED and non-LEED certified buildings. Build. Environ. 2014, 77, 148–159. [Google Scholar] [CrossRef]
- Leder, S.; Newsham, G.R.; Veitch, J.A.; Mancini, S.; Charles, K.E. Quantitative relationships between occupant satisfaction and satisfaction aspects of indoor environmental quality and building design. Indoor Air 2012, 22, 119–131. [Google Scholar] [CrossRef]
- Kim, J.; de Dear, R. Nonlinear relationships between individual IEQ factors and overall workspace satisfaction. Build. Environ. 2012, 49, 33–40. [Google Scholar] [CrossRef]
- Sailer, K.; McCulloh, I. Social networks and spatial configuration—How office layouts drive social interaction. Soc. Netw. 2012, 34, 47–58. [Google Scholar] [CrossRef]
- Lee, Y.S.; Guerin, D.A. Indoor environmental quality differences between office types in LEED-certified buildings in the US. Build. Environ. 2010, 45, 1104–1112. [Google Scholar] [CrossRef]
- Ozdemir, A. The effect of window views ‘openness and naturalness on the perception of rooms ‘spaciousness and brightness: A visual preference study. Sci. Res. Essays 2010, 16, 2275–2287. [Google Scholar] [CrossRef]
- Lee, Y.S.; Guerin, D.A. Indoor Environmental Quality Related to Occupant Satisfaction and Performance in LEED-certified Buildings. Indoor Built Environ. 2009, 18, 293–300. [Google Scholar] [CrossRef]
- Dinç, P. Gender (in)difference in private offices: A holistic approach for assessing satisfaction and personalization. J. Environ. Psychol. 2009, 29, 53–62. [Google Scholar] [CrossRef]
- Yildirim, K.; Akalin-Baskaya, A.; Celebi, M. The effects of window proximity, partition height, and gender on perceptions of open-plan offices. J. Environ. Psychol. 2007, 27, 154–165. [Google Scholar] [CrossRef]
- Al Horr, Y.; Arif, M.; Kaushik, A.; Mazroei, A.; Katafygiotou, M.; Elsarrag, E. Occupant productivity and office indoor environment quality: A review of the literature. Build. Environ. 2016, 105, 369–389. [Google Scholar] [CrossRef]
- De Croon, E.M.; Sluiter, J.K.; Kuijer, P.P.F.; Frings-Dresen, M.H.W. The effect of office concepts on worker health and performance: A systematic review of the literature. Ergonomics 2005, 48, 119–134. [Google Scholar] [CrossRef]
- Saaty, T. How to make a decision: The Analytic Hierarchy Process. Eur. J. Oper. Res. 1990, 48, 9–26. [Google Scholar] [CrossRef]
- Mardani, A.; Zavadskas, E.K.; Khalifah, Z.; Zakuan, N.; Jusoh, A.; Nor, K.M.; Khoshnoudi, M. A review of multi-criteria decision-making applications to solve energy management problems: Two decades from 1995 to 2015. Renew. Sustain. Energy Rev. 2017, 71, 216–256. [Google Scholar] [CrossRef]
- Lazar, N.; Chithra, K. A comprehensive literature review on development of Building Sustainability Assessment Systems. J. Build. Eng. 2020, 32, 101450. [Google Scholar] [CrossRef]
- Zhuang, D.; Wang, T.; Gan, V.J.; Zhao, X.; Yang, Y.; Shi, X. Supervised learning-based assessment of office layout satisfaction in academic buildings. Build. Environ. 2022, 216, 109032. [Google Scholar] [CrossRef]
- Kano, N.; Seraku, N.; Takahashi, F.; Tsuji, S. Attractive quality and must be quality. J. Jpn. Soc. Qual. Control 1984, 14, 147–156. [Google Scholar]
- Geng, Y.; Yu, J.; Lin, B.; Wang, Z.; Huang, Y. Impact of individual IEQ factors on passengers’ overall satisfaction in Chinese airport terminals. Build. Environ. 2017, 112, 241–249. [Google Scholar] [CrossRef]
- Zhang, Z.; Geng, Y.; Wu, X.; Zhou, H.; Lin, B. A method for determining the weight of objective indoor environment and subjective response based on information theory. Build. Environ. 2022, 207, 108426. [Google Scholar] [CrossRef]
- Hou, H.C.; Lai, J.H.K.; Edwards, D. Gap theory based post-occupancy evaluation (GTbPOE) of dormitory building performance: A case study and a comparative analysis. Build. Environ. 2020, 185, 107312. [Google Scholar] [CrossRef]
Publisher’s Note: MDPI stays neutral with regard to jurisdictional claims in published maps and institutional affiliations. |
© 2022 by the authors. Licensee MDPI, Basel, Switzerland. This article is an open access article distributed under the terms and conditions of the Creative Commons Attribution (CC BY) license (https://creativecommons.org/licenses/by/4.0/).