
Investigating the Key Hindering Factors and Mechanism of BIM Applications Based on Social Network Analysis

 ,
,  ,
, 
Abstract
:1. Introduction
2. Methods
2.1. Data Collection
2.2. Data Inspection
- (1)
- Reliability Analysis
- (2)
- Validity test
- (3)
- Evaluation of influence degree of hindering factors
- (4)
- Correlation test
2.3. Data Depth Analysis
3. Results
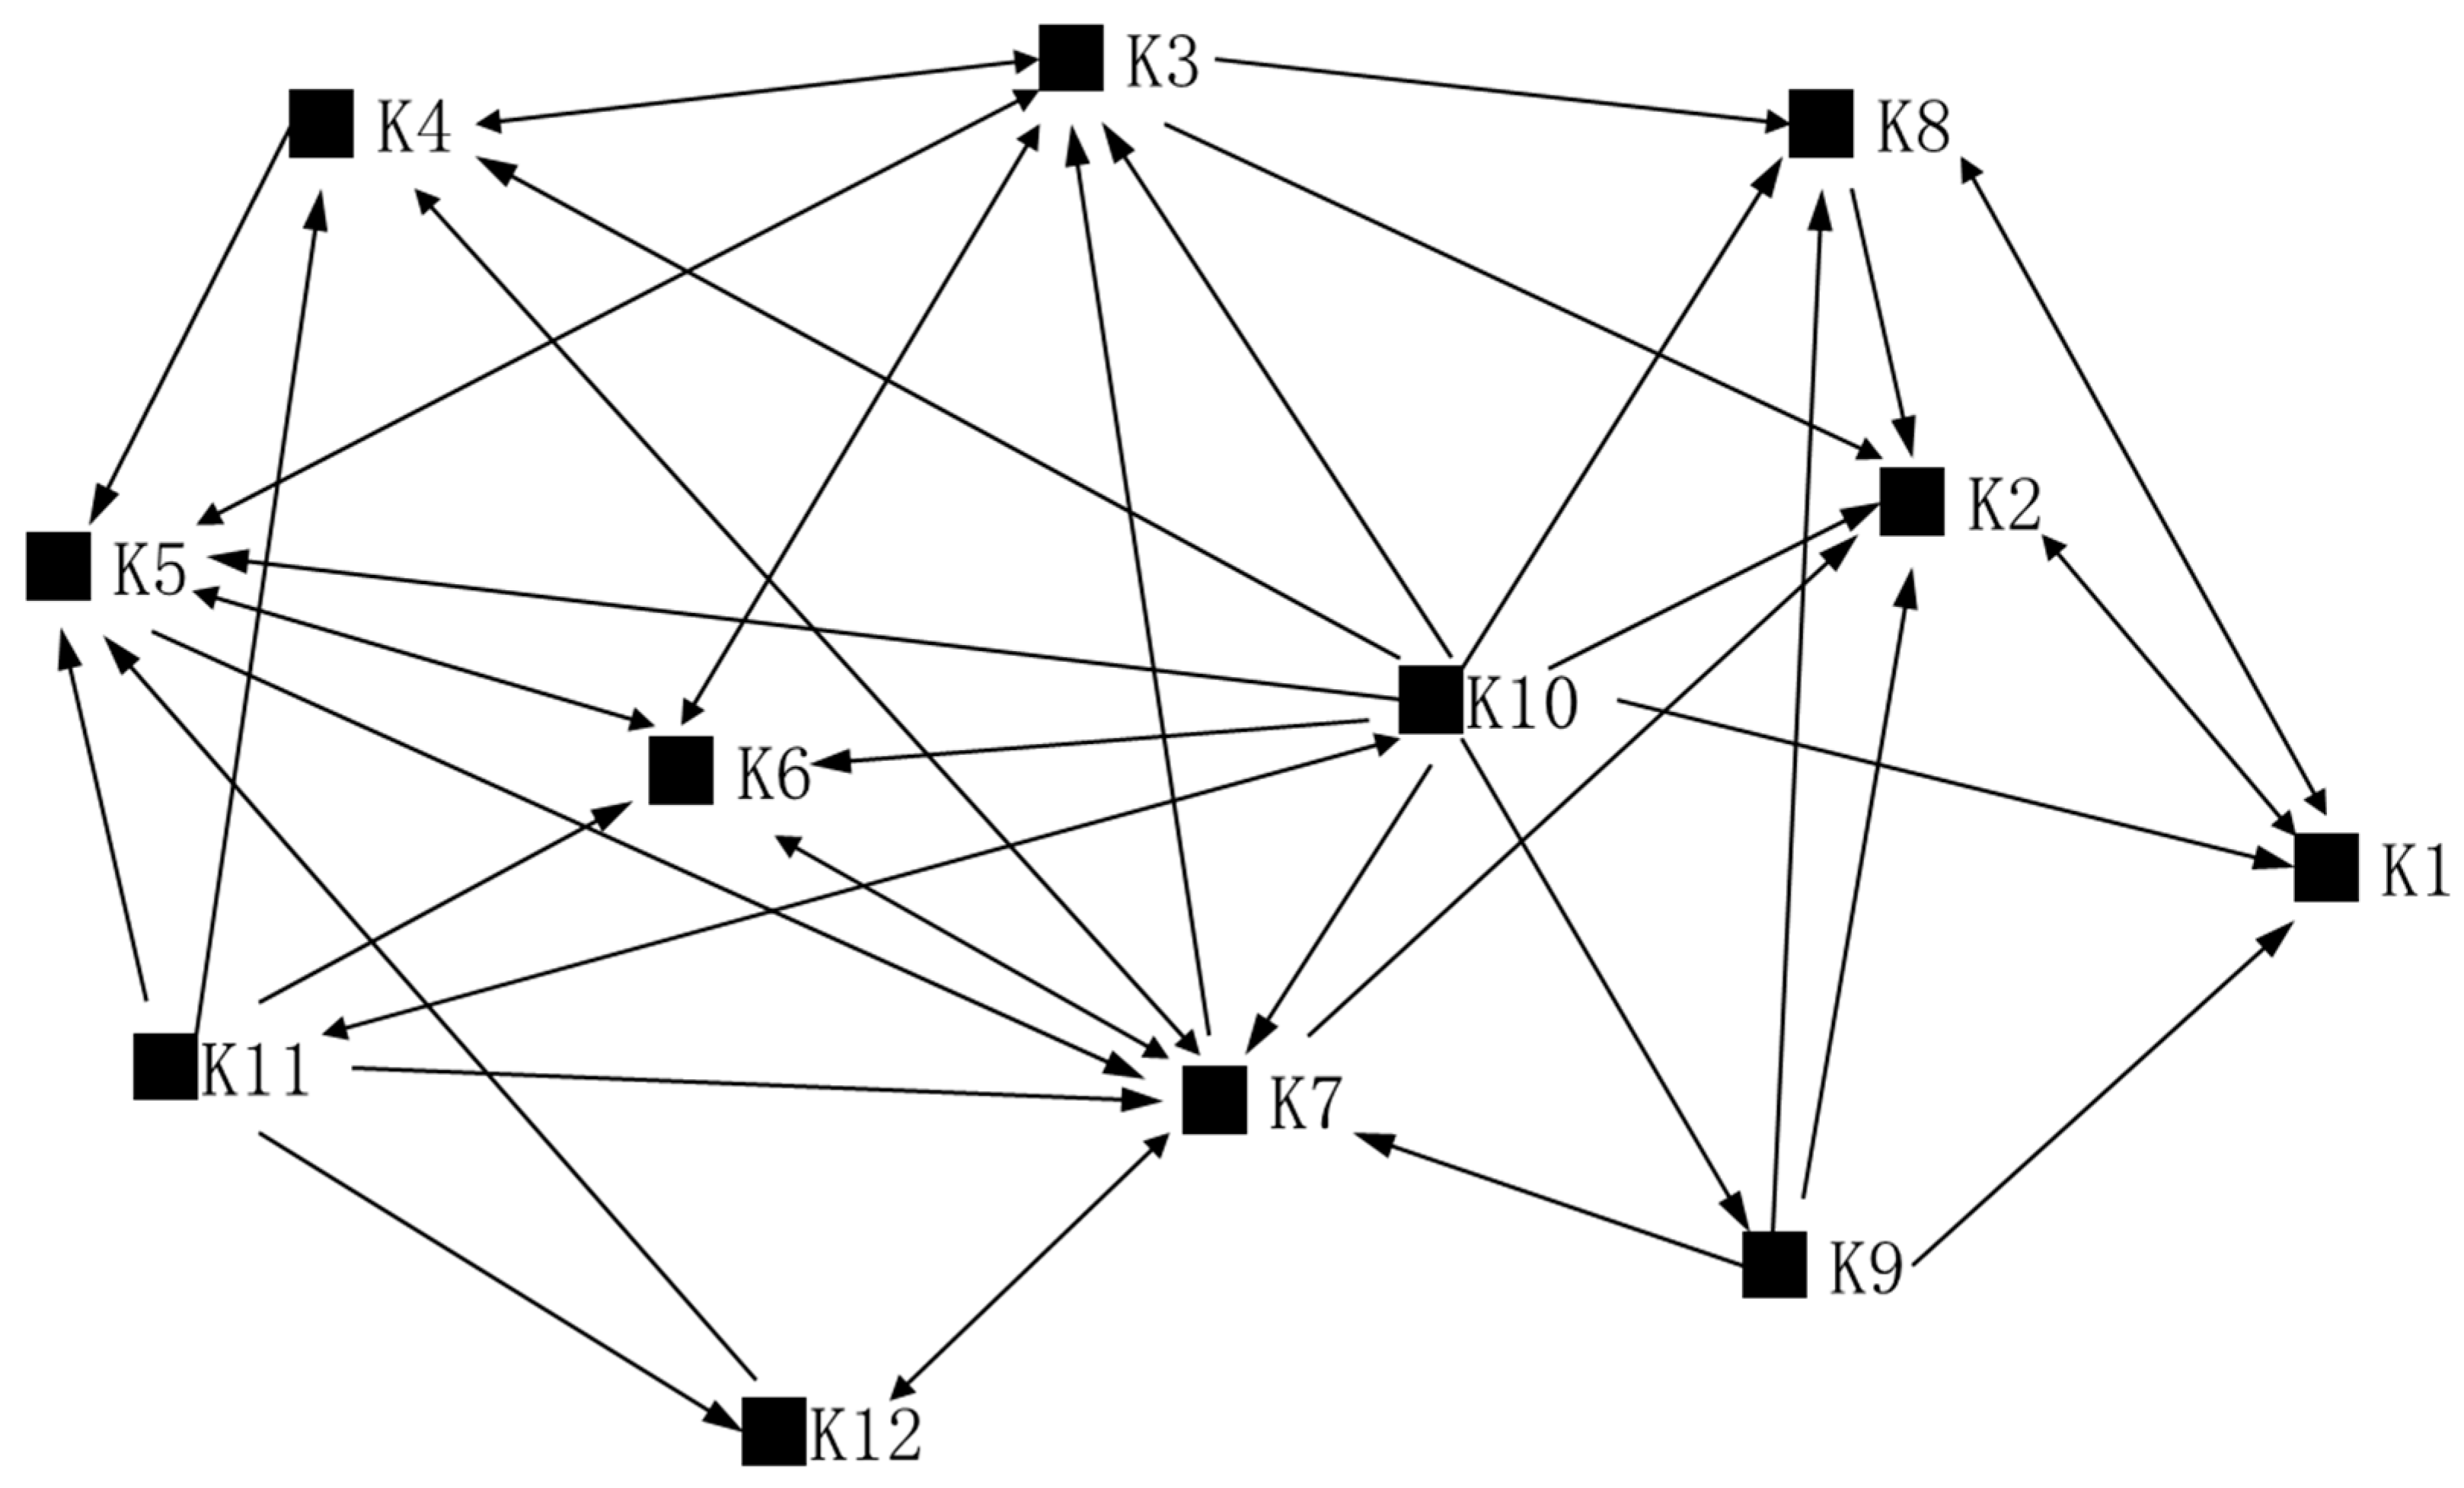
3.1. Building the Influencing Factor Network
3.2. Results of Network Analysis
- (1)
- Degree Centrality
- (2)
- Closeness Centrality
- (3)
- Between Centrality
4. Discussion
5. Conclusions
Author Contributions
Funding
Institutional Review Board Statement
Informed Consent Statement
Data Availability Statement
Acknowledgments
Conflicts of Interest
References
- Anderson, J.S. Energy use excellence and the building envelope. J. Green Build. 2019, 14, 181–204. [Google Scholar] [CrossRef]
- Wu, Z.Z.; He, Q.F.; Chen, Q.H.; Xue, H.; Li, S.H. A topical network based analysis and visualization of global research trends on green building from 1990 to 2020. J. Clean Prod. 2021, 320, 24. [Google Scholar] [CrossRef]
- Wu, Z.Z.; He, Q.F.; Yang, K.J.; Zhang, J.M.; Xu, K.X. Investigating the dynamics of China’s green building policy development from 1986 to 2019. Int. J. Environ. Res. Public Health 2021, 18, 196. [Google Scholar] [CrossRef] [PubMed]
- Peterson, F.; Hartmann, T.; Fruchter, R.; Fischer, M. Teaching construction project management with BIM support: Experience and lessons learned. Autom. Constr. 2011, 20, 115–125. [Google Scholar] [CrossRef]
- Wu, Z.Z.; Chen, C.H.; Cai, Y.Z.; Lu, C.; Wang, H.; Yu, T. BIM-Based visualization research in the construction industry: A network analysis. Int. J. Environ. Res. Public Health 2019, 16, 3473. [Google Scholar] [CrossRef]
- Wu, Z.Z.; Jiang, M.Y.; Li, H.; Luo, X.C.; Li, X.Y. Investigating the critical factors of professionals’ BIM adoption behavior based on the theory of planned behavior. Int. J. Environ. Res. Public Health 2021, 18, 3022. [Google Scholar] [CrossRef]
- Mao, Z.Y.; Li, Y.G.; Qiu, K.N.; Liu, J.Y. The preparation of standards for building information modeling construction application GB/T51235. Stand. Eng. Constr. 2019, 5, 71–74. [Google Scholar]
- Wang, S.J.; Gui, L.; Zhang, Y.Y. Application of the building information modeling in Metro construction project. Eng. Econ. 2019, 29, 38–42. [Google Scholar]
- Association, C.C. BIM Application Analysis Report of Chinese Construction Enterprises (2019); China Construction Industry Press: Beijing, China, 2019. [Google Scholar]
- Hochscheid, E.; Halin, G. Generic and SME-specific factors that influence the BIM adoption process: An overview that highlights gaps in the literature. Front. Eng. Manag. 2020, 7, 119–130. [Google Scholar] [CrossRef]
- Siebelink, S.; Voordijk, H.; Endedijk, M.; Adriaanse, A. Understanding barriers to BIM implementation: Their impact across organizational levels in relation to BIM maturity. Front. Eng. Manag. 2021, 8, 236–257. [Google Scholar] [CrossRef]
- Qin, X.; Mauro, M.; Agnese, T.; Lv, C.Y.; Wang, M. A comparative study on barriers between China and ltaly in BlM adoption from the construction market perspective. Chin. J. Manag. 2016, 13, 1718–1727. [Google Scholar]
- Guo, B.; Zhu, K.; Feng, t. BIM Collaborative Application Obstacle FactorInterpretation Structure Modlel. J. Civil Eng. Manag. 2019, 36, 7. [Google Scholar]
- Xie, T.R.; She, J.J.; Song, J.R. Countermeasure research on promoting BIM based on the analysis of key cost factors. J. Civil Eng. Manag. 2018, 35, 152–157. [Google Scholar]
- Alreshidi, E.; Mourshed, M.; Rezgui, Y. Factors for effective BIM governance. J. Build. Eng. 2017, 10, 89–101. [Google Scholar] [CrossRef]
- Olsen, D.; Taylor, J.M. Quantity Take-Off Using Building Information Modeling (BIM), and Its Limiting Factors. Procedia Eng. 2017, 196, 1098–1105. [Google Scholar] [CrossRef]
- Yang, Q.; Su, Z.M.; Jin, S.J.; She, S.J. Risk control system of construction project of integrated project delivery with social network analysis. J. Eng. Manag. 2015, 29, 110–115. [Google Scholar]
- Eastman, C.; Sacks, R. BIM Handbook: A Guide to Building Informationmodeling for Owners, Managers, Designers, Engineers and Contractors; John Wiley & Sons: New York, NY, USA, 2008. [Google Scholar]
- Ding, Z.K.; Zuo, J.; Wu, J.C.; Wang, J.Y. Key factors for the BIM adoption by architects: A China study. Eng. Constr. Archit. Manag. 2015, 22, 732–748. [Google Scholar] [CrossRef]
- Wan, L.; Huang, J.G. Research on the application status and obstacles of BIM technology in construction industry of Zhanjiang city. Constr. Econ. 2019, 40, 116–120. [Google Scholar]
- Xu, Y.Q.; Kong, Y.Y. Analysis of the influence factors of application and promotion of BIM in China. J. Eng. Manag. 2016, 30, 28–32. [Google Scholar]
- Li, Y.M.; Li, S.L. Analysis of factors restricting BIM technology promotion based on ISM method. Value Eng. 2020, 39, 178–180. [Google Scholar]
- Zhang, L.M.; Wu, X.G.; Wang, X.Y.; Wu, F.F. Behavior mining of BIM designers based on social network analysis. J. Eng. Manag. 2019, 33, 6–10. [Google Scholar]
- Wang, T.K.; Zhang, Q. Study on the cost control of real estate development projects based on BIM. Constr. Econ. 2015, 36, 51–55. [Google Scholar]
- Won, J.; Lee, G.; Dossick, C.; Messner, J. Where to focus for successful adoption of building information modeling within organization. J. Constr. Eng. Manag. 2013, 139, 10. [Google Scholar] [CrossRef]
- Suermann, P.C.; Issa, R.R. Evaluating industry perceptions of building information modelling (BIM) impact on construction. J. Inf. Technol. Constr. (ITcon) 2009, 14, 574–594. [Google Scholar]
- Xu, B.; Zhu, H.L. Research on BIM application status and influence mechanism of Chinese construction industry. Constr. Econ. 2015, 36, 10–14. [Google Scholar]
- Qi, E.T.; Li, Y.; Xiong, K.; Liu, Y.M.; Ma, C.Y. Factors of influencing BIM application in construction enterprises based on AHP. J. Guilin Univ. Technol. 2016, 36, 526–532. [Google Scholar]
- Ji, B.Y.; Qi, Z.Q.; Jin, Z.Y. Obstacles and countermeasures for BIM application in building industry based on the externalities analysis. Constr. Technol. 2014, 43, 84–87. [Google Scholar]
- Li, Y.Y.; Tang, T.T. The study of factors affecting the application of BIM in the construction industry based on SEM. J. Shenyang Jianzhu Univ. (Soc. Sci.) 2017, 19, 286–291. [Google Scholar]
- Liu, J.K.; Liu, J.C.; Wang, D.; Zhu, J. An analysis of BIM Cconstruction project risks using the DEMATEL model. J. Guangdong Univ. Technol. 2018, 35, 72–78. [Google Scholar]
- Hartmann, T. Applications of BIM and Hurdles for Widespread Adoption of BIM; Stanford University: Stanford, CA, USA, 2008; pp. 5–14. [Google Scholar]
- Ahuja, R.; Jain, M.; Sawhney, A.; Arif, M. Adoption of BIM by architectural firms in India: Technology–organization–environment perspective. Arch. Eng. Design Manag. 2016, 12, 311–330. [Google Scholar] [CrossRef]
- Liao, L.H.; Teo, E.A.L. Critical success factors for enhancing the building information modelling implementation in building projects in singapore. J. Civil Eng. Manag. 2017, 23, 1029–1044. [Google Scholar] [CrossRef]
- Ghaffarianhoseini, A.; Tookey, J.; Ghaffarianhoseini, A.; Naismith, N.; Azhar, S.; Efimova, O.; Raahemifar, K. Building Information Modelling (BIM) uptake: Clear benefits, understanding its implementation, risks and challenges. Renew. Sust. Energ. Rev. 2017, 75, 1046–1053. [Google Scholar] [CrossRef]
- Hu, S.J.; Xu, B.; Wang, J.P. Research on risk factors affecting BIM technology application in construction enterprises. China Real Estate 2018, 15, 65–73. [Google Scholar]
- Liu, X.X.; Wang, X.W. Research and analysis on influencing factors and measures of BlM technology popularization. Build. Technol. Dev. 2018, 45, 3–4. [Google Scholar]
- Liu, X.D.; Tian, L.; Gao, Z.Y. Research on BIM affect building engineering construction technology. J. Harbin Univ. Sci. Technol. 2015, 20, 117–120. [Google Scholar]
- He, Q.H.; Qian, L.L.; Duan, Y.F.; Li, Y.K. Current situation and barriers of BlM implementation. J. Eng. Manag. 2012, 26, 12–16. [Google Scholar]
- Shen, L.; Song, J.R.; Qian, J. Key factors and countermeasures of BIM application benefit based on DEMATEL model. J. Civil Eng. Manag. 2018, 35, 45–51. [Google Scholar]
- Feng, J.C.; Li, S.; Luo, H.; Zhang, K. The efficiency evaluation of BlM policies in China from the perspective of policy instruments. Soft Sci. 2020, 34, 70–74. [Google Scholar]
- Gong, Y.X. Analysis on the application status and development obstacles of BIM in China. China Market 2013, 46, 104–105. [Google Scholar]
- He, Q.H.; Yang, D.L.; Zheng, X. Survey on foreign theory and practice about BlM implementation. Sci. Technol. Manag. Res. 2015, 35, 136–141. [Google Scholar]
- Qi, B.K.; Wei, S.Y.; Shang, C.C.; Liu, Z.X. Research on the application of BIM technology in project management. Constr. Technol. 2018, 47, 1531–1534. [Google Scholar]
- Lu, R.X. Research on the influencing factors and analysis model of BlM collaboration management in construction projects. Constr. Econ. 2018, 39, 55–58. [Google Scholar]
- Li, H.J.; Zhang, Q.Q. Research on the hindering factors and countermeasures of the development of BIM technology in the construction industry. J. Inf. Technol. Civil Eng. Arch. 2016, 8, 45–50. [Google Scholar]
- Liu, H.L.; Liu, S.Y. Key factors of BIM adoption in firms based on TOE&RC framework. Value Eng. 2016, 35, 22–25. [Google Scholar]
- Ahmed, A.L.; Kassem, M. A unified BIM adoption taxonomy: Conceptual development, empirical validation and application. Autom. Constr. 2018, 96, 103–127. [Google Scholar] [CrossRef]
- Gao, M.; He, S.Y. A study of influencing factors for BIM application in Chinese construction industry based on factor analysis. J. Eng. Manag. 2019, 33, 38–42. [Google Scholar]
- Wang, Q.; Zhang, J.; Niu, Z. Architecture multi-disciplinary collaborative design process based on building information model. Tongji Daxue Xuebao 2018, 46, 1155–1160. [Google Scholar]
- Li, P.F.; Zheng, S.Q.; Si, H.Y.; Xu, K. Critical challenges for BIM adoption in small and medium-sized enterprises: Evidence from China. Adv. Civ. Eng. 2019, 2019, 9482350. [Google Scholar] [CrossRef]
- Eastman, C.M.; Eastman, C.; Teicholz, P.; Sacks, R.; Liston, K. BIM Handbook: A Guide to Building Information Modeling for Owners, Managers, Designers, Engineers and Contractors; John Wiley & Sons: Hoboken, NJ, USA, 2011. [Google Scholar]
- Poirier, E.A.; Staub-French, S.; Forgues, D. Measuring the impact of BIM on labor productivity in a small specialty contracting enterprise through action-research. Autom. Constr. 2015, 58, 74–84. [Google Scholar] [CrossRef]
- He, G.P. Construction company BIM technological route analysis. J. Eng. Manag. 2014, 28, 1–5. [Google Scholar]
- Cao, D.P.; Li, H.; Wang, G.B.; Zhang, W.J. Linking the motivations and practices of design organizations to implement building information modeling in construction projects: Empirical study in China. J. Manage. Eng. 2016, 32, 10. [Google Scholar] [CrossRef]
- Liu, S.; Wang, G. Analysis of research literature on influencing factors of BlM application. Eng. Econ. 2018, 28, 56–59. [Google Scholar]
- Ozorhon, B.; Karahan, U. Critical success factors of building information modeling implementation. J. Manage. Eng. 2017, 33, 10. [Google Scholar] [CrossRef]
- Zhao, Y.P. Applicability analysis and empirical study of BIM from the perspective of TOE-UTAUT. Soft Sci. 2018, 32, 101–105. [Google Scholar]
- Duan, Z.L.; Xie, H.T. Research on the obstacles of BIM technology in construction stage and the countermeasures. Value Eng. 2017, 36, 12–14. [Google Scholar]
- Bai, S.; Zhang, Y.K.; Han, F. The research on application obstacles and countermeasures of BlM technology in engineering consulting industry. J. Shenyang Jianzhu Univ. (Soc. Sci.) 2016, 18, 393–398. [Google Scholar]
- Xu, J.; Zhang, M.L.; Yin, Y.T.; Xu, Y.J. Analysis on obstacles to promotion of BlM in China. Jiangsu Arch. 2016, 117–120. [Google Scholar]
- Tang, X.L.; Yi, X.H. BIM technology diffusion study in construction enterprises. Constr. Technol. 2016, 45, 25–28. [Google Scholar]
- Li, J.C.; Liu, L. Evolution analysis of BIM adoption behaviors in engineering design industry in China. J. Eng. Manag. 2014, 28, 11–14. [Google Scholar]
- Zhang, J.P.; He, T.F.; Lin, J.R.; Chen, X.Y.; Zhang, Y.L. Lin Jiarui. Space and MEP topology extraction and application based on BIM. J. Tsinghua Univ. (Nat. Sci. Ed.) 2018, 58, 587–592. [Google Scholar]
- Man, Q.P.; Sun, L.Y.; Zhang, X.X. Factors analysis of cross-organizational BIM collaborative application. J. Eng. Manag. 2016, 30, 26–30. [Google Scholar]
- Ni, J.F. Research on influencing factors of BIM technology adoption willingness based on TAM. Eng. Econ. 2019, 29, 47–50. [Google Scholar]
- Li, M.M.; Lai, J.Y.; Chen, Q.L.; Yi, Z.N.; Sun, X.D. Application risk evaluation of BlM technology based on SEM. J. Chongqing Univ. Technol. (Nat. Sci.) 2018, 32, 206–212. [Google Scholar]
- Yuan, H.P.; Yang, Y. BIM adoption under government subsidy: Technology diffusion perspective. J. Constr. Eng. Manag. 2020, 146, 15. [Google Scholar] [CrossRef]
- Ou, Y.Y.W.; Shi, K.R.; Zhang, Y. Research on method of BIM-based construction schedule management of metro engineering. Arch. Technol. 2017, 48, 271–274. [Google Scholar]
- Chai, H. Researches on Reliability and Validity of Inspection Procedure in Questionnaire Design. World Sci. Tech. Res. Dev. 2010, 3, 548–550. [Google Scholar]
- Pan, X.; Zhong, B.T.; Wang, X.B.; Xiang, R. Text Mining-Based patent analysis of BIM application in construction. J. Civil Eng. Manag. 2021, 27, 303–315. [Google Scholar] [CrossRef]
- Freeman, L.C. Research Methods in Social Network Analysis; Taylor and Francis: Milton Park, UK, 2017. [Google Scholar]
- Huang, N.; Bai, L.B.; Wang, H.L.; Du, Q.; Shao, L.; Li, J.T. Social network analysis of factors influencing green building development in China. Int. J. Environ. Res. Public Health 2018, 15, 2684. [Google Scholar] [CrossRef]

| Hindering Factors of BIM Application | Sources |
|---|---|
| 1. The costs of BIM expert consultation and training are high. | [18,19] |
| 2. The costs of hardware upgrade configuration are high. | [20,21] |
| 3. The costs of BIM software upgrade configuration are high. | [21,22] |
| 4. The application of BIM increases the design cost. | [23,24] |
| 5. The benefits of BIM application are not clearly defined. | [25,26] |
| 6. The economic benefits and application value brought by BIM are not obvious. | [27,28] |
| 7. The cost sharing and benefit distribution mechanism of BIM application by all parties is not perfect. | [29,30] |
| 8. The support of domestic BIM software is insufficient, and the localization degree of foreign software is not high. | [22,31] |
| 9. The function of BIM software is not perfect (such as poor mapping, poor application, poor expansibility, and poor compatibility). | [28,31] |
| 10. There is a lack of unified BIM information and data exchange standards. | [32,33] |
| 11. The accuracy required by each discipline for the model is not uniform, the interaction between disciplines is not perfect, and the data interoperability of BIM software is insufficient. | [34,35] |
| 12. The BIM supporting software is immature. | [35,36] |
| 13. There are insufficient data sources for BIM modeling. | [37,38] |
| 14. The BIM information collaboration platform is not mature. | [39,40] |
| 15. BIM cloud service technology is not perfect. | [41,42] |
| 16. The data protection and security issues of BIM are not perfect. | [12,43] |
| 17. The BIM secondary development is not mature. | [12,44] |
| 18. BIM technology has a single application point and is not closely combined with other advanced technologies. | [21,45] |
| 19. There is a lack of trust in the accuracy of the BIM model, resulting in the duplication of work. | [15,46] |
| 20. Enterprises do not pay enough attention to BIM and lack external and internal driving forces, and the application rate of BIM is low. | [47,48] |
| 21. The internal BIM capability of the enterprise is insufficient, the enterprise organizational structure matching with BIM is lacking, the overall management is lacking, and the comprehensive application mode of BIM is lacking. | [12,26] |
| 22. The goal of enterprises using BIM is not clear, and there is lack of strategic plans for the use of BIM. | [30,49] |
| 23. The referenced successful cases and BIM application experiences are insufficient. | [40,50] |
| 24. All stakeholders have insufficient awareness of sharing BIM achievements. | [51,52] |
| 25. Stakeholders have insufficient understanding of the essence of BIM technology, and there are deviations in their cognition of BIM value and application. | [53,54] |
| 26. The communication and cooperation among the stakeholders of the projects are insufficient. | [15,55] |
| 27. The project participants have different proficiencies in BIM applications. | [22,56] |
| 28. There is a lack of BIM talents (e.g., lack of mature BIM management teams, BIM experts, and BIM software proficiency). | [34,57] |
| 29. The society has low recognition of middle and senior BIM management staff. | [58,59] |
| 30. There is a lack of systematic BIM education systems and institutions. | [60,61] |
| 31. The BIM-related materials and learning opportunities are insufficient. | [30,45] |
| 32. It is difficult to transform the working mode from independent to collaborative, and it is difficult to accept the new BIM technology. | [54,62] |
| 33. There is insufficient research on BIM. | [36,63] |
| 34. The lack of a BIM application policy has led to the lack of BIM application. | [14,36] |
| 35. There is a lack of unified BIM standards, guidelines, and contract model texts from industry-competent departments. | [39,64] |
| 36. The legal liability boundary of BIM is not clear and lacks relevant laws (such as BIM intellectual property protection law and BIM insurance law). | [12,42] |
| 37. There is a lack of a BIM database conforming to domestic building codes and standardization. | [28,65] |
| 38. The definition of BIM deliverables is unclear. | [40,66] |
| 39. There is a lack of incentive mechanisms for BIM application. | [67,68] |
| 40. The dispute resolution mechanism of the BIM project is not mature. | [21,58] |
| 41. There is a mismatch between responsibilities and risks of parties involved in BIM application. | [30,35] |
| 42. There is a lack of long-term application plans and schemes of BIM. | [41,69] |
| 43. There is a lack of project management mode based on BIM and workflow throughout the whole industry chain. | [26,43] |
| Classification | Hindering Factors of BIM Applications |
|---|---|
| Economic | A1. The costs of BIM expert consultation and training are high. |
| A2. The costs of hardware upgrade configuration are high. | |
| A3. The costs of BIM software upgrade configuration are high. | |
| A4. The application of BIM increases the design cost. | |
| A5. The benefits of BIM applications are not clearly defined. | |
| A6. The cost sharing and benefit distribution mechanism of BIM applications by all parties is not perfect. | |
| Technology | B1. The support of domestic BIM software is insufficient, and the localization degree of foreign software is not high. |
| B2. The function of BIM software is not perfect (such as poor mapping, poor application, poor expansibility, and poor compatibility). | |
| B3. The accuracy required by each discipline for the model is not uniform, the interaction between disciplines is not perfect, and the data interoperability of BIM software is insufficient. | |
| B4. The secondary development based on BIM is not mature. | |
| B5. BIM’s cloud service technology is not perfect. | |
| B6. BIM’s data protection and security issues are not perfect. | |
| Social environment | C1. Enterprises do not pay enough attention to BIM, and the application rate of BIM is low. |
| C2. All stakeholders have insufficient awareness of sharing BIM achievements. | |
| C3. The stakeholders’ different perceptions of BIM value and application are biased. | |
| C4. Stakeholders have different proficiencies in BIM applications. | |
| C5. There is a lack of BIM talents (e.g., lack of mature BIM management teams, BIM experts, and BIM software proficiency). | |
| C6. There is a lack of systematic BIM education systems, and insufficient BIM-related materials and learning opportunities. | |
| C7. It is difficult to transform the working mode from independent to collaborative, and it is difficult to accept the new BIM technology. | |
| Institution | D1. There is a lack of policies to promote BIM application (such as incentive mechanism for BIM applications), resulting in insufficient BIM market demand. |
| D2. There is a lack of unified BIM standards and contract model texts from industry-competent departments. | |
| D3. The legal liability boundary of BIM is not clear and lacks relevant laws (such as BIM intellectual property protection law and BIM insurance law). | |
| D4. There is a lack of a BIM database conforming to domestic building codes and standardization. | |
| D5. There is a mismatch between responsibilities and risks of parties involved in BIM applications. | |
| D6. There is a lack of BIM project management mode and workflow throughout the whole industry chain. |
| Classification | Number | Standardized Alpha | Standardized Total Alpha |
|---|---|---|---|
| Economic | 6 | 0.910 | 0.970 |
| Technology | 6 | 0.904 | |
| Social environment | 7 | 0.912 | |
| Institution | 6 | 0.899 |
| Average | Median | Mode | Standard Deviation | Mean Sorting | |
|---|---|---|---|---|---|
| A1 | 3.95 | 4 | 4 | 1.034 | 20 |
| A2 | 3.94 | 4 | 4 | 1.078 | 22 |
| A3 | 4.19 | 4 | 4 | 0.942 | 9 |
| A4 | 4.16 | 4 | 4 | 0.935 | 11 |
| A5 | 3.90 | 4 | 4 | 1.082 | 25 |
| A6 | 4.12 | 4 | 4 | 0.895 | 12 |
| B1 | 3.95 | 4 | 4 | 1.098 | 21 |
| B2 | 4.23 | 4 | 4 | 0.862 | 4 |
| B3 | 3.98 | 4 | 4 | 1.047 | 15 |
| B4 | 4.19 | 4 | 4 | 0.883 | 10 |
| B5 | 3.97 | 4 | 5 | 1.053 | 17 |
| B6 | 4.24 | 4 | 5 | 0.925 | 3 |
| C1 | 3.92 | 4 | 4 | 1.024 | 23 |
| C2 | 4.22 | 4 | 4 | 0.934 | 5 |
| C3 | 4.06 | 4 | 5 | 1.044 | 13 |
| C4 | 4.28 | 4 | 5 | 0.877 | 1 |
| C5 | 3.98 | 4 | 4 | 1.038 | 16 |
| C6 | 4.22 | 4 | 4 | 0.871 | 6 |
| C7 | 3.96 | 4 | 4 | 1.038 | 18 |
| D1 | 4.21 | 4 | 4 | 0.886 | 8 |
| D2 | 3.96 | 4 | 4 | 1.044 | 19 |
| D3 | 4.26 | 4 | 5 | 0.934 | 2 |
| D4 | 4.05 | 4 | 5 | 1.032 | 14 |
| D5 | 4.22 | 4 | 4 | 0.926 | 7 |
| D6 | 3.92 | 4 | 4 | 1.033 | 24 |
| A1 | A2 | A3 | A4 | A5 | A6 | B1 | B2 | B3 | B4 | B5 | B6 | C1 | C2 | C3 | C4 | C5 | C6 | C7 | D1 | D2 | D3 | D4 | D5 | D6 | |
|---|---|---|---|---|---|---|---|---|---|---|---|---|---|---|---|---|---|---|---|---|---|---|---|---|---|
| A1 | 1.000 | ||||||||||||||||||||||||
| A2 | 0.315 ** | 1.000 | |||||||||||||||||||||||
| A3 | 0.357 ** | 0.415 ** | 1.000 | ||||||||||||||||||||||
| A4 | 0.377 ** | 0.398 ** | 0.382 ** | 1.000 | |||||||||||||||||||||
| A5 | 0.415 ** | 0.382 ** | 0.331 ** | 0.427 ** | 1.000 | ||||||||||||||||||||
| A6 | 0.338 ** | 0.427 ** | 0.342 ** | 0.414 ** | 0.324 ** | 1.000 | |||||||||||||||||||
| B1 | 0.348 ** | 0.304 ** | 0.378 ** | 0.291 ** | 0.392 ** | 0.278 ** | 1.000 | ||||||||||||||||||
| B2 | 0.379 ** | 0.402 ** | 0.343 ** | 0.378 ** | 0.371 ** | 0.427 ** | 0.334 ** | 1.000 | |||||||||||||||||
| B3 | 0.369 ** | 0.285 ** | 0.414 ** | 0.363 ** | 0.425 ** | 0.364 ** | 0.400 ** | 0.363 ** | 1.000 | ||||||||||||||||
| B4 | 0.248 ** | 0.416 ** | 0.316 ** | 0.375 ** | 0.249 ** | 0.393 ** | 0.404 ** | 0.441 ** | 0.344 ** | 1.000 | |||||||||||||||
| B5 | 0.362 ** | 0.376 ** | 0.370 ** | 0.350 ** | 0.382 ** | 0.334 ** | 0.466 ** | 0.342 ** | 0.345 ** | 0.405 ** | 1.000 | ||||||||||||||
| B6 | 0.324 ** | 0.421 ** | 0.279 ** | 0.411 ** | 0.391 ** | 0.437 ** | 0.373 ** | 0.393 ** | 0.290 ** | 0.435 ** | 0.475 ** | 1.000 | |||||||||||||
| C1 | 0.396 ** | 0.352 ** | 0.372 ** | 0.379 ** | 0.468 ** | 0.350 ** | 0.327 ** | 0.351 ** | 0.372 ** | 0.299 ** | 0.443 ** | 0.302 ** | 1.000 | ||||||||||||
| C2 | 0.434 ** | 0.401 ** | 0.382 ** | 0.351 ** | 0.382 ** | 0.426 ** | 0.309 ** | 0.375 ** | 0.344 ** | 0.382 ** | 0.331 ** | 0.344 ** | 0.383 ** | 1.000 | |||||||||||
| C3 | 0.393 ** | 0.386 ** | 0.342 ** | 0.317 ** | 0.403 ** | 0.295 ** | 0.362 ** | 0.284 ** | 0.429 ** | 0.265 ** | 0.370 ** | 0.282 ** | 0.390 ** | 0.288 ** | 1.000 | ||||||||||
| C4 | 0.388 ** | 0.359 ** | 0.331 ** | 0.425 ** | 0.391 ** | 0.371 ** | 0.430 ** | 0.370 ** | 0.376 ** | 0.429 ** | 0.478 ** | 0.402 ** | 0.317 ** | 0.374 ** | 0.339 ** | 1.000 | |||||||||
| C5 | 0.375 ** | 0.311 ** | 0.372 ** | 0.305 ** | 0.265 ** | 0.319 ** | 0.375 ** | 0.338 ** | 0.381 ** | 0.281 ** | 0.307 ** | 0.333 ** | 0.359 ** | 0.353 ** | 0.419 ** | 0.358 ** | 1.000 | ||||||||
| C6 | 0.391 ** | 0.319 ** | 0.356 ** | 0.392 ** | 0.360 ** | 0.292 ** | 0.369 ** | 0.325 ** | 0.355 ** | 0.322 ** | 0.371 ** | 0.351 ** | 0.383 ** | 0.366 ** | 0.398 ** | 0.433 ** | 0.354 ** | 1.000 | |||||||
| C7 | 0.323 ** | 0.315 ** | 0.384 ** | 0.314 ** | 0.370 ** | 0.242 ** | 0.276 ** | 0.341 ** | 0.378 ** | 0.299 ** | 0.323 ** | 0.309 ** | 0.377 ** | 0.330 ** | 0.273 ** | 0.313 ** | 0.342 ** | 0.300 ** | 1.000 | ||||||
| D1 | 0.386 ** | 0.428 ** | 0.368 ** | 0.370 ** | 0.300 ** | 0.359 ** | 0.312 ** | 0.402 ** | 0.380 ** | 0.339 ** | 0.319 ** | 0.356 ** | 0.381 ** | 0.341 ** | 0.421 ** | 0.437 ** | 0.339 ** | 0.391 ** | 0.348 ** | 1.000 | |||||
| D2 | 0.314 ** | 0.350 ** | 0.290 ** | 0.362 ** | 0.342 ** | 0.349 ** | 0.339 ** | 0.305 ** | 0.391 ** | 0.336 ** | 0.419 ** | 0.403 ** | 0.347 ** | 0.287 ** | 0.398 ** | 0.373 ** | 0.372 ** | 0.326 ** | 0.354 ** | 0.348 ** | 1.000 | ||||
| D3 | 0.354 ** | 0.374 ** | 0.343 ** | 0.345 ** | 0.344 ** | 0.407 ** | 0.291 ** | 0.438 ** | 0.367 ** | 0.360 ** | 0.404 ** | 0.470 ** | 0.353 ** | 0.374 ** | 0.310 ** | 0.427 ** | 0.317 ** | 0.373 ** | 0.422 ** | 0.402 ** | 0.350 ** | 1.000 | |||
| D4 | 0.385 ** | 0.325 ** | 0.411 ** | 0.403 ** | 0.307 ** | 0.322 ** | 0.296 ** | 0.304 ** | 0.382 ** | 0.331 ** | 0.375 ** | 0.366 ** | 0.309 ** | 0.285 ** | 0.273 ** | 0.375 ** | 0.403 ** | 0.413 ** | 0.328 ** | 0.318 ** | 0.413 ** | 0.358 ** | 1.000 | ||
| D5 | 0.448 ** | 0.384 ** | 0.386 ** | 0.416 ** | 0.326 ** | 0.320 ** | 0.361 ** | 0.391 ** | 0.333 ** | 0.367 ** | 0.433 ** | 0.340 ** | 0.338 ** | 0.375 ** | 0.328 ** | 0.416 ** | 0.381 ** | 0.389 ** | 0.342 ** | 0.336 ** | 0.393 ** | 0.433 ** | 0.389 ** | 1.000 | |
| D6 | 0.358 ** | 0.338 ** | 0.405 ** | 0.276 ** | 0.333 ** | 0.315 ** | 0.335 ** | 0.255 ** | 0.324 ** | 0.290 ** | 0.331 ** | 0.305 ** | 0.357 ** | 0.292 ** | 0.344 ** | 0.296 ** | 0.304 ** | 0.359 ** | 0.331 ** | 0.329 ** | 0.335 ** | 0.299 ** | 0.384 ** | 0.307 ** | 1.000 |
| Number | Key Hindering Factors |
|---|---|
| K1 | The costs of BIM expert consultation and training are high. |
| K2 | The application of BIM increases the design cost. |
| K3 | The function of BIM software is not perfect (such as poor mapping, poor application, poor expansibility, and poor compatibility). |
| K4 | There is a lack of unified BIM information data exchange standards and insufficient data interoperability. |
| K5 | BIM’s cloud service technology is not perfect. |
| K6 | BIM’s data protection and security issues are not perfect. |
| K7 | All stakeholders have insufficient awareness of sharing BIM achievements. |
| K8 | Stakeholders have different proficiencies in BIM applications. |
| K9 | There is a lack of systematic BIM education systems, and insufficient BIM-related materials and learning opportunities. |
| K10 | There is a lack of policies to promote BIM applications (such as incentive mechanism for BIM applications), resulting in insufficient BIM market demand. |
| K11 | The legal liability boundary of BIM is not clear and lacks relevant laws (such as BIM intellectual property protection law and BIM insurance law). |
| K12 | There is a mismatch between responsibilities and risks of parties involved in BIM applications. |
| Code | K1 | K2 | K3 | K4 | K5 | K6 | K7 | K8 | K9 | K10 | K11 | K12 |
|---|---|---|---|---|---|---|---|---|---|---|---|---|
| K1 | 0 | 1 | 0 | 0 | 0 | 0 | 0 | 1 | 0 | 0 | 0 | 0 |
| K2 | 1 | 0 | 0 | 0 | 0 | 0 | 0 | 0 | 0 | 0 | 0 | 0 |
| K3 | 0 | 1 | 0 | 1 | 1 | 1 | 0 | 1 | 0 | 0 | 0 | 0 |
| K4 | 0 | 0 | 1 | 0 | 1 | 1 | 1 | 0 | 0 | 0 | 0 | 0 |
| K5 | 0 | 0 | 1 | 0 | 0 | 1 | 1 | 0 | 0 | 0 | 0 | 0 |
| K6 | 0 | 0 | 1 | 1 | 1 | 0 | 1 | 0 | 0 | 0 | 0 | 1 |
| K7 | 0 | 1 | 1 | 1 | 0 | 1 | 0 | 0 | 0 | 0 | 0 | 1 |
| K8 | 1 | 1 | 0 | 0 | 0 | 0 | 0 | 0 | 0 | 0 | 0 | 0 |
| K9 | 1 | 1 | 0 | 0 | 0 | 0 | 1 | 1 | 0 | 0 | 0 | 0 |
| K10 | 1 | 1 | 1 | 1 | 1 | 1 | 1 | 1 | 1 | 0 | 1 | 1 |
| K11 | 0 | 0 | 0 | 1 | 1 | 1 | 1 | 0 | 0 | 1 | 0 | 1 |
| K12 | 0 | 0 | 0 | 0 | 1 | 1 | 1 | 0 | 0 | 0 | 0 | 0 |
| Number | Degree Centrality | Closeness Centrality | Between Centrality | |||
|---|---|---|---|---|---|---|
| Out-Degree | In-Degree | Difference | In-Closeness Centrality | Out-Closeness Centrality | ||
| K1 | 2 | 4 | −2 | 50.000 | 10.000 | 1.000 |
| K2 | 1 | 6 | −5 | 68.750 | 9.910 | 4.500 |
| K3 | 5 | 5 | 0 | 23.404 | 23.404 | 9.333 |
| K4 | 4 | 5 | −1 | 23.404 | 22.449 | 1.033 |
| K5 | 3 | 6 | −3 | 23.404 | 22.000 | 1.200 |
| K6 | 5 | 7 | −2 | 24.444 | 22.917 | 4.533 |
| K7 | 5 | 7 | −2 | 24.444 | 23.404 | 12.700 |
| K8 | 2 | 4 | −2 | 57.895 | 10.000 | 1.500 |
| K9 | 4 | 1 | 3 | 9.910 | 28.205 | 0.000 |
| K10 | 11 | 1 | 10 | 9.091 | 100.000 | 3.700 |
| K11 | 6 | 1 | 5 | 9.091 | 68.750 | 0.000 |
| K12 | 3 | 4 | −1 | 22.917 | 21.569 | 0.500 |
| Mean Value | 4.250 | 4.917 | 1 | 28.896 | 30.217 | 3.333 |
Publisher’s Note: MDPI stays neutral with regard to jurisdictional claims in published maps and institutional affiliations. |
© 2022 by the authors. Licensee MDPI, Basel, Switzerland. This article is an open access article distributed under the terms and conditions of the Creative Commons Attribution (CC BY) license (https://creativecommons.org/licenses/by/4.0/).
Share and Cite
Wu, Z.; Lu, Y.; He, Q.; Hong, Q.; Chen, C.; Antwi-Afari, M.F. Investigating the Key Hindering Factors and Mechanism of BIM Applications Based on Social Network Analysis. Buildings 2022, 12, 1270. https://doi.org/10.3390/buildings12081270
Wu Z, Lu Y, He Q, Hong Q, Chen C, Antwi-Afari MF. Investigating the Key Hindering Factors and Mechanism of BIM Applications Based on Social Network Analysis. Buildings. 2022; 12(8):1270. https://doi.org/10.3390/buildings12081270
Chicago/Turabian StyleWu, Zezhou, Yun Lu, Qiufeng He, Qing Hong, Changhong Chen, and Maxwell Fordjour Antwi-Afari. 2022. "Investigating the Key Hindering Factors and Mechanism of BIM Applications Based on Social Network Analysis" Buildings 12, no. 8: 1270. https://doi.org/10.3390/buildings12081270
APA StyleWu, Z., Lu, Y., He, Q., Hong, Q., Chen, C., & Antwi-Afari, M. F. (2022). Investigating the Key Hindering Factors and Mechanism of BIM Applications Based on Social Network Analysis. Buildings, 12(8), 1270. https://doi.org/10.3390/buildings12081270