1. Introduction
Abu Dhabi (the capital of the United Arab Emirates) has experienced rapid urban development in the last 70 years. The city is expanding towards the inner part of the country. Referring to a recent study done in the city of Abu Dhabi, 80% of energy consumption goes to the building sector and 70% of this energy goes to cooling the buildings [
1].
There are several initiatives and standards from the Abu Dhabi Emirate on energy efficiency in buildings with the goal of reducing the total consumption of cities under this Emirate. Al Ain, located in the inner part of the country (border with Oman), is part of the Abu Dhabi Emirate. Therefore, the new rating system of ESTIDAMA is applied in new constructions. This building code was introduced by the Urban Planning Council and is part of the Abu Dhabi 2030 sustainability plan [
2].
1.1. Retrofit Strategies
There are several retrofit strategies that can be applied to a building to reduce energy consumption. Particularly in Middle Eastern countries, the focus is to minimize the cooling load used in buildings, therefore the strategies include shading devices on the windows, cool paint on the roofs and the walls, efficient windows, insulated walls, all of which can have a drastic impact on energy consumption. In a recent study done on a house on the main island of Abu Dhabi, an application of several retrofit strategies, such as Louvres to the windows, cool paint on the roof, shading around the building, improving wall insulation, adding shading in the central atrium led to an annual reduction in energy consumption of 34% [
3,
4].
Referring to a study where a building (single-family house) in Abu Dhabi was modified based on a comparison of standards of LEED, ASHRAE, and ESIDAMA, there was a 61% energy reduction based on the ESTIDAMA rating system. Based on the standards, the walls were more insulated and the windows and the air conditioning unit were more efficient. This is because the standards consider the local climate and geographical location of the region [
5,
6].
Furthermore, if a double-skin façade is added to a building, energy consumption falls by 16%. In this study, conducted at the multipurpose building of Abu Dhabi media zone where Two Four54 towers are located, the application of double skin not only reduced electricity consumption but also improved internal comfort due to the reduction of direct light on the users [
7].
The impact of a parametric design structure on energy consumption reduction in the Mreifa Compound villa was 10%. This reduction was due to the parametrization of the structure as a retrofit strategy based on several parameters. The parameters were mainly related to creating shade in the current building, keeping a visual connection indoors and outdoors, and improving outdoor thermal comfort in the area in front of the building [
8].
1.2. Modelling and Simulation
Based on the concept of a zero-emission city, a recent study made some important advancements in urban building greenhouse systems. This system has specific dimensions related to the necessary land areas for the needed supply. The methodology of this study is based on system modeling language (SysML). The parametric information is added to design-oriented modeling, overlapping with the geometry-based computer-added design (CAD) [
9].
Referring to a recent study based on the RHINO tool and plug-in Grasshopper/Ladybug, a parametric design was used as a double-skin façade. In addition, BIPV (building integrated PV) was integrated into the structure by maintaining an architectural connection to the building. This approach where the area of BIPV is larger when using standard modules proved to be more efficient in terms of the energy supply [
10].
A detailed energy model based on a parametric approach has proven to be flexible in the results obtained from several scenarios. The energy evaluation was done throughthrough Termolog Epix. The scenarios of design, once built, could be simulated faster, and changes were possible at every stage and were easy to apply [
11].
RHINO is the environment where modeling is done. The plug-in tools make the simulations and parametrization possible. Grasshopper, Ladybug, and Honeybee are connected to Energy Plus. Energy Plus is the engine of the simulation. Grasshopper is the environment where the scripts are connected to the main model; Honeybee is the connector to the weather files; Ladybug is the connector of the model with the energy simulation plug-in. In order to achieve zero-energy buildings, a sensitivity analysis was conducted in order to understand the role of each plug-in and their impact on the results [
12,
13,
14].
Understanding the environment of Rhino Grasshopper might be challenging for the architects since the base of the simulations is Python and basic scripting knowledge are needed. Therefore, researchers developed a new methodology of design procedures (DP) that is more user-friendly. Based on DP that was tested on the columns of a temple, it was possible to generate the initial design of the columns and a large number of variables [
15].
Analyzing daylight in Rhino/Grasshopper, several parameters are studied, such as building geometry, material transparency, and reflectance. Honeybee creates thermal zones and EnergyPlus links the geometry with the materials for the energy simulation. In order to optimize the daylight in the building, the maximum useful daylight intensity (UDI) and the minimum end use intensity (EUI) are combined [
16].
Referring to a new study done in an office building, optimizing the methodology of the building design can minimize energy consumption by maximizing daylight. The sizes and the orientation of the windows in all the facades of the building were optimized throughthrough EnergyPlus and Radiance. In connection with the location of the building studied in China, the south and the north were the best window orientations [
17].
By improving the algorithms in Grasshopper, the modeling and simulation time can be reduced. Therefore, the performance-based generative design study brings light on the evolution of scripts used for optimization and parametrization in the building design and performance [
18].
Referring to a study of slats in a south-oriented window office in the city of Cairo, the use of Grasshopper with the introduction of several parameters defines the best distance, the balance between the slats, and the light that was entering the office. The process of optimization included an analysis on equinox days with the aim of minimizing the direct light into the office [
19].
The geometry of a building and the performance are strictly connected to the process. This connection was analyzed in a parallel network of PCs running Windows 7 and a Linux web server. The geometry itself is one of the elements linked to processing, however, the solution space is a crucial factor [
20].
1.3. Parametric Design
By the use of advanced tools such as Grasshopper, Rhinoceros, Galapagos Gas, and ANSYS CFD, it is possible to design sustainable communities with parametric design processes. Using innovative methodology-optimized building forms in integration with the surrounding spaces can bring a decrease in energy performance, contributing to a more sustainable community [
21].
Based on a recent study a comparison was done in the work of several architects using different methodologies in problem spaces and solution spaces. This task was carried out through PDE (parametric design environment) and GME (geometric modeling environment). Even though the designers worked with similar efforts in both environments, there were significant differences in the problem solution in each environment [
22].
There is an increasing effort in improving the simulation tools in relation to climate conditions where a certain building is located. Since the early stages of design, before moving to the construction detailing, the energy performance of the building defines the best design option to be selected for the final process. The improving tools are: AutoDesk Ecotect, Rhino, and Grasshopper, version 2020 [
23].
In a recent study, Radiance/Daysim formats were generated from models in RHINO in order to produce solar radiation maps and daylight autonomy distributions. The initial results are sent back to RHINO enabling the architects to make the necessary changes for an optimized building design. This connection saves time in the early stage of the design compared to the modifications that used to be done previously in an advanced stage of the design [
24].
In a recent study, a teaching experiment was conducted. The multidomain simulation teaches a new approach to building design from the early stages. Form optimization and daylight analysis bring more energy-efficient models. Design simulation modeling brings innovation in terms of merging creative thinking with analytical thinking [
25].
Referring to the literature review, there are several retrofit strategies that can be applied to a building in a Middle Eastern City. However, the shading devices applied as a double skin seems to be the most common strategy.
The aim of this study is to evaluate the energy consumption of a retrofitted building versus a new building designed based on advanced tools of calculation. The new design is based on sustainability principles of design, as well as the advanced parametric design where the analysis considers several parameters.
The novelty of this research is the use of advanced tools to design a new efficient building in terms of energy. This process from the concept to the modeling and simulation can help the industry in applying such tools in the early stages of design.
2. Methodology
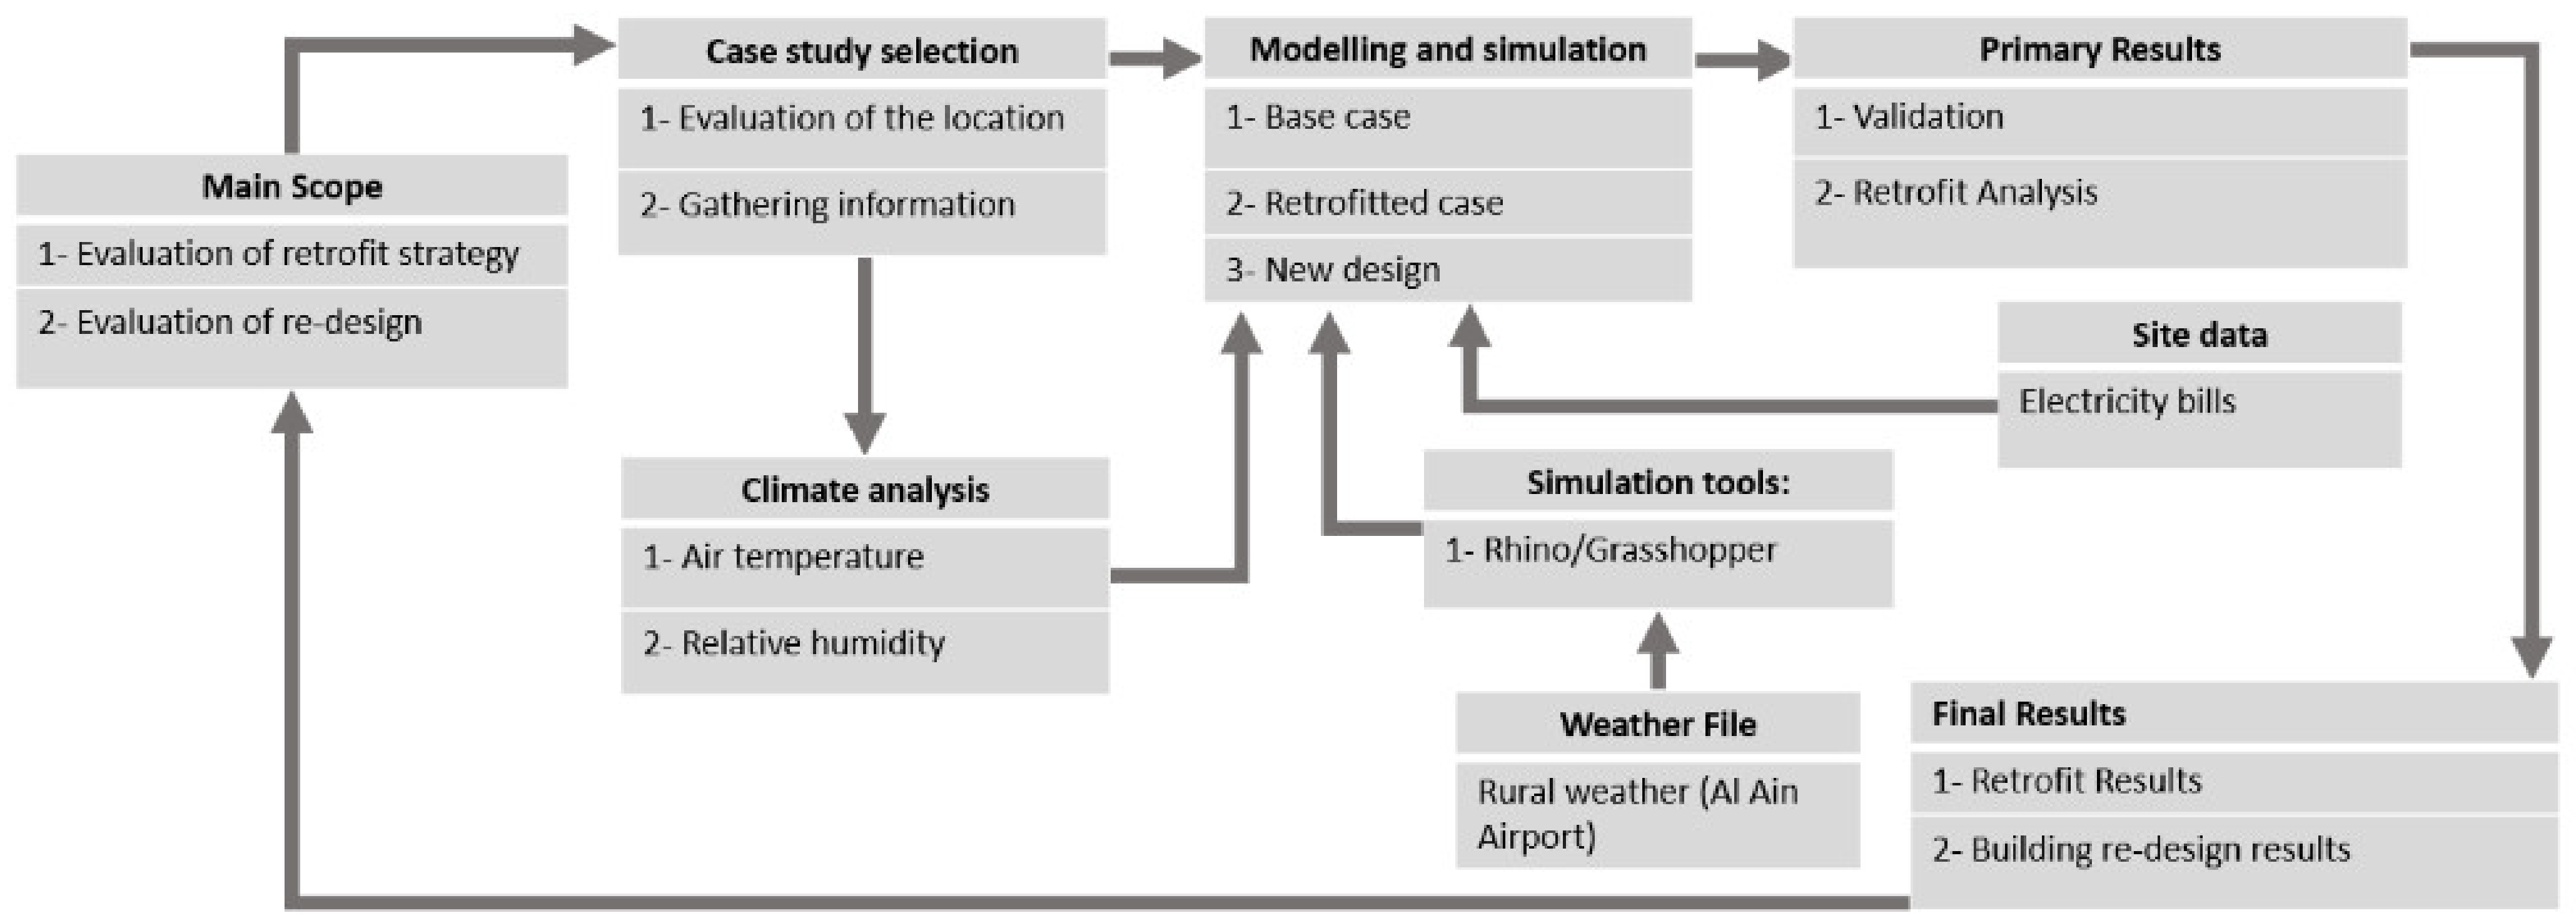
This study follows a linear methodology where the steps are linked to each other. The selected case study is located in the city of AL Ain. This selection was done mainly because of the growing urban developments and because of the available data. The city of Al Ain is part of the United Arab Emirates, hot arid climate. However, due to the geographical location of the city, there is less humidity compared to coastal cities such as Dubai and Abu Dhabi. The data for the modeling was taken from the local sources and site analysis. The modeling and simulation start with the base case, where the full building as per the current conditions is constructed. Then the validation process starts based on the electricity bills taken from the building (the shop unit). Afterward, the retrofit analysis starts, and the scenario is modeled accordingly. Then the last phase of modeling and simulation is the re-design of the full structure based on the same built-up area and function. The results obtained are then compared and assessed (
Figure 1).
The main steps of the study are listed below:
- -
Case study selection,
- -
Climate analysis,
- -
Modeling and simulation of the base case,
- -
Modeling and simulation of the retrofitted case,
- -
Modeling and simulation of the re-designed building.
2.1. Case Study Selection
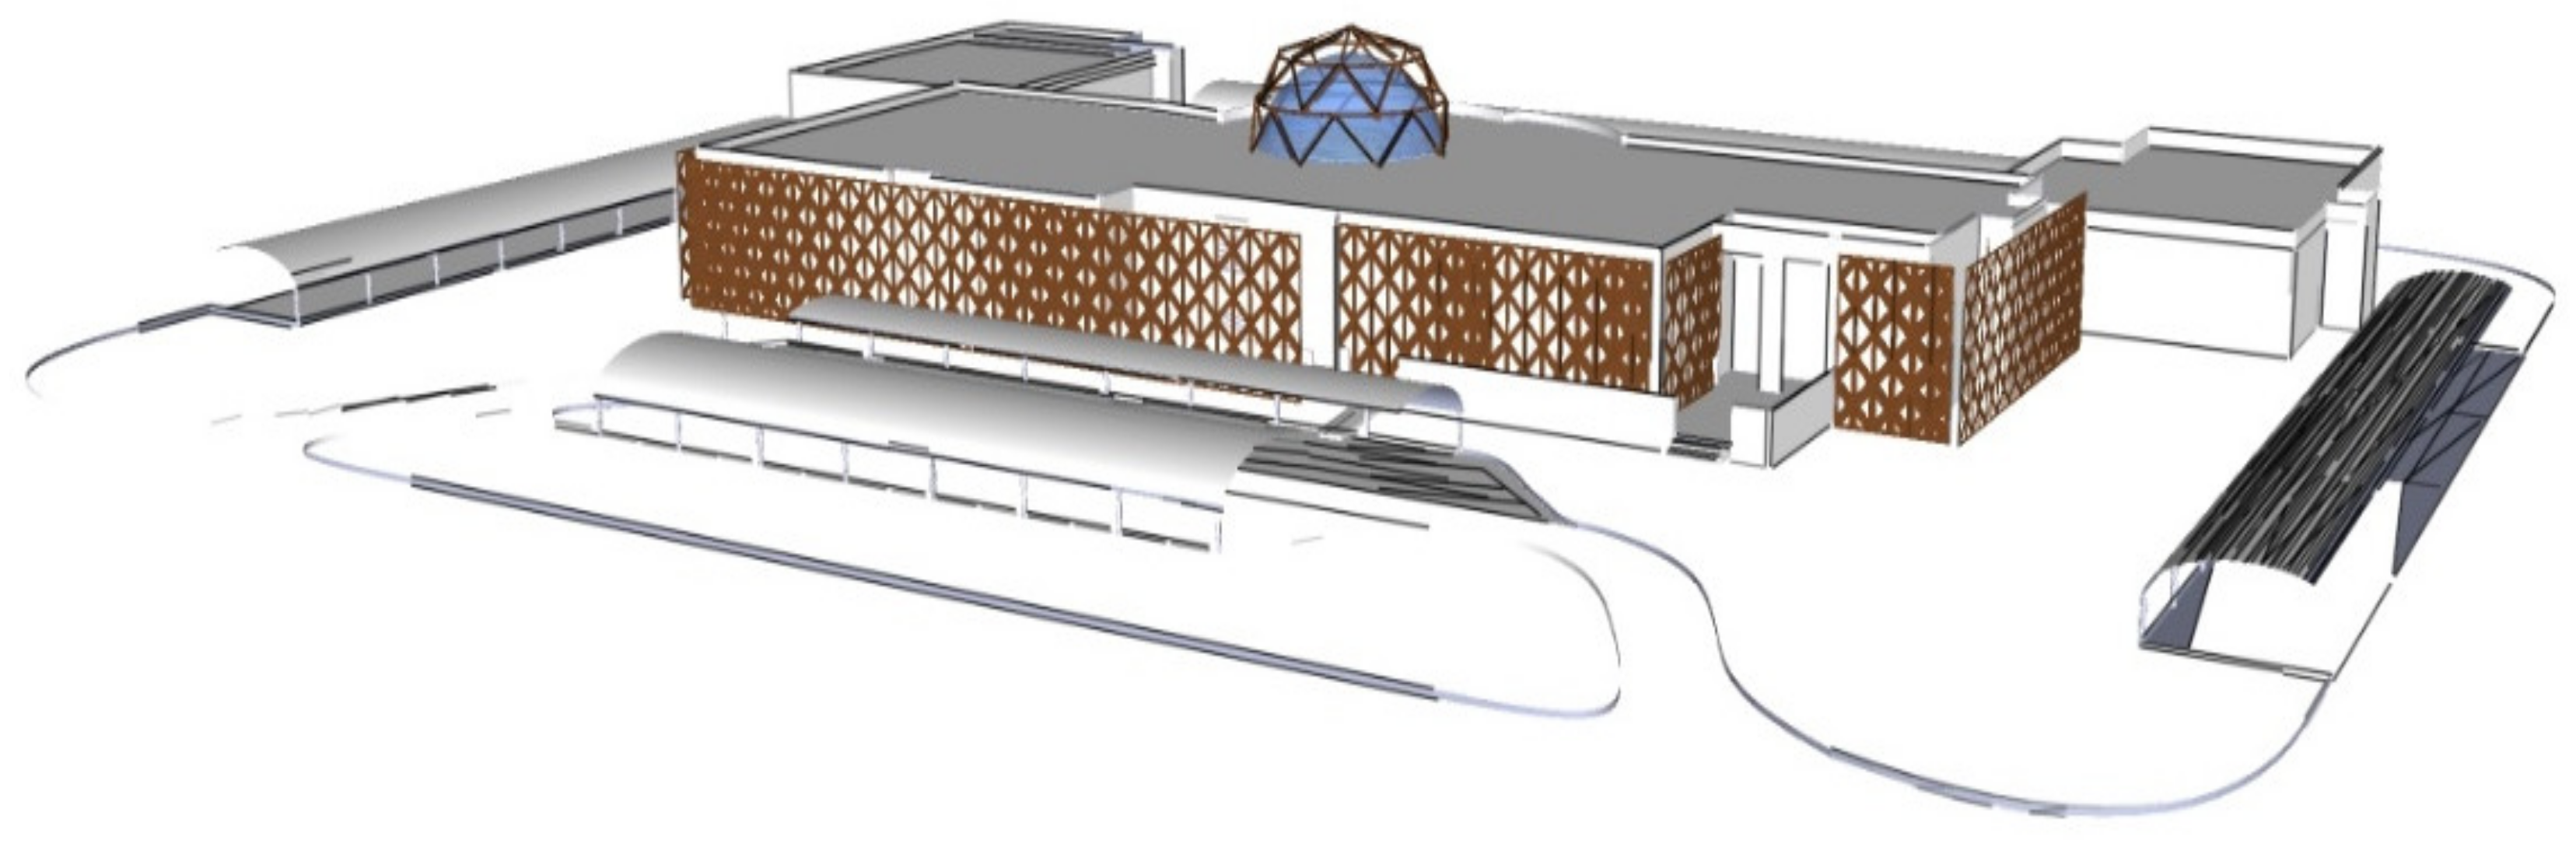
This study refers to the MREIFA, Compound Club building located in the city of Al Ain, Abu Dhabi, UAE. The selection of this building was done due to the available data and the interest of the authors. This building has an area of 2000 m2 and is located in the center of a new residential neighborhood. The surrounding area is composed of green zones and parking is 1650 m2. The indoor activities include a gym, yoga and recreative zone, services, and a minimarket for the community. The outdoor space beside the green area and parking includes an outdoor pool, oriented to the northwest of the selected site.
The architectural composition of this Community Center is quite simple. Cubic forms overlap with each other. In the center of the building, a glass dome is located. The main entrance is located on the southwest façade. No shading devices are provided to the building. The walls have white paint and there is no special treatment to any of the elevations (
Table 1).
2.2. Climate Analysis
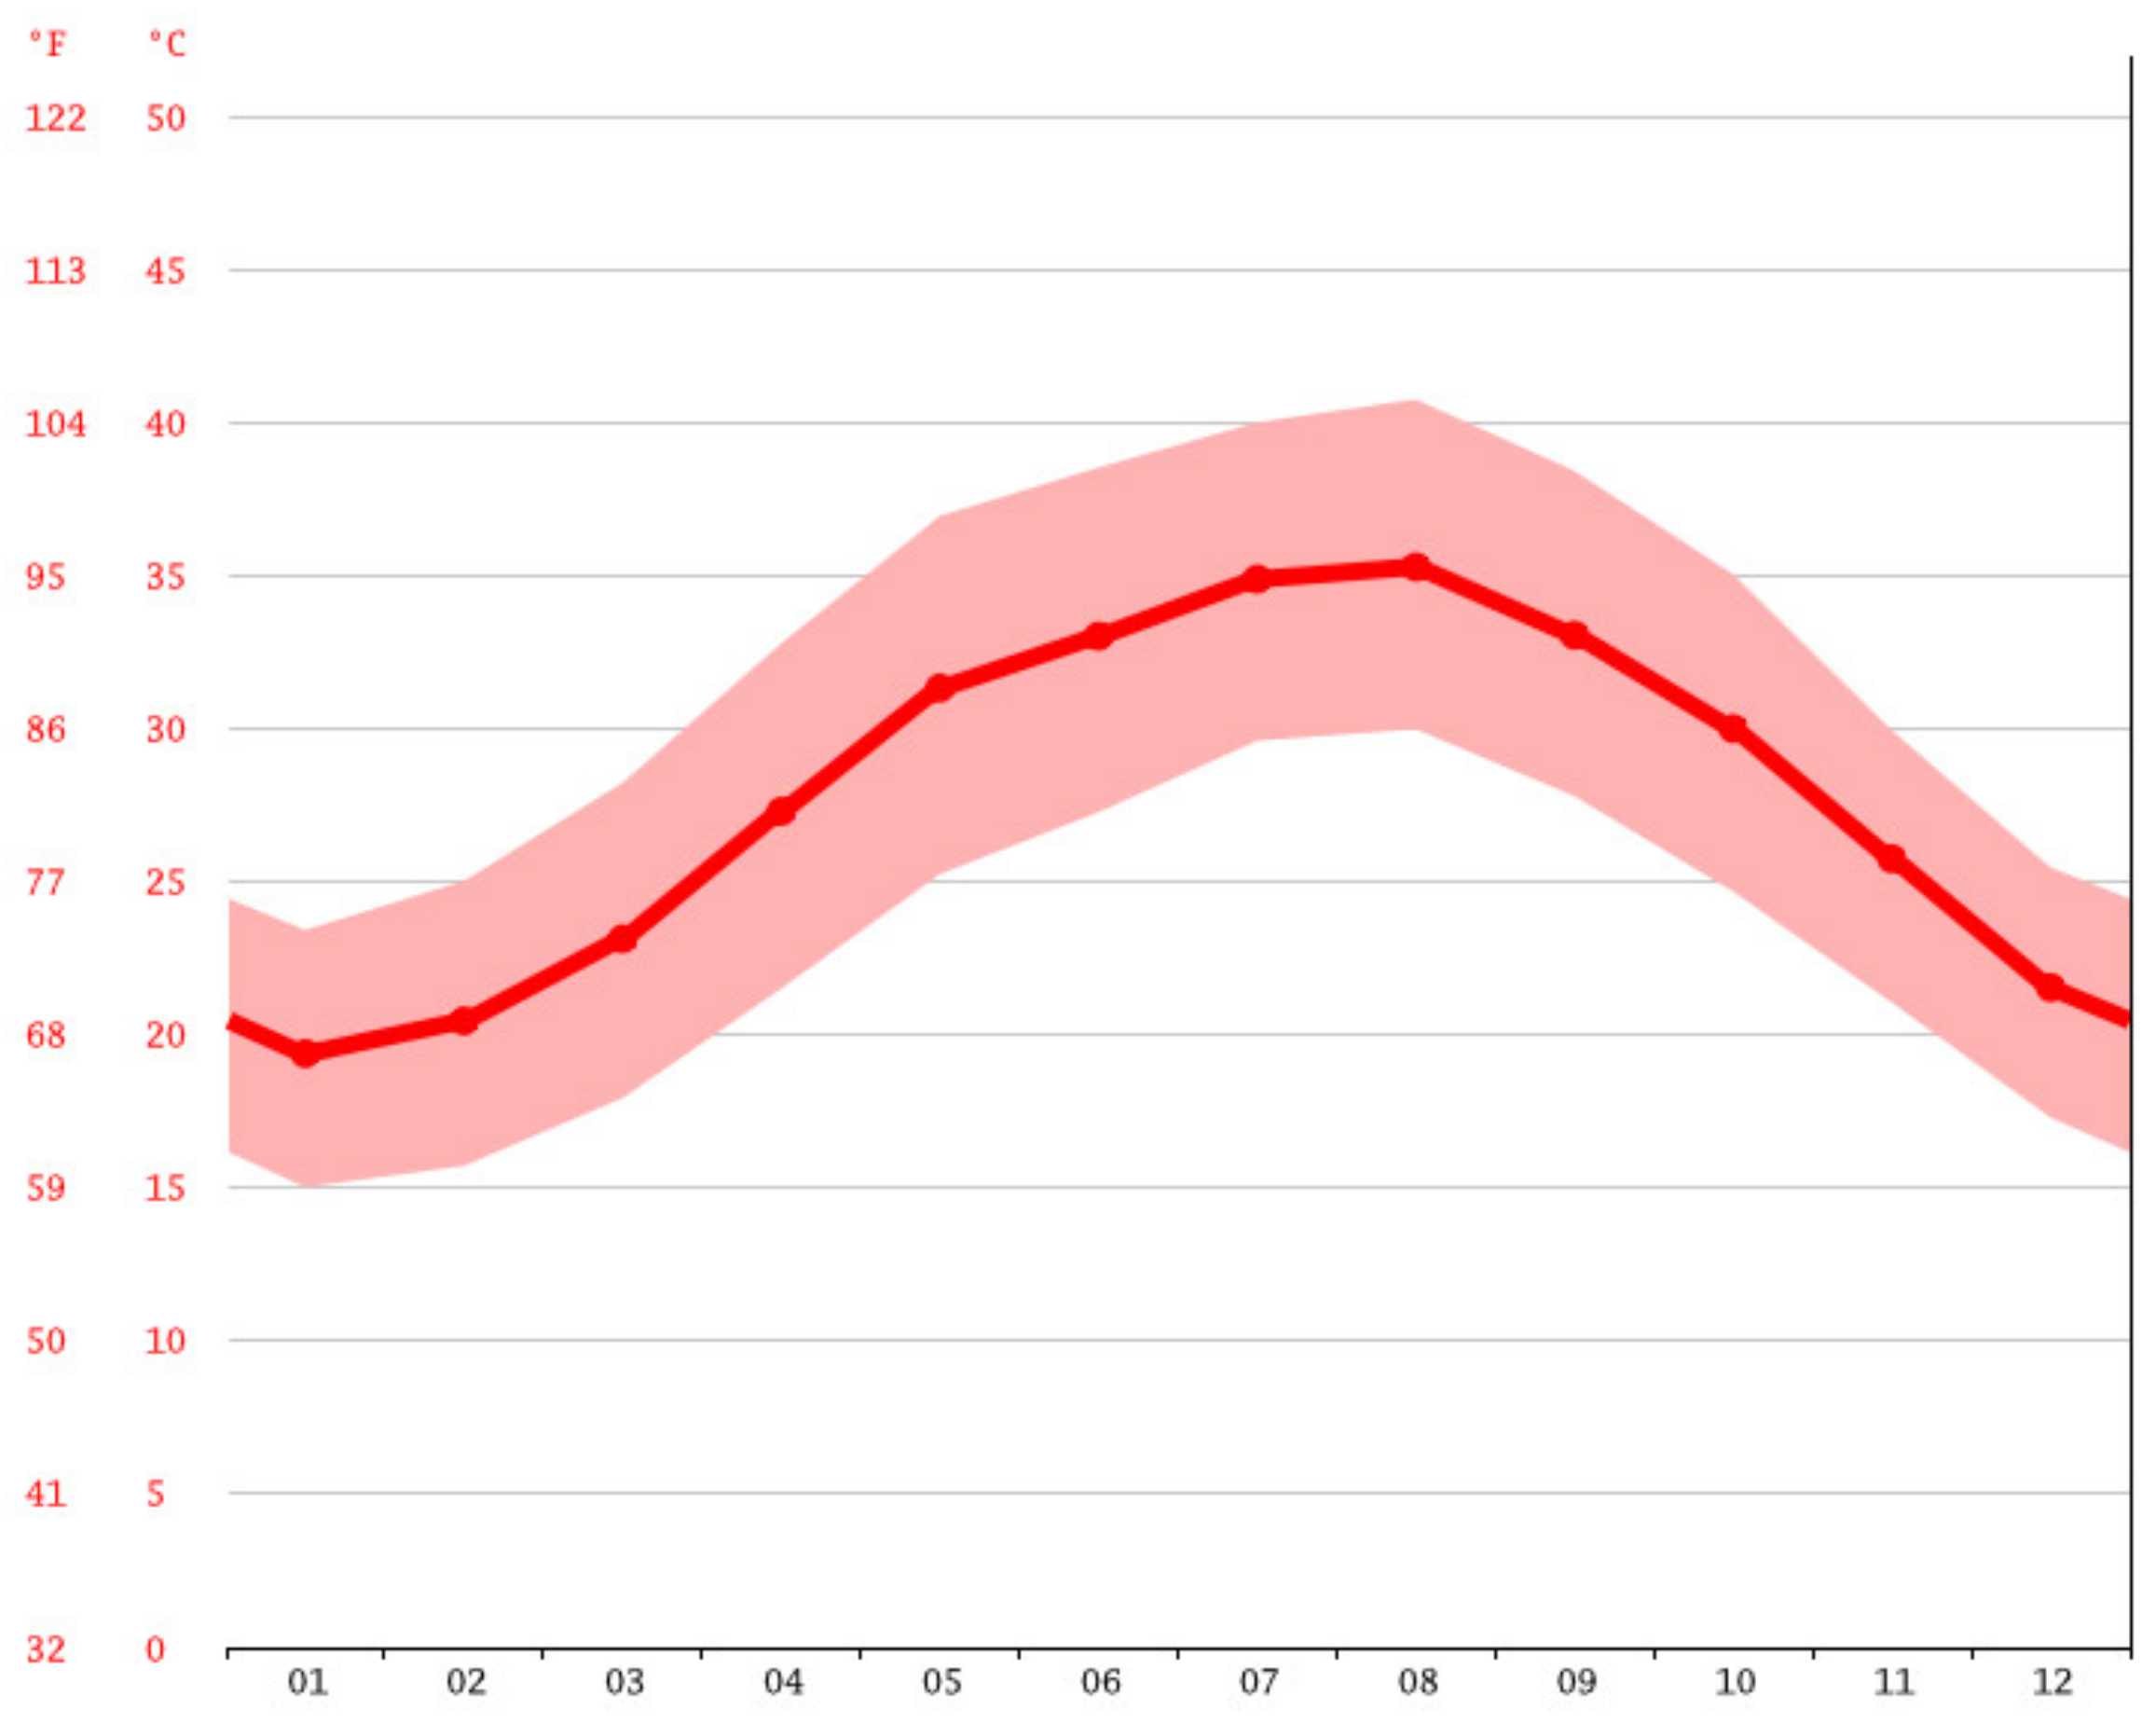
The city of AL Ain falls under the Emirate of Abu Dhabi, UAE. The climate of the city is hot and arid with cool winters from November to March, Spring and Autumn that vary from 1–2 months, and a very hot summer from June to September. Over the course of the year, the temperature varies between 38–42 °C in summers and the maximum temperature in winter is 24–26 °C (
Figure 2 and
Figure 3) [
26].
2.3. Modelling and Simulations
2.3.1. Software Analysis
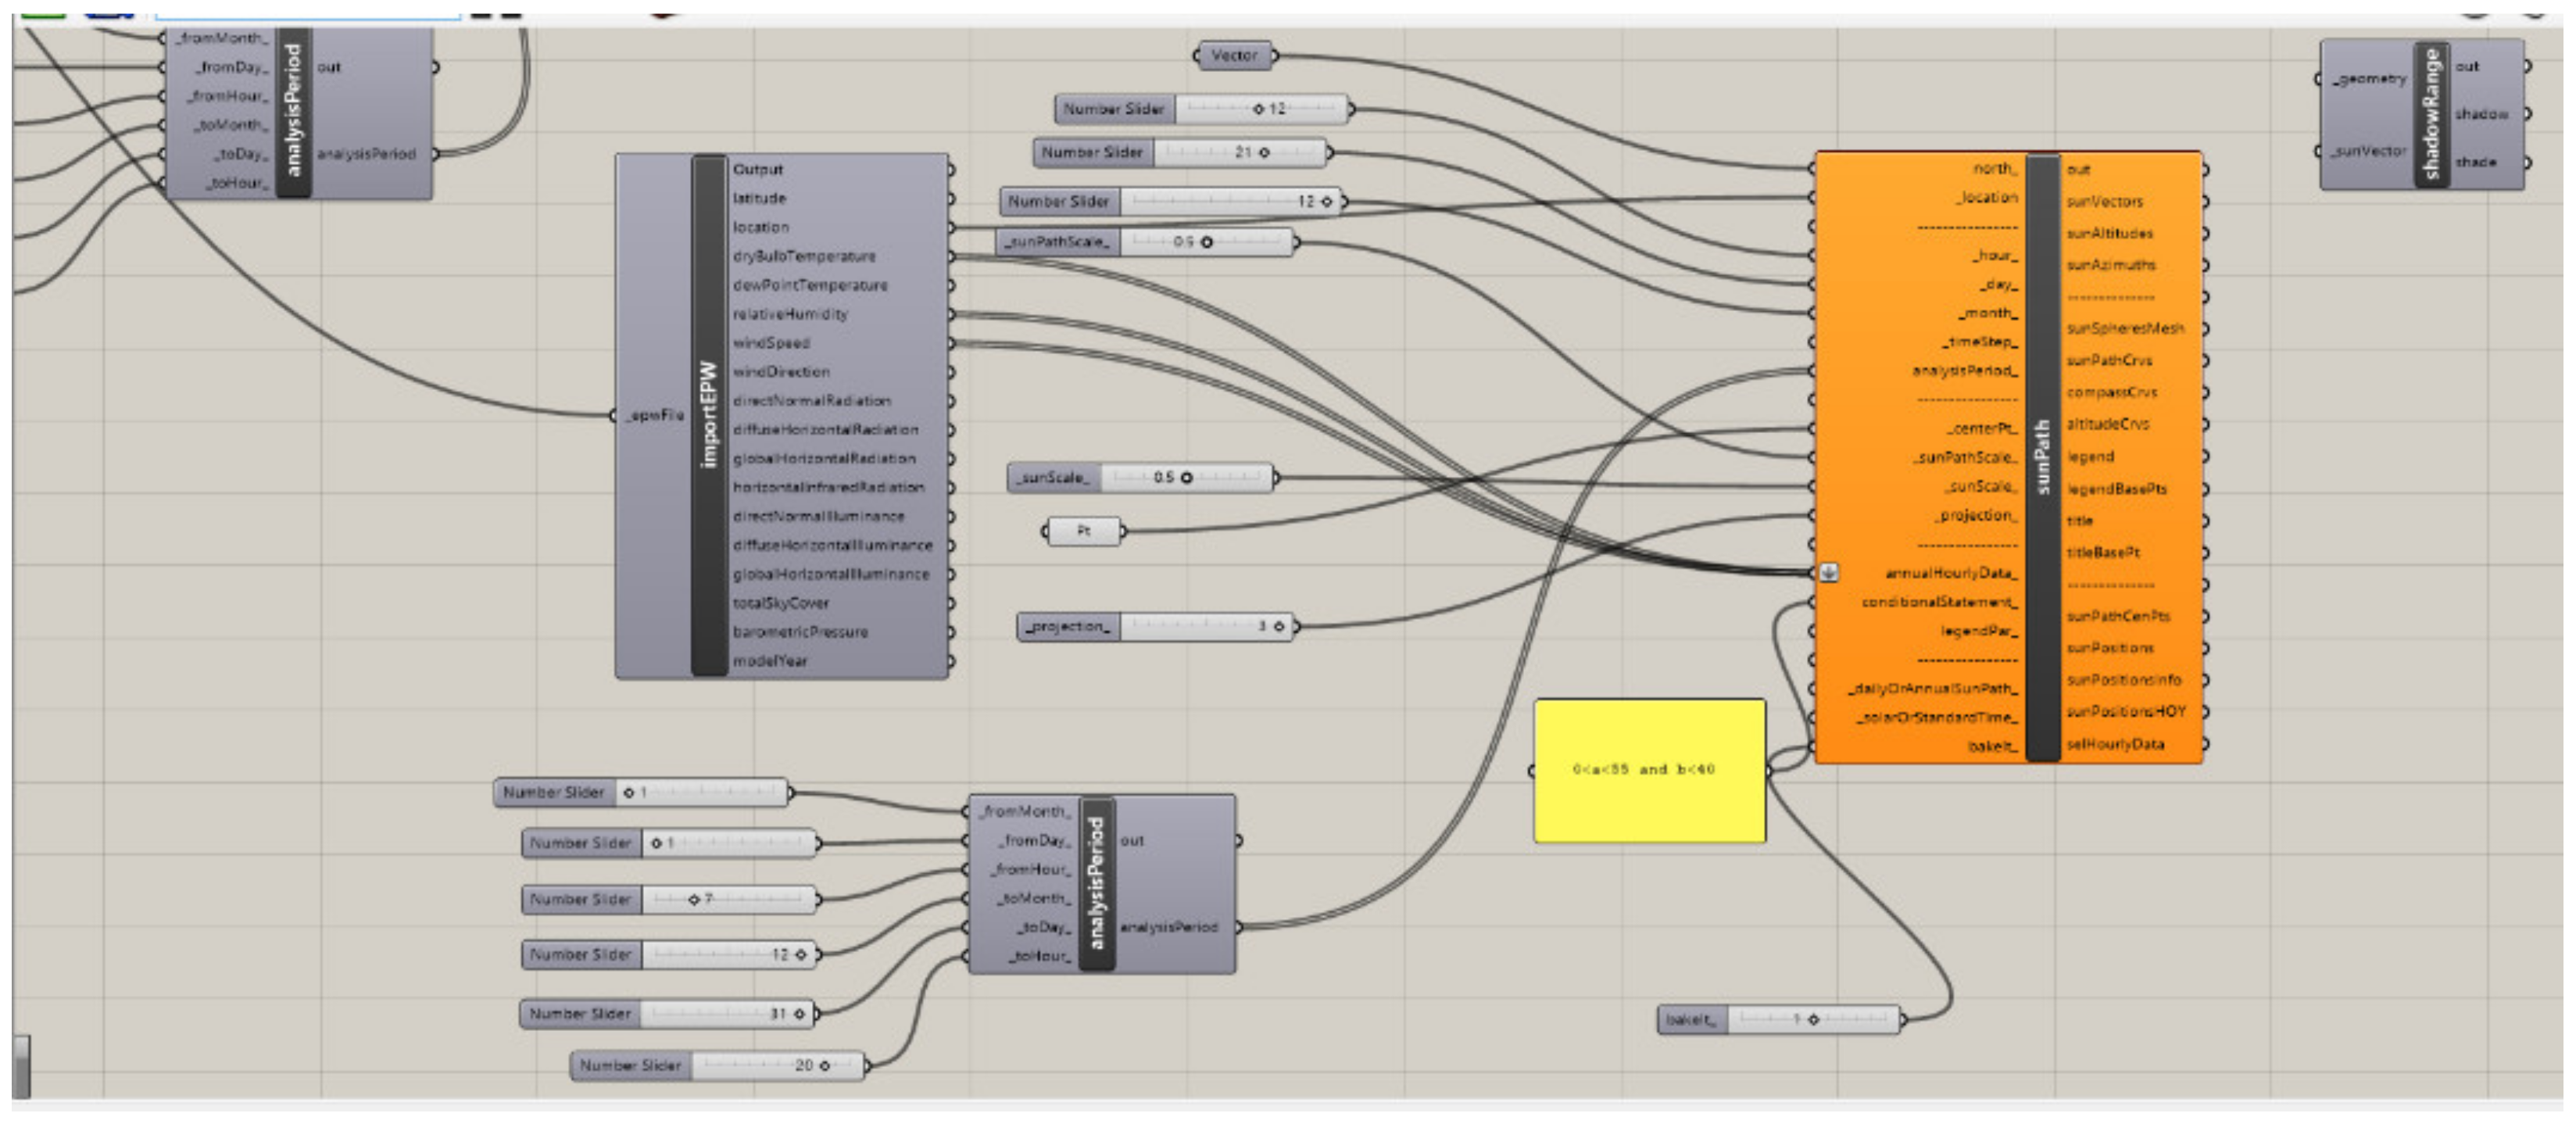
The main tool used in this research is Rhinoceros. This tool enables the creation of complex shapes and analyzes in real-time the data from various scenarios. The tool has been updated over the years with several plug-ins, such as Grasshopper, Ladybug, Honeybee, Houdini, Daysim, and many more. Each shape introduced can be modified, parameters added, optimized throughthrough the use of the plug-in. The scripting language is Python and Grasshopper is the environment where the other plug-ins are connected. For energy simulations, Energy Plus is used as a plug-in. The process of connecting the scripts requires basic knowledge of algorithm design (
Figure 4 and
Figure 5).
The energy simulation model was done in the Rhinoceros 3D software using the Ladybug plug-in and Honeybee launcher. So, the script was written with the help of a previous energy simulation project and the help of video tutorials provided by the developers. During the energy simulation, difficulties were found in closing several geometries. Therefore, the file was brought to REVIT to improve the geometry and brought back to the RHINO environment. The energy modeling was time-consuming due to continuous errors that needed to be addressed.
Moreover, the Ladybug installed was a different version from what most people used, and other versions of Ladybug could not be installed immediately, so it was difficult to write the script in that program with an un-updated version. After such problems were solved, Grasshopper ran the script once, but the results were inaccurate and unconvincing. We were unable to run the script and the simulation for the second time due to an error in the IDF file.
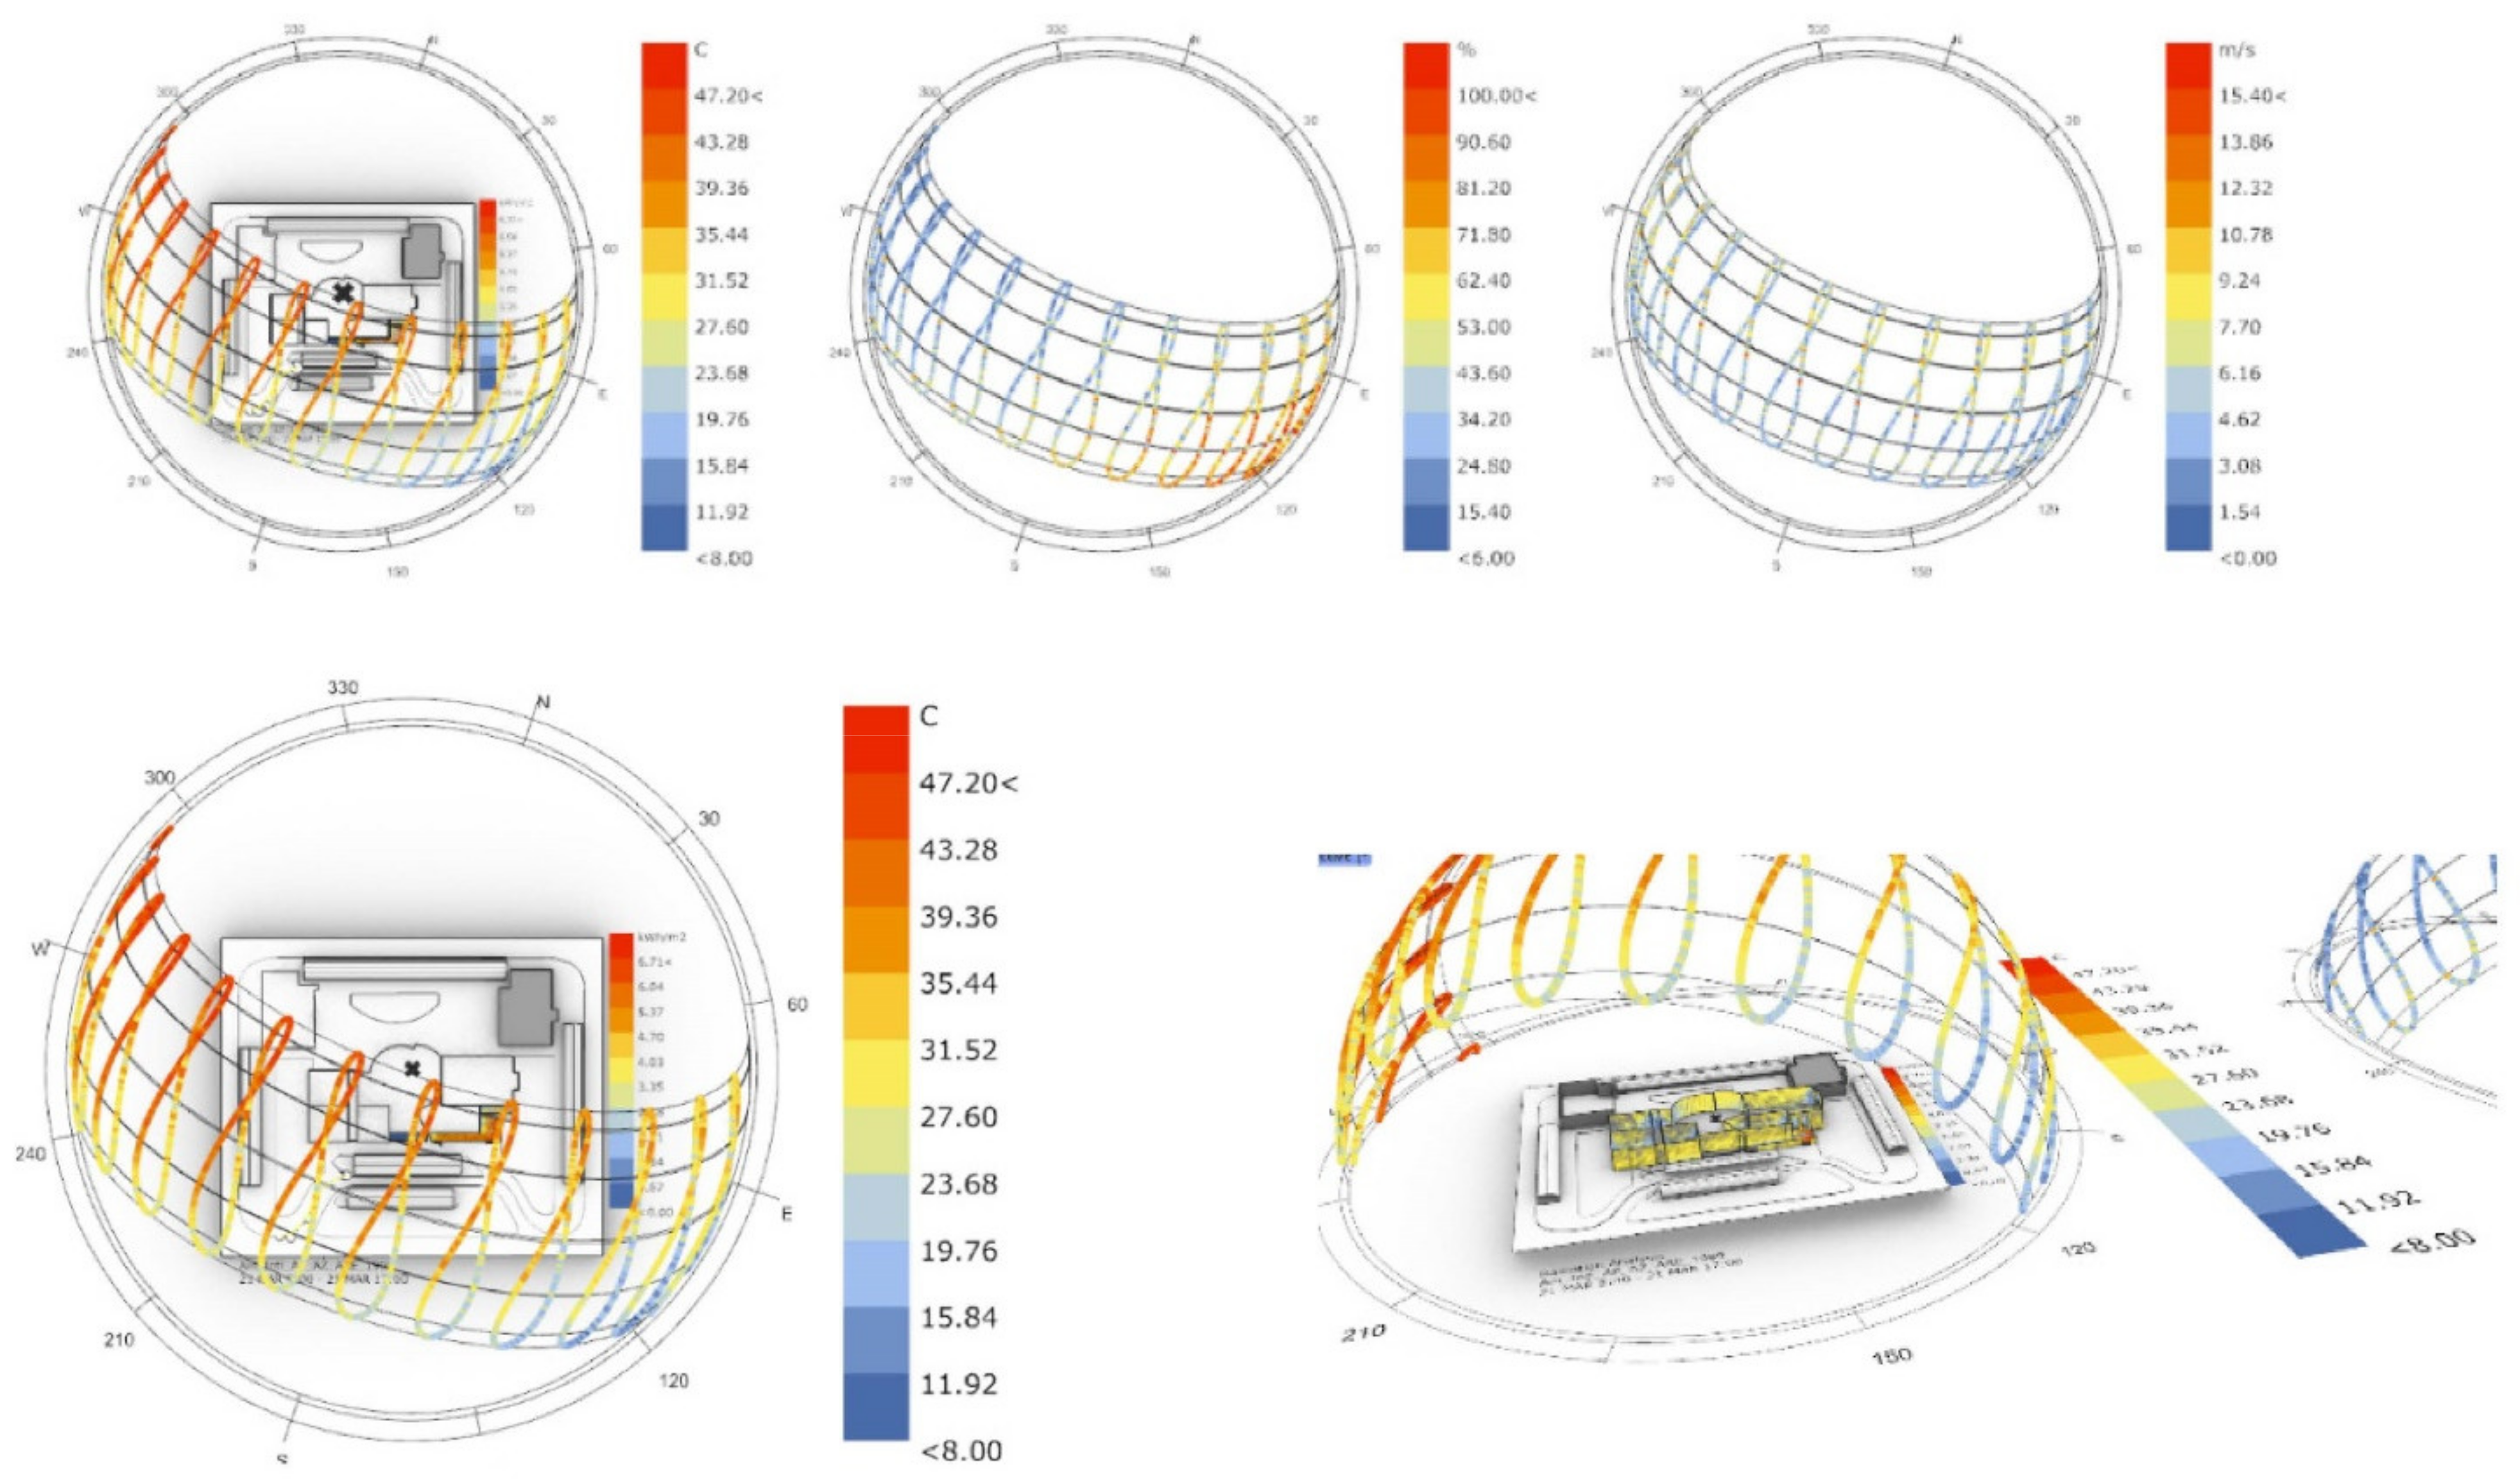
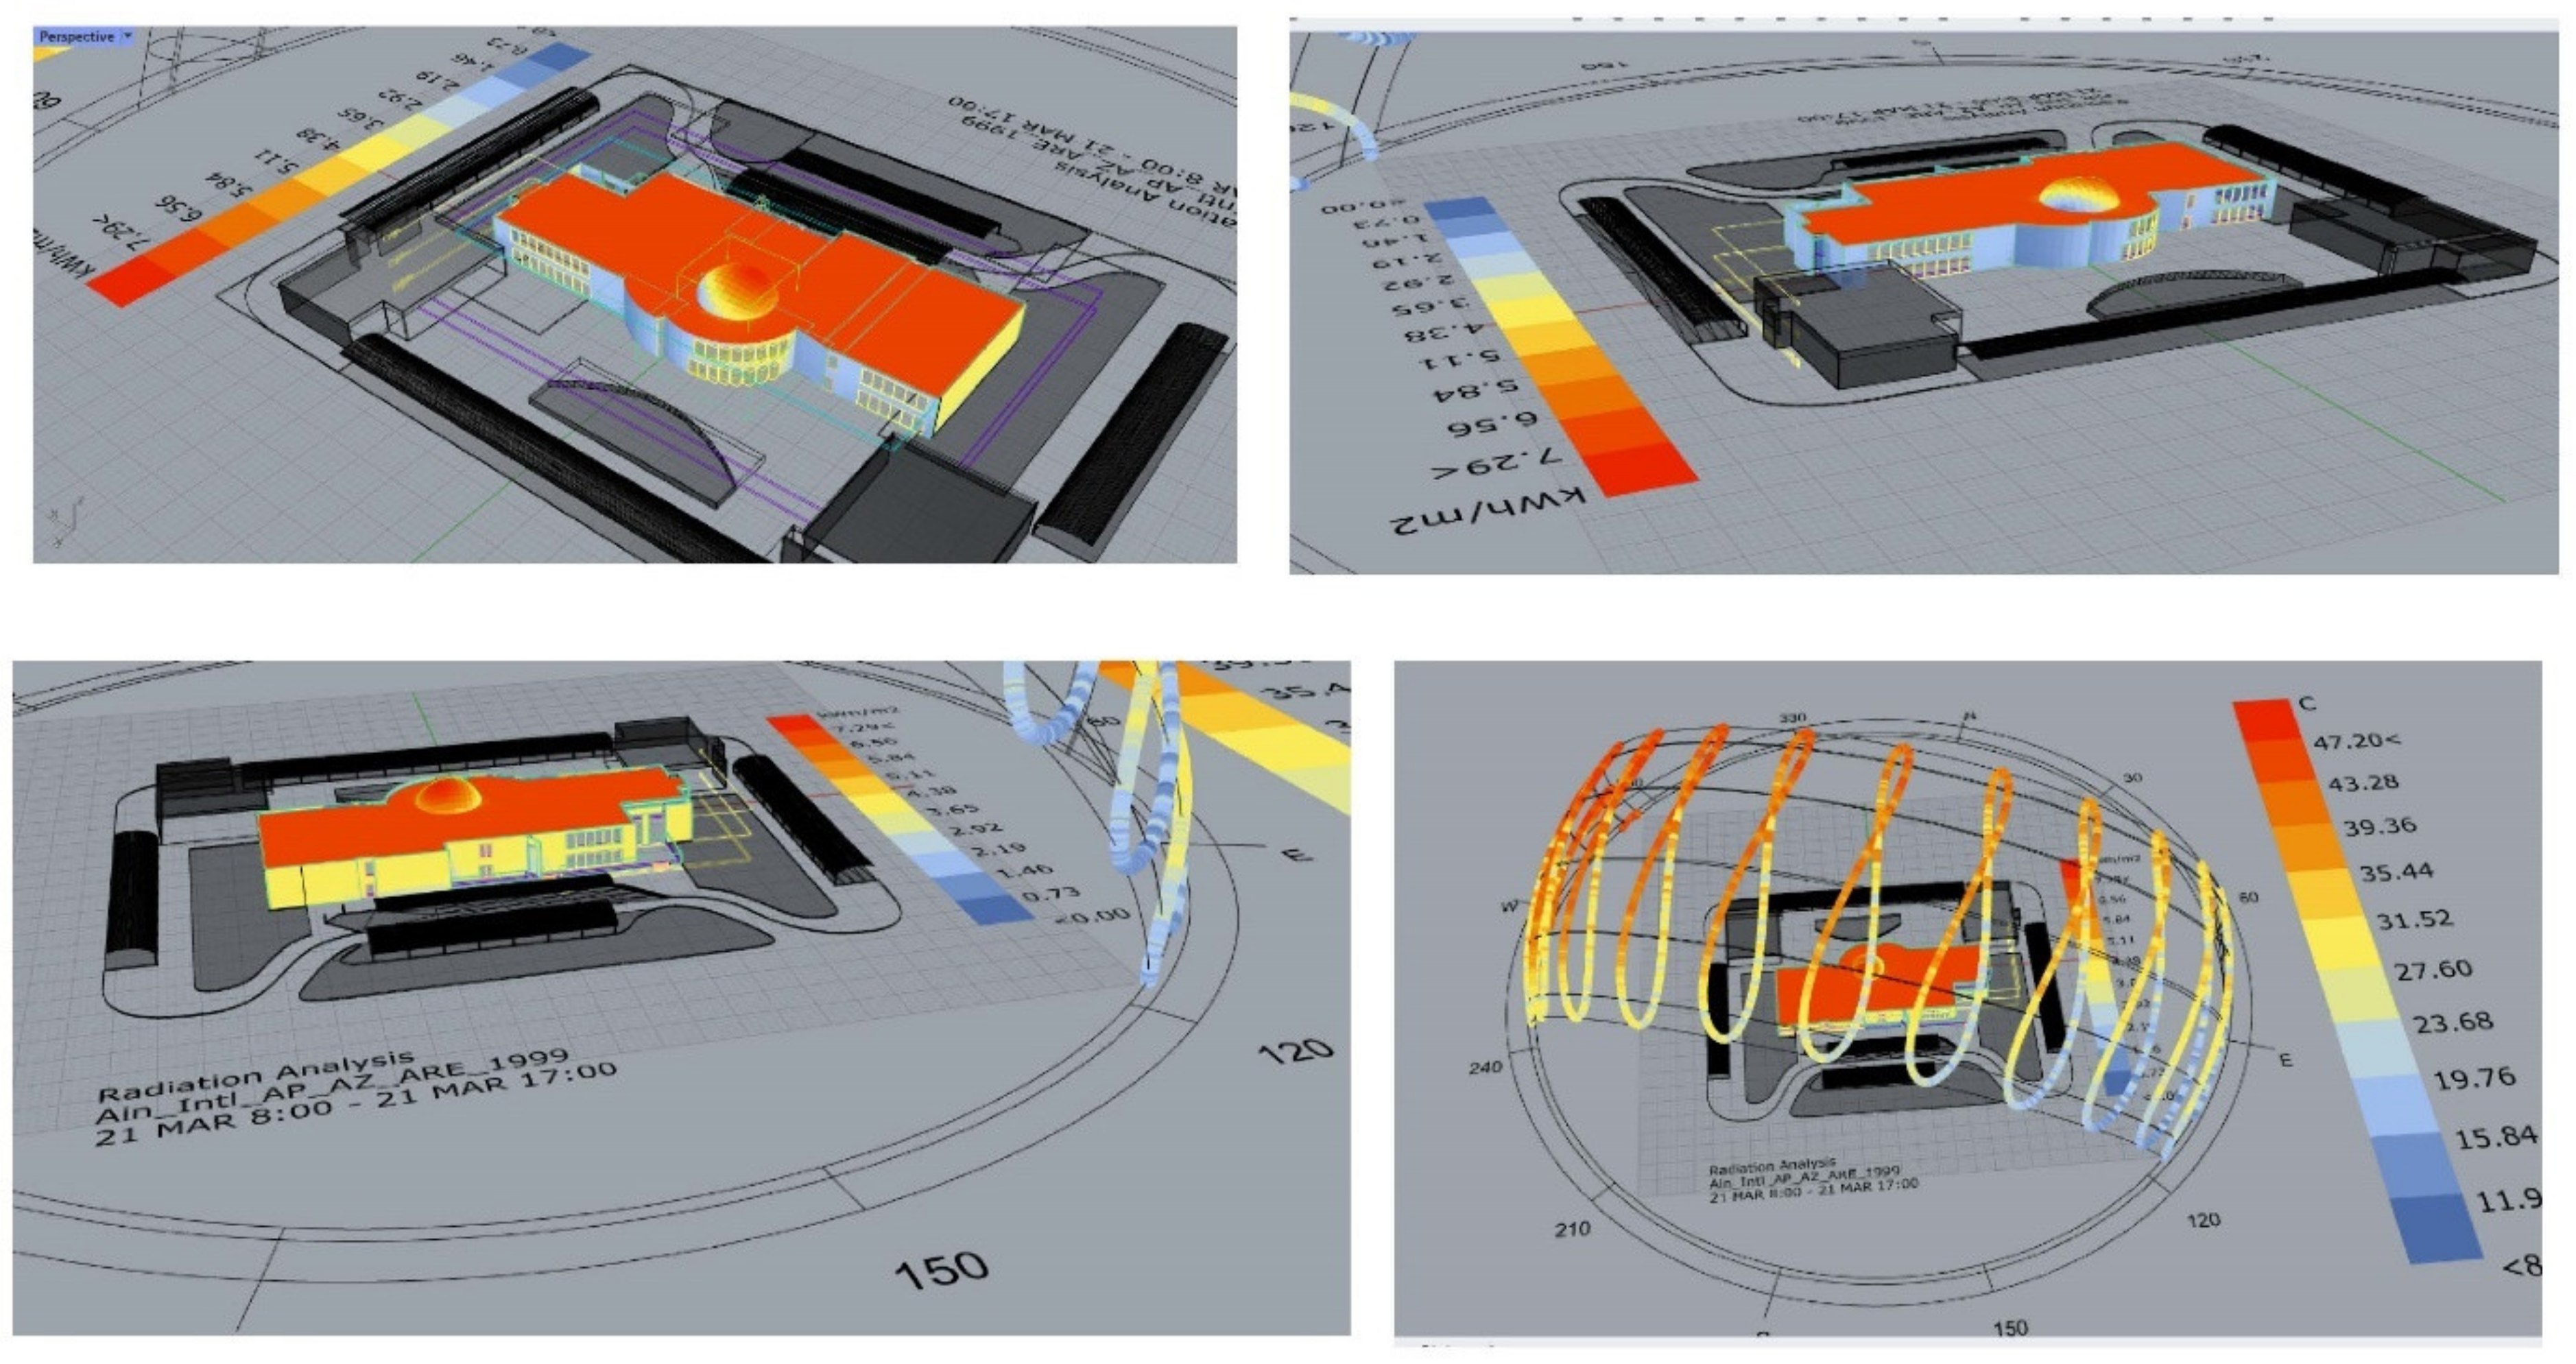
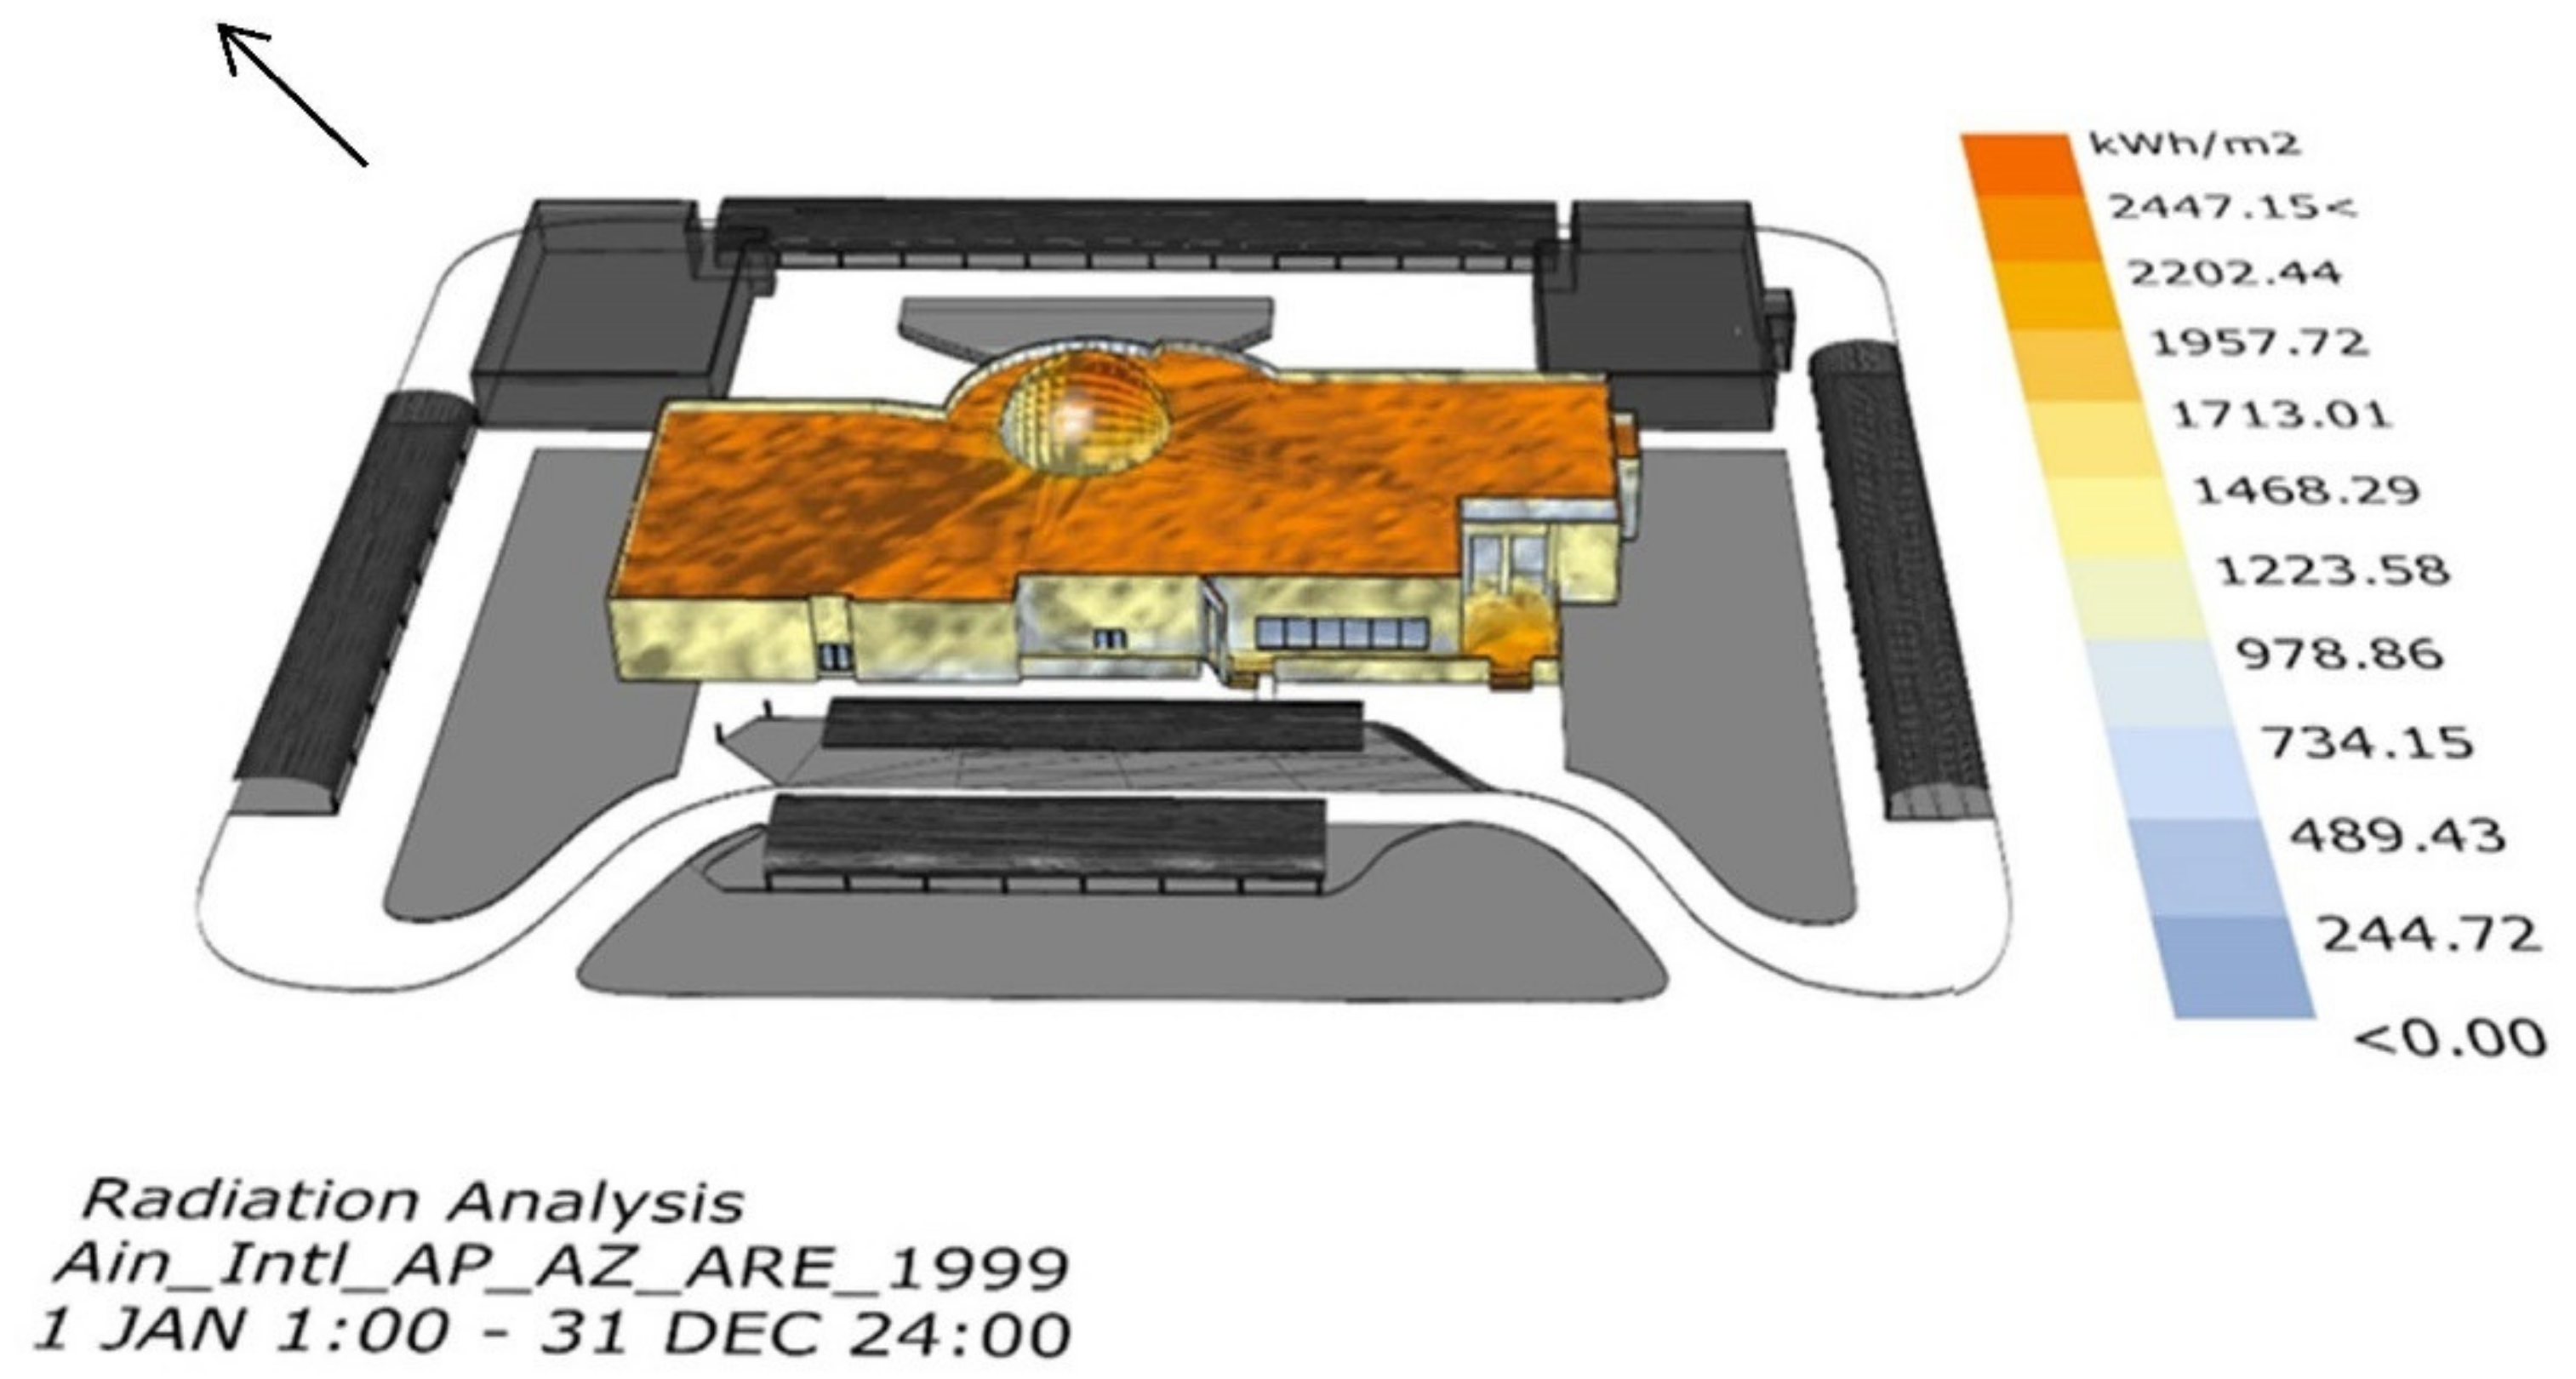
Figure 6 and
Figure 7 show the 3D of the community center done in Rhino and the radiation analysis.
2.3.2. Base Model Energy Consumption
The energy simulation of the base model as shown in
Figure 8 was done by using Rhino/Grasshopper. This model was later compared to the retrofitted and new design model. The analysis was carefully done based on the data taken from the local sources and site observation. The north orientation based on the building plans was added. The solar radiation was carefully done in order to understand the possible application of retrofit strategies to be added to the second analysis. The building’s main entrance in the southwest and the glass dome are the main factors of the energy consumption.
2.3.3. Validation for Base Model
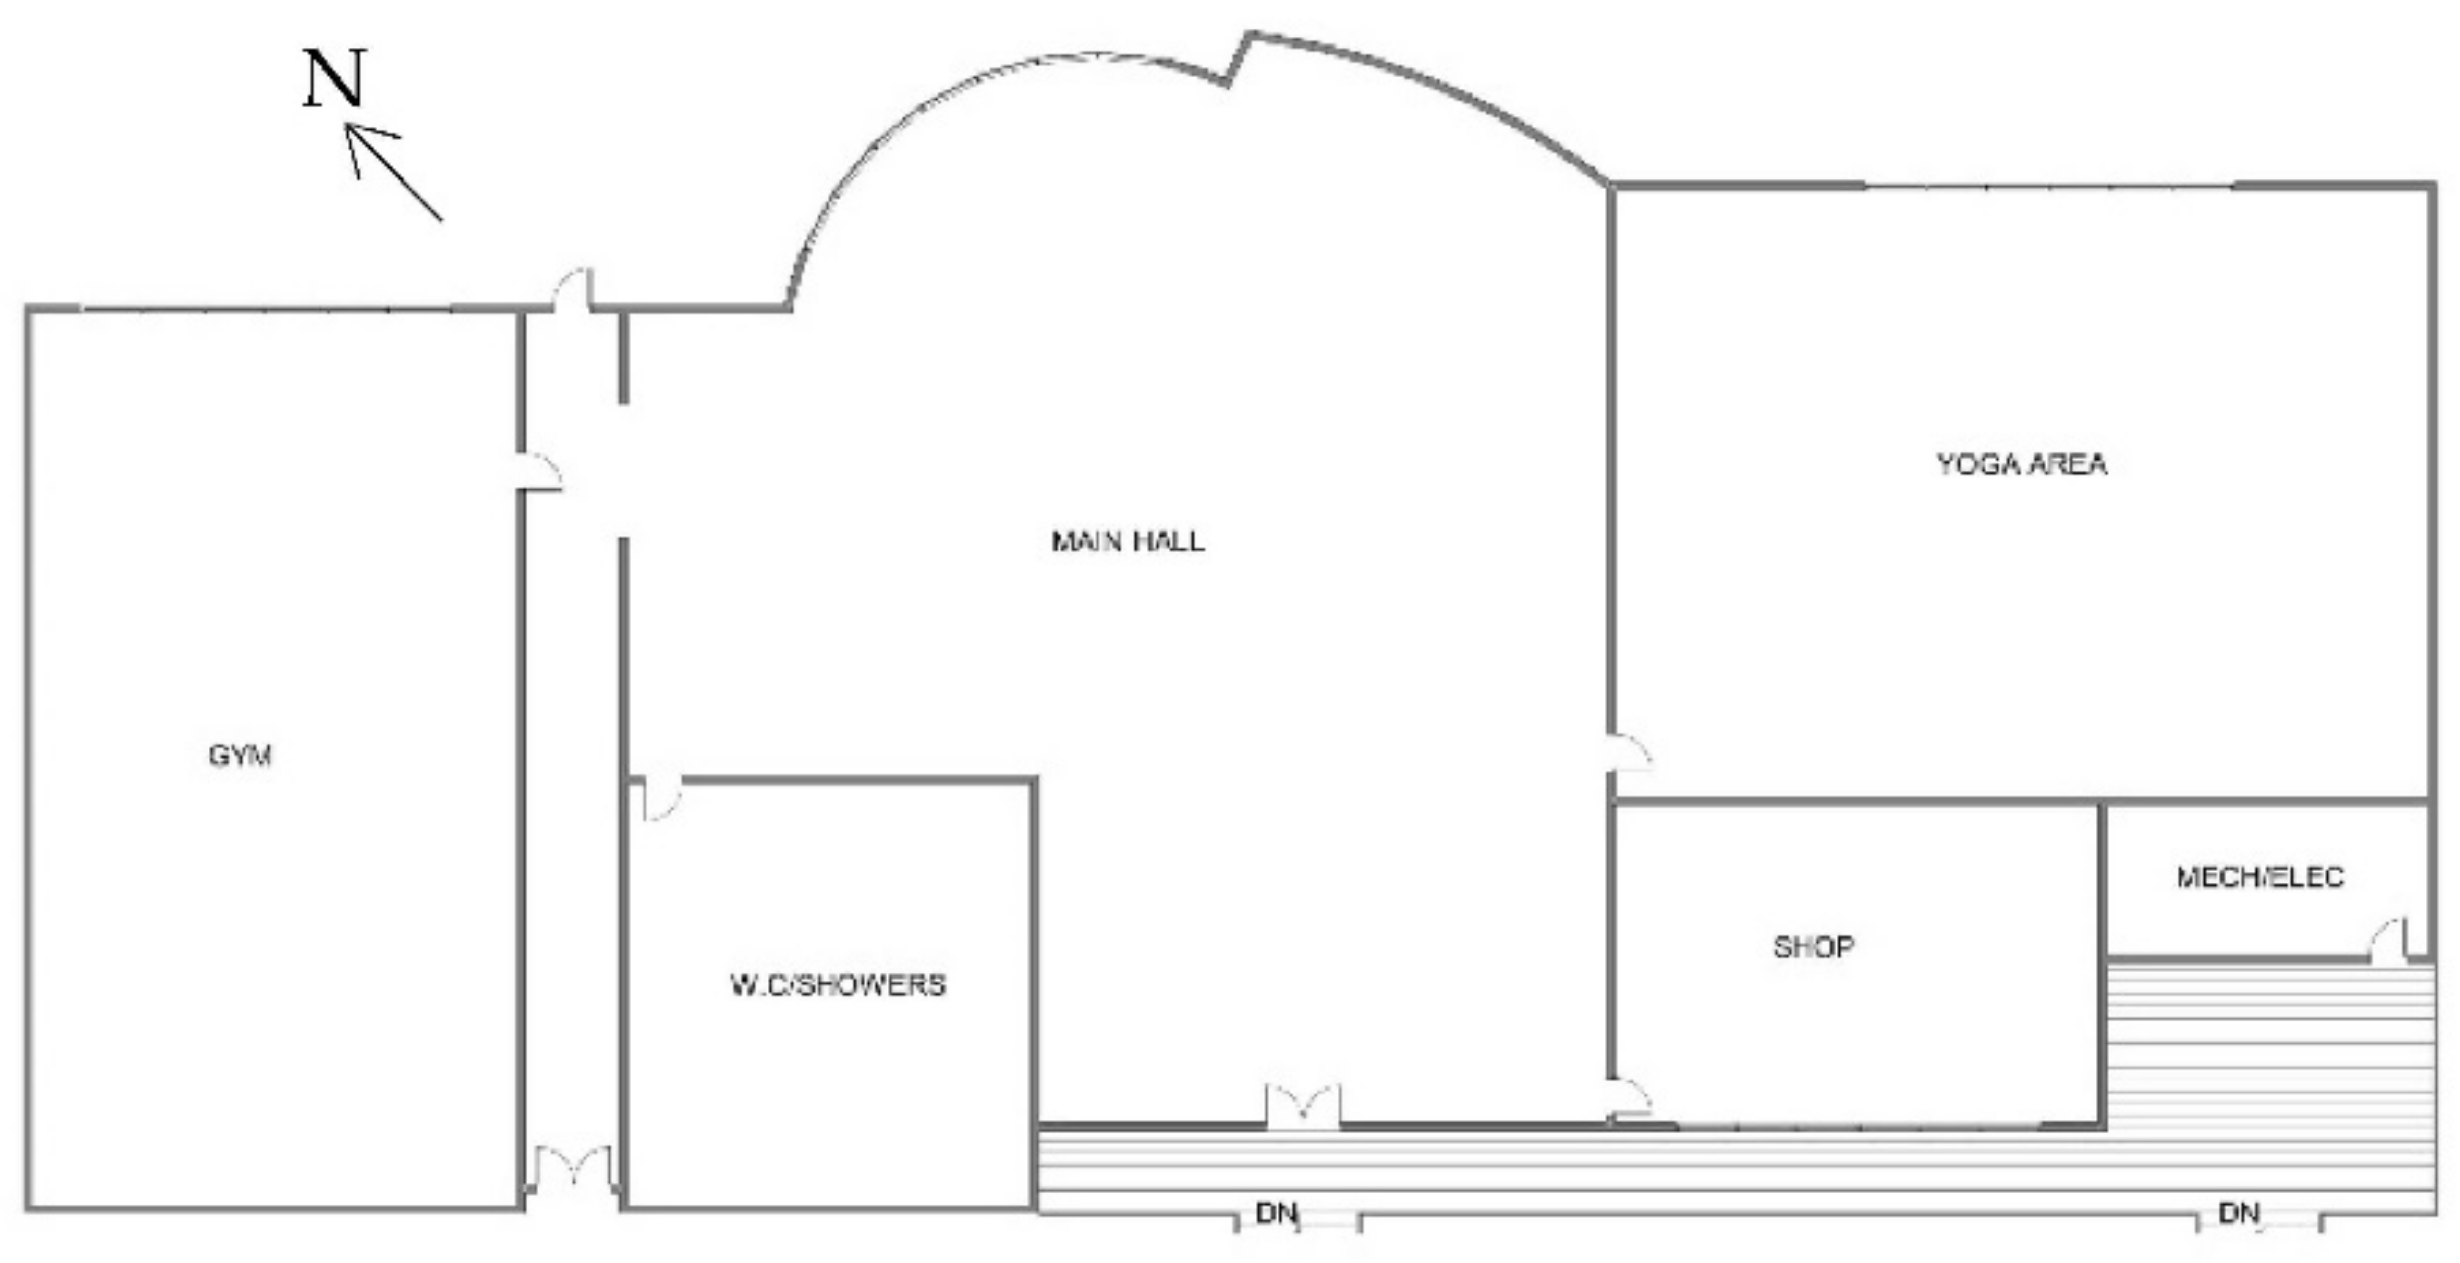
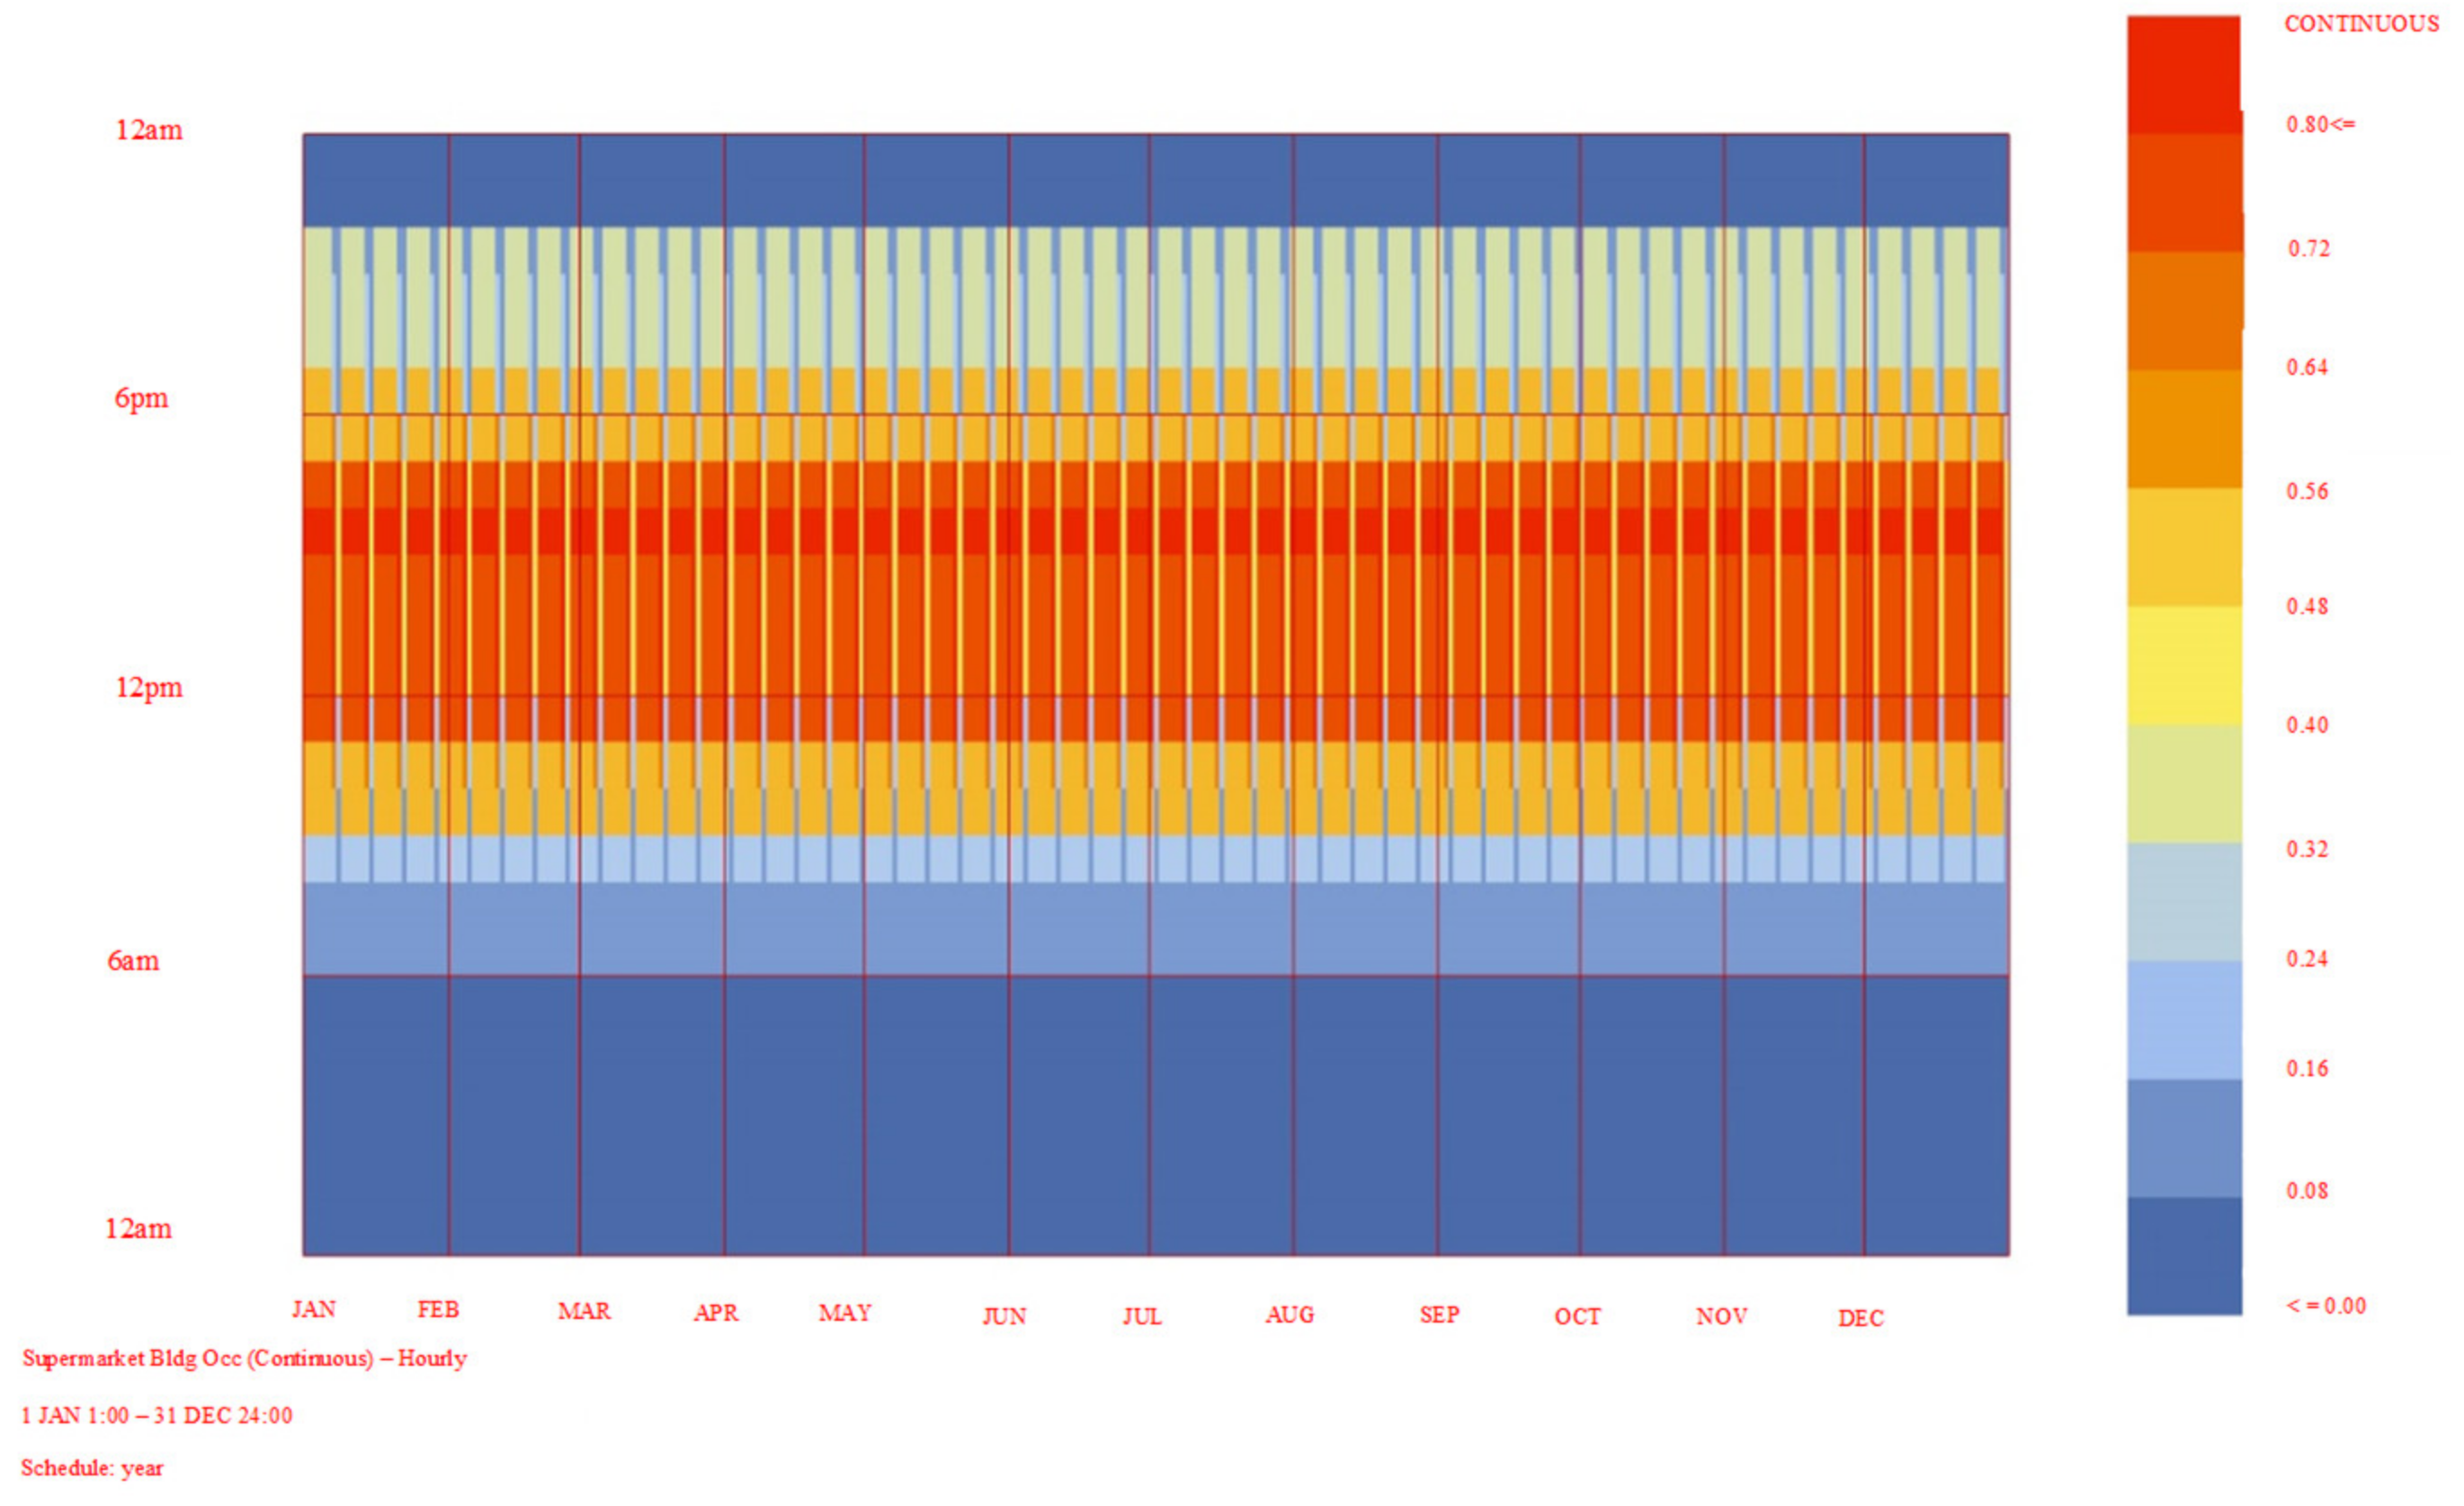
The validation process of the existing building starts with the modeling and simulation based on the data received. The walls, windows, roof, and flooring templates are based on the technical drawings received, which follow the UAE building standards. Afterwards, the full model was validated based on the electricity bills received from the shop located on the southeast side of the building. The main points that were adjusted were the occupancy schedule of the shop and the electrical equipment.
Total energy consumption found based on our study for the base model is 692,190.33 kWh. To validate the energy consumption value found, we will refer to the electricity bill of the small shop inside the community center, which is obtained to be AED (Arab Emirates Dirham) 48,000 yearly, thus AED 4000 monthly. Moreover, based on the information obtained the cooling temperature used in the shop is 23 °C and 14 fridges are used in the storage area (
Figure 9). First, the occupancy schedule is created using the Grasshopper-Honeybee plug-in to find more accurate energy consumption results based on the occupancy activity. As illustrated in the figure above, since it is a commercial building and a community center used every day by the residents around the neighborhood, the activity is usually every day starting from 9 a.m. to around 8 p.m. (
Figure 10).
The energy consumption value of the shop is found to be 240,000 kWh based on the electricity bill information obtained. The next step is to ensure that the base model we created in the beginning has approximately the same energy consumption values. After validating the shop room using the electricity bill, the base model script is adjusted to the changes done to the shop room and is calculated again as Scenario B after validation which is noted down in
Table 2. In fact, scenario B after the validation has a higher value of energy consumption than Scenario A because the 14 fridges were considered (which is about 250 watts each), as well as the gym equipment, which is about 10,000 kWh per year (
Figure 11).
Referring to
Table 2, the base model calculation before the validation is less than the calculation after the validation using the given information of the shop because the validated energy model is more accurate, and it takes into consideration the equipment used inside the community center such as the fridges and gym equipment. As a result, the validated full model calculation in scenario B is now more accurate after validating the shop room which results in 820,903.29 kWh compared to the value of 692,190.33 of the base models prior to the validation. Results are demonstrated in
Table 2.
2.3.4. Modeling and Simulation of the Retrofitted Building
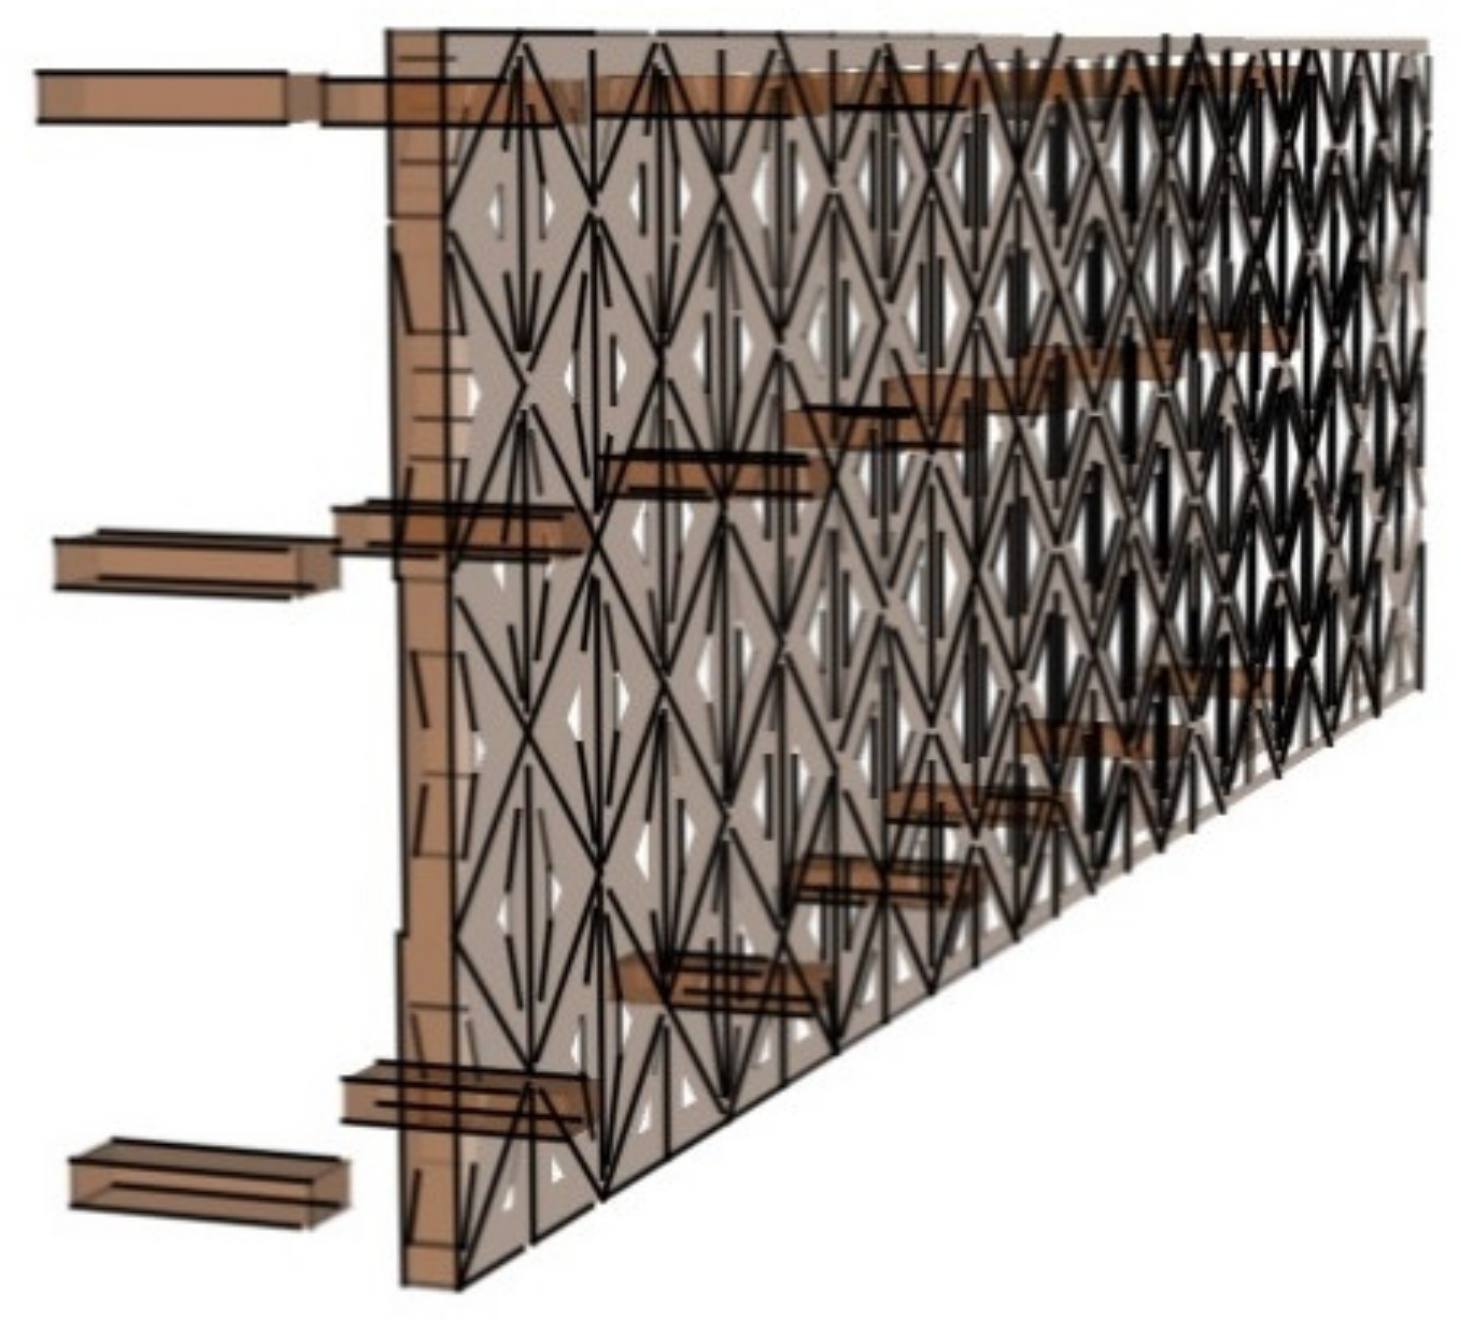
The retrofitted model reduces the energy due to the parametric shading added on the south, east, and west façades. In addition, the dome is shaded with a parametric triangular-shaped shading as shown in
Figure 12. The parametric shading was done using Grasshopper by setting various parameters, such as the height and width of the opening, and the detail is illustrated in
Figure 13. Radiation analysis was crucial in defining the retrofit strategy. Based on this analysis the most problematic elevations were the south and west elevations. Therefore, it was decided based on this analysis that the parametric shading would be added to these elevations (
Figure 14).
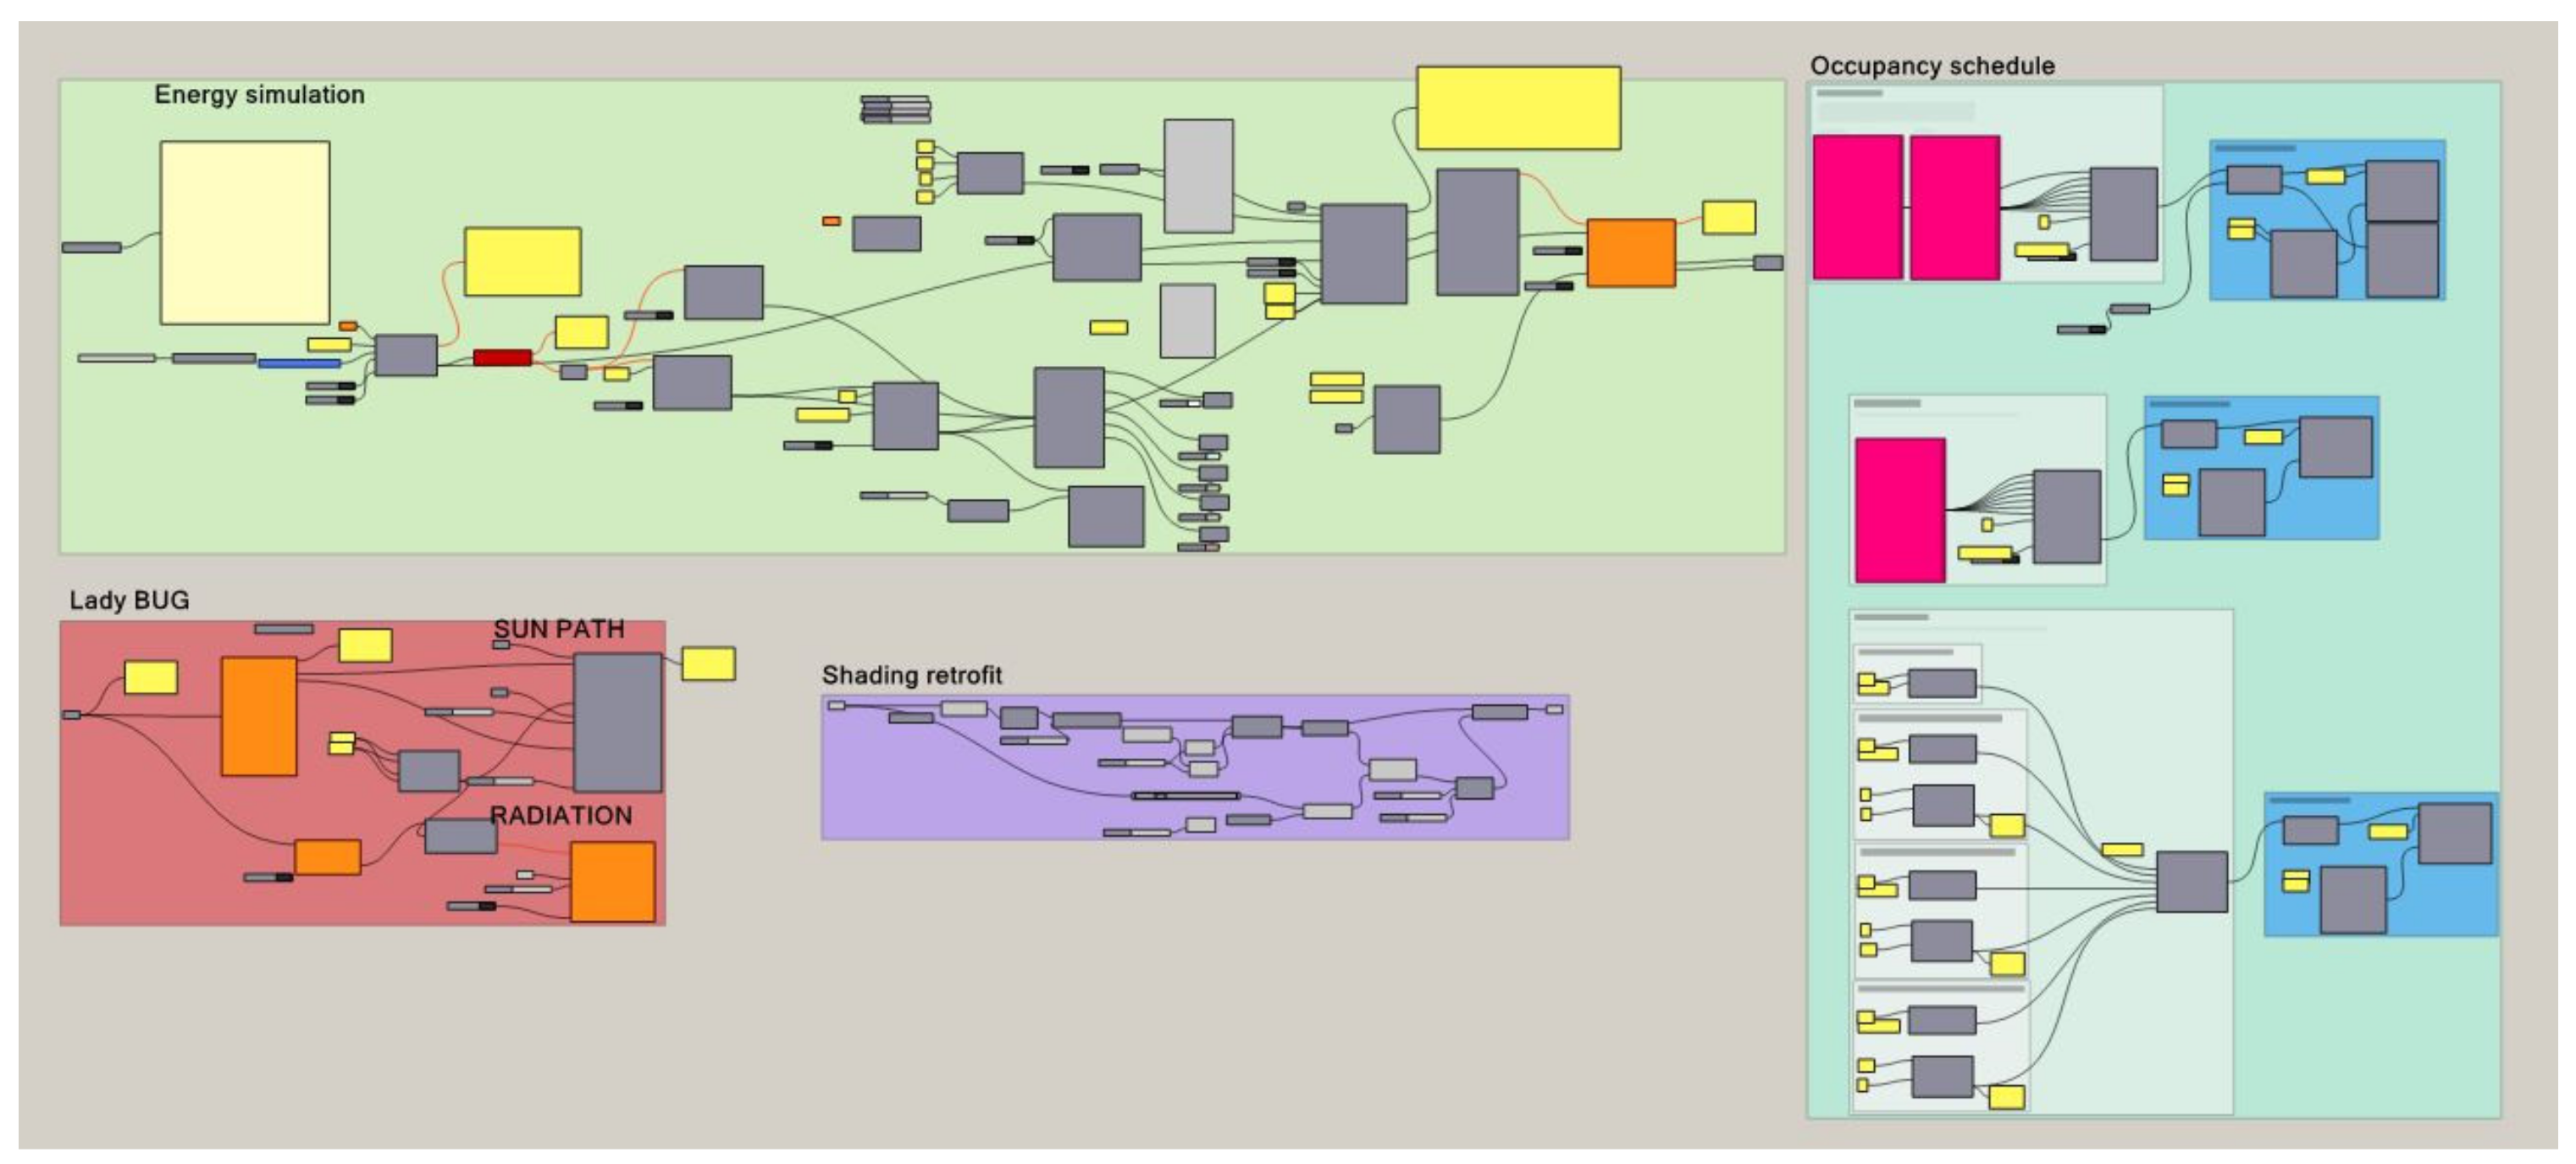
For this study, several scripts have been used. First, the script in the green box as illustrated in
Figure 15 is the energy calculation script, which consists of several parameters or Grasshopper components, such as building type/use, materials, heights, location, and surrounding context. In addition, a radiation script shown in red calculates the radiation based on the location and sun path. Moreover, for the sake of validating the base model in Scenario B, an occupancy schedule script has been used shown in blue. Another script was also used for the parametric shading and dome as shown in the purple box for the retrofitted model.
2.3.5. Modeling and Simulation of New Building Design
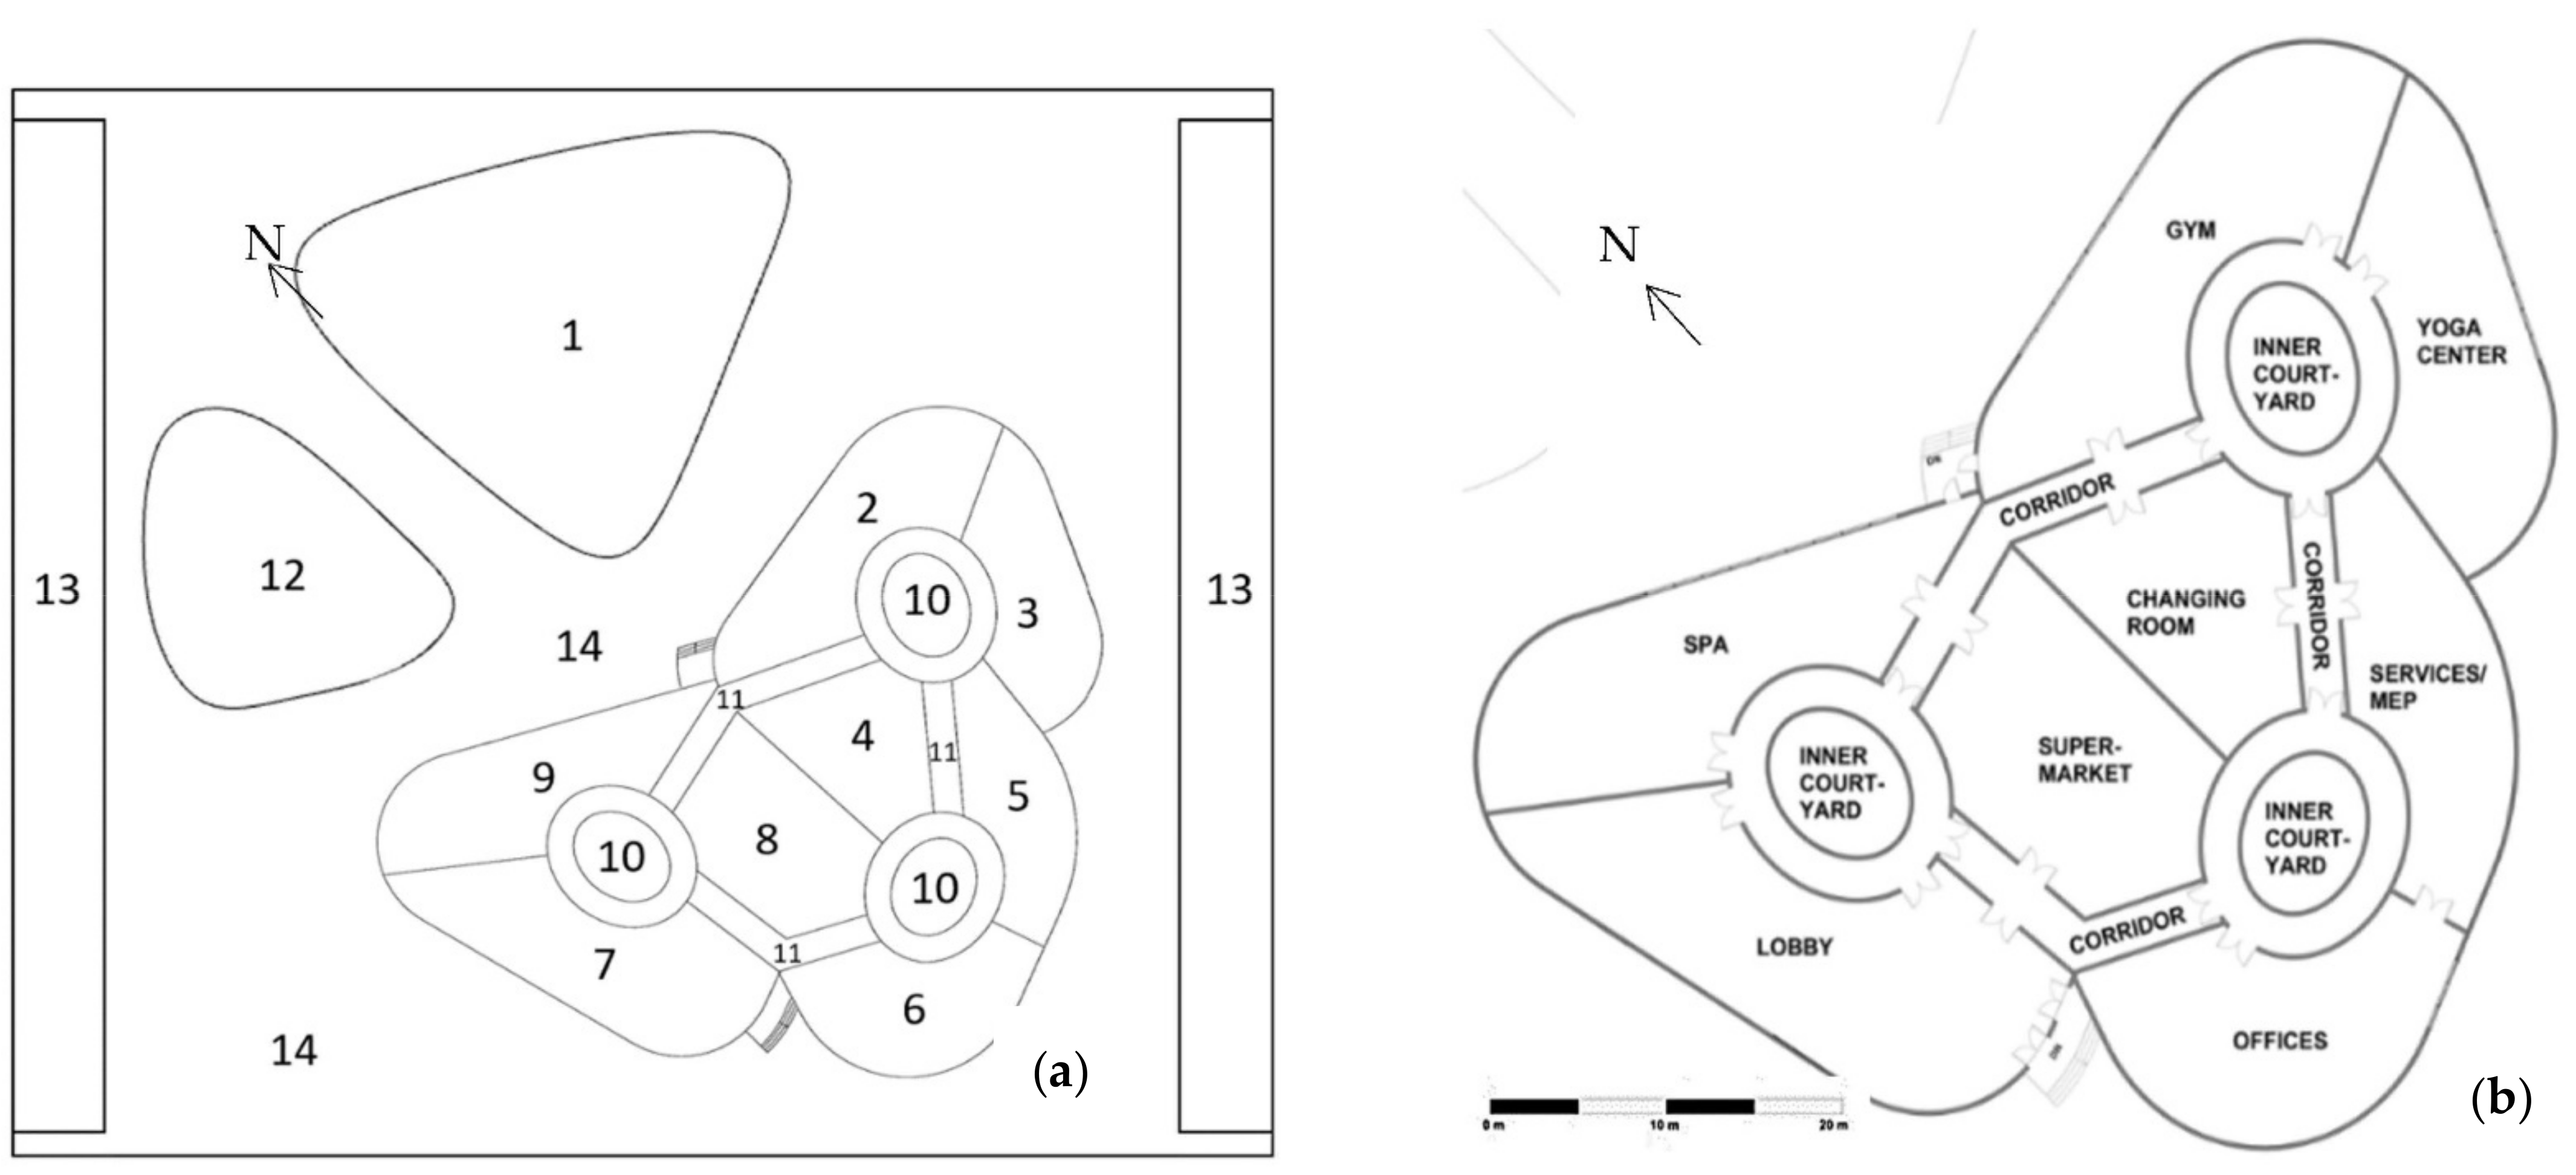
The community center new design is created based on sustainability principles used in the Middle East where an inner courtyard is introduced. The rook expands over the walls by creating the shade. The area of the new design, but also the subdivisions, are the same as the base design in order to have a better comparison of energy consumption. The shape of the new building is more organic in order to embrace better the internal functions and inspire creativity in the community (
Figure 16). The building has been modeled by the dynamic curves technique of non-uniform rational basis spline (NURBS) in Rhino (
Figure 17). The area division is shown in
Table 3.
In addition, the energy performance was done through Rhino Grasshopper. The weather file inserted for the simulation refers to the airport of AL Ain. The energy zones are carefully defined in the Grasshopper environment. The parametric roof was selected to give a unique design while creating maximum shade on the surrounding walls. The organic design allows ventilation in the winter season based on the traditional sustainable architecture principles. Furthermore, the openings are mainly in the north elevation (
Figure 17).
The 3D is in
Figure 18 and the energy model is shown in
Figure 19 and
Figure 20. The total site energy is 555,158.33 kWh in a year, and 411.23 kWh/sqm.
Several difficulties were encountered during the simulation using Rhinoceros 3D and its plug-ins Grasshopper and EnergyPlus. The modeling program is in fact very convenient to model forms, especially complex free-forms, due to NURBS geometric representation. In addition, the parametric roof was created easily and straightforwardly. Despite Rhino 3D’s convenience in the modeling aspect, Grasshopper and EnergyPlus were not easy to maneuver and master. Both plug-ins require knowledge of programming, albeit basic knowledge, to be able to construct a script with all the numerous intended inputs and outputs. There were also errors and bugs regarding unsupported version updates of the EnergyPlus Data Dictionary (IDD) and Input Files (IDF).
3. Results
The results are divided in three main streams. The results coming from the retrofitted case, the results from the new building design and the comparison of these two scenarios. The energy simulation analysis the calculation and electricity tariff per kWh for Al Ain of the total bill cost are shown in
Table 4 (
Figure 21).
The retrofitted building has a total yearly consumption of 771,616.00. In comparison to the base case of 820,903.29 kWh there is a difference of 49,287.29 kWh. This difference between the retrofitted case and the current building would bring a 9% reduction of the electricity used. In terms of cost the total bill for the base case is 164,180.658 AED and the retrofitted case is 154,323.25 AED. This difference is 9857.41 AED.
The new building design has a total yearly consumption of 111,031.67 kWh. In comparison to the base case of 820,903.29 kWh, there is a difference of 265,744.96 kWh. This difference between the new building design and the current building would bring a 32% reduction in the electricity used. In terms of cost, the total bill for the base case is 164,180.658 AED and the retrofitted case is 111,031.67 AED. This difference is 53,148.99 AED.
Table 4.
Total bill cost of the three scenarios using the simulated energy values.
Table 4.
Total bill cost of the three scenarios using the simulated energy values.
| | Total Building Energy (kWh) | Electricity Tariff (AED/kWh) * | Total Bill Cost (AED) |
|---|
| Base case | 820,903.29 | 0.200 | 164,180.658 |
| Retrofit case | 771,616.00 | 0.200 | 154,323.25 |
| New design case | 555,158.33 | 0.200 | 111,031.67 |
The new building design compared to the retrofitted case has a reduction of energy consumption on a yearly base by 216,457.67 kWh, which in terms of percentage is 23%. In terms of cost, the difference between these two cases is 43,291.58 AED.
4. Discussion
This study aims to evaluate the impact of retrofitted buildings versus new parametric designs on the yearly energy consumption. The results showed a significant improvement in terms of energy reductions in the new building design.
However, there were several challenges encountered in this study:
Collecting site information: this task was proven more time-consuming than initially stated and the bureaucratic procedures had more complications than previously estimated. Receiving the electricity bills for the validation of the base model was a long process of meetings until the information was obtained.
Validation process: building the geometry of the existing building based on the available data was challenging as the geometries we not consistent. Therefore, there were several revisions of the script to close the volumes of the building. Translating the electricity bills in Python was a difficult task. Several attempts were made to calibrate the model as per the real site conditions.
Retrofit model modeling: the use of the parametric screen had an optimization process in terms of the parameters added such as the unit size, the opening, the connection to the building, and the impact on the energy consumption. Connecting the geometry of the shading device to the base model, understanding the impact of the solar radiation, therefore linking it to the cooling load and energy consumption needed to customize scripts and run through several errors.
Tools used: the tools used in this study such as Rhino and plug-ins Grasshopper, Ladybug, Honeybee are based on Python. Based on the architectural background of the authors, understanding the scripts was initially challenging and time-consuming. Analyzing the language of the architectural design and translating it into Python by adding several parameters was a longer process than initially estimated (
Figure 22).
Future research has to be done including the construction methods, the building cost, the operational energy cost, and life cycle analysis (LCA). Further development of the scripts using Python can be done. These scripts shall be shared in the open forum of the online community in the Rhino platform for young researchers to be adapted to different built environments and therefore improve and develop them further.
However, despite all the difficulties faced in this study, the results of the new design are promising and can be potentially applied on a large scale in the Middle Eastern region. Other cities in Saudi Arabia, Qatar, Kuwait, Oman, Bahrain can consider and apply the strategy used in this study to improve energy consumption and help reach the sustainability goals set by the governments.
5. Conclusions
This research aimed to analyze and evaluate the impact of a retrofit strategy in an existing building compared to a new building design based on advanced tools. The main finding of this research is that the new building design can reduce electricity consumption by 32% compared to the base case. Meanwhile, the retrofitted scenario had an energy consumption reduction of 9% compared to the base case. The new design compared to the retrofitted case scenario has a 23% reduction.
Furthermore, a validation of the base model was done. The validation process of the existing building started with the modeling and simulation based on the data received. Afterward, based on the electricity bills received from the shop located on the southeast side of the building, the full model was validated. The main points that were adjusted were the occupancy schedule of the shop and the electrical equipment. As a result, the validated full model was more accurate based on the shop electricity bills. The validated full model had yearly energy consumption of 820,903.29 kWh compared to the value of 692,190.33 kWh of the base model prior to the validation.
Another important aspect of this study is that considering the design of the building by fully analyzing through the modeling and simulation tools that are currently used by the academic and industrial environment there can be a great impact on energy consumption.
This study brings innovation to the research community due to the tool used and the methodology applied. The Rhino Grasshopper had a major development in the last few years when online users could contribute to open forums and assist the young researchers in real time. The Python language and the script used can have a large field of application.
The retrofit strategy, on the other hand, can contribute with its design based on the UAE architectural heritage to other building typology retrofits. In this specific design, several parameters were added considering the opening size, the unit dimensions, the connection to the building, and the impact on energy consumption.
This study is relevant to the regional design offices. By using advanced tools from the initial stages of the design, the construction industry can have a great contribution to building green communities considering the hot and arid climate of the Middle East. This research can have a large field of application as the methods from design to building the model can also be used by the local government in housing programs and governmental building constructions. This study and its findings could help the Abu Dhabi municipality reach the sustainability goals set in the 2030 Plan.
Author Contributions
Conceptualization, L.B.; methodology, L.B.; validation, H.H.; formal analysis, L.B., D.A. and H.H.; investigation,; resources, L.B.; data curation, L.B.; writing—original draft preparation, L.B., D.A. and H.H.; writing—review and editing, L.B., D.A. and H.H.; visualization, D.A., H.H., supervision, L.B.; project administration, L.B.; funding acquisition, L.B. All authors have read and agreed to the published version of the manuscript.
Funding
This research received no external funding.
Institutional Review Board Statement
Not applicable.
Informed Consent Statement
Not applicable.
Data Availability Statement
Not applicable.
Acknowledgments
The authors thank you UAEU, COE, AE Department for the support in the work done in this publication. Thank you to the online community in the Rhino/Grasshopper forum. Also a thank you to A.A. (A. Alnuaimi), A.A. (A. Alsaadi), K.A. for their initial support.
Conflicts of Interest
The authors declare no conflict of interest.
References
- Energy and Water Statistics Content List. 2017. Available online: http://www.zemch.org/zemch_conference_proceedings (accessed on 3 April 2022).
- Department of Urban Planning and Municipalities—Estidama Services. Available online: https://www.upc.gov.ae/en/upc-services-and-tools/services/estidama-services (accessed on 10 June 2020).
- Bande, L.; Cabrera, A.G.; Afshari, A.; Martin, M. Evaluation of Smart Shading Structures in Mitigating Urban Heat Island in a district of a Hot Arid Climate City (Abu Dhabi). In Proceedings of the 9th International Conference on Urban Climate Jointly with 12th Symposium on the Urban Environment, Toulouse, France, 20–24 July 2015. [Google Scholar]
- Abu Dhabi Urban Planning Council (UPC). The Pearl Rating System for Estidama Community Rating System. 2010. Available online: https://www.academia.edu/41520072/The_Pearl_Rating_System_for_Estidama_Community_Rating_System_Design_and_Construction (accessed on 3 April 2022).
- Old and Rare Pictures of Dubai and Abu Dhabi—1966, 1954 |Living Life in UAE | Life in UAE, Dubai, Abu Dhabi, Sharjah, Universities, College, Education, Banks, Jobs, Business, Expats Life, Working in Dubai. Available online: http://blog.idubai.info/2012/11/old-and-rare-pictures-of-dubai-and-abu.html (accessed on 9 July 2021).
- Al-Alili, A.; Al Qubaisi, A. Efficient Residential Buildings in Hot and Humid Regions: The Case of Abu Dhabi, UAE. Int. J. Therm. Environ. Eng. 2018, 17, 29–40. [Google Scholar] [CrossRef]
- Camo House/WOW Architects | ArchDaily. Available online: https://www.archdaily.com/943769/camo-house-wow-architects (accessed on 18 May 2021).
- Bande, L.; Alshamsi, A.; Alhefeiti, A.; Alderei, S.; Shaban, S.; Albattah, M.; Scoppa, M.D. Parametric Design Structures in Low Rise Buildings in Relation to the Urban Context in UAE. Sustainability 2021, 13, 8595. [Google Scholar] [CrossRef]
- Geyer, P.; Buchholz, M. Parametric systems modeling for sustainable energy and resource flows in buildings and their urban environment. Autom. Constr. 2012, 22, 70–80. [Google Scholar] [CrossRef]
- De Sousa Freitas, J.; Cronemberger, J.; Soares, R.M.; Amorim, C.N.D. Amorim, Modeling and assessing BIPV envelopes using parametric Rhinoceros plugins Grasshopper and Ladybug. Renew. Energy 2020, 160, 1468–1479. [Google Scholar] [CrossRef]
- Gaspari, J.; Fabbri, K.; Gabrielli, L. IOP Conference Series: Earth and Environmental Science. In Proceedings of the Retrofitting Hospitals: A Parametric Design Approach to Optimize Energy Efficiency Retrofitting Hospitals: A Parametric Design Approach to Optimize Energy Efficiency, Prague, Czech Republic, 2–4 July 2019. [Google Scholar]
- Kim, H.; Clayton, M.J. Parametric behavior maps: A method for evaluating the energy performance of climate-adaptive building envelopes. Energy Build. 2020, 219, 110020. [Google Scholar] [CrossRef]
- Bot, K.; Ramos, N.M.M.; Almeida, R.M.S.F.; Pereira, P.F.; Monteiro, C. Energy performance of buildings with on-site energy generation and storage—An integrated assessment using dynamic simulation. J. Build. Eng. 2019, 24, 100769. [Google Scholar] [CrossRef]
- Rossi-Schwarzenbeck, M.; Figliola, A. Adaptive building and skin: An innovative computational workflow to design energy efficient buildings in different climate zones. J. Green Build. 2019, 14, 1–15. [Google Scholar] [CrossRef]
- Hernandez, C.R.B. Thinking parametric design: Introducing parametric Gaudi. Des. Stud. 2006, 27, 309–324. [Google Scholar] [CrossRef]
- Fang, Y.; Cho, S. Design optimization of building geometry and fenestration for daylighting and energy performance. Sol. Energy 2019, 191, 7–18. [Google Scholar] [CrossRef]
- Qingsong, M.; Fukuda, H. Parametric Office Building for Daylight and Energy Analysis in the Early Design Stages. Procedia-Soc. Behav. Sci. 2016, 216, 818–828. [Google Scholar] [CrossRef] [Green Version]
- Touloupaki, E.; Theodosiou, T. Optimization of Building form to Minimize Energy Consumption through Parametric Modelling. Procedia Environ. Sci. 2017, 38, 509–514. [Google Scholar] [CrossRef]
- Eltaweel, A.; Su, Y. Controlling venetian blinds based on parametric design; via implementing Grasshopper’s plugins: A case study of an office building in Cairo. Energy Build. 2017, 139, 31–43. [Google Scholar] [CrossRef] [Green Version]
- Turrin, M.; von Buelow, P.; Kilian, A.; Stouffs, R. Performative skins for passive climatic comfort: A parametric design process. Autom. Constr. 2012, 22, 36–50. [Google Scholar] [CrossRef]
- Taleb, H.; Musleh, M.A. Applying urban parametric design optimisation processes to a hot climate: Case study of the UAE. Sustain. Cities Soc. 2015, 14, 236–253. [Google Scholar] [CrossRef]
- Yu, R.; Gu, N.; Ostwald, M. Comparing designers’ problem-solving behavior in a parametric design environment and a geometric modeling environment. Buildings 2013, 3, 621–638. [Google Scholar] [CrossRef] [Green Version]
- Asl, Y.G. Applying Parametric Design in Order to Meet the Environmental Goals. Kuwait Chapter Arab. J. Bus. Manag. Rev. 2014, 3, 184–191. [Google Scholar] [CrossRef] [Green Version]
- Lagios, K.; Niemasz, J.; Reinhart, C.F. Animated building performance simulation (ABPS)—linking Rhinoceros/Grasshopper with Radiance/Daysim. Proc. SimBuild 2010, 4, 321–327. [Google Scholar]
- Doelling, M.C.; Nasrollahi, F. Parametric Design: A Case Study in Design-simulation Integration. In Proceedings of the 13th Conference of International Building Performance Simulation Association, Chambéry, France, 26–28 August 2013. [Google Scholar]
- Al Ain Climate: Average Temperature, Weather by Month, Al Ain Weather Averages—Climate-Data.org. Available online: https://en.climate-data.org/asia/united-arab-emirates/abu-dhabi/al-ain-1210/#temperature-graph (accessed on 30 June 2022).
Figure 1.
Methodology schematic view.
Figure 1.
Methodology schematic view.
Figure 2.
Temperature range for Abu Dhabi.
Figure 2.
Temperature range for Abu Dhabi.
Figure 3.
Radiation range for Abu Dhabi.
Figure 3.
Radiation range for Abu Dhabi.
Figure 4.
Python script for Grasshopper plug-in (illustration purpose only).
Figure 4.
Python script for Grasshopper plug-in (illustration purpose only).
Figure 5.
Radiation analysis of the base model of MREIFA compound club.
Figure 5.
Radiation analysis of the base model of MREIFA compound club.
Figure 6.
3D volumes of the base model.
Figure 6.
3D volumes of the base model.
Figure 7.
Grasshopper solar radiation analysis of the base case.
Figure 7.
Grasshopper solar radiation analysis of the base case.
Figure 8.
Radiation analysis of the base model.
Figure 8.
Radiation analysis of the base model.
Figure 9.
Base model floor plan; occupancy schedule.
Figure 9.
Base model floor plan; occupancy schedule.
Figure 10.
Base model occupancy schedule.
Figure 10.
Base model occupancy schedule.
Figure 11.
Energy calculation of the base model: (a) north view, (b) south view.
Figure 11.
Energy calculation of the base model: (a) north view, (b) south view.
Figure 12.
3D of the retrofitted model.
Figure 12.
3D of the retrofitted model.
Figure 13.
Parametric shading detail of retrofitted model.
Figure 13.
Parametric shading detail of retrofitted model.
Figure 14.
Energy calculation of the retrofitted model.
Figure 14.
Energy calculation of the retrofitted model.
Figure 15.
Scripts used for energy calculations, occupancy schedule, and shading structure.
Figure 15.
Scripts used for energy calculations, occupancy schedule, and shading structure.
Figure 16.
(
a) Site plan of the new design (zones description by numbers in
Table 4), (
b) developed floor plan of the new design (plan development).
Figure 16.
(
a) Site plan of the new design (zones description by numbers in
Table 4), (
b) developed floor plan of the new design (plan development).
Figure 17.
Grasshopper script of the energy simulation.
Figure 17.
Grasshopper script of the energy simulation.
Figure 18.
3D views of the new design: (a) south view, (b) north view.
Figure 18.
3D views of the new design: (a) south view, (b) north view.
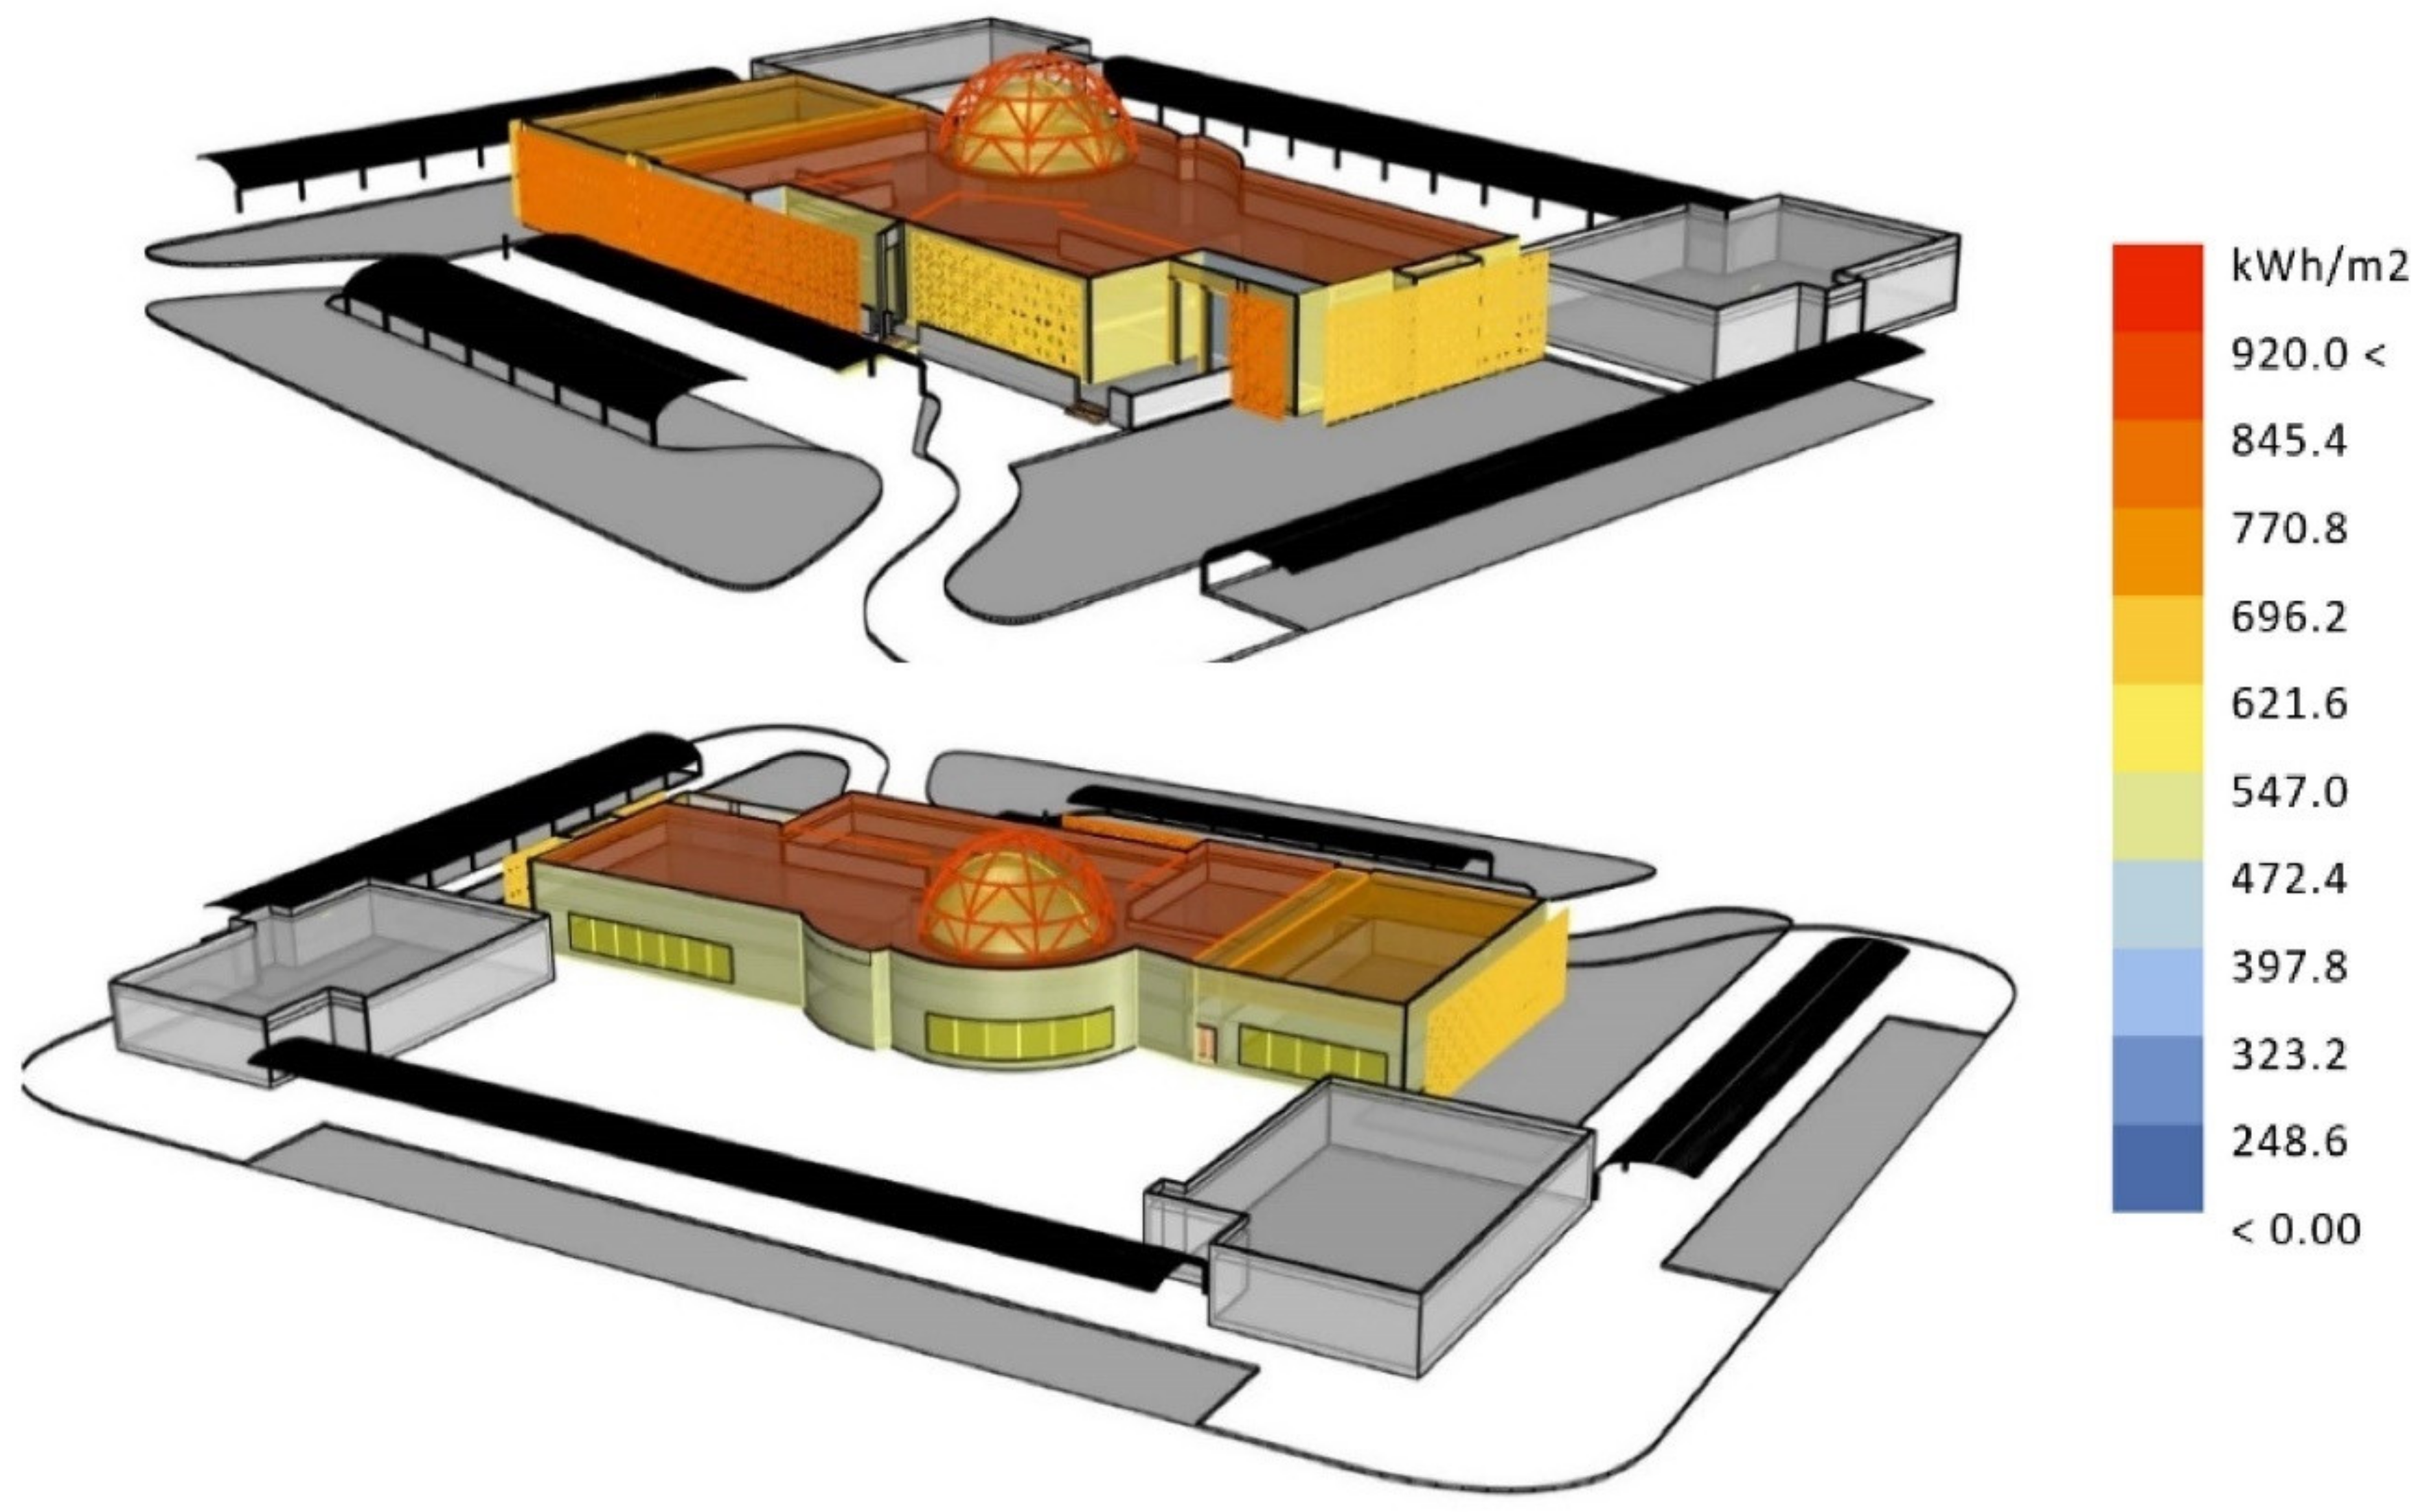
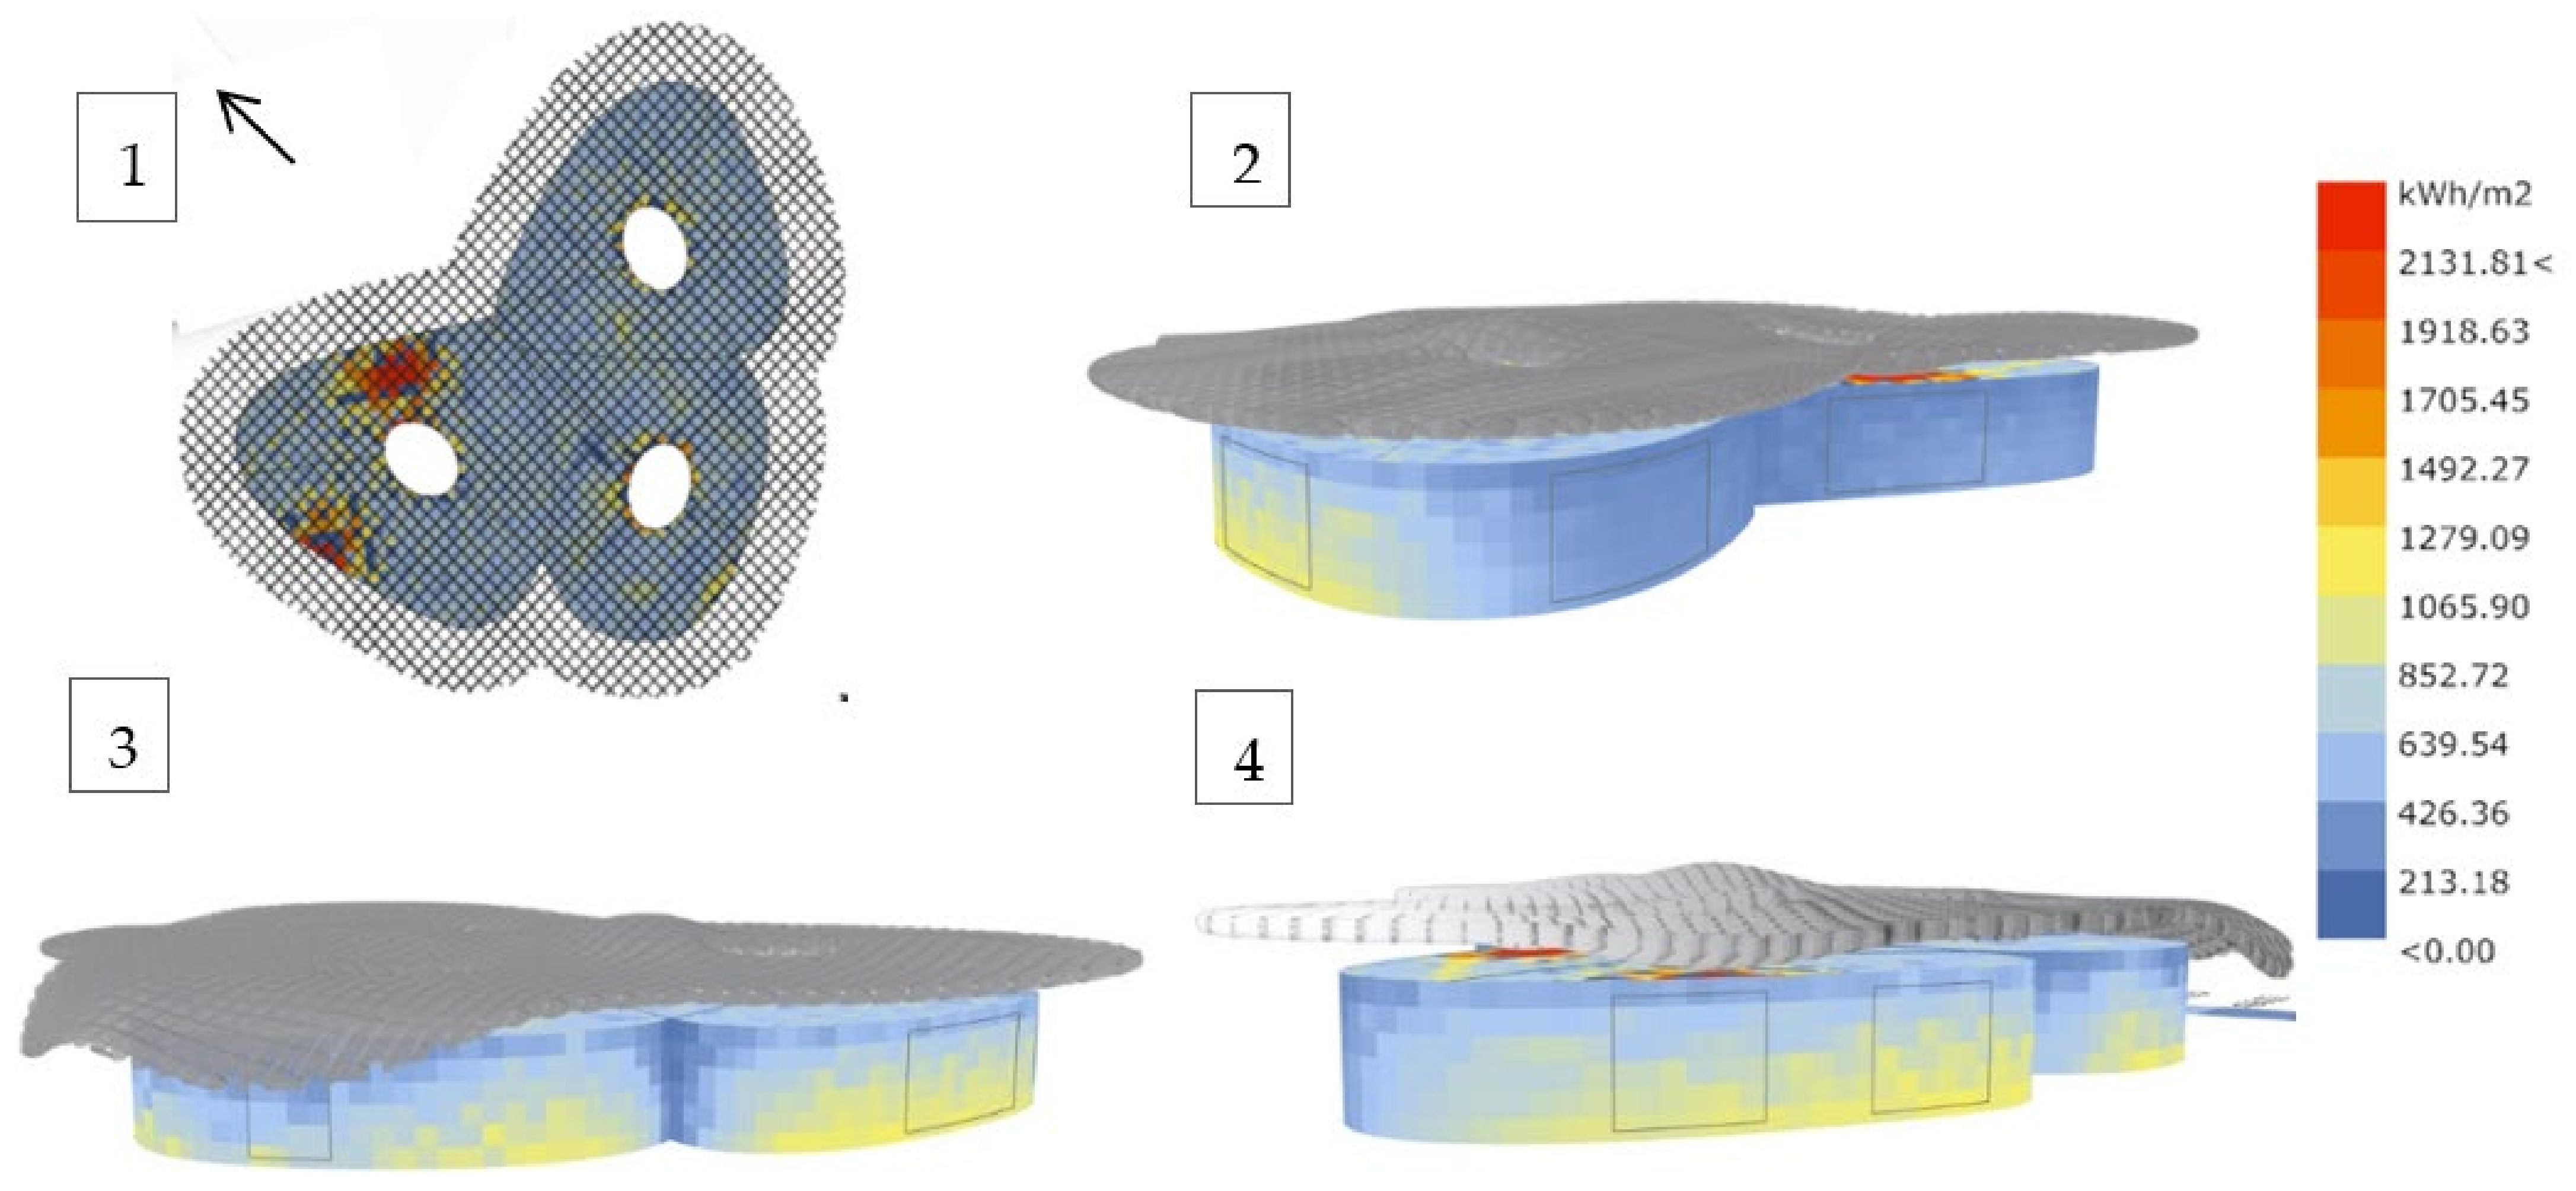
Figure 19.
Radiation model and legend of the new MREIFA design. Figures (1) top view, (2) north-east orientation, (3) east orientation, and (4) west orientation.
Figure 19.
Radiation model and legend of the new MREIFA design. Figures (1) top view, (2) north-east orientation, (3) east orientation, and (4) west orientation.
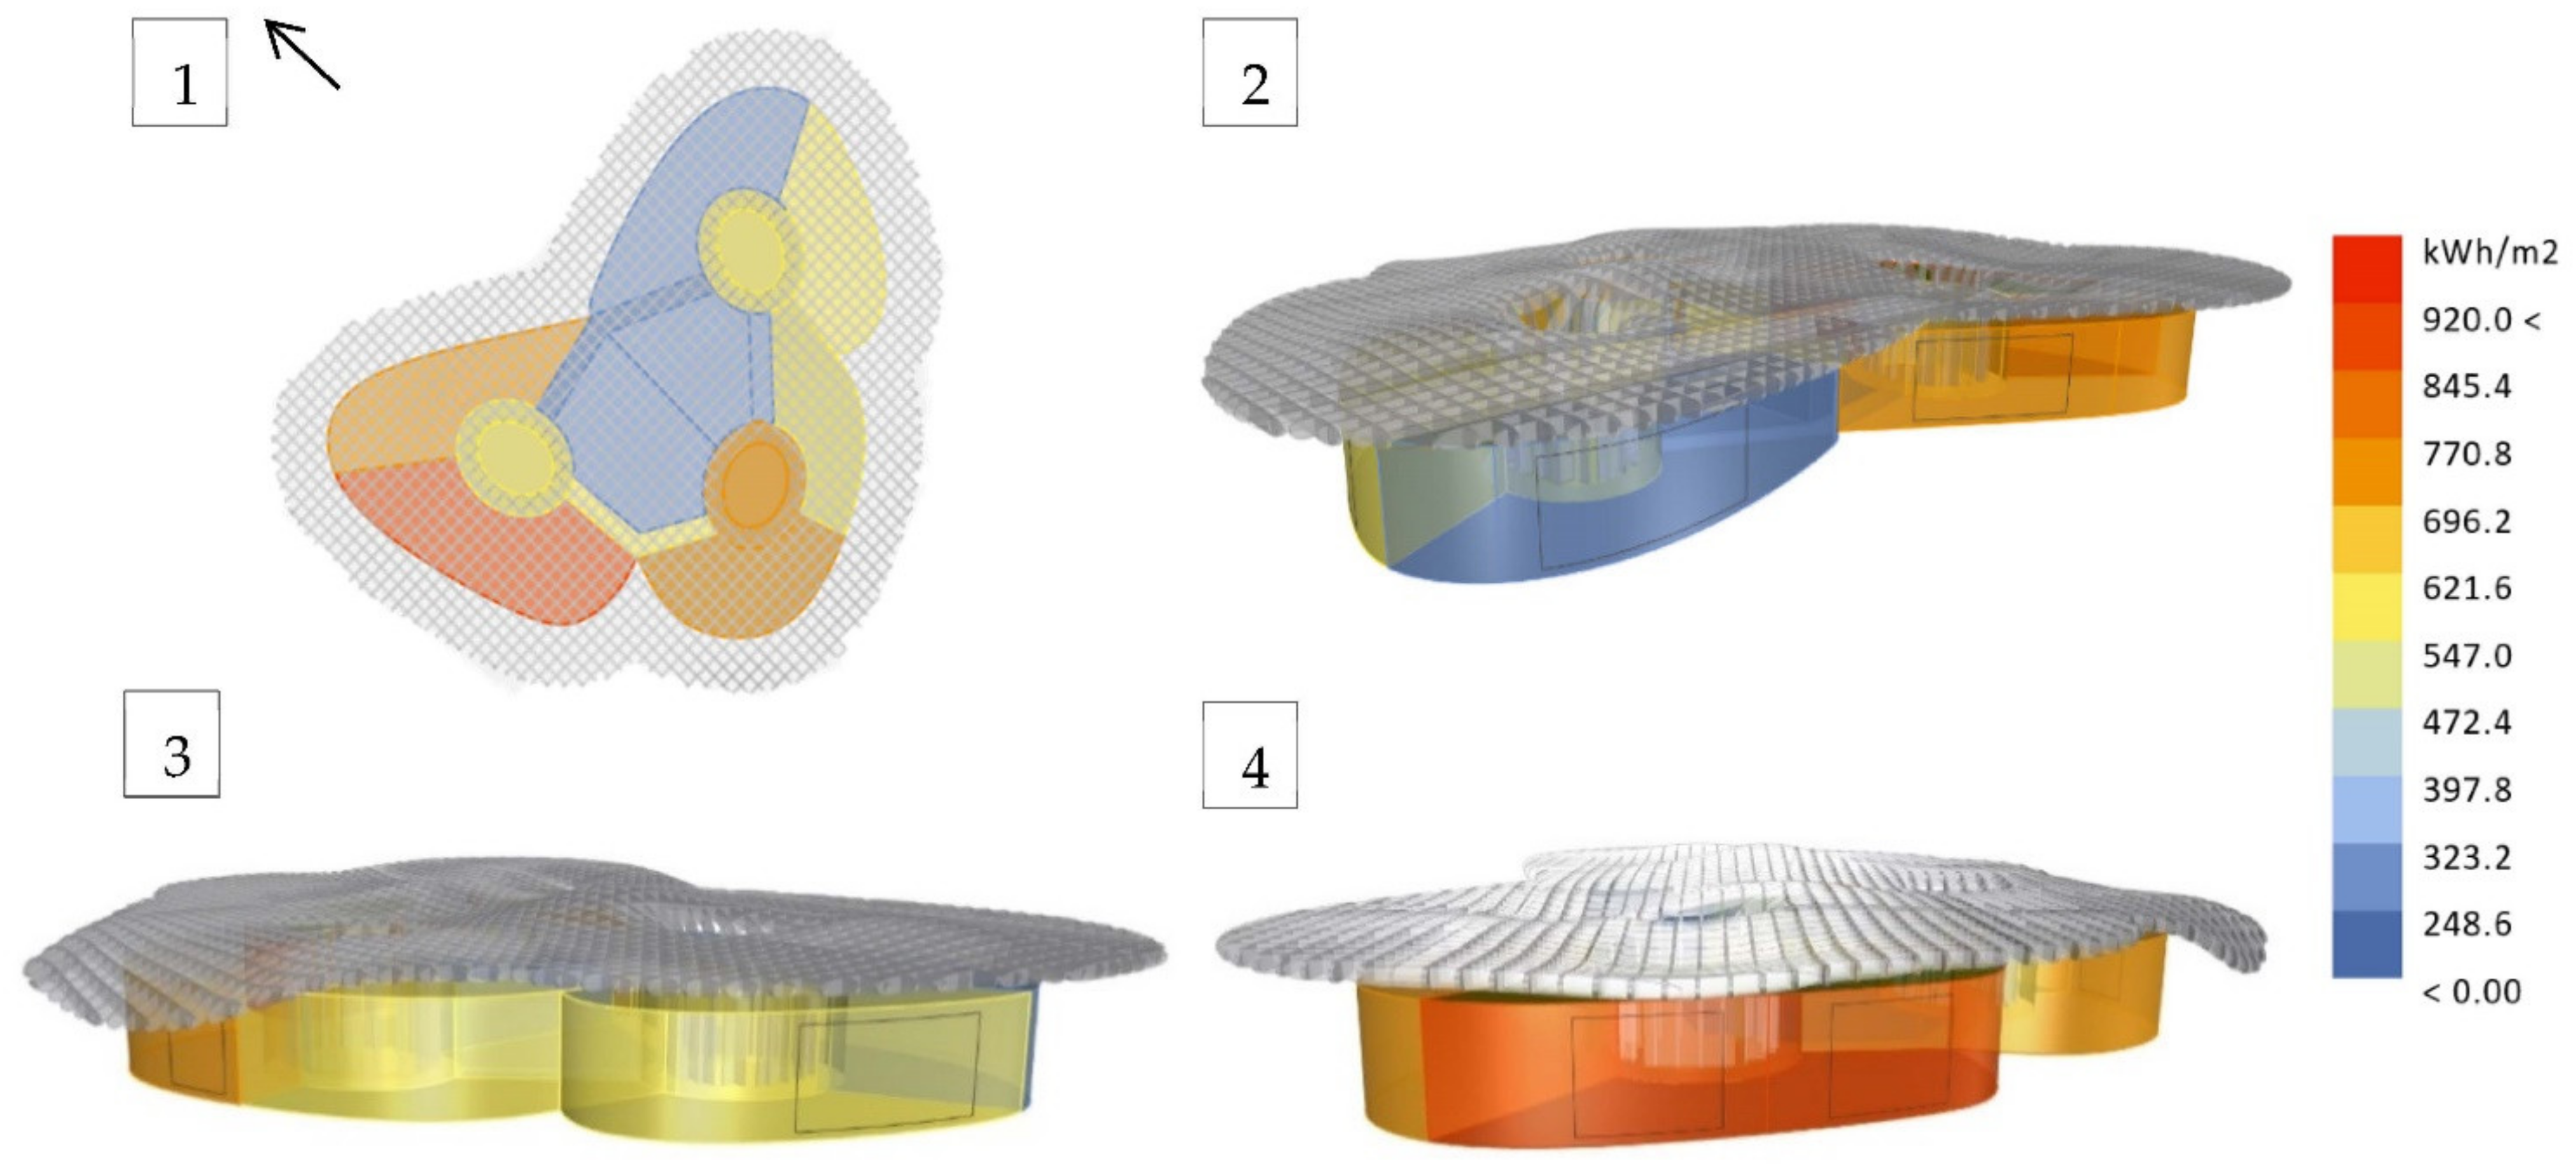
Figure 20.
3D energy model of the new MREIFA design. Figures (1) top view, (2) north-east orientation, (3) east orientation, and (4) west orientation.
Figure 20.
3D energy model of the new MREIFA design. Figures (1) top view, (2) north-east orientation, (3) east orientation, and (4) west orientation.
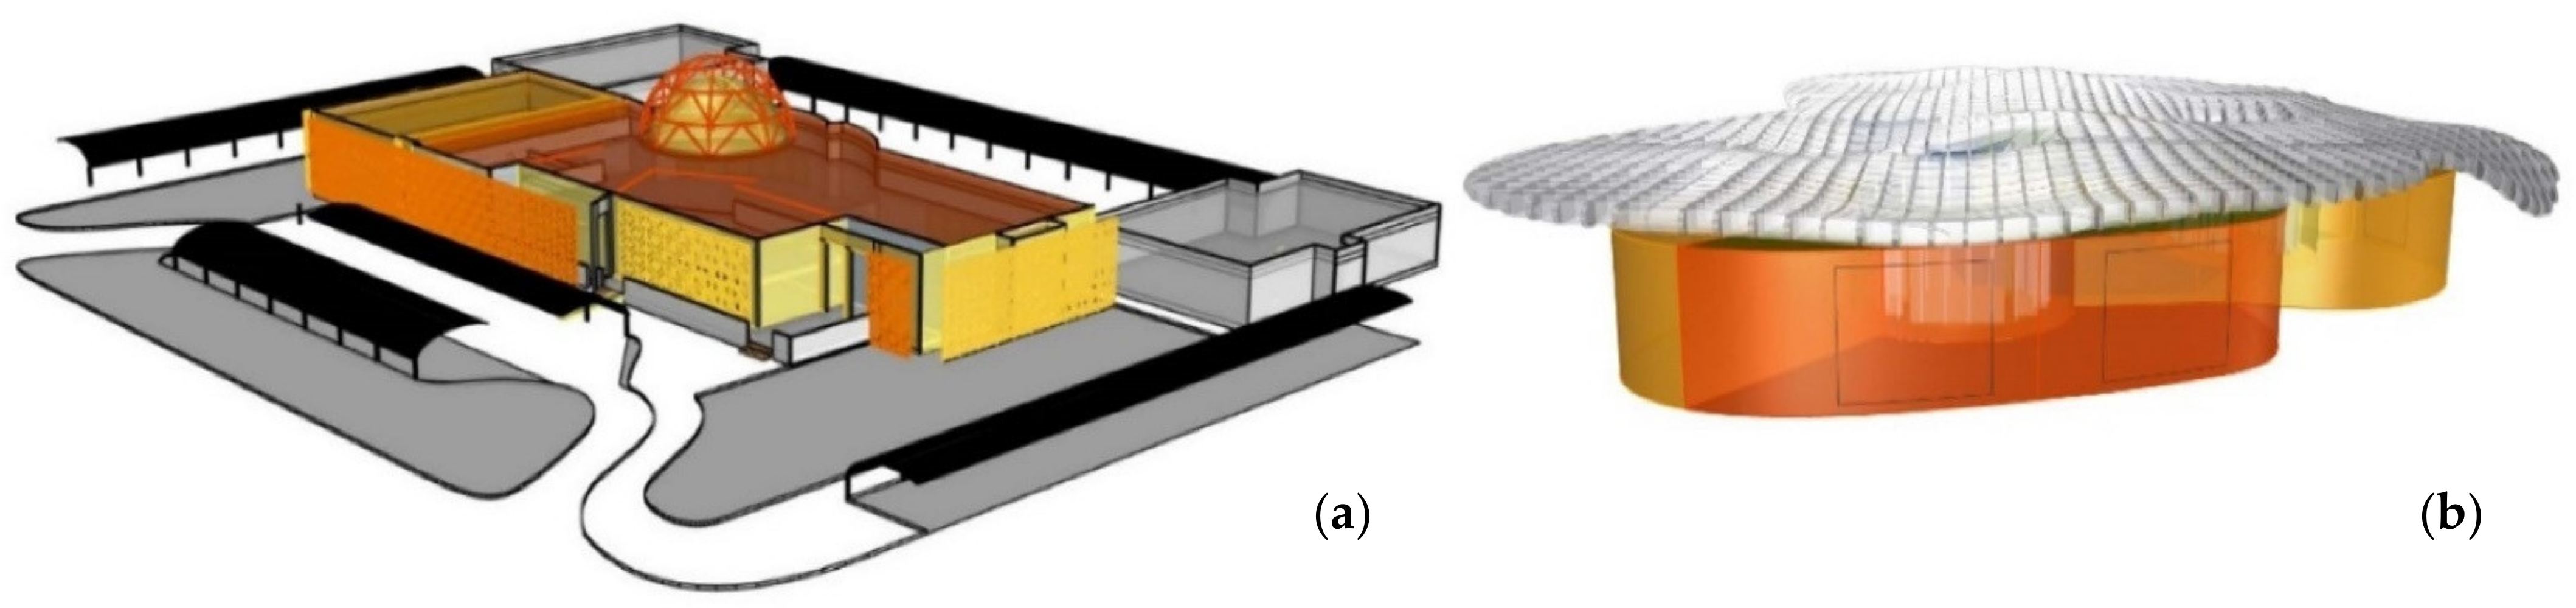
Figure 21.
The energy model of (a) retrofitted building, (b) new building design.
Figure 21.
The energy model of (a) retrofitted building, (b) new building design.
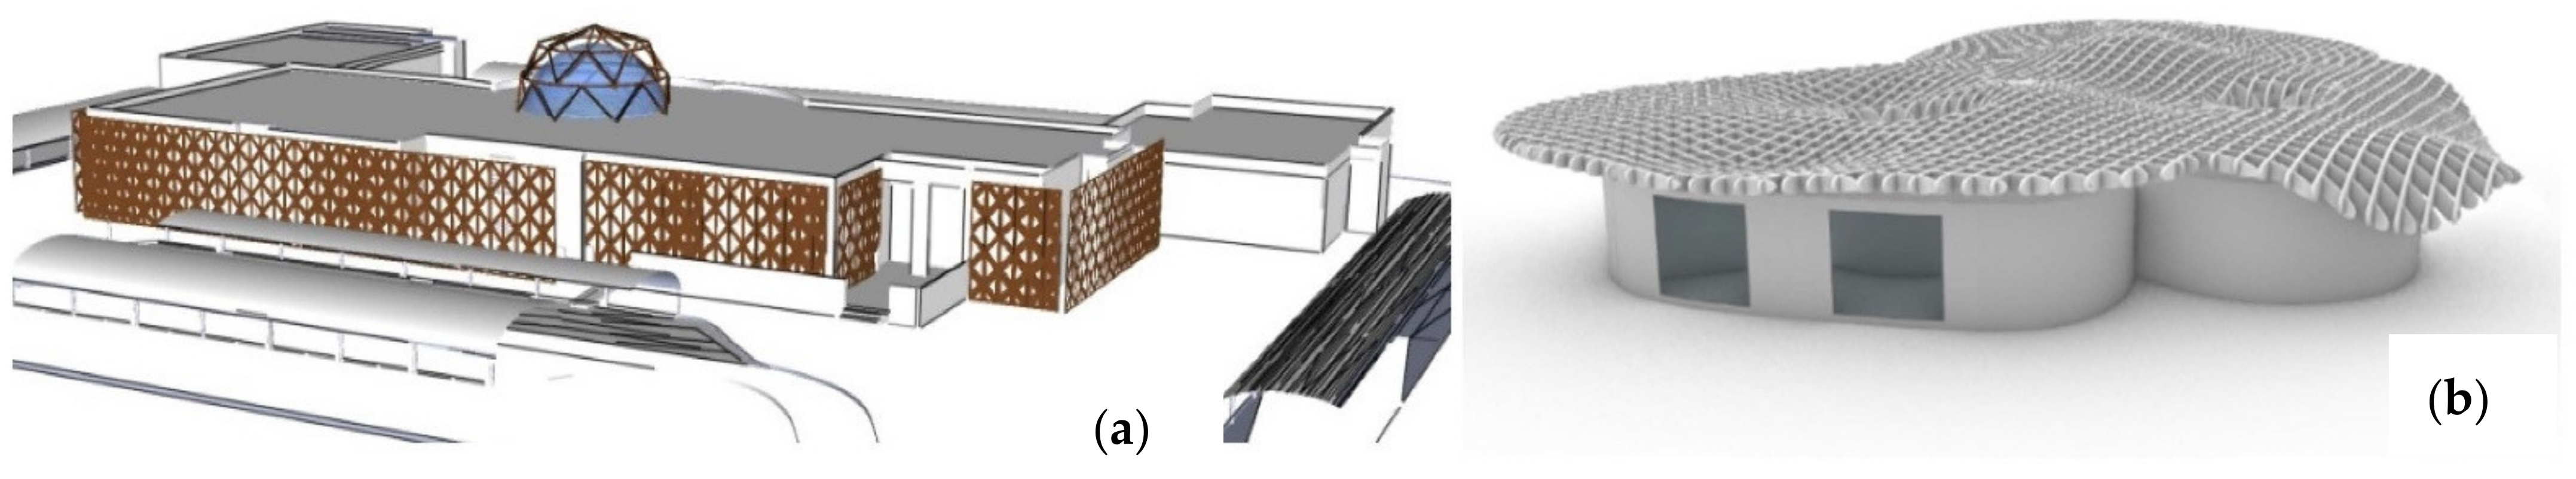
Figure 22.
(a) Retrofitted model, (b) new building design model.
Figure 22.
(a) Retrofitted model, (b) new building design model.
Table 1.
Existing building program.
Table 1.
Existing building program.
| Space | Area (m2) | Space | Area (m2) |
|---|
| GYM | 130 | Swimming pool | 180 |
| Changing area | 130 | Car parking | 1370 |
| Lobby | 500 | Pavement | 2950 |
| Yoga center | 300 | Service blocks | 670 |
| Supermarket | 170 | Greenery | 1650 |
| Bathrooms | 100 | Total area | 8150 |
Table 2.
Energy consumption of base model.
Table 2.
Energy consumption of base model.
| Model | Shop Zone Energy Consumption (kWh) | Electricity Cost of Shop (AED) | Full Model Energy Consumption (kWh) | Electricity Cost of Full Building (AED) |
|---|
| Scenario A: Base model | 111,287.04 | 22,257.41 | 692,190.33 | 138,438.07 |
| Scenario B: After validation | 240,000.00 | 48,000.00 | 820,903.29 | 164,180.66 |
Table 3.
Total area of the new design.
Table 3.
Total area of the new design.
| # | Space | Area (m2) | # | Space | Area (m2) |
|---|
| 1 | Swimming pool | 700 | 8 | Supermarket | 152 |
| 2 | Gym | 189 | 9 | Spa/WC | 172 |
| 3 | Yoga center | 138 | 10 | Inner Courtyards | 82 |
| 4 | Changing Area/WC | 114 | 11 | Corridors | 251 |
| 5 | Services/MEP | 119 | 12 | Greenery | 220 |
| 6 | Offices | 142 | 13 | Car Parking | 900 |
| 7 | Lobby | 216 | 14 | Pavement | 4765 |
| | | | | Total | 8160 |
| Publisher’s Note: MDPI stays neutral with regard to jurisdictional claims in published maps and institutional affiliations. |
© 2022 by the authors. Licensee MDPI, Basel, Switzerland. This article is an open access article distributed under the terms and conditions of the Creative Commons Attribution (CC BY) license (https://creativecommons.org/licenses/by/4.0/).


