Article

Research on the Application of Multi-Source Data Analysis for Bridge Safety Monitoring in the Reconstruction and Demolition Process

1
School of Civil Engineering and Architecture, East China Jiaotong University, Nanchang 330013, China
2
State Key Laboratory of Performance Monitoring Protecting of Rail Transit Infrastructure, East China Jiaotong University, Nanchang 330013, China
3
Anhui Transport Consulting & Design Institute Co., Ltd., Hefei 530021, China
*
Author to whom correspondence should be addressed.
Buildings 2022, 12(8), 1195; https://doi.org/10.3390/buildings12081195
Submission received: 24 June 2022 / Revised: 2 August 2022 / Accepted: 6 August 2022 / Published: 9 August 2022

Abstract

:
With the increase of bridge-required demolition/dismantling for reconstruction or modification, the early warning of construction emergencies is greatly needed for monitoring the structural safety of bridges under construction. In this paper, based on the multi-source data of nearby construction and demolition construction of a large-span RC arch bridge in China, the Analytic Hierarchy Process (AHP) method is adopted to analyze the multi-source data and set the early warning threshold for bridge safety in construction. According to the analytical results, a reasonable evaluation of AHP factors can improve the accuracy and timeliness of safety early warning in the structural safety monitoring of bridges during the construction process. The weight of the monitoring data in AHP should be assigned according to its reliability, stability, and importance. Bridge safety assessment of nearby construction having harmful vibration should prioritize dynamic bridge monitoring by cooperating with multi-source data, including stress, and deformation monitoring of the bridge is necessary. The assessment results proved that multi-source data, including but not limited to structural stress and deformation monitoring data, vibration data, theoretical prediction data, environment data such as temperature data, and construction/maintenance history data, are necessary for safety monitoring and early warning of construction with specifications related to bridge construction. The early warnings triggered by the evaluation results successfully ensure the safety status of the bridge during nearby construction and demolition construction, which shows the proposed method can provide a guideline for comprehensively evaluating and early warning of the status of bridge construction.

1. Introduction

With the rapid development of urban construction, most of the reinforced concrete arch bridges built in China since the 1980s require demolition/dismantling for reconstruction or modification due to the low standard of original design and aging/exposure-related failure structural components. However, in recent years, safety accidents have occurred in the process of bridge reconstruction or modification construction in China [1,2]. All the collapse accidents concerning bridge reconstruction or modification were accompanied by painful casualties and huge economic losses. Therefore, to ensure the bridge structure’s safety, applicability, and durability, it is necessary to carry out structural monitoring during the construction phase [3,4]. The traditional bridge construction monitoring system generally includes structural design parameter monitoring, geometric state monitoring, stress monitoring, temperature monitoring, and other parts. Stress monitoring is one of the main contents of construction monitoring and the most critical data source of safety warnings in the construction process [5,6].
The construction monitoring and control of a bridge monitor the structure stress, deformation, and stability of a bridge in the construction process, make the structure state optimal, and ensures bridge construction. Following this idea, there are numerous studies have already done. Inaudi [7] studied the functional principle and installation of the long-gage sensors and discussed the measurement results obtained during bridge construction. Hernandez [8] presented the results of a dynamic response evaluation of a segmental bridge during two construction stages by updating its corresponding finite element model with modal parameters experimentally obtained in construction and demonstrated that a rigorous construction control could effectively calibrate finite element models in the construction process of segmental bridges. By updating the finite element model, Gou [9] predicted the behaviors of a self-anchored suspension bridge throughout the construction process and provided helpful monitoring data to ensure safety and quality in construction. Tatsunori [10] studied the monitoring of a temporary bridge during and after construction by the field measurements, and a simplified analysis program, PRAB (Piled Raft Analysis with Batter piles), used to predict the load distribution and the settlements, aligned well with the field measurement predictions. Butler et al. [11] studied the monitoring and assessment of a self-sensing railway bridge during construction. The time-dependent properties of the concrete deck were evaluated by comparing fiber optic sensor (FOS) measurements to predicted results according to several model code formulations implemented in the finite element model. Rao [12] reviewed recent research on the real-time monitoring of construction projects, including sensor technologies and methodologies of construction activities in indoor and outdoor environments and application case studies.
To ensure the geometry and the internal force state of the bridge in construction can ultimately achieve final design requirements, the control measures and suggestions by the finite element analysis and in-site monitoring were studied by many researchers. Zhang [13] studied the construction monitoring and load testing of a pedestrian suspension bridge in China and confirmed the design, specification, and accuracy. With finite element analysis and in-site monitoring, Yang et al. [14] studied the integrated geometry control system for the Incheon cable-stayed bridge. A data integrated management system, structural analysis system, error adjustment system, and measurement system, were employed in the control system. By lidar and 4D design models, Puri et al. [15] developed a technology-supplemented progress monitoring approach for an ongoing bridge construction project. Wang et al. [16] proposed an interactive analysis framework integrating the numerical iteration with the finite element model to achieve a proper equilibrium for the bridge construction stages. The validity and performance of the framework were demonstrated by considering the in-field test data in a self-anchored suspension bridge under construction. Kim et al. [17] developed a methodology for measuring and predicting the time variance of the relative displacement between two prefabricated segments during bridge construction. The method enabled the automated estimation of the relative displacement between two bridge segments in the construction of the Cheonsa Bridge in South Korea.
However, during the monitoring period for bridge reconstruction or modification construction, monitoring data usually have linkage changes, which make the damage identification more complex. To identify bridge damage, methods for damage identification using the dynamic response of bridges induced by moving vehicles and static test data are proposed by many researchers [18,19,20,21,22]. The early warning damage of bridges has been introduced in bridge structure safety monitoring [21,22,23,24], and monitoring bridges is a key part of the maintenance strategy if the bridge becomes unsafe. The early warning threshold of bridge safety in construction is mainly affected by the environment, traffic, and construction load. As the monitoring data are generally random, clear discrimination is challenging. If only a single assessment factor has been referred to, the early warning threshold may be inaccurate or exaggerated in forecasting structure safety and construction safety concerning accidents. Hence, collecting as much assessment data as possible in construction monitoring is essential to judge the bridge’s technical condition and damage identification comprehensively.
Through the above-mentioned studies, the research on the construction monitoring and controlling theory of new bridges has got many applications. However, there is little research on monitoring and safety early warning for the reconstruction and reconstruction of existing bridges, and accurate assessment and forecast methods for the construction of vibration are still lacking. The construction environment and the existing bridge are often more complex than new bridges. There are many uncertain factors in the reconstruction and modification of existing bridges, which might cause great safety risks. Thus, it is necessary to propose an analysis method for bridge safety monitoring during the reconstruction and demolition process.
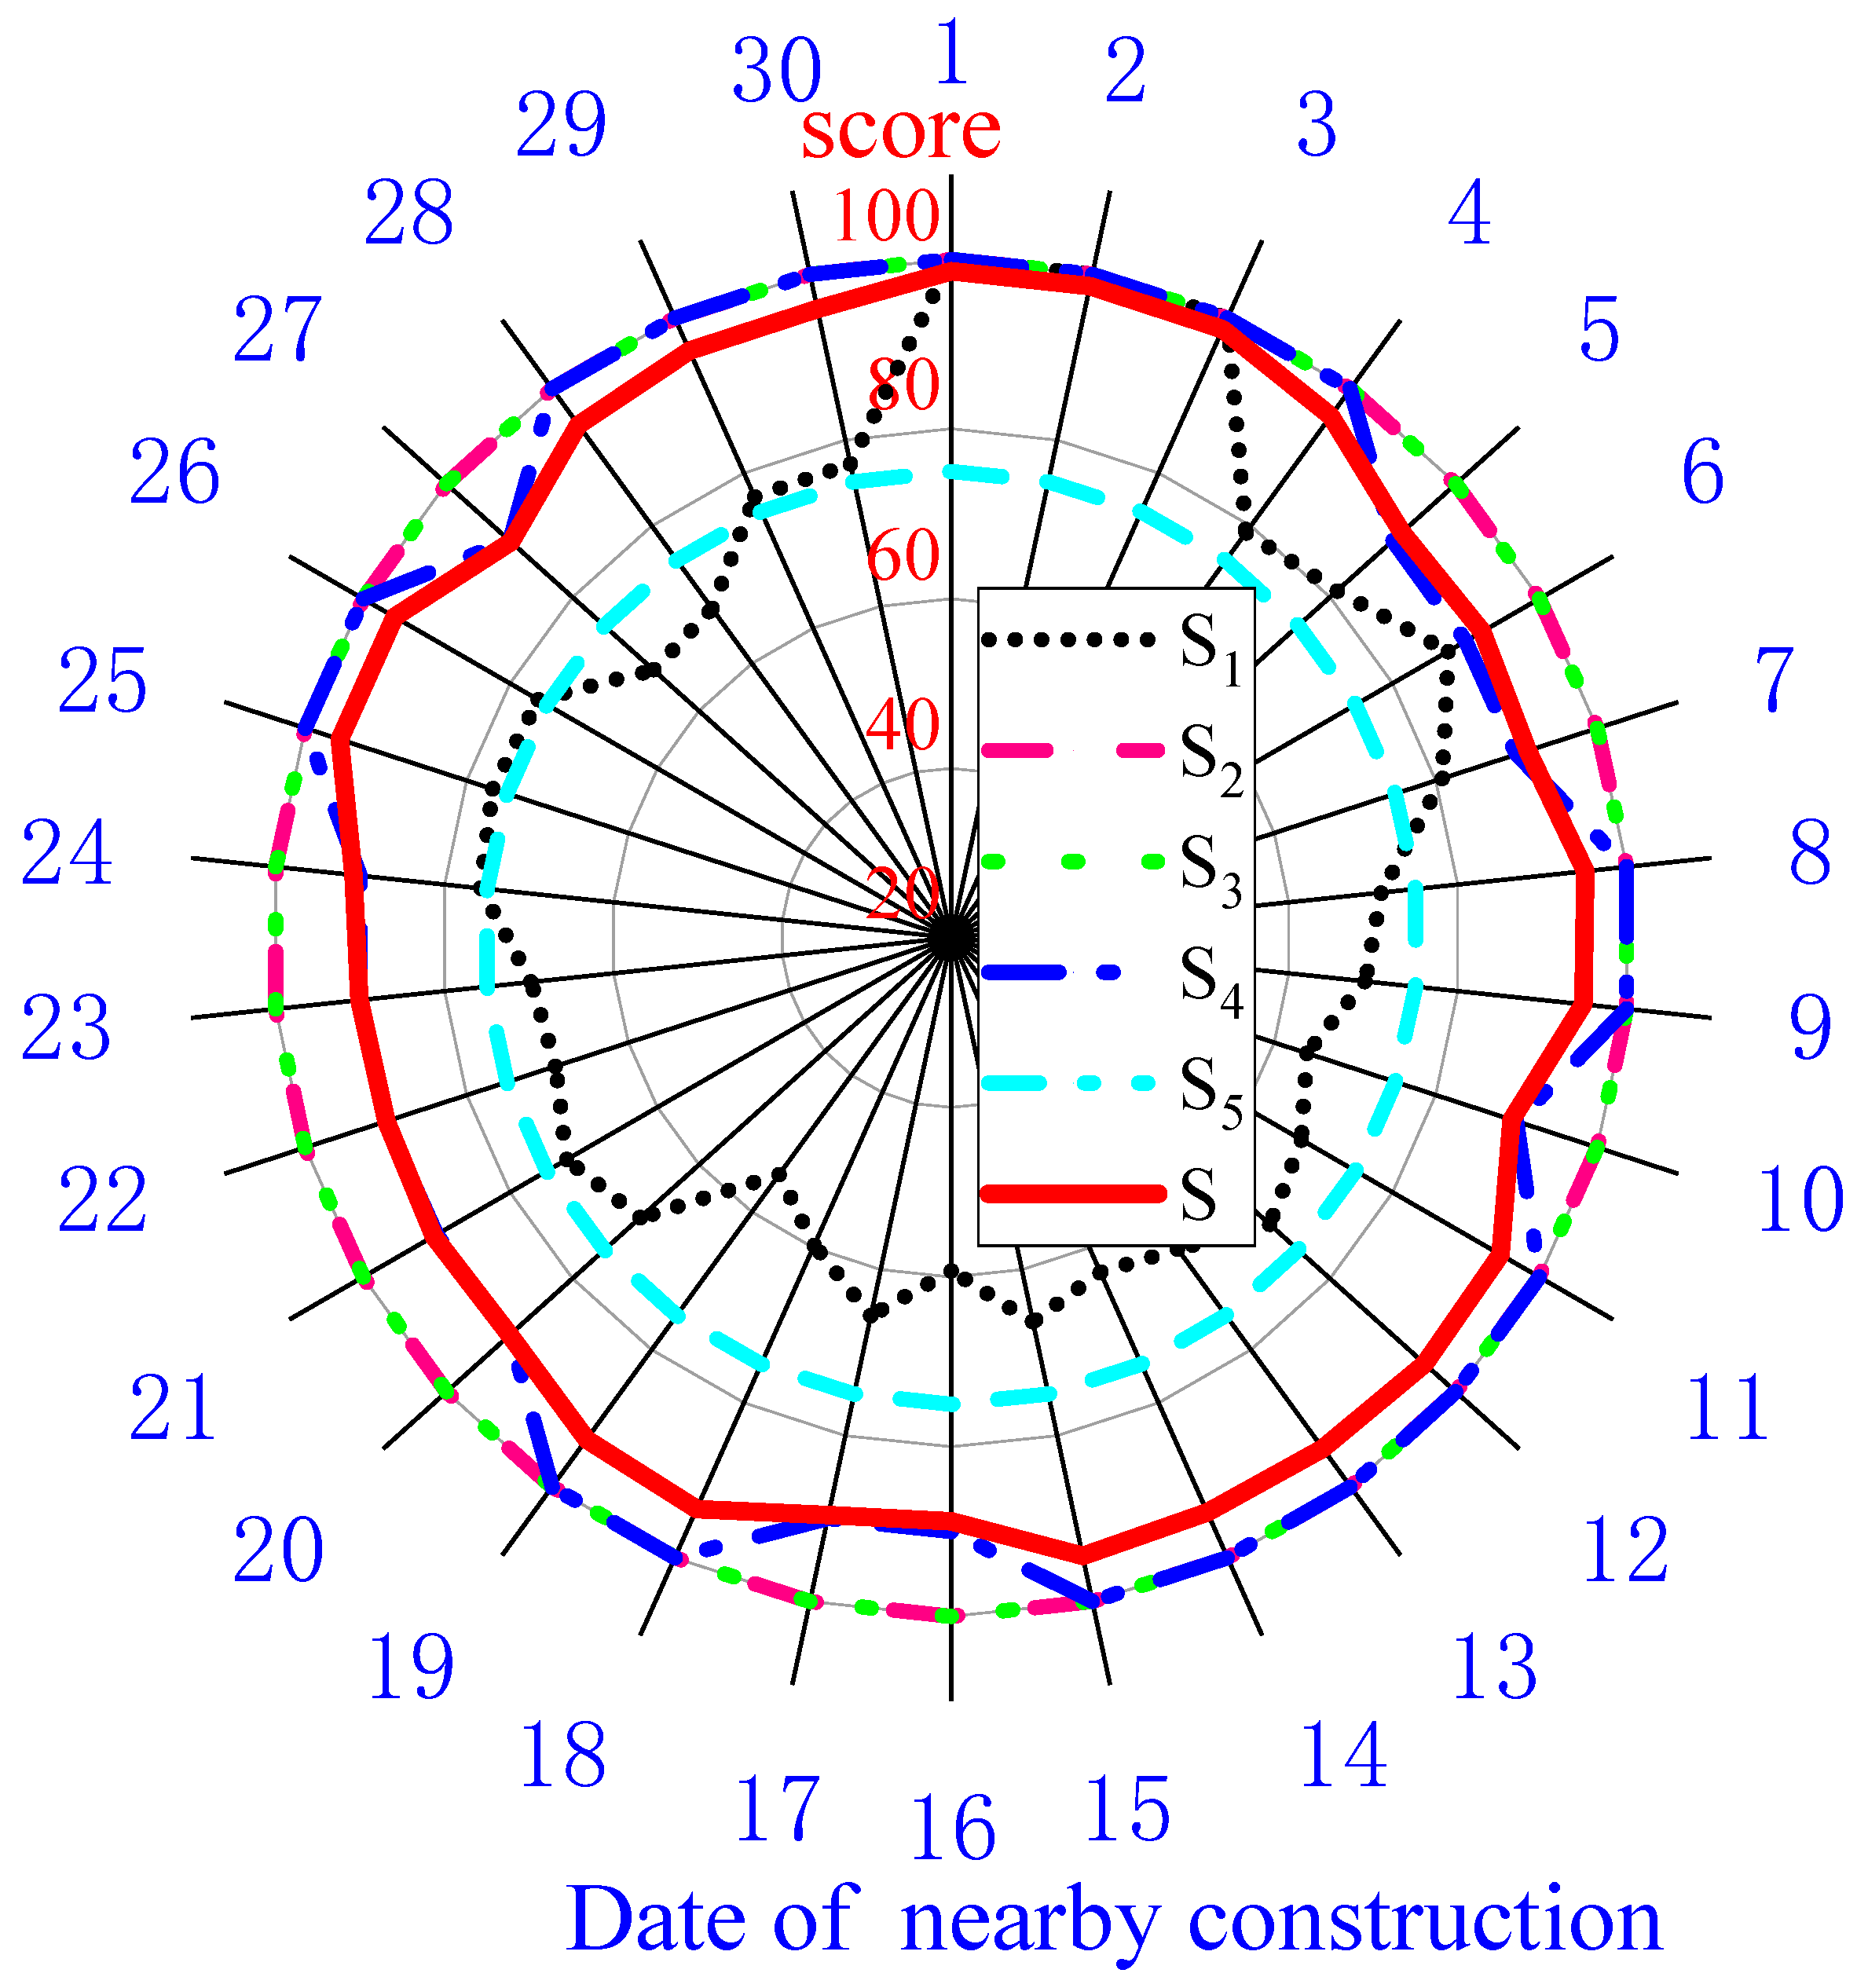
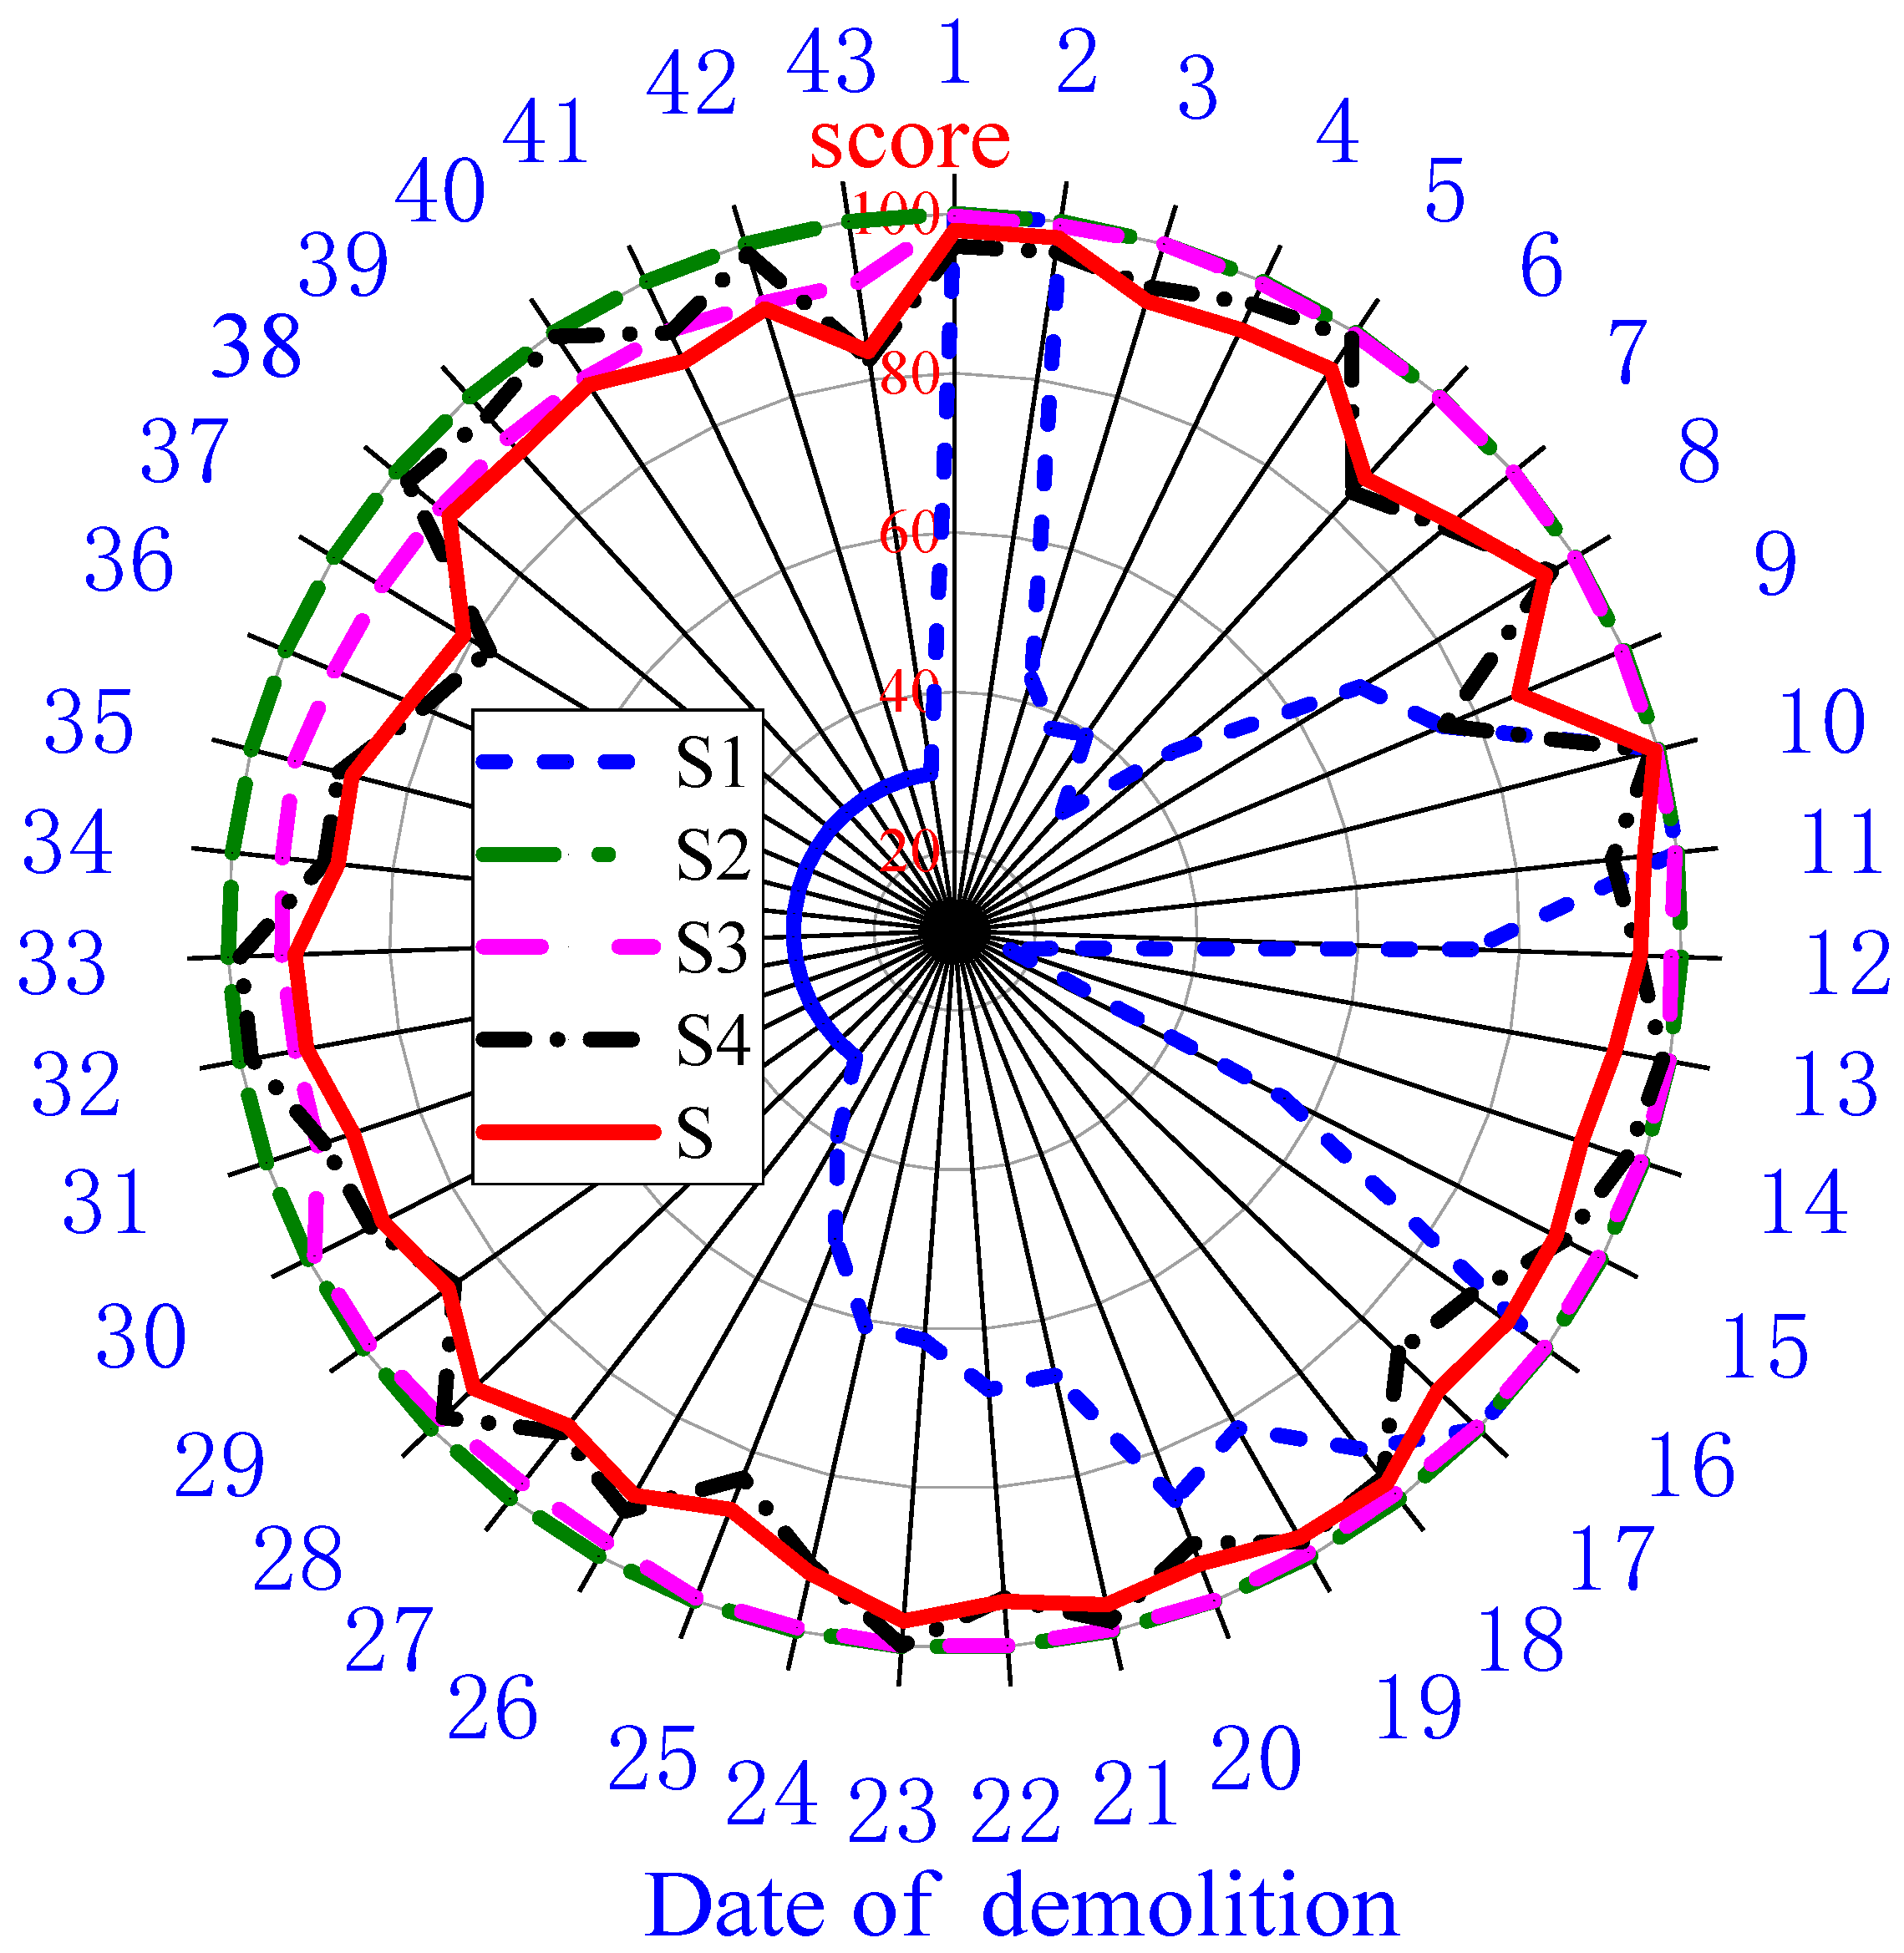
In this paper, taking the stage of nearby impact drilling construction and the stage of demolition construction of the South River bridge as cases, the analysis method of multi-source data and the setting method of early warning threshold for the bridge safety monitoring is studied using the Analytic Hierarchy Process (AHP) method [25]. The multi-source data of the bridge included bridge vibration response, stress, and deformation obtained from finite element simulation, vibration response monitoring data, and stress as well as temperature monitoring data.

2. Background of Bridge Reconstruction and Demolition

The older South River bridge was a three-span double-convex arch bridge requiring demolition for reconstruction. Before demolition, a new bridge with a distance of 0.5 m from the adjacent side of the existing bridge was constructed. The satellite image of the South River bridge is shown in Figure 1. The foundation of the new bridge was built by impact drilling piles. The minimum distance of the piles from the foundation of the older bridge is 7.5 m. It was challenging to close traffic on the older bridge during the construction of the new bridge foundation because of traffic pressure. After the new bridge was constructed, the older bridge was demolished. Another new bridge will be built at the site of the old demolished bridge. The two new bridges, completed at different times, will replace the original bridge to meet the need for vehicle traffic.
The nearby construction of piles of the new bridge was constructed by impact drilling machines, driven by the impact force produced by the heavy hammer lifting and falling freely. The hammer smashed the soil layer at the bottom of the pile hole and then floated out the fine stone slag using mud before pouring concrete onto the pile foundation. After the new bridge was completed, the older bridge was demolished on the site based on the principle of ensuring the stability and safety of the original arch span structure. The overall structure was cut by diamond rope saw into several small units, and then lifting equipment removed the pieces.
The main arch of the bridge at 30 years old was a prefabricated structure, which cannot guarantee integrity. The connection structure was weak at the point of the string since the arch is several concrete slabs connected by a wet joint. Additionally, the concrete grade of some bridge parts was different, and there were small cracks on the anchor layer and the arch rib. The defects made the older bridge sensitive to the construction vibration caused by heavy construction activity. The expected construction period of the new bridge was one year, and the most critical period for the safety status of the bridge was the first month of the nearby construction because the construction vibration generated by impact drilling piles was potentially dangerous to the bridge. Therefore, during the adjacent construction and demolition construction period, the bridge was faced with great risk and danger. It was necessary to comprehensively evaluate the status of bridge construction based on the analysis of multi-source data composed of monitoring data and theoretical prediction data.

3. Contents of Multi-Source Data

To accurately assess the safety impact of adjacent construction on the bridge and construction safety during bridge demolition, the multi-source in this paper are as follows: the bridge deformation, stress, and vibration response obtained from the finite element model, monitoring data of deformation, stress, and pier foundation vibration response monitoring data during construction. The existing older bridge condition is monitored at two different times, first during the nearby construction of the new bridge on the east side of the existing older bridge, and second during the demolition construction of the existing older bridge.

3.1. Strain and Deformation Data Based on Finite Element Static Analysis

Midas Civil was utilized to conduct the static analysis of the bridge. The calculated load includes the self-weight loads of the bridge structure, the vehicle load, the temperature load, and the foundation settlement. The calculation parameters of the bridge in the model are shown in Table 1.
The deterioration coefficient was used for subtracting the effect of existing diseases and previous reinforcement in the model. The vehicle load standard adopts the Vehicle-20 level load of the General Code for the Design of Highway Bridges and Culverts (JTJ021-1989) [26]. The overall lifting temperature is considered according to the temperature heating and cooling of 10 °C, the measured representative overall temperature difference of the bridge before construction. The action of gradient temperature is not considered in the model. The above load is calculated by the finite element static analysis model.

3.2. Bridge Vibration Response Data Based on Finite Element Dynamics Analysis

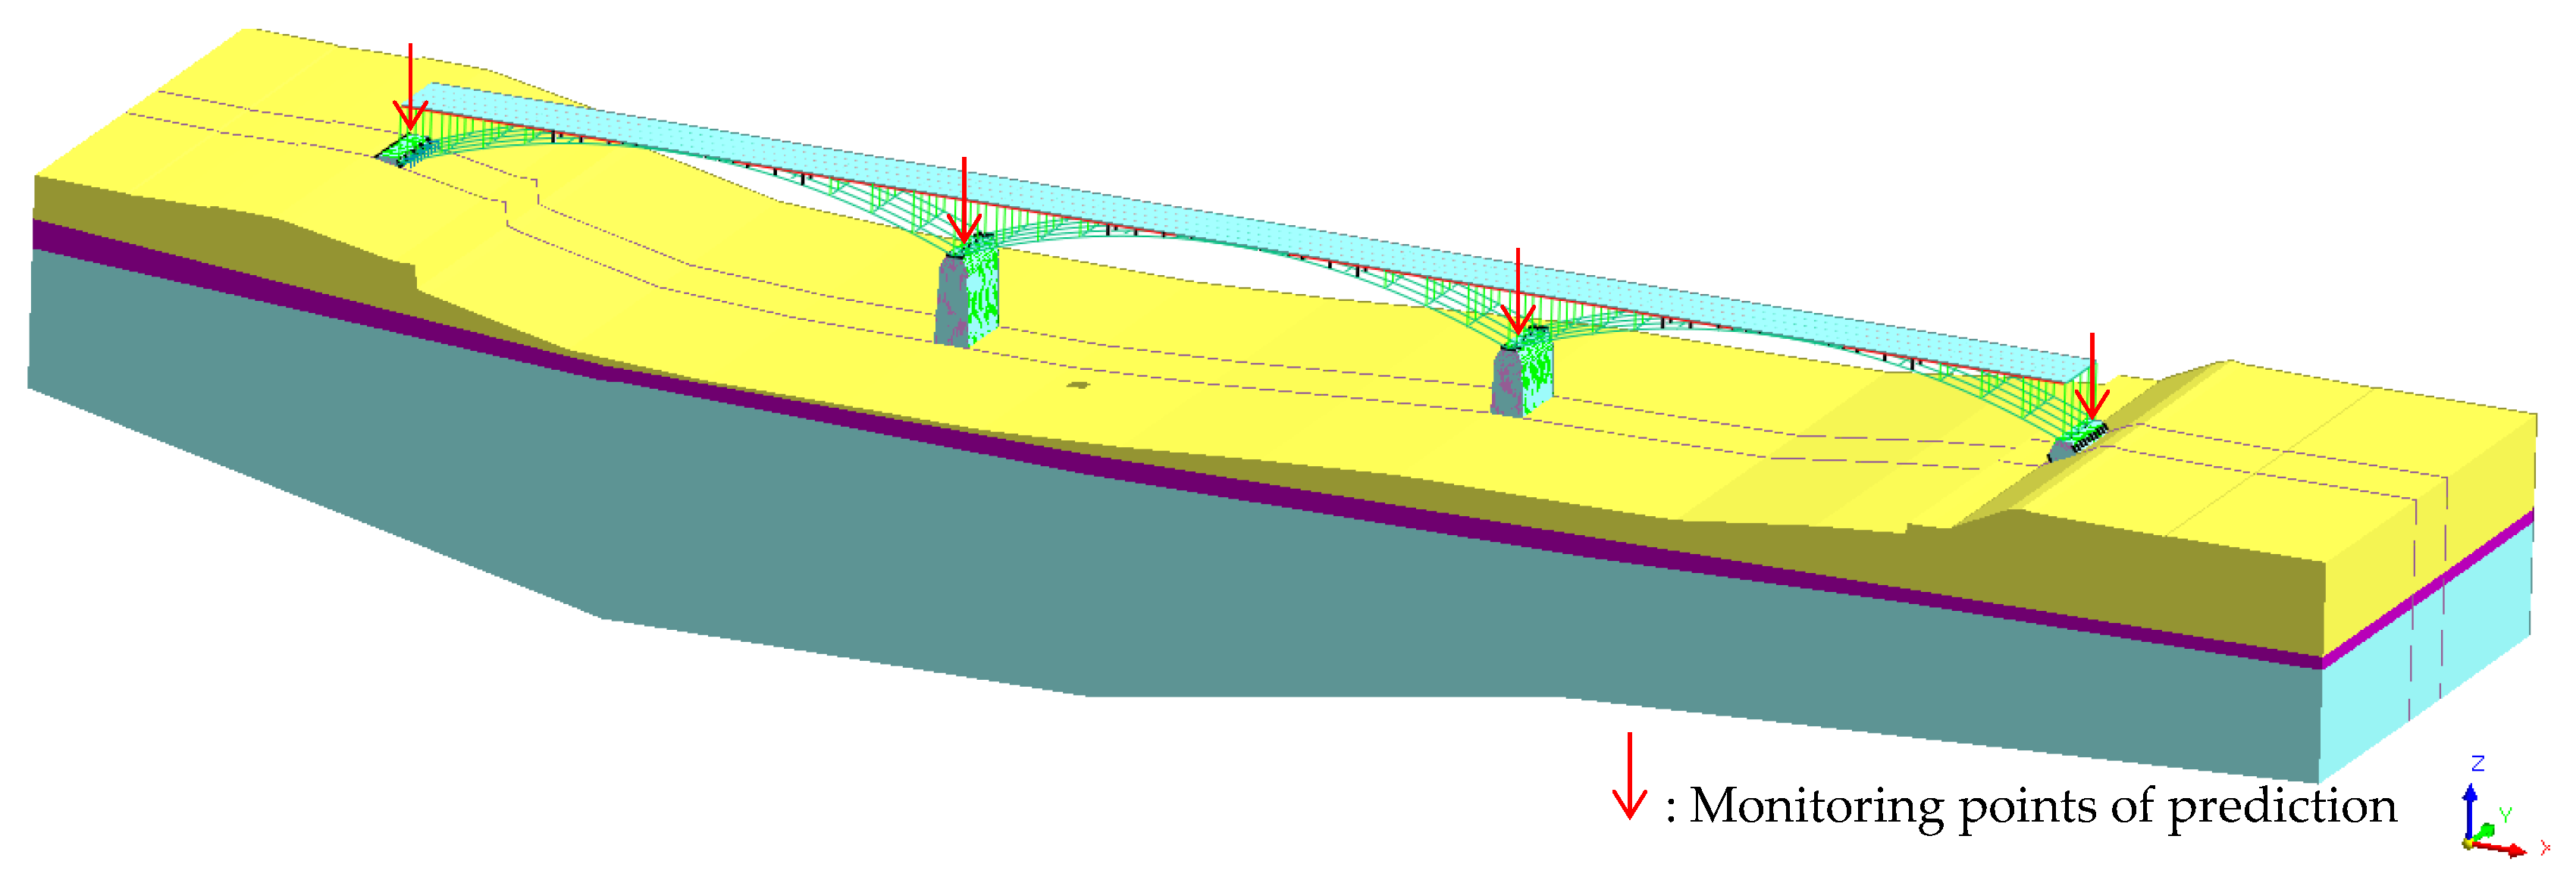
Bridge vibration response data is obtained from the finite element model under the dynamic loads of the impact drilling by Midas GTS. The impacting drilling piles are constructed by an impact drilling machine, relying on the impact force produced by the heavy hammer lifting and falling freely. As the action of the free-falling hammer on the soil layer is a typical pulse load, the dynamic load is considered a pulse triangle dynamic load, loaded at actual positions of the construction machinery in the finite element model. The finite element model, shown in Figure 2, constitutes the existing bridge and the soil foundation. The soil foundation is discretized by 8-node brick linear elements, the 3D element type from the Midas library. The type of the 3D elements is fine enough to obtain an accurate solution. The finite element model adopts semi-infinite space boundary conditions to make the Vibration-induced elastic waves propagate to infinity. The Mohr-Coulomb model is used for the material constitutive model of the rock layers. The calculation parameters of the foundation soil are shown in Table 2. The calculation parameters of the bridge are the same as those in the finite element static analysis model.
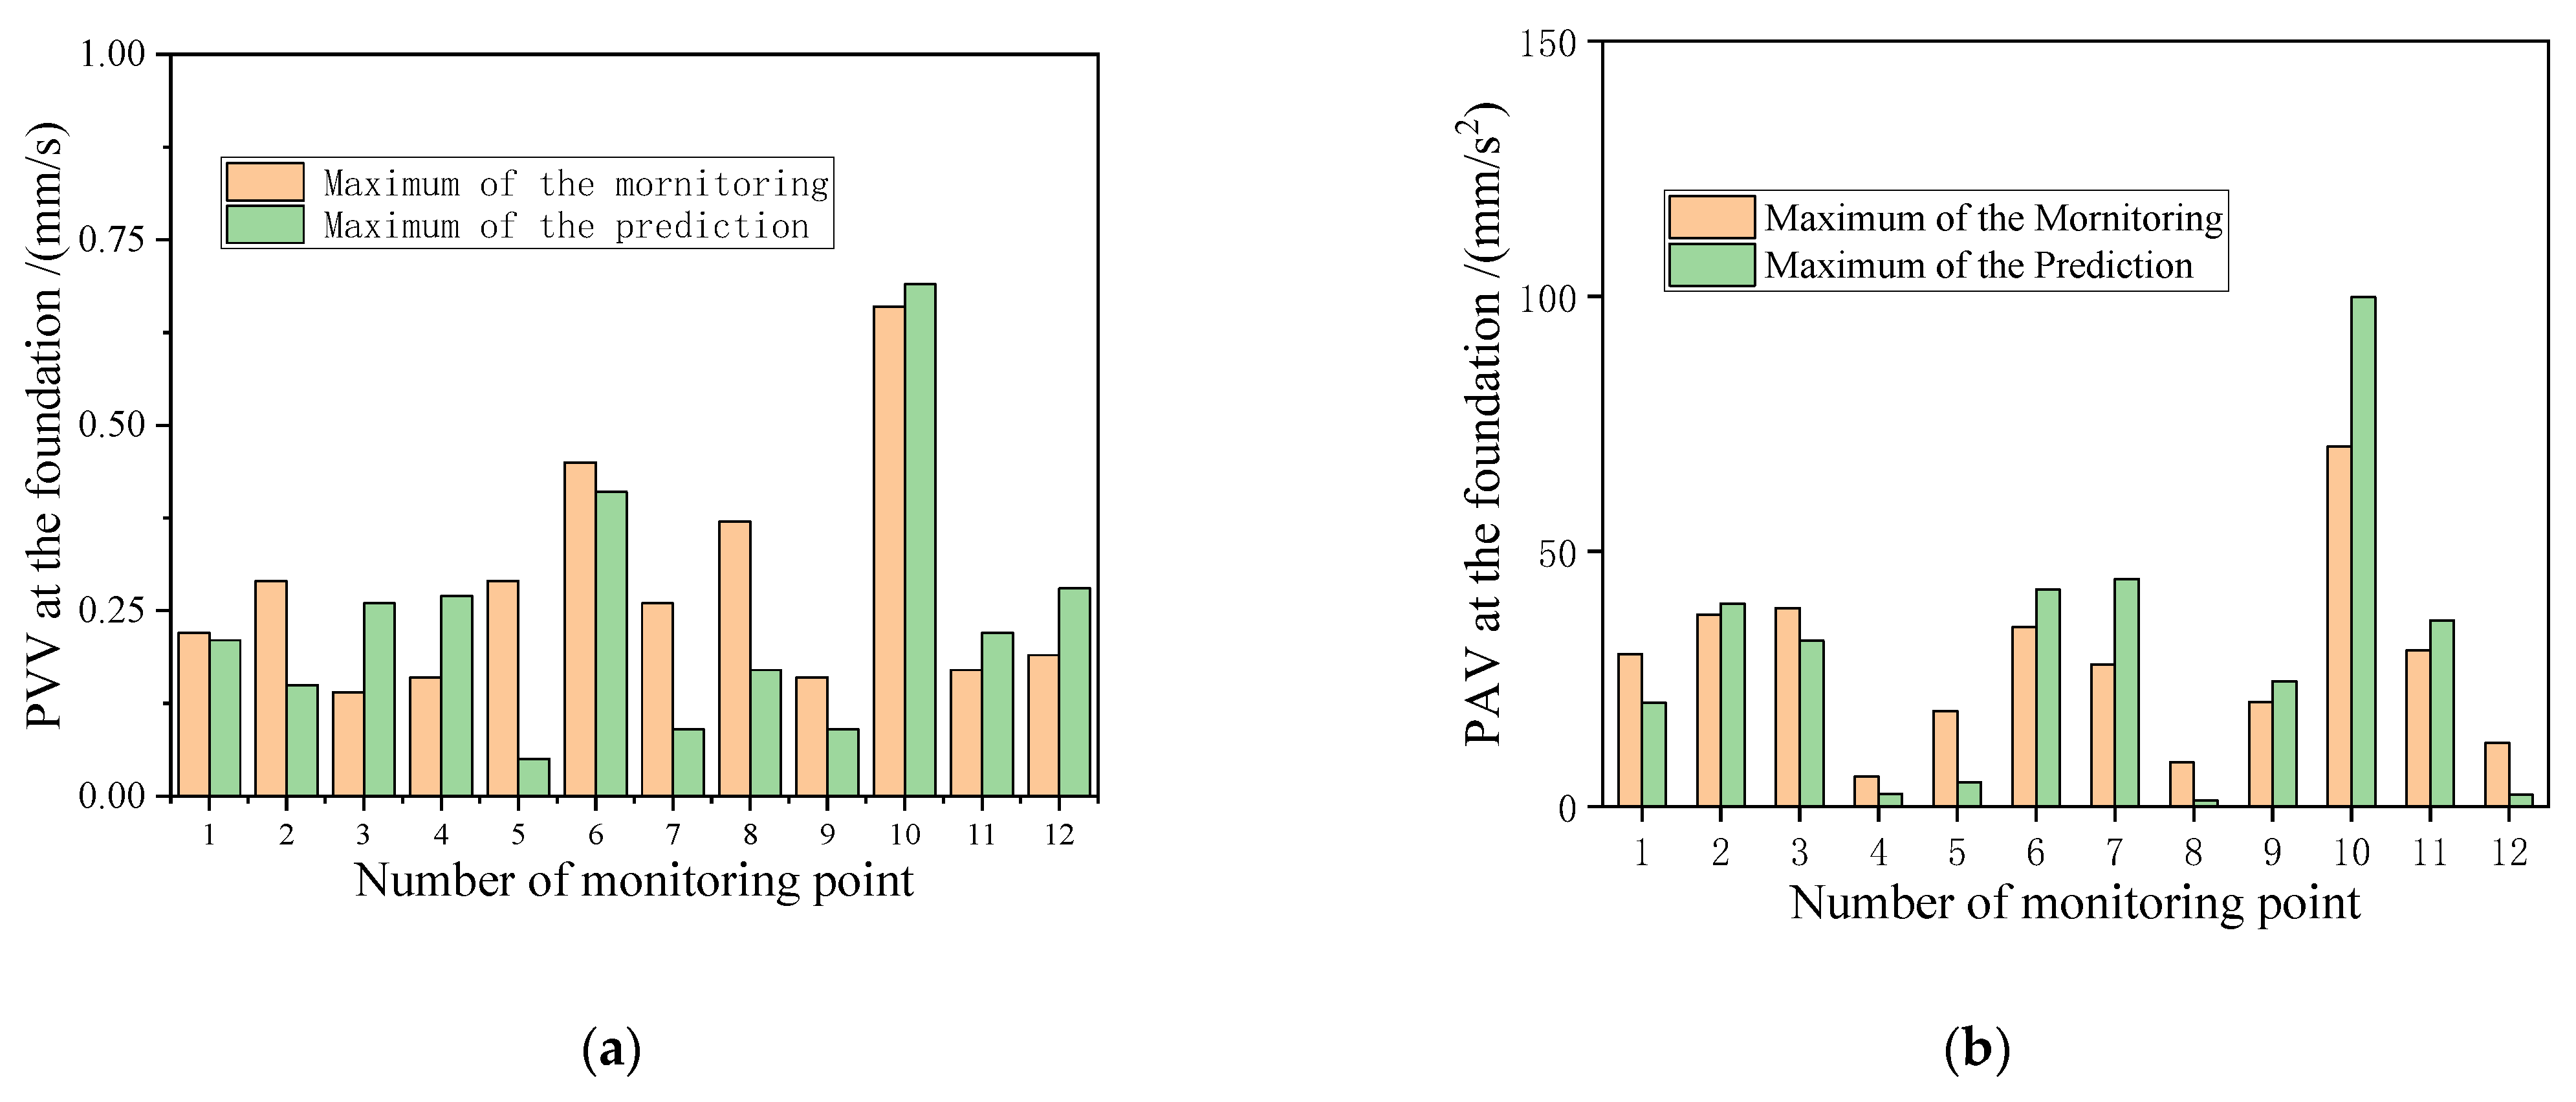
The dynamic simulation is based on the static simulation results for the stress field distribution after zeroing the rock layers’ displacement and velocity fields. According to the actual detailed position of the construction machinery of the nearby construction, the maximum PVA (peak vibration velocity) and PVV (peak vibration acceleration) prediction results are obtained from the finite element model, and the monitoring points of prediction are placed on top of the pier, as shown in Figure 2.

3.3. Strain and Deformation Data from In-Site Static Monitoring

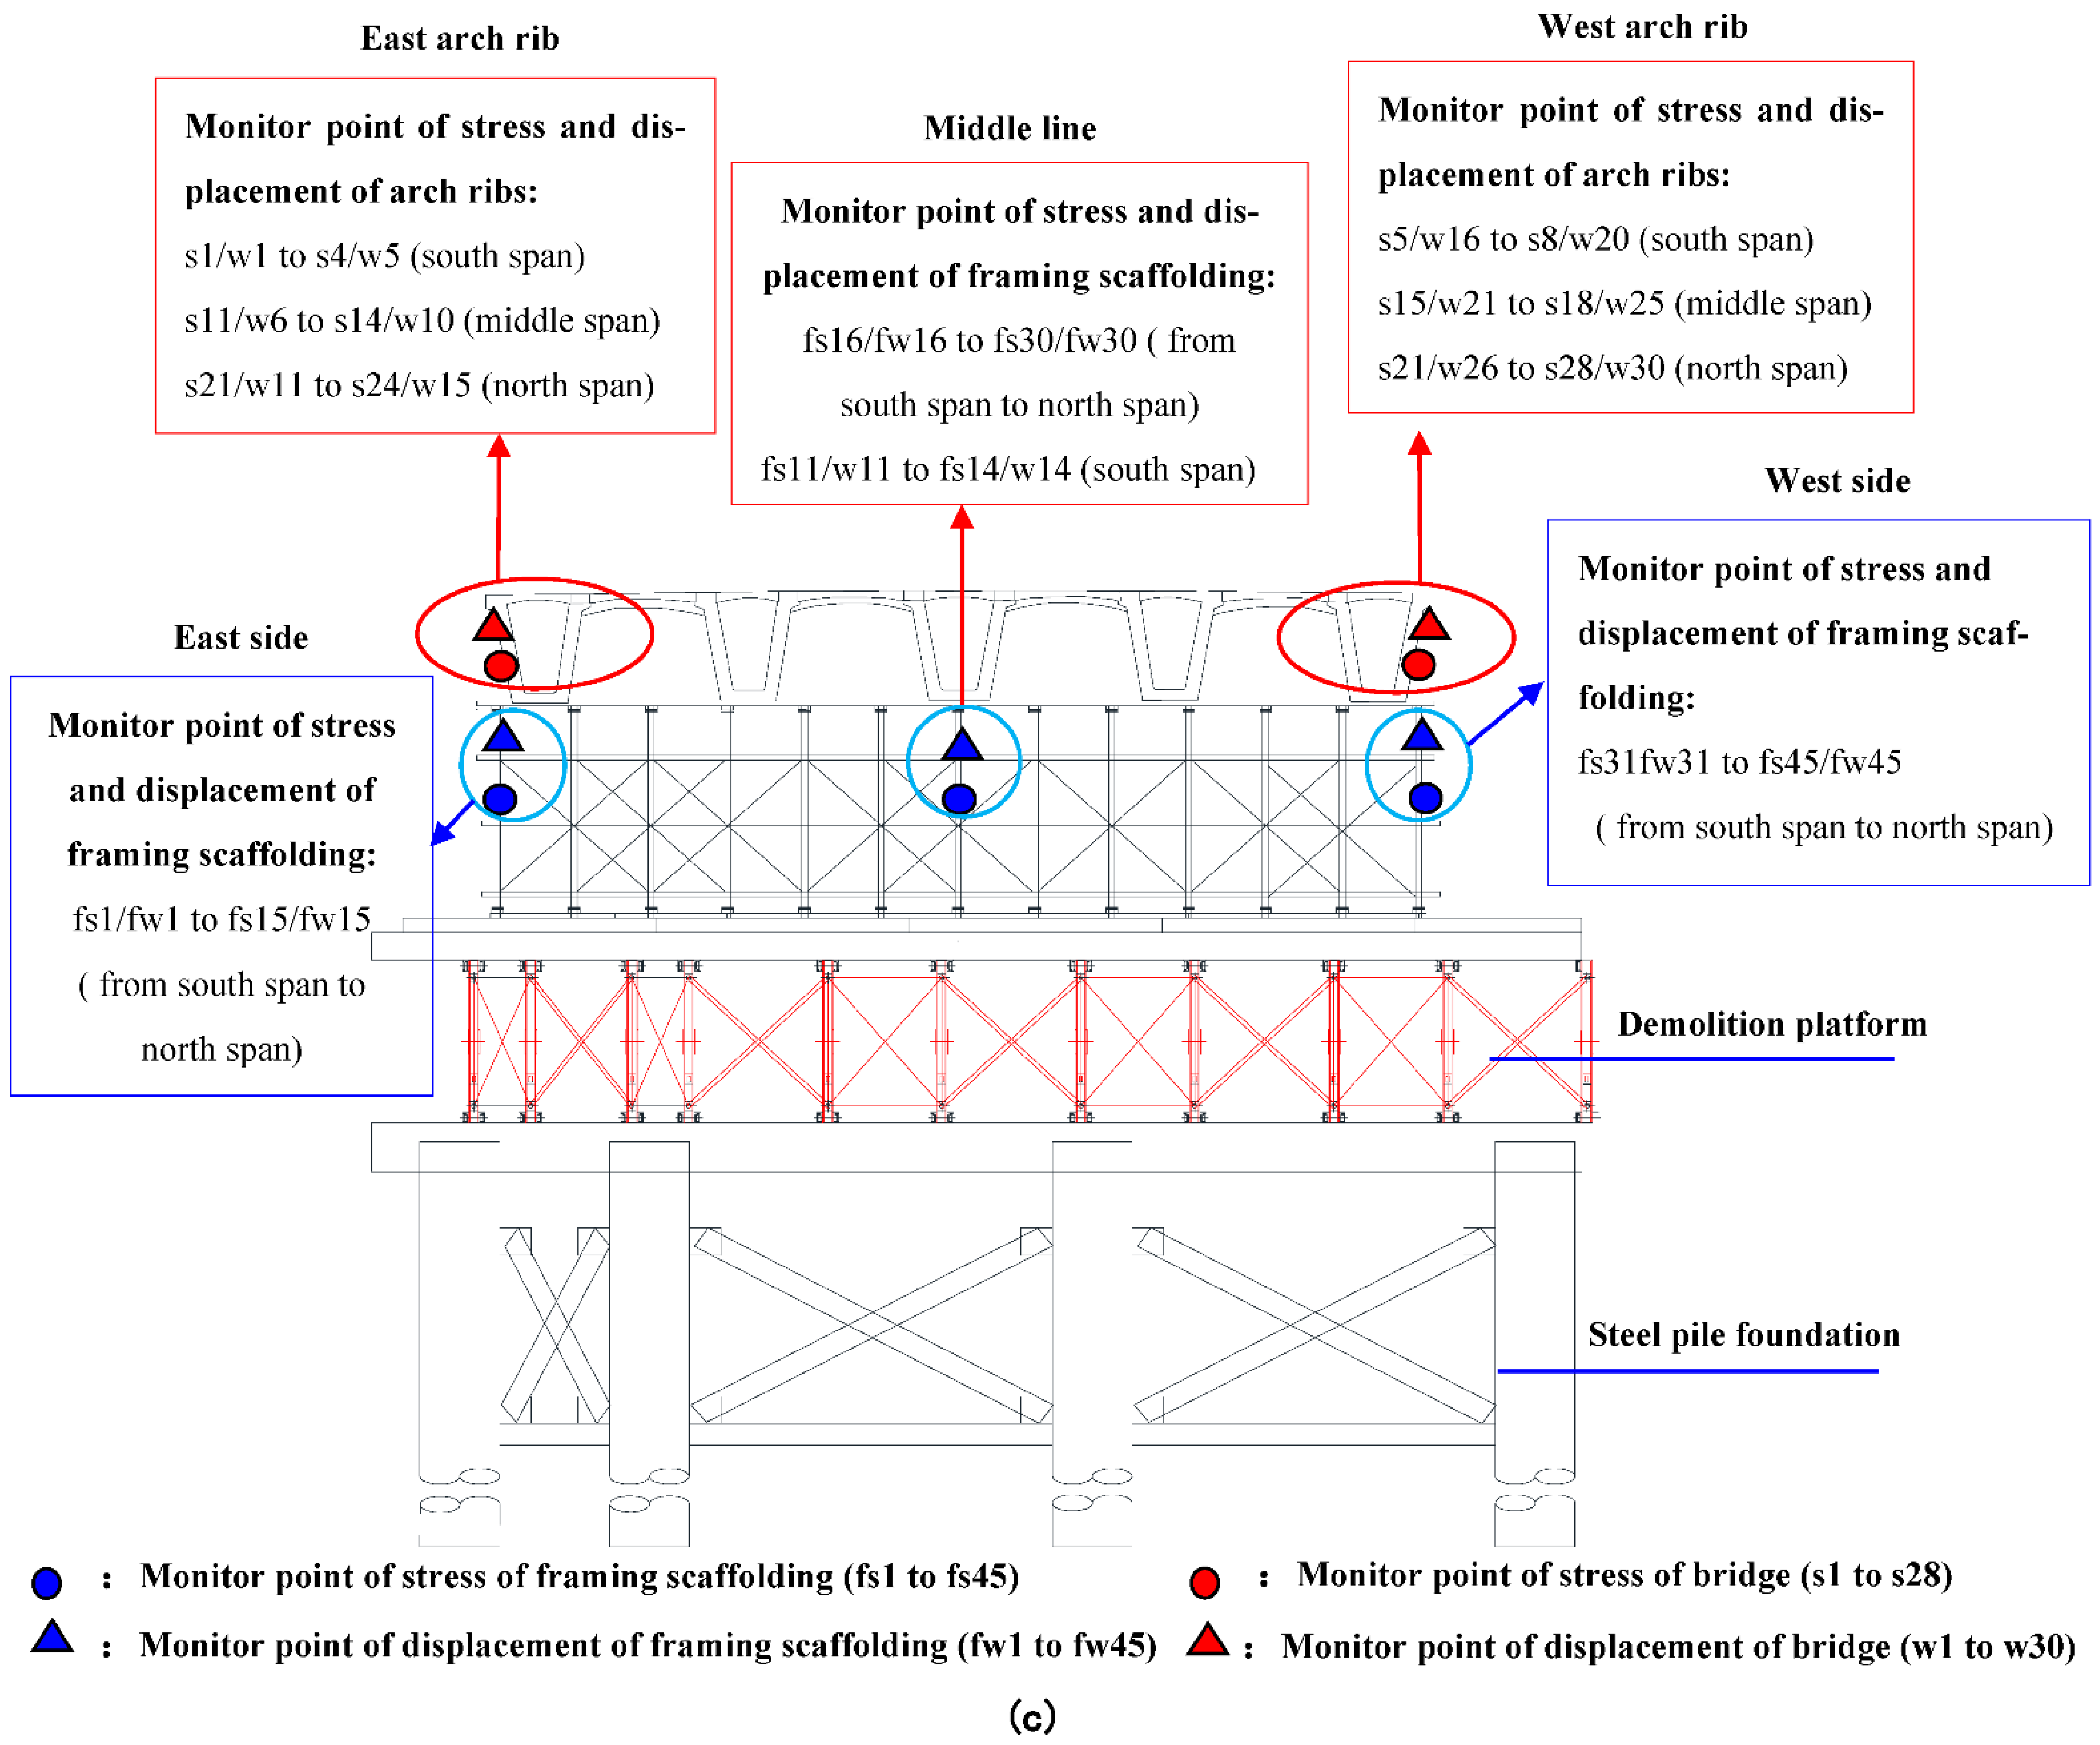
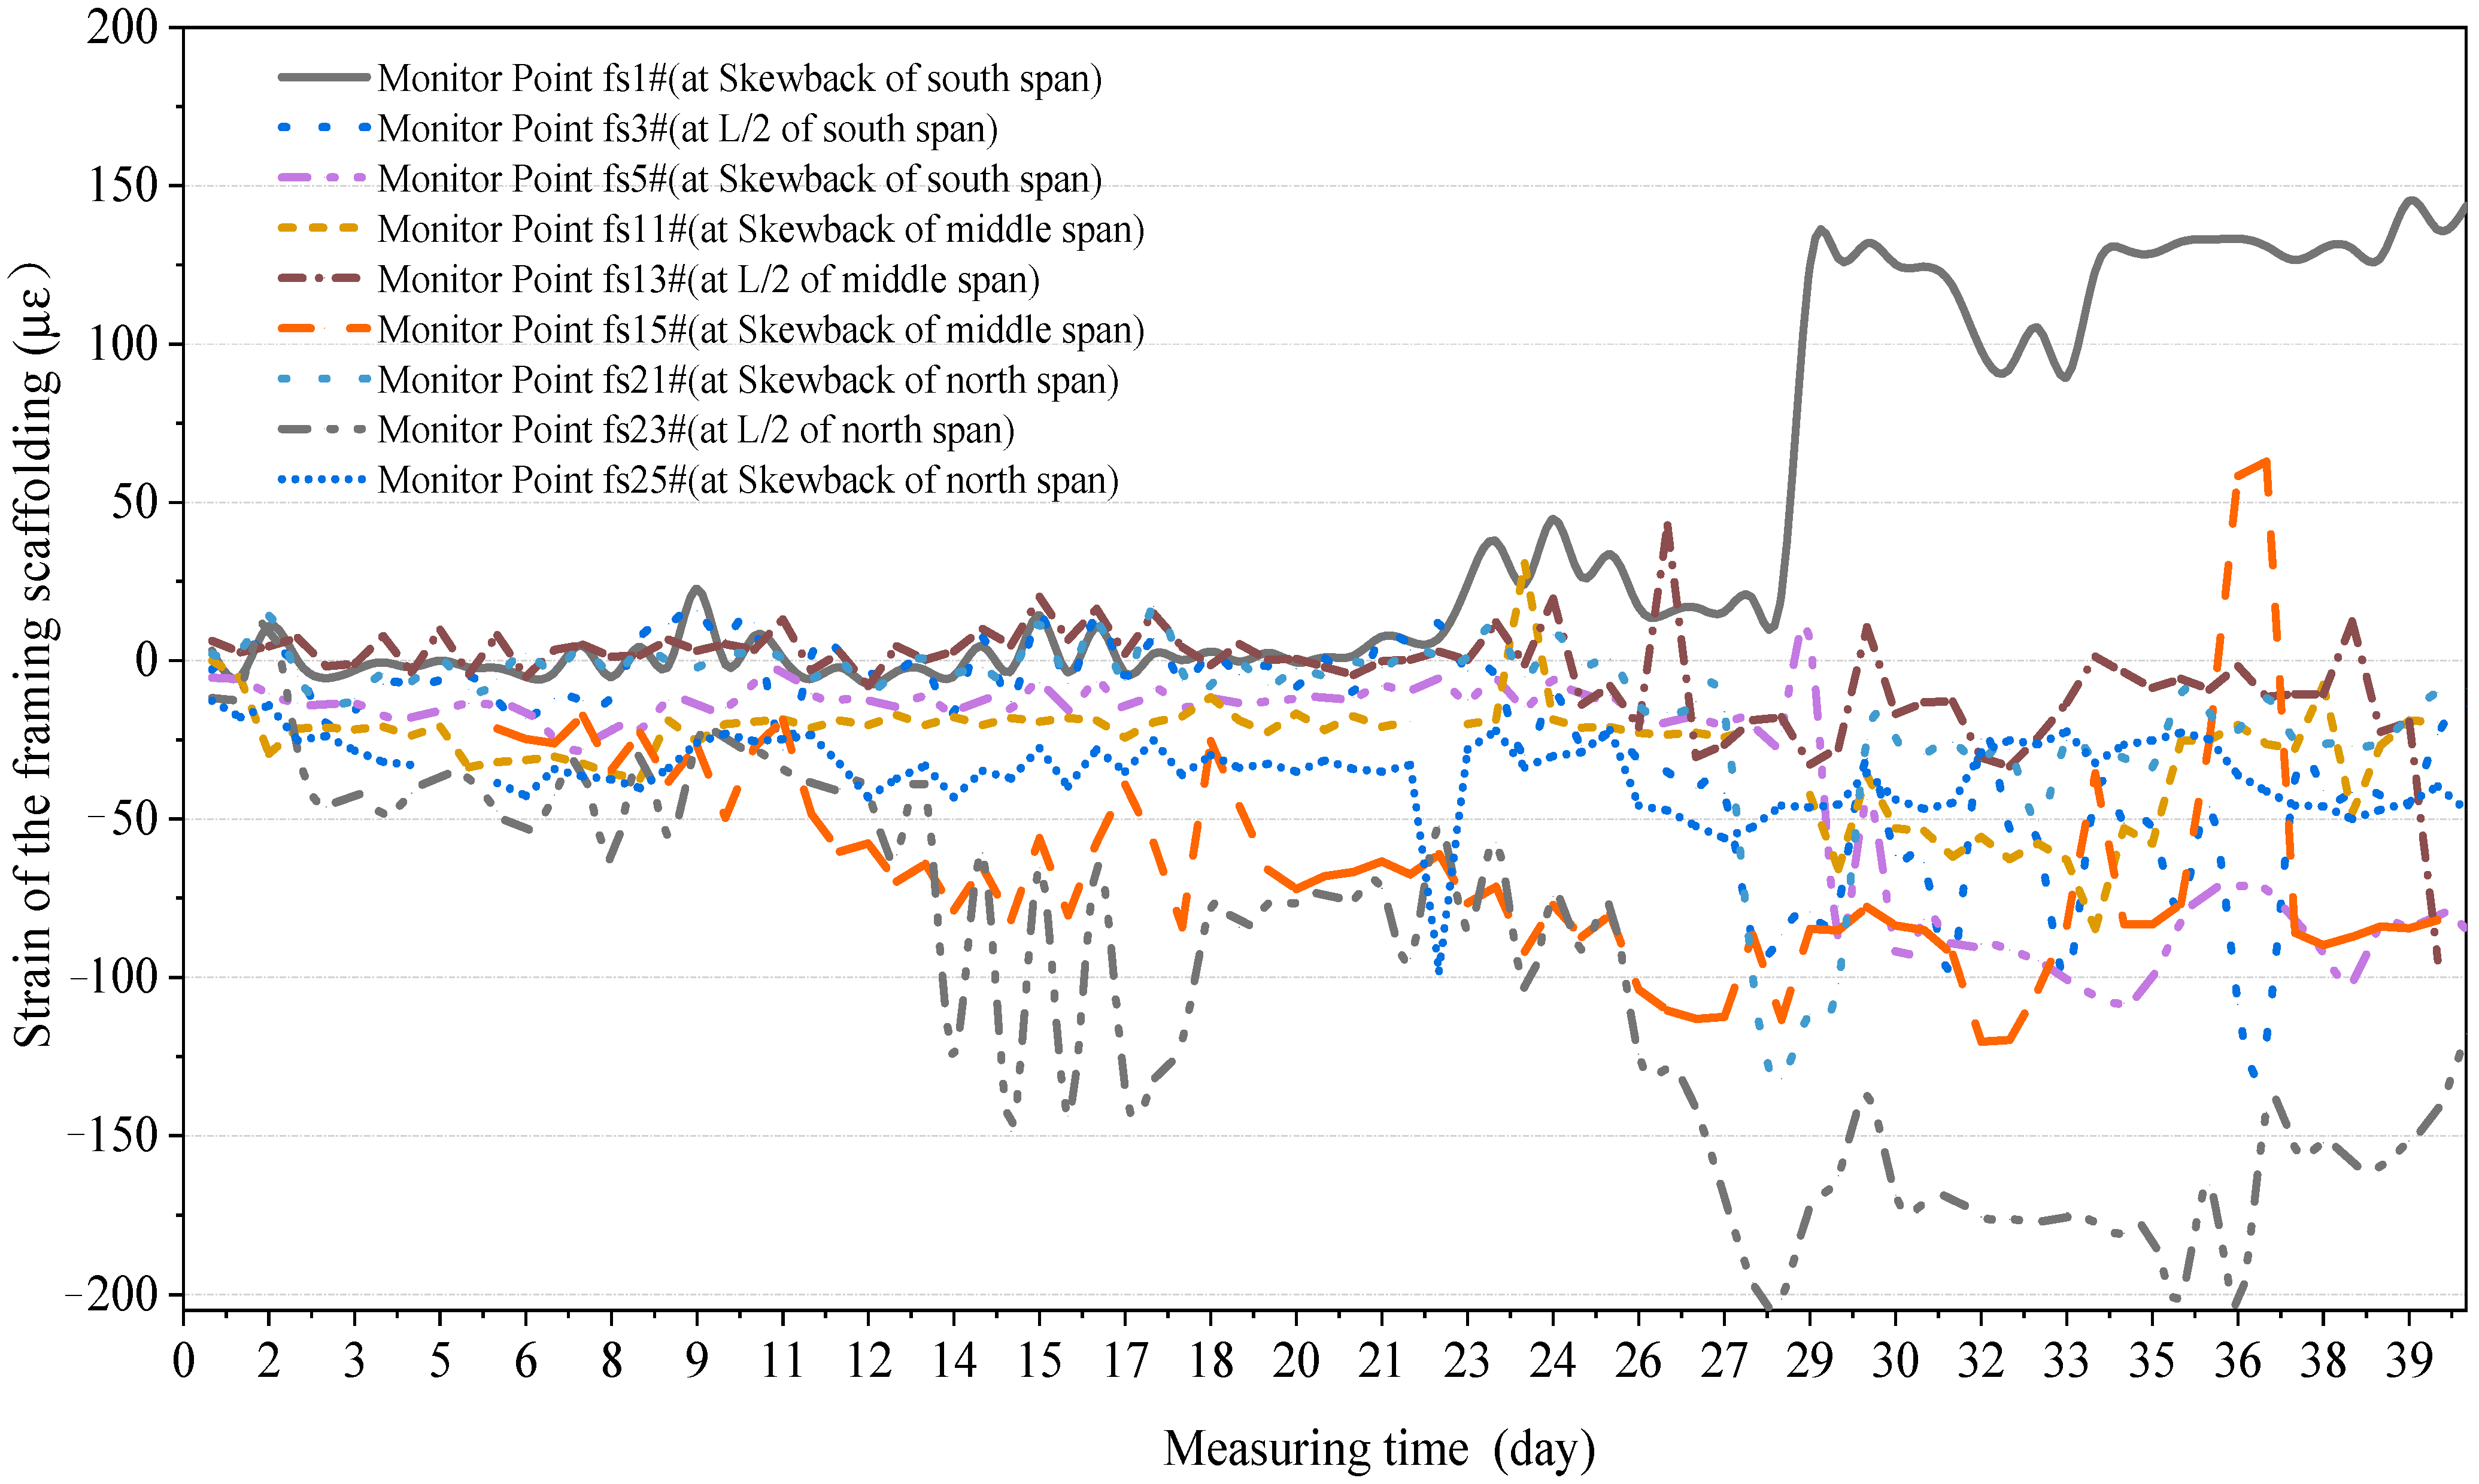
During the nearby construction and demolition construction of the bridge, stress and displacement monitoring directly reflected the changes in the forced state of the bridge structure and temporary structure. Monitoring points were set on the main loaded area of arch ribs and framing scaffolding to avoid sudden construction accidents such as collapse through monitoring stress and deformation.
For a bridge that has been under service for more than 30 years, the structure and material have uncertainty factors, and the data analysis of the stress monitoring point directly adopts strain monitoring value. To ensure consistency, the data analysis of the stress monitoring point of the framing scaffolding also adopts strain monitoring value.
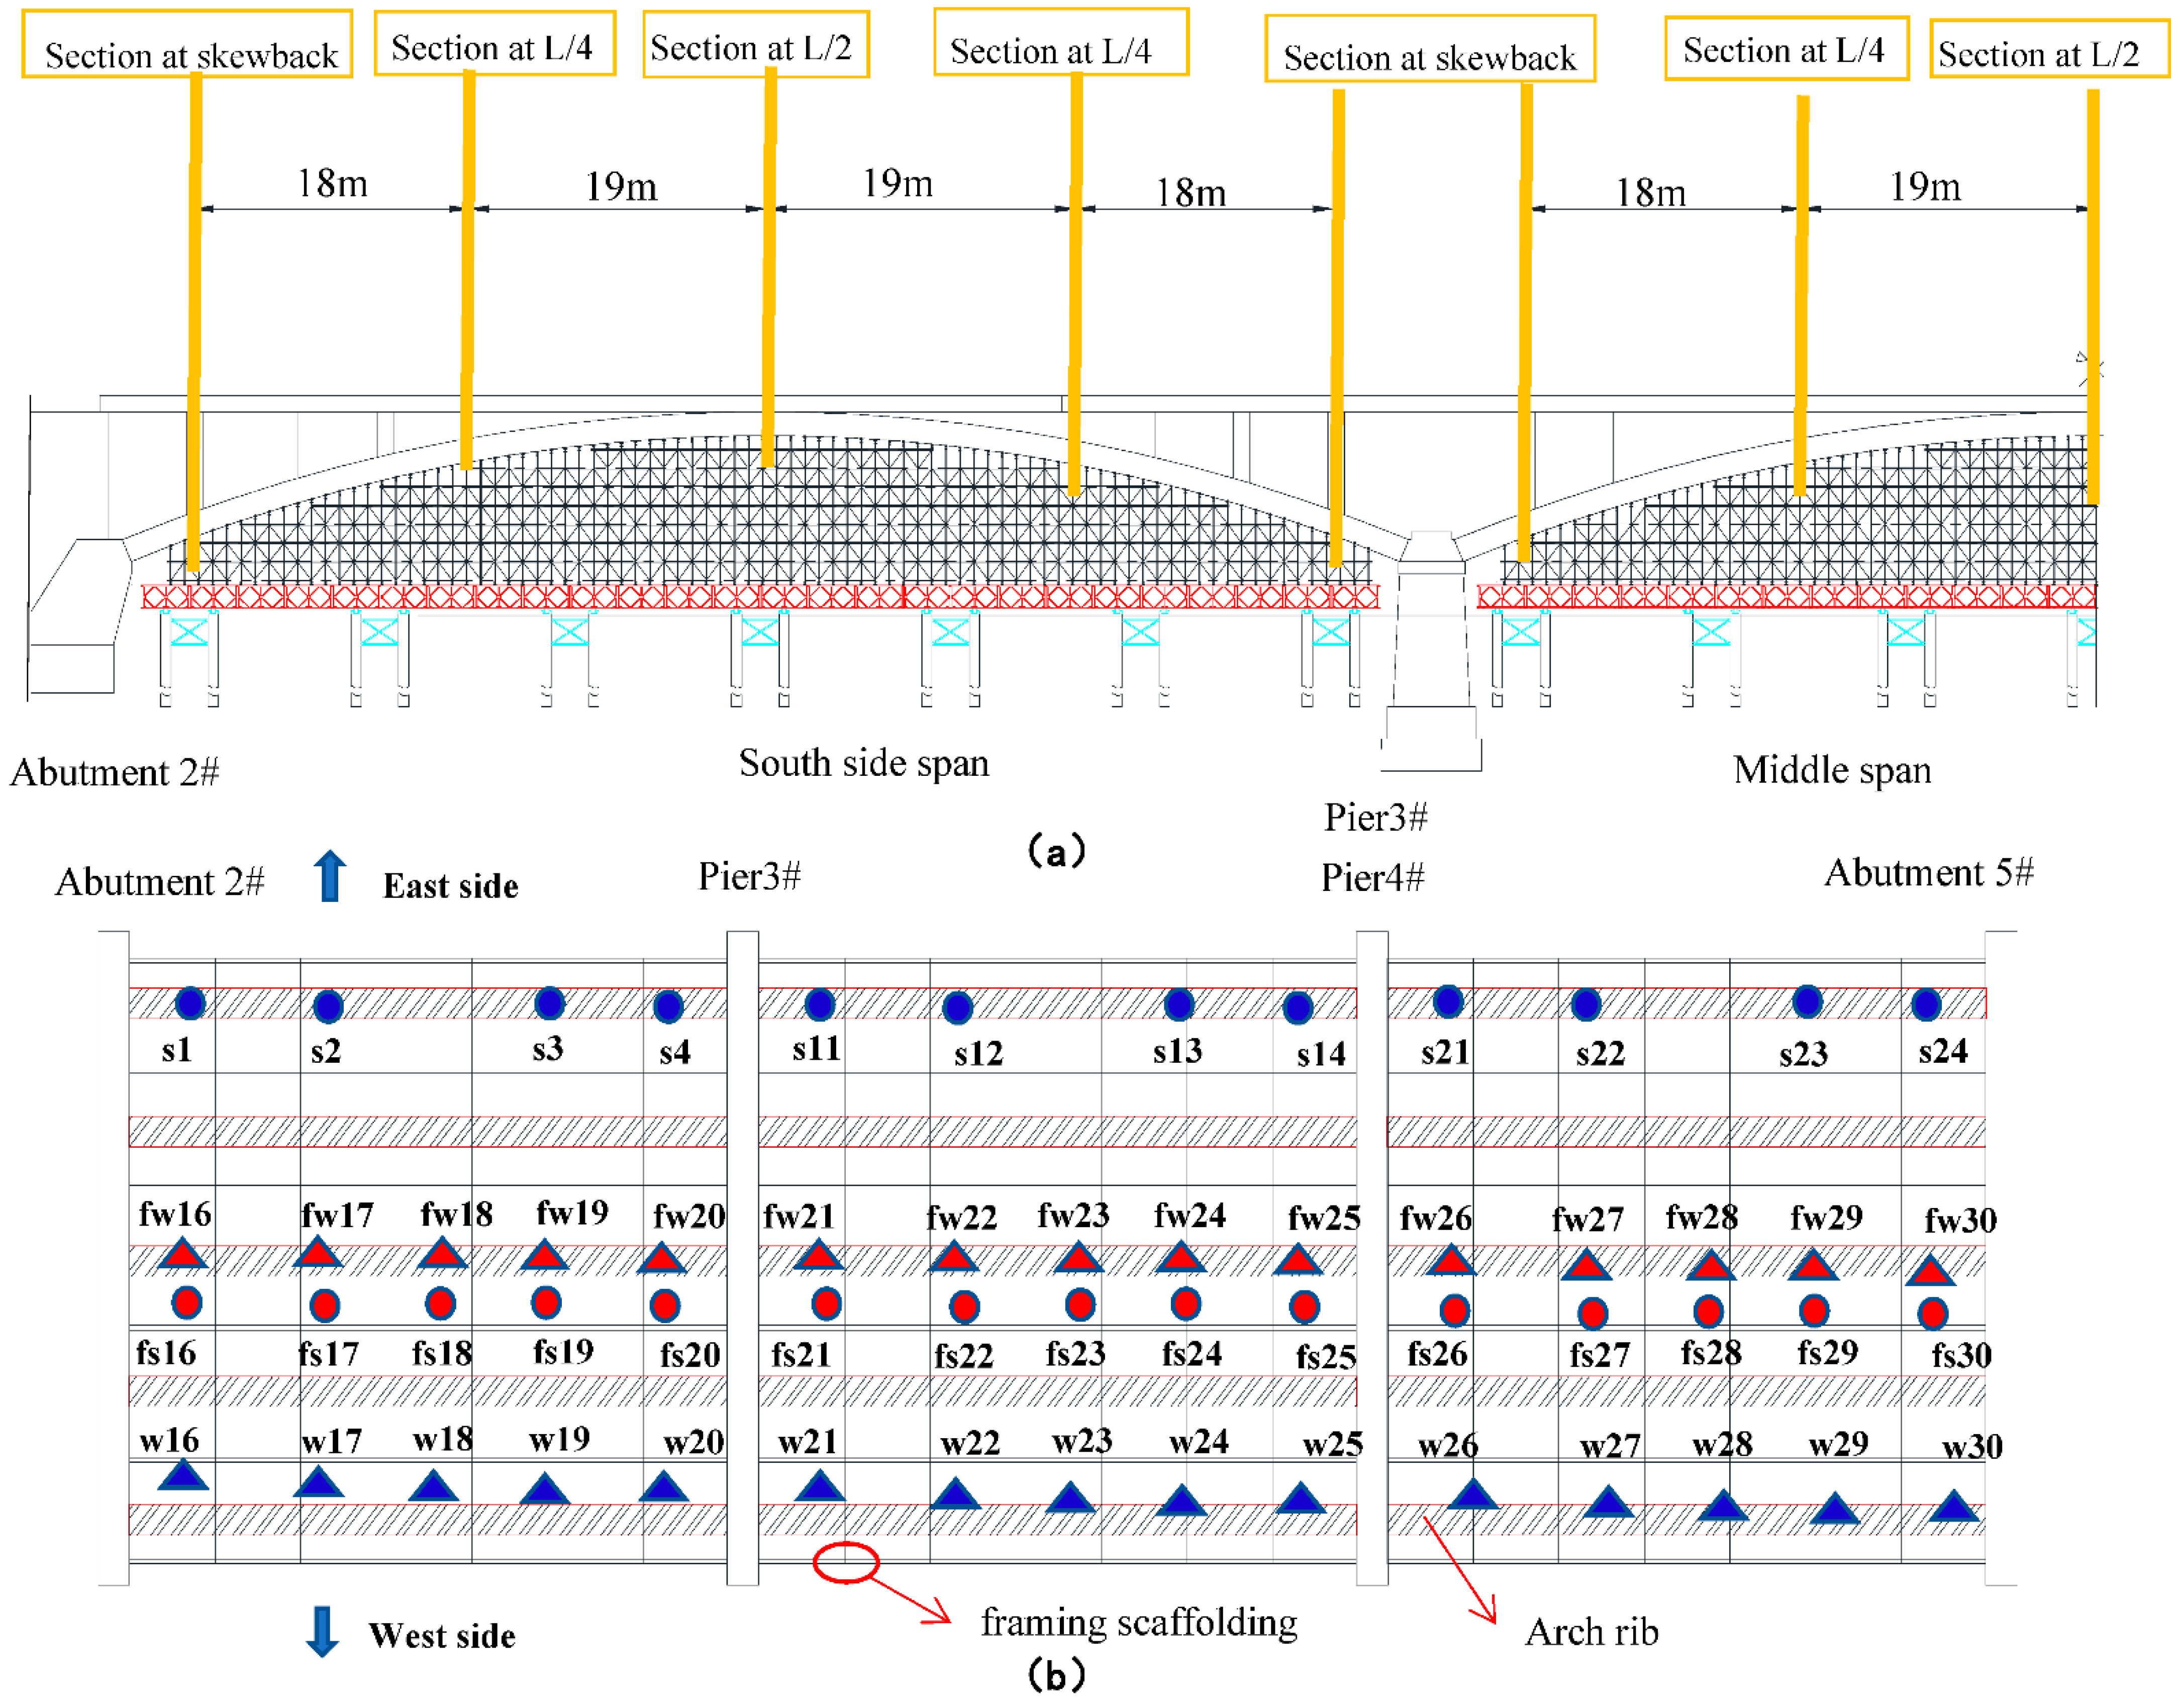
The layout diagram of the stress and deformation monitoring point is shown in Figure 3. The stress monitoring points of the bridge during the nearby construction are arranged on the arch ribs in the section of skewback and L/4 of the south, middle, and north spans. L is the arch span. The displacement monitoring points of the bridge during the nearby construction are arranged on the arch ribs in the section of skewback, L/2, and L/4. The bridge stress and displacement monitoring points during the bridge demolition construction are the same as measuring points in the nearby construction. The framing scaffolding’s stress and displacement monitoring points during the demolition construction are arranged at the top steel pipe in the section of skewback, L/2, and L/4.

3.4. In-Site Measured Bridge Foundation Vibration Response Data

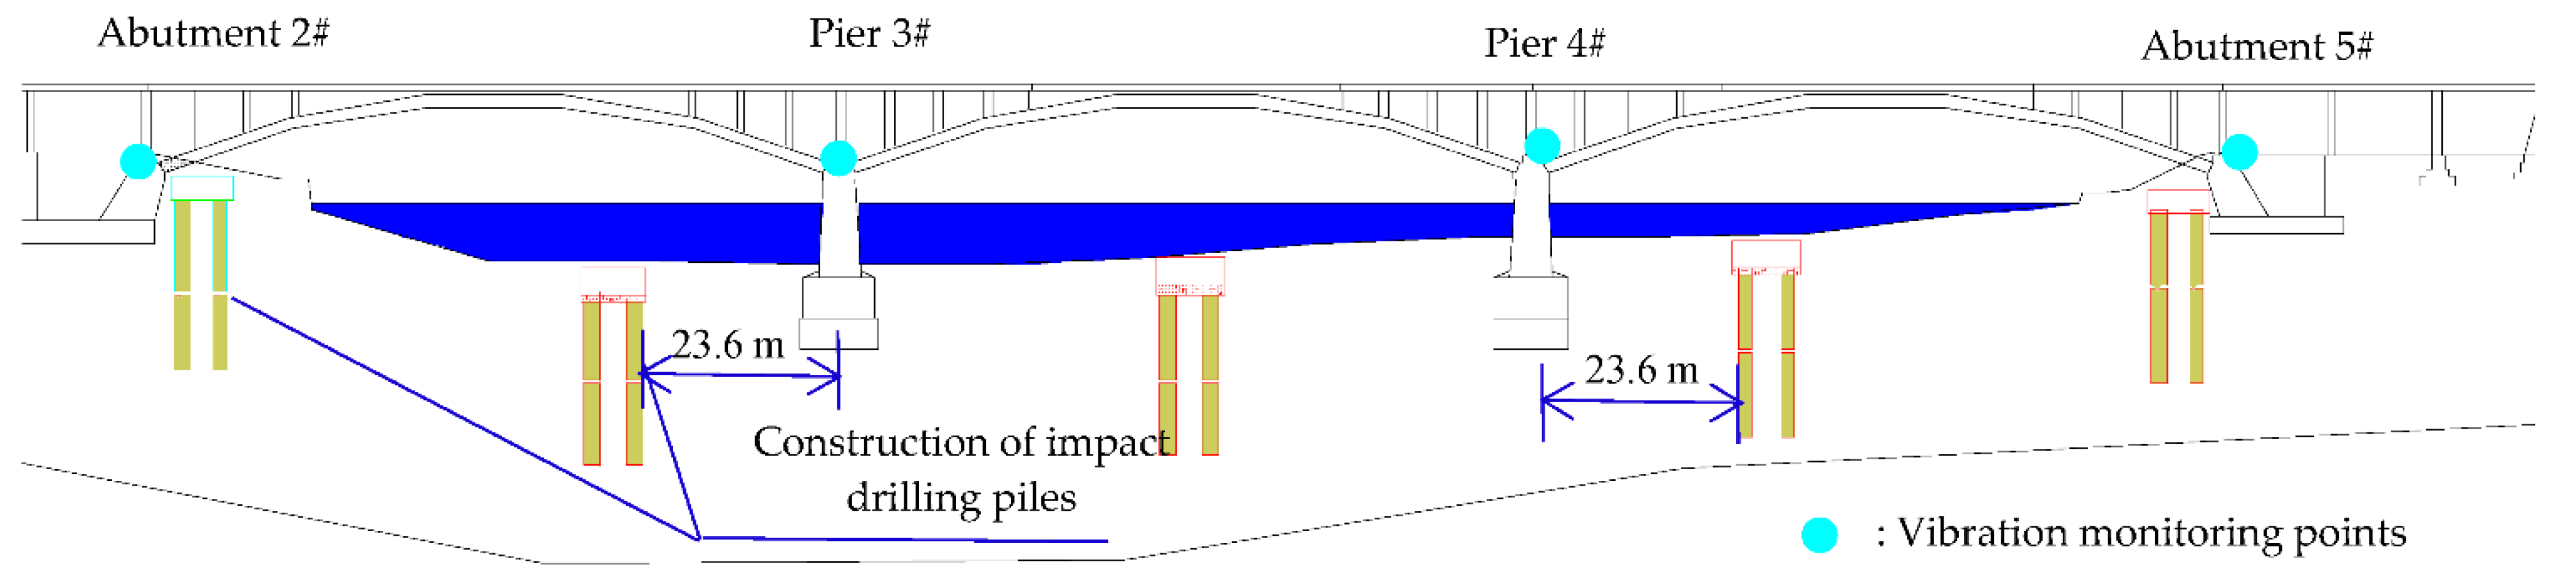
On-site vibration monitors were undertaken at each pier and abutment of the bridge, and the locations of the measuring points at the site are shown in Figure 4. The instruments consisted of 12 ultra-low frequency accelerometers with a maximum range of 20 m/s2 and sensitivity of 0.342 V/(m/s2), 12 ultra-low frequency velocity sensors with a maximum range of 0.6 m/s and sensitivity of 0.336 V/(m/s), 16-channel digital recorders, and a data acquisition system. The frequency range of the ultra-low frequency acceleration and velocity sensors ranges is 0–200 Hz. Three accelerometers (in the vertical, longitudinal, and transverse directions) and three velocity sensors (in the vertical, longitudinal, and transverse directions) are installed for each vibration measuring point. The velocity sensors were magnetoelectric. The magnetoelectric sensors transform the vibration signal into a voltage signal, which is proportional to the vibration velocity value. The output signal is directly proportional to the vibration velocity, which can measure the vibration with good flexibility.
During the construction of the impact drilling piles, the vibration response of the bridge’s foundation caused by the impact hammer machines operated at the construction position of the impact hammer machines was measured by real-time monitoring.
Three accelerometers (in the vertical, longitudinal, and transverse directions) and three velocity sensors (in the vertical, longitudinal, and transverse directions) were installed for each vibration measuring point. During the construction of the impact drilling piles, the vibration response of the bridge’s foundation caused by the impact hammer machines operated at the construction position of the impact hammer machines was measured by real-time monitoring.

4. Assessment Method

4.1. Hierarchical Division of Comprehensive Assessment of Bridge Safety Status

The health monitoring system of the bridge in service usually collects the environment and structural response information in real-time to record the structural changes caused by damage or degradation. The early warning can be issued in a predetermined manner when evaluation indexes such as load and structural response exceed a predetermined early warning threshold. The health monitoring system of the bridge usually collects huge numbers of long-term monitoring data, while the monitoring data obtained during construction is often short-term and reduced. During construction, the bridge safety monitoring needs to be judged quickly through short-term monitoring data gained in construction. A single index cannot easily evaluate the safety of the bridge structure in construction conditions.
Hence, the analytic hierarchy process is used to analyze the multi-source data and determine the early warning threshold of a comprehensive assessment of bridge safety status. During the nearby temporary construction, the stress and displacement of the main arch rib, the vibration acceleration and velocity of the foundation, and the observation of abnormal status, are taken as the indexes for comprehensive bridge assessment of bridge safety status, as shown in Figure 5. The purpose of assessing the vibration response of the foundation is to prevent harmful effects caused by the surrounding construction vibration. In addition, the observation of abnormal status is used to timely correct and optimize the early warning threshold according to the changing appearance state of the environment and the structure.
The comprehensive assessment of bridge safety status in the demolition process is shown in Figure 6. The stress and displacement of the main arch rib are the two evaluation factors announcing the direct response of the structure state. The safety of the framing scaffolding is also crucial for the demolition of the construction, so the stress and displacement of framing scaffolding are also included in the comprehensive assessment of bridge safety status.
The assessment steps are listed as follows [25]: first, consider the stress characteristics of the structure and the influence of the surrounding construction to set the weight of each evaluation index and evaluation criteria, and then score each index according to the evaluation criteria. Finally, the total score is calculated according to the weight. At last, the early warning threshold is given according to the total score of the evaluation criteria. The early warning threshold includes red, orange, yellow, and blue warning thresholds.

4.2. Setting of the Evaluation Weights

By the TELFE expert evaluation method [27], the weighted index of assessment factors of the comprehensive evaluation system of the bridge during the nearby construction is shown in Table 3. In Table 3, the weight index of the assessment factors for the AHP was obtained according to the evaluation scale for the AHP, which was assigned the parameters to rate the relative importance of each pair of input data layers [28,29]. For example, the assessment factor a 2 has double preference over assessment factor a 1 , and assessment factor a 1 has half priority compared to the assessment factor a 2 . As experts consider that the influence of construction vibration on bridge safety is similar to seismic wave input, and monitoring the strain on the bridge during nearby construction is difficult to distinguish the accurate relationship between test strain value and theoretical value for the vehicle load and the structure parameters of the bridge are difficult to identify accurately. Therefore, the weight index of PVA (peak vibration velocity) and PVV (peak vibration acceleration) of the foundation are higher than the weight index of strain, and the observation of abnormal status has a certain lag in identifying the structural status of the bridge in time, so the weight index of observation of abnormal status is the lowest. The pairwise comparison matrix c was developed from Table 3 for the AHP.
To derive the normalized matrix for the AHP, the matrix element of the pairwise comparison matrix c was divided by its column total [29], and the normalized weights obtained from the normalized matrix were shown in Table 4.
To avoid contradictions concerning the importance of each evaluation index, the consistency test should be conducted to determine whether the degree of inconsistency can be accepted. The consistency test of the judgment matrix for the AHP is as follows [25]:
λ m = 1 n 1 n ( c ω ) i ω i = 5.2192
where λ m is the maximum eigenvalue; n is the assessment factor number; c is the matrix of pairwise comparisons between assessment factor a i and assessment factor a j , shown in Table 1; ω is the eigenvector of c ; ω i is the weight vector obtained from the normalizing matrix c , shown in Table 2.
C I = λ m N N 1 = 5.2192 5 5 1 = 0.0548
where C I is the consistency index; λ m is the maximum eigenvalue; N is the weight vector obtained from the normalizing matrix.
When N = 5 , R I = 1.12 , R I C I = 0.0458 0.1 , R I is the random index depending on the number of elements. The judgment matrix meets the full consistency condition, so Table 2 can be used as an evaluation weight index.
Similarly, the weight indexes of comprehensive evaluation during demolition construction were obtained by the TELEF expert evaluation method, as shown in Table 5. The normalized weights obtained from the normalized matrix are shown in Table 6.

4.3. Score Criteria of Each Assessment Factor

The stress generated by self-weight load has already existed in the arch ribs, and the exact value of the stress of self-weight load can not be measured. Therefore, by finite element model calculation, the strains generated by the designed vehicle load, the foundation settlement with 10 mm (foundation settlement of design), and the whole bridge cooling at 10 °C are shown in Table 7. The score criteria of monitoring data of strain of arch ribs are set according to the finite element static analysis result in Table 7 in the following contents. If the maximum monitoring strain of the arch rib is between the compression strain and tensile strain generated by the designed vehicle load, the evaluation score S 1 is given 100, and if the maximum monitoring strain ε s is below the strain of the design value of tensile strength of the arch concrete, the evaluation score S 1 is given 30, the entire score criteria of monitoring data of strain of arch ribs are given in Equation (3).
S 1 = { 30 ,   ε 124   μ ε 60 ( ε 84.0 ) / 2 ,   84 ε 124   μ ε 90 2 × ( ε 39 ) / 3 ,   39.6   μ ε ω < 84.0   μ ε 100 ,   65.7   μ ε ε < 39.6   μ ε 90 + ( ε + 65.5 ) / 3 ,   155.5   μ ε ω < 65.7   μ ε 60 + ( ε + 155.5 ) ,   ε 155.5   μ ε
where ε s is the maximum monitoring strain of the arch rib, and 124 μ ε is the strain of the design value of the tensile strength of the arch concrete.
For the evaluation of the displacement monitoring of the bridge, displacement induced by all possible loads except self-weight load is calculated. The displacement generated by vehicle load is 8.5 mm, the displacement generated by the action of the whole bridge cooling at 10 °C is 18.2 mm, and the total two displacements are 26.7 mm. Since the above loads are the most occurred load type during nearby construction, the evaluation score S 2 of monitoring data of displacement of the bridge foundation is given in Equation (4).
S 2 = { 60 ( ω 26.7 ) ,   ω 26.7   mm 90 ( ω 6.7 ) × 1.5 ,   8.5   mm ω < 26.7   mm 100 ,   ω < 8.5   mm
As well as the basic seismic intensity of the location of the bridge is 6 degrees, and the PGA (peak ground acceleration) is 0.05 g in the China Code for the seismic design of the bridges (CJJ166-2011) (2011) [30]. Therefore 500 mm/s2 (value of 0.05 g) and 250 mm/s2 (half value of 0.05 g) is referred in evaluation score S 3 of monitoring data of PAV (peak vibration acceleration) of bridge foundation in Equation (5).
S 3 = { 60 ( P V A 500 ) ,   P V A 500   mm / s 2 90 ( P V A 200 ) / 10 ,   250   mm / s 2 P V A < 500   mm / s 2 90 ,   A p < P V A < 250   mm / s 2 100 ,   P V A < 250   mm / s 2   and   P V A < A p
where A P is the maximum PVA from the prediction result of the finite element model.
As the bridge with many existing defects is a prefabricated structure that cannot maintain the integrity of the whole bridge at the age of 30, the bridge is thus classified as a building sensitive to vibration. The allowable peak vibration velocity of buildings sensitive to vibration is 1.5 mm/s in the “Building Engineering Allowable Vibration Standards” (GB50868-2013) [31]. The evaluation score S 4 of monitoring data of PVV of bridge foundation is given in Equation (6).
S 4 = { 60 ( P V V 1.5 ) × 100 ,   P V V 1.5   mm / s 90 ( P V V 0.5 ) × 300 ,   0.5   mm / s P V V < 1.5   mm / s 90 ,   V p < P V V < 0.5   mm / s 100 ,   P V V < V p
where V P is the maximum PVV from the prediction result of the finite element model.
To assess the observation of abnormal status during the nearby construction, the evaluation score S 5 of the observation of abnormal status is given in Equation (7), and the BCI (Bridge Condition Index) in the Maintenance Specifications (CJJ 99-2017) [32] is quoted in Equation (7).
S 5 = B C I = B C I m · ω m + B C I s · ω s + B C I x · ω x
where B C I m , B C I s , B C I x are bridge condition index of the deck system, superstructure, substructure; ω m , ω s , ω x are the weight index of the deck system, superstructure, substructure [32].
The evaluation score S 1 and S 2 regarding monitoring data of bridge strain and deformation during the bridge demolition is referred to as the scoring standard of the old bridge during nearby construction. The evaluation score S 3 of monitoring data of framing scaffolding stress is given in Equation (8).
S 3 = { 60 ( ε s 750 ) × 100 ,   ε s 750   μ ε 100 4 ε s / 75 ,   0 ε s < 750   μ ε
where ε s is the maximum monitoring strain of framing scaffolding, and 750 μ ε is the allowable strain of the allowable stress of the steel pipe of framing scaffolding.
The evaluation score S 4 of monitoring data of framing scaffolding deformation is given in Equation (9), referring to the scaffolding safety code (JGJ 130-2011) [33].
S 4 = { 60 ( ω s 10 ) × 100 ,   ω s 10   mm 100 4   ω s ,   0 ω s < 10   mm
where ω s is the maximum monitoring deformation of framing scaffolding, 10 mm is the allowable deformation in the Scaffolding Safety Code.

4.4. Total Score Criteria

The multi-source data is analyzed according to the evaluation’s weight and scoring criteria mentioned above, the total score S of the bridge’s status during the adjacent construction and demolition construction are given in Equation (10).
S = 1 n S i ω i
where S i is the score of each evaluation index, ω i is the weight of each index.
The early warning thresholds are finally given in Table 8 according to the grade of the total score.

5. Assessment Results

5.1. Safety Status Assessment of the Nearby Construction

Take the first month of the nearby construction as an example. The multi-source data of the bridge safety monitoring is analyzed according to the above-mentioned method. In the first month, the number of impact drilling machines was 4–7. The nearby construction effect on the older bridge was greatest, for after this month, the machine number declined to 2–3. To briefly prove the method proposed in this paper, the results only plotted the data of the monitoring points on the east side of the bridge. Figure 7 shows the monitoring results of the strain on the arch ribs of the middle and side spans. Figure 7 shows the strain values from −100 and 100. Figure 8 shows the temperature monitoring results of the main arch ribs of the middle and side span, respectively, where the highest temperature difference for the same day is from 10 to 20 °C, close to the assessment of the effect of temperature in the previous section.
Figure 9a shows the vertical deformation monitoring result of the main arch ribs. Figure 9b shows the longitudinal deformation monitoring result of the main arch ribs. The maximum vertical displacement is between 10 and 28 mm, which is higher than the total displacement of the finite element model induced by live load and temperature action of the whole bridge increasing by 10 °C. The changes in the bridge’s material performance and geometric parameters may cause inaccurate calculation results of the finite element static analysis model.
Figure 10a shows the monitoring and prediction results of the PVV of the bridge’s foundation. Figure 10b shows the monitoring results and prediction results of the PVA of the bridge’s foundation. From Figure 10a,b, PVV and PAV monitoring results are consistent with the prediction results. PVV monitoring results are below the allowable vibration velocity (AVV) of Buildings sensitive to Vibration in “Building Engineering Allowable Vibration Standards”(GB50868-2013) in China. Referencing the China Code for the seismic design of urban bridges (CJJ166-2011) (2011), the basic seismic intensity of the location of the bridge is 6 degrees, and the PGA (peak ground acceleration) is 0.05 g (500 mm/s2). The PVA monitoring results are much smaller than the PGA at the bridge site.
During the nearby construction, there was no significant change, and new defects such as existing cracks widening, new cracks, and concrete defects from appearance inspection were compared with the bridge’s overall check results before the construction, and the evaluation score S5 varied 70–75.
The final comprehensive evaluation results of bridge safety within the first month during the nearby construction are shown in Figure 11, and the daily evaluation result in Figure 11 is the average result according to all the multi-source data, including the daily measured data of all the monitoring points in the first month of the nearby construction. The early warnings triggered by the evaluation results were reported every day. The evaluation results triggered 0 red warnings, 0 orange warnings, 5 yellow warnings, and 25 blue warnings. Due to the number of changes of impact drilling machinery put into the adjacent construction, and the uncertainty of the random vehicle load on the bridge during the nearby construction, as well as the sensitivity of strain monitoring instruments making it easy to receive environment interference from the construction site, the calculation data of S1 varies greatly.

5.2. Safety Status Assessment of the Demolition Construction

The safety status assessment of the bridge demolition construction is analyzed during the total demolition process lasting 45 days. The results only plotted the data of the monitoring points on the east side of the bridge. The monitoring results of the strain of arch ribs in the demolition process are shown in Figure 12. It can be seen from Figure 12 that the strain of the arch ribs is between −100 μ ε and 100 μ ε before the demolition of the arch ribs, and the strain changes greatly in the arch rib demolition stage, the maximum strain reaching 250 μ ε . The monitoring results of vertical deformation of arch ribs in the demolition process are shown in Figure 13. From Figure 13, the maximum deformation of arch ribs is between 5 and 10 mm before the demolition of the arch ribs, and the maximum deformation of arch ribs reaches −15 mm during the stage of the demolition of the arch ribs.
The monitoring results of the strain of framing scaffolding are shown in Figure 14. It can be seen from the figure that the strain of the framing scaffolding is between −50 μ ε and 50 μ ε during the stage of deck demolition. And the strain changes greatly in the arch rib demolition stage, but it does not exceed the strain value of 750 μ ε ; 750 μ ε is the strain corresponding to the allowable stress of the framing scaffolding steel.
Figure 15 shows that the vertical deformation of the framing scaffolding is stable; the values are between −5 and 5 mm. The vertical deformation is larger in the stage of deck demolition compared to vertical deformation during the stage of demolition of the arch ribs. According to the in-site confirmation, the vertical deformation value change of the framing scaffolding is mainly composed of the random error of the measurement value, and the vertical deformation caused by the self-weight load of the dismantled bridge can be ignored.
Figure 16 shows the final comprehensive safety assessment results during the demolition construction, with 0 red warnings, 0 orange warnings, 13 yellow warnings, and 32 blue warnings. The daily evaluation result in Figure 16 is the average result according to all the multi-source data, including the daily measured data of all the monitoring points of the old bridge. The abnormal measured data were discriminated according to the several measurement values within the same short period and the actual site conditions. For example, the abnormal measured data generated by the outside disturbance of sensors should be eliminated. At the same time, if the abnormalities cause cannot be determined, the evaluation time interval should be shortened so that the warning value can be timely revised according to the actual safety status of the structure.

6. Conclusions

Through the comprehensive analysis of multi-source data composed of monitoring data and theoretical prediction data during nearby construction and demolition construction of a bridge, AHP was successfully introduced to comprehensively evaluate the status of bridge construction. And by the early warning method of the multi-source data analysis method proposed in this paper, the whole construction was completed successfully. The conclusions are summarized as follows:
  • Due to the lack of huge monitoring historical data and the sensitivity of strain monitoring instruments that are easy to receive environment interference of the construction site, the strain monitoring data of the bridge and framing scaffolding often has inevitable inaccuracy. While the deformation monitoring data is more reliable and stable as a safety assessment for similar bridge construction, the evaluation weight should be increased in the analytic hierarchy process.
  • Bridge safety assessment of nearby construction having harmful vibration should be given priority to bridge monitoring dynamics. The vibration response of the bridge foundation can be evaluated concerning the bridge seismic design specification, and a comprehensive evaluation cooperating with multi-source data, including stress and deformation monitoring of the bridge, is necessary.
  • For the evaluation of bridge status and construction safety of nearby construction and demolition construction, the analytic hierarchy process with a reasonable weight of evaluation factors for a comprehensive assessment to improve the accuracy and timeliness of safety warning can effectively prevent inaccurate judgment in safety early warning.
  • Multi-source data, including but not limited to structural stress and deformation monitoring data, vibration data, theoretical prediction data, environment data, construction, and maintenance history data, are necessary for safety monitoring and early construction warning with specifications related to bridge construction. Bridges under repair and/or during the reconstruction process are often more complex than new construction bridges due to factors such as hydraulics and other complex factors. The multi-source data analysis for bridge safety monitoring can consider these factors in a more comprehensive study.

Author Contributions

Investigation, Y.L. and Q.F.; software, Y.L. and M.F.; analysis, M.F.; resources, M.F.; writing—original draft preparation, M.F.; writing—review and editing, Y.L. and B.W.; supervision, Q.F.; project administration, G.T.; funding acquisition, Y.L. and M.F. All authors have read and agreed to the published version of the manuscript.

Funding

This research was funded by the National Natural Science Foundation of China, grant number 51878277, 52068022, 52178423, the Youth Science Foundation of the Education Department of Jiangxi Province, grant number GJJ180335, GJJ190341, and the Natural Science Foundation of Jiangxi Province, Grant number 20212BAB204010.

Institutional Review Board Statement

Not applicable.

Informed Consent Statement

Not applicable.

Data Availability Statement

Not applicable.

Conflicts of Interest

The authors declare no conflict of interest.

References

  1. Khoei, A.S.; Akbari, R.; Maalek, S.; Gharighoran, A. Assessment of design and retrofitting solutions on the progressive collapse of Hongqi Bridge. Shock. Vib. 2020, 2020, 4932721. [Google Scholar] [CrossRef]
  2. Xu, X.B.; Wang, J.T.; Wei, J.X.; Taciroglu, E.; Dai, F.; Peng, W. A forensic investigation of the Taihe arch bridge collapse. Eng. Struct. 2018, 176, 881–891. [Google Scholar] [CrossRef]
  3. Ministry of Housing and Urban-Rural Development of People’s Republic of China (MOHURD). Technical Specification for Safety of Urban Bridge Demolition Project (CJJ248-2016); Ministry of Housing and Urban-Rural Development of People’s Republic of China: Beijing, China, 2016.
  4. Ministry of Transport of the People’s Republic of China (MOT). Technical Specification for Structural Safety Monitoring Systems of Highway Bridges (T/T 1037-2016); Ministry of Transport of the People’s Republic of China: Beijing, China, 2016.
  5. Keller, P.; McConnell, J.; Schumacher, T.; Thostenson, E.T. Construction stress monitoring using a wireless sensor network to evaluate reuse potential of structural steel. J. Struct. Eng. 2019, 145, 04019143. [Google Scholar] [CrossRef]
  6. Zasukhin, I.; Ivanov, A.; Kuzmenkov, P.; Polyakov, S.; Chaplin, I. Features of monitoring the stress-strain state of structures during the construction of bridge crossings. In Proceedings of the International Scientific Siberian Transport Forum TransSiberia–2021, Novosibirsk, Russia, 11–14 May 2021; pp. 72–81. [Google Scholar] [CrossRef]
  7. Inaudi, D.; Ruefenacht, A.; von Arx, B.; Noher, H.; Vurpillot, S.; Glisic, B. Monitoring of a concrete arch bridge during construction. In Proceedings of the SPIE’s 9th Annual International Symposium on Smart Structures and Materials, San Diego, CA, USA, 17–21 March 2002; Volume 4696, pp. 146–153. [Google Scholar]
  8. Hernandez, W.; Viviescas, A.; Riveros Jerez, C.A. Verifying of the finite element model of the bridge based on the vibration monitoring at differente stages of construction. Arch. Civ. Eng. 2020, 66, 25–40. [Google Scholar] [CrossRef]
  9. Gou, H.Y.; Liu, C.; Bao, Y.; Han, B.; Pu, Q.H. Construction monitoring of self-anchored suspension bridge with inclined tower. J. Bridge Eng. 2021, 26, 05021011. [Google Scholar] [CrossRef]
  10. Tatsunori, M.; Pastsakorn, K.; Hiromasa, M.; Katsuzaki, Y. Monitoring of load distribution of the piles of a bridge during and after construction. Soils Found. 2004, 44, 109–117. [Google Scholar] [CrossRef] [Green Version]
  11. Butler, L.J.; Lin, W.W.; Xu, J.L.; Gibbons, N.; Elshafie, M.Z.E.B.; Middleton, C.R. Monitoring, modeling, and assessment of a self-sensing railway bridge during construction. J. Bridge Eng. 2018, 23, 04018076. [Google Scholar] [CrossRef]
  12. Rao, A.S.; Radanovic, M.; Liu, Y.G.; Hu, S.; Fang, Y.; Khoshelham, K.; Palaniswami, M.; Ngo, T. Real-time monitoring of construction sites: Sensors, methods, and applications. Autom. Constr. 2022, 136, 104099. [Google Scholar] [CrossRef]
  13. Zhang, K.X.; LiD, C.; Shen, X.Y.; Hou, W.Y.; Li, Y.F.; Xue, X.W. Construction monitoring and load testing of a pedestrian suspension bridge in China. Proc. Inst. Civ. Eng. Civ. Eng. 2022, 175, 33–41. [Google Scholar] [CrossRef]
  14. Yang, J.H.; Im, D.K.; Kim, C.H.; Ahn, S.S.; Lee, W.S. Construction and geometry control of Incheon Cable-stayed Bridge. Struct. Eng. Int. 2012, 22, 49–52. [Google Scholar] [CrossRef]
  15. Puri, N.; Turkan, Y. Bridge construction progress monitoring using lidar and 4D design models. Autom. Constr. 2020, 109, 102961. [Google Scholar] [CrossRef]
  16. Wang, X.; Wang, H.; Sun, Y.; Mao, X.; Tang, S. Process-independent construction stage analysis of self-anchored suspension bridges. Autom. Constr. 2020, 117, 103227. [Google Scholar] [CrossRef]
  17. Kim, D.; Kwak, Y.; Sohn, H. Accelerated cable-stayed bridge construction using terrestrial laser scanning. Autom. Constr. 2020, 117, 103269. [Google Scholar] [CrossRef]
  18. Lee, K.; Byun, N.; Shin, D.H. A Damage Localization Approach for Rahmen Bridge Based on Convolutional Neural Network. KSCE J. Civ. Eng. 2020, 24, 1–9. [Google Scholar] [CrossRef]
  19. Lee, J.J.; Lee, J.W.; Yi, J.H.; Yun, C.B.; Jung, H.Y. Neural networks-based damage detection for bridges considering errors in baseline finite element models. J. Sound Vib. 2005, 280, 555–578. [Google Scholar] [CrossRef]
  20. Kim, C.W.; Kawatani, M. Pseudo-static approach for damage identification of bridges based on coupling vibration with a moving vehicle. Struct. Infrastruct. Eng. 2008, 4, 371–379. [Google Scholar] [CrossRef]
  21. Farahani, R.V.; Penumadu, D. Full-scale bridge damage identification using time series analysis of a dense array of geophones excited by drop weight. Struct. Control. Health Monit. 2016, 23, 982–997. [Google Scholar] [CrossRef]
  22. Meixedo, A.; Santos, J.P.; Ribeiro, D.; Rui, C.; Todd, M. Damage detection in railway bridges using traffic-induced dynamic responses. Eng. Struct. 2021, 238, 112189. [Google Scholar] [CrossRef]
  23. Alexakis, H.; Liu, H.; Dejong, M.J. Damage identification of brick masonry under cyclic loading based on acoustic emissions. Eng. Struct. 2020, 221, 110945. [Google Scholar] [CrossRef]
  24. Biondi, F.; Addabbo, P.; Ullo, S.L.; Clemente, C.; Orlando, D. Perspectives on the Structural Health Monitoring of Bridges by Synthetic Aperture Radar. Remote Sens. 2020, 12, 3852. [Google Scholar] [CrossRef]
  25. Saaty, R.W. The analytic hierarchy process—what it is and how it is used. Math. Model. 1987, 9, 161–176. [Google Scholar] [CrossRef] [Green Version]
  26. Ministry of Transport of the People’s Republic of China (MOT). General Specification for Highway Bridge and Culvert Design (JTJ021-1989); Ministry of Transport of the People’s Republic of China: Beijing, China, 1989.
  27. Li, C.Z.; Wang, L.Y.; Xie, J.W.; Hu, P.P. The TELFE expert evaluation in the highway bridge assessment. China J. Highw. Transp. 1993, 6, 46–52. [Google Scholar]
  28. Almansi, K.Y.; Shariff, A.R.M.; Kalantar, B.; Abdullah, A.F.; Ismail, S.N.S.; Ueda, N. Performance Evaluation of Hospital Site Suitability Using Multilayer Perceptron (MLP) and Analytical Hierarchy Process (AHP) Models in Malacca, Malaysia. Sustainability 2022, 14, 3731. [Google Scholar] [CrossRef]
  29. Omar, F.; Bushby, S.T.; Williams, R.D. Assessing the performance of residential energy management control Algorithms: Multi-criteria decision making using the analytical hierarchy process. Energy Build. 2019, 199, 537–546. [Google Scholar] [CrossRef]
  30. China Architecture & Building Press. China Code for Seismic Design of Urban Bridges (CJJ166-2011); China Architecture & Building Press: Beijing, China, 2011. [Google Scholar]
  31. China Planning Press. China Building Engineering Allowable Vibration Standards (GB50868-2013); China Planning Press: Beijing, China, 2013. [Google Scholar]
  32. Ministry of Housing and Urban-Rural Development of People’s Republic of China (MOHURD). Technical Code of Maintenance for City Bridges (CJJ 99-2003); Ministry of Housing and Urban-Rural Development of People’s Republic of China: Beijing, China, 2017.
  33. Ministry of Housing and Urban-Rural Development of People’s Republic of China (MOHURD). Technical Code for Safety of Steel Tubular Scaffold with Couplers in Construction (JGJ 130-2011); Ministry of Housing and Urban-Rural Development of People’s Republic of China: Beijing, China, 2011.
Figure 1. The satellite image of the South River bridge.
Buildings 12 01195 g001
Figure 2. The finite element dynamic analysis model.
Buildings 12 01195 g002
Figure 3. Monitor points of the arch rib and framing scaffolding during the nearby and demolition construction: (a) The cross-section of monitor points of the arch rib and framing scaffolding; (b) Plane-view diagram of the numbered rule of the monitor points; (c) The cross-section of monitor points of the arch rib and framing scaffolding.
Buildings 12 01195 g003aBuildings 12 01195 g003b
Figure 4. Front-view illustration of the vibration monitoring points.
Buildings 12 01195 g004
Figure 5. Hierarchical division of comprehensive assessment of bridge safety status in the nearby construction process.
Buildings 12 01195 g005
Figure 6. Hierarchical division of comprehensive assessment of bridge safety status in the demolition process.
Buildings 12 01195 g006
Figure 7. Monitoring results of strain: (a) Monitoring results of the strain of middle span; (b) Monitoring results of the strain of side span.
Buildings 12 01195 g007
Figure 8. Monitoring results of the temperature of arch ribs: (a) Monitoring results of the temperature of middle span arch ribs; (b) Monitoring results of the temperature of side span arch ribs.
Buildings 12 01195 g008
Figure 9. Monitoring results of deformation of arch ribs: (a) Monitoring result of vertical deformation of arch ribs; (b) Monitoring result of longitudinal deformation of arch ribs.
Buildings 12 01195 g009
Figure 10. Monitoring and prediction results of vibration response: (a) monitoring and prediction results of PVV; (b) monitoring and prediction results of PVA.
Buildings 12 01195 g010
Figure 11. Assessment results during the nearby construction.
Buildings 12 01195 g011
Figure 12. Monitoring results of the strain on arch ribs.
Buildings 12 01195 g012
Figure 13. Monitoring results of vertical deformation of arch ribs.
Buildings 12 01195 g013
Figure 14. Monitoring results of the strain on the arch ribs.
Buildings 12 01195 g014
Figure 15. Monitoring results of vertical deformation of framing scaffolding.
Buildings 12 01195 g015
Figure 16. Assessment results during the demolish construction.
Buildings 12 01195 g016
Table 1. Calculation parameters of the bridge.
ClassificationMain ArchHollow SlabArch Rib BeamBox Girder
Elastic modulus [MPa]2500250025002500
Poisson’s ratio (ν)0.180.180.180.18
Bulk density (Y) [kN/m3]26262626
Resistance to moment of Inertia (Iy) [m4]0.02130.00280.00910.0211
Cross section (A) [m2]0.6830.390.1350.46
Table 2. Calculation parameters of the foundation soil.
ClassificationOverlay Pebble LayerStrong Weathering Argillaceous SiltstoneWeathered Argillaceous Siltstone
Elastic modulus (E) [MPa]10010503500
Poisson’s ratio (ν)0.250.320.2
Bulk density (Y) [kN/m3]222526
Bulk density (saturated) [kN/m3]22.52526
Cohesion (c) [MPa]0.10.10.2
Friction angle (Φ)3530.433.3
Damping ratio0.020.020.02
The thickness of the rock layer.0.1~8.22~316.7~33.2
Table 3. Weight index of comprehensive evaluation during the nearby construction.
Assessment FactorsStress of Arch Ribs (a1)Displacement of Arch Ribs (a2)PVA of Foundation (a3)PVV of Foundation (a4)Observation of Abnormal Status (a5)
Stress of the main arch rib (a1)11/21/31/41
Displacement of arch ribS (a2)211/31/24
PVA of foundation (a3)3311/35
PVV of foundation (a4)45316
Observation of abnormal status (a5)11/41/51/61
Table 4. Normalized weights of comprehensive assessment during nearby construction.
Stress of the Arch Ribs Displacement of Arch Ribs PVA of Foundation PVV of Foundation Observation of Abnormal Status
0.07930.12020.25730.48580.0575
Table 5. Weight index of comprehensive evaluation during demolition construction.
Assessment FactorsStress of the Arch Rib (a1)Displacement of Arch Rib (a2)Stress of the Framing Scaffolding (a3)Displacement of the Framing Scaffolding (a4)
Stress of the main arch rib (a1)11/21/31/6
Displacement of the main arch rib (a2)211/21/3
Stress of the framing scaffolding (a3)3211/2
Displacement of the framing scaffolding (a4)6321
Table 6. Normalized weight of comprehensive evaluation during demolition construction.
Stress of the Arch RibsDisplacement of Arch RibsStress of the Framing ScaffoldingDisplacement of the Framing Scaffolding
0.08270.15400.26680.4965
Table 7. Finite element static analysis results of the maximum stress and strain of the arch rib.
Action TypeCompression Stress/MPaTensile Stress/MPa Compression   Strain / μ ε Tensile   Strain / μ ε
vehicle load−1.50.9−65.739.6
10 mm settlement of foundation−1.40.4−63.117.7
whole bridge cooling at 10 °C−0.60.6−26.726.7
Total−3.51.9−155.584.0
Table 8. The early warning threshold during the nearby construction and demolition.
Warning LevelColor LogoGrade of the Total ScoreCorresponding Measures during Nearby ConstructionCorresponding Measures during Demolish Construction
IRed<60Close trafficStop construction
IIOrange60–75Stop constructionCheck construction
IIIYellow75–90Increased frequency of monitoringIncreased frequency of monitoring
IVBlue>90Normal constructionNormal construction
Publisher’s Note: MDPI stays neutral with regard to jurisdictional claims in published maps and institutional affiliations.

