
Environmental Efficiency Evaluation of Construction Waste Generation Based on Data Envelopment Analysis and Malmquist Index


Abstract
:1. Introduction
2. Research Methodology
2.1. Model Construction
2.1.1. Data Envelopment Analysis
2.1.2. Malmquist Index
2.2. Data sources and Indicator Selection
2.2.1. Data Sources
2.2.2. Indicator Selection
- (1)
- Labor input: The construction industry is a labor-intensive industry with a large demand for labor, and the level of development of the industry can be judged by the number of laborers engaged in the construction industry in each province. Therefore, this study chose the number of construction workers published in the China Statistical Yearbook in previous years as a measure of labor input.
- (2)
- Capital input: The construction industry, as an industry of fixed asset investment, requires a large amount of investment in fixed and current assets during the construction process. The amount of total asset input invested each year affects the productivity of the industry to a certain extent, and has an impact on the environment. This paper selected the amount of total asset input provided by the China Construction Industry Statistical Yearbook in previous years as a measure of capital input.
- (3)
- Resource consumption: The main resources consumed during the construction phase of the building industry are steel, timber, cement, glass, and aluminum. In view of the availability of data, the consumption of steel, timber, cement, glass, and aluminum according to the China Construction Industry Statistical Yearbook in previous years was used as an approximate measure of resource consumption in this study.
- (1)
- Desired output: Since total profits and taxes can directly reflect the economic benefits brought to society by the construction industry, this study chose the total profits and taxes in the China Construction Industry Statistical Yearbook of previous years as the expected output.
- (2)
- Undesired output: As construction waste is often generated during the production process of engineering construction, the lower the amount of construction waste generated, the stronger the construction industry is in terms of environmental protection. In this study, the amount of construction waste generated was selected as the non-expected output, but China currently does not have statistics on the amount of construction waste generated in the construction industry. The relevant data was obtained by calculating the amount of construction waste generated during the engineering construction process provided in the Technical Standard for Construction Waste Disposal (CJJ/T134-2019) promulgated by the Ministry of Housing and Urban-Rural Development, which is as follows:where Mg denotes the amount of construction waste generated by each province in t/a; Rg denotes the new construction area in 104 m2/a; mg denotes the base amount of construction waste generated per unit area in t/104 m2, which can be chosen from 300 t/104 m2 to 800 t/104 m2. This study takes it to a value of 500 t/104 m2. Amongst them, the statistical yearbook lacks data on new construction areas in each province, and considering that construction waste is generated in both the construction and completion stages, the construction area and completion area data counted in the China Construction Industry Statistical Yearbook (2012–2021) were used to sum up and obtain the value of new construction area in each region in each calendar year.
2.3. Pearson Correlation Test for Input and Output Indicators
3. Results
3.1. Environmental Efficiency Measurement Based on the SBM Method
- (1)
- There are four provinces where the average environmental efficiency of construction waste generation is equal to 1, namely Beijing, Jiangsu, Hainan, and Qinghai, accounting for 13.33% of the provinces studied. Beijing and Jiangsu, which have been on the environmental frontier during the 10-year studied period, are among the eastern economic prosperous provinces. It can be seen that these regions, even though they generate a lot of construction waste during the construction and production process, also attach great importance to the related environmental pollution remediation cost investment, and their economic development status and the environmental efficiency of construction waste generation are positively influenced by the relationship. The environmental efficiency of Hainan and Qinghai is also 1, which may be related to the direction of their industrial structure, as the leading industry in these regions is not the secondary industry of construction. For example, Hainan’s leading industry is the tertiary industry of tourism, and Qinghai’s mainstay industry is the primary industry of agriculture. Thus, to improve the environmental efficiency of construction waste generation in each province, the industrial structure could be adjusted appropriately, and the level of economic development could be improved, while at the same time focusing on the investment in environmental management costs in the construction industry.
- (2)
- The provinces with the lowest average environmental efficiency of construction waste generation are Hebei, Guangxi, and Guizhou, all of which are below 0.4, with Guizhou having the lowest environmental efficiency of construction waste generation at 0.272. These provinces are far from the environmental frontier surface, and assuming that the reference object is a province with effective environmental efficiency of construction waste generation, then with constant inputs and outputs, Hebei, Guangxi, and Guizhou’s construction waste generation could be reduced by more than 60%. This shows that there is a large difference in the environmental efficiency of construction waste generation between provinces, with lower values of environmental efficiency of construction waste generation indicating that there is much room for development in reducing construction waste generation in the construction sector in that province.
- (3)
- The average value of the overall engineering environmental efficiency in China from 2011 to 2020 is 0.740, which is not too high overall. At the same time, the average environmental efficiency of construction waste generation from 2011 to 2020 shows a general downward trend, which indicates that the environmental pollution caused by the construction process needs to be improved, and the overall level still needs to be improved. To analyze the differences in the environmental efficiency of construction waste generated in the four major regions of China, this study divides the 30 provinces to be studied into four regions: eastern, northeastern, central, and western, according to the division of China’s economic situation by relevant Chinese departments. Amongst them, the eastern regions are composed of 10 provinces including Beijing, Tianjin, Hebei, Shanghai, Jiangsu, Zhejiang, Fujian, Shandong, Guangdong, and Hainan; the northeastern region is composed of the three provinces of Liaoning, Jilin, and Heilongjiang; the central region is composed of the six provinces of Shanxi, Anhui, Jiangxi, Henan, Hubei, and Hunan; the provinces in the western region consist of the 11 provinces of Inner Mongolia, Guangxi, Chongqing, Sichuan, Guizhou, Yunnan, Shanxi, Gansu, Qinghai, Ningxia, and Xinjiang. It can be seen that the environmental efficiency of construction waste generation in the eastern region is the highest, with a mean value of 0.791; the environmental efficiency of construction waste generation in the central region follows with a mean value of 0.765; the environmental efficiency of construction waste generation in the northeastern region ranks third, with a mean value of 0.741; and the environmental efficiency of construction waste generation in the western region is the lowest, with a mean value of 0.680. The average environmental efficiency of construction waste generation in the eastern, central and northeastern regions is greater than the Chinese average, while the average environmental efficiency in the western region is lower than the Chinese average. The above ranking shows that there is a gradient difference in the environmental efficiency of construction waste generation between the eastern, central, northeastern and western regions, probably because the regional economic development status has some influence on the level of development of the construction industry. The eastern region is more advanced in the development of the construction industry, and the technology level is more mature. Therefore, the amount of construction waste generated is less, the resource utilization rate is higher; thus, the environmental efficiency of construction waste generation is higher.
3.2. Dynamic Analysis Based on the Malmquist Index
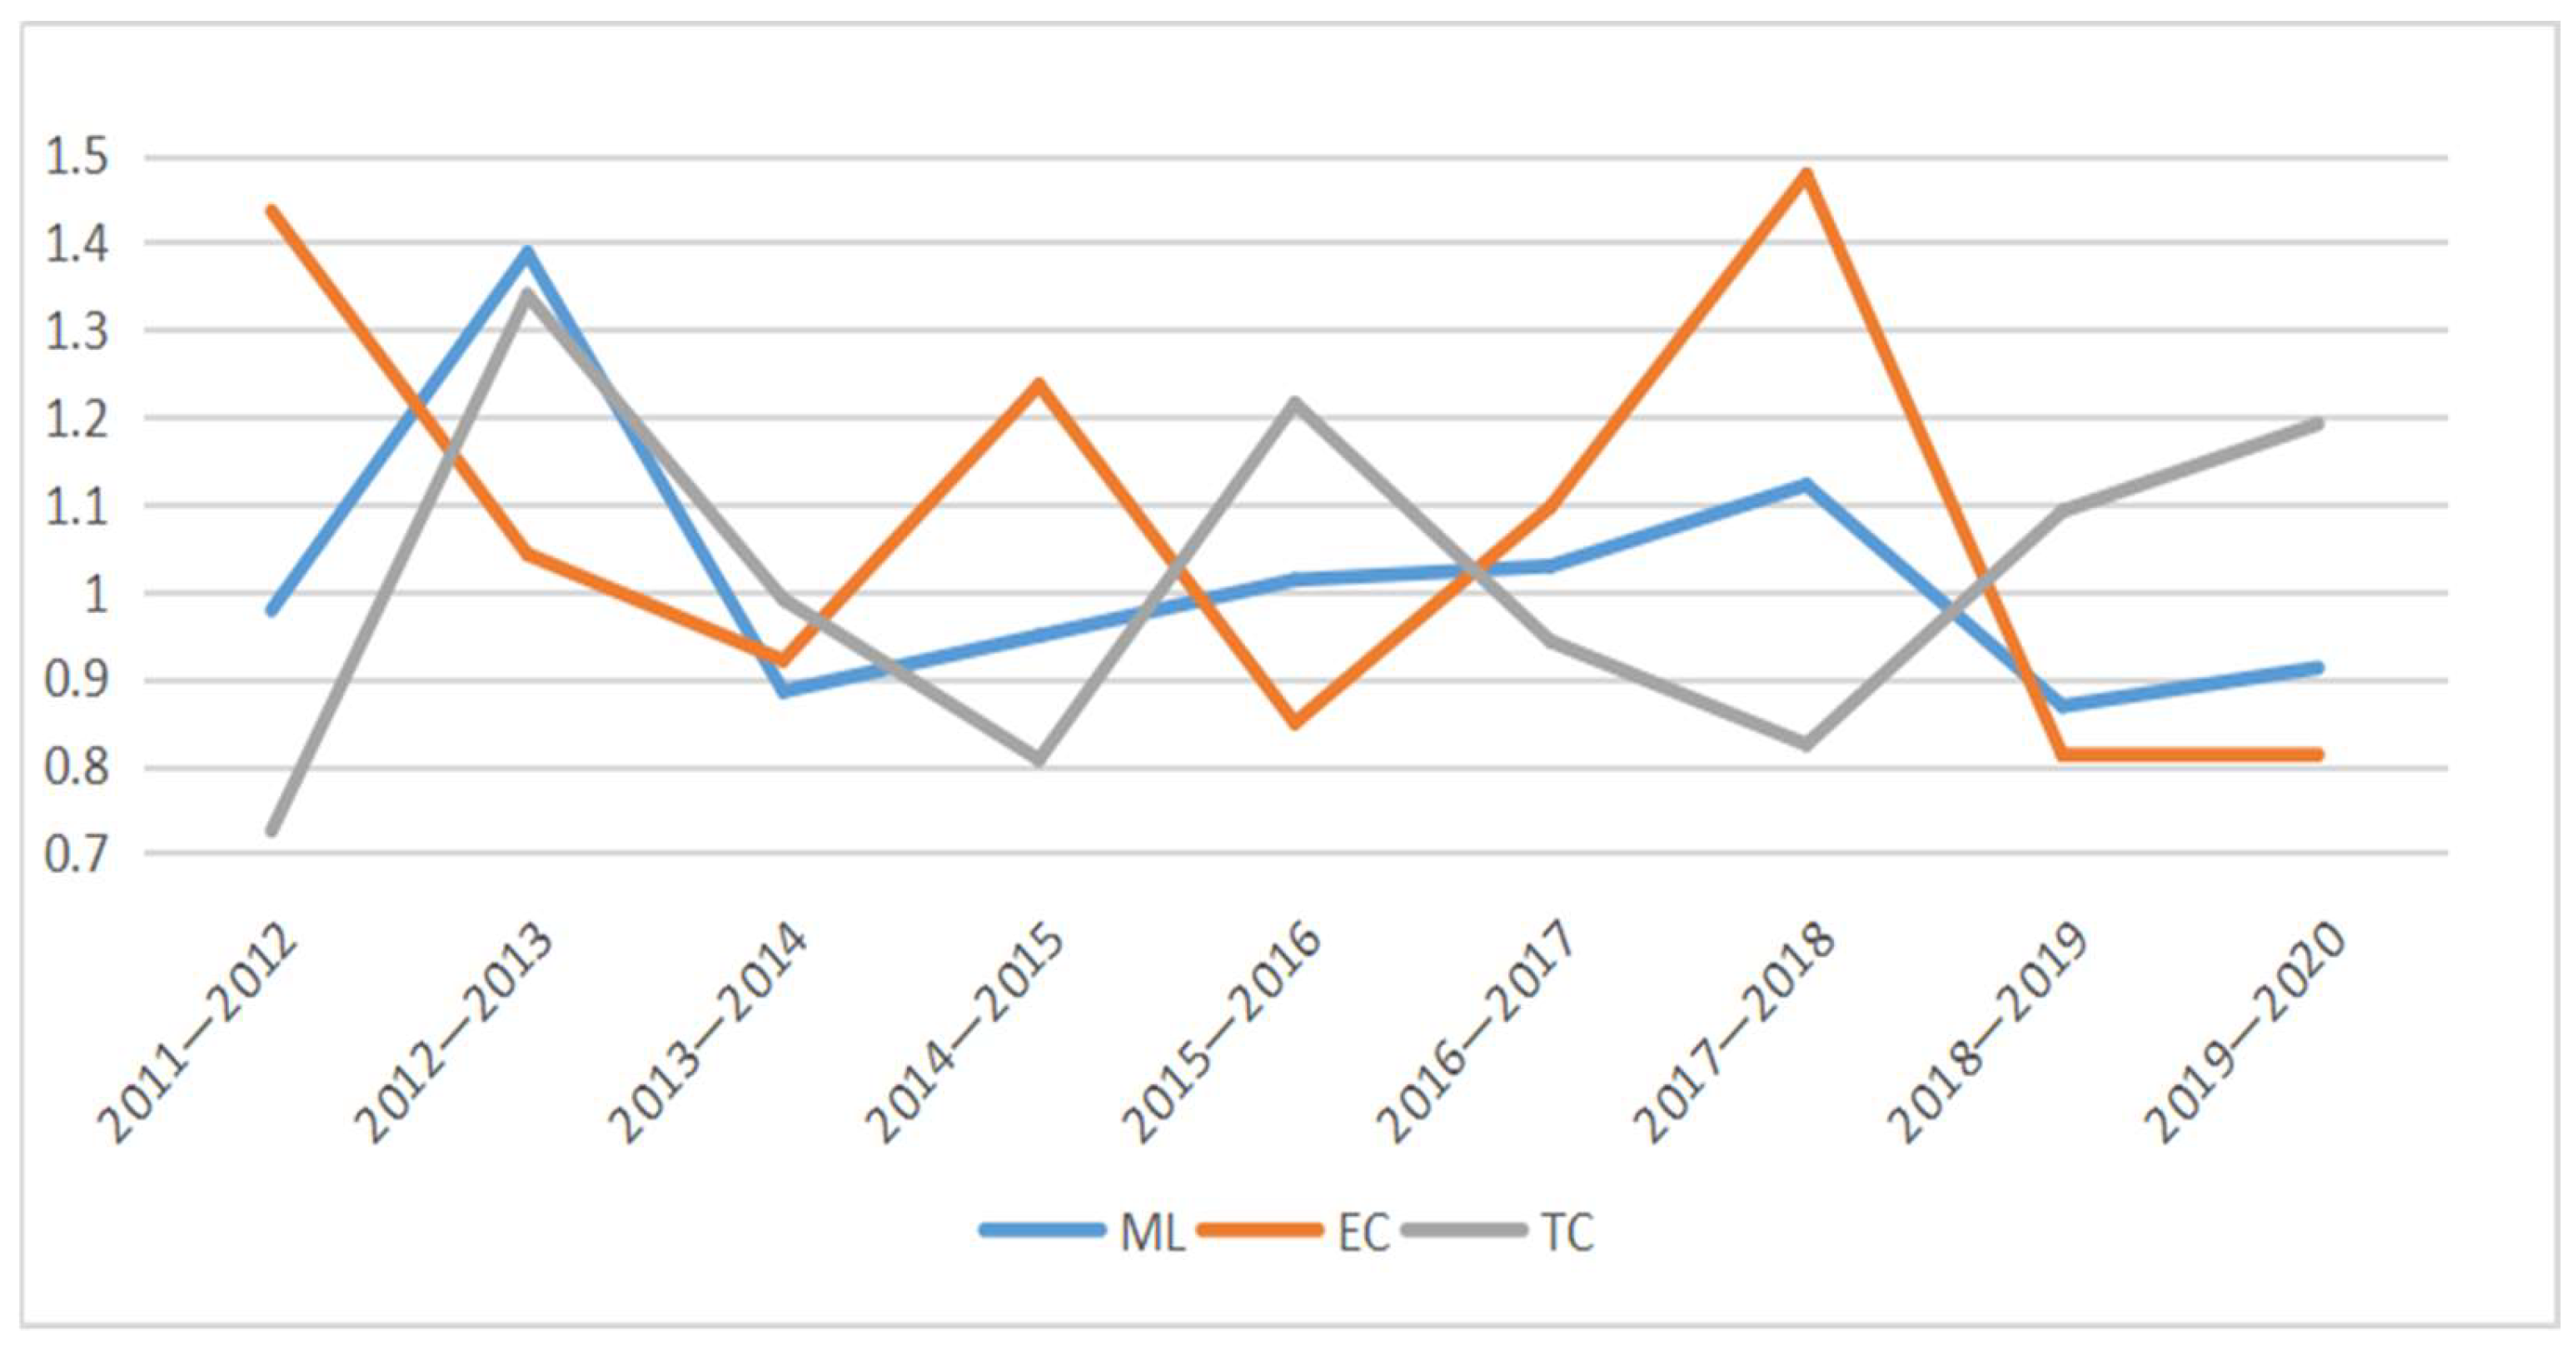
3.2.1. Analysis of the Overall Changes in the Malmquist Index in China
3.2.2. Analysis of Regional Variations in the Malmquist Index for China
4. Conclusions
Author Contributions
Funding
Institutional Review Board Statement
Informed Consent Statement
Data Availability Statement
Acknowledgments
Conflicts of Interest
References
- You, Z.J.; Wu, C.; Zheng, L.Q.; Feng, L.J. An Informatization Scheme for Construction and Demolition Waste Supervision and Management in China. Sustainability 2020, 12, 1672. [Google Scholar] [CrossRef] [Green Version]
- Wu, Z.; Yang, K.; Xue, H.; Zuo, J.; Li, S. Major barriers to information sharing in reverse logistics of construction and demolition waste. J. Clean. Prod. 2022, 350, 131331. [Google Scholar] [CrossRef]
- Pittau, F.; Giacomel, D.; Iannaccone, G.; Malighetti, L. Environmental consequences of refurbishment versus demolition and reconstruction: A comparative life cycle assessment of an Italian case study. J. Green Build. 2020, 15, 155–172. [Google Scholar] [CrossRef]
- Bao, Z.K.; Laovisutthichai, V.; Tan, T.; Wang, Q.; Lu, W.S. Design for manufacture and assembly (DfMA) enablers for offsite interior design and construction. Build. Res. Inf. 2022, 50, 325–338. [Google Scholar] [CrossRef]
- Phillips, H.; Handy, R.; Sleeth, D.; Thiese, M.S.; Schaefer, C.; Stubbs, J. Taking the "LEED" in indoor air quality: Does certification result in healthier buildings? J. Green Build. 2020, 15, 55–66. [Google Scholar] [CrossRef]
- Wu, Z.; He, Q.; Yang, K.; Zhang, J.; Xu, K. Investigating the Dynamics of China’s Green Building Policy Development from 1986 to 2019. Int. J. Environ. Res. Public Health 2021, 18, 196. [Google Scholar] [CrossRef] [PubMed]
- Barth, K.B.; Formoso, C.T. Requirements in performance measurement systems of construction projects from the lean production perspective. Front. Eng. Manag. 2021, 8, 442–455. [Google Scholar] [CrossRef]
- Zeng, N.; Liu, Y.; Gong, P.; Hertogh, M.; König, M. Do right PLS and do PLS right: A critical review of the application of PLS-SEM in construction management research. Front. Eng. Manag. 2021, 8, 356–369. [Google Scholar] [CrossRef]
- Wei, Y.; Li, Y.; Liu, X.; Wu, M. Sustainable development and green gross domestic product assessments in megacities based on the emergy analysis method—A case study of Wuhan. Sustain. Dev. 2019, 28, 294–307. [Google Scholar] [CrossRef]
- Yang, L.C.; Ao, Y.B.; Ke, J.T.; Lu, Y.; Liang, Y. To walk or not to walk? Examining non-linear effects of streetscape greenery on walking propensity of older adults. J. Transp. Geogr. 2021, 94, 103099. [Google Scholar] [CrossRef]
- Fu, H.; Niu, J.; Wu, Z.; Xue, P.; Sun, M.; Zhu, H.; Cheng, B. Influencing Factors of Stereotypes on Wastewater Treatment Plants- Case Study of 9 Wastewater Treatment Plants in Xi’an, China. Environ. Manag. 2022, 1–10. [Google Scholar] [CrossRef] [PubMed]
- Liu, J.; Gong, E.; Wang, D.; Lai, X.; Zhu, J. Attitudes and behaviour towards construction waste minimisation: A comparative analysis between China and the USA. Environ. Sci. Pollut. Res. 2019, 26, 13681–13690. [Google Scholar] [CrossRef] [PubMed]
- Song, M.L.; Zhang, L.L.; An, Q.X.; Wang, Z.; Li, Z. Statistical analysis and combination forecasting of environmental efficiency and its influential factors since China entered the WTO: 2002–2010–2012. J. Clean. Prod. 2013, 42, 42–51. [Google Scholar] [CrossRef]
- Halkos, G.; Petrou, K.N. Assessing 28 EU member states’ environmental efficiency in national waste generation with DEA. J. Clean. Prod. 2019, 208, 509–521. [Google Scholar] [CrossRef]
- Kim, H.; Son, J. Analyzing the Environmental Efficiency of Global Airlines by Continent for Sustainability. Sustainability 2021, 13, 1571. [Google Scholar] [CrossRef]
- Guo, X.J.; Wang, X.; Wu, X.L.; Chen, X.P.; Li, Y. Carbon Emission Efficiency and Low-Carbon Optimization in Shanxi Province under "Dual Carbon" Background. Energies 2022, 15, 2369. [Google Scholar] [CrossRef]
- Li, J.K.; Ma, J.J.; Wei, W. Analysis and Evaluation of the Regional Characteristics of Carbon Emission Efficiency for China. Sustainability 2020, 12, 3138. [Google Scholar] [CrossRef] [Green Version]
- Li, Y.J.; Hou, W.H.; Zhu, W.W.; Li, F.; Liang, L. Provincial carbon emission performance analysis in China based on a Malmquist data envelopment analysis approach with fixed-sum undesirable outputs. Ann. Oper. Res. 2021, 304, 233–261. [Google Scholar] [CrossRef]
- Wang, R.; Feng, Y. Research on China’s agricultural carbon emission efficiency evaluation and regional differentiation based on DEA and Theil models. Int. J. Environ. Sci. Technol. 2021, 18, 1453–1464. [Google Scholar] [CrossRef]
- Xu, J.; Jiang, Y.C.; Guo, X.; Jiang, L. Environmental Efficiency Assessment of Heavy Pollution Industry by Data Envelopment Analysis and Malmquist Index Analysis: Empirical Evidence from China. Int. J. Environ. Res. Public Health 2021, 18, 5761. [Google Scholar] [CrossRef] [PubMed]
- Guo, S.D.; Li, H.; Zhao, R.; Zhou, X. Industrial environmental efficiency assessment for China’s western regions by using a SBM-based DEA. Environ. Sci. Pollut. Res. 2019, 26, 27542–27550. [Google Scholar] [CrossRef]
- Farrell, M.J. The Measurement of Productive Efficiency. J. R. Stat. Soc. 1957, 120, 253–290. [Google Scholar] [CrossRef]
- Charnes, A.; Cooper, W.W.; Rhodes, E. Measuring the efficiency of decision-making units. Eur. J. Oper. Res. 1979, 3, 429–444. [Google Scholar] [CrossRef]
- Tone, K. A slacks-based measure of efficiency in data envelopment analysis. Eur. J. Oper. Res. 2001, 130, 498–509. [Google Scholar] [CrossRef] [Green Version]
- Abbas, A.; Zhao, C.; Waseem, M.; Ahmad, R. Analysis of energy input–output of farms and assessment of greenhouse gas emissions: A case study of Cotton Growers. Front. Environ. Sci. 2022, 9, 725. [Google Scholar] [CrossRef]
- Singh, G.; Singh, P.; Sodhi, G.P.S.; Tiwari, D. Energy auditing and data envelopment analysis (DEA) based optimization for increased energy use efficiency in wheat cultivation (Triticum aestium L.) in north-western India. Sustain. Energy Technol. Assess. 2021, 47, 101453. [Google Scholar] [CrossRef]
- Wan, B.H.; Zhou, E.D. Research of Total Factor Productivity and Agricultural Management Based on Malmquist-DEA Modeling. Math. Probl. Eng. 2021, 2021, 1–8. [Google Scholar] [CrossRef]

| Indicator Category | Indicator Name | Specific Indicators |
|---|---|---|
| Input indicator | Labor input | Number of construction workers (in1) |
| Capital investment | Total asset investment (in2) | |
| Resource consumption | Steel (in3) | |
| Wood (in4) | ||
| Cement (in5) | ||
| Grass (in6) | ||
| Aluminum (in7) | ||
| Output indicator | Desired output | Total profit and tax (out) |
| Undesired output | Construction waste generation (badout1) |
| Variable | In1 | In2 | In3 | In4 | In5 | In6 | In7 | Out1 | Badout1 |
|---|---|---|---|---|---|---|---|---|---|
| In1 | 1 | 0.582 ** | 0.846 ** | 0.800 ** | 0.643 ** | 0.823 ** | 0.519 ** | 0.879 ** | 0.959 ** |
| In2 | 0.582 ** | 1 | 0.572 ** | 0.519 ** | 0.315 ** | 0.417 ** | 0.283 ** | 0.823 ** | 0.690 ** |
| In3 | 0.846 ** | 0.572 ** | 1 | 0.813 ** | 0.689 ** | 0.800 ** | 0.567 ** | 0.790 ** | 0.826 ** |
| In4 | 0.800 ** | 0.519 ** | 0.813 ** | 1 | 0.599 ** | 0.773 ** | 0.618 ** | 0.746 ** | 0.738 ** |
| In5 | 0.643 ** | 0.315 ** | 0.689 ** | 0.599 ** | 1 | 0.616 ** | 0.453 ** | 0.532 ** | 0.608 ** |
| In6 | 0.823 ** | 0.417 ** | 0.800 ** | 0.773 ** | 0.616 ** | 1 | 0.622 ** | 0.705 ** | 0.778 ** |
| In7 | 0.519 ** | 0.283 ** | 0.567 ** | 0.618 ** | 0.453 ** | 0.622 ** | 1 | 0.451 ** | 0.446 ** |
| Out1 | 0.879 ** | 0.823 ** | 0.790 ** | 0.746 ** | 0.532 ** | 0.705 ** | 0.451 ** | 1 | 0.927 ** |
| Badout1 | 0.959 ** | 0.690 ** | 0.826 ** | 0.738 ** | 0.608 ** | 0.778 ** | 0.446 ** | 0.927 ** | 1 |
| DMU | 2011 | 2012 | 2013 | 2014 | 2015 | 2016 | 2017 | 2018 | 2019 | 2020 | Mean |
|---|---|---|---|---|---|---|---|---|---|---|---|
| Beijing | 1 | 1 | 1 | 1 | 1 | 1 | 1 | 1 | 1 | 1 | 1 |
| Tianjin | 1 | 1 | 1 | 1 | 1 | 0.442 | 1 | 1 | 1 | 0.361 | 0.88 |
| Hebei | 0.424 | 0.409 | 0.433 | 0.388 | 0.388 | 0.414 | 0.346 | 0.504 | 0.328 | 0.253 | 0.389 |
| Shanghai | 1 | 1 | 1 | 0.703 | 1 | 0.524 | 0.463 | 1 | 0.429 | 0.327 | 0.745 |
| Jiangsu | 1 | 1 | 1 | 1 | 1 | 1 | 1 | 1 | 1 | 1 | 1 |
| Zhejiang | 1 | 1 | 0.521 | 0.598 | 0.547 | 0.522 | 0.489 | 0.357 | 0.333 | 0.314 | 0.568 |
| Fujian | 0.755 | 0.761 | 0.551 | 0.562 | 1 | 1 | 1 | 1 | 1 | 1 | 0.863 |
| Shandong | 1 | 0.505 | 0.805 | 0.843 | 0.607 | 0.539 | 0.595 | 0.703 | 0.481 | 0.365 | 0.644 |
| Guangdong | 1 | 1 | 1 | 1 | 1 | 0.629 | 0.729 | 1 | 0.560 | 0.295 | 0.821 |
| Hainan | 1 | 1 | 1 | 1 | 1 | 1 | 1 | 1 | 1 | 1 | 1 |
| Eastern mean | 0.918 | 0.868 | 0.831 | 0.809 | 0.854 | 0.707 | 0.762 | 0.856 | 0.713 | 0.592 | 0.791 |
| Shanxi | 0.635 | 1 | 0.621 | 0.657 | 0.578 | 0.404 | 0.388 | 0.666 | 0.529 | 0.341 | 0.582 |
| Anhui | 0.540 | 0.660 | 1 | 0.452 | 0.635 | 0.538 | 0.485 | 0.663 | 0.367 | 0.402 | 0.574 |
| Jiangxi | 0.366 | 1 | 1 | 1 | 1 | 0.622 | 0.534 | 0.583 | 0.498 | 0.544 | 0.715 |
| Henan | 1 | 1 | 1 | 1 | 0.796 | 1 | 1 | 1 | 1 | 1 | 0.98 |
| Hubei | 1 | 1 | 1 | 1 | 1 | 0.559 | 0.599 | 1 | 1 | 1 | 0.916 |
| Hunan | 1 | 1 | 1 | 1 | 1 | 0.551 | 0.502 | 1 | 0.502 | 0.668 | 0.822 |
| Middle mean | 0.757 | 0.943 | 0.937 | 0.852 | 0.835 | 0.612 | 0.585 | 0.819 | 0.649 | 0.659 | 0.765 |
| Inner Mongolia | 1 | 1 | 1 | 1 | 0.484 | 0.411 | 0.535 | 0.636 | 0.653 | 0.481 | 0.720 |
| Guangxi | 0.305 | 0.34 | 0.308 | 0.286 | 0.401 | 0.36 | 0.326 | 0.415 | 0.41 | 0.299 | 0.345 |
| Chongqing | 0.685 | 1 | 0.835 | 1 | 1 | 1 | 1 | 1 | 0.855 | 1 | 0.938 |
| Sichuan | 0.466 | 0.474 | 0.445 | 0.351 | 0.368 | 0.273 | 0.302 | 0.627 | 0.403 | 0.476 | 0.419 |
| Guizhou | 0.279 | 0.261 | 0.239 | 0.246 | 0.2 | 0.153 | 0.298 | 0.478 | 0.309 | 0.256 | 0.272 |
| Yunnan | 0.636 | 1 | 1 | 0.536 | 0.736 | 0.592 | 1 | 1 | 1 | 1 | 0.850 |
| Shanxi | 1 | 1 | 0.762 | 0.652 | 0.498 | 0.461 | 0.442 | 0.660 | 0.409 | 0.335 | 0.622 |
| Gansu | 0.414 | 0.518 | 0.489 | 0.499 | 1 | 0.603 | 0.746 | 0.858 | 0.802 | 0.303 | 0.623 |
| Qinghai | 1 | 1 | 1 | 1 | 1 | 1 | 1 | 1 | 1 | 1 | 1 |
| Ningxia | 1 | 0.684 | 0.429 | 1 | 0.56 | 1 | 1 | 1 | 1 | 1 | 0.867 |
| Xinjiang | 0.308 | 0.551 | 1 | 1 | 1 | 1 | 1 | 1 | 1 | 0.373 | 0.823 |
| Western mean | 0.645 | 0.712 | 0.682 | 0.688 | 0.659 | 0.623 | 0.695 | 0.789 | 0.713 | 0.593 | 0.680 |
| Liaoning | 1 | 1 | 1 | 0.49 | 0.514 | 0.258 | 0.345 | 1 | 0.358 | 0.263 | 0.623 |
| Jilin | 1 | 0.382 | 0.416 | 1 | 0.728 | 0.652 | 1 | 1 | 1 | 0.640 | 0.782 |
| Heilongjiang | 0.452 | 1 | 0.566 | 1 | 1 | 1 | 0.575 | 1 | 1 | 0.586 | 0.818 |
| Northeast mean | 0.817 | 0.794 | 0.661 | 0.83 | 0.747 | 0.637 | 0.640 | 1 | 0.786 | 0.496 | 0.741 |
| National mean | 0.776 | 0.818 | 0.781 | 0.775 | 0.768 | 0.650 | 0.690 | 0.838 | 0.708 | 0.596 | 0.740 |
| Year | Malmquist (ML) | Technical Efficiency Change (EC) | Technological Change (TC) |
|---|---|---|---|
| 2011–2012 | 0.978 | 1.436 | 0.726 |
| 2012–2013 | 1.388 | 1.042 | 1.34 |
| 2013–2014 | 0.885 | 0.921 | 0.991 |
| 2014–2015 | 0.949 | 1.236 | 0.807 |
| 2015–2016 | 1.013 | 0.849 | 1.215 |
| 2016–2017 | 1.029 | 1.097 | 0.942 |
| 2017–2018 | 1.122 | 1.478 | 0.824 |
| 2018–2019 | 0.868 | 0.812 | 1.092 |
| 2019–2020 | 0.912 | 0.815 | 1.192 |
| Mean | 1.016 | 1.076 | 1.014 |
| DMU | Malmquist (ML) | Technical Efficiency Change (EC) | Technological Change (TC) |
|---|---|---|---|
| Beijing | 1.111 | 1 | 1.111 |
| Tianjin | 0.929 | 1.056 | 1.042 |
| Hebei | 0.967 | 0.986 | 1.022 |
| Shanghai | 0.987 | 1.006 | 1.198 |
| Jiangsu | 1.13 | 1.229 | 0.979 |
| Zhejiang | 0.934 | 1.019 | 0.972 |
| Fujian | 0.942 | 1.278 | 0.898 |
| Shandong | 1.051 | 1.006 | 1.013 |
| Guangdong | 1.058 | 1.043 | 1.014 |
| Hainan | 1.131 | 1.254 | 0.981 |
| Eastern mean | 1.024 | 1.088 | 1.023 |
| Shanxi | 0.945 | 1.021 | 1.091 |
| Anhui | 1.013 | 1.045 | 0.982 |
| Jiangxi | 0.977 | 1.138 | 0.938 |
| Henan | 1.044 | 1.122 | 0.945 |
| Hubei | 1.057 | 1.041 | 1.001 |
| Hunan | 0.965 | 1.144 | 0.899 |
| Middle mean | 1 | 1.085 | 0.976 |
| Inner Mongolia | 0.927 | 0.907 | 1.066 |
| Guangxi | 1.005 | 1.023 | 1.004 |
| Chongqing | 1.08 | 1.103 | 1.007 |
| Sichuan | 1.05 | 1.07 | 1.004 |
| Guizhou | 1.043 | 1.077 | 1.033 |
| Yunnan | 1.08 | 1.119 | 1.003 |
| Shanxi | 0.935 | 0.946 | 1.032 |
| Gansu | 0.936 | 1.008 | 1.013 |
| Qinghai | 0.979 | 1 | 0.979 |
| Ningxia | 1.073 | 1.038 | 1.049 |
| Xinjiang | 1.074 | 1.126 | 1.141 |
| Western mean | 1.017 | 1.038 | 1.03 |
| Liaoning | 0.976 | 1.217 | 1.026 |
| Jilin | 1.052 | 1.079 | 1.028 |
| Heilongjiang | 1.029 | 1.186 | 0.956 |
| Northeast mean | 1.019 | 1.161 | 1.003 |
| National mean | 1.016 | 1.076 | 1.014 |
Publisher’s Note: MDPI stays neutral with regard to jurisdictional claims in published maps and institutional affiliations. |
© 2022 by the authors. Licensee MDPI, Basel, Switzerland. This article is an open access article distributed under the terms and conditions of the Creative Commons Attribution (CC BY) license (https://creativecommons.org/licenses/by/4.0/).
Share and Cite
Liu, X.; Wu, Z.; Xie, P.; Hong, Q.; Hu, X.; Antwi-Afari, M.F. Environmental Efficiency Evaluation of Construction Waste Generation Based on Data Envelopment Analysis and Malmquist Index. Buildings 2022, 12, 1189. https://doi.org/10.3390/buildings12081189
Liu X, Wu Z, Xie P, Hong Q, Hu X, Antwi-Afari MF. Environmental Efficiency Evaluation of Construction Waste Generation Based on Data Envelopment Analysis and Malmquist Index. Buildings. 2022; 12(8):1189. https://doi.org/10.3390/buildings12081189
Chicago/Turabian StyleLiu, Xia, Zezhou Wu, Peiying Xie, Qing Hong, Xi Hu, and Maxwell Fordjour Antwi-Afari. 2022. "Environmental Efficiency Evaluation of Construction Waste Generation Based on Data Envelopment Analysis and Malmquist Index" Buildings 12, no. 8: 1189. https://doi.org/10.3390/buildings12081189
APA StyleLiu, X., Wu, Z., Xie, P., Hong, Q., Hu, X., & Antwi-Afari, M. F. (2022). Environmental Efficiency Evaluation of Construction Waste Generation Based on Data Envelopment Analysis and Malmquist Index. Buildings, 12(8), 1189. https://doi.org/10.3390/buildings12081189