Article

Comparative Analysis of Dynamic Response of Damaged Wharf Frame Structure under the Combined Action of Ship Collision Load and Other Static Loads

1
Engineering Research Center of Diagnosis Technology and Instruments of Hydro-Construction, Chongqing Jiaotong University, Chongqing 400074, China
2
Principal Room, Chongqing University of Science and Technology, Chongqing 400000, China
*
Author to whom correspondence should be addressed.
Buildings 2022, 12(8), 1131; https://doi.org/10.3390/buildings12081131
Submission received: 12 July 2022 / Revised: 26 July 2022 / Accepted: 27 July 2022 / Published: 30 July 2022
(This article belongs to the Special Issue Structural Health Monitoring of Buildings, Bridges and Dams)

Abstract

:
In the long-term service, the wharf structure can be damaged by ship impact, wave load, and even earthquake, which will affect the safe production and smooth operation of the port. Based on the theory of structural dynamic response analysis and wavelet packet analysis principle, this paper established the damage identification index of the wharf frame structure. Combining with the finite element method and the dynamic response theory of the wharf frame structure, it set up a finite element analysis model of the dynamic response of the wharf frame structure under the action of multiple loads, with the impact load of the ship as the dynamic load under the non-damaged state and the different damaged states. In addition, the characteristic response point location was drawn up. Furthermore, the transient dynamic analysis and damage index analysis of the frame structure in the non-damaged and damaged state were conducted respectively. In addition, the model test and numerical simulation results were combined to compare and analyze the identification of damage indicators, so as to verify the identification effect of the established damage identification indicators on the structural damage, which lays a foundation for the next step of structural damage identification.

1. Introduction

As a key component of water transportation projects, port terminals have important safety performance and guarantee capabilities for the smooth flow of water transportation. Once damaged, it will not only seriously affect the normal performance of traffic functions and the operation of important traffic arteries, but also threaten people’s life and property safety. However, under long-term loads such as ship impacts, wave loads, and even earthquakes, a lot of wharves will produce undesirable structural deformations during construction and operation periods, which can lead to varying degrees of damage and deterioration, and even seriously affect normal function and effective operation [1]. Therefore, it is very crucial to effectively detect and identify wharf structural damage. Indeed, structural damage identification in structural health monitoring is a core component and a difficult problem [2]. Generally speaking, the basic principle of the research on structural damage identification [3] is to analyze the response measurement data of the structure under external load excitation, and infer the change of the dynamic characteristics of the structure. Despite extensive attention given to the dynamic characteristics related damage detection methods, the research on the damage identification of wharves based on dynamic characteristics has not been fully integrated and embodied in the practical engineering applications. Therefore, the dynamic response of structures under environmental excitation is a subject worthy of further study.
The principle of damage-free detection method based on the structural dynamic characteristics or dynamic response is that some dynamic parameters of the damaged structures will change. In addition, the dynamic characteristics or dynamic response of the structure can reflect whether the structure is in the damage state, so as to realize the research of structural damage identification. Among them, the damage identification based on the change of natural frequency has been widely applied because of its easy access and high identification accuracy. As pointed out by Ostachowicz and Krawczuk [4], the relative position of the cantilever crack is associated with the natural frequency of the relative depth. Apart from that, Stubbs and Osegueda [5] obtained the relevant methods of structural damage location and quantitative research from the relationship between the change of natural frequency and the element stiffness matrix. Additionally, Yi et al. [6] deeply studied the influence of pile–soil interaction on the dynamic characteristics of a single pile fixed at the bottom. As the basic attribute of the structure, the modal shape describes the vibration characteristics of the structure at different positions. Based on Southwell frequency composition theory, Zhao et al. [7] derived that it is of great necessity to consider the pile–soil interaction in the natural frequency calculation of tapered high pier. In order to detect the location and severity of damage, Yan et al. [8] proposed a damage detection method based on the high-efficiency algebraic algorithm of element modal strain energy sensitivity. Through the experimental modal analysis, Xiang et al., [9] obtained several natural frequencies and employed them as inputs to construct database using the particle swarm optimization, in order to search for damage depths. According to Moaveni et al. [10], the sensitivity-based finite-element model updating strategy can be employed to detect, locate, and quantify damage based on the changes in the identified effective modal parameters. The above results show that the damage detection method based on natural frequency and mode shape is dependable.
Up to now, many scholars have studied how to identify structural damage based on the dynamic response of the structure and analyze the acceleration time-domain information of the dynamic response. For example, Boroschek et al. [11] put forward the results from a series of experimental tests to determine the damping characteristics of a section of a 375 m long pile-supported wharf structure under the forced excitation. Moreover, Huang et al. [12] investigated the dynamic characteristics of the wharf pile structure under the influence of ocean wave forces. In terms of the engineering theory, Manna et al. [13] explored the impact of nonlinearity on the dynamic response of cast-in-situ-reinforced concrete piles subjected to strong vertical excitation. Beyond that, Su et al. [14] proposed a disturbing-energy method for the safety assessment of high-piled wharves based on the variational principle and minimum potential energy principle. Then, Zheng et al. [15] proposed an analytical framework for the horizontal dynamic analysis of a large-diameter pipe pile subjected to combined loadings, which provided appropriate estimates of complex impedances of large-diameter pipe piles. With the deepening of finite element numerical analysis methods, various structural dam-age conditions of wharves can be described more accurately. Based on the numerical analysis, Zhang et al. [16] compared the dynamic characteristic of an all-vertical-piled wharf with that of a traditional inshore high-piled wharf. In addition, Pepe et al. [17] simulated different damage states through the nonlinear static (pushover) analysis developed by the FE model of the building. In this analysis, both the bare framed structure and the infilled structure were considered to appraise the damage to the infill walls. Based on response surface model (RSM) updating and element modal strain energy (EM-SE) damage index, Niu et al. [18] proposed a novel damage identification method for girder bridge structures. By using partial measurements of structural acceleration responses, Lei et al. [19] put forward an algorithm based on a two-step Kalman filter approach for the damage detection of frame structures with joint damage under earthquake excitation. Combining with numerical model and experimental research, Lin et al. [20] proposed an optimal placement method for multi-target multi-type structural damage sensors based on dynamic response covariance, indicating that the optimal multi-type sensor placement determined by the proposed method could provide accurate damage localization and satisfactory damage quantitation. Meanwhile, Kang et al. [21] conducted a numerical simulation study on a double-span truss girder bridge and a three-story shear building model, used the measured acceleration response to estimate the relevant physical parameters, and proposed an acceleration-based time-domain system damage identification method. In short, the physical parameters of the structure obtained through dynamic response analysis and acceleration response characteristics related research have achieved good recognition effect in the research of one-step damage identification method.
The problem of damage identification of wharf frame structure is complicated. Although the above-mentioned structural damage identification methods and technologies based on static feature analysis, structural vibration response, and system dynamic characteristic parameters have achieved certain research results and some of them have been applied in engineering practice, continuous low-order modes are chosen for calculation in most of the methods. Beyond that, the location and degree of structural damage are uncertain, and the damage in some parts does not change to modes of some orders, leading to the insensitive change of the corresponding damage index. In practice, the effect is often not good, especially for small damages of large and complex structures such as wharf frame structures, which are more likely to be missed and misjudged. In addition, most of the existing damage identification methods based on vibration characteristics, especially for large and complex structures, need the model before the damage of the structure. However, due to the incomplete geological and hydrological data or the discrepancy between the material and size of the structure and the design drawings, it is difficult to establish a high-precision structural model.
Combining with the numerical simulation and model test, this paper analyzed the dynamic response of wharf frame structure under natural excitation (combined action of dynamic and static loads). Based on this, the damage identification index was directly established, which does not depend on the change of structural mode. Moreover, the identification index established by the structural transient acceleration signal under the action of natural incentives reflects the sensitivity to the change of small damage of the structure. Apart from that, the dynamic response damage identification index established based on the common natural excitation effects of docks can be further used for long-term monitoring of damage changes in the wharf frame structures.
According to the above theoretical and experimental research, the external load of structural damage detection in the experiment was proposed as the combined action of transient dynamic load and static load in the finite element model. In addition, the dynamic response analysis of wharf frame structure was performed by ANSYS numerical simulation method. In addition, the transient dynamic response damage identification index was established, and verified through model tests, laying a foundation for the future practical engineering application.

2. Dynamic Damage Identification Index of Wharf Frame Structure

2.1. Basic Theory of Structural Dynamic Response Analysis

When the load imposed on the structure changes with time, transient dynamic analysis, as a kind of time history analysis, needs to be taken into account. In the case of load combination, the laws of displacement, velocity, acceleration, stress, and strain over time can be obtained. Notably, when transient dynamic analysis is performed, it is essential to focus on the impact of inertial force and damping on structural response. At the same time, the structure changes with time under dynamic load. Transient dynamic analysis can be selected to determine a law of structure displacement, velocity, acceleration, stress, strain, and other parameters changing with time under load, which is called Time-History response analysis. In the transient dynamic analysis, the time variable is introduced, and the load can be any function of time.
When the dynamic load is applied to the structure, the vibration of the structure should not be ignored, because in the structural dynamics, the vibration of the structure is one of the reasons for the change of inertial force and damping force. In mathematics, inertial force is the second-order derivative of displacement with respect to time. The expression of the equation of motion is written as a differential equation. Beyond that, the motion equation of the structural system can be expressed as:
M q ¨ ( t ) + C q ˙ ( t ) + K q ( t ) = F ( t )
where, M represents quality matrix; C represents damping matrix; K represents stiffness matrix; q ¨ ( t ) represents acceleration vector; q ˙ ( t ) represents velocity vector; q ( t ) represents displacement vector; F(t) represents dynamic load vector; t represents time.
The initial conditions are as follows:
{ q ( t ) } | t = 0 = { q 0 } { q ˙ ( t ) } | t = 0 = { q ˙ 0 }
where, q 0 represents initial displacement vector; q ˙ ( t ) represents initial velocity vector.
At present, the commonly used transient dynamic analysis methods are mainly divided into three categories: full, reduced, and mode superposition. Each method has its own advantages and limitations, of which the full method is the most powerful one. While calculating the transient response of the structure, the full method allows the application of various loads, which can be loaded on the solid model and is also applicable to nonlinearities.
In this paper, the complete method was used to analyze the transient dynamic response of the structure.

2.2. Establishment of Damage Identification Index of Wharf Frame Structure

It is inevitable that the damage of the structure will cause the change of the energy of the structure’s dynamic response in each frequency band. Thus, the damage of the structure can also be judged by the energy. Structural dynamic response decomposition carries a wealth of structural damage information in various frequency bands, including time and frequency variables. The closer to the damage section, the greater the dynamic response energy change rate of the structure before and after the damage. Thus, the energy of the signal can be used to indicate the damage of the structure. This paper collected the dynamic response signal of each measuring point of the wharf frame structure, conducted wavelet packet analysis, obtained the energy change rate, and constructed the damage identification index.
If a certain position of the wharf frame structure is damaged, the acceleration time history response F(t) of the structure will inevitably change. In the practical engineering, a lot of studies have demonstrated that varying degrees of damage to quay frame structures during operation could alter the structural stiffness and dynamic response. Moreover, the occurrence of damage is often accompanied by a reduction in structural stiffness. Assuming that the acceleration time history response after damage is f(t)k, the stiffness reduction rate α of the wharf frame structure can be defined as the damage factor:
α = ( E I ) y ( E I ) w
where, (EI)y represents stiffness after injury; (EI)w represents stiffness before injury.
The acceleration time history response f(t)k after damage can be expressed as:
f ( t ) k = α { α 1 , α 2 , , α n }
where, f(t)k represents acceleration time history response after injury; {α1, α2, …, αn} represents damage factor of n units on wharf frame structure.
The wavelet packet analysis method was adopted to decompose the dynamic response signal of each measuring point before and after the damage, so as to obtain the energy distribution of the signal on each scale.
This study used the component energy of each node
E f j i = + f j i ( t ) 2 d t
E f j i represents the correlation function of the damage factors of n units of the wharf frame structure, which can be expressed as:
( E f j i ) k = e ( α 1 , α 2 , , α n )
Assume that the initial value of the damage factor of the wharf frame structure unit is { α 1 0 , α 2 0 , , α n 0 } . After expansion of the multi-level Taylor series, the following formula can be obtained:
( E f j i ) k = e ( α 1 0 , α 2 0 , , α n 0 ) + i = 0 n e ( α 1 0 , α 2 0 , , α n 0 ) α 1 ( α 1 α 1 0 ) 1 2 ! m = 0 n e ( α 1 0 , α 2 0 , , α n 0 ) α 1 α m ( α 1 α 1 0 ) ( α m α m 0 ) + o n
Ignoring the higher-order terms, the correlation function E f j i of the element damage factor could be approximately expressed as:
( E f j i ) k = ( E f j i ) k 0 + i = 1 n ( E f j i ) k 0 α 1 ( α 1 α 1 0 )
Then, the correlation function increment of the damage factor of the wharf frame structure in the time domain k could be expressed as:
Δ ( E f j i ) k = ( E f j i ) k ( E f j i ) k 0 = i = 1 n ( E f j i ) k 0 α 1 Δ α 1
There is an obviously internal connection between the energy change of each component and the structural damage, and the damage factor refers to a function value of the independent variable. Therefore, the damage identification index can be further constructed based on the energy change of each component. Under the condition that a certain position of the pier frame structure is not damaged, the acceleration time history signal at the response point of the structure is decomposed by the wavelet packet at the J level, and the calculated energy of the i-th component is ( E f j i ) w . If damage occurs at a certain position of the wharf frame structure, the acceleration time history response signal at the response point of the structure is subjected to wavelet packet decomposition at the J level, and the energy of the i-th component obtained by the solution is ( E f j i ) y . This study defined the wavelet packet energy change rate of the signal at level J (i.e., the number of scales, the number of decomposition layers) as the damage identification index Dj:
D j = Δ ( E j ) = i = 1 2 j | ( E f j i ) y ( E f j i ) w | ( E f j i ) w
where, ( E f j i ) y represents structural component energy after damage; ( E f j i ) w represents non-destructive structural component energy.

3. Dynamic Response Analysis of Wharf Frame Structure

The finite element model of the wharf frame structure was established, and the transient dynamic analysis of the frame structure under different damage conditions was made. Then, the acceleration response curve of the structure under different working conditions could be obtained.

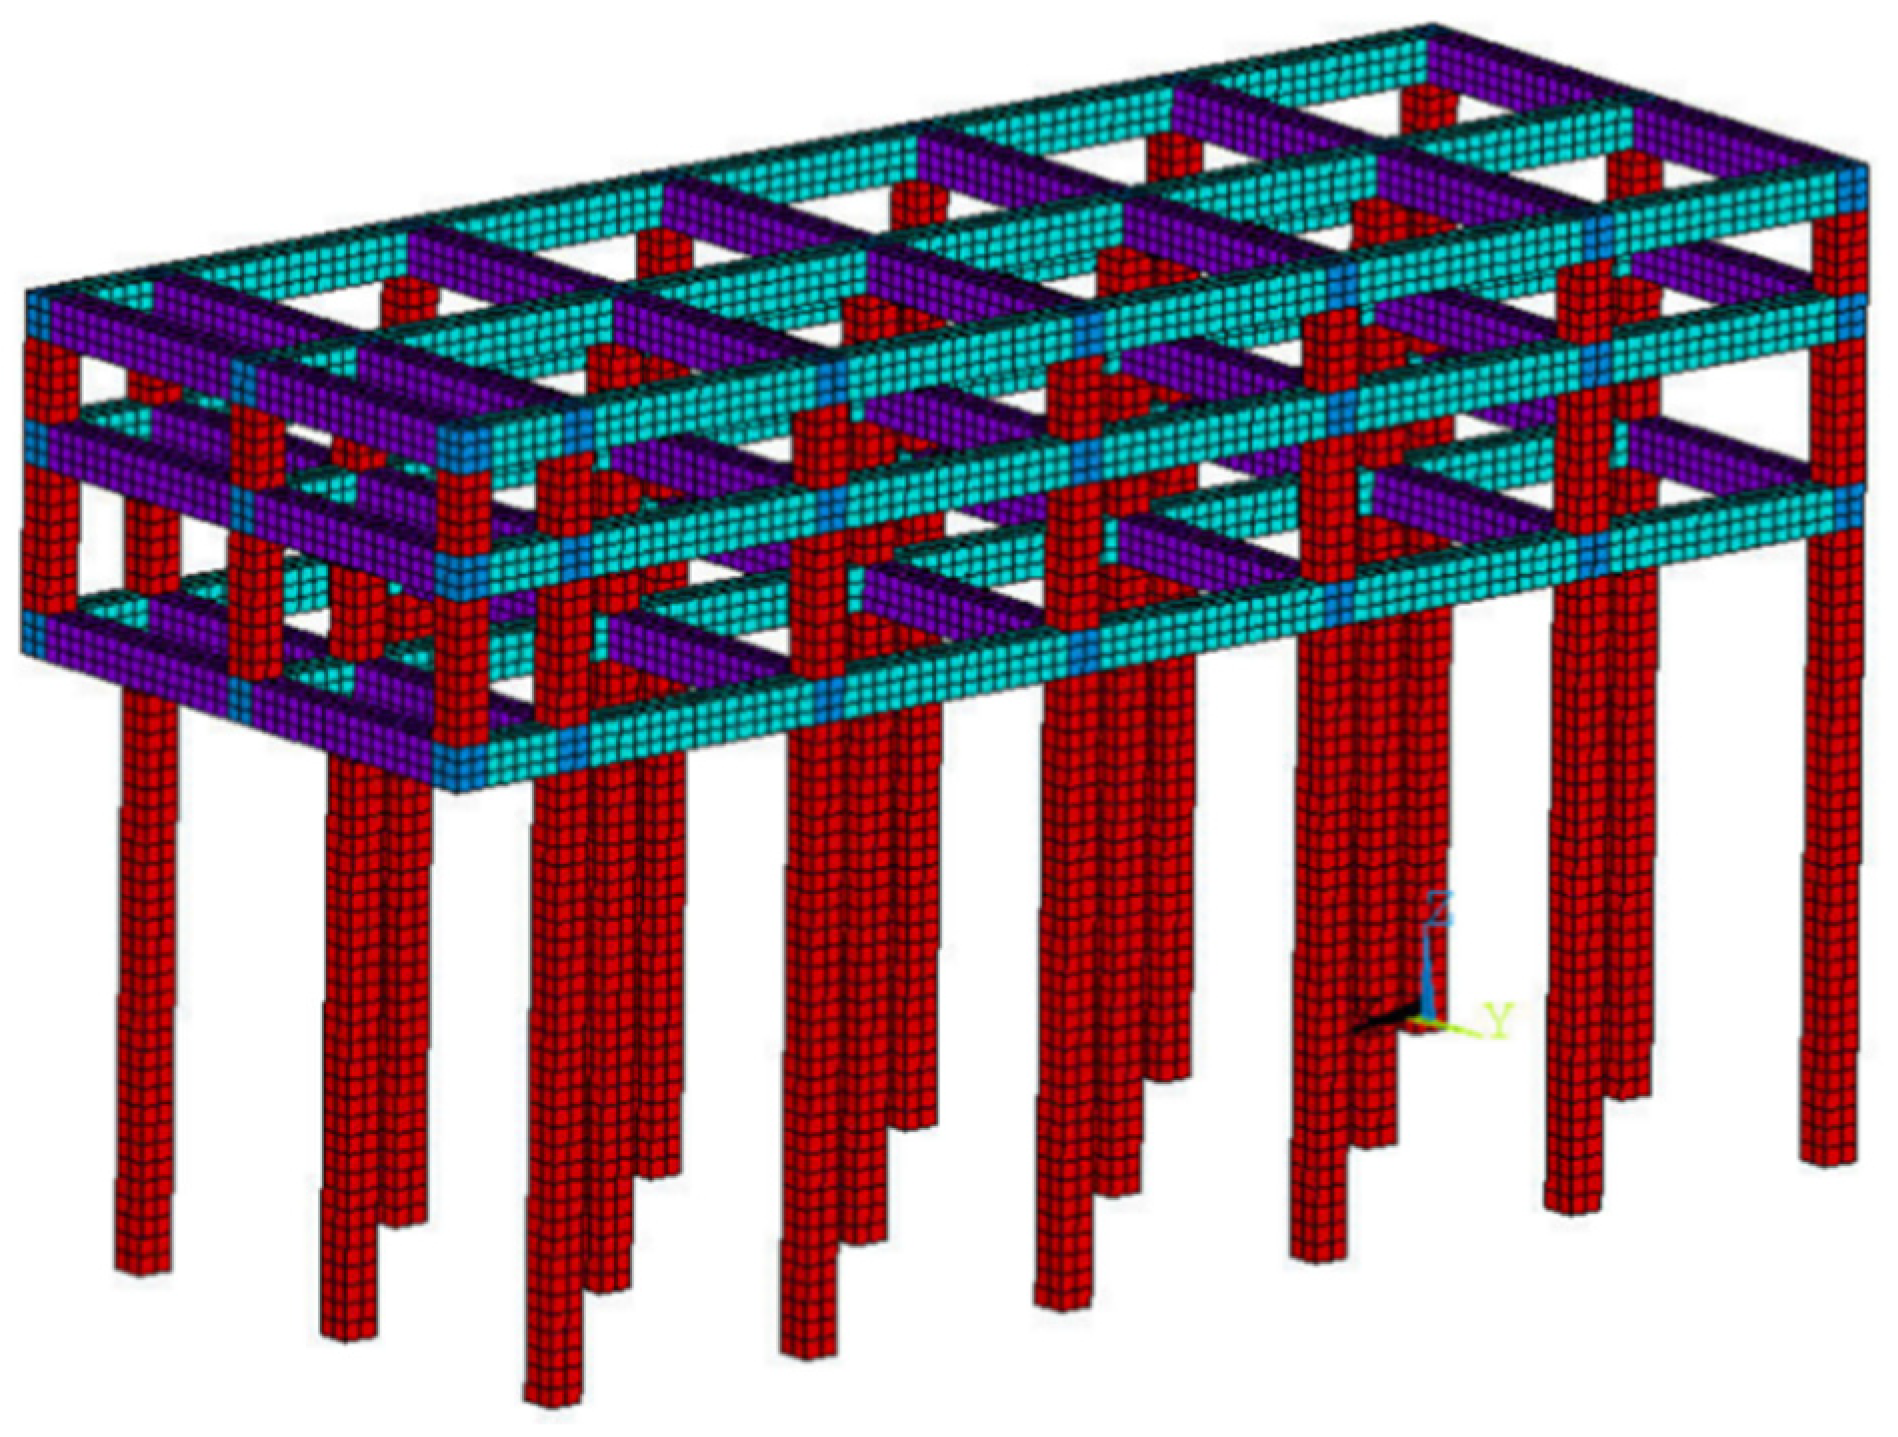
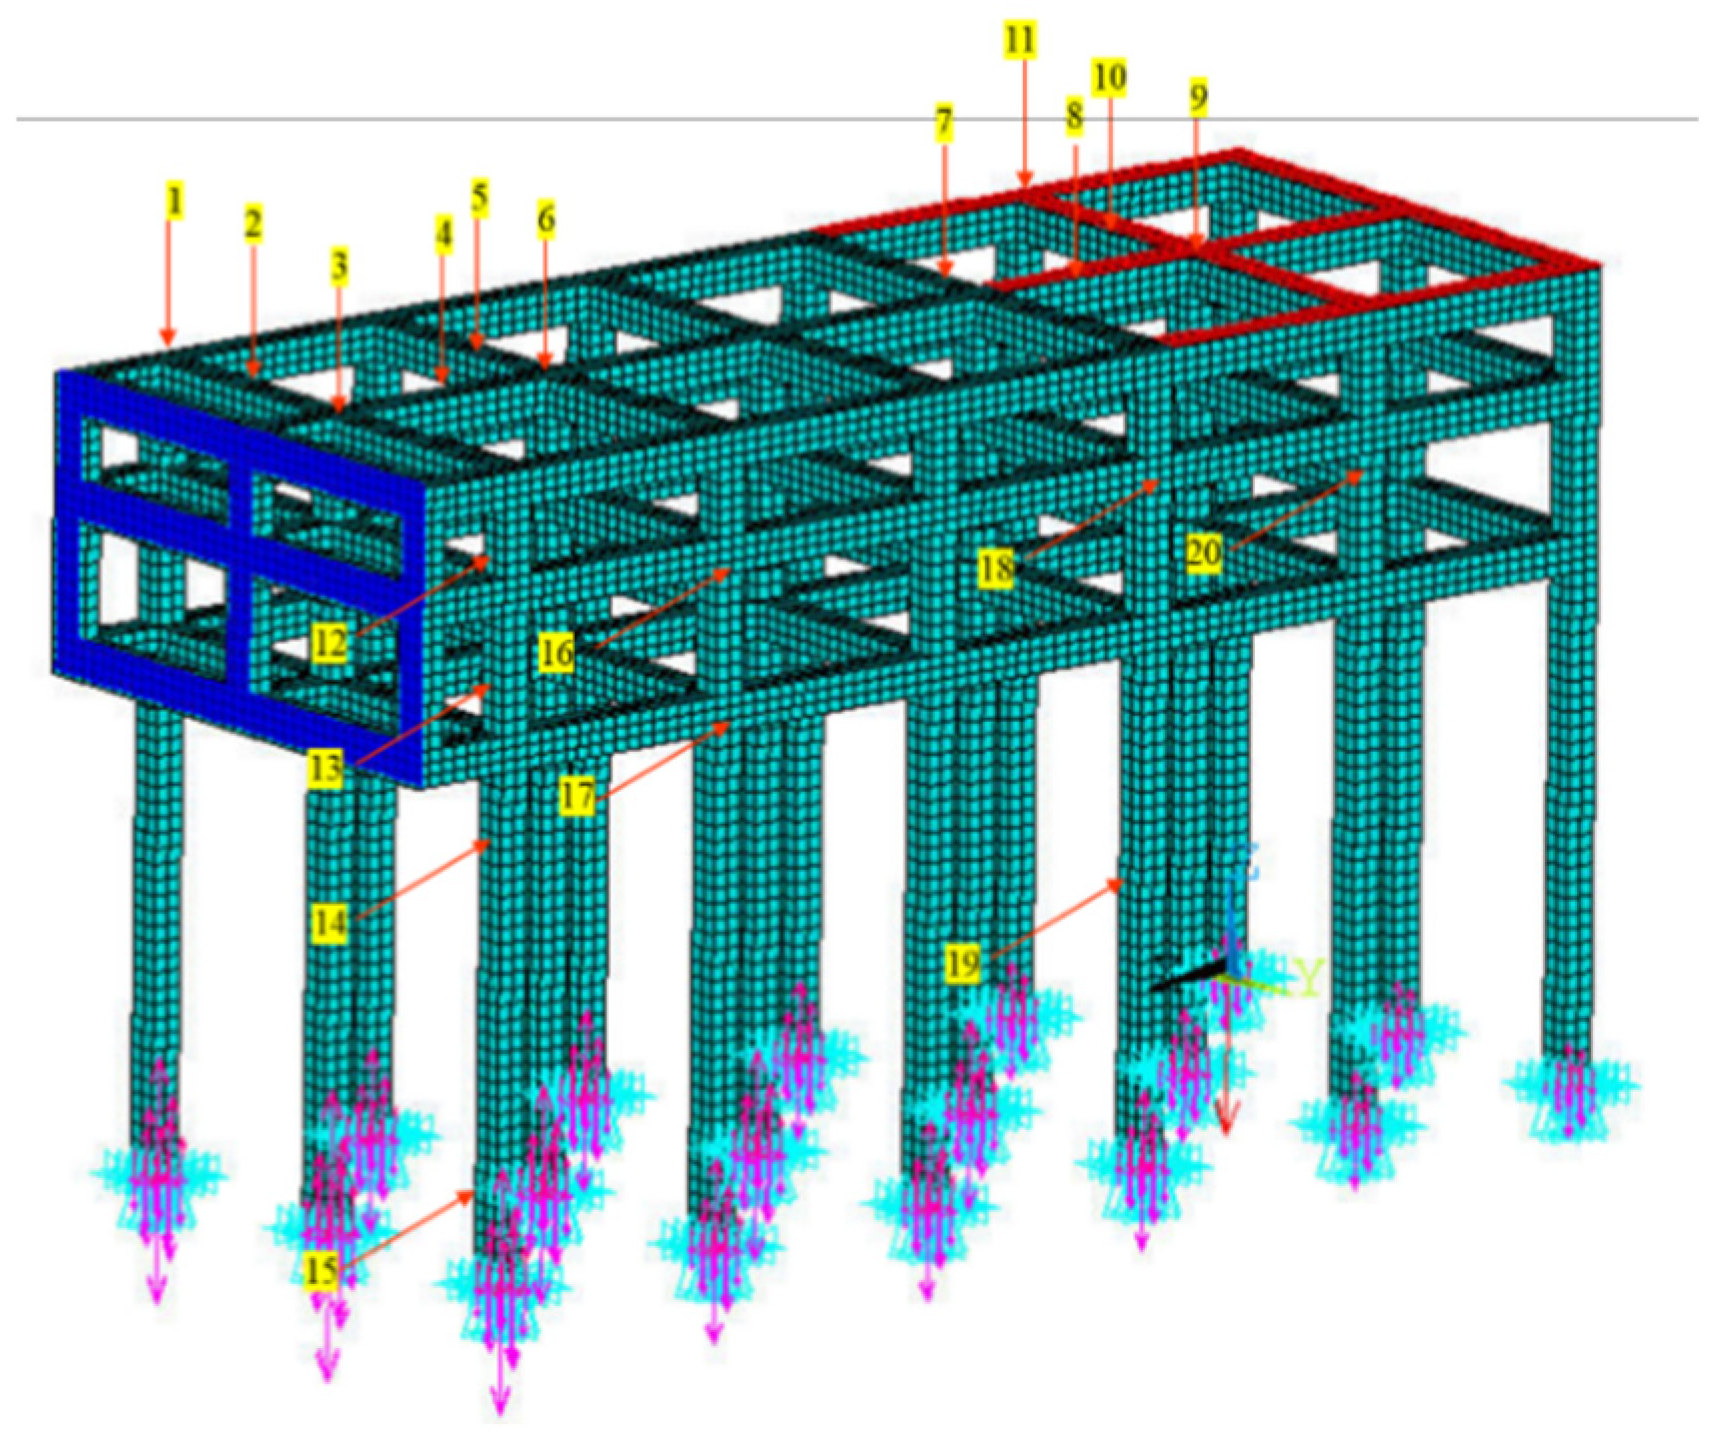
3.1. Establishment of Finite Element Model of Wharf Frame Structure

3.1.1. Basic Settings of Finite Element Model of Wharf Frame Structure

The wharf structure of a port area in Chongqing was taken as an example. Specifically, the overall method and ANSYS finite element software were used to establish a three-dimensional finite element model with the solid concrete 65 solid elements as the main elements and the link180 elements as the reinforcement elements. In addition, the model established is 6 rows and 2 spans. The piles are square piles with a side length of 600 mm and a height of 15 m. Furthermore, the single span of the transverse and longitudinal beams is 5 m, and the cross-sectional dimension of the beam is 600 mm × 700 mm. In addition, the model material is C35 concrete, and the material parameters are: elastic modulus E = 3.15 × 10¹⁰ Pa, Poisson’s ratio μ = 0.2, and density ρ = 2500 kg/m3. Moreover, the material parameters of the steel bar are: the elastic modulus E = 2 × 10⁹ N/m2 and the Poisson’s ratio μ = 0.27. At the same time, the beams were rigidly connected to the piles, and the bottoms of the piles were all restrained by consolidation. In addition, springs were set at the joints of both sides of the beam and other bent frames to simulate elastic boundary conditions. As for the overall structure, the method of mapping division was selected, and 300 mm space hexahedral grid was adopted. There were a total of 12,396 cells and 24,903 nodes, in which each node had 8 degrees of freedom. With reference to the relevant domestic specification “Code for Port Engineering Loads (JTS 144-1-2010)” and the relevant data of the actual measurement of a wharf in Chongqing [22], the loads on the wharf frame structure were respectively set as: self-weight load (RC unit weight γ = 25 kN/m3), front yard stacking load q1 = 30 kPa, and berthing load F0 = 350 kN. The structure self-gravity is the volume force, while the stacking load and the berthing load are set as the surface force. The finite element model of the wharf frame structure is shown in Figure 1.

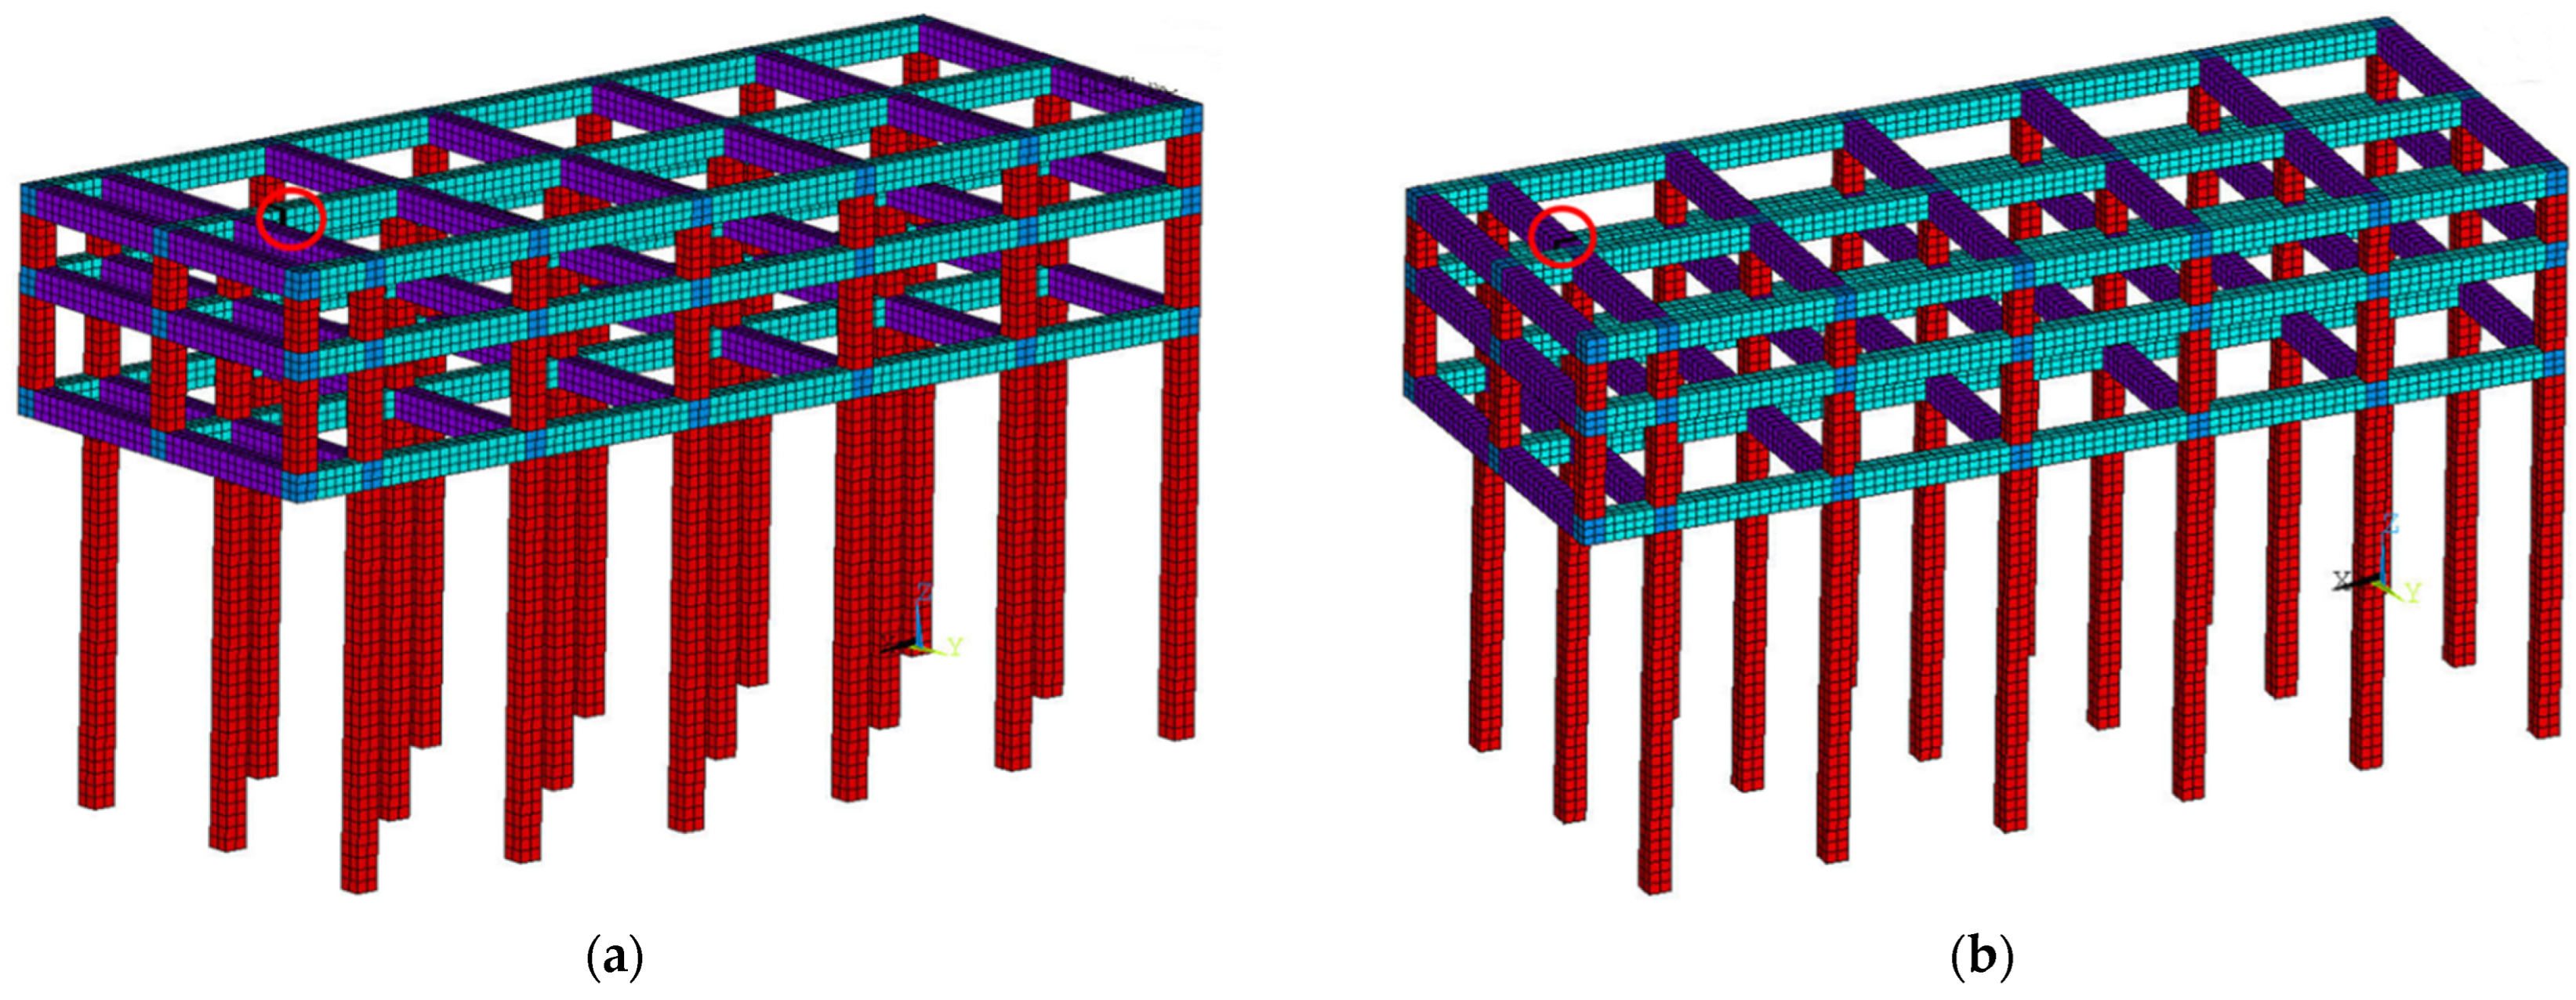
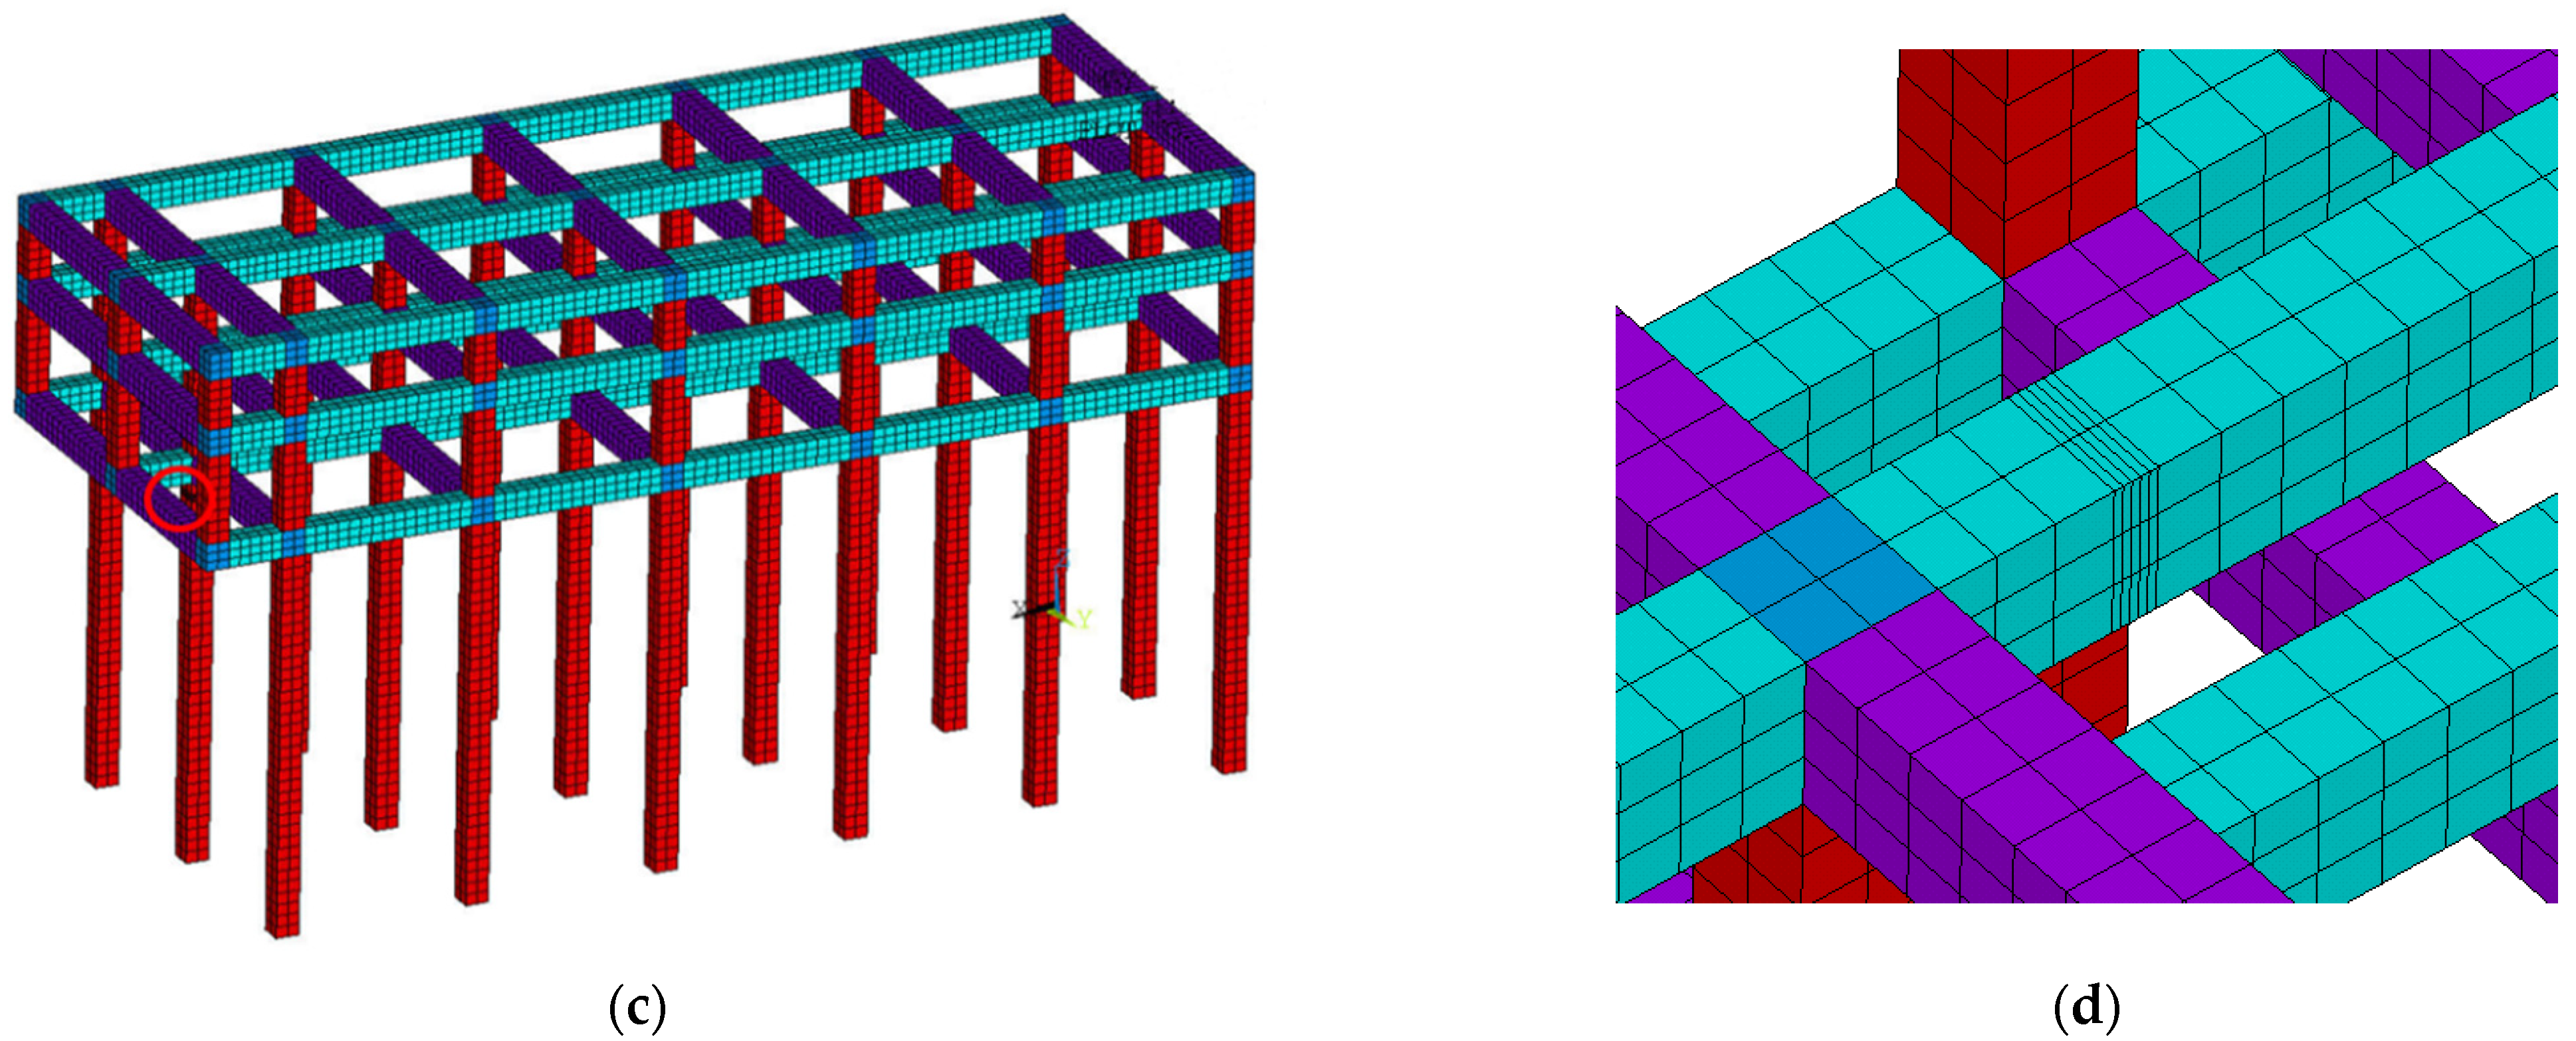
3.1.2. Damage Settings of Finite Element Model of Wharf Frame Structure

In view of the symmetry and common locations where damage occurs, the damage of the wharf frame tends to occur near the nodes. Thus, the beams, longitudinal beams, and piles are respectively damaged at the near nodes. This paper simulated the structural damage by reducing the elastic modulus, and set the strength loss 20%, 40%, and 60% respectively (i.e., the elastic modulus values are E × 80%, E × 60%, and E × 40% respectively). In terms of the structure, the size of the damaged section on the beam is 0.2 m × 0.6 m × 0.7 m, and the size of the damaged section on the pile is 0.2 m × 0.6 m × 0.6 m. Moreover, elements of the damaged section were selected for dense division, and a 40 mm space was used as the grid to divide the damaged section. The damaged part was locally dense, and the grid was classified into a 40 mm space. As shown in Figure 2a–c, the position indicated by the red circle in the damaged wharf frame structure is the damaged section. In addition, Figure 2d shows a partial enlarged view of the damaged part of the wharf frame structure.

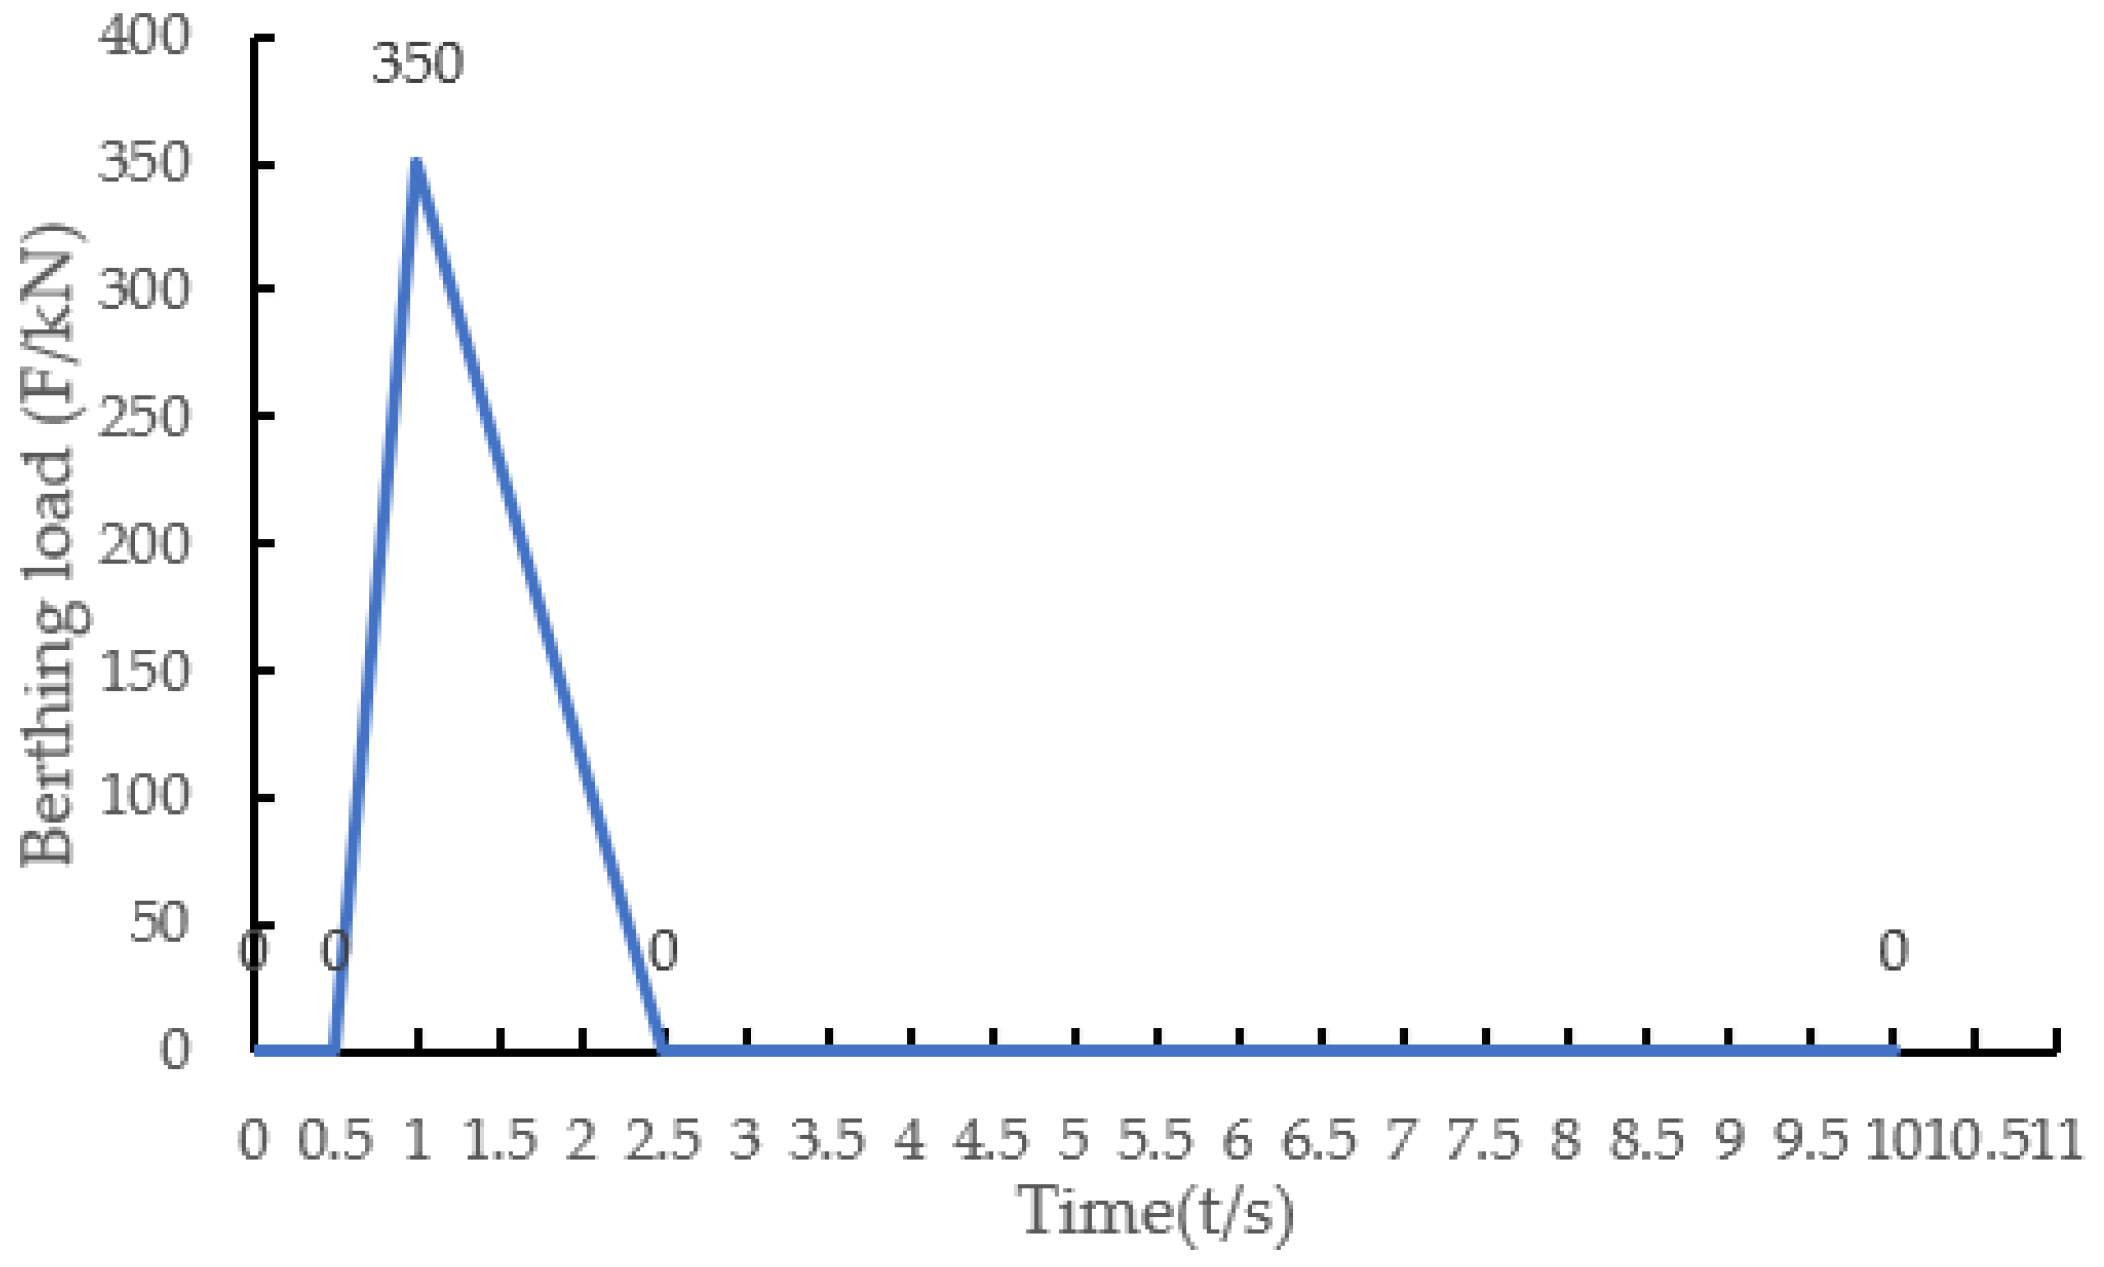
3.1.3. Structure Loading and Setting of Response Points

With reference to the measured data and relevant specifications, a mooring force F = 350 kN was applied on the mooring surface of the mooring member. The ship collision load was applied at 0.5 s, the impact force reached the peak value of 350 kN at 1.0 s, and the impact force value dropped to 0 at the end of the 2.5 s impact. Apart from that, a stacking load of P = 30 kPa was applied to the top beam at the yard position in front of the wharf frame structure. The time course of the dynamic analysis was 10 s, and the time step was set to 300 steps. The time history curve of the impact force is shown in Figure 3.
Under the combined action of the combined load with the ship collision load as the dynamic load, the dynamic response of different positions of the wharf frame structure is different. After the damage occurs, the dynamic response characteristics of the structure in different damage states will also be different. In order to explore the change law of structural damage identification index due to damage degree and damage location, it is necessary to select appropriate response points on the structure.
Since the established finite element model of the wharf frame structure is symmetrical along the middle longitudinal beam, the selected response points can be distributed on one side. Beyond that, the selected response points need to be representative. Therefore, it is necessary to set the response points on the upper, middle, and lower parts of the longitudinal beams, beams, and piles. Meanwhile, the collision occurs at the forefront of the ship member, and the load on the front and rear of the structure is different. Hence, it is important to set response points at the front and rear of the frame structure. In order to make the response points more representative and observable, this paper selected the pile-beam node, the middle of the front crossbeam, the middle of the front longitudinal beam, the position of the near node of the front pile, the position of the front pile foundation, and the middle of the rear crossbeam to set the response points. The locations of the load application and the response points is displayed in the Figure 4. The red part is the position where the stacking load is applied, and the blue part is the position where the ship impact load is applied, and the numbers 1–20 with arrows represent the locations of response points 1–20.

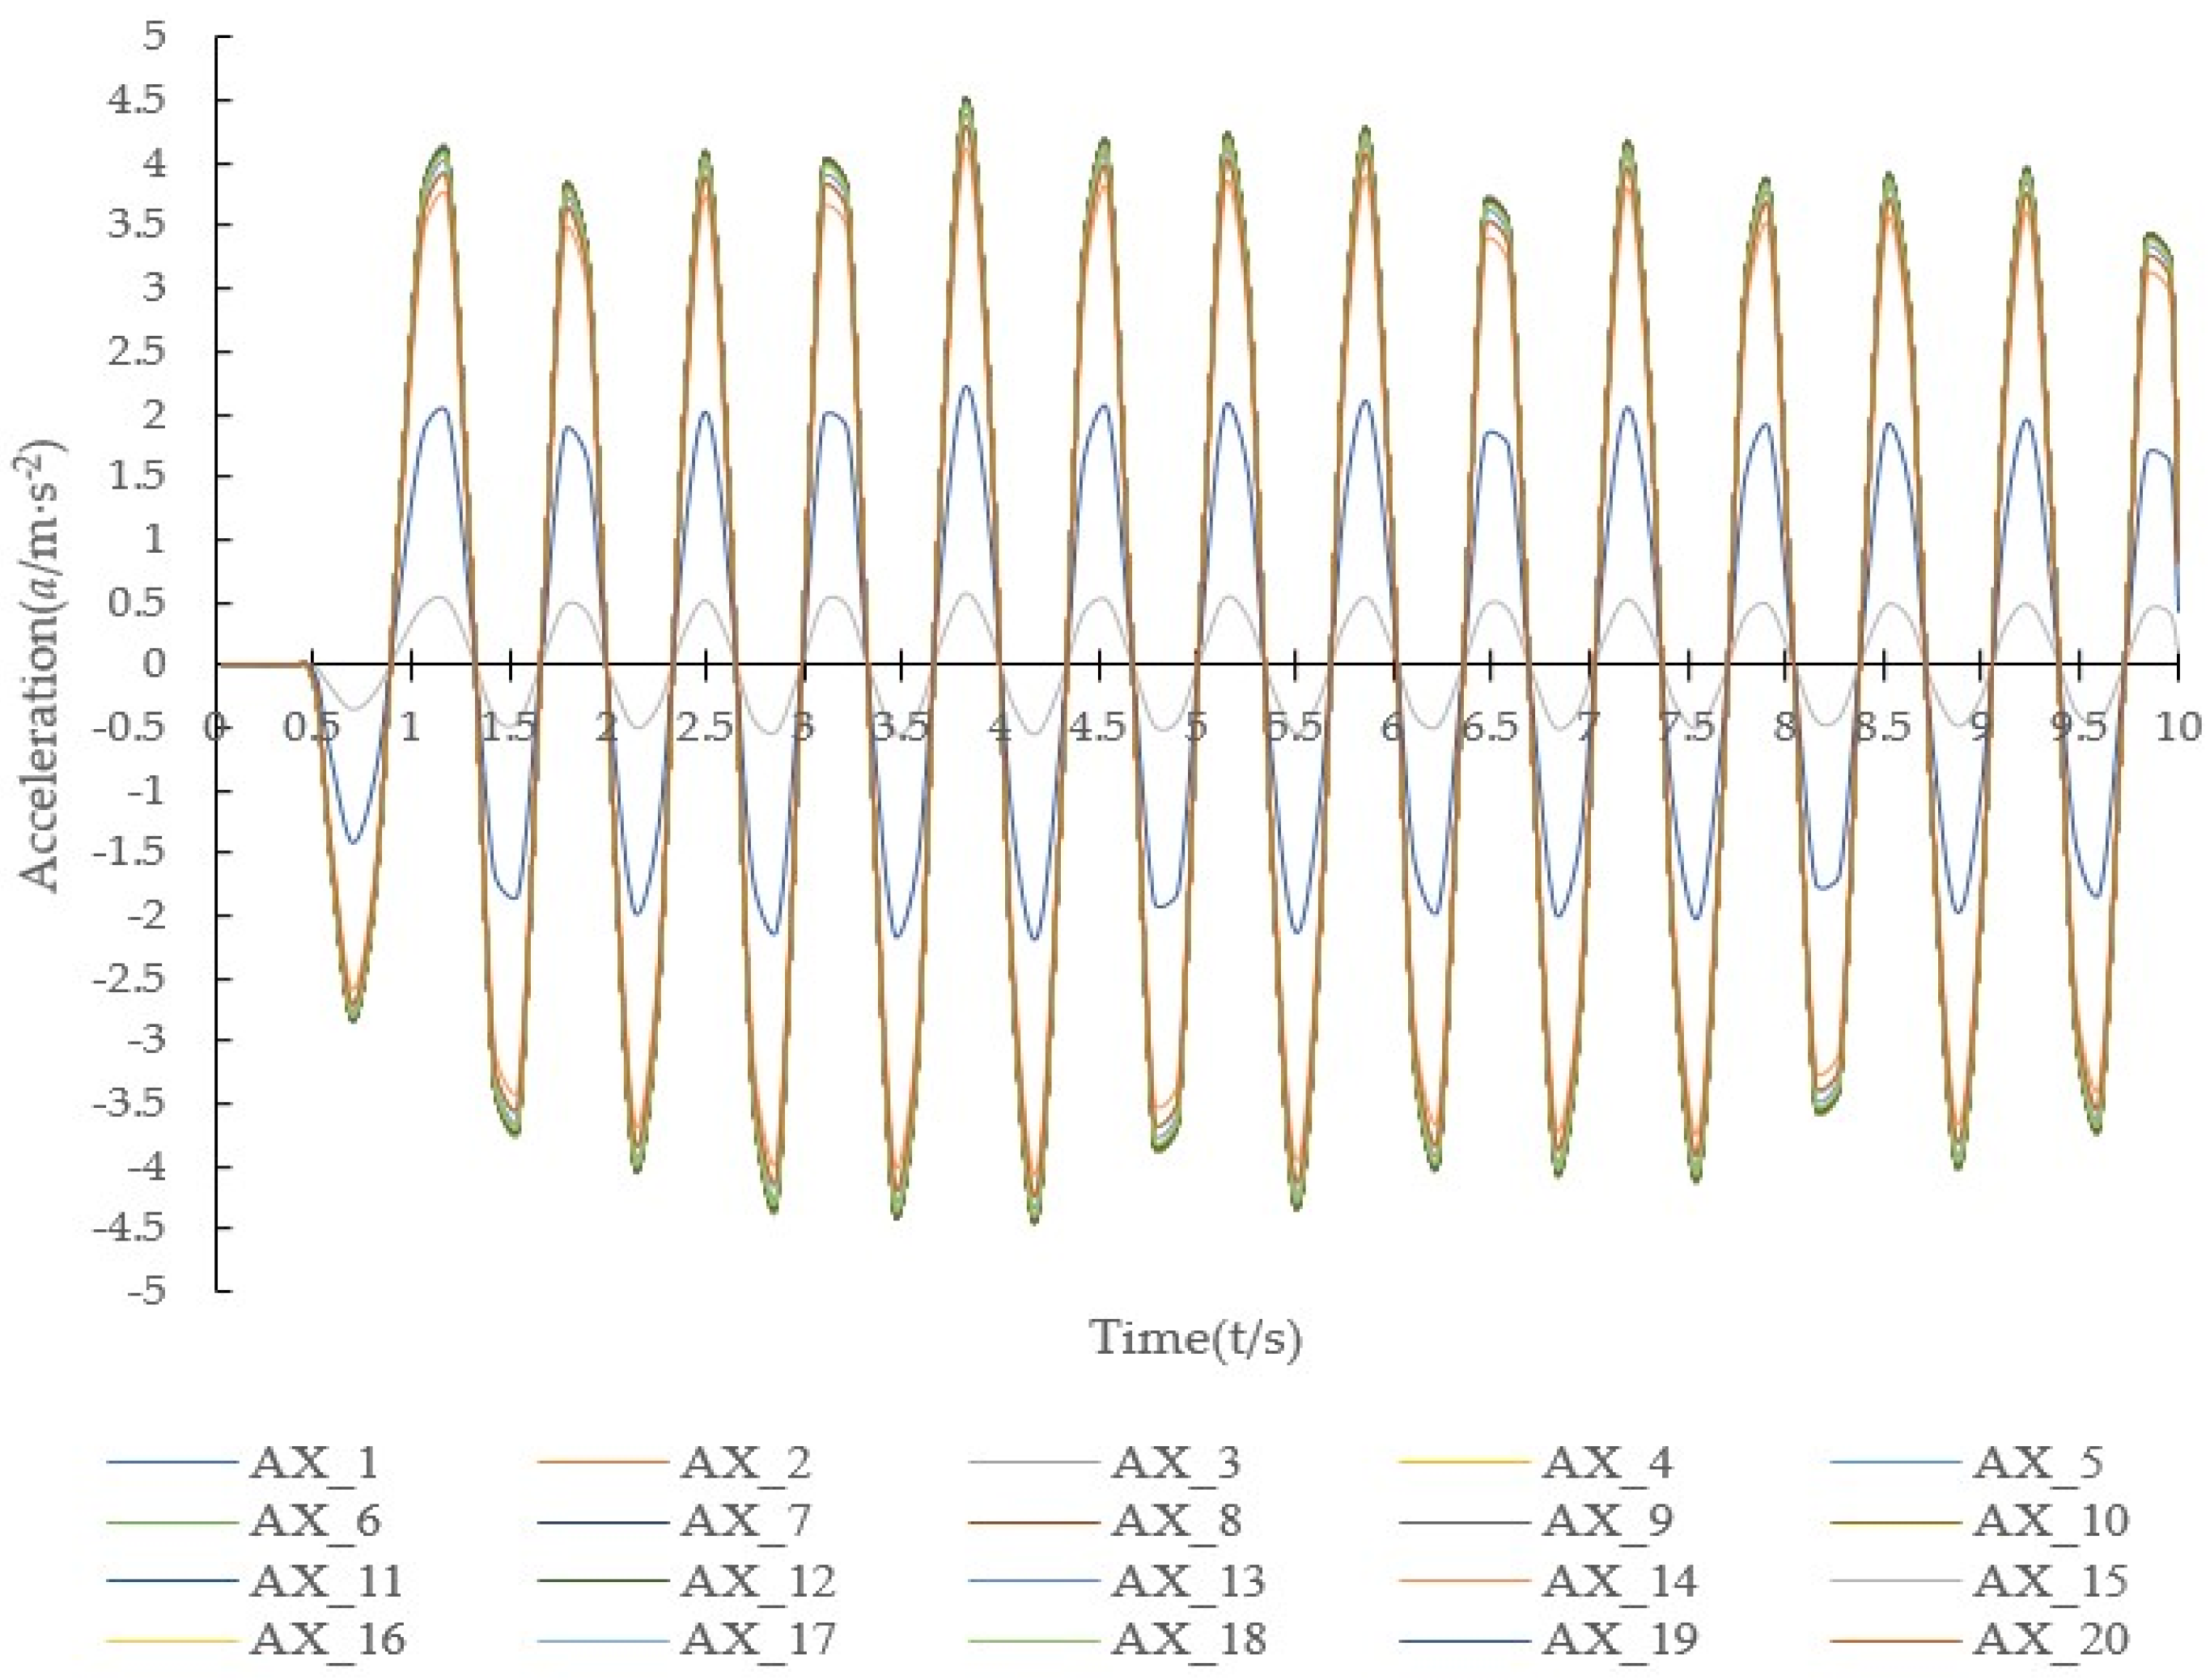
3.2. Analysis of Transient Dynamic Response of Non-Damaged Wharf Frame Structure

After the analysis of the transient dynamic response, the transient dynamic acceleration response curve diagram of the undamaged frame structure under the load combination action of the ship collision force as the main dynamic load is presented in Figure 5:
The curves in Figure 5 show that, after 0.5 s of dynamic load is applied, the acceleration curves present symmetrical regular fluctuations in the 10 s interval. Obviously, the acceleration response value of the upper structure of the frame is higher than that of the pile foundation. What’s more, the dynamic response of the frame structure of the wharf gradually decreases from the upper structure to the pile foundation. For the response points on the same level, the closer the point to the dynamic load, the stronger the acceleration dynamic response.

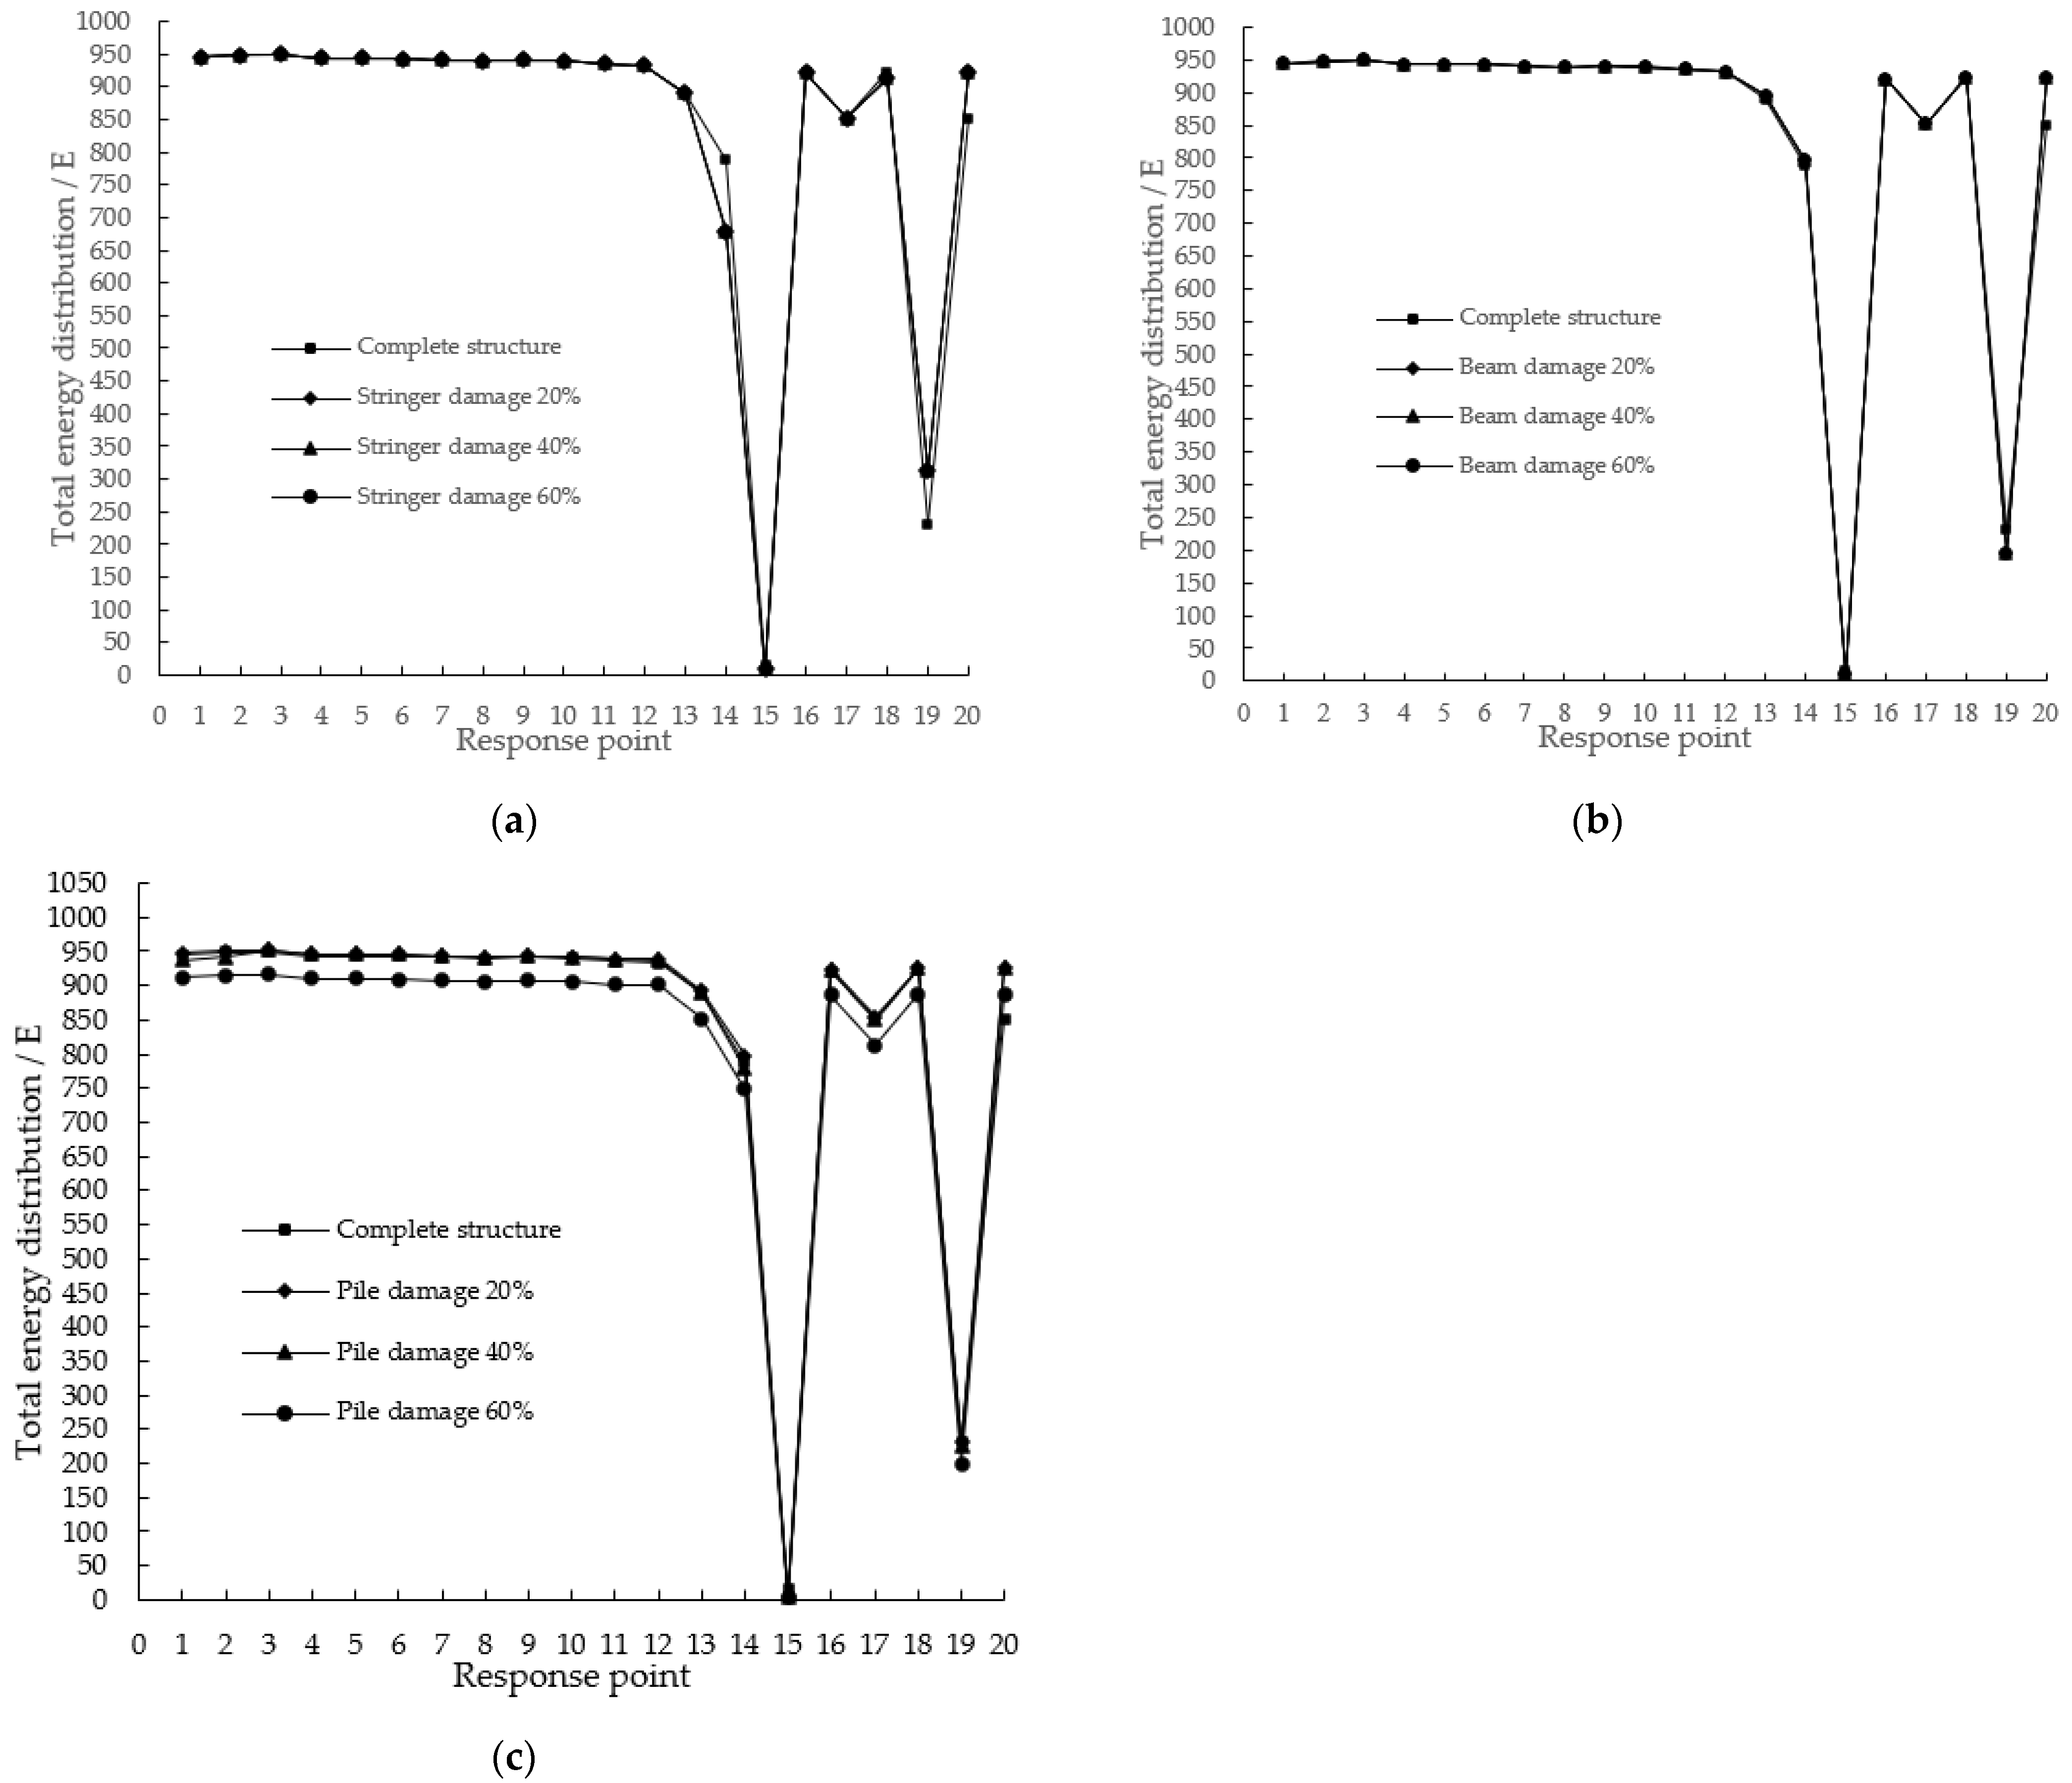
3.3. Analysis of Transient Dynamic Response of Damaged Wharf Frame Structure

Based on the comparison of the non-destructive conditions, the analysis of the wavelet packet total energy distribution curves of the transient dynamic acceleration response of the wharf frame structure with damages of 20%, 40%, and 60% under the combined action of dynamic and static loads is shown in Figure 6.
The comparative analysis of the dynamic response energy distribution curves of different damage degrees reveals that, the energy distribution of each response point before and after the damage is relatively consistent, yet the overall energy value has a certain change. First, the energy has little changes after damage occurs on the beam, and the energy change is relatively more obvious when 60% of the damage occurs. However, the damage happens on the pile, which can be seen in Figure 6c, and with the deepening of the damage, the energy change is more obvious. Second, as the response point is farther away from the force surface of the structure, the total energy value decreases, indicating that the total energy inside the structure has a certain escape as it moves away from the force surface. The energy change of the front structure is relatively greater. Third, after the damage occurs, the acceleration signal is subjected to wavelet packet energy transformation and the signal presents a downward trend. As the damage degree of the damaged section of the structure increases, the total energy of the wavelet packet transform of the acceleration signal decreases accordingly. That is to say, when the ship impact load is applied to the wharf frame structure, the energy dissipation of the damaged structure is obvious.

4. Analysis on Changes of Damage Identification Index of Wharf Frame Structure under Different Damage States

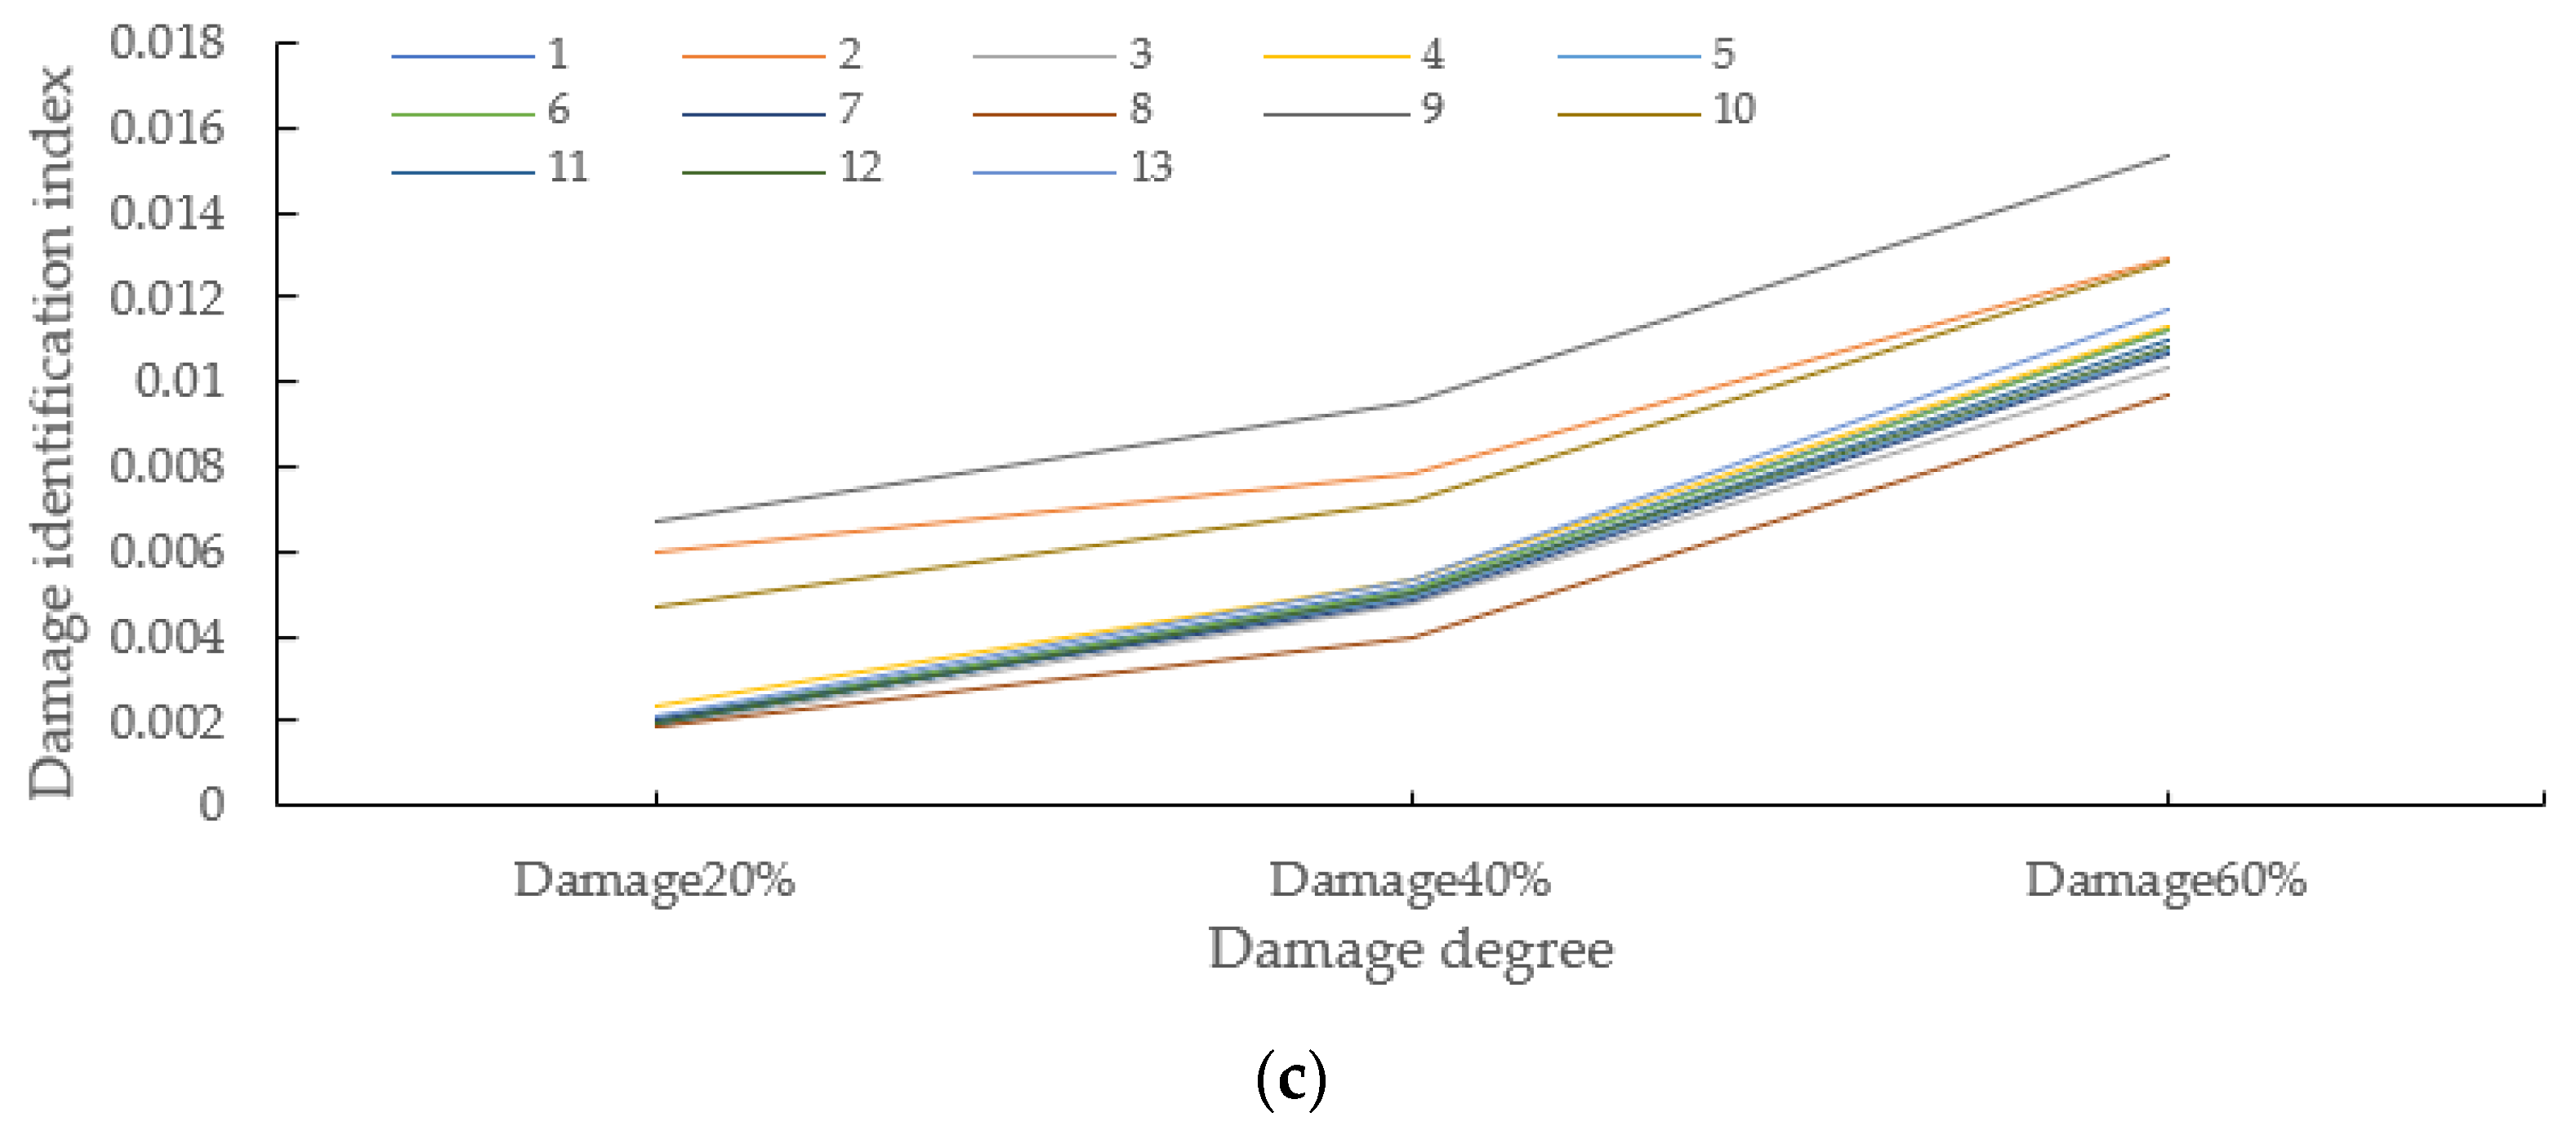
4.1. Variations of Damage Identification Indexes for Wharf Frame Structures with Different Degrees of Damage

Taking the damage on the stringer as an example, when the frame structure of the wharf is damaged by 20%, 40%, and 60% respectively, the damage identification index changes of each selected response point are displayed in Figure 7a below.
As shown in Figure 7a, under the combined action of dynamic and static loads, when the damage degree of the longitudinal beam increases from 20% to 40% to 60%, the damage identification indicators of each response point present an increasing trend. Despite more obvious damage index of the response point at the lower part of the structure, the maximum index change is at the 15th response point of the pile foundation. Compared with the response point of the pile, the response point of the superstructure has a much smaller change in damage index. Meanwhile, this phenomenon also exists after the damage occurs in other locations. This is because the pile itself is more constrained, a small acceleration change during a ship collision can produce a larger rate of change, and the resulting damage identification index value will increase correspondingly. Notably, it also causes the change rule of the damage index to be difficult to show on the curve. In order to clarify the change rule of the damage identification index under the combined action of dynamic and static load, the damage index of the partial response point of the superstructure has been selected to obtain the damage index change of the same position with different damage levels (see Figure 7b).
As displayed in Figure 7a,b, the damage identification index of the energy change rate is relatively increased at the response points 2, 9, 10, 14, 15, and 19, indicating that under the impact of the wharf frame structure, the damage response of setting response points at the structural positions such as piles and beams is stronger than the response of the joints. Therefore, setting the response points at the long structure position is more favorable for structural damage judgment. In addition, the three curves of 20%, 40%, and 60% damage at the same position of the structure rise layer by layer, indicating that with the deepening of damage degree, the damage index shows an increasing trend. The overall increase trend can be observed from Figure 7c. The trend is close to linear, suggesting that the damage index presents an approximately exponential increase trend with the deepening of the damage. After the degree of damage exceeds a certain degree, the acceleration energy change rate of the structure under dynamic load will increase. Namely, the degree of energy dissipation will increase. That is to say, the damage identification index can better describe the development of the damage degree of the wharf frame structure under dynamic load.

4.2. Analysis on the Change of Damage Identification Indexes of Wharf Frame Structures at Different Damage Locations

The location of damage is different, and the change of damage index also has its regularity. Taking structural damage of 40% as an example, when the longitudinal beams, piles, and crossbeams are damaged by 40%, the damage identification indexes change at response points of the wharf frame structure (see Figure 8).
As shown in Figure 8, when the longitudinal beams, beams, and piles are damaged at 40%, the change trend of the damage identification index of each response point is roughly the same. Although there is a little change in the damage identification index of the first 13 response points, the damage identification index set on the pile changes more obviously. When the longitudinal beams and beams at the same height have the same degree of damage, the value and change of the damage identification index are roughly the same. Apart from that, the damage identification index of the response point of the longitudinal beam is relatively obvious. After the pile position of the lower structure is damaged by 40%, the damage identification indexes of the response points on the upper structure are about 1.2, while the damage index value of the response point on the pile is 4.82. That is to say, after the damage occurs on the pile, the damage recognition effect of the arranged response points is better. Therefore, the energy change rate damage identification index effectively recognizes whether the structure is damaged at the position of the pile or the beam by the damage index value of the response points arranged on the structure. However, the specific location of the damage has not been clearly determined. Thus, further exploration and analysis are needed.

5. Comparative Analysis of Damage Test of Wharf Frame Structure Based on Random Forest Algorithm

5.1. Transient Dynamic Response Test of Wharf Frame Structure

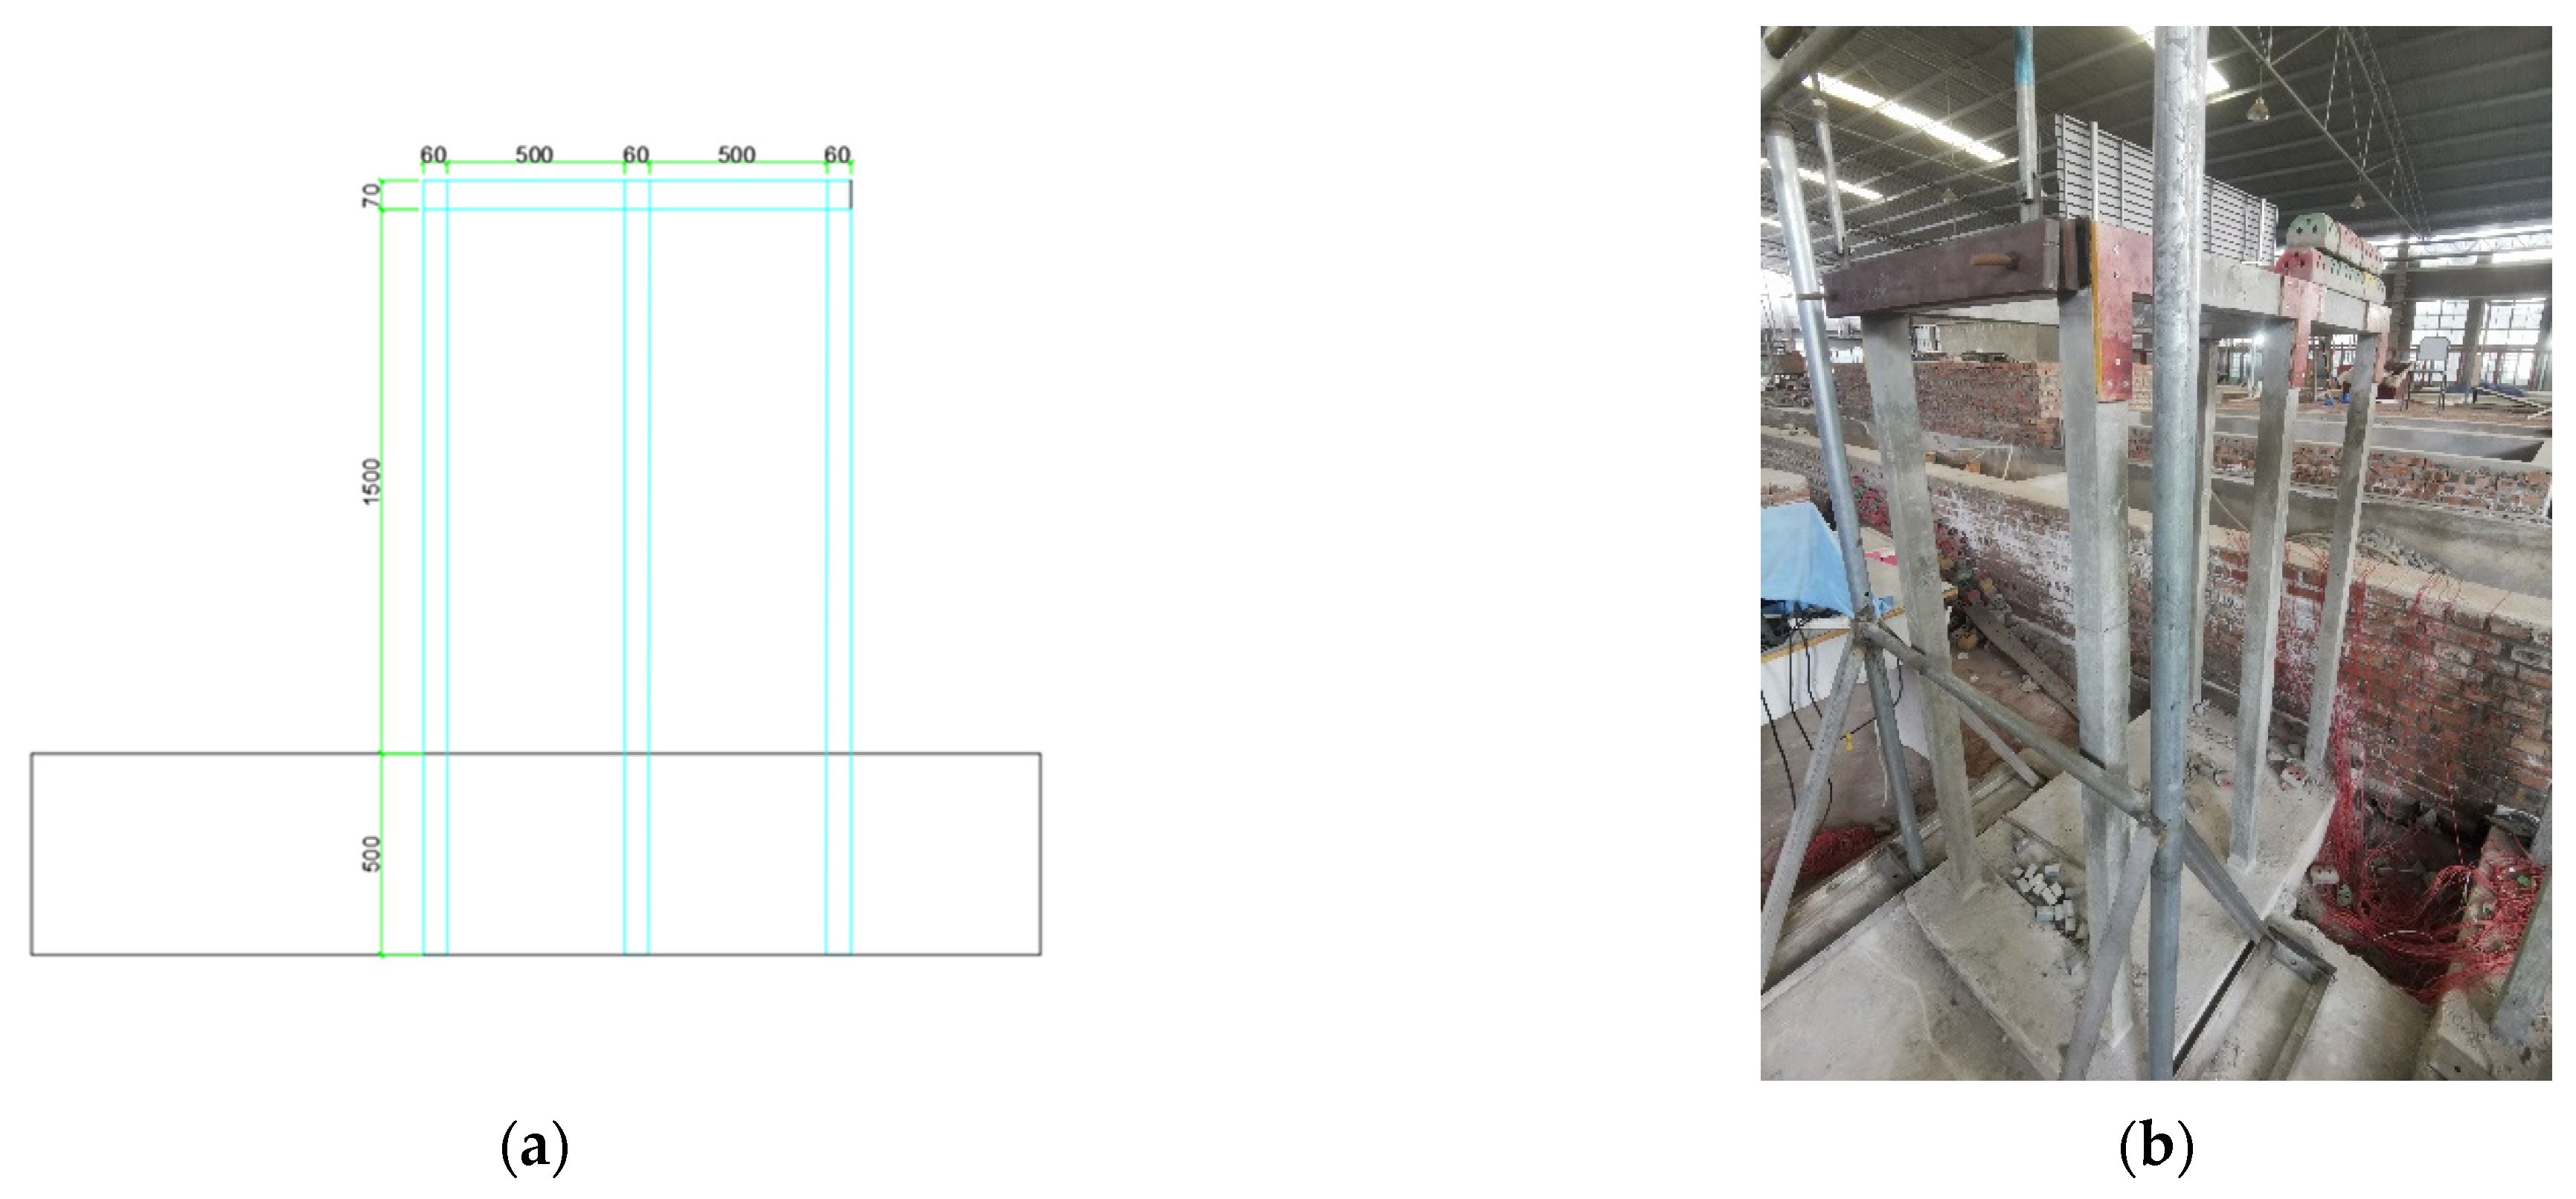
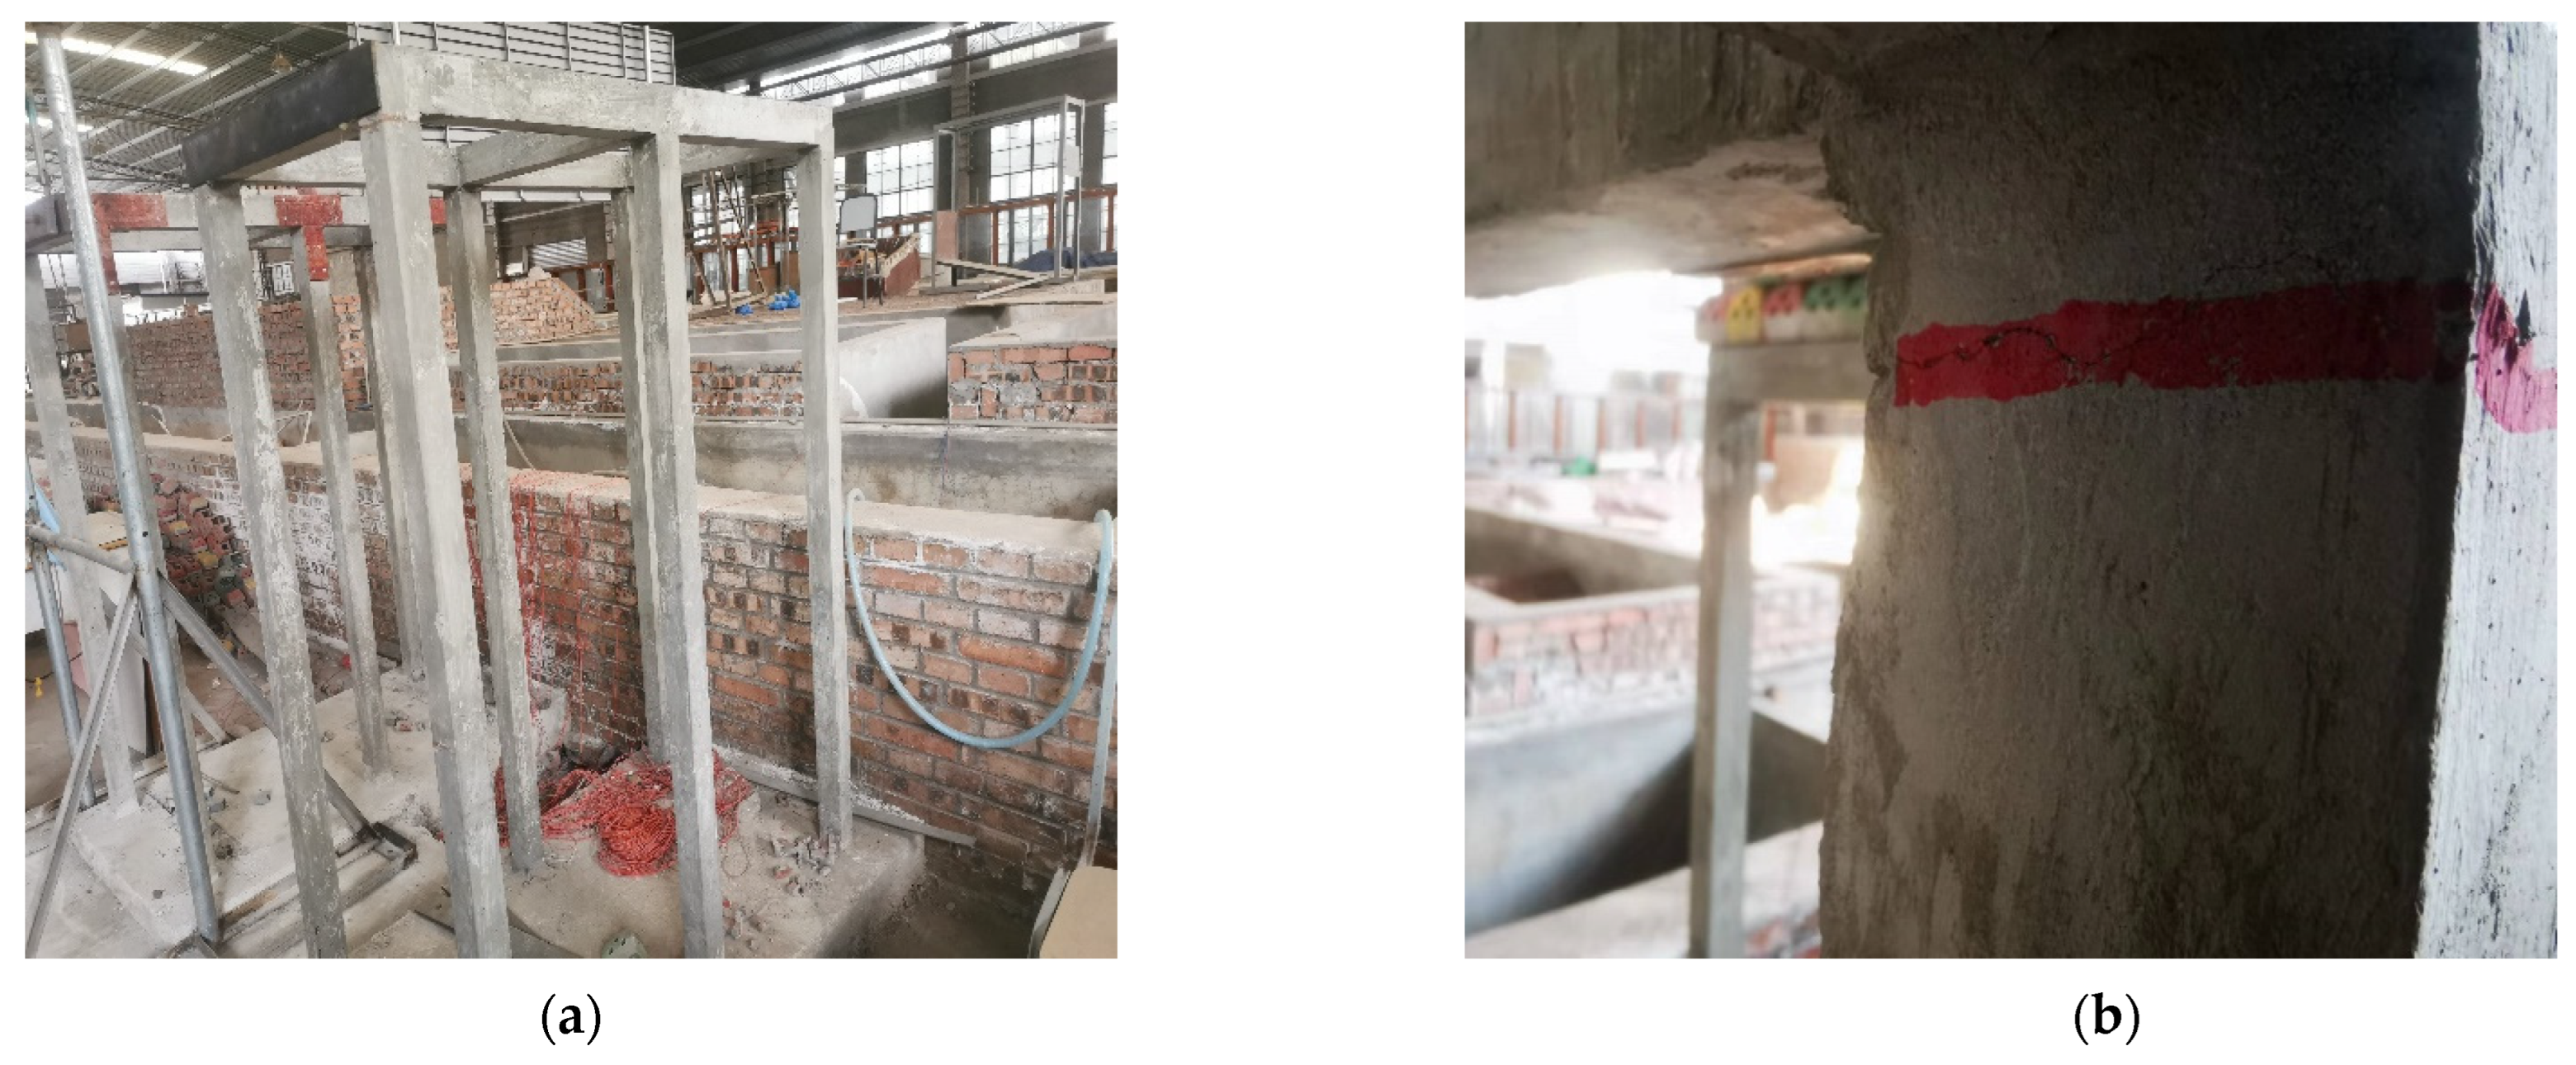
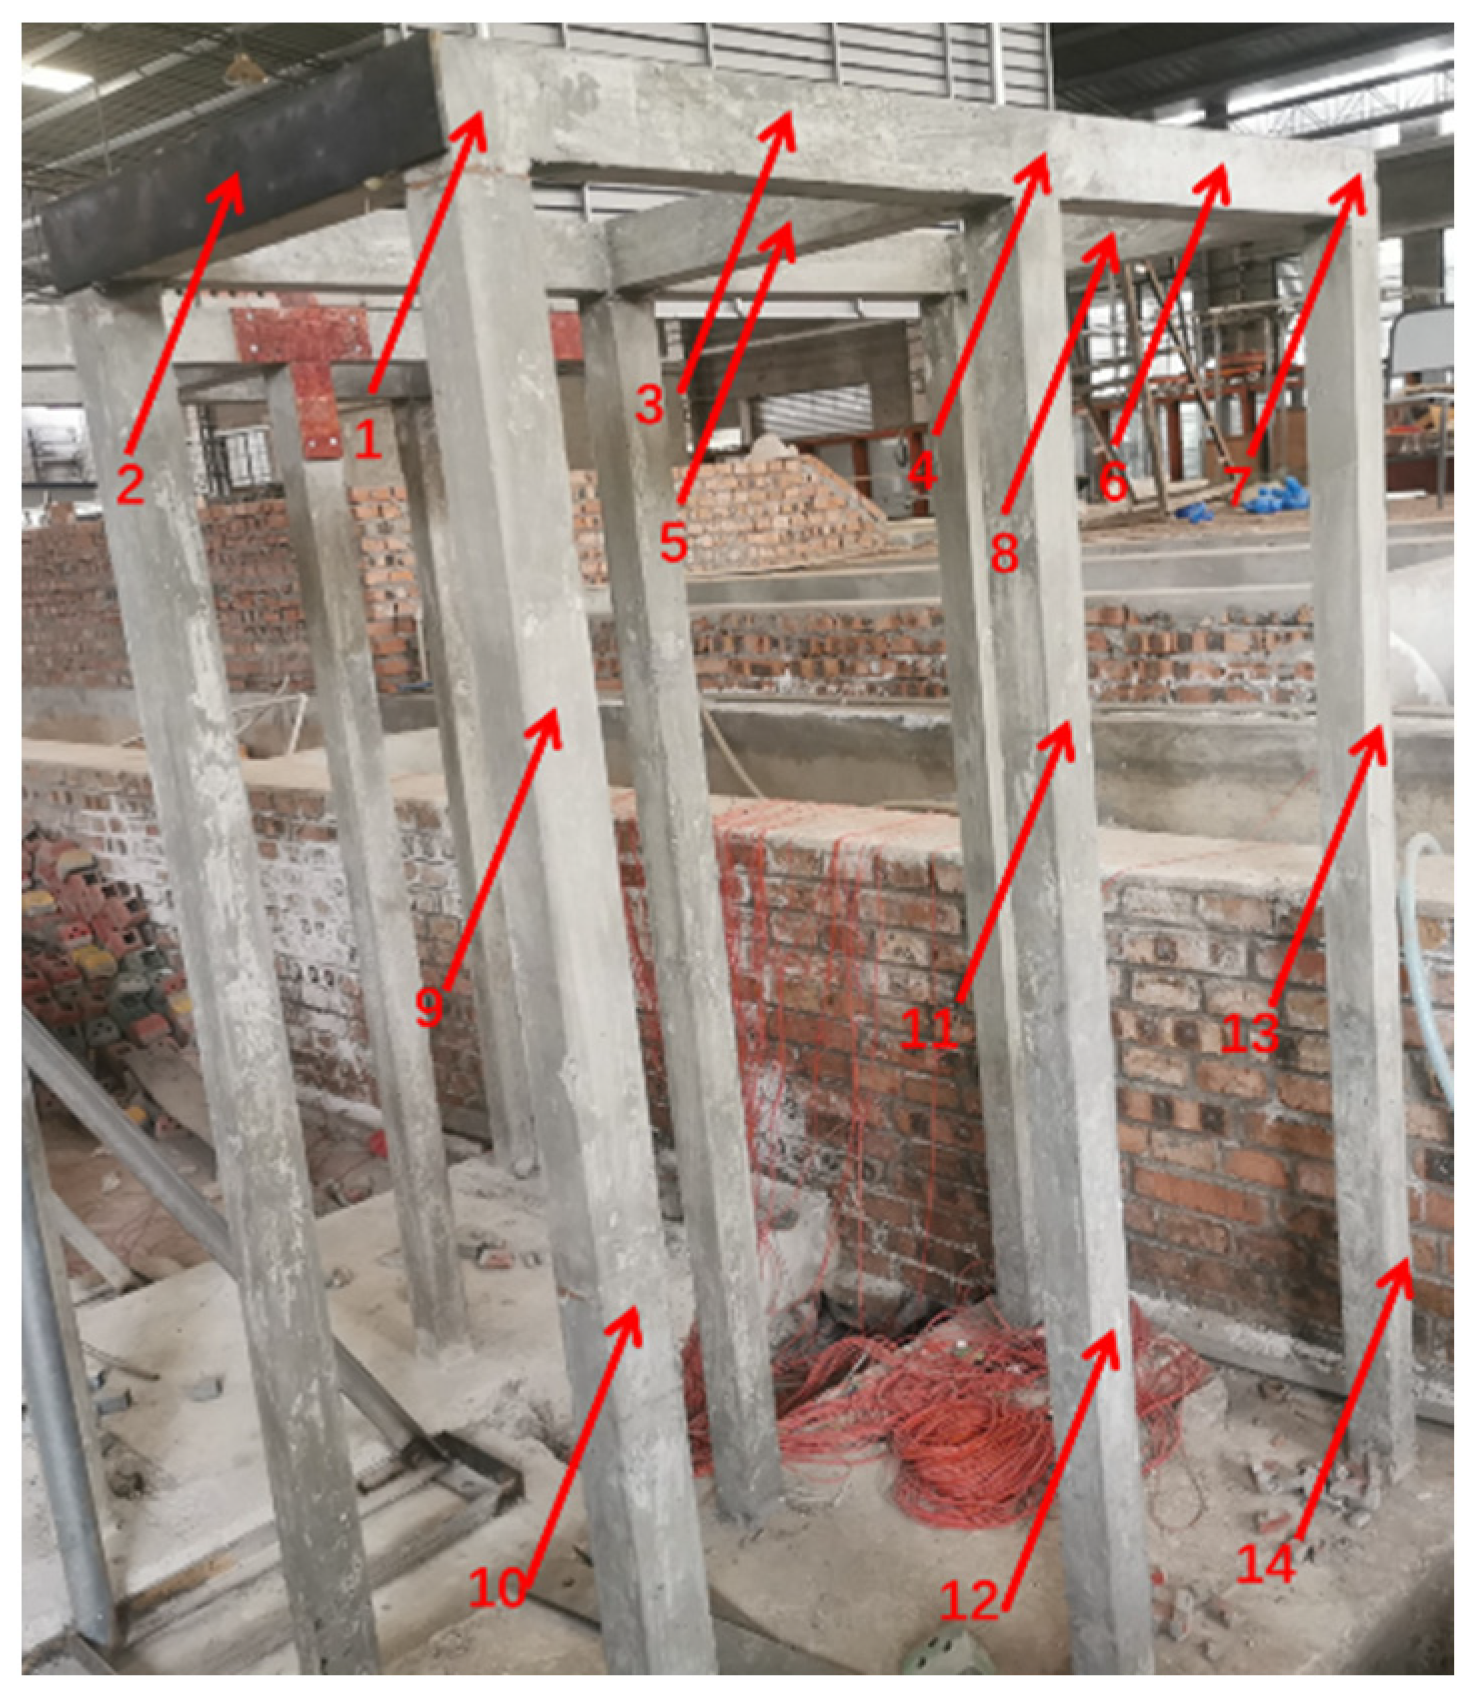
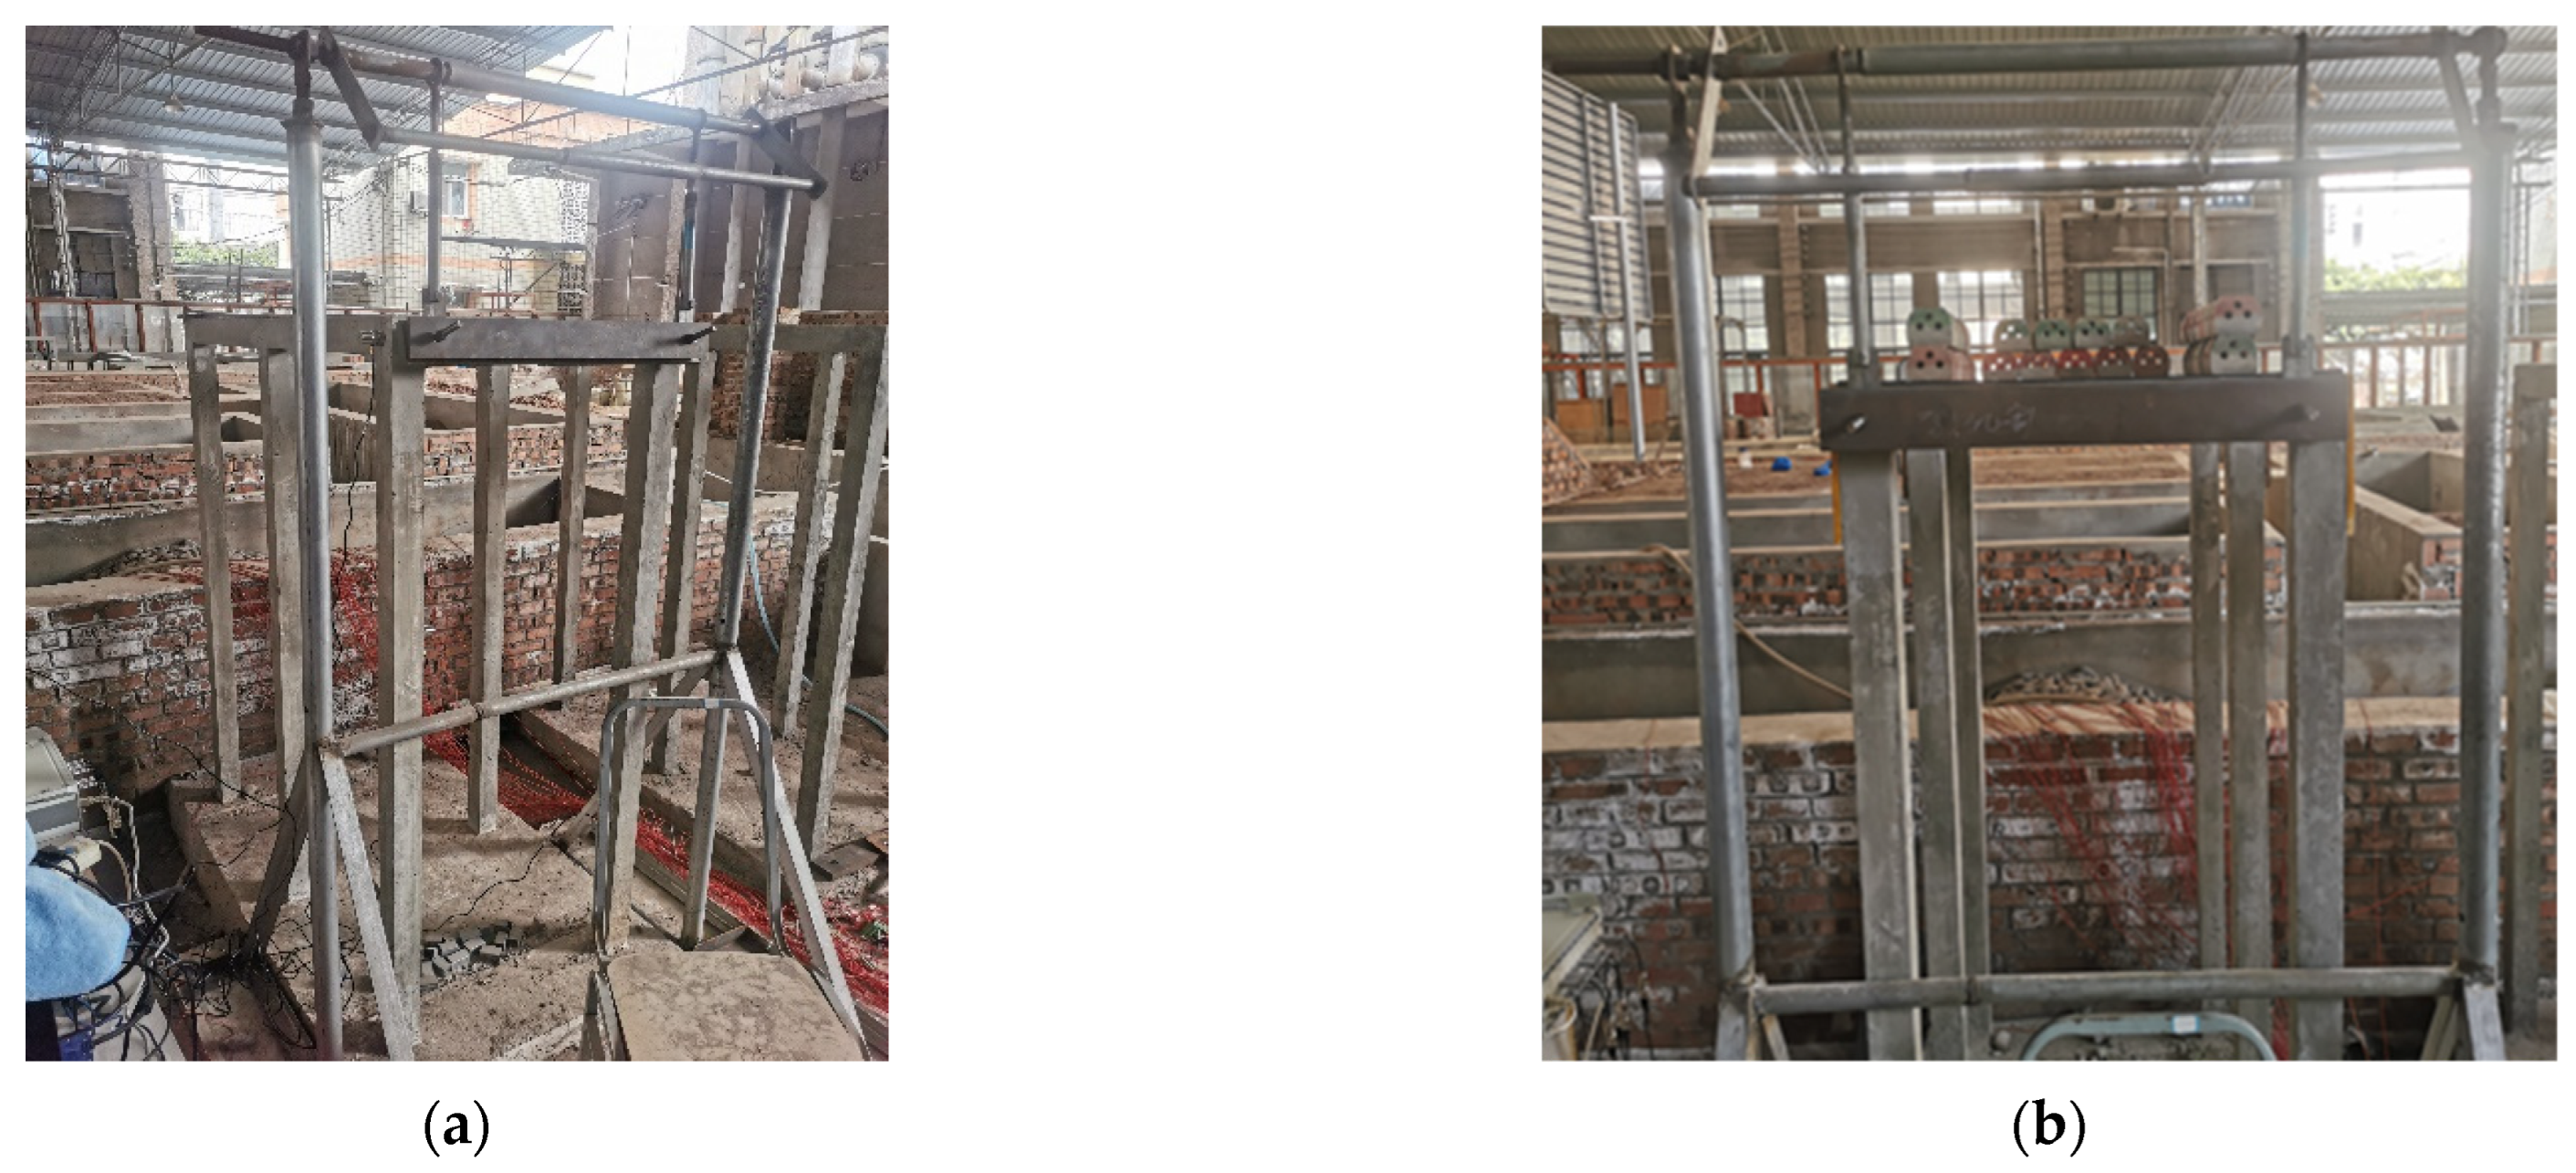
5.1.1. Wharf Frame Structure Model Making

The experimental model was simplified based on a standard structural section of a port in Chongqing. It was designed and made according to scale 1:10. This experiment mainly studied the method of transient dynamic response identification of wharf frame structure and did not reflect the actual engineering situation. Therefore, the model scale has no need to strictly follow the similarity criterion, namely, the strain similarity scale Cε = 1 is not strictly required when Cl =10. In order to ensure the similarity of failure modes, C35 concrete was still selected as the main material of the test model. The elastic modulus similarity scale of the model and prototype is CE = 1, and the bulk density similarity scale is Cy = 1. According to the dynamic similarity theory of model test CF = CE × Cl, the similarity scale of external load CF = 10 was determined. In this model, C35 reinforced concrete was adopted as the main material and the reinforcement ratio was 0.2%. The wharf frame model consists of two rows of single-layer frame in front and rear. The pile is the square pile, with height of 1.5 m and cross section of 0.06 m × 0.06 m. The longitudinal beam is a rectangular beam with a single span length of 0.5 m and a section of 0.06 m × 0.07 m.
The model was poured into a concrete base with a length of 2.5 m, a width of 1.5 m, and a depth of 0.5 m. C30 plain concrete was used to simulate the basement rock. Furthermore, the frame pile was embedded in the 0.5 m deep concrete foundation to simulate the prototype rock-socketed pile. In addition, a plain concrete hollow block was stowed above the frame model to simulate the stowing of goods. The block was made of C20 concrete material into 0.08 m × 0.08 m × 0.06 m cube, and the thickness of the hollow cube was 2 cm.
The model materials were tested by geotechnical tests. The material parameters are as follows in Table 1:
The pendulum was made of steel sheet to simulate natural excitation dynamic load. The ram steel sheet was a rectangle of 0.07 m × 0.62 m and its mass was 50 kg. In order to meet the impact force requirements, the initial drop angle of the pendulum was set to 60°, and the length of the pendulum rod was 0.8 m. At the same time, the pendulum was supported by a self-made bracket. The following Table 2 shows the experimental design scheme.
The longitudinal section of the model structure is shown in Figure 9a below. Dynamic response model test diagram of actual wharf frame structure is displayed in Figure 9b.
As a control of damage identification, a wharf frame model with damage was made under the same conditions. Then, crack damage was set at the joint position of the model pile and beam, and the damage degree was 40%. This was compared with the transient acceleration response of the complete structure. The test model with damage is shown in Figure 10.

5.1.2. Multi-Load Wharf Frame Model Test

In this test, accelerometers were arranged at the response points of pile beam joints, middle beam, middle rail, middle and lower part of pile in front, middle and back of the wharf frame structure model. Beyond that, the response points were set in sequence and sensors were arranged at the response points. The locations of response points are shown in Figure 11, and the numbers 1–14 with arrows represent the locations of response points 1–14.
The external natural excitation (ship impact load) was simulated by pendulum impact. Prior to the formal test, a WMS-6303 magnetoelectric pressure sensor was used for test so as to ensure that the test conditions were met. The test instrument was DH5922 dynamic digital acquisition system produced by Jiangsu Donghua Test Technology Co., LTD, Jingjiang City, Jiangsu Province, China, and the sensor was DH1A213E magnetoelectric acceleration sensor. The above instruments were used to collect the acceleration response data of the frame and draw the time-history curves during repeated crash tests. In order to distinguish the difference of dynamic response parameters of wharf frame structure before and after damage, the model of undamaged wharf frame was reinforced with wood riveting. When sensors were installed on the frame structure, the test was performed in two batches due to the limitation of the number of sensors. Intact structure and damaged structure were taken as one batch respectively. Each lot was divided into three sub-lots. The front, middle, and rear racks were tested as a sub-lot. Apart from that, the pendulum was calculated to strike the frame load surface at a fixed angle. The impact surface was wrapped with rubber to simulate the force of the ship member. Test photos are shown in Figure 12 as follows.

5.2. Comparative Analysis of Ship Collision Simulation Test Data of Wharf Frame Structure

Compared with the numerical model, the experimental model was further simplified. Thus, the transient acceleration data obtained was slightly larger than that obtained by numerical simulation. Therefore, the transient acceleration values obtained from the test should be normalized:
a M 1 - i = a M i a M 1 a N 1
where aM1-i represents normalized model test acceleration at response point i; aMi represents model test acceleration at response point i; aM1 represents model test acceleration at response point 1; aN1 represents numerical simulation acceleration at response point 1.
The corresponding response point was selected. In addition, the total energy values of transient acceleration wavelet packet of the wharf frame model obtained through experimental acquisition and normalization in the complete state and damage state were compared with the numerical simulation results, as shown in Figure 13a:
As shown in Figure 13a, after the loading of ship impact load and cargo load is simulated in the dock frame structure test model, the total energy variation of transient acceleration response signal obtained through the change of wavelet packet has a greater jump than the numerical simulation result. However, the range of values it presents is consistent with the law. After the pile tip near the node is damaged, the total energy escapes. Due to the decrease of stiffness caused by structural damage, the acceleration of superstructure increases after impact, leading to the increase of energy. Due to the immobilized action, the transient acceleration change of the substructure is relatively small, which reflects the energy dissipation caused by damage.
Figure 13b reflects the comparative analysis results of damage indexes obtained from model test and numerical simulation. It is obvious that the damage identification indexes obtained from the model test are relatively stable in the superstructure compared with the numerical model. The lower the part of the substructure, the more obvious the change of damage identification index caused by structural damage. At the response points of No. 1–8 superstructure, the damage identification index of model test is higher than that of numerical simulation. However, at the response point of No. 9–14 substructure, the damage identification index of numerical simulation is more obvious. According to correlation calculation, it can be found that the fitting degree of damage identification index obtained by numerical simulation and model test reaches 81.24%.

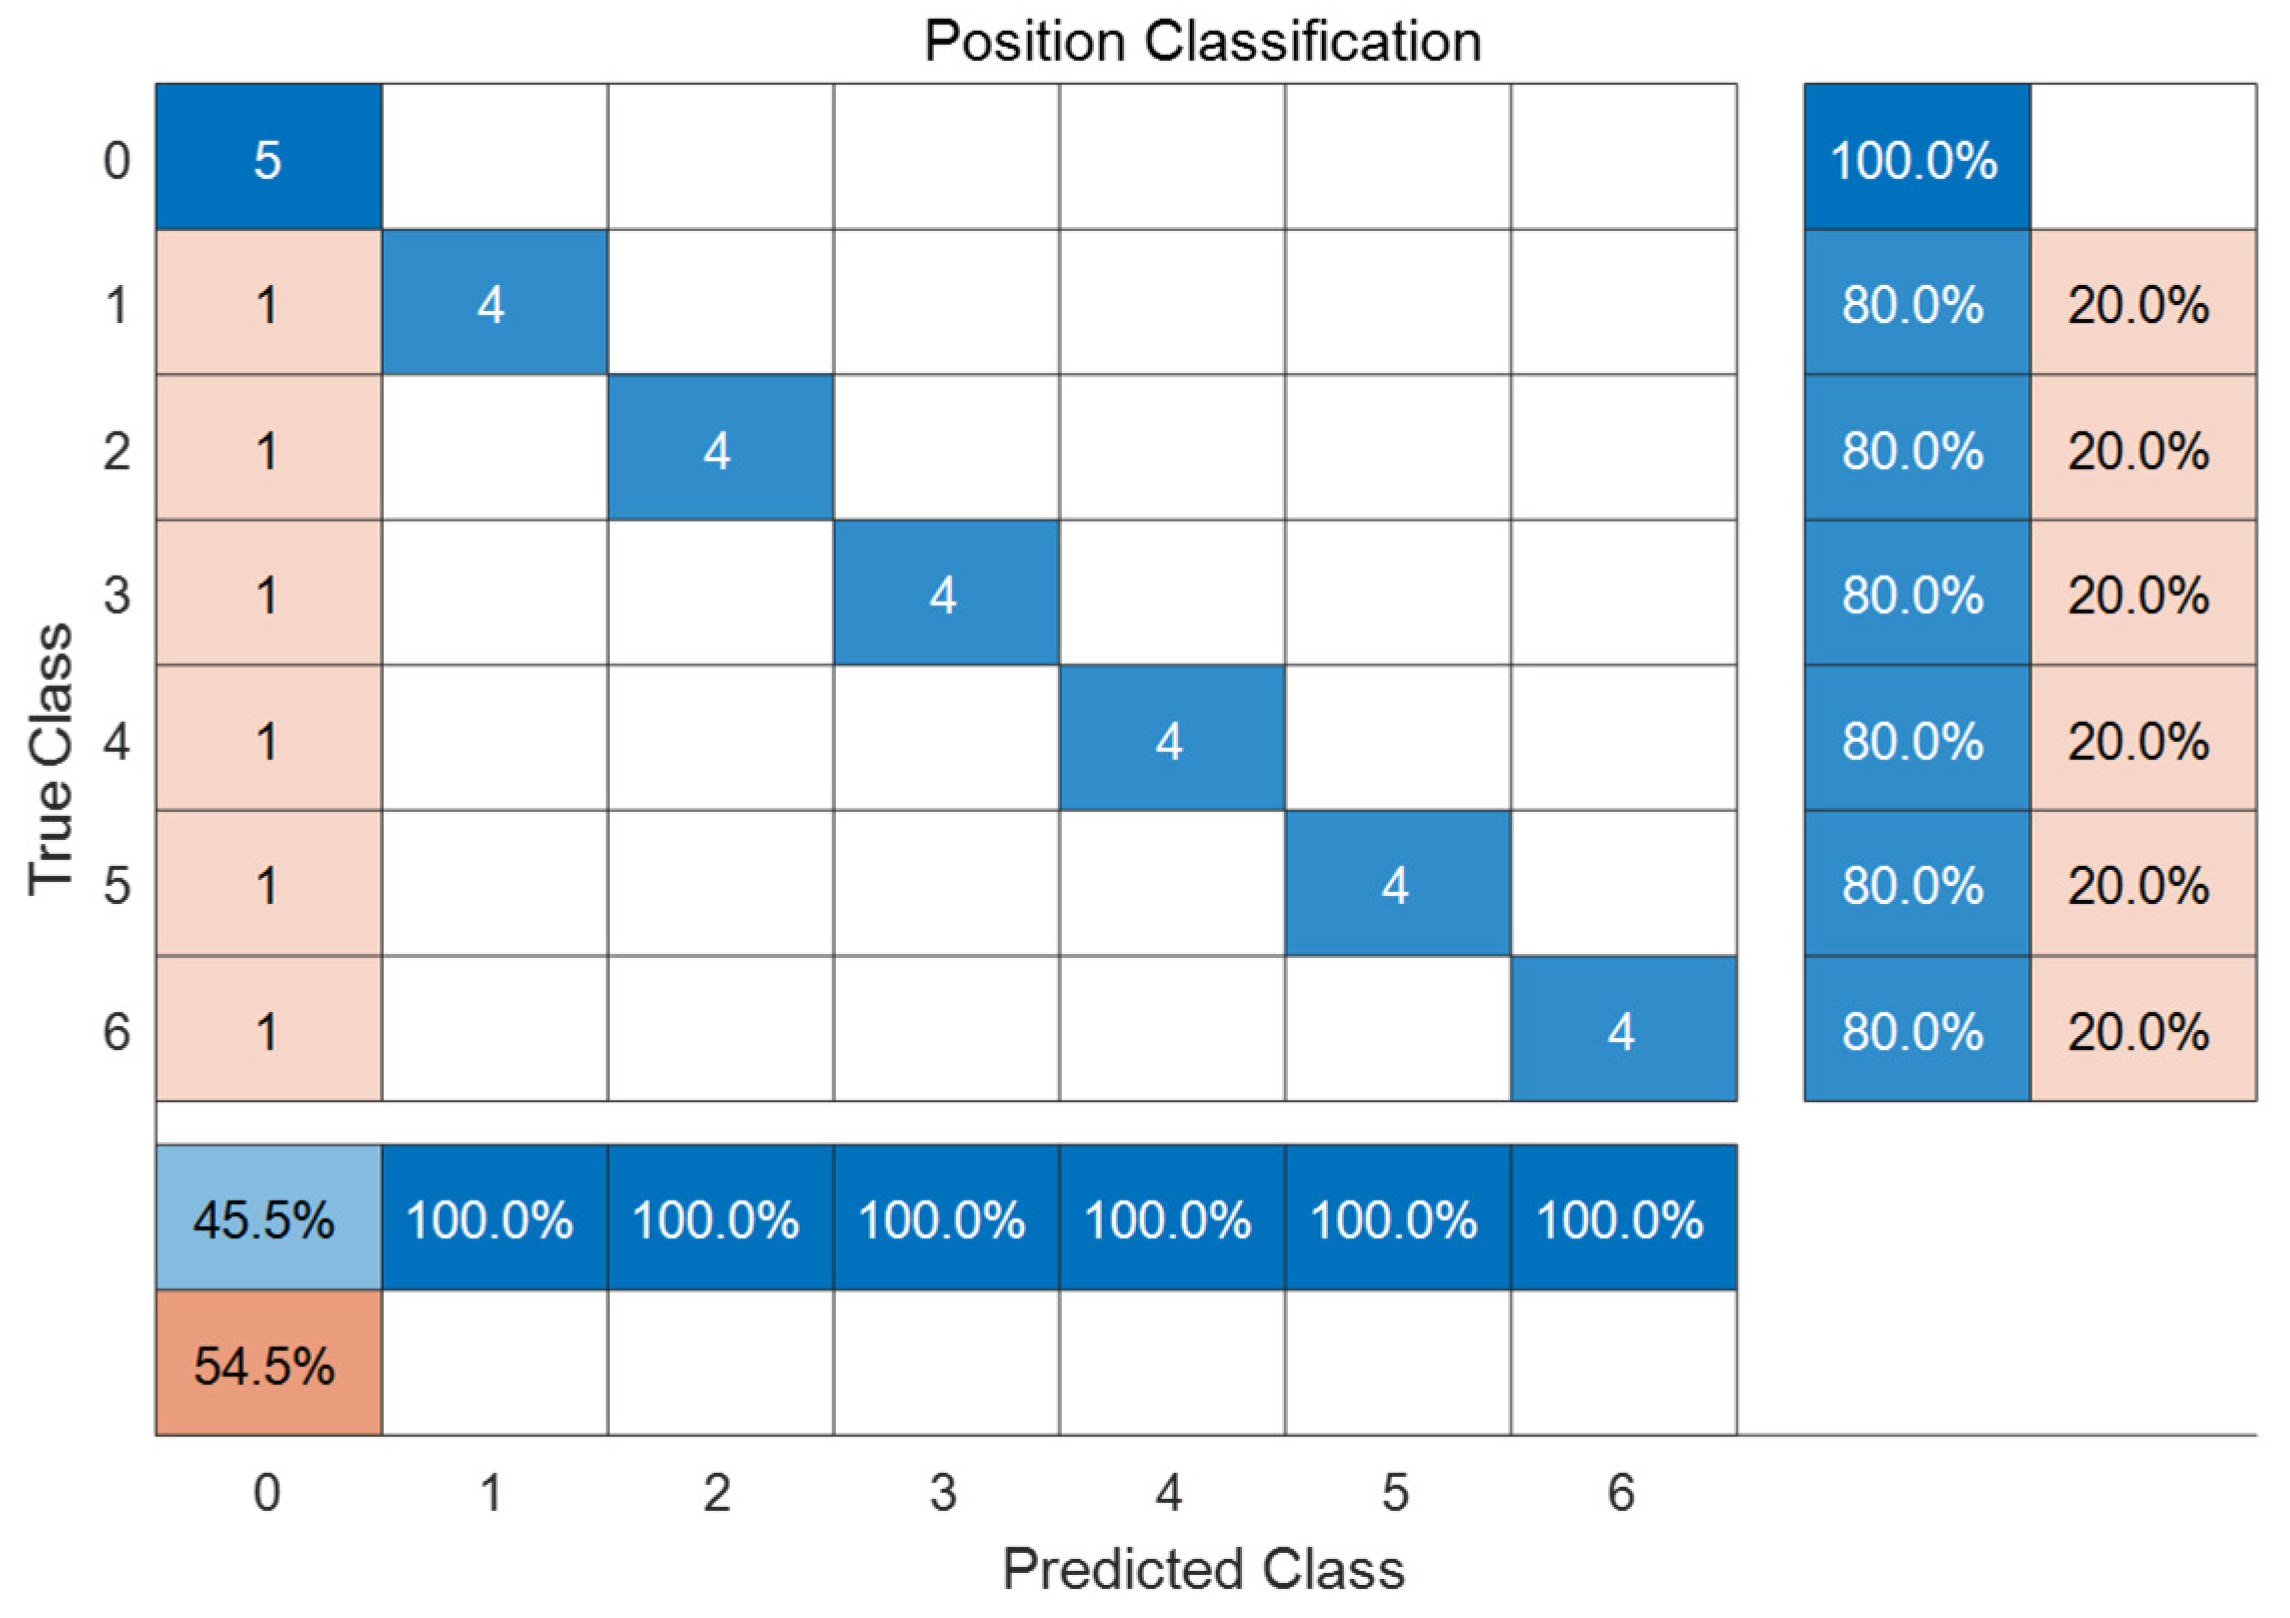
5.3. Damage Identification of Wharf Frame Structure Based on Random Forest Algorithm

Random forest algorithm [23], which was proposed by Leo Breiman in 2001, is a new combinatorial classifier generated by combining Bagging integration method [24] and CART decision tree algorithm [25] based on the idea of random selection. Leo Breiman comprehensively introduced the definition of random forest algorithm, generalization error analysis and related algorithms, and conducted mathematical derivation. As an integration of decision tree, random forest algorithm is simple, easy, and accurate.
Random forest algorithm was used in this paper. To be specific, it took the identification index of transient dynamic damage of wharf frame structure obtained by numerical model as training sample. Meanwhile, the damage recognition indexes of 20%, 40%, and 60% of each damage position in the numerical model were extracted for recognition training. In addition, the damage identification index obtained from the model test was used as the test set for identification test. Through multiple regression operations, the optimal leaf size, Leaf = 5, was selected. Through repeated training identification, the damage identification accuracy of random forest algorithm for model test was finally obtained, as shown in Figure 14.
It can be observed from the Figure 14 that the damage identification and prediction accuracy of wharf frame structure model by using random forest algorithm and numerical model as training samples reaches 100%, except for the first layer. While verifying the damage identification index of transient dynamic response of wharf frame structure obtained by ANSYS numerical simulation, it can effectively identify the degree of structural damage to a certain extent.

6. Summary

This paper not only established the finite element model of the wharf frame structure with damaged longitudinal beams, beams, and pile positions near the pile-beam intersection, but also made the transient dynamic response analysis of the structure. Through the extracted structural acceleration parameters, the wavelet packet energy change was used to establish the damage identification index of the wharf frame structure. Furthermore, the dynamic response damage identification indexes of the wharf frame structure under different damage degree and damage location were compared to obtain the dynamic response law of the structure damage caused by the combined action of multiple loads with the ship load as the dynamic load. Apart from that, the dynamic response law of wharf frame structure before and after damage was verified by experiments. The main content of this paper can be summarized as follows:
(1)
The initial conditions of the structural dynamic response system were set by the basic principles of the dynamic response of the wharf frame structure, and the structural stiffness was reduced as the damage factor. Furthermore, the dynamic damage identification index of the wharf frame structure based on the wavelet packet energy change rate was established. Although the acceleration signal is sensitive to structural vibration changes, the information contained in the signal is relatively complex. Compared with the previous research, this paper directly performed wavelet packet analysis on the extracted acceleration signal, and decomposed the acceleration time-history signal into different frequency bands. In this way, the integrity of the signal to be analyzed can be preserved to the greatest extent. Meanwhile, it can independently select the best frequency band that matches the situation, thereby improving the time resolution and frequency resolution of the signal. In addition, by decomposing the acceleration signal into high-frequency and low-frequency parts, the change rate of wavelet packet energy was proposed as the damage identification index, so that the relationship between structural damage and wavelet packet energy was established.
(2)
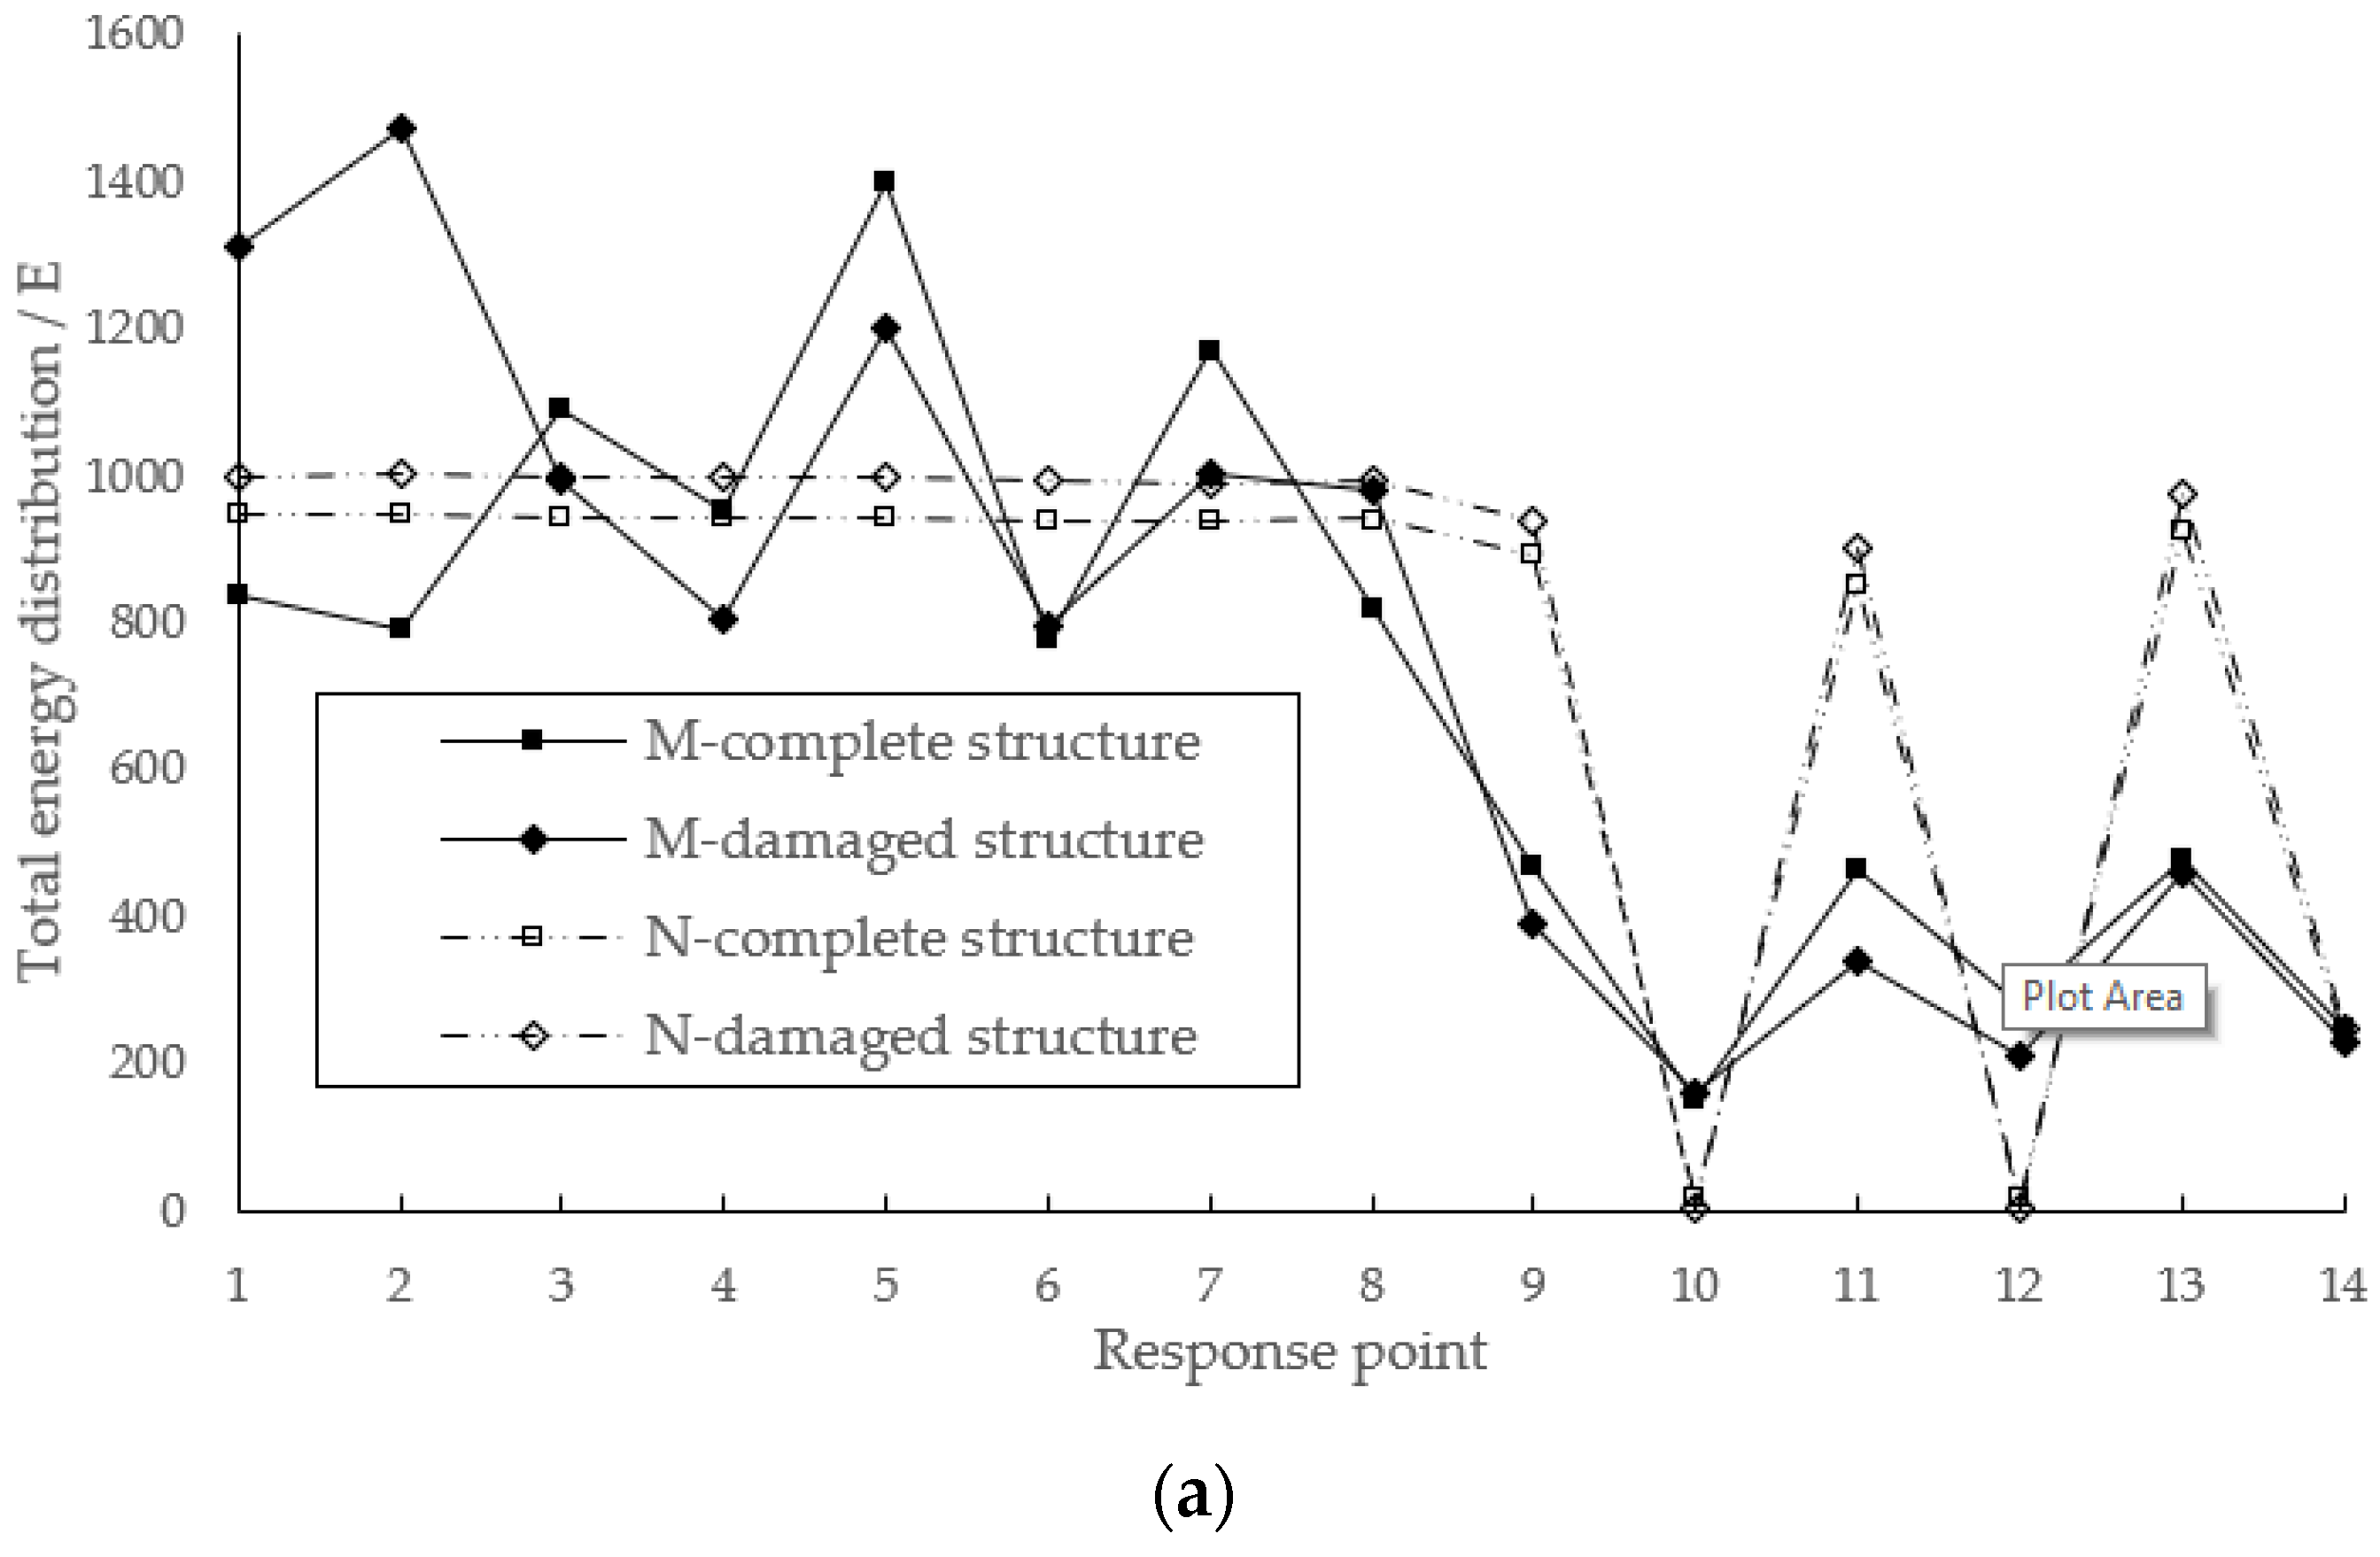
A complete wharf frame structure and damaged wharf frame structure with damage to the cross beam, longitudinal beam, and pile position near the pile-beam intersection had been established respectively. Beyond that, this paper conducted the transient dynamic response analysis under the combined action of the dynamic and static load, with the ship impact load as the main dynamic load. Through the dynamic response finite element simulation analysis, the dynamic response of the acceleration of the wharf frame structure under multi-load conditions was extracted. After extraction and comparison of wavelet packet energy, the total energy of the wavelet packet acceleration of the wharf frame structure could reflect the damage degree of the wharf frame structure to a certain degree.
(3)
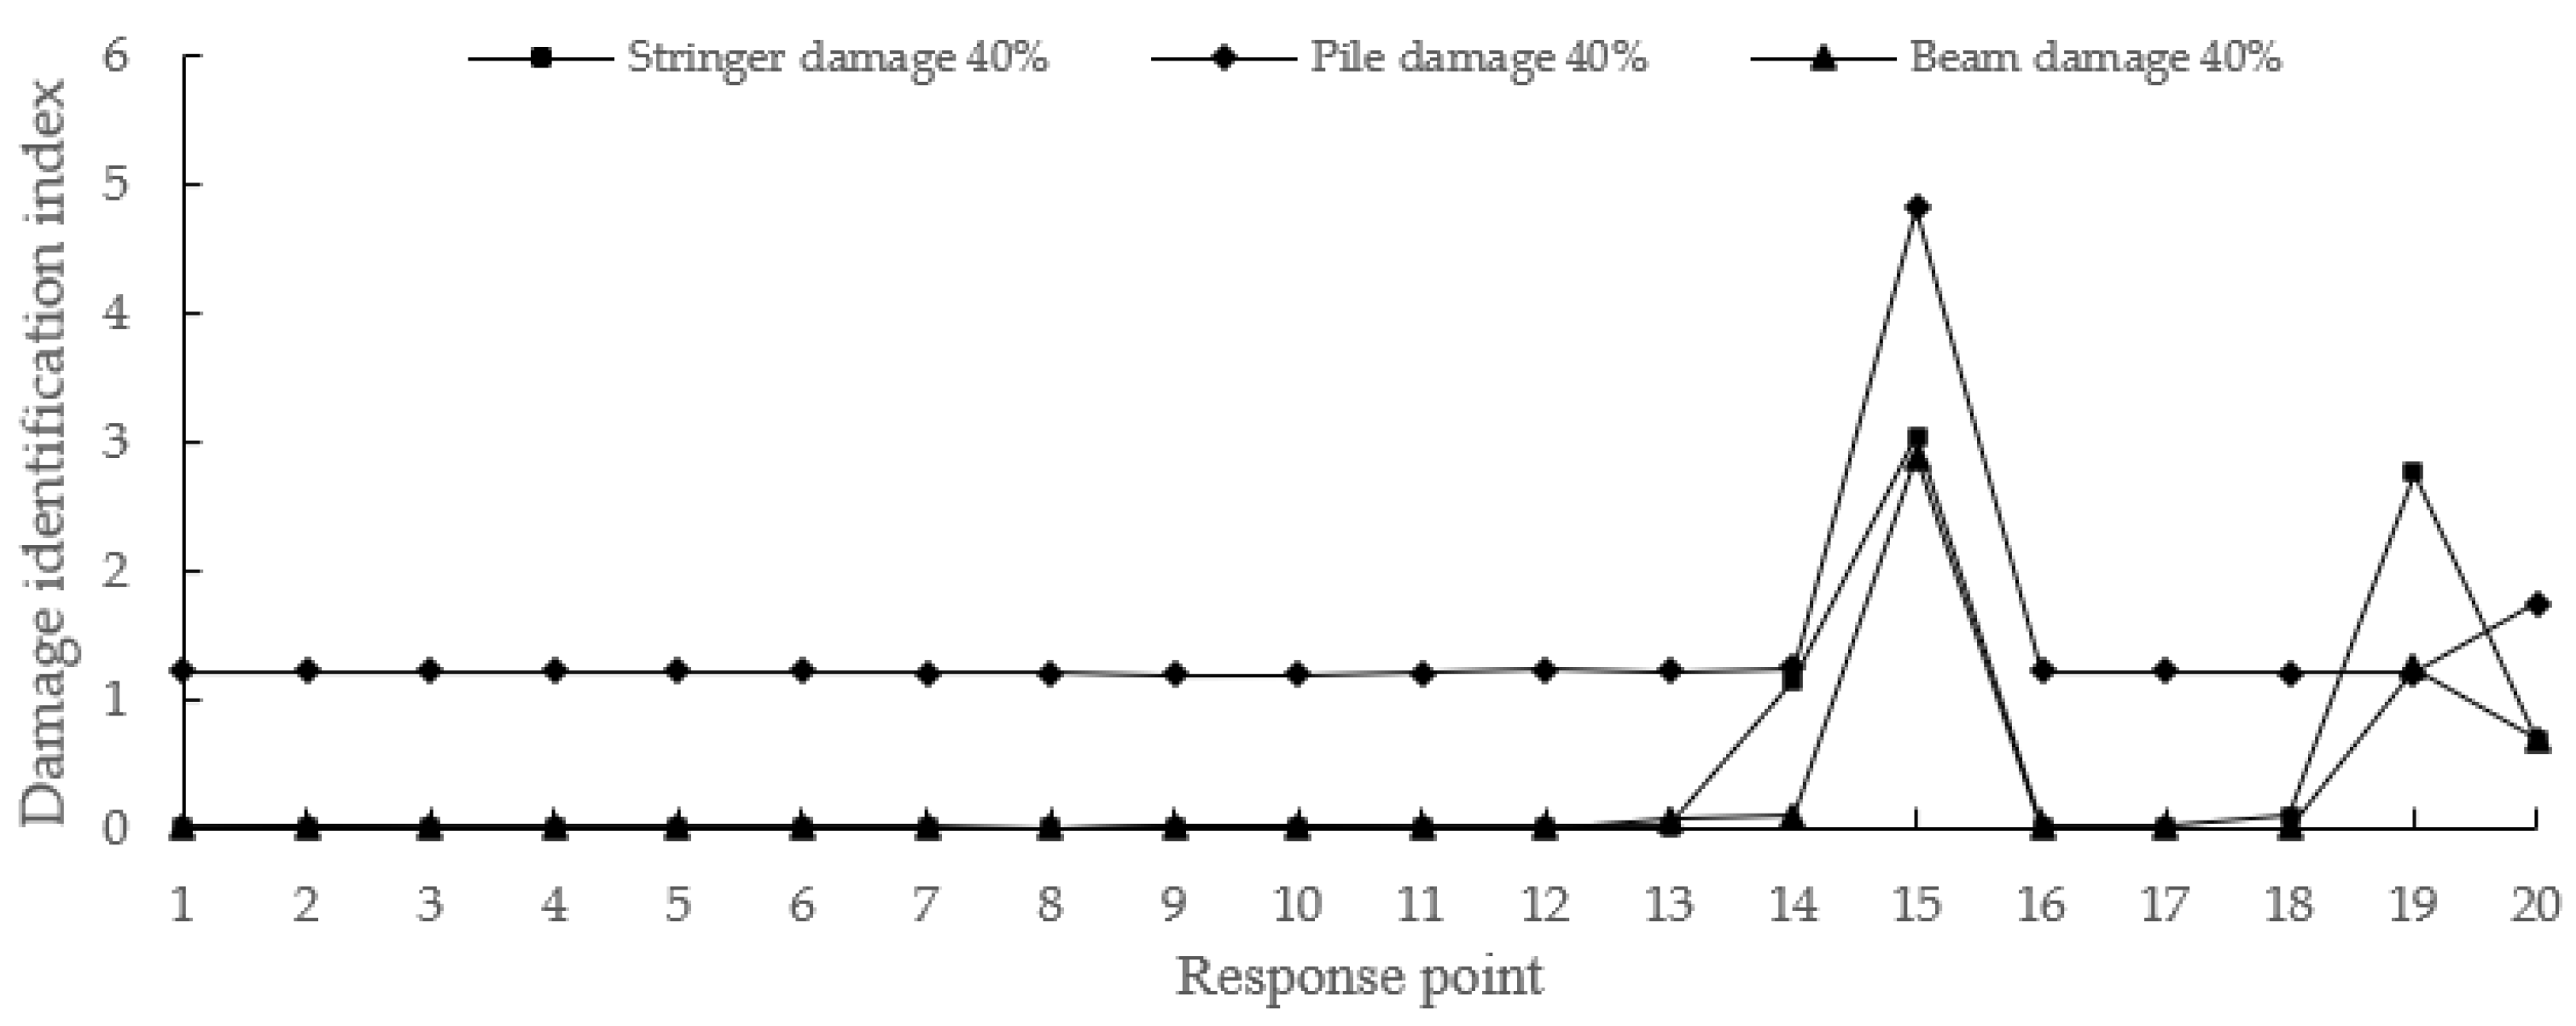
In this paper, the dynamic response damage identification index of the wharf frame structure under different damage conditions was analyzed. According to the research result, under the condition of different damage levels at the same location, the change of damage identification index at the response points of pile position was relatively greater. Moreover, other response points reveal that with the increase of the damage degree, the change trend of the damage identification index of each response point is similar to an exponential increase trend, indicating that the energy dissipation phenomenon becomes more obvious with the deepening of damage degree. Under the condition of the same degree of damage, the change trend of the damage recognition index at each response point of the damage recognition index at different damage locations was roughly the same. When longitudinal beams and cross beams of the same height were damaged, the value and change trend of the damage identification index were nearly the same. Apart from that, the damage identification index of the response point of the longitudinal beam was relatively obvious.
(4)
According to the analysis results, the damage recognition index (acceleration response wavelet energy rate of change) changed significantly when damage occurred at a certain location of the pier frame structure. The more serious the damage to the structure, the more obvious the change of the damage recognition index. In the same degree of damage, there was also a significant difference in the energy change rate of the acceleration time response at different damage locations. Obviously, the energy change rate after wavelet packet energy change with acceleration response signal was very sensitive to the structural damage. In addition, this paper proposed to take the self-weight, ship impact force, and stacking load, which are common in the use of quay frame structures, as the natural excitation sources. Then, the dynamic response signal could be maintained for a long period of time, which is helpful to long-term observation of the damage condition of wharf frame structures.
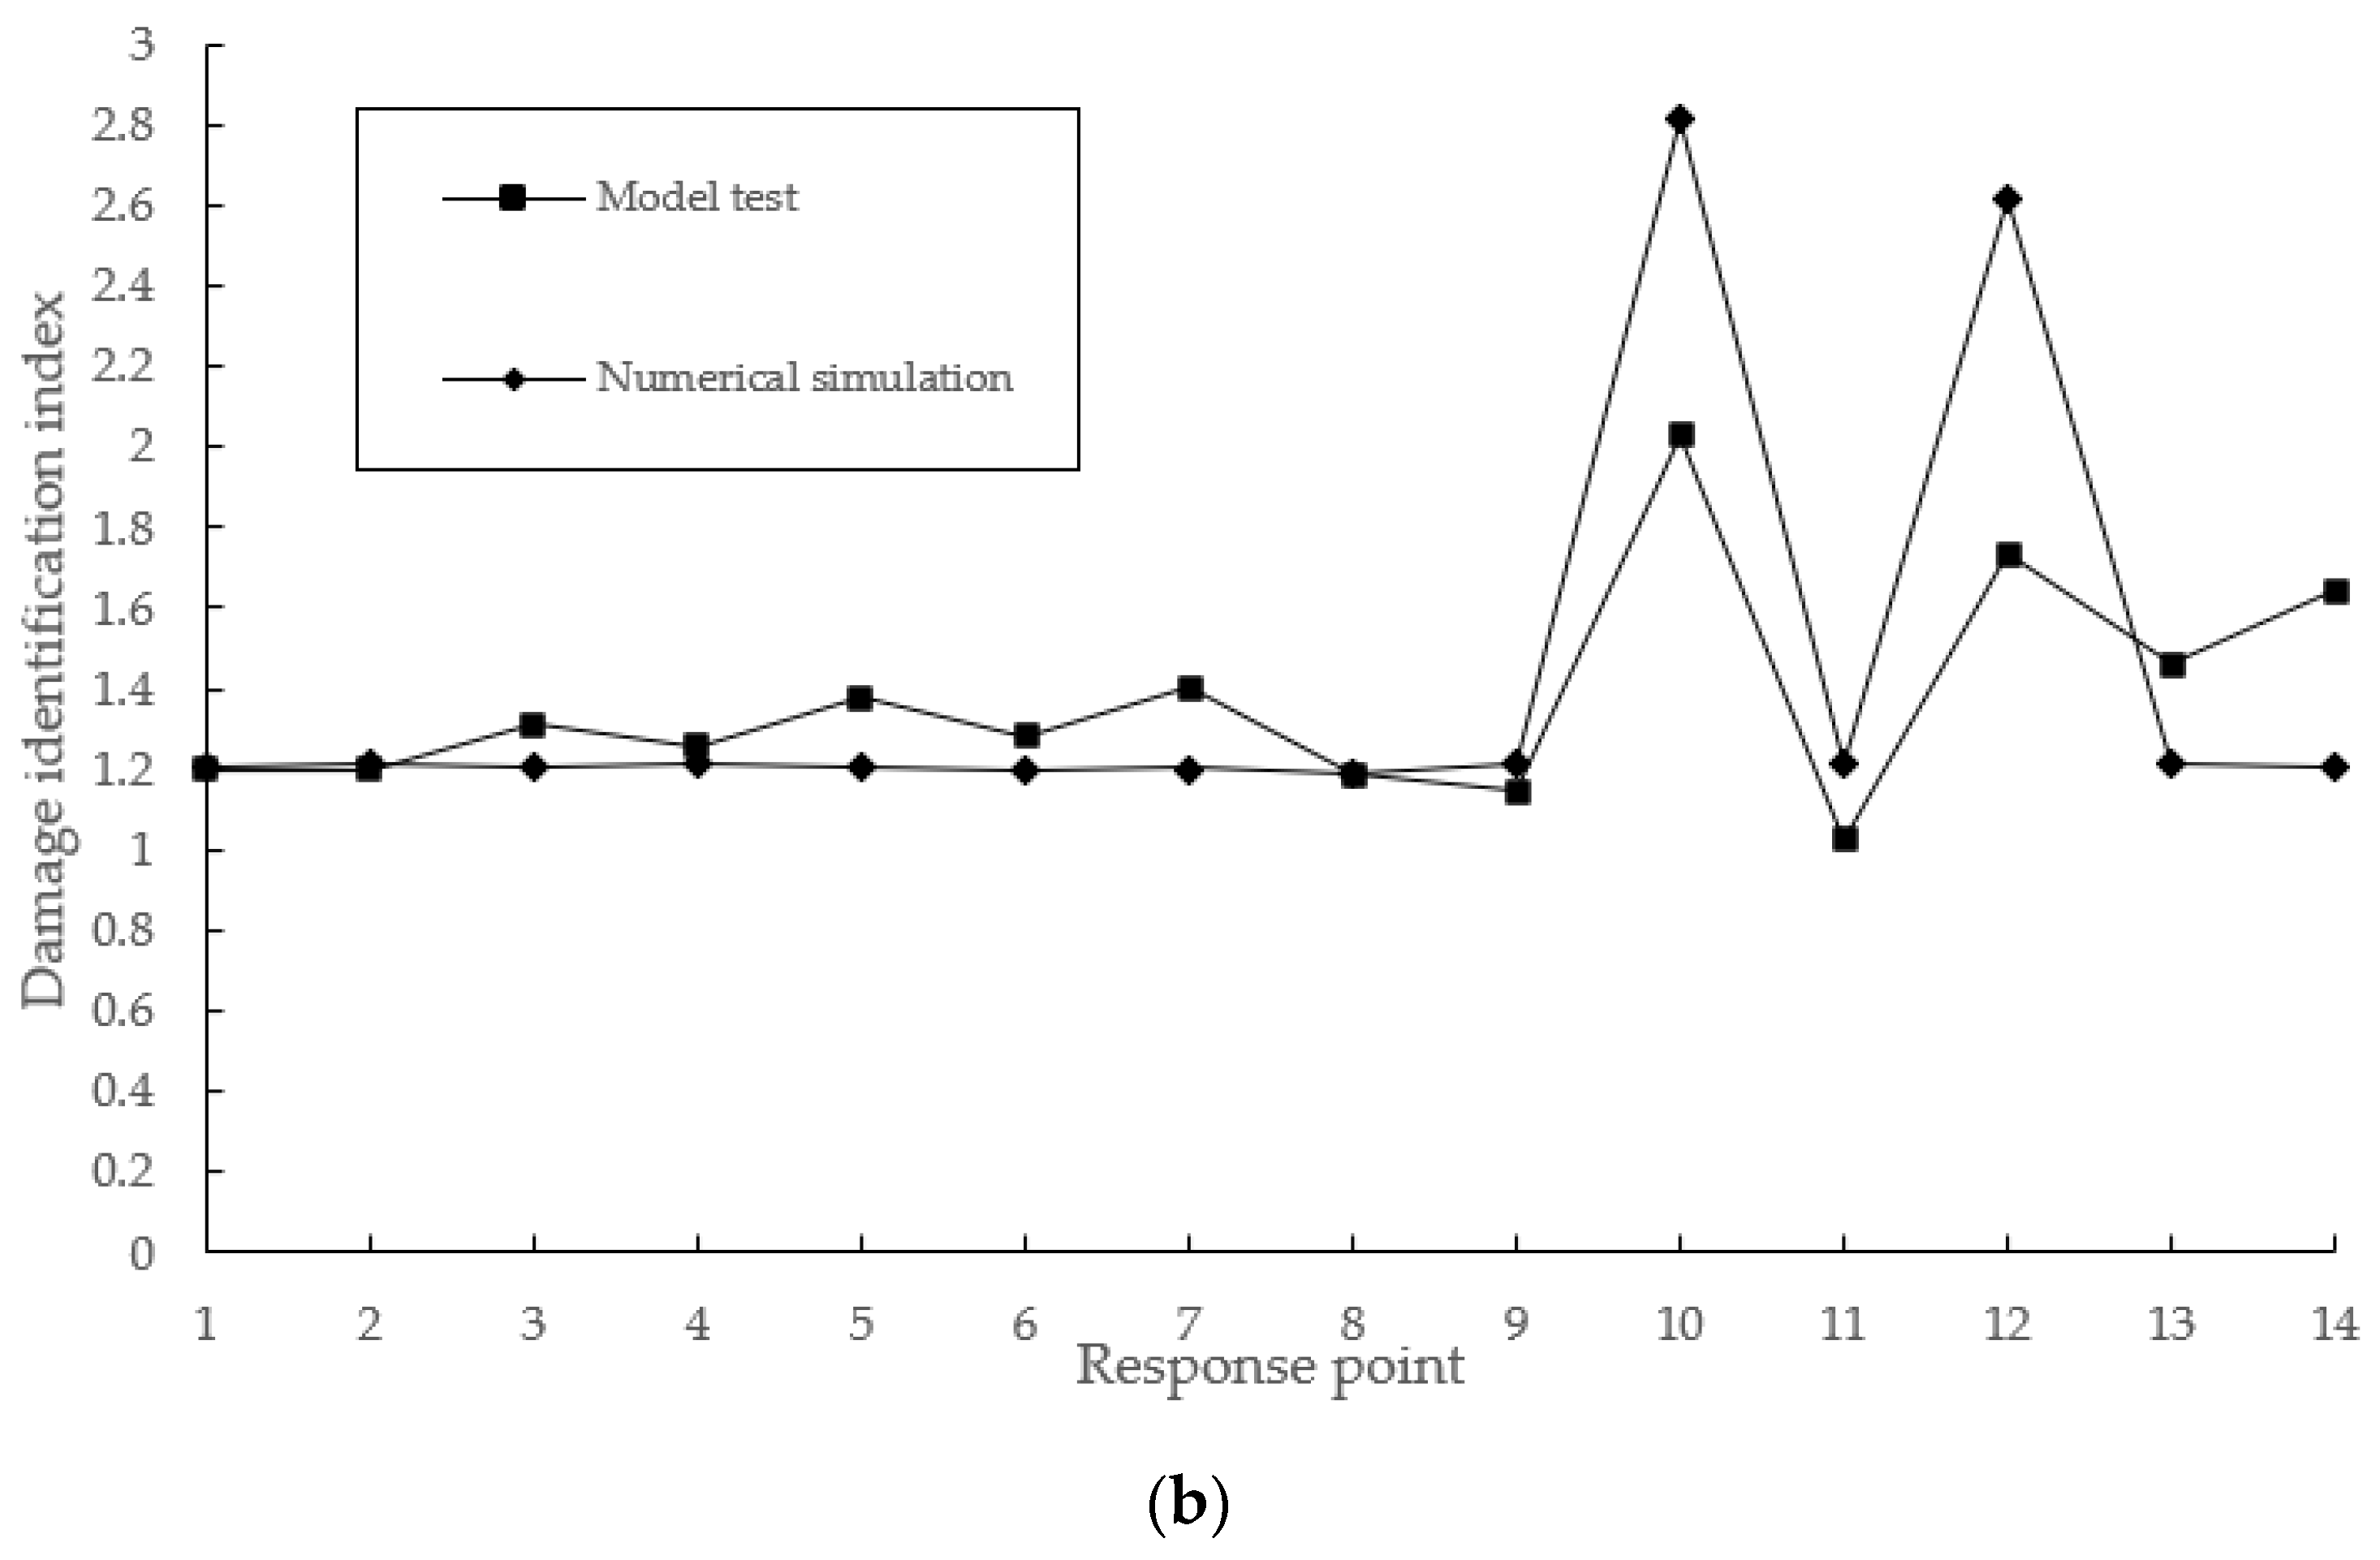
(5)
The dynamic response damage identification results obtained by numerical simulation should be verified before they were considered valid. Therefore, this paper referred to a standard structure section of a river port wharf in Chongqing and made a simplified wharf frame structure model to simulate the ship collision test. Moreover, the transient acceleration was extracted and processed to obtain the change curves of the test damage identification index. Through the correlation verification, the fitting degree of the damage identification index obtained from the model test and numerical simulation reached 81.24%. Using random forest algorithm and taking numerical simulation data as training samples, the recognition accuracy of test results was also high enough. However, the correlation between the damage identification index obtained from the test and the numerical simulation had not reached a good enough level. In the process of random forest algorithm recognition, repeated learning and training were also needed to achieve such an effect. The reasons may be as follows: First, the model used in the test is simpler than the numerical model, and its structural stability is weaker than the numerical model. Therefore, the component energy of the acceleration wavelet packet generated after the impact is higher, and even the normalization treatment cannot erase this effect. Second, the setting conditions and simulation process of the numerical model are more ideal, the degree of embedment between each node and the bottom surface of the structure is higher, and the basic data extracted is relatively conservative. Third, the environment of model test is complex, and the environmental noise greatly affects the test signal.

7. Conclusions

Through numerical simulations and model tests, the following conclusions can be drawn in this paper:
(1)
The connection between structural damage and structural transient dynamic response signals was established by wavelet packet analysis, which could describe the structural damage relatively accurately and lay a theoretical basis for the identification of structural damage of wharf frames.
(2)
According to the results, the total energy of the wavelet packet corresponding to the acceleration value of the response point of the pile position was relatively small, but the appearance of damage was more obvious. Namely, the damage change was more obviously reflected on the response point of the pile position.
(3)
According to the research result, under the condition of different damage levels at the same location, with the increase of the damage degree, the change trend of the damage identification index of each response point was similar to an exponential increase trend, indicating that with the deepening of damage degree, the energy dissipation phenomenon becomes more obvious. Under the condition of the same degree of damage, the change trend of the damage recognition index at each response point of the damage recognition index at different damage locations was roughly the same.
(4)
When damage occurred at the position of the longitudinal beam and the beam at the same height, the value and change of the damage identification index were roughly equivalent, and the damage identification index of the response point where the longitudinal beam was damaged was relatively obvious. After the damage occurred on the pile, the damage identification effect of each response point was the best.
(5)
The energy change rate after wavelet packet energy change with acceleration response signal was quite sensitive to the structural damage. In addition, this paper proposed to take the self-weight, ship impact force and stacking load, which are common in the use of quay frame structures, as natural excitation sources. Then, the dynamic response signal could be maintained for a long period of time, which is favorable for long-term observation of the damage condition of wharf frame structures.
(6)
Through the correlation verification, the fitting degree of the damage identification index obtained from the model test and numerical simulation fit well. In the case of using random forest algorithm and taking numerical simulation data as the training samples, the recognition accuracy of test results was also high enough. However, the correlation between the damage identification index obtained from the test and the numerical simulation did not reach a good level. In the next step, more test data and numerical simulation are needed to analyze the accurate damage identification of the wharf frame structure.

Author Contributions

Methodology, M.Z. and K.W.; formal analysis, G.W.; investigation, G.W.; data curation, G.W.; writing—original draft preparation, G.W.; writing—review and editing, K.W.; project administration, M.Z. and K.W.; funding acquisition, M.Z. All authors have read and agreed to the published version of the manuscript.

Funding

The authors acknowledge the financial support from the National Natural Science Foundation of China (Grant No. 51879017), and Chongqing Research Program of Basic Research and Frontier Technology (Grant No. cstc2017jcyjBX0066).

Institutional Review Board Statement

Not applicable.

Informed Consent Statement

Not applicable.

Data Availability Statement

Not applicable.

Conflicts of Interest

The authors declare no conflict of interest.

References

  1. Karami, V.; Chenaghlou, M.; Gharabaghi, A.M. A combination of wavelet packet energy curvature difference and Richardson extrapolation for structural damage detection. Appl. Ocean Res. 2020, 101, 102224. [Google Scholar] [CrossRef]
  2. Na, C.; Kim, S.-P.; Kwak, H.-G. Structural damage evaluation using genetic algorithm. J. Sound Vib. 2011, 330, 2772–2783. [Google Scholar] [CrossRef]
  3. Johnson, E.A.; Lam, H.F.; Katafygiotis, L.S.; Beck, J.L. Phase I IASC-ASCE Structural Health Monitoring Benchmark Problem using Simulated Data. J. Eng. Mech. 2004, 130, 3–15. [Google Scholar] [CrossRef]
  4. Ostachowicz, W.; Krawczuk, M. Analysis of the effect of cracks on the natural frequencies of a cantilever beam. J. Sound Vib. 1991, 150, 191–201. [Google Scholar] [CrossRef]
  5. Stubbs, N.; Osegueda, R. Global non-destructive damage evaluation in solids. Int. J. Anal. Exp. Modal Anal. 1990, 5, 67–79. [Google Scholar]
  6. Yi, J.-H.; Kim, S.-B.; Yoon, G.-L.; Andersen, L.V. Natural frequency of bottom-fixed offshore wind turbines considering pile-soil-interaction with material uncertainties and scouring depth. Wind Struct. 2015, 21, 625–639. [Google Scholar] [CrossRef]
  7. Zhao, M.-H.; Yang, J.; Yang, M.-H. Natural frequency of tapered high pier considering pile-soil interaction. J. Cent. South Univ. Technol. 2010, 17, 635–641. [Google Scholar] [CrossRef]
  8. Yan, W.-J.; Huang, T.-L.; Ren, W.-X. Damage detection method based on element modal strain energy sensitivity. Adv. Struct. Eng. 2010, 13, 1075–1088. [Google Scholar] [CrossRef]
  9. Xiang, J.W.; Matsumoto, T.; Wang, Y.X.; Jiang, Z. A hybrid of interval wavelets and wavelet finite element model for damage detection in structures. Comput. Model. Eng. Sci. 2011, 81, 269–294. [Google Scholar]
  10. Moaveni, B.; Stavridis, A.; Lombaert, G.; Conte, J.P.; Shing, P.B. Finite-Element model updating for assessment of progressive damage in a 3-story infilled RC frame. J. Struct. Eng. 2013, 139, 1665–1674. [Google Scholar] [CrossRef] [Green Version]
  11. Boroschek, R.L.; Baesler, H.; Vega, C. Experimental evaluation of the dynamic properties of a wharf structure. Eng. Struct. 2011, 33, 344–356. [Google Scholar] [CrossRef]
  12. Huang, J.; Chen, G. Experimental modeling of wave load on a pile-supported wharf with pile breakwater. Ocean Eng. 2020, 201, 107149. [Google Scholar] [CrossRef]
  13. Manna, B.; Baidya, D. Dynamic nonlinear response of pile foundations under vertical vibration—Theory versus experiment. Soil Dyn. Earthq. Eng. 2010, 30, 456–469. [Google Scholar] [CrossRef]
  14. Su, J.B.; Yang, G.Q.; Zhang, L.M.; Shao, G.J.; Zhu, R.H. Safety evaluation method for high-piled wharf structures based on the disturbing-energy method. J. Eng. Mech. 2020, 146, 04020044. [Google Scholar] [CrossRef]
  15. Zheng, C.; Luan, L.; Qin, H.; Zhou, H. Horizontal Dynamic Response of a Combined Loaded Large-Diameter Pipe Pile Simulated by the Timoshenko Beam Theory. Int. J. Struct. Stab. Dyn. 2020, 20, 2071003. [Google Scholar] [CrossRef]
  16. Zhang, H.-Q.; Sun, X.-P.; Wang, Y.-Z.; Yin, J.-L.; Wang, C.-Y. Dynamic characteristics and simplified numerical methods of an all-vertical-piled wharf in offshore deep water. China Ocean Eng. 2015, 29, 705–718. [Google Scholar] [CrossRef]
  17. Pepe, V.; De Angelis, A.; Pecce, M.R. Damage assessment of an existing RC infilled structure by numerical simulation of the dynamic response. J. Civ. Struct. Health Monit. 2019, 9, 385–395. [Google Scholar] [CrossRef]
  18. Niu, J.; Zong, Z.; Chu, F. Damage identification method of girder bridges based on finite element model updating and modal strain energy. Sci. China Technol. Sci. 2015, 58, 701–711. [Google Scholar] [CrossRef]
  19. Lei, Y.; Li, Q.; Chen, F.; Chen, Z. Damage identification of frame structures with joint damage under earthquake excitation. Adv. Struct. Eng. 2014, 17, 1075–1087. [Google Scholar] [CrossRef]
  20. Lin, J.-F.; Xu, Y.-L.; Zhan, S. Experimental investigation on multi-objective multi-type sensor optimal placement for structural damage detection. Struct. Health Monit. 2019, 18, 882–901. [Google Scholar] [CrossRef]
  21. Kang, J.S.; Park, S.-K.; Shin, S.; Lee, H.S. Structural system identification in time domain using measured acceleration. J. Sound Vib. 2005, 288, 215–234. [Google Scholar] [CrossRef]
  22. CCCC First Harbor Engineering Survey and Design Institute Co., Ltd. Code for Port Engineering Loads (JTS 144-1-2010); China Communication Press: Beijing, China, 2010. (In Chinese) [Google Scholar]
  23. Breiman, L. Random forests. Mach. Learn. 2001, 45, 5–32. [Google Scholar] [CrossRef] [Green Version]
  24. Breiman, L. Bagging predictors. Mach. Learn. 1996, 24, 123–140. [Google Scholar] [CrossRef] [Green Version]
  25. Breiman, L.; Friedman, J.H.; Olshen, R.A.; Stone, C.J. Classification and Regression Trees. Biometrics 1984, 1, 14–23. [Google Scholar]
Figure 1. Finite element model of wharf frame structure.
Buildings 12 01131 g001
Figure 2. Finite element model of damaged wharf frame structure. (a) Damaged wharf frame structure near the node on the longitudinal beam. (b) Damaged wharf frame structure near the joint on the crossbeam. (c) Damaged wharf frame structure near nodes on piles. (d) Partial enlarged view of damaged section.
Buildings 12 01131 g002aBuildings 12 01131 g002b
Figure 3. Schematic diagram of ship loading time course.
Buildings 12 01131 g003
Figure 4. Schematic diagram of the load positions and response points positions of the wharf frame.
Buildings 12 01131 g004
Figure 5. Acceleration response curves of no damage frame structure from No. 1 to No. 20 response points.
Buildings 12 01131 g005
Figure 6. Curves of acceleration response of response points from No. 1 to No. 20 of damaged wharf frame structure. (a) Comparison of dynamic response energy distribution between longitudinal beam damage and complete structure. (b) Comparison of dynamic response energy distribution between crossbeam damage and complete structure. (c) Comparison of dynamic response energy distribution between pile damage and complete structure.
Buildings 12 01131 g006
Figure 7. Variation curves of damage identification index at each response point under different damage degree of longitudinal beam. (a) The damage identification indices of 1–20 response points. (b) The damage identification indices of 1–13 response points. (c) Growth trend curves of damage identification indices of 1–13 response points with increasing damage degree.
Buildings 12 01131 g007aBuildings 12 01131 g007b
Figure 8. Variation curves of damage identification index at different damage locations of the structure.
Buildings 12 01131 g008
Figure 9. Dynamic response test model of wharf frame structure. Attachment: Dimension in cm (a) Longitudinal section of the model. (b) Dynamic response test model of wharf frame.
Buildings 12 01131 g009
Figure 10. Test model of wharf frame structure with damage. (a) Test model of wharf frame with damage. (b) Damaged part of model.
Buildings 12 01131 g010
Figure 11. Location of response points in the test model.
Buildings 12 01131 g011
Figure 12. Dock frame structure simulating ship impact test process. (a) Sensor arrangement; (b) dynamic load of impact and pile load simulation setting; (c) impact way; (d) test data acquisition system.
Buildings 12 01131 g012aBuildings 12 01131 g012b
Figure 13. Comparison between model test and numerical simulation of transient dynamic response of wharf frame structure. Attachment: M—model test; N—numerical simulation. (a) Comparison of total energy distribution of transient acceleration between model test and numerical simulation. (b) Comparison of damage identification indexes between model test and numerical simulation.
Buildings 12 01131 g013aBuildings 12 01131 g013b
Figure 14. Damage identification by random forest algorithm.
Buildings 12 01131 g014
Table 1. Material parameters of physical model.
Structural PartUnit Weight (kN/m3)Modulus of Elasticity (MPa)
Pile253.15 × 104
Transverse girder253.15 × 104
Bottom concrete243.05 × 104
Hollow concrete block23.52.55 × 104
Table 2. Dynamic response test scheme of wharf frame model.
SchemeTest Conditions and RequirementsLoad Combination
A
Making complete wharf frame structure model
Analyzing the mechanical characteristics of the complete frame structure model under multiple loads
Dead weight + stowage load + dependent force
B
Making the wharf frame structure model with damage in the middle of beam single span, near the lower part of node and in the middle of pile
Analyzing and comparing the variation of vibration characteristic parameters of frame structures under intact state and three different damage states
Dead weight + stowage load + dependent force
Publisher’s Note: MDPI stays neutral with regard to jurisdictional claims in published maps and institutional affiliations.

