Article

Investigation on Forced Convective Heat Transfer at the Building Façade with Louver Blinds under Different Wind Directions

1
School of Mechanical Engineering, Southwest Jiaotong University, Chengdu 610031, China
2
School of Mechanical Engineering, Tongji University, Shanghai 200092, China
*
Author to whom correspondence should be addressed.
Buildings 2022, 12(8), 1096; https://doi.org/10.3390/buildings12081096
Submission received: 6 July 2022 / Revised: 22 July 2022 / Accepted: 22 July 2022 / Published: 26 July 2022
(This article belongs to the Special Issue Healthy Green Building Planning and Design)

Abstract

:
Exterior louver blinds are one of the most common shading devices attached to the building façade, which will not only screen solar radiation but also affect the flow around the building and change the convective heat exchange at the façade. To better understand how different wind directions affect the convective heat properties of louvered building façades, this paper conducted a CFD simulation with the validation of previous wind-tunnel experiments. A total of 63 shading cases and 7 unshaded cases were both investigated by simulations. It was found that with the increase in wind attack angle θ, the surface-averaged convective heat transfer coefficient (CHTC) at the louvered surface will first increase by about 40~50% (θ from 0° to 60°) and then be cut down by 60% (θ from 60° to 90°). In addition, the convective heat exchange rate at the louver slats will gradually decrease with the growth of θ. Finally, modifications for previous correlations were proposed to quantify the effect of wind directions on the CHTCavg at the blinds and façade, of which the maximum deviation for convective heat exchange rate is less than 18%.

1. Introduction

Exterior shading is one of the most efficient approaches to barrier solar heat gain from building façades [1,2,3]. Among them, louver blinds are increasingly applied to practical engineering because of their artistic and convenient advantages. However, the utilization of louvers will not only change radiant distribution along the façade but also induce or obstruct the airflow around the buildings [4,5]. It has been proved that the louver slats array can change the convective heat transfer rate of the envelope surfaces around them when set indoors or between glasses [6,7,8,9]. Since incorrect descriptions of this process may result in significant errors in the building’s heat gain/loss prediction [10], it is important to clarify the influence of louver blinds on the convective heat transfer of the building façade.
The convective heat exchange between the building surface and air is usually defined by the Newton cooling law [11], which is formed by:
q c v = h c ( T w T a )
where qcv is the average convective heat flux at the heat exchanging surface, W/m2; Tw and Ta are the temperature of the wall surface and the surrounding air, °C; hc is the convective heat transfer coefficient (CHTC) of the wall surface, W/(m2·K). It can be seen that the hc is the key parameter for Newton’s cooling law, which is also one of the key coefficients in building energy simulation to describe the heat gain/loss for the envelope. Thereby, a certain number of research studies have been conducted to quantify the CHTC of a building’s exterior surface.
The hc/Nusselt number (Nu) of the building façade is usually correlated with the reference wind speed/Reynold number (Re), which is usually described as hc = a + bUn/Nu = aRebPrc + d [10,11,12]. The initial studies mainly focused on the local/average convective heat exchange at the cubic building with an atmospheric boundary layer [13,14,15], which also explained the relations between the surface CHTC and the around-flow patterns of the building. Except for airflow velocity, the forced convective heat exchange rate at the building façade is proved to be affected by other factors. Montazeri et al. [16] proved that the geometry of the building will significantly affect the local and average convective heat exchange at the windward façade, and they also proposed a group of correlations to predict these effects [17]. Babakhani et al. [18] investigated the forced convective heat exchange at the façade with different building geometries and wind directions, in which a coefficient F was developed to modify the correlation between Nu and Re. In addition to the geometry of the building itself, the surroundings may also change the hc/Nu at the façade, such as adjacent buildings in the street canyon [19] and exterior components attached to the façade [20,21]. For the latter one, Jiang et al. [21] analyzed the convective heat exchange of the windward building façade with louver blinds. It was found that the barrier effects of exterior louver shadings will suppress the convective heat transfer at the façade and cause a lower hc/Nu than that without blinds, and the louver blinds will replace the façade to mainly generate the convective heat loss of the building skins. In addition, they also conducted correlations to calculate the hc/Nu at the façade and blinds, which considered louver angle, slat width, and the spacing between the façade and blinds [20]. However, these research studies did not address the impact of wind directions on convective heat transfer at the louvered façade. Because wind directions usually determine the attack angle between the façade and the approaching flow, the flow patterns around the building may be altered significantly by the variation in wind direction, which naturally causes the change in convective heat gain/loss at the façade [15,22,23]. Therefore, this paper focuses on the convective heat transfer of the louvered building façade under different wind directions and tries to construct a modification to describe wind direction’s effect on the hc/Nu at the façade with louvers.
For the research methods, field measurements, wind-tunnel experiments, and CFD simulations are the common approaches for analyzing the convective heat transfer at the building façade [10,12]. In field measurements, heating plates were usually set at the façade [23,24] or roof [25] to obtain the real convective heat gain/loss rate at the building surface. However, the surrounding conditions cannot be controlled outdoors, which brings great difficulties in distinguishing the influence of different factors on hc/Nu [10]. Wind-tunnel experiments can be carried out with the convective heat exchange rate with a specified boundary condition [13,14,26], but similarity requirements limit its utilization to investigate buildings’ heat exchange [10]. CFD simulations have been widely used to assess the mass and heat transfer at the building surface with atmospheric boundary. This method can assess detailed information about airflow patterns around the building and discuss the relationships between convective heat exchange and complex around-flow. Due to their affordability and widespread applicability, CFD simulations have recently produced numerous correlations about CHTC/Nu at the building façade. Therefore, this study was carried out using the CFD method with the validation of a previous wind-tunnel experiment [21], which reproduced the forced convective heat exchange at the building façade with louver blinds.
This paper is divided into five sections. The detailed computation settings and validation work for the CFD method are stated in Section 2. Results for the convective heat transfer at the louvered façade with different directions are presented in Section 3. Section 4 establishes the modifications to describe the effect of the wind direction on hc/Nu at the façade with louver blinds. The main conclusions are summarized in Section 5.

2. CFD Methods and Validation Works

Before the simulation investigation, the CFD methods used in this study should be verified by experiments. According to previous research [10,16,20], in this paper, steady RANS equations with the realizable k-ε turbulence model are utilized combined with a low Reynolds number modeling (LRNM) near-wall solution. Referring to similar works [27,28], radiative heat exchange is not considered in simulations, since the focus was only on the forced convective heat transfer, and these two processes are independent of each other with the boundary conditions of a certain surface temperature. Based on the wind-tunnel experiment data of Jiang et al. [20], the following validation research was carried out: (1) validation of the flow field around the cubic building; (2) comparison of convective heat transfer on the windward façade and louver surfaces between simulations and experiments.

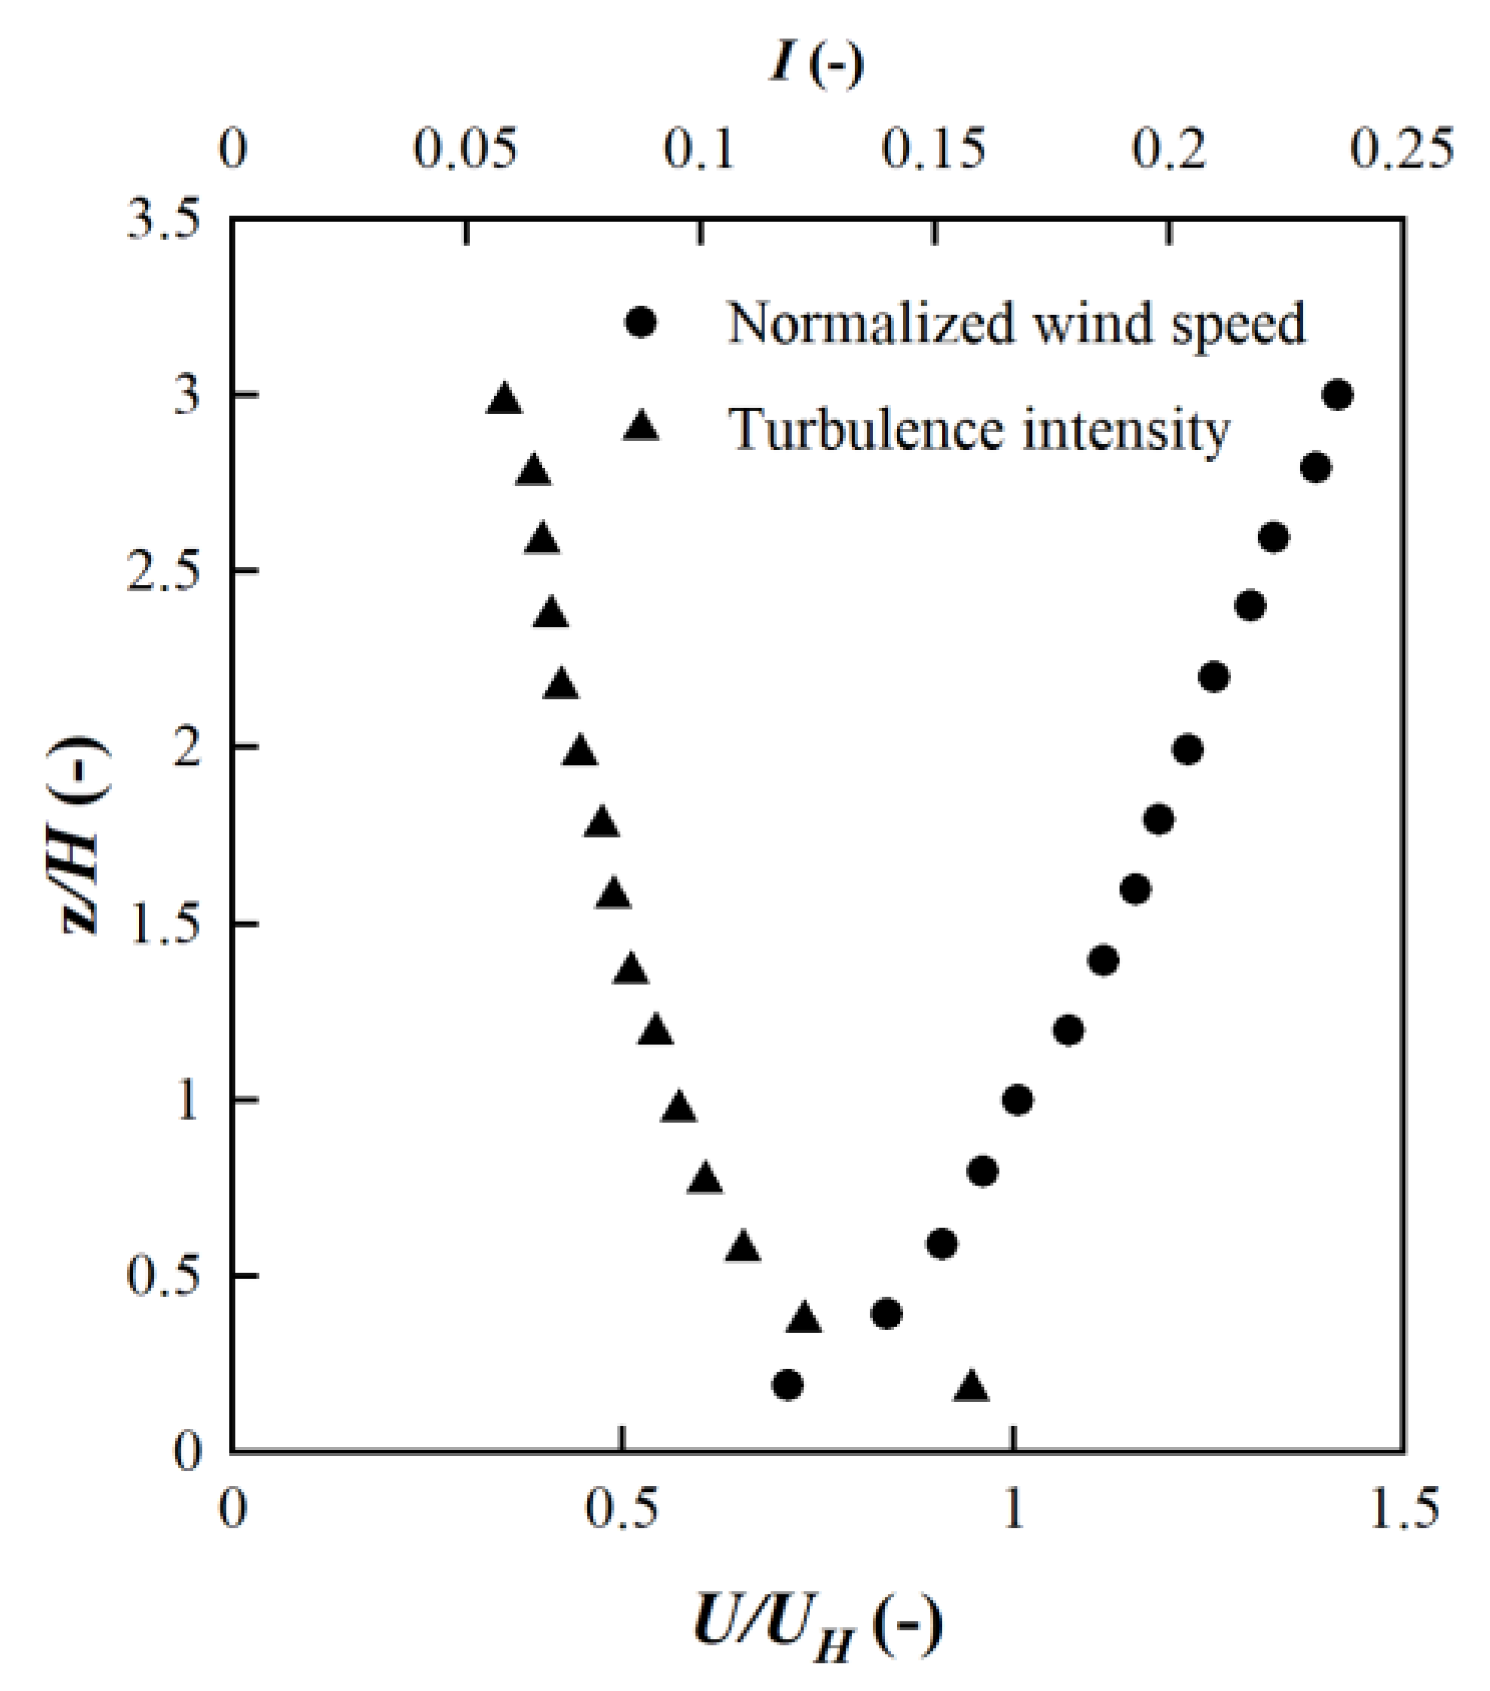
2.1. Description of the Wind-Tunnel Experiment

The experiment was conducted in the TJ-1 atmospheric boundary layer wind tunnel of Tongji University. The detailed setting in the wind tunnel is shown in Figure 1; the test section is 12 m long, and the section size is 1.8 m × 1.8 m. Two spires, a baffle, and a series of rough elements (7 rows of wood blocks and 2 rows of stones) were used to construct the atmospheric boundary layer inflow. The downstream experimental model consists of a 1:30 scale cubic model (H = 500 mm) and louver models (93 mm × 17.5 mm × 1 mm), resulting in a blocking ratio of 7.8%. The wind speed and turbulence intensity profile are shown in Figure 2. Metal ceramics heater (MCH) is selected as the louver salt model. The whole façade is covered with 130 pieces of louvers (26 rows, 5 columns, and the spacing between adjacent louvers is 18.3 mm). The building façade is composed of aluminum alloy plates embedded with quartz heating tubes. The convective heat transfer on the windward façade and louver surfaces is studied using the heat balance method. A total of 9 thermocouples on the windward façade and 14 thermocouples on louver surfaces were set to obtain their surface temperature. Twelve heat flux meters were set behind the façade to measure the heat conduction rate in the building model. Based on the surface temperature, heat flow, and view factors obtained by experiments, the average convective heat transfer intensity can be calculated by subtracting radiation and heat conduction fluxes at the façade and blinds. Detailed experimental settings can be seen in the previous study [21].

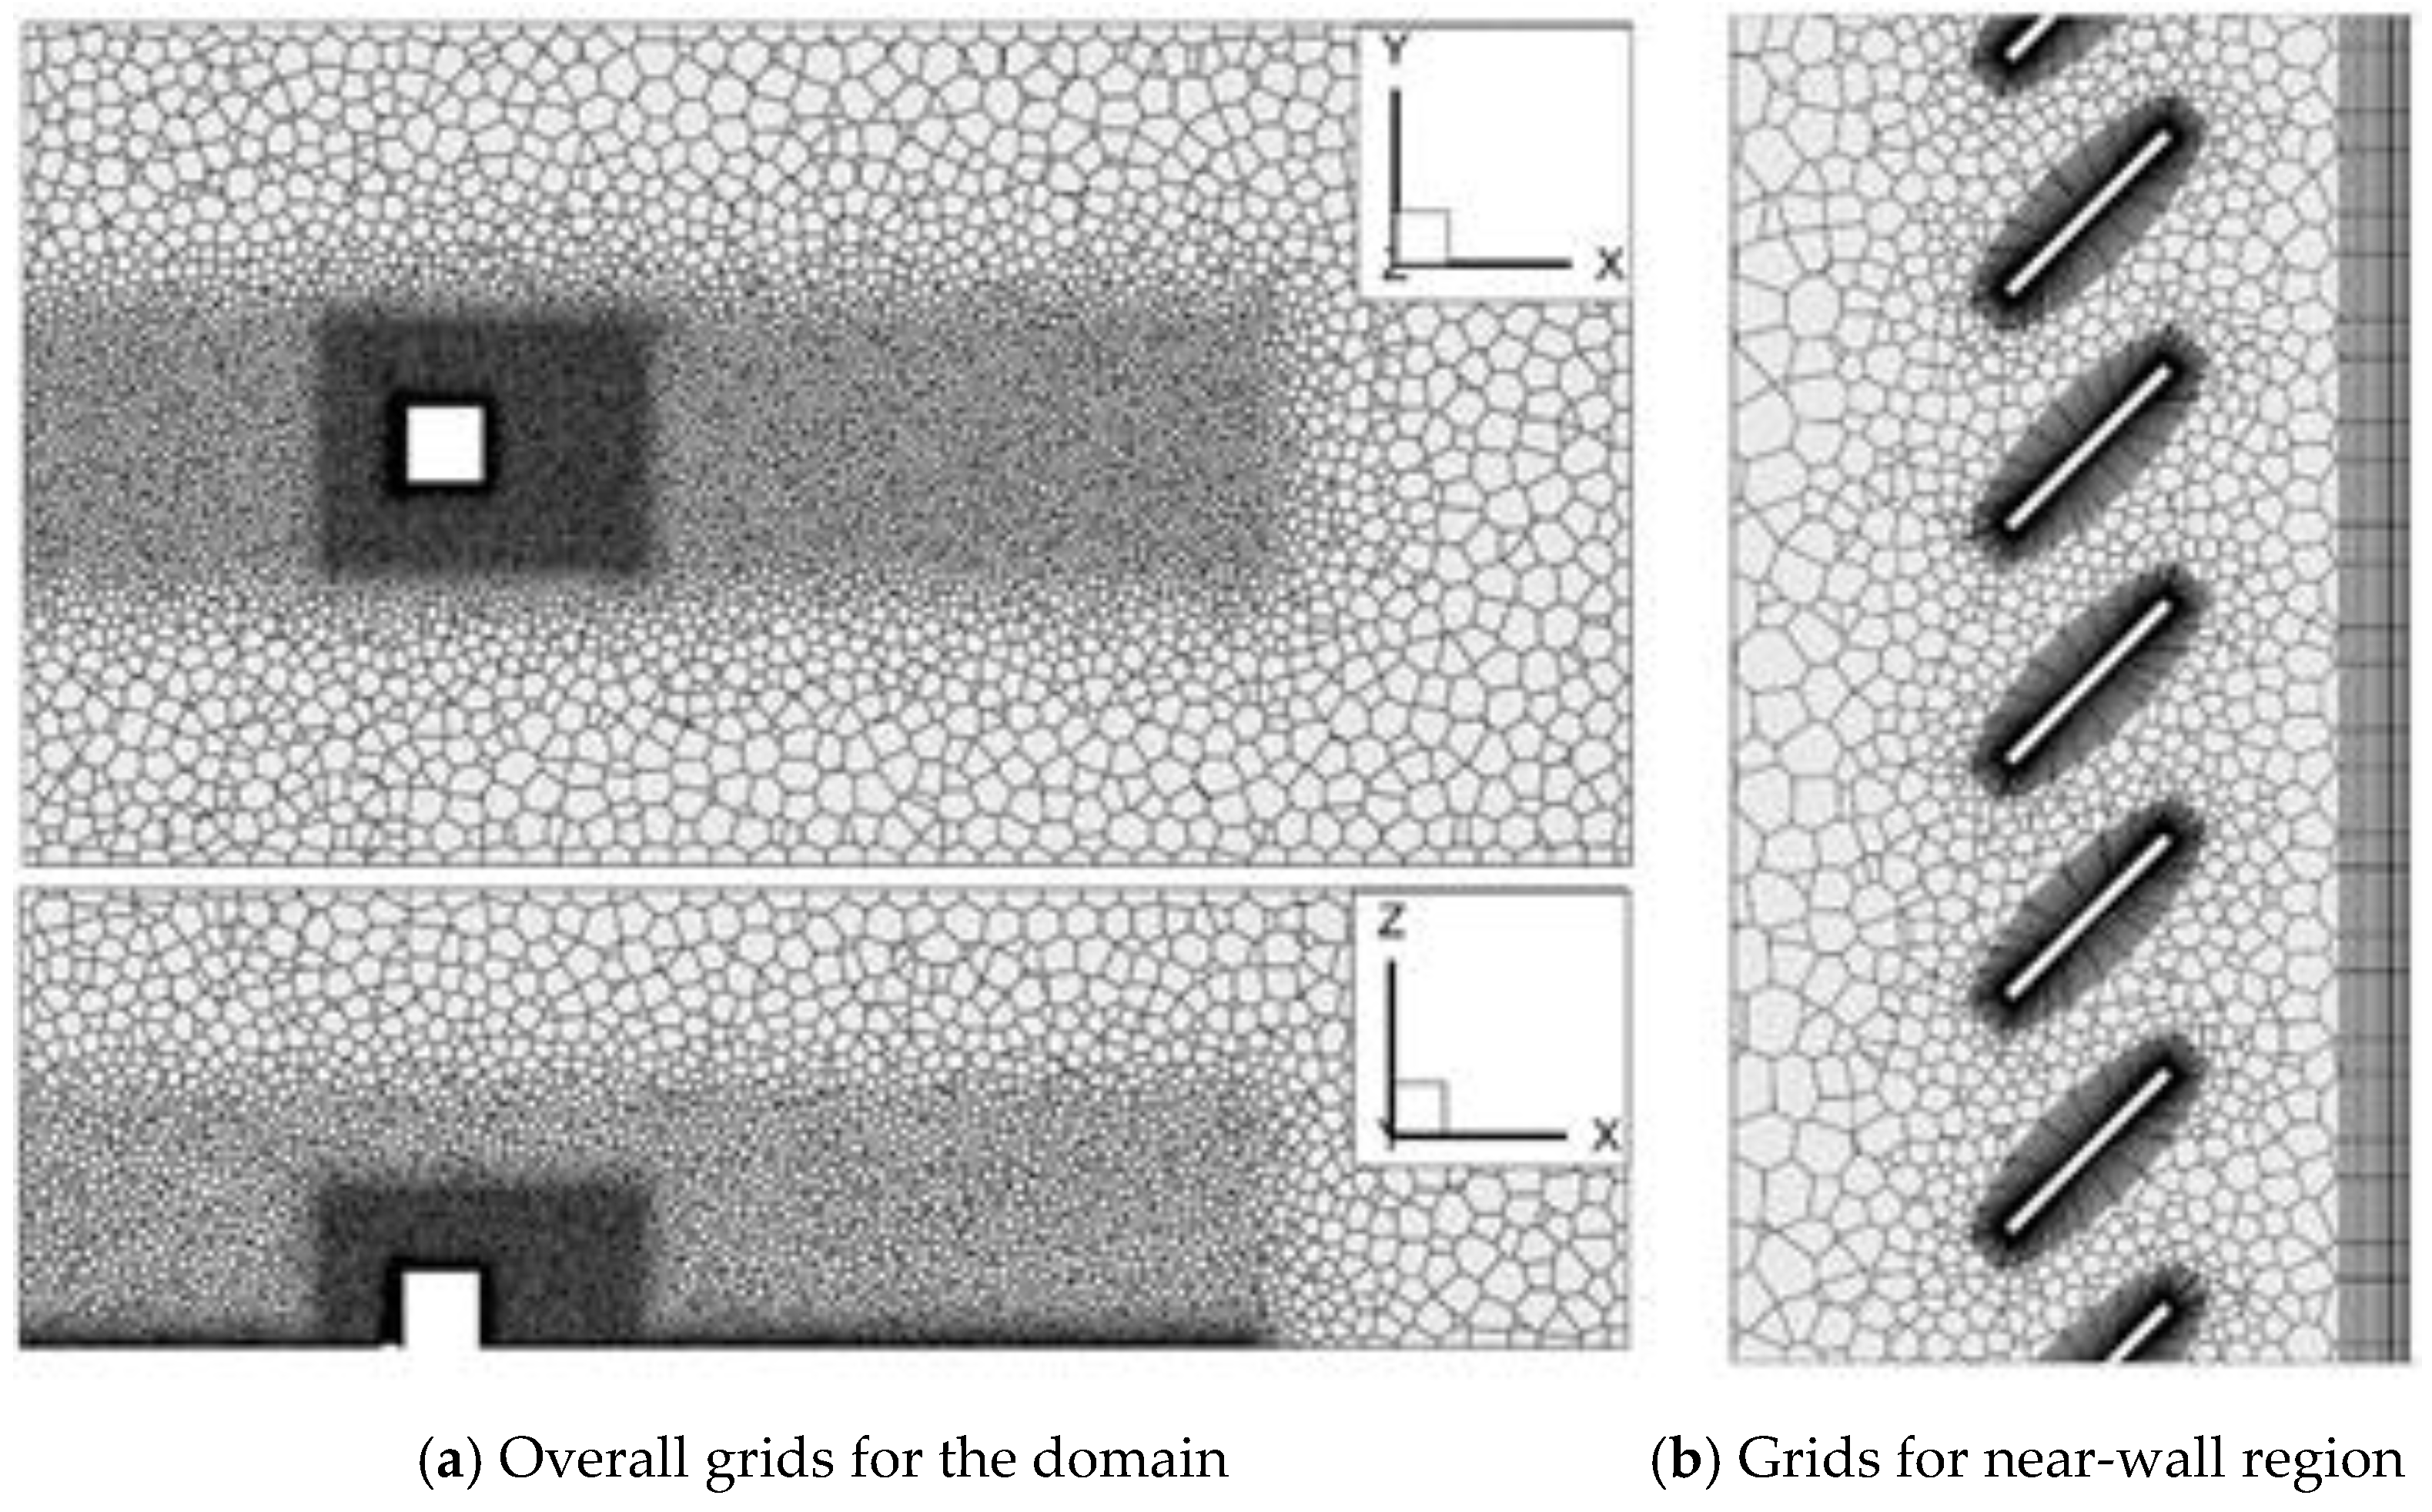
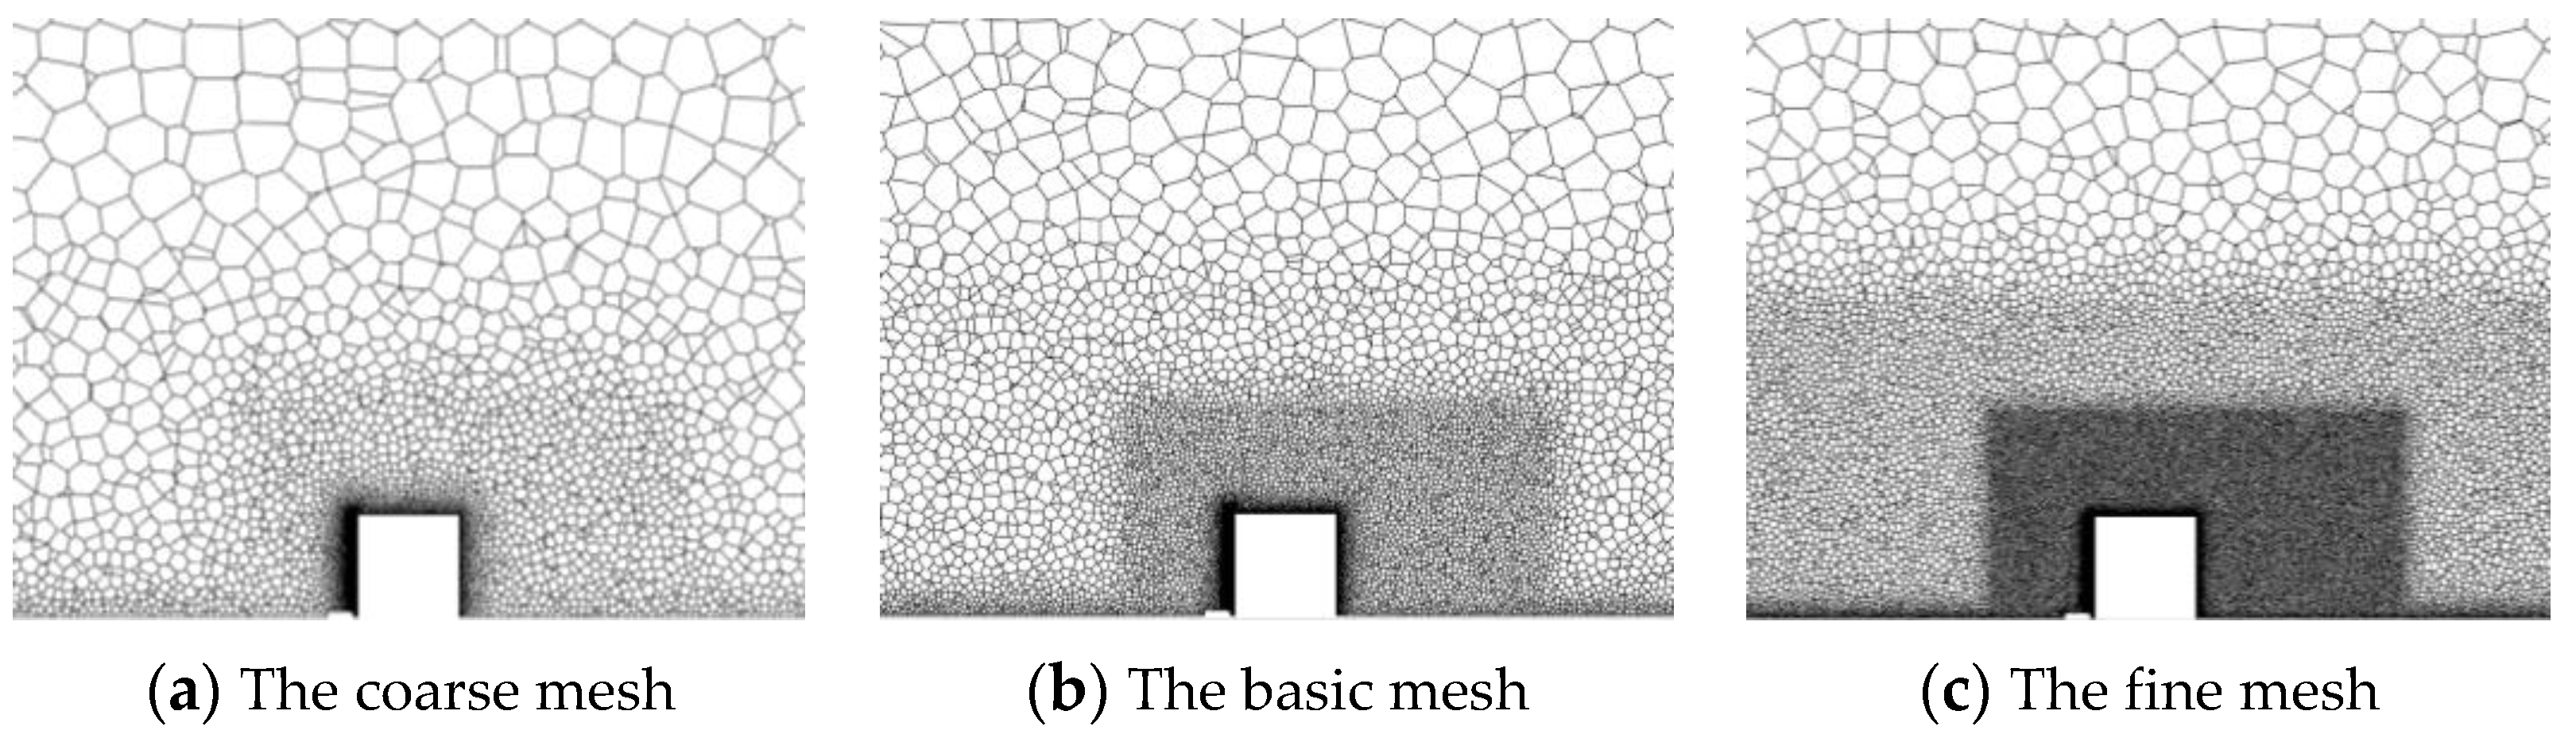
2.2. Computational Domain and Grid

The computational domain size is set based on the guidelines by Tominaga et al. [29] and Franke et al. [30]. The length of the upstream and downstream domain is 5H and 15H, respectively (H = 0.5 m), and the distance between the building side and the domain side is 5H (Figure 3a). The geometric model of louvers is simplified, and the multiple louvers in each row are combined into one piece (Figure 3b). The computational domain is discretized by hybrid grids generated using fluent meshing (Figure 4). In order to solve the low Reynolds number flow near the wall and improve the accuracy of heat transfer calculation, 20-layer prism grids are set up, in which the height of the first layer is 160 mm, and the growth rate is 1.1. Grid independence analysis was conducted for 3 groups of mesh sizes, which are shown in Figure 5. The prediction results of them for the CHTCavg are shown in Table 1. It can be seen that the basic mesh has nearly the same accuracy as the fine one. Thereby, the generation of the basic mesh was selected for the following studies.

2.3. Boundary Conditions

At the inlet of the computational domain (Plane A), the exponential atmospheric boundary layer inflow profiles of wind speed U (m/s), turbulent kinetic energy k (m2/s2), and turbulence dissipation rate ε (m2/s3) are imposed.
  U ( z ) = U H ( z H ) a
k ( z ) = ( U ( z ) I ( z ) ) 2
    ε ( z ) = C μ 0.5 k ( z ) U H H a ( z H ) ( a 1 )
where UH (m/s) is the reference wind speed at the building height H; a is the power-law component determined by the terrain category and is taken as 0.27; I is set as the measured exponential turbulence intensity in Figure 2; Cμ is the model constant, which is 0.09. The outlet of the domain (Plane B) is set as the zero-static pressure, and the turbulence parameter setting is consistent with the inlet. The air temperature is imposed at 10 °C, the windward façade and louver surfaces are set as fixed temperatures of 20 °C and 30 °C, respectively, while other building surfaces and the ground are imposed as adiabatic conditions. The lateral side and top of the domain are modeled as slip conditions, while no-slip conditions are applied on the ground, building, and louver surfaces.

2.4. Solver Settings

The commercial software ANSYS Fluent 19.0 is employed to perform simulations. The 3D steady RANS equations with the realizable k-ε turbulence model are solved in combination with the low Reynolds number Wolfshtein model (LRNM). The SIMPLE algorithm is used for pressure–velocity coupling; pressure interpolation is second-order, and the convection and viscosity terms of the governing equation are set as a second-order upwind scheme. When all the scaled residuals tend to be stable and the monitored velocity, turbulent kinetic energy, and heat flux also reach stability, it can be determined as convergence.

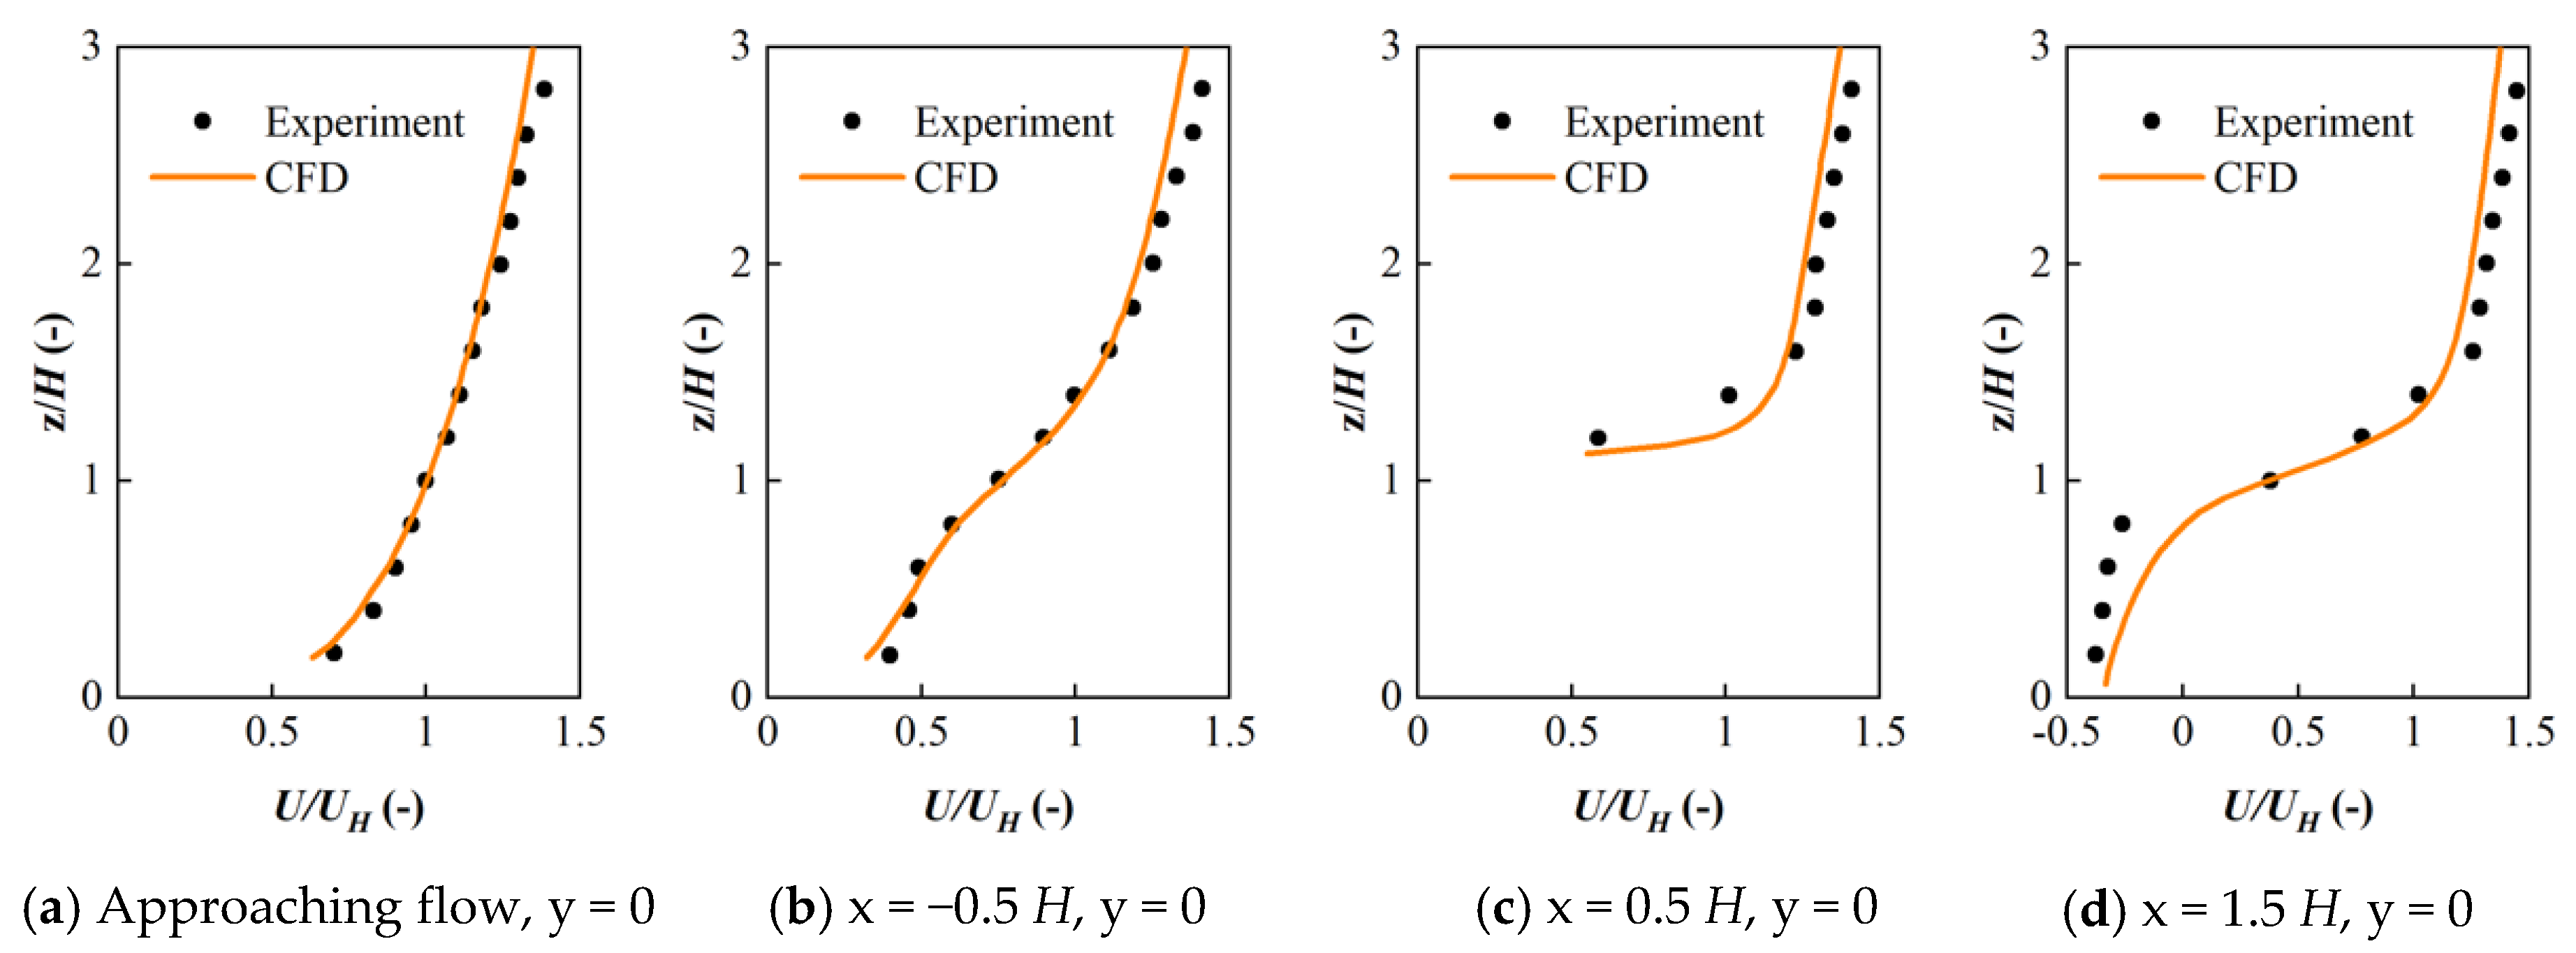
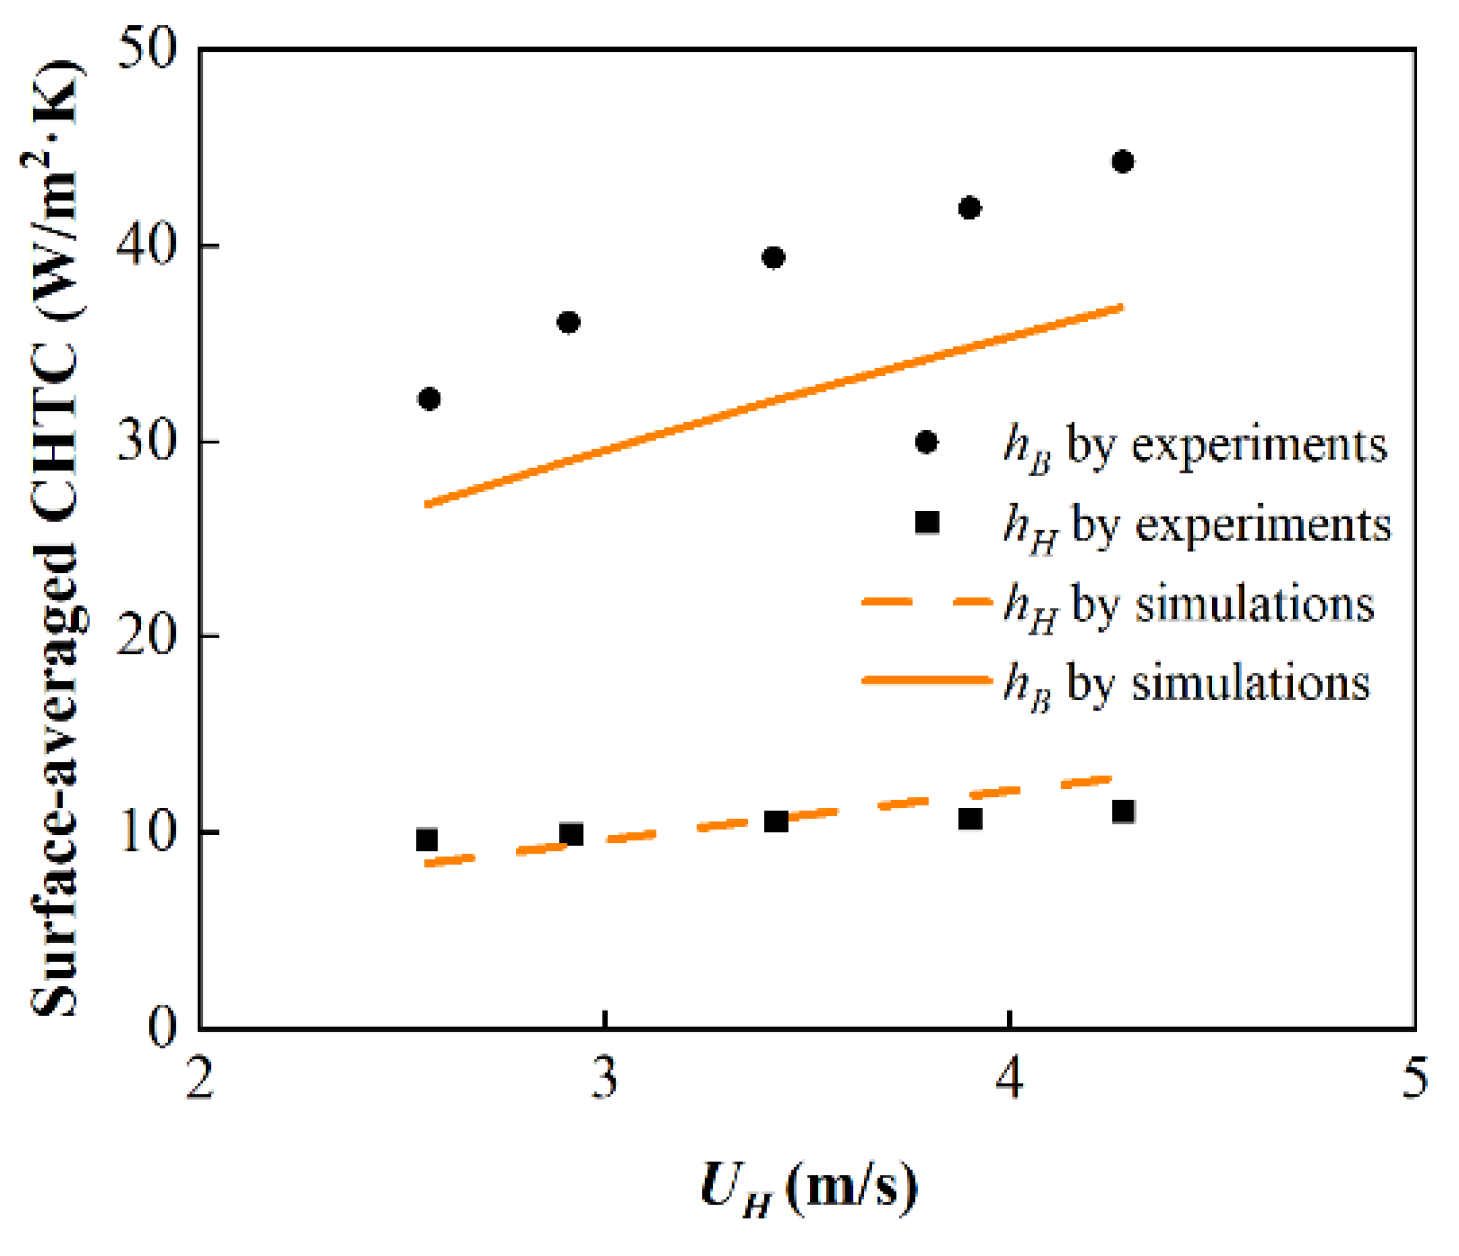
2.5. Comparison between Experiments and Simulations

The convective heat transfer is mainly affected by the flow field. Therefore, the velocity field should be verified first, and the results are shown in Figure 6. Under the same inflow conditions, the predicted results of the wind speed upstream of the building are in good agreement with the experimental results, while the predicted results downstream of the building are somewhat different from the experimental results. However, the trend of the simulated velocity profile in this area is relatively consistent with the wind-tunnel experiment. In addition, the flow field in the tail area has little direct impact on the convective heat transfer of the windward façade, and therefore the simulation results are acceptable. This paper mainly studies the convective heat transfer on the building façade and louver surfaces; therefore, in addition to the velocity field, it is also necessary to verify the convective heat transfer on these surfaces. The comparison of the surface-averaged convective heat transfer coefficient (CHTCavg) obtained from the wind-tunnel experiment and numerical simulations is shown in Figure 7. It can be seen from the figure that the CHTCavg on the windward façade obtained by numerical simulations is close to that obtained by the wind-tunnel experiment, but the CHTCavg on louver surfaces obtained by simulation is somewhat different from the experimental results. The main reason for this difference is that the louver model used in the experiment is equipped with structural components such as brackets and connecting rods. Although there is no internal heat source in these structural components, the louver can transfer heat to these components through convective and radiative heat exchange, which increases the overall heat exchange area and increases the surface heat exchange. However, these components are not included in the heat transfer area when calculating hB. Therefore, the experimental results of hB will be greater than the numerical results. Despite the above discrepancies, the discrepancy between the numerical and experimental results of hB is less than 15%, and the changing trend with increasing wind speed is nearly identical to that of the experiment. Therefore, the simulation results can still be acceptable.

3. Simulation Results for Convective Heat Exchange of the Louvered Buildings with Different Wind Direction

3.1. List of Simulation Cases

In this study, the CHTC at the building façade in 63 shading conditions and 7 unshaded conditions are investigated by the above simulation methods, the settings of which can be seen in Table 2. The wind attack angle φ is emphasized in Table 1 because the effect of wind directions is the key aspect of this paper. For each case, the convective heat exchange results under Uref = 2.56 m/s, 2.91 m/s, 3.41 m/s, 3.86 m/s, and 4.27 m/s were discussed. In addition, the louver slat’s width is set as B/H = 0.35, and the temperature difference among the façade, blinds, and air is set as THTa = 10 °C, TBTa = 20 °C [20,21].

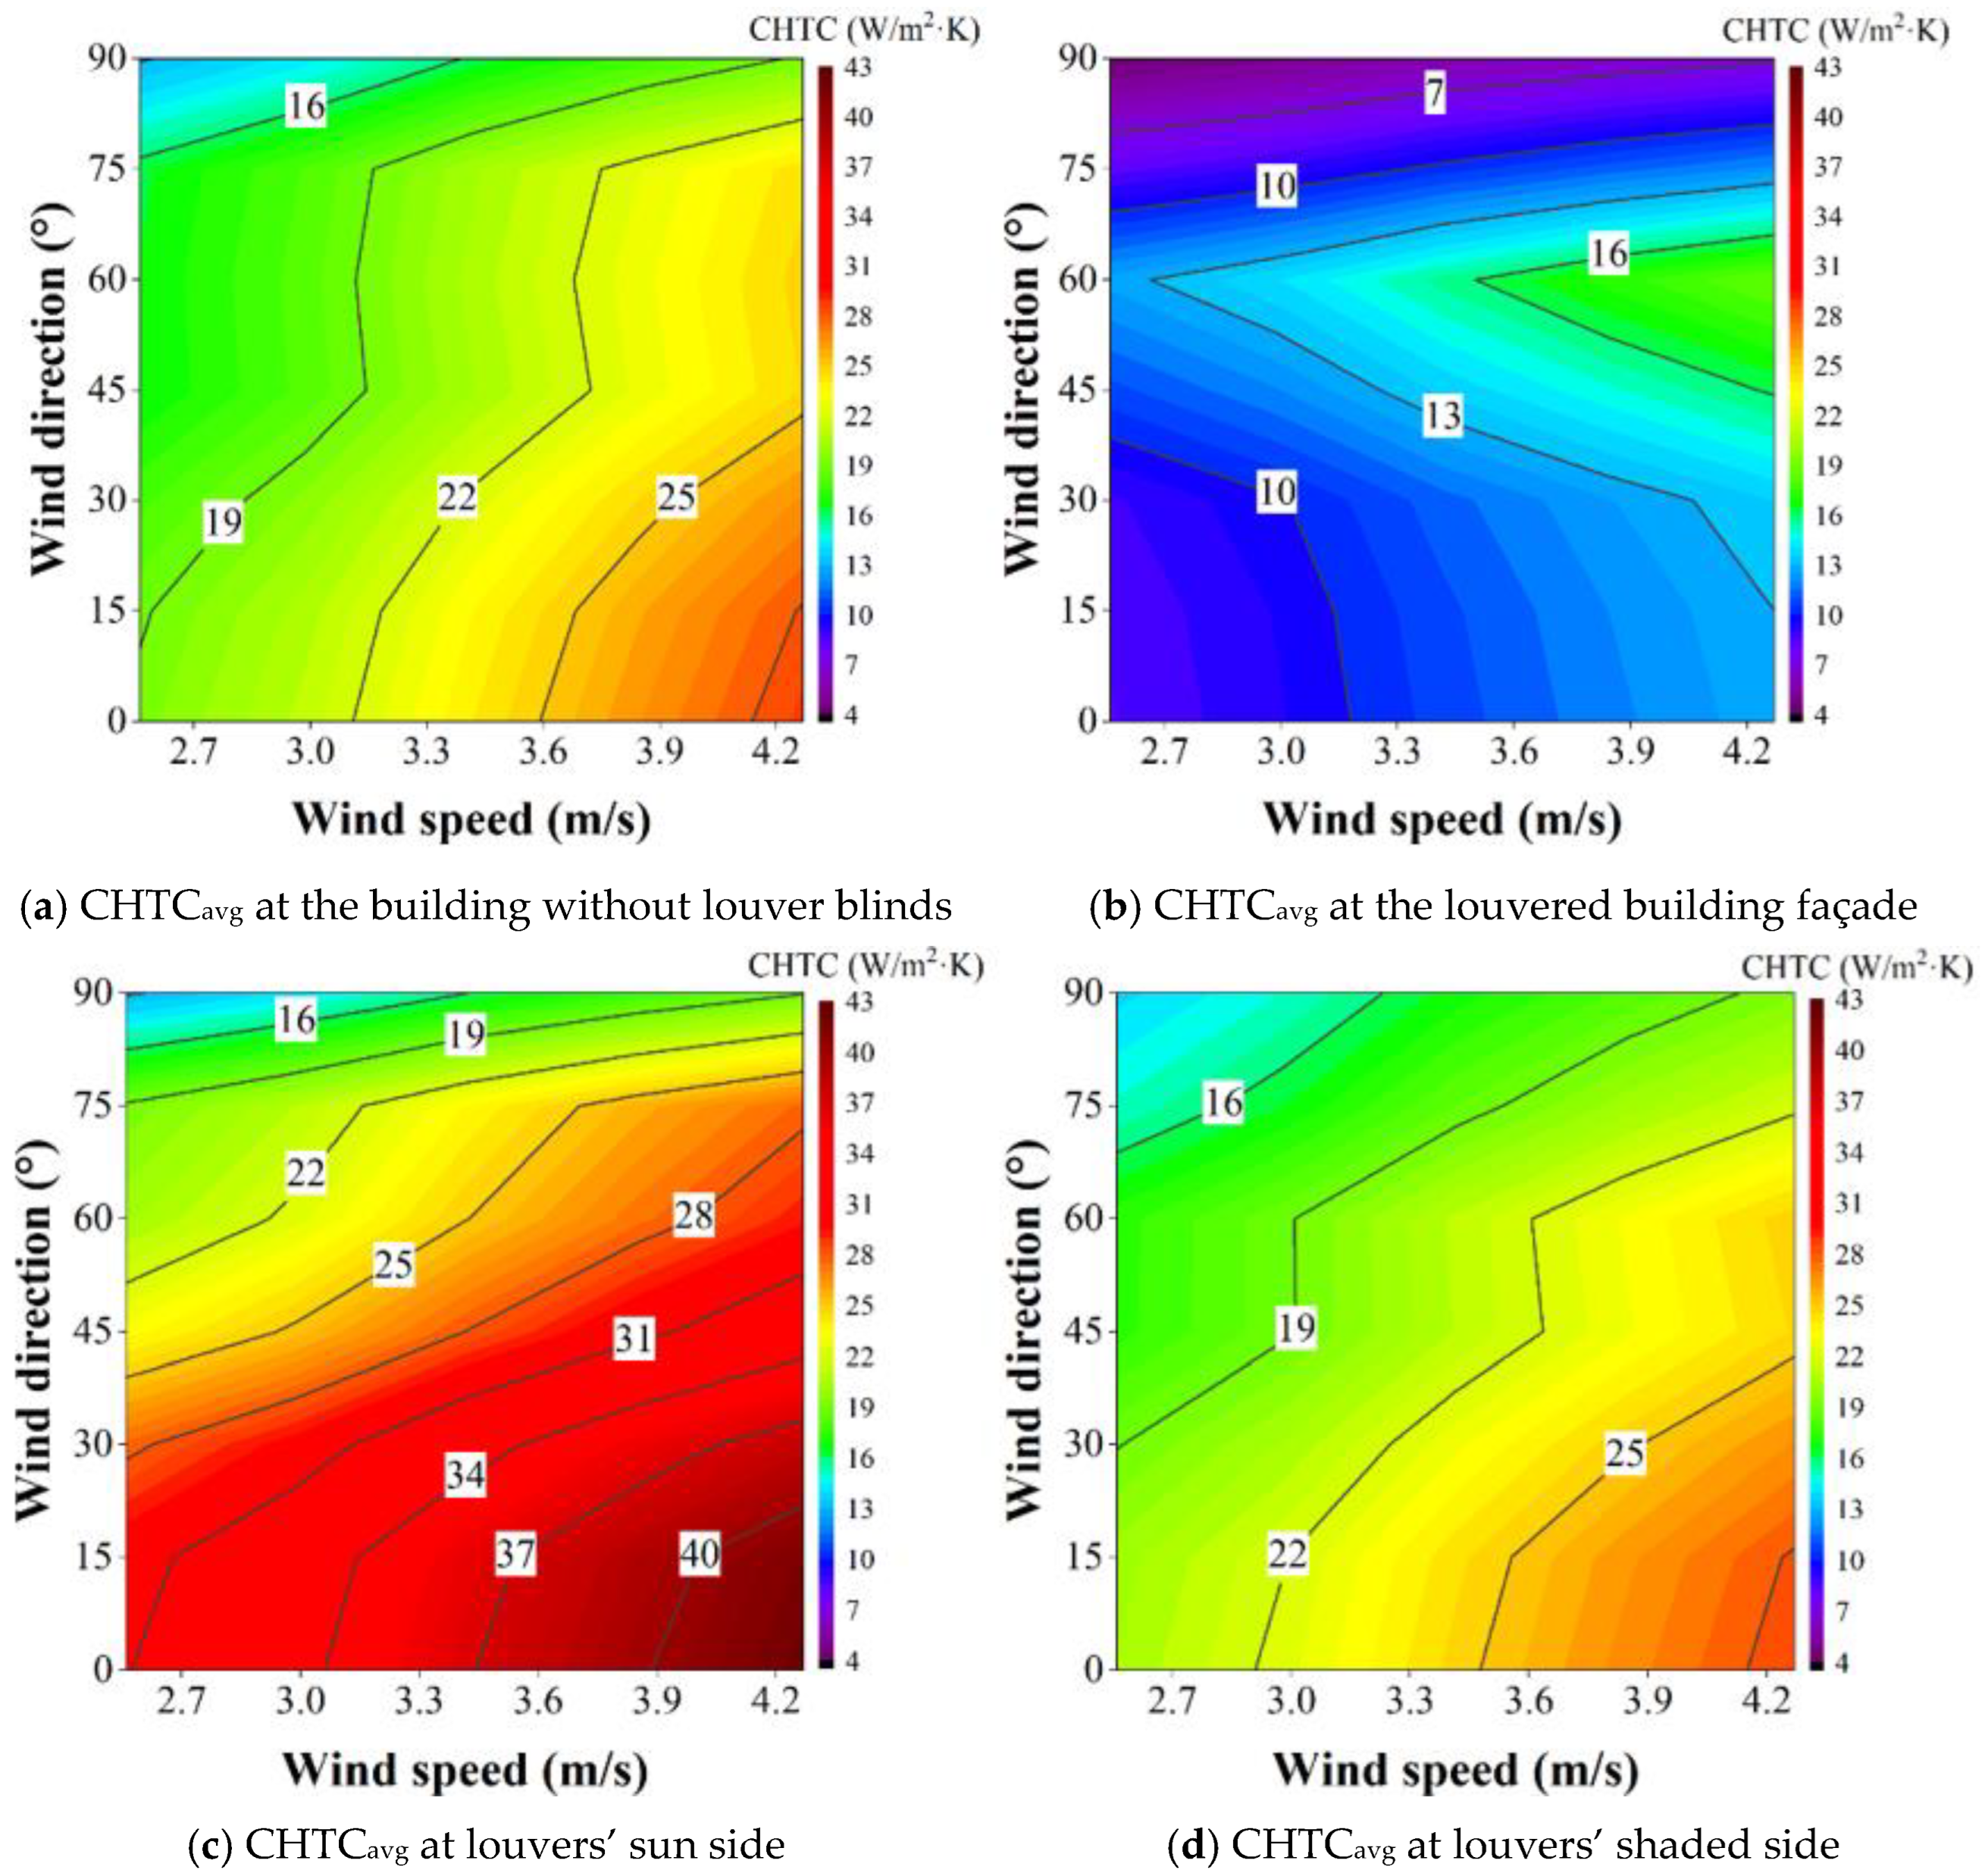
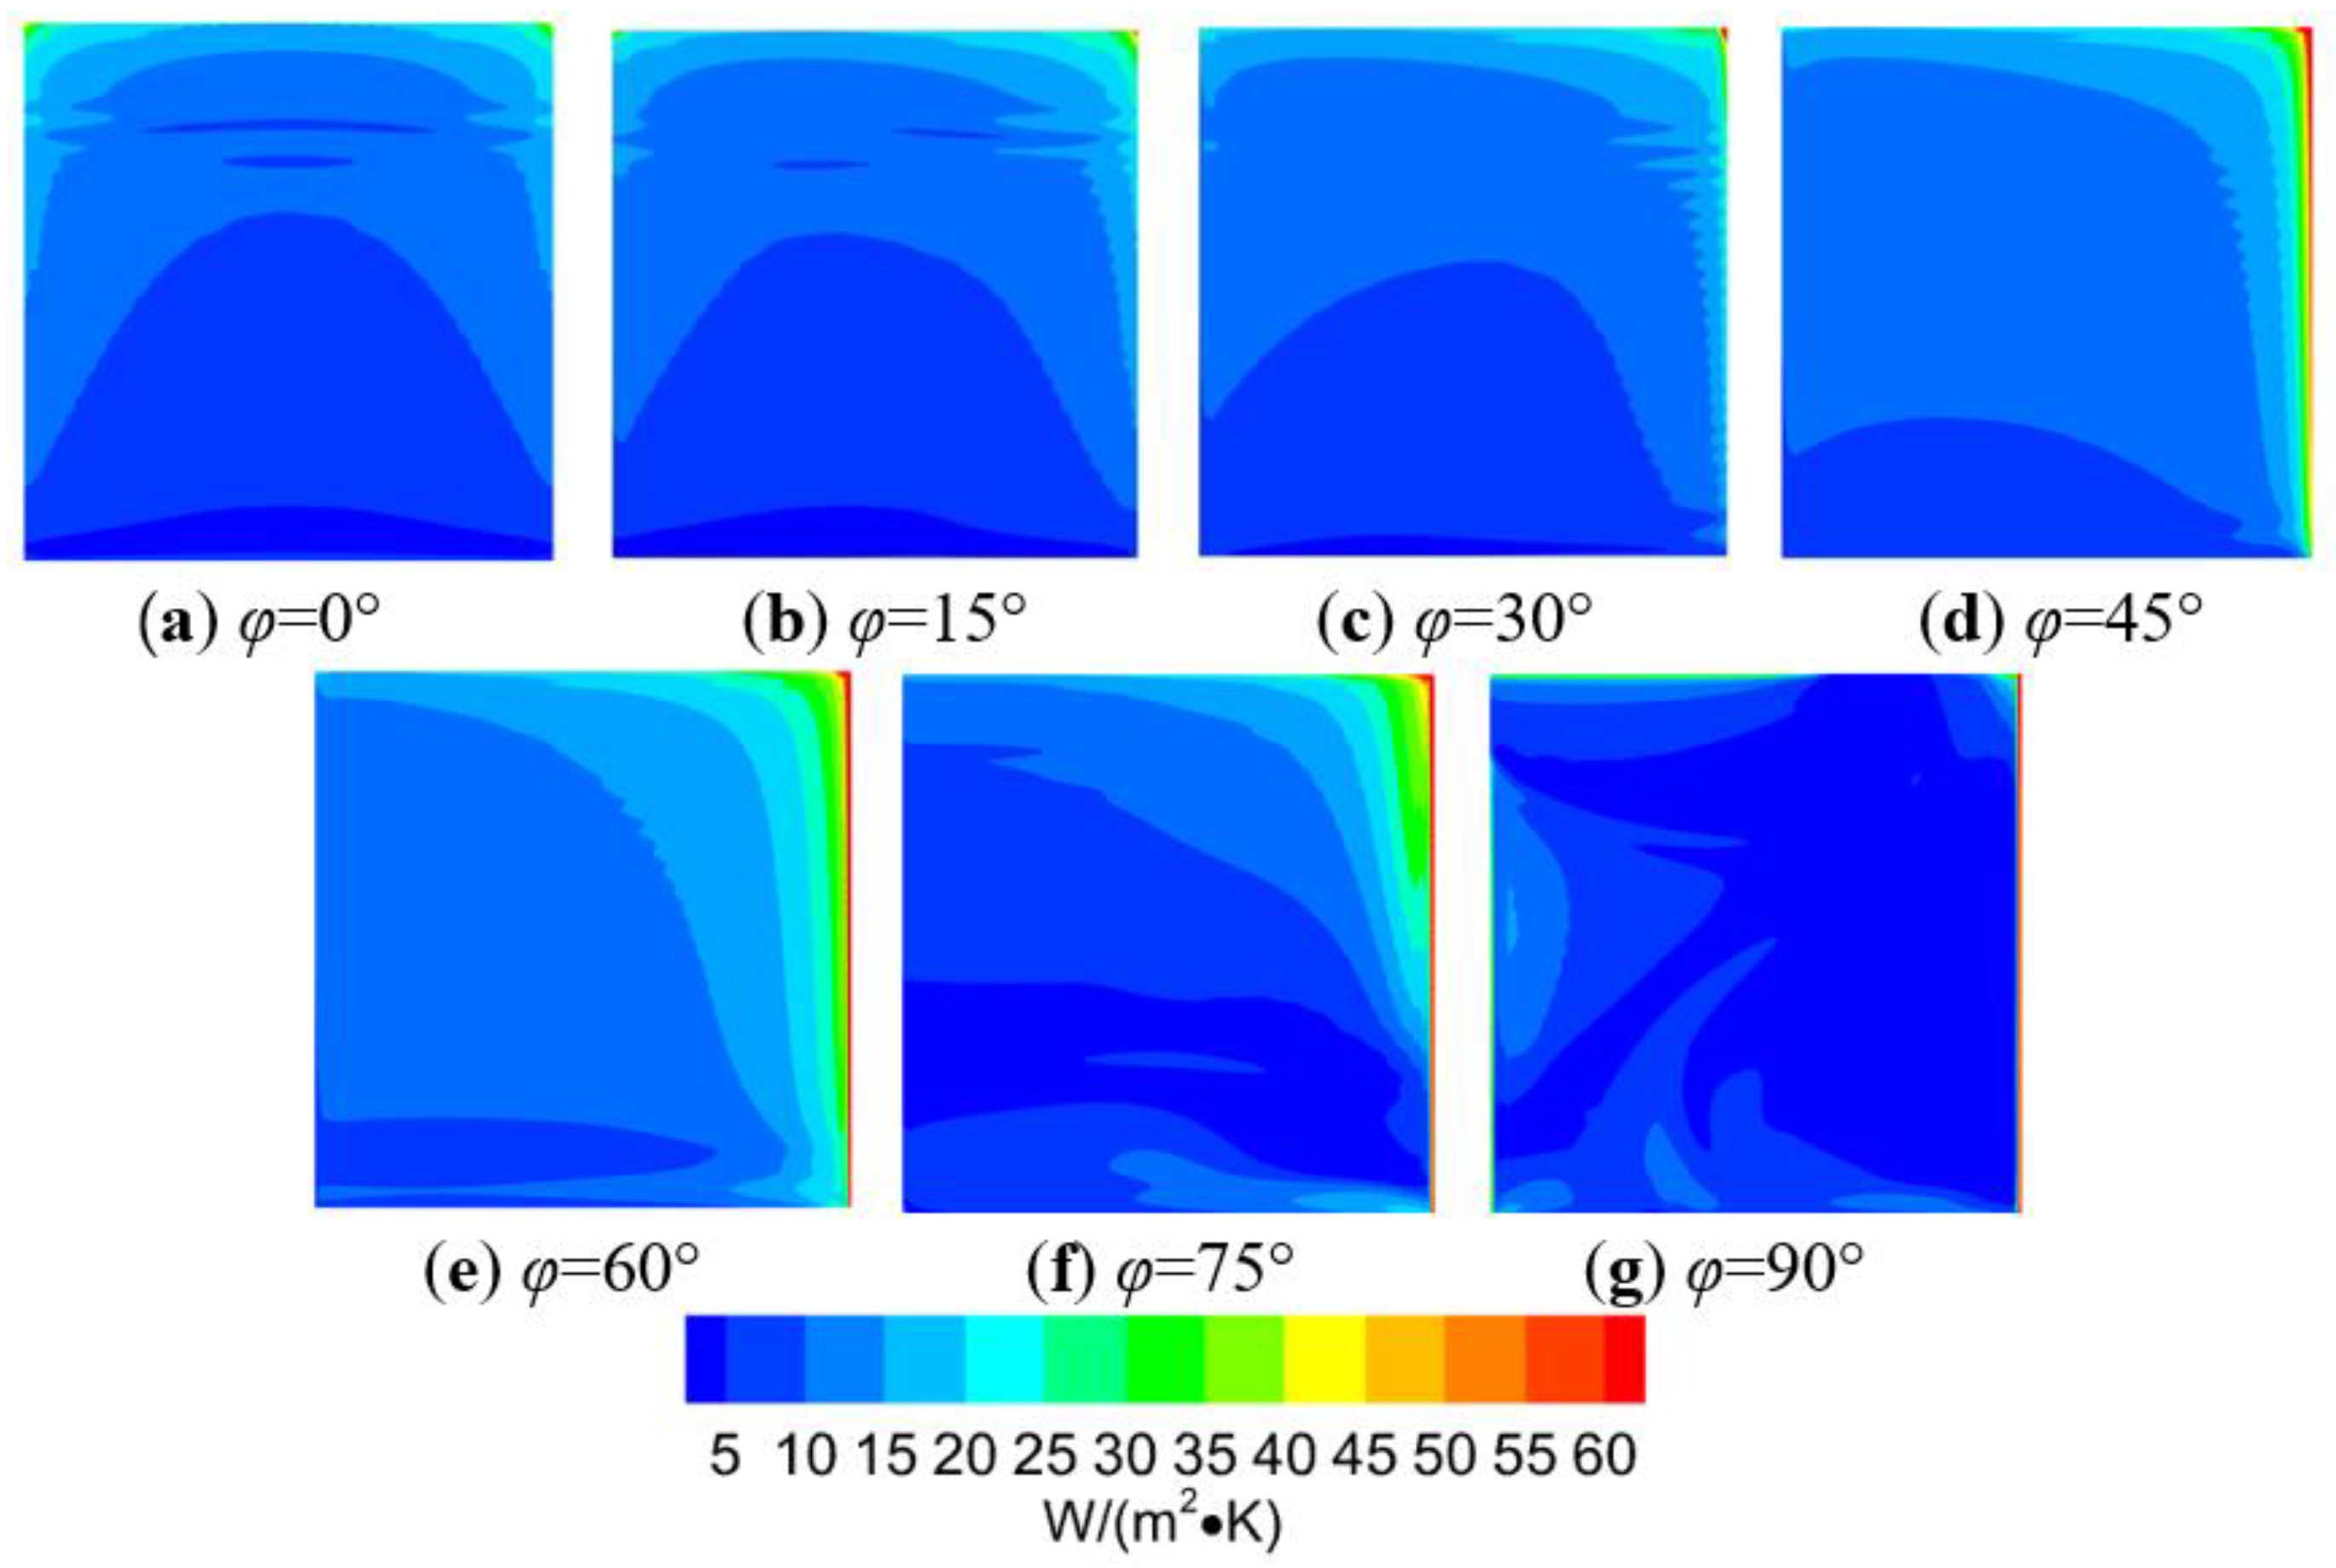
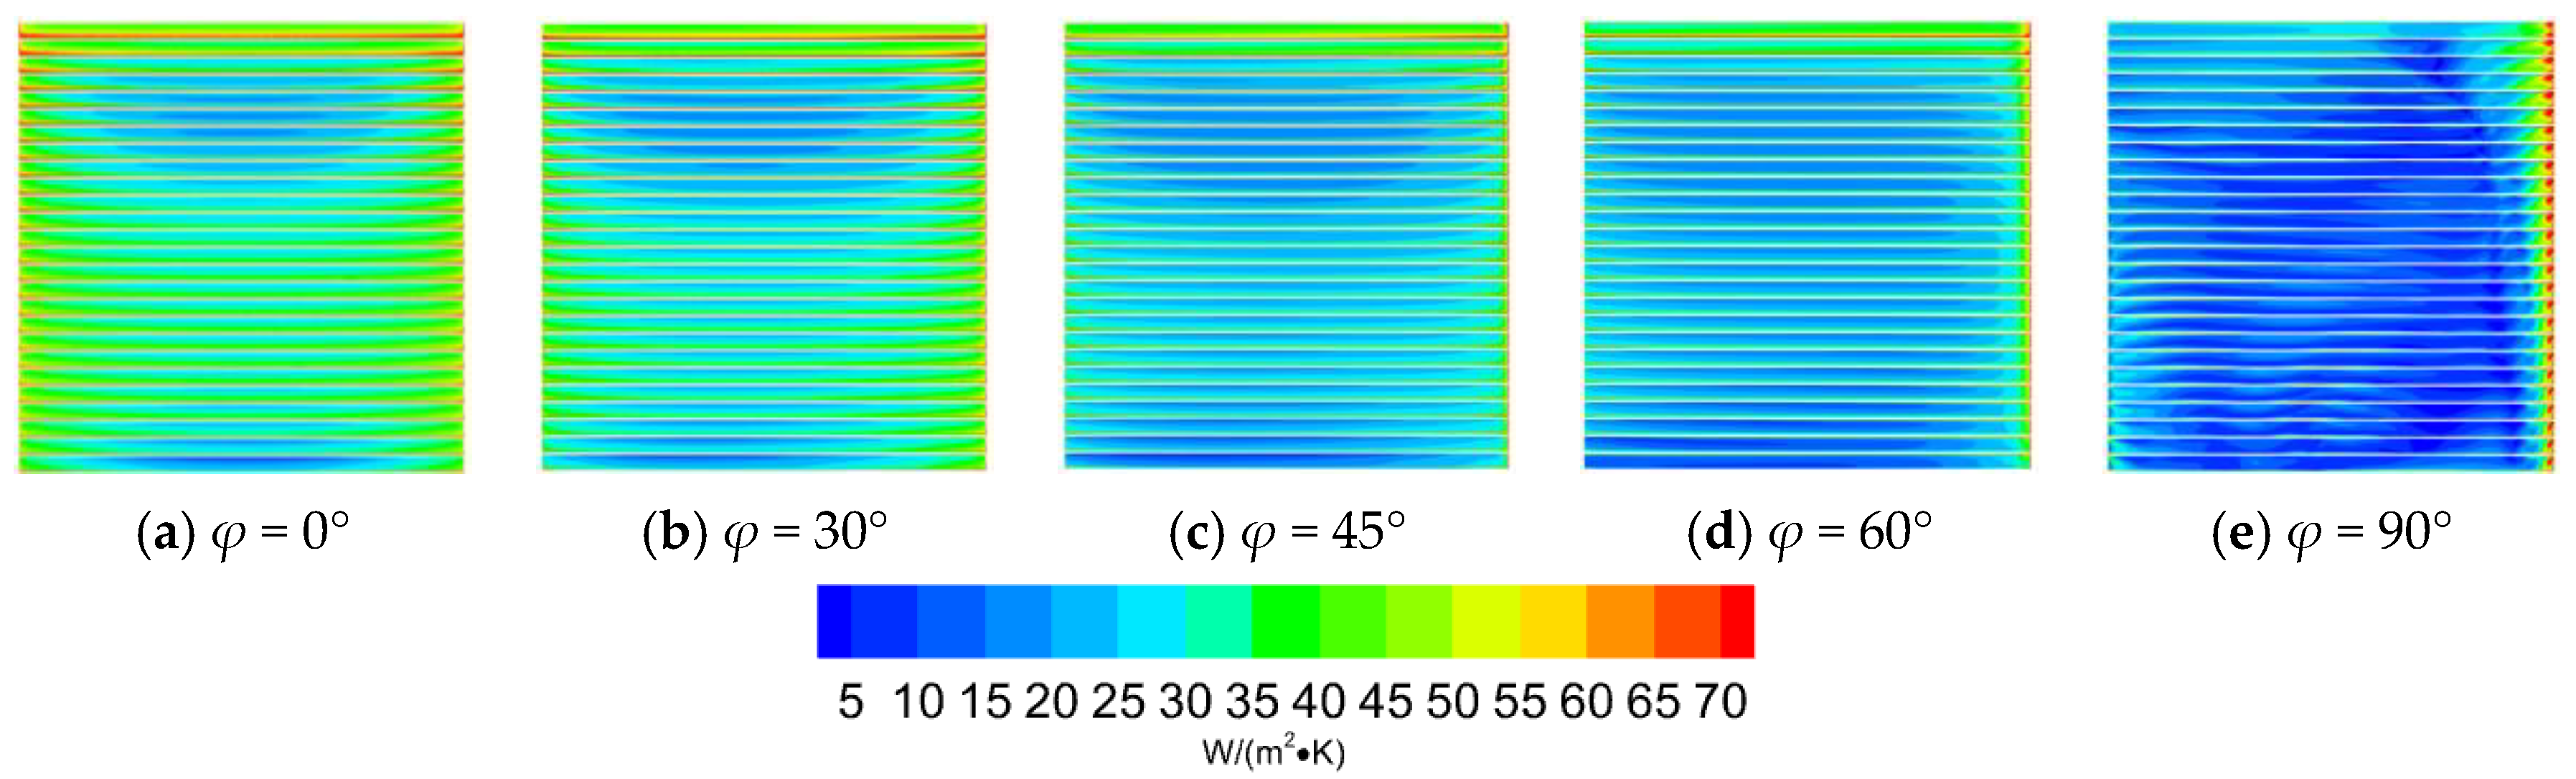
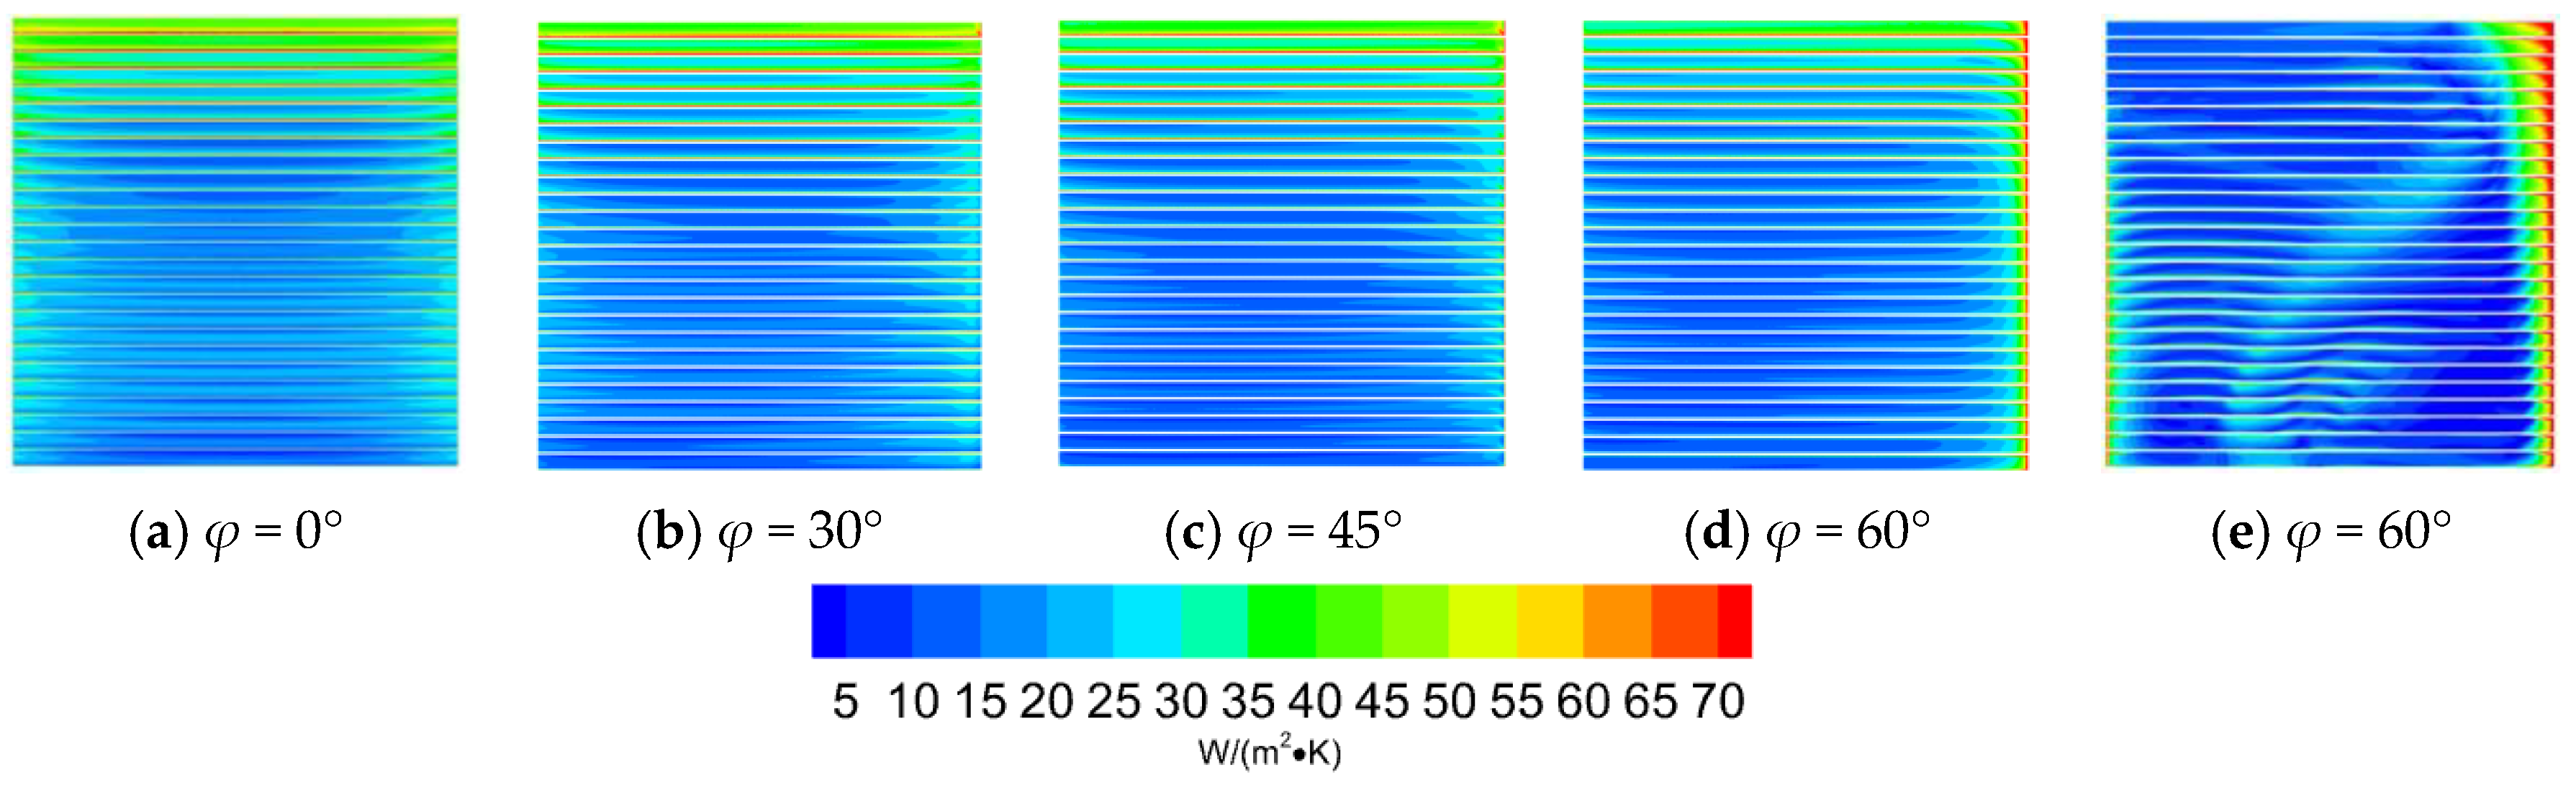
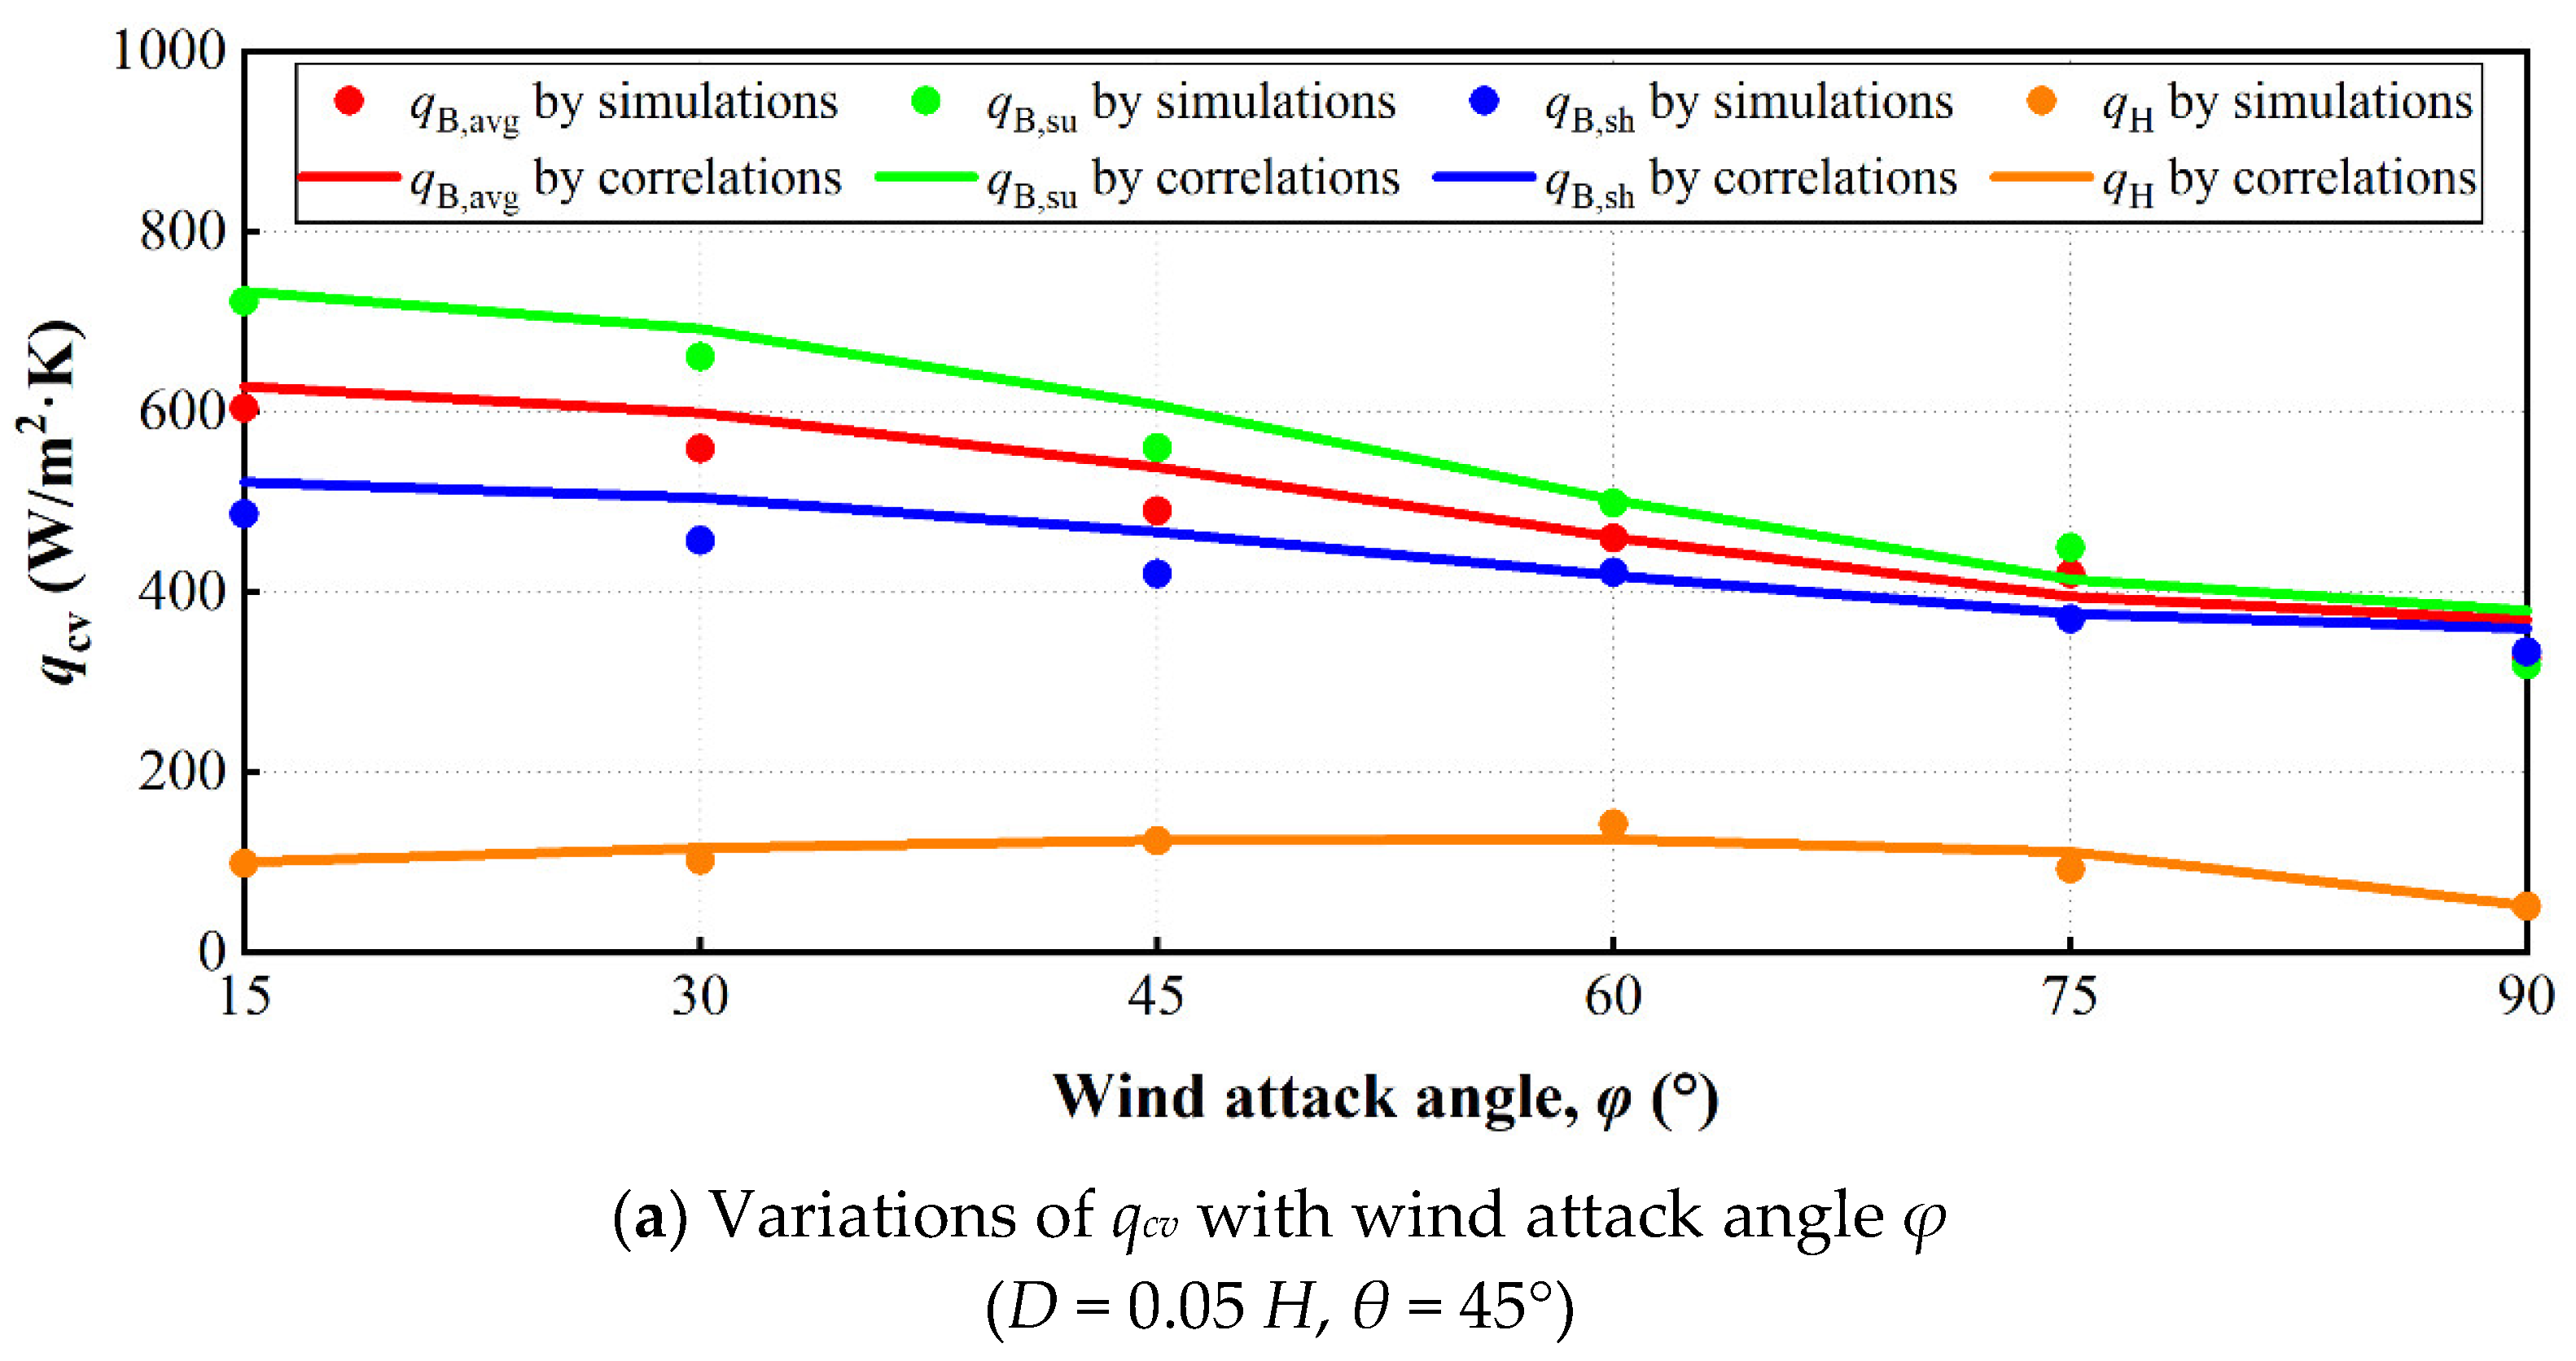
3.2. The Effects of Wind Directions on the Convective Heat Exchange at the Building Façade with Louvers

Figure 8 shows the comparison of the CHTC at the building façade/louvers among different louver angles θ. As discussed in previous studies [20,21], because of the barrier effect of louver blinds, the convective heat exchange rate of the louvered façade will be quite smaller than that of the unlouvered one. In addition, the growth of wind direction will depress the convective heat transfer of the façade without blinds. However, when the horizontal louvers are set in front of the building, with the wind attack angle increase, the CHTC of the façade will first rise up by about 40~50% and then decrease to about 60~70% of the CHTC with φ = 0°. This growth of the CHTC of the façade may come from the decrease in louvers’ barrier effect due to the change in φ from 0° to 60°, which was also concluded in the previous studies about wind ventilation [31]. With the φ increased from 0° to 60°, one edge of the façade will gradually change from the louvers’ downstream to the upstream position parallel to the louvers. The change in relative position for this region will make it directly attacked by the approaching airflow. Therefore, the local convective heat exchange of this edge region will rise significantly with the direction change (see Figure 9a–e). Then, with the further growth of wind attack angle, the suppression of the edge region’s convective heat exchange from the flow separation will exceed the enhancement from the previous effect, which will finally lead to the decline in the average CHTC of the façade when φ changes from 60° to 90° (see Figure 9e–g).
It can also be seen from Figure 8 that for all wind directions, the average CHTCs of the louvers’ sun side and shaded side are both higher than that of their attached façade. Nevertheless, the vibration trend of the CHTC at the louvers’ surface will directly decrease with the growth of the wind attack angle, which is quite different from that at the louvered façade. This is because the louver blinds are located upstream, and therefore the rise in φ will divert the approaching flow from impinging on the slats to sweeping across the slats. These changes in flow patterns around the slats will directly result in a reduction in the convective heat exchange rate [32]. This can also be proved by the variation of the local convective heat exchange rate at the louvers. As shown in Figure 10 and Figure 11, with the wind attack angle turned from 0° to 90°, the local CHTCs along the sun side/shaded side of the louvers fall down gradually.

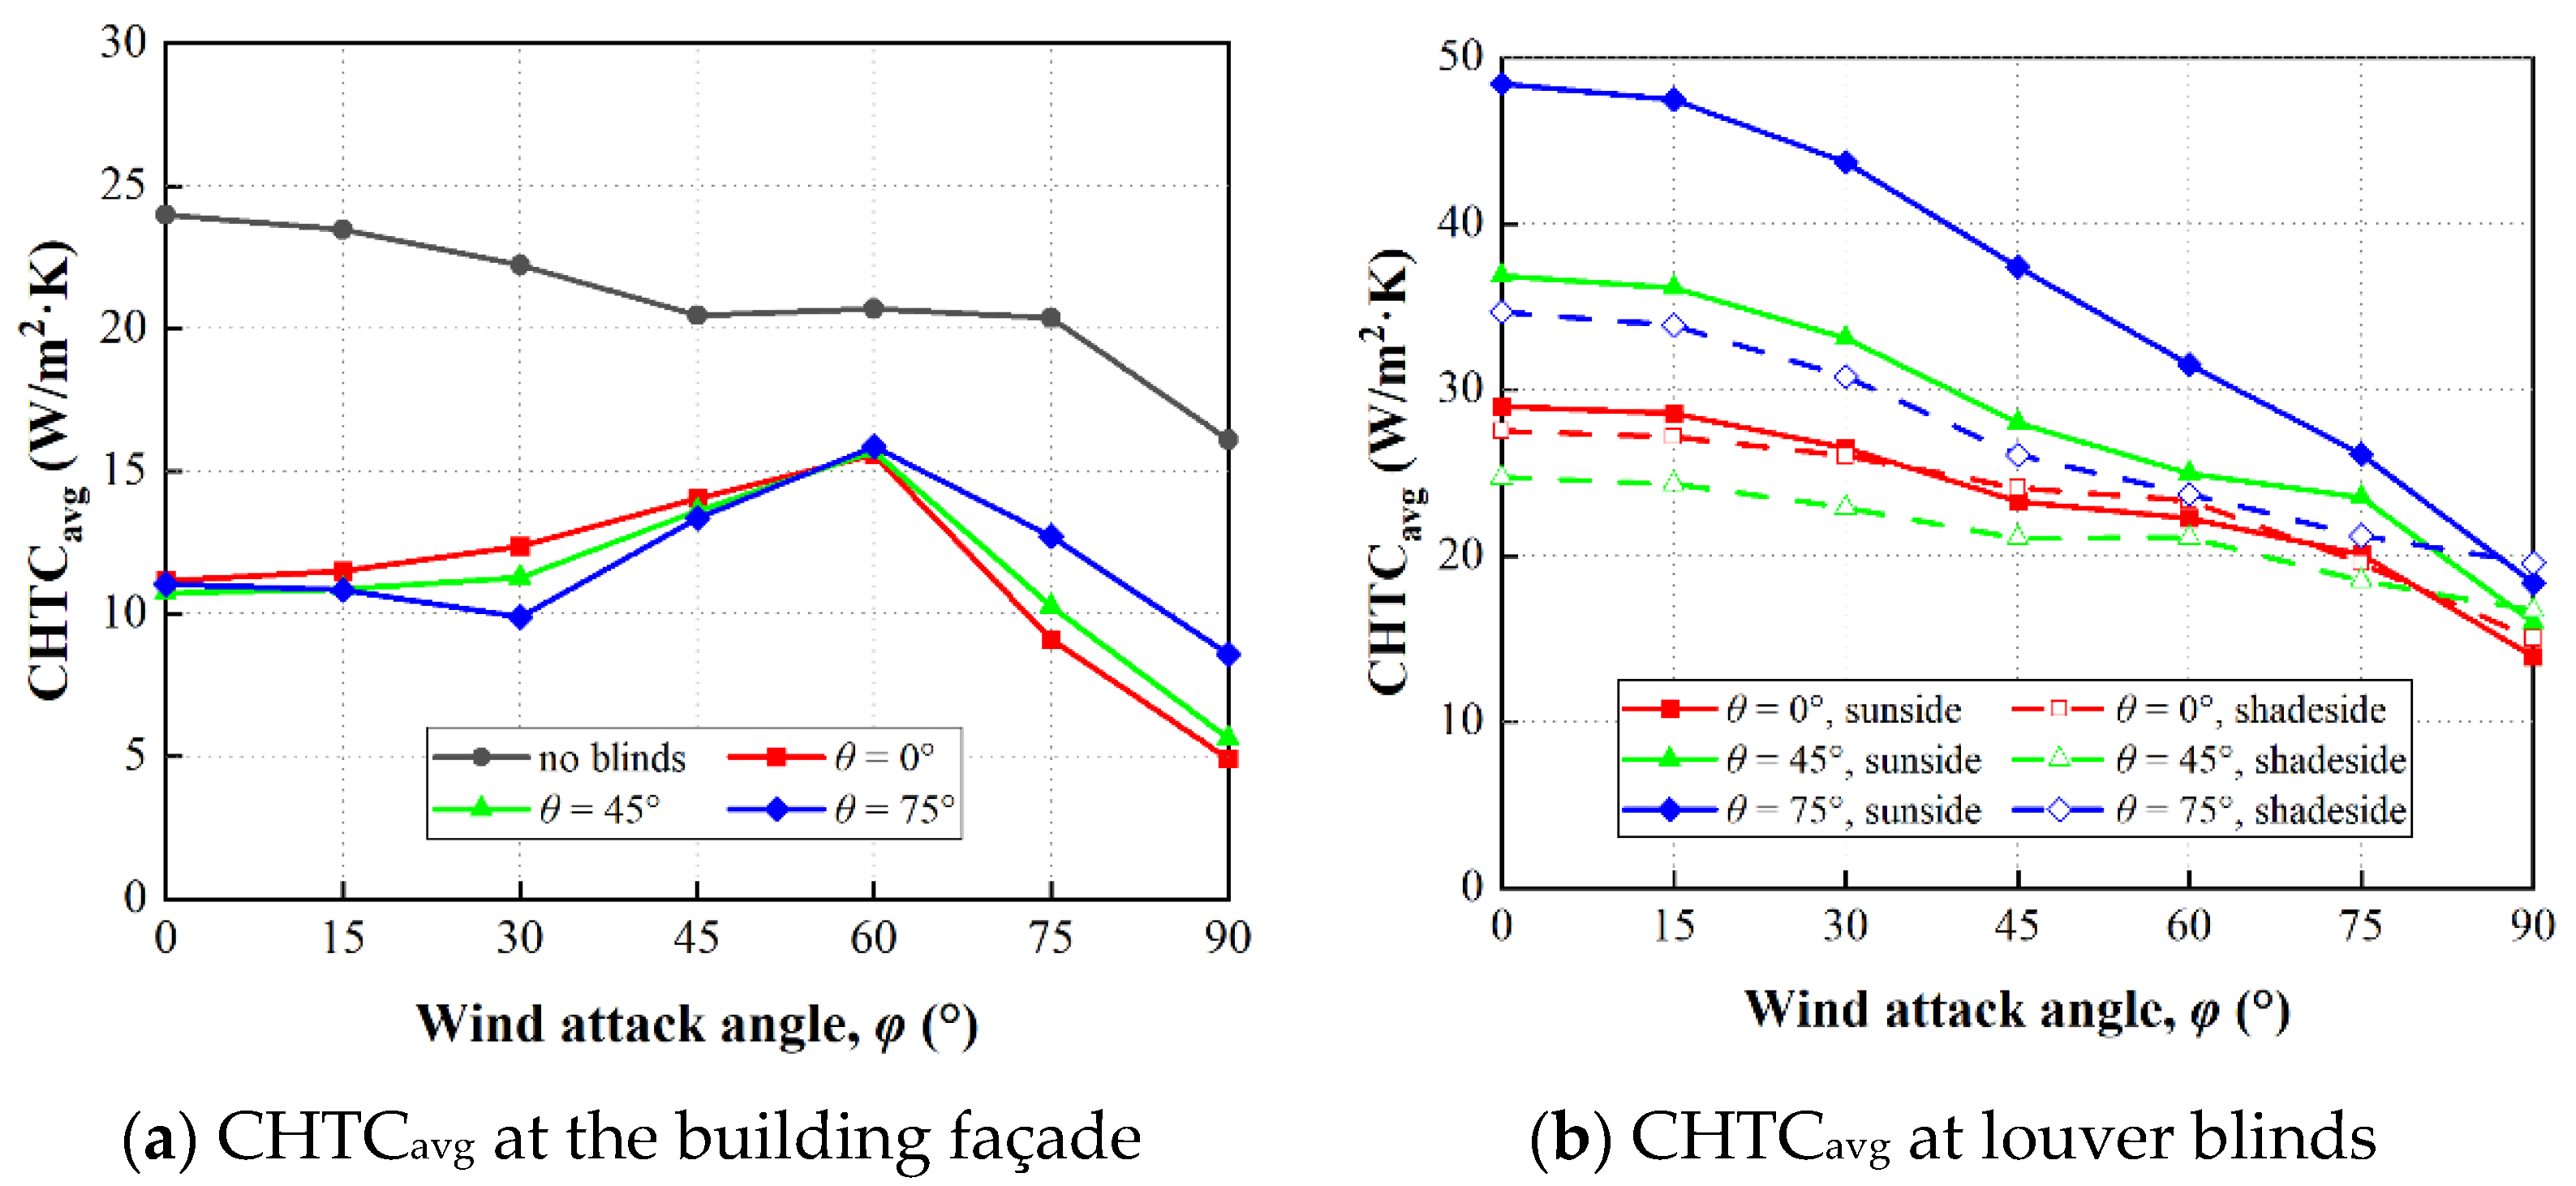
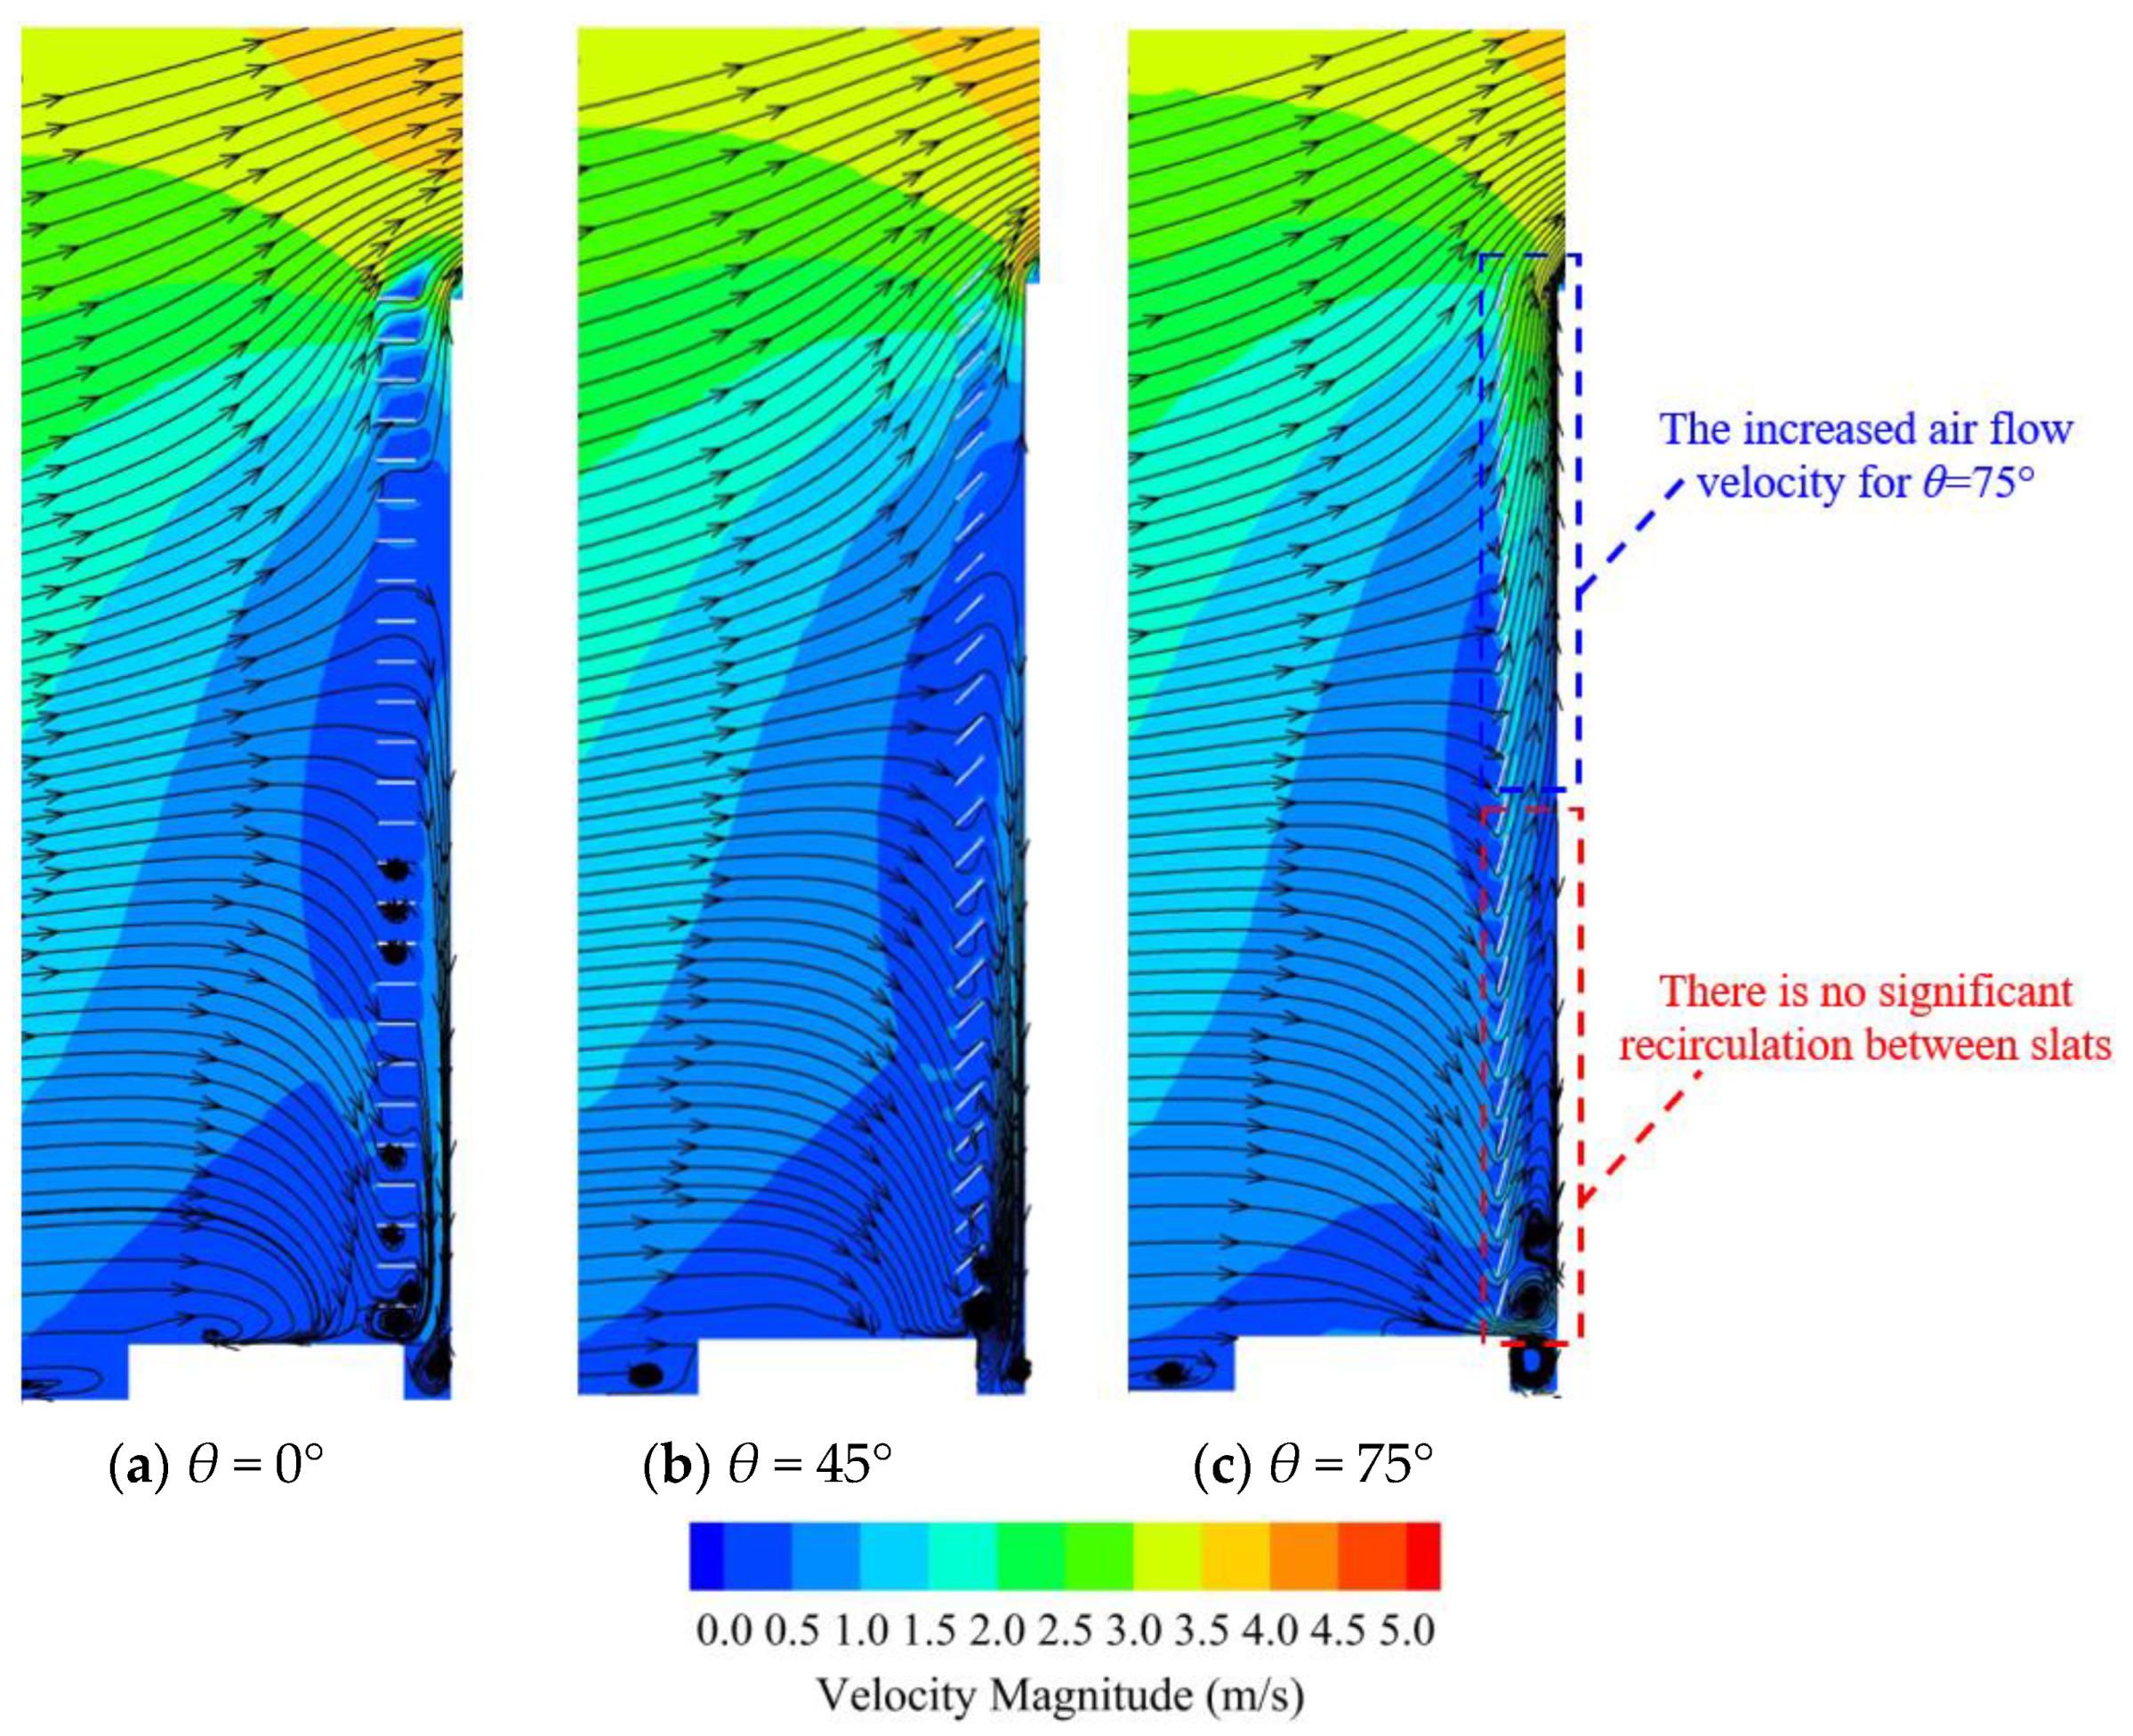
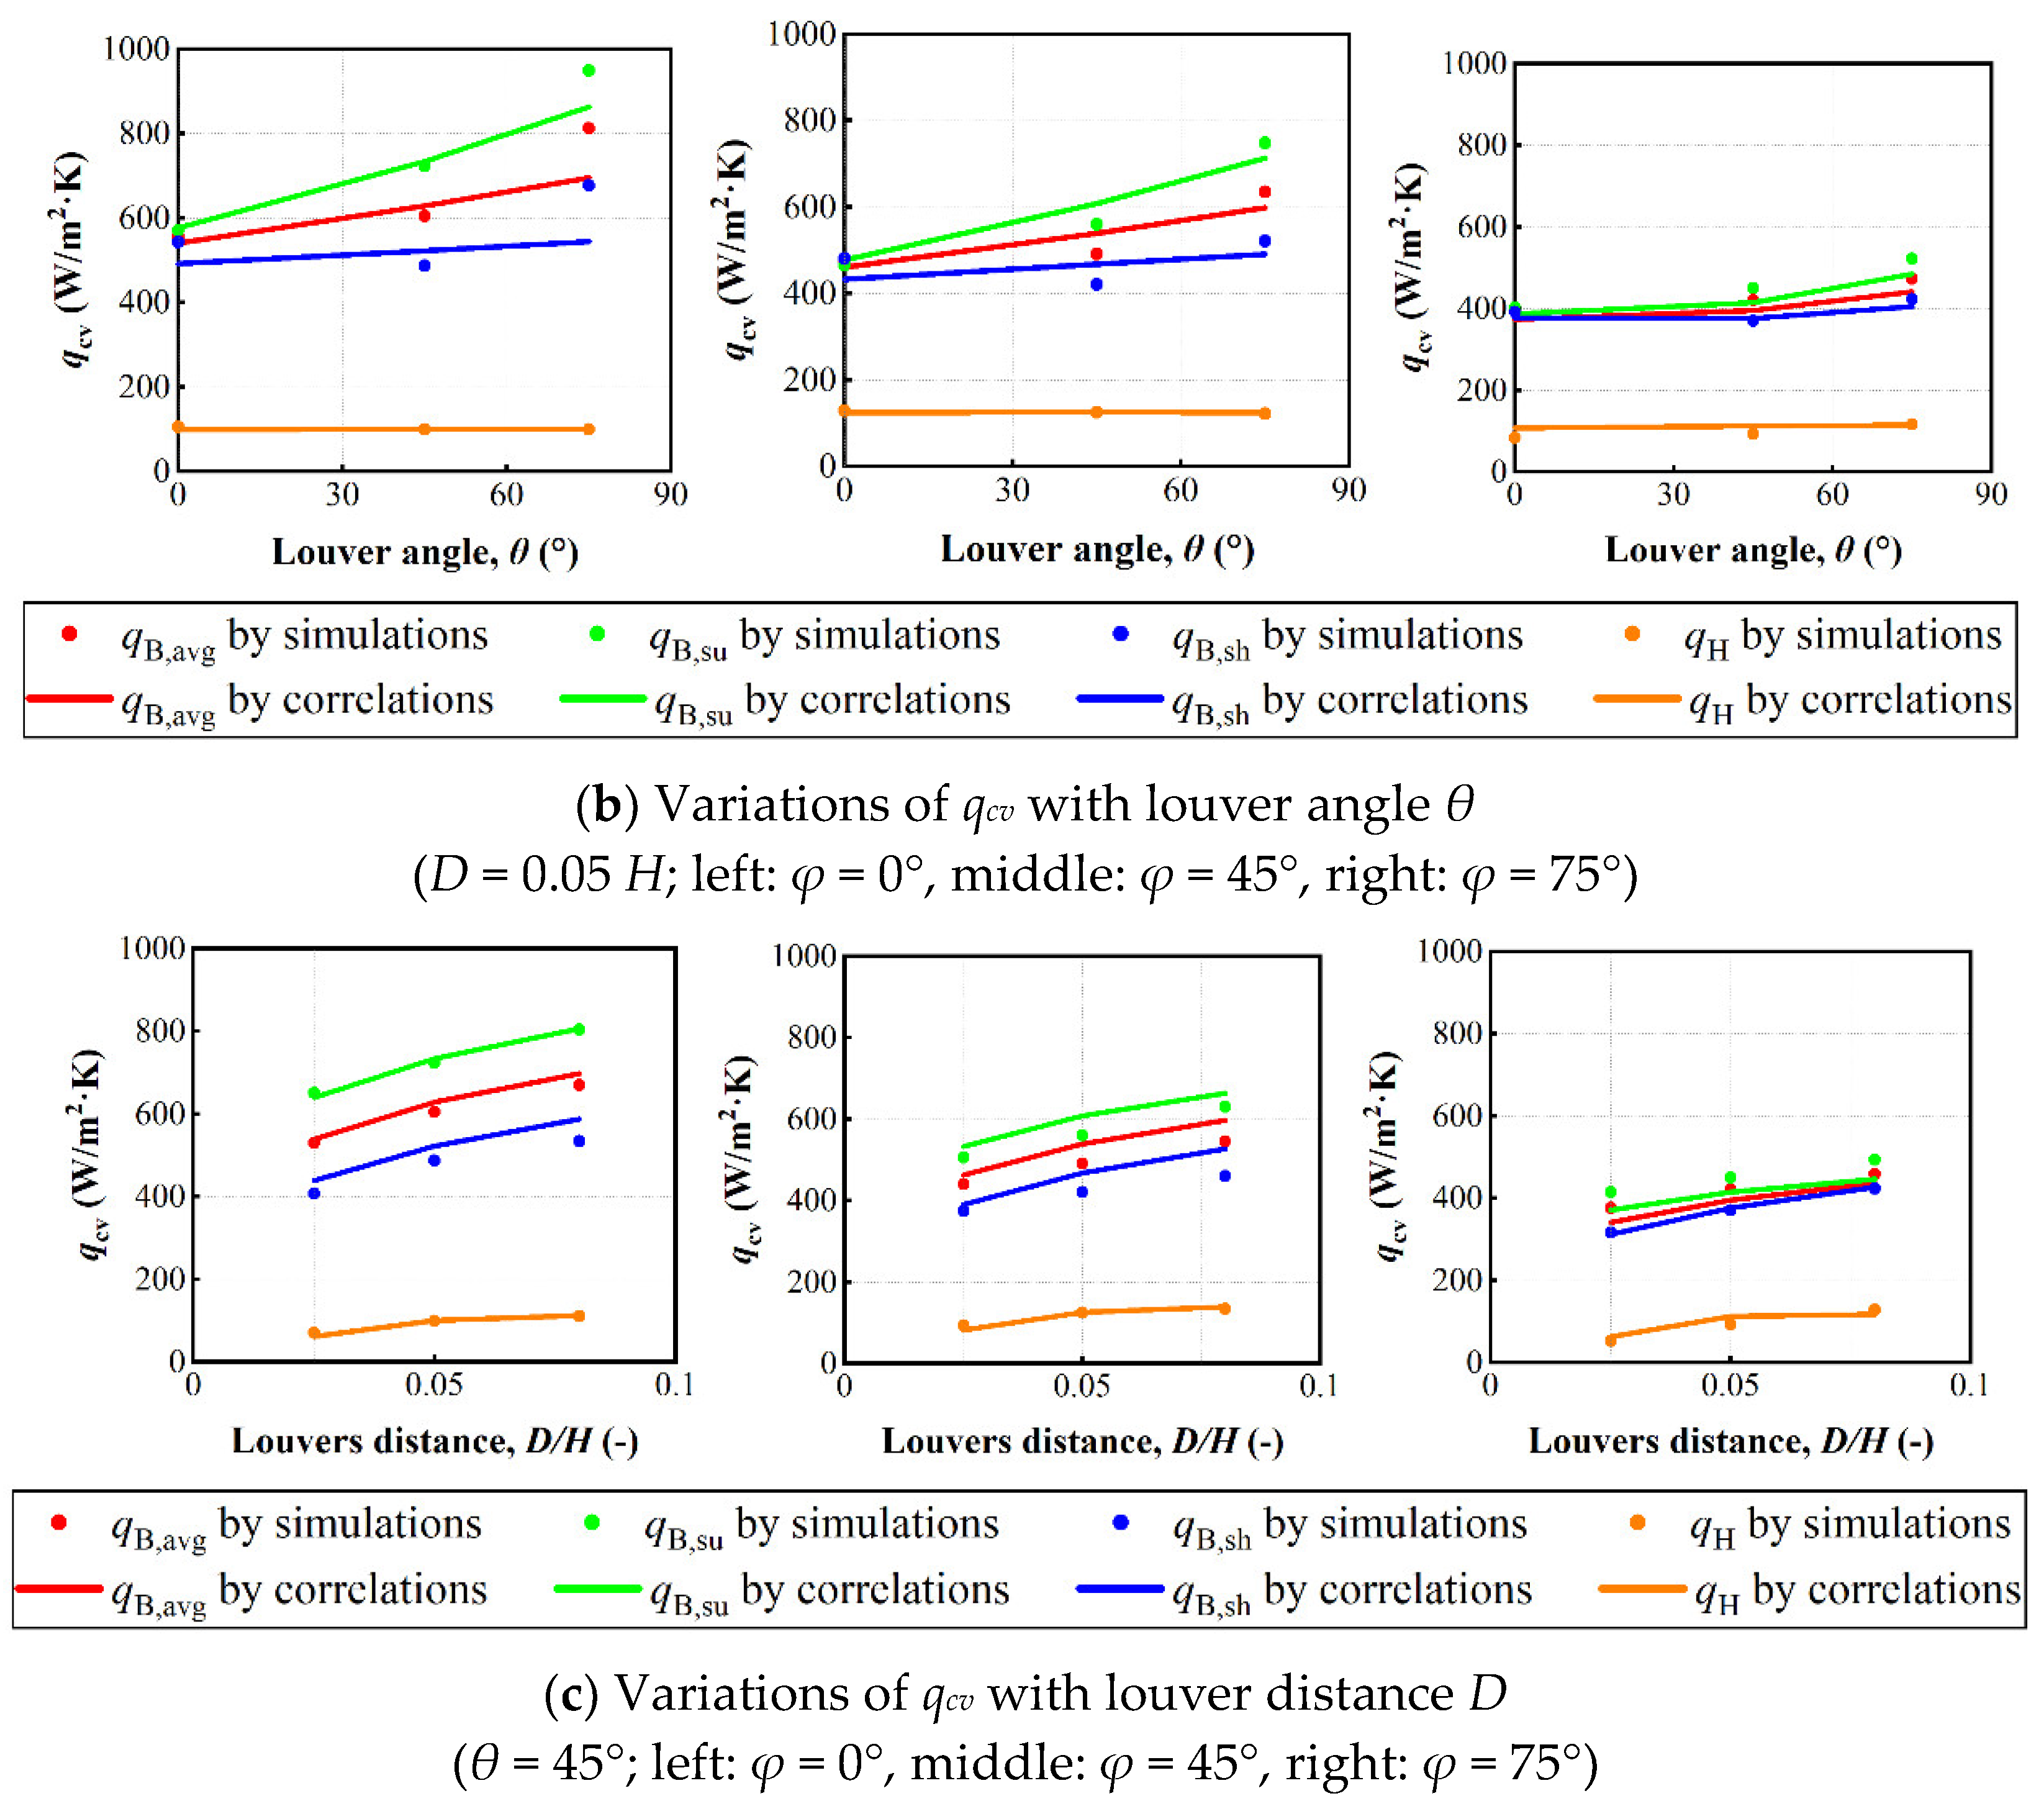
3.3. Influence of Louver Angle θ on CHTC at the Louvered Façade under Different Wind Directions

Figure 12 shows the comparison of the average CHTC at the façade and louver slats among different louver angles θ. It can be seen from Figure 12a that no matter the size of the louver angle, the convective heat exchange rate of the louvered façade is much smaller than that of the façade without blinds. Furthermore, for all three louver angles, the average CHTC at the façade will first increase as φ rises from 0° to 60° and then decrease as φ rises from 60° to 90°. The main difference is that the larger the louver angle, the greater the barrier effect on the approaching flow, resulting in a reduction in the convective heat exchange at the building façade, especially when φ is about 0° to 30°. This result is also similar to the previous results [20].
Figure 12b shows the average CHTC at louver blinds under different slat angles θ. Unlike the building façade, the average CHTC at the louvers’ sun side will increase with the growth of θ. The reason is that the growth of the louver angle will make the approaching flow change from sweeping across the slats’ sun side to impinging on them, which will promote the convective heat transfer at the slats’ sun side [32].
It can be also seen from Figure 13 that the average CHTC of the louvers’ shaded side does not monotonically increase/decrease with the rise of θ. As the louver angle changes from 0° to 45°, the convective heat exchange rate at the louvers’ shaded side will firstly drop by about 10% because the shaded side will turn from swept to impinged by the surrounding air. However, when θ is then raised to 75°, the spacing between two louver slats will decrease significantly, and therefore after impinging a slat sun side, the approaching flow will directly sweep along the shaded side of another slat (see Figure 13), which will destroy the recirculation around this shaded side. In addition, as seen in Figure 13, the reduced spacing will further give rise to the Venturi effect which leads to an increase in flow velocity around the shaded side. These two effects make the average CHTC of the louvers’ shaded side increase by about 15~40% when θ is raised from 45° to 75°.

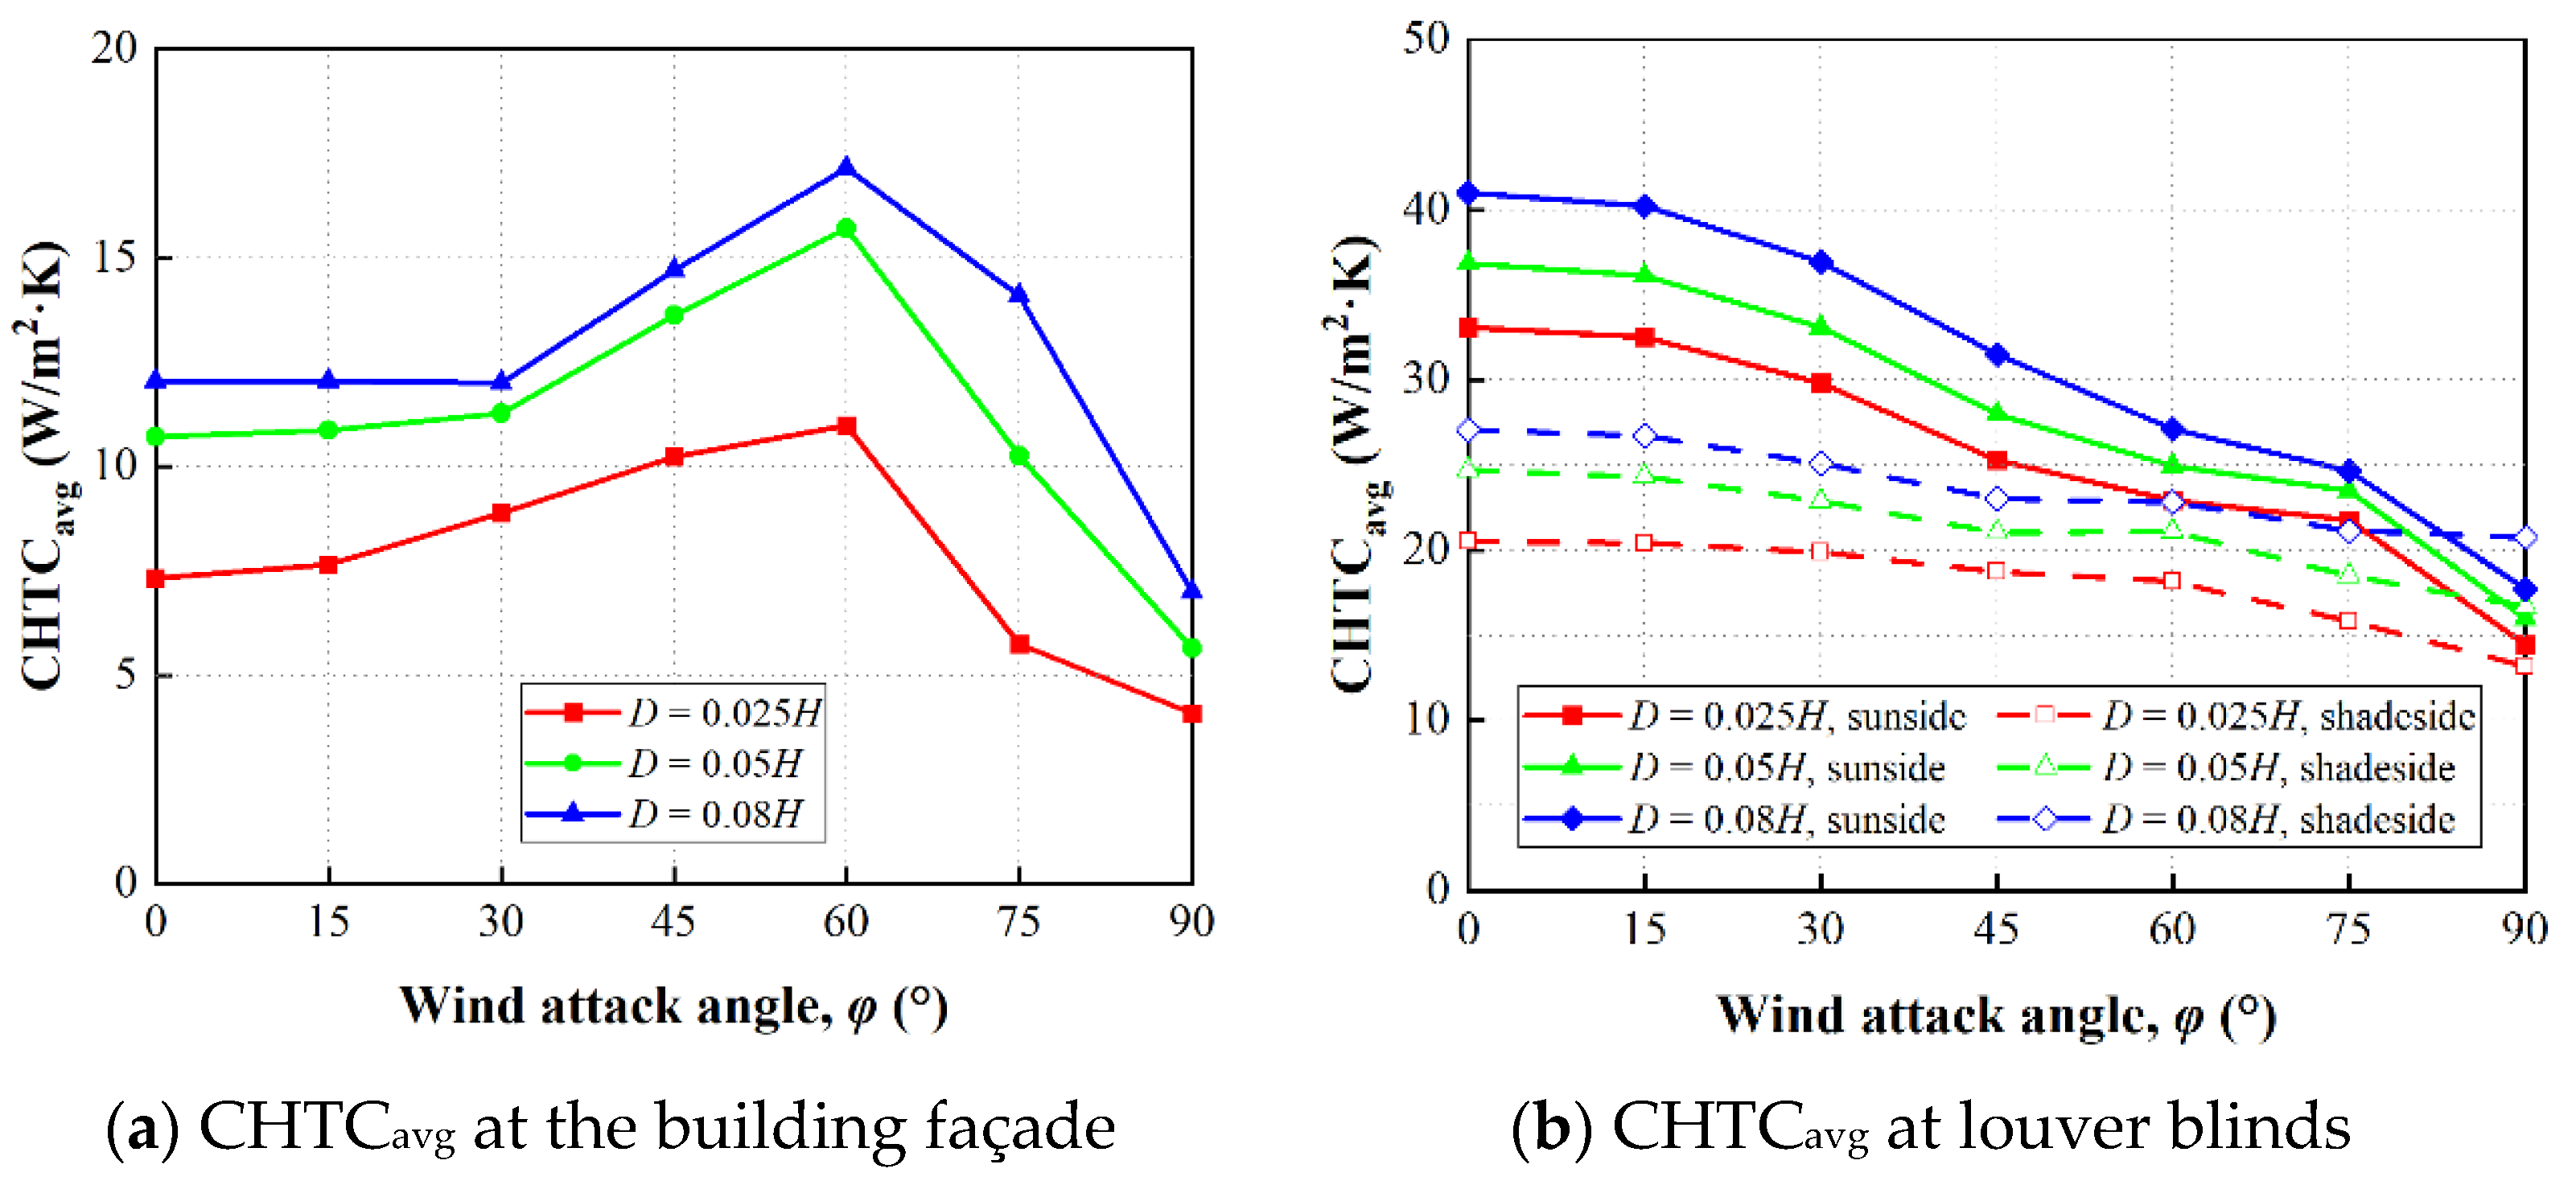
3.4. Influence of Blinds Distance D on CHTC at the Louvered Façade under Different Wind Directions

Figure 14 presents the convective heat exchange rate at the façade with louvers under different blinds distance. It reveals that no matter how the wind direction changes, the average CHTC at the façade and blinds will increase with the growth of D. The main reason is that as D increases, louver slats will be moved far away from the flow recirculation/stagnation region around the building, while barrier effects from blinds to the around-flow of the building will also be weakened. Therefore, the forced CHTCavg at the façade and blinds is positive with the blinds distance D. In addition, the change in D will not significantly affect the variation trend of the CHTC under different wind directions.

4. Correlations to Describe the Influence of Wind Direction on Nu at the Louvered Façade

In order to summarize the effect of wind direction, modifications should be added to correlations to calculate the convective heat transfer rate at the façade and blinds. For dimensionless parameters, the Nusselt number (Nu) and Reynold number (Re) are used to characterize the forced convection around the building, and the modified method is also based on these descriptions. The modified correlations to describe the convective heat transfer at the louvered building façade are presented in Table 3, Table 4, Table 5 and Table 6. Calculations for dimensionless parameters (Nu, Re and Pr) and methods to obtain the convective heat transfer rate can be found in Ref. [20]. These modification methods are suitable for wind attack angle φ = 15°~90°, and other limitations are also the same with correlations in Ref. [20].
Figure 15 shows the comparison between modified correlations and CFD simulations. It can be seen that the modified correlations can precisely describe the variation trend of the convective heat transfer rate at the façade and blinds under different wind directions, the average error of which is no more than 10%, and the maximum deviation is about 18%. These correlations can be used to improve the thermal models to analyze the building envelope heat exchange and building energy consumption.

5. Conclusions

This study focused on the effect of wind direction on the convective heat exchange at the building façade with louver blinds. The investigation was proposed using a realizable k-ε turbulence model with an LRNM near-wall solution and validated in a reduced-scale wind-tunnel experiment. The results can be summarized and concluded as follows:
(1) With the growth of wind attack angle φ, the convective heat exchange rate at the louvered façade will increase first and then decrease. Because of the depression of the louvers’ barrier effect, when the wind attack angle turns from 0° to 60°, the average CHTC at the façade will increase by about 40~50%. While φ further rises to 90°, the flow separation generated by the large wind attack angle will restrict the forced convection around the façade, which will exceed the above effect and make the CHTC at the louvered façade fall back to about 50~60% of that at φ = 0°.
(2) As the louver blinds change from windward to sideward, the convective heat transfer rate on their sun side and shaded side will decrease gradually. When the blinds become leeward completely, the convective heat transfer intensity on the sun side will gradually decrease to about half of that at the windward louvers’ sun side. The CHTCavg on the shaded side will decrease by about 30~40%.
(3) The variation of wind directions will not significantly affect the change trend of the CHTCavg with the louver angle θ and louver distance D at the façade and louver blinds.
In addition, the modification was proposed for correlations in Ref. [20], which can obtain the average Nu at the façade and blinds under different wind attack angles φ. The results and conclusion can be used to optimize the thermal models for the building envelope and accurately analyze the energy consumption of louvered buildings. However, this paper does not discuss the thermal transaction along the building envelope with new correlations, nor does it clarify what changes will be brought to the U-value of the envelope with exterior louver blinds. As the radiative heat exchange (including short-wave and long-wave radiation) will also account for a certain proportion of the heat loss/gain at the building envelope’s surface, the behavior of which is usually nonlinear, further studies should combine the correlations obtained from this study with the radiative transmittance model of louver slats to investigate the influence of louver slats array on the building energy consumption and indoor environmental quality. In addition, as the building geometry has a certain impact on the convective heat exchange at its façade, the applicability of results from this study to other different building forms should be also clarified. Subsequent research should focus on the above problem.

Author Contributions

Conceptualization, R.M., Z.L. and F.J.; methodology, R.M., Y.Y. and F.J.; software, S.T. and F.J.; validation, Z.L. and F.J.; formal analysis, R.M. and F.J.; investigation, Z.L. and F.J.; resources, Y.Y.; data curation, F.J.; writing—original draft preparation, R.M., S.T. and F.J.; writing—review and editing, R.M. and Y.Y.; visualization, S.T.; supervision, Y.Y. and Z.L.; project administration, Y.Y. All authors have read and agreed to the published version of the manuscript.

Funding

This project was supported by the National Natural Science Foundation of China (Grant No. 52008348) and the Scientific Research Foundation of Chengdu Science and Technology Bureau (2019YF0501326SN).

Institutional Review Board Statement

Not applicable.

Informed Consent Statement

Not applicable.

Data Availability Statement

Not applicable.

Conflicts of Interest

The authors declare no conflict of interest. We confirm that there has been no significant financial support for this work that could have influenced its outcome. The manuscript has been read and approved by all named authors, and there are no other persons who satisfied the criteria for authorship but are not listed. We also confirm that we have given due consideration to the protection of intellectual property associated with this work and that there are no impediments to publication, including the timing of publication, with respect to intellectual property. We have followed the regulations of our institutions concerning intellectual property, and we understand that the Corresponding Author is the sole contact for the editorial process (including Editorial Manager and direct communications with the office). He is responsible for communicating with the other authors about progress, submissions of revisions, and final approval of proofs. We have provided a current, correct email address that is accessible by the Corresponding Author and that has been configured to accept email from [email protected].

Nomenclature

BWidth of louver slat, m
DDistance from blinds to the façade, m
FModification coefficient for wind directions
HBuilding height, m
ITurbulent intensity
LThe length of the cavity between the façade and blinds, m
M, NConstant in correlations
NuNusselt number
ReReynolds number
PrPrandtl number
R2Coefficient of determination
TTemperature, °C
UWind velocity, m·s1
X, Y, ZCoordinates, m
a, b, c, d, f, m, nConstant in correlations
hConvective heat transfer coefficient, W·m−2·k−1
kTurbulent kinetic energy, m2·s−2
qHeating intensity, W·m−2
CpHeat capacity of the air, J·kg−1·°C−1
CμConstant for exponential atmospheric boundary layer profiles
Greek symbols
aPower-law exponent for atmosphere boundary layer wind description
ρThe density of the air, kg·m−3
λThermal conductivity, W·m−1·K−1
εTurbulent dissipation rate, m2·s−3
θLouver angle, °
νKinematic viscosity, m2·s−1
φWind attack angle, °
β, γ, δ, ζ, ηConstant in correlations
β′, γ′, δ′, ζ′, η
Subscripts
BAssociated with the louver blinds
HAssociated with the building
cvAssociated with convective heat exchange
aAssociated with air
avAssociated with surface-averaged
suAssociated with sun side of the louver blinds
shAssociated with shaded side of the louver blinds
eAssociated with the envelope
wAssociated with the wall surface
inAssociated with the air flowing into the cavity between the façade and blinds
φAssociated with wind directions

References

  1. Tan, Y.; Peng, J.; Curcija, C.; Yin, R.; Deng, L.; Chen, Y. Study on the impact of window shades’ physical characteristics and opening modes on air conditioning energy consumption in China. Energy Built Environ. 2020, 1, 254–261. [Google Scholar] [CrossRef]
  2. Cho, J.; Yoo, C.; Kim, Y. Viability of exterior shading devices for high-rise residential buildings: Case study for cooling energy saving and economic feasibility analysis. Energy Build. 2014, 82, 771–785. [Google Scholar] [CrossRef]
  3. Kim, G.; Lim, H.S.; Lim, T.S.; Schaefer, L.; Kim, J.T. Comparative advantage of an exterior shading device in thermal performance for residential buildings. Energy Build. 2012, 46, 105–111. [Google Scholar] [CrossRef]
  4. Jiang, F.; Li, Z.; Zhao, Q.; Tao, Q.; Yuan, Y.; Lu, S. Flow field around a surface-mounted cubic building with louver blinds. Build. Simul. 2019, 12, 141–151. [Google Scholar] [CrossRef]
  5. Lee, D.-S.; Kim, S.-J.; Cho, Y.-H.; Jo, J.-H. Experimental study for wind pressure loss rate through exterior venetian blind in cross ventilation. Energy Build. 2015, 107, 123–130. [Google Scholar] [CrossRef]
  6. Phillips, J.; Naylor, D. Numerical study of convective and radiative heat transfer from a window glazing with a venetian blind. HVAC&R Res. 2001, 7, 383–402. [Google Scholar]
  7. Collins, M. Convective heat transfer coefficients from an internal window surface and adjacent sunlit Venetian blind. Energy Build. 2004, 36, 309–318. [Google Scholar] [CrossRef]
  8. Dalal, R.; Naylor, D. A CFD study of convection in a double-glazed window with an enclosed pleated blind. Energy Build. 2009, 41, 1256–1262. [Google Scholar] [CrossRef]
  9. Sun, Y.Y.; Wu, Y.P. Experimental measurement and numerical simulation of the thermal performance of a double glazing system with an interstitial Venetian blind. Build. Environ. 2016, 103, 111–122. [Google Scholar] [CrossRef]
  10. Mirsadeghi, M.; Cóstola, D.; Blocken, B.; Hensen, J.L.M. Review of external convective heat transfer coefficient models in building energy simulation programs: Implementation and uncertainty. Appl. Therm. Eng. 2013, 56, 134–151. [Google Scholar] [CrossRef]
  11. Incropera, F.P.; DeWitt, D.P. Fundamentals of Heat and Mass Transfer, 5th ed.; Wiley: Chichester, UK, 2001; pp. 285–333. [Google Scholar]
  12. Palyvos, J.A. A survey of wind convection coefficient correlations for building envelope energy systems’ modeling. Appl. Therm. Eng. 2008, 28, 801–808. [Google Scholar] [CrossRef]
  13. Meinders, E.R.; Hanjalic, K.; Martinuzzi, R.J. Experimental Study of the Local Convection Heat Transfer from a Wall-Mounted Cube in Turbulent Channel Flow. Solid State Ion. 1999, 121, 1534–1538. [Google Scholar] [CrossRef]
  14. Nakamura, H.; Igarashi, T. Local heat transfer around a wall-mounted cube in the turbulent boundary layer. Intern. J. Heat Mass Transf. 2001, 44, 3385–3395. [Google Scholar] [CrossRef]
  15. Emmel, M.G.; Abadie, M.O. New external convective heat transfer coefficient correlations for isolated low-rise buildings. Energy Build. 2007, 39, 335–342. [Google Scholar] [CrossRef]
  16. Montazeri, H.; Blocken, B.; Derome, D.; Carmeliet, J.; Hensen, J. CFD analysis of forced convective heat transfer coefficients at windward building facades: Influence of building geometry. J. Wind Eng. Ind. Aerodyn. 2015, 146, 102–116. [Google Scholar] [CrossRef] [Green Version]
  17. Montazeri, H.; Blocken, B. New generalized expressions for forced convective heat transfer coefficients at building facades and roofs. Build. Environ. 2017, 119, 153–168. [Google Scholar] [CrossRef] [Green Version]
  18. Babakhani, J.; Veysi, F. Experimental study of geometric cuboid effect on convective heat transfer. Eur. Phys. J. Plus 2022, 137, 215. [Google Scholar] [CrossRef]
  19. Yang, H.; Chen, G.; Wang, D.; Hang, J.; Li, Q.; Wang, Q. Influences of street aspect ratios and realistic solar heating on convective heat transfer and ventilation in full-scale 2D street canyons. Build. Environ. 2021, 204, 108125. [Google Scholar] [CrossRef]
  20. Jiang, F.; Yuan, Y.; Li, Z.; Zhao, Q.; Zhao, K. Correlations for the forced convective heat transfer at a windward building façade with exterior louver blinds. Sol. Energy 2020, 209, 709–723. [Google Scholar] [CrossRef]
  21. Jiang, F.; Li, Z.; Zhao, Q.; Tao, Q.; Lu, S.; Zhao, K. The influence of exterior louver blinds’ geometric and thermal attributes on the convective heat transfer at building facades. Sol. Energy 2019, 193, 654–665. [Google Scholar] [CrossRef]
  22. Karava, P.; Jubayer, C.M.; Savory, E.; Li, S. Effect of incident flow conditions on convective heat transfer from the inclined windward roof of a low-rise building with application to photovoltaic-thermal systems. J. Wind Eng. Ind. Aerodyn. 2012, 104–106, 428–438. [Google Scholar] [CrossRef]
  23. Hagishima, A.; Tanimoto, J. Field measurements for estimating the convective heat transfer coefficient at building surfaces. Build. Environ. 2003, 38, 873–881. [Google Scholar] [CrossRef]
  24. Liu, Y.; Harris, D.J. Full-scale measurements of convective coefficient on external surface of a low-rise building in sheltered conditions. Build. Environ. 2007, 42, 2718–2736. [Google Scholar] [CrossRef]
  25. Clear, R.D.; Gartland, L.; Winkelmann, F.C. An empirical correlation for the outside convective air-film coefficient for horizontal roofs. Energy Build. 2003, 35, 797–811. [Google Scholar] [CrossRef] [Green Version]
  26. Wang, K.C.; Chiou, R.T. Local mass/heat transfer from a wall-mounted block in rectangular channel flow. Heat Mass Transf. 2006, 42, 660–670. [Google Scholar] [CrossRef]
  27. Defraeye, T.; Blocken, B.; Carmeliet, J. Convective heat transfer coefficients for exterior building surfaces: Existing correlations and CFD modelling. Energy Conserv. Manag. 2011, 52, 512–522. [Google Scholar] [CrossRef] [Green Version]
  28. Allegrini, J.; Dorer, V.; Carmeliet, J. Analysis of convective heat transfer at building facades in street canyons and its influence on the predictions of space cooling demand in buildings. J. Wind. Eng. Ind. Aerodyn. 2012, 104–106, 464–473. [Google Scholar] [CrossRef]
  29. Tominaga, Y.; Mochida, A.; Yoshie, R.; Kataoka, H.; Nozu, T.; Yoshikawa, M.; Shirasawa, T. AIJ guidelines for practical applications of CFD to pedestrian wind environment around buildings. J. Wind Eng. Ind. Aerodyn. 2008, 96, 1749–1761. [Google Scholar] [CrossRef]
  30. Franke, J.; Hellsten, A.; Schlunzen, K.H.; Carissimo, B. The COST 732 Best Practice Guideline for CFD simulation of flows in the urban environment: A summary. Int. J. Environ. Pollut. 2011, 44, 419. [Google Scholar] [CrossRef]
  31. Jiang, F.; Tao, S.; Tao, Q.; Li, Z.; Yuan, Y.; Zheng, J. The effect of louver blinds on the wind-driven cross ventilation of multi-storey buildings. J. Build. Eng. 2022, 54, 104614. [Google Scholar] [CrossRef]
  32. Sparrow, E.M.; Ramsey, J.W.; Mass, E.A. Effect of Finite Width on Heat Transfer and Fluid Flow about an Inclined Rectangular Plate. J. Heat Transf. 1979, 101, 199–204. [Google Scholar] [CrossRef]
Figure 1. Set-up of the wind-tunnel experiments [21].
Buildings 12 01096 g001
Figure 2. The profiles of normalized wind velocity U/UH and turbulence intensity I for the approaching flow of the experiment [20].
Buildings 12 01096 g002
Figure 3. Computational domain and boundary conditions for validations.
Buildings 12 01096 g003
Figure 4. Grids for the simulation.
Buildings 12 01096 g004
Figure 5. Mesh generation for grid independence analysis.
Buildings 12 01096 g005
Figure 6. Comparison of wind velocity profile between experiments and simulations (B = 0.035 H, W = 0.05 H, θ = 45°, φ = 0°, UH = 3.4 m/s).
Buildings 12 01096 g006
Figure 7. Comparison of surface-averaged CHTC at the façade and blinds between experiments and simulations (B = 0.035 H, W = 0.05 H, θ = 45°, φ = 0°, THTa = 10 °C, TBTa = 20 °C).
Buildings 12 01096 g007
Figure 8. The change in CHTCavg of the façade and louvers with different wind directions (D = 0.05 H, B/H = 0.35, THTa = 10 °C, TBTa = 20 °C, θ = 45°).
Buildings 12 01096 g008
Figure 9. The change in CHTCavg of the louvered façade with different wind directions (Uref = 3.41 m/s, D = 0.05 H, B/H = 0.035, THTa = 10 °C, TBTa = 20 °C, θ = 45°).
Buildings 12 01096 g009
Figure 10. The change in CHTCavg of the louvers’ sun side with different wind directions (Uref = 3.41 m/s, D = 0.05 H, B/H = 0.035, THTa = 10 °C, TBTa = 20 °C, θ = 45°).
Buildings 12 01096 g010
Figure 11. The change in CHTCavg of the louvers’ shaded side with different wind directions (Uref = 3.41 m/s, D = 0.05 H, B/H = 0.035, THTa = 10 °C, TBTa = 20 °C, θ = 45°).
Buildings 12 01096 g011
Figure 12. The comparison of CHTCavg at the façade and louvers among different louver angles θ (Uref = 3.41 m/s, D = 0.05 H, B/H = 0.035, THTa = 10 °C, TBTa = 20 °C).
Buildings 12 01096 g012
Figure 13. The flow patterns around the building façade with different louver angles θ (Uref = 3.41 m/s, D = 0.05 H, B/H = 0.035, THTa = 10 °C, TBTa = 20 °C, φ = 0°).
Buildings 12 01096 g013
Figure 14. The flow patterns around the building façade with different louver distance D (Uref = 3.41 m/s, B/H = 0.035, THTa = 10 °C, TBTa = 20 °C, θ = 45°).
Buildings 12 01096 g014
Figure 15. Comparison of qcv at the façade and blinds between simulations and correlations (ReB = 9.5 × 10⁴, ReH = 10.9 × 10⁴, B/H = 0.035, THTa = 10 °C, TBTa = 20 °C).
Buildings 12 01096 g015aBuildings 12 01096 g015b
Table 1. Predictions for CHTCavg by three different grid sizes (B = 0.035 H, W = 0.05 H, θ = 45°, φ = 0°, UH = 3.4 m/s, THTa = 10 °C, TBTa = 20 °C).
CoarseBasicFine
Surface-averaged CHTC of the windward façade ( W / m 2 · K )10.7110.7710.8
Surface-averaged CHTC of louver blinds ( W / m 2 · K )32.1432.0532.05
Total grids3.96 million9.21 million14.43 million
Table 2. The louver blinds geometry for the CFD investigation.
Casesφ, °D/Hθ, °
The building with louver blinds0
15
30
45
60
75
90
0.025
0.05
0.08
0
45
75
The building without louver blinds0
15
30
45
60
75
90
\\
Table 3. Correlations to calculate surface-averaged Nu for louver blinds with different louver angles φ.
CorrelationsConstant ParametersR2
abcd
Surface-averaged N u = F φ , B · e a ( θ 90 ° ) · ( D H ) b · ( B H ) c · R e B d · P r 1 3 0.2510.236−0.2920.5340.841
Sun side0.5010.253−0.3290.5370.893
Shaded side−0.1510.210−0.2360.5330.912
Table 4. Calculation for Fφ,B to describe the wind direction effect on Nu at the louver blinds.
CorrelationsConstant Parameters
βγδζη
Surface-averaged F φ , B = e β ( θ 90 ° ) · ( D H ) γ · R e B δ ζ s i n η φ 0.052−0.014−0.0120.3882.971
Sun side−0.016−0.053−0.0260.4212.872
Shaded side0.2690.0420.0050.3353.037
Table 5. Correlations to calculate surface-averaged Nu for the louvered façade with different louver angles φ.
CorrelationsConstant ParametersR2
abcd
Surface-averaged Nusselt number N u H , a d = F φ , H · e a ( θ 90 ° ) · ( D H ) b · ( B H ) c · R e H d · P r 1 3 −0.1160.0940.1250.5730.927
Effective cavity air temperature Ta,c T a , c = M + N H ( M T a ) ( e H N 1 ) M = h B T B + h H , a c T H + ρ C p U i n T a h B + h H , a c + ρ C p U i n \
N = ρ C p U i n H 2 ( h B + h H , a c + ρ C p U i n ) \
Effective velocity of airflow into cavity Uin U i n = [ ( D H ) m U H ] n m = 1.117n = 1.135\
Table 6. Calculation for Fφ,H to describe the wind direction effect on Nu at the louvered façade.
CorrelationsConstant Parameters
βγδζη
Surface-averaged F φ , H = e β ( θ 90 ° ) · ( W H ) γ · R e B δ ζ f φ η 0.119−0.1220.0371.015−0.573
Note:   f φ = 0.9863 + 1.8543 cos ( φ 60 ° ) 0.5411 sin ( φ 60 ° ) .
Publisher’s Note: MDPI stays neutral with regard to jurisdictional claims in published maps and institutional affiliations.

