Article

Model of Demand of Human Settlement Environment for Rural Houses in North China: A Structural Equation Modeling Approach

1
School of Civil Engineering, Dalian University of Technology, Dalian 116024, China
2
School of Civil Engineering, Zhengzhou University, Zhengzhou 450001, China
3
Institute of Engineering & Architecture of Dalian University of Technology Co., Ltd., Dalian 116024, China
*
Author to whom correspondence should be addressed.
Buildings 2022, 12(7), 926; https://doi.org/10.3390/buildings12070926
Submission received: 1 June 2022 / Revised: 26 June 2022 / Accepted: 27 June 2022 / Published: 30 June 2022
(This article belongs to the Section Building Energy, Physics, Environment, and Systems)

Abstract

:
Numerous studies have shown that the technology used to improve the living environment in rural areas often loses its effect in a few years, and farmers return to their familiar and habitual way of life. The failure to consider the basic needs of farmers is an important reason for these problems. Therefore, this study conducted qualitative and quantitative analyses on the factors that influence the demand on the human settlement environment through visits, field measurements, a questionnaire survey (which involved more than 20 households in 14 villages in seven provinces and cities in northern China), and the construction of a structural equation model based on demand. The survey included (amongst other factors) personal attributes, daily living, diet and environmental preferences, living customs and energy consumption, housing construction methods, and the surrounding environment. The results showed that, compared with mental happiness (0.084) and physical health (0.119), socioeconomic status (0.260) had a greater influence on the weight of the overall demand satisfaction among the various demand indicators. Farmers prioritized yard planning (0.135), toilets (0.126), and living rooms (0.095). They also gave importance to the indoor thermal environment (0.088), air quality (0.088), and food problems (0.087). The findings of this study provide a theoretical reference for the inception of technical approaches to improve human settlement environment centered on rural houses in North China, and the realization of sustainable development in the future.

1. Introduction

Winter in northern China is cold and long. In light of the actual conditions in rural areas, the Chinese government issued an implementation plan in January 2022 for rural revitalization and development based on bottom-up principles, villagers’ autonomy, farmers’ participation, and local conditions. Clean heating, improvement of housing conditions and village appearances, and improvement of the human settlement environment in the northern rural areas were important issues of concern. The thinking involved in finding ways to solve the problems focuses on the advantages and disadvantages associated with the following: (1) blindly using urban heating technology to replace the heating methods adapted to rural life style; (2) sacrificing characteristic rural culture and simply pursuing urban lifestyle thinking; (3) rural houses being built to conform to the way energy is used; (4) Learning from and inheriting the simplicity-based approach obtained by accumulated wisdom from life experiences. Research shows that lack of regional features, imperfect functional spaces, and poor indoor thermal comfort are urgent problems that need to be solved in the rural housing construction field in North China [1,2]. Building rural houses without destroying the scenic countryside is faced with many limitations, such as wastage of land resources, unreasonable overall housing layout, risks to safe house construction, and poor living environments that need to be improved [3]. Poor thermal performance of building envelopes in northern rural areas is a common problem, and the most important constraint of improving this performance is the high-thermal insulation cost. Shan et al. proposed an economical, technical, thermal insulation scheme for the residential envelope in northern rural areas, based on the proposition of thermal insulation methods for the wall, roof, window, and door. Subject to the condition that the investment required from each farmhouse is not more than 600 dollars, the efficiency improvement rate can be more than 30% [4]. The regional characteristics of rural northeast China are very unique. Almost all heating methods use biomass fuel as the main source, whereas the neighboring Hebei Province hardly uses biomass fuel for heating. To improve the environmental quality, the energy consumption mode of “coal to gas” has been fully realized. The large number of young and middle-aged workers who have left rural areas to work in cities has caused considerable changes in the structures of rural families. Most of the members left behind are elderly, women, and children. Accordingly, the indoor air quality has a great impact on these vulnerable groups. Studies have shown that biomass burning resulting in indoor air pollution in farmhouses is an important health risk factor. Even in the low-latitude Yunnan Province, the exposure time of adult women to PM2.5 (fine particulate matter) in winter is twice that in the summer. Ventilation during cooking, stove maintenance, and kitchen structure are important predictors of PM2.5 personal exposure among rural women who mainly used biomass for cooking [5]. Daily emissions from space heating were significantly higher than those from cooking, and the use of honeycomb briquette for cooking and raw coal chunk for space heating reduces 28%, 24% and 25% for CO, PM10 (inhalable particles) and PM2.5, compared to wood for cooking and peat for space heating [6]. According to data released by China’s National Development and Reform Commission, the 2021 statistical report shows that the urbanization rate of China’s permanent population has reached 64.72%, but 400 million people still live in rural areas. Most of the people in rural areas rely on solid fuels for cooking and heating; hence, rural areas are more polluted than urban areas, even though the outdoor air is much cleaner in rural areas than in urban areas [7,8]. Following the “change from coal to gas” policy and acceleration of urbanization, the lifestyle in rural areas has changed considerably. The gap between the living needs and habits of people of different ages has been expanding, and an increasing number of daily necessities are acquired through purchases. Considerable research has been conducted on the construction of a living environment tailored to local conditions in the rural areas of northern China, such as on suitable clean heating technology [9,10,11], ventilation problems associated with self-built farm houses [12], poor indoor air quality in old people’s farm houses in North China [13], rural households’ well-being, and ecosystem dependence [14], insufficient rural resident participation, and a homogeneous design in the unified construction mode of rural housing in the North China Plain [15]. In addition, studies have shown that the human factor is the main aspect affecting the environmental quality of the rural human settlement [16].
Thus, the improvement of human settlement environment in the rural areas of northern China is affected by many factors, such as local climate conditions, economic development level, cultural customs, housing construction and heating methods, cost, and even family structure, etc. At present, energy-saving and human settlement environment improvement technology strategies rarely take into account the needs of farmers themselves. Based on farmers’ demands, literature searches since 2010 identified a few publications related to the improvement of living environment. From one viewpoint, farmers’ demands involve a wide range of areas, which makes it difficult to conduct comprehensive research. Conversely, it is difficult to construct a complex demand impact relationship model. In recent years, the structural equation model is increasingly used to represent multifactorial complex relationships. It has become an important research method in terms of the indoor environment. Studies have been carried out on the relationship between multidimensional sound environmental settings and the degree of pleasure [17,18], the representation model of the indoor environment and associated health effects in residential buildings [19], the causality between perception of health and the indoor environment [20], and the relationship between environmental perception and residents’ behavior and satisfaction [21,22,23], etc.
This study focuses on the construction of the demand model of human settlement environment with farmers as the core. Based on some typical rural areas in northeast China and North China, the structural equation model was used to depict rural residential environment needs (such as a concise demand-oriented environment) in the form of a quantitative relation representation model in North China through field visits, questionnaires, field testing, and theoretical research methods. The model was used to improve the key influencing factors. This model provides a theoretical reference for the future formation of adaptive technical approaches to improve the human settlement environment of farmhouses in North China.

2. Methods

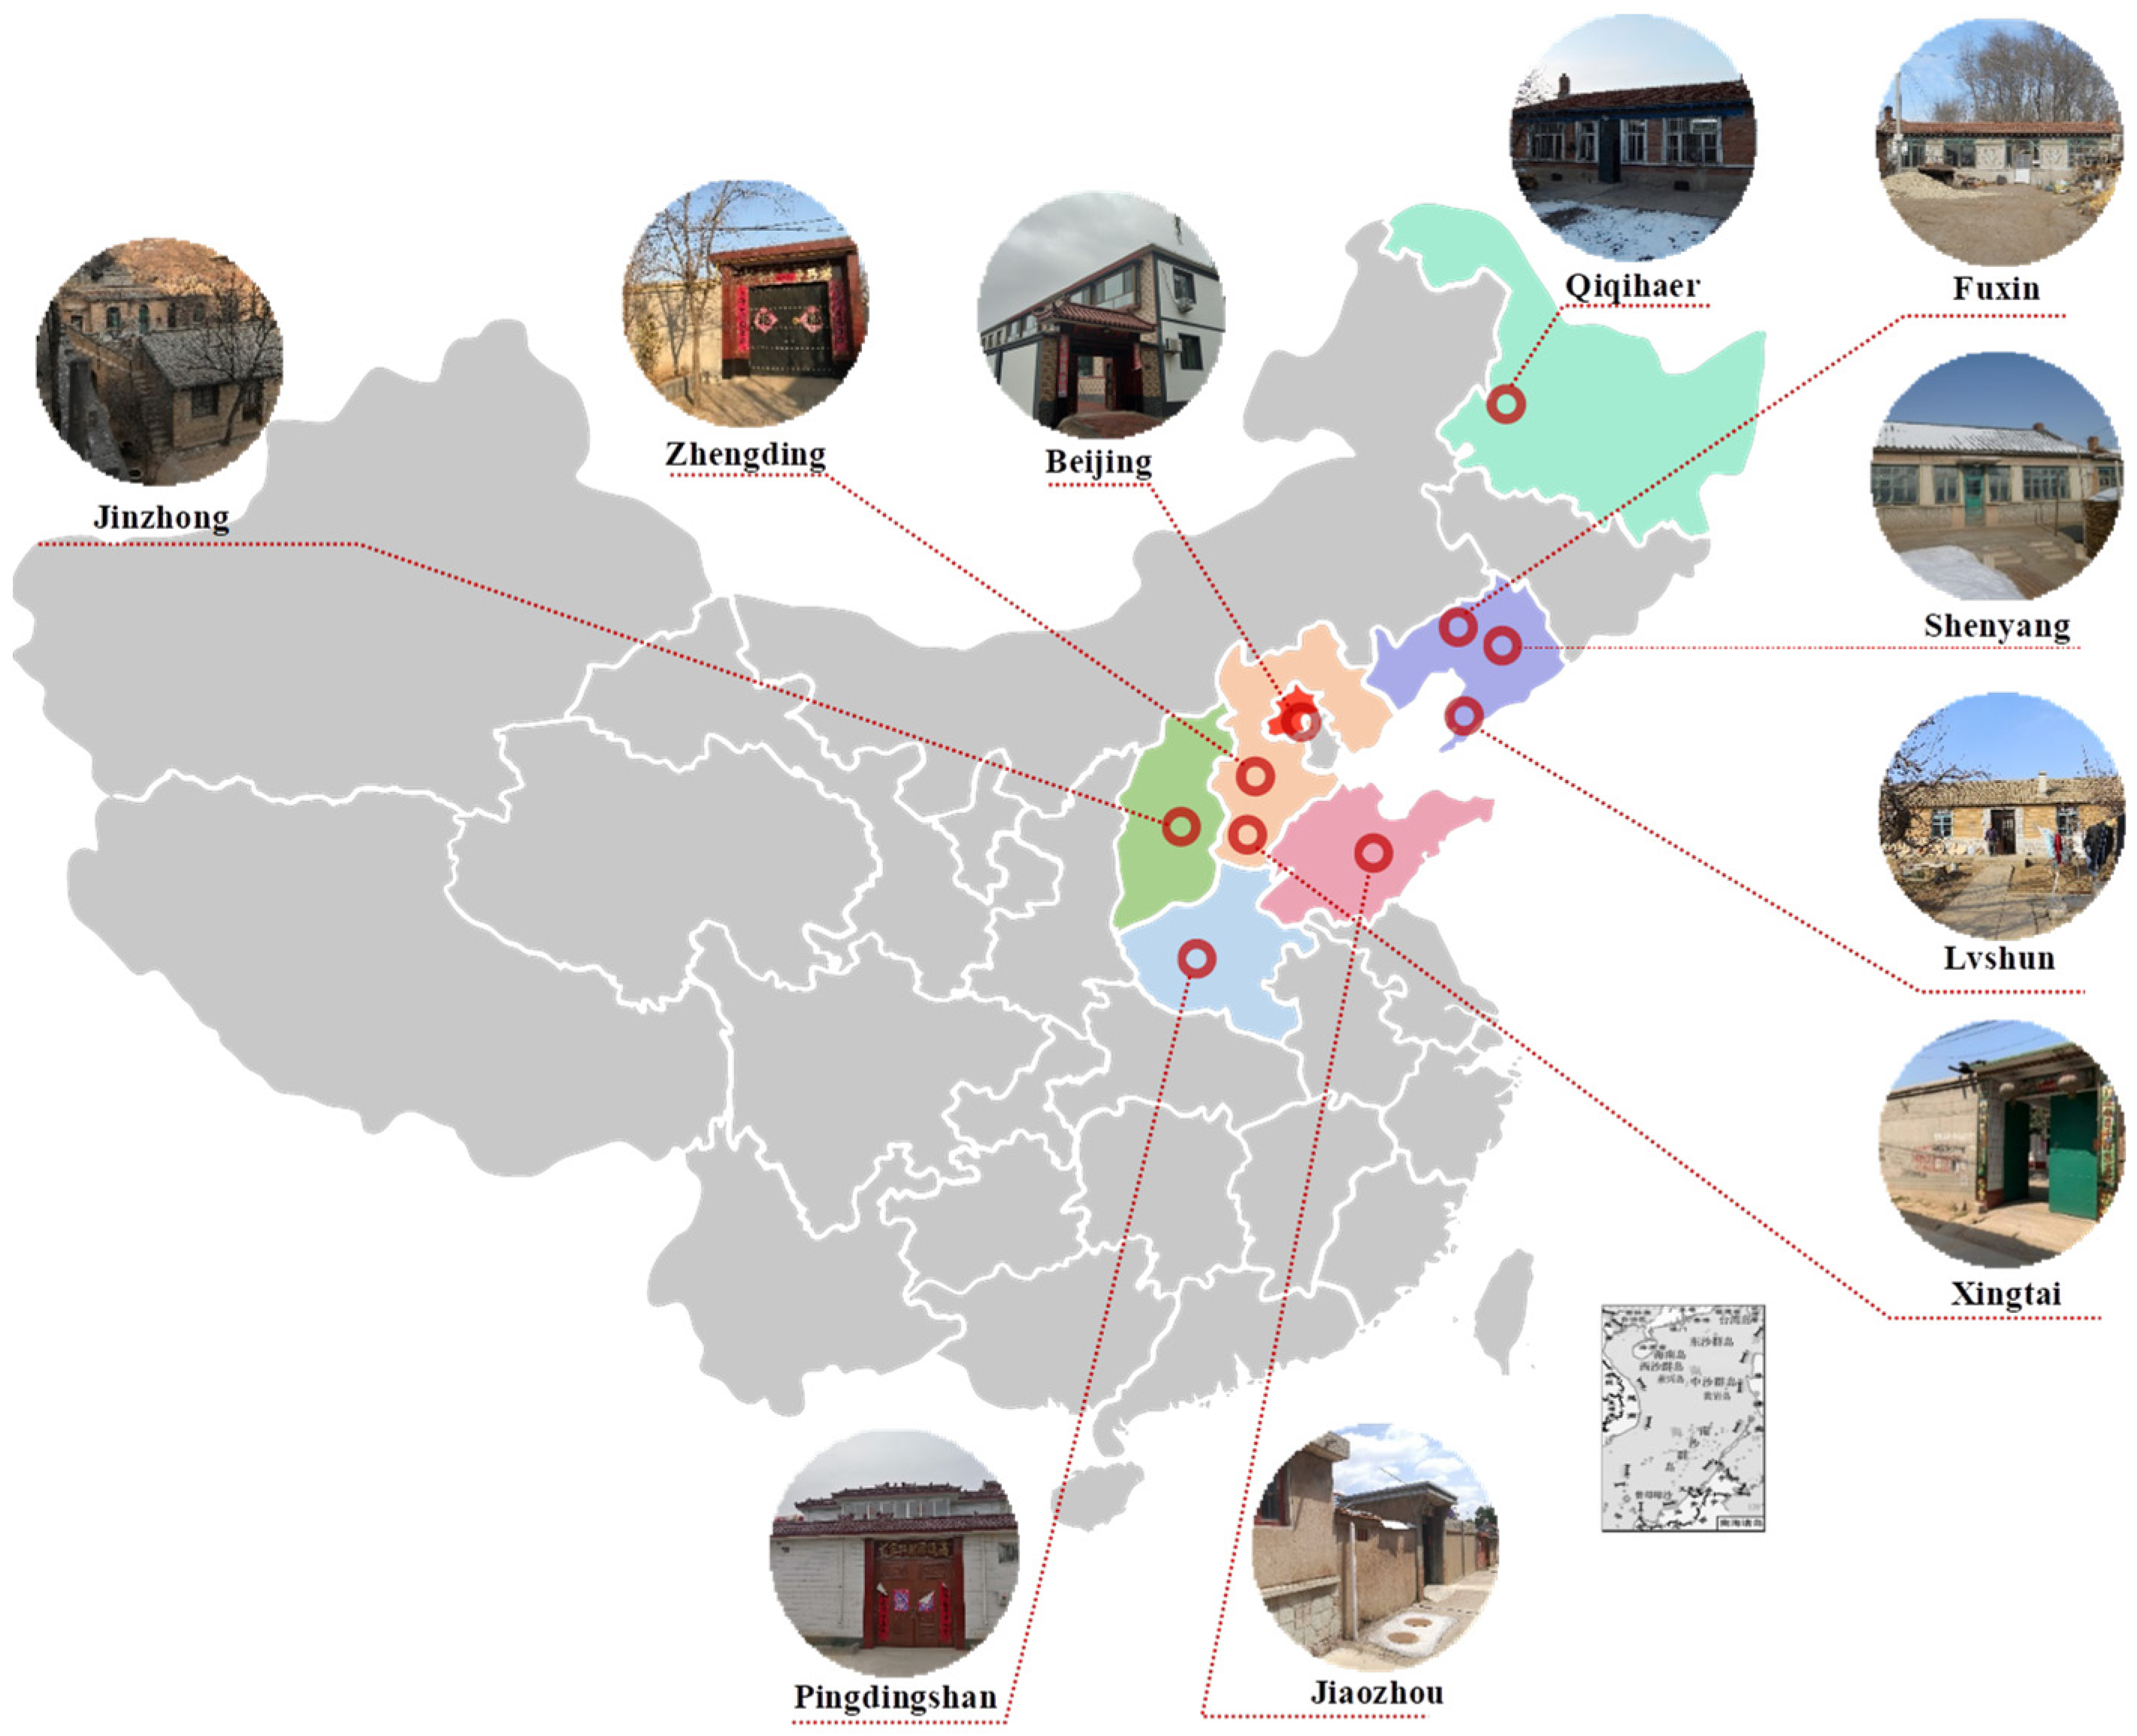
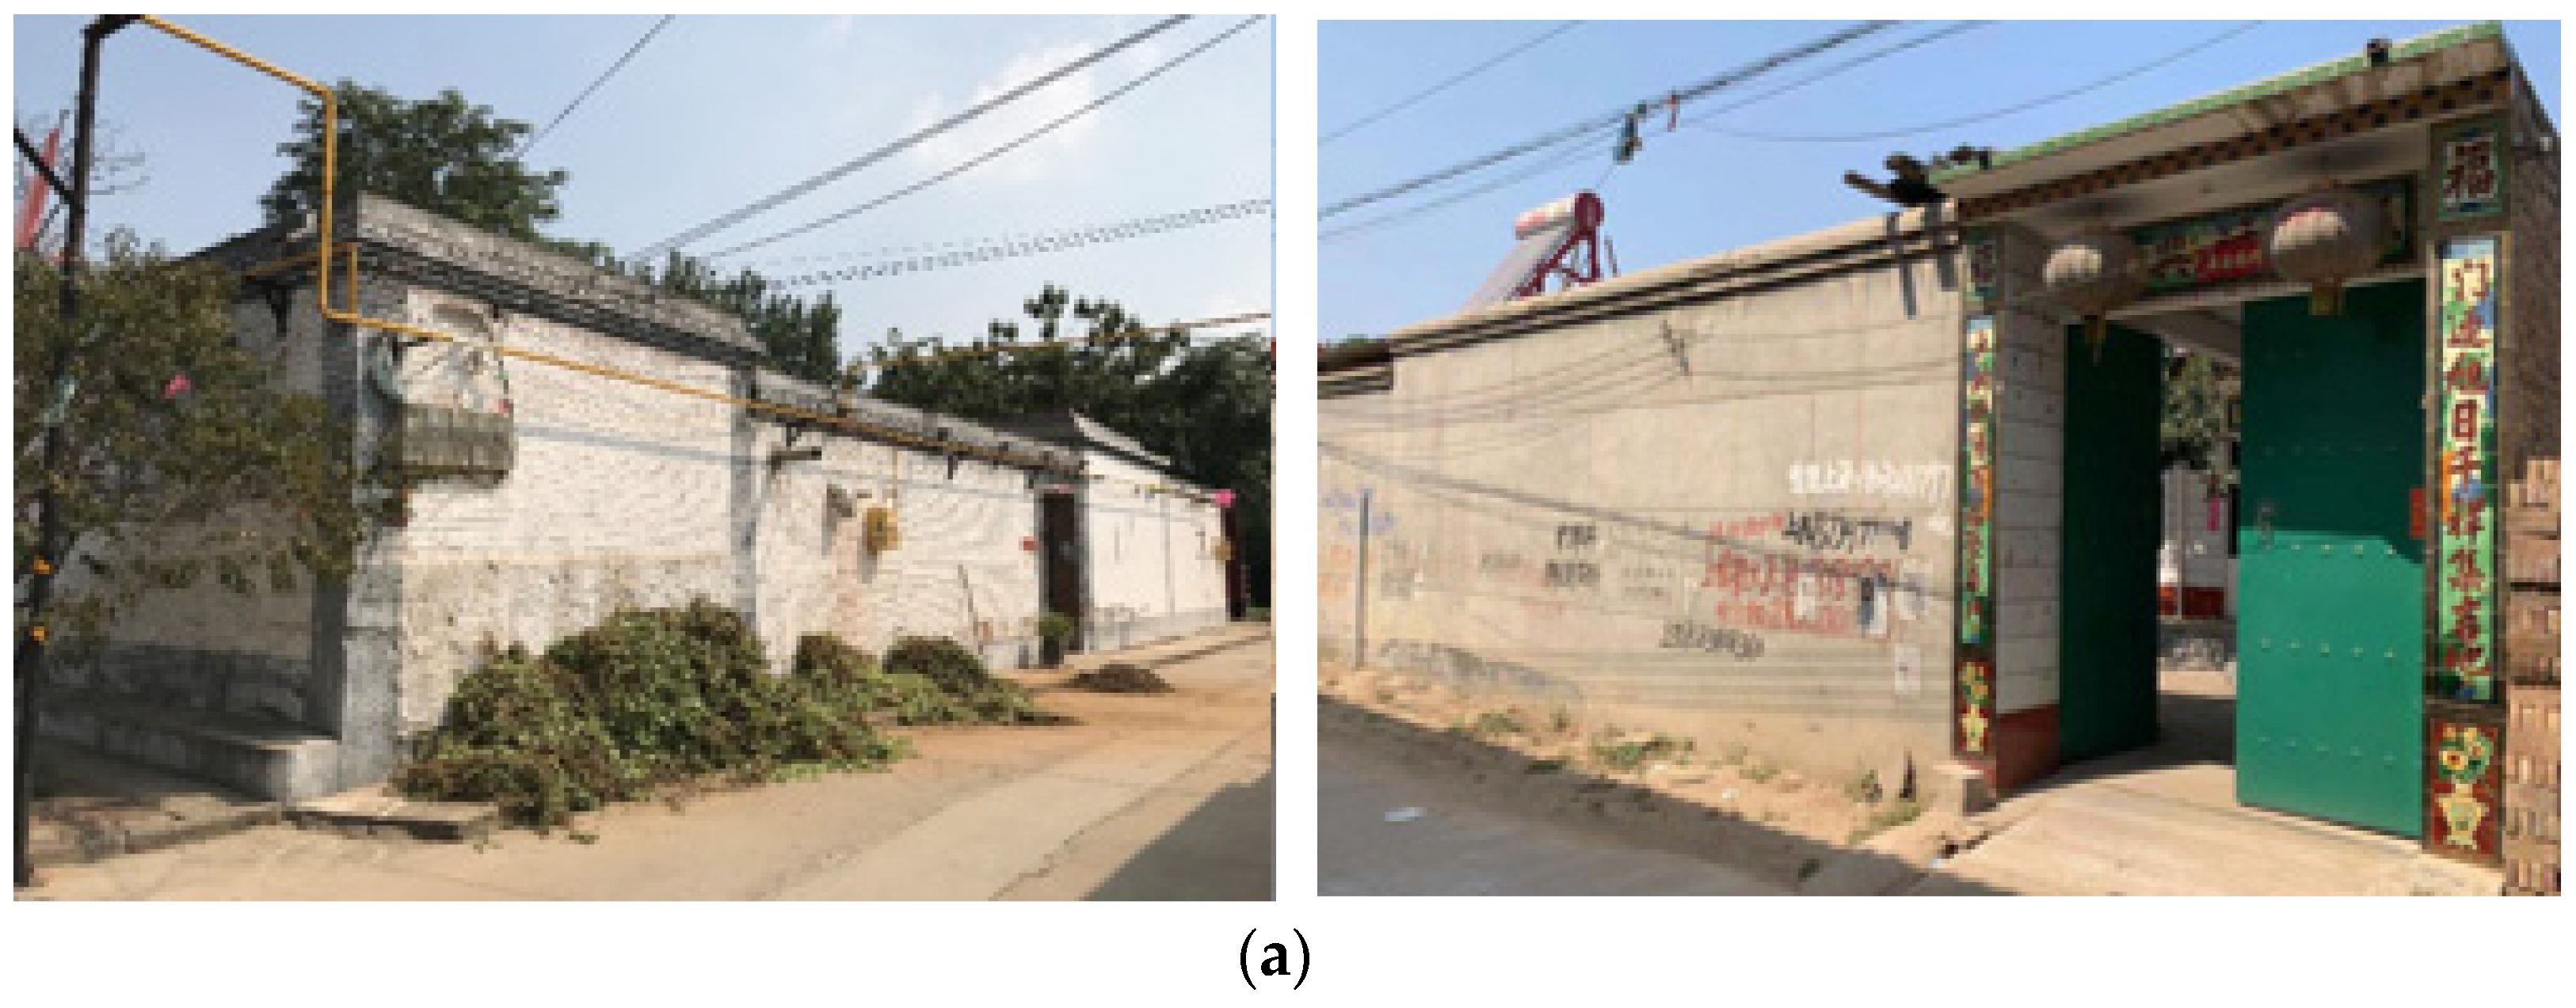
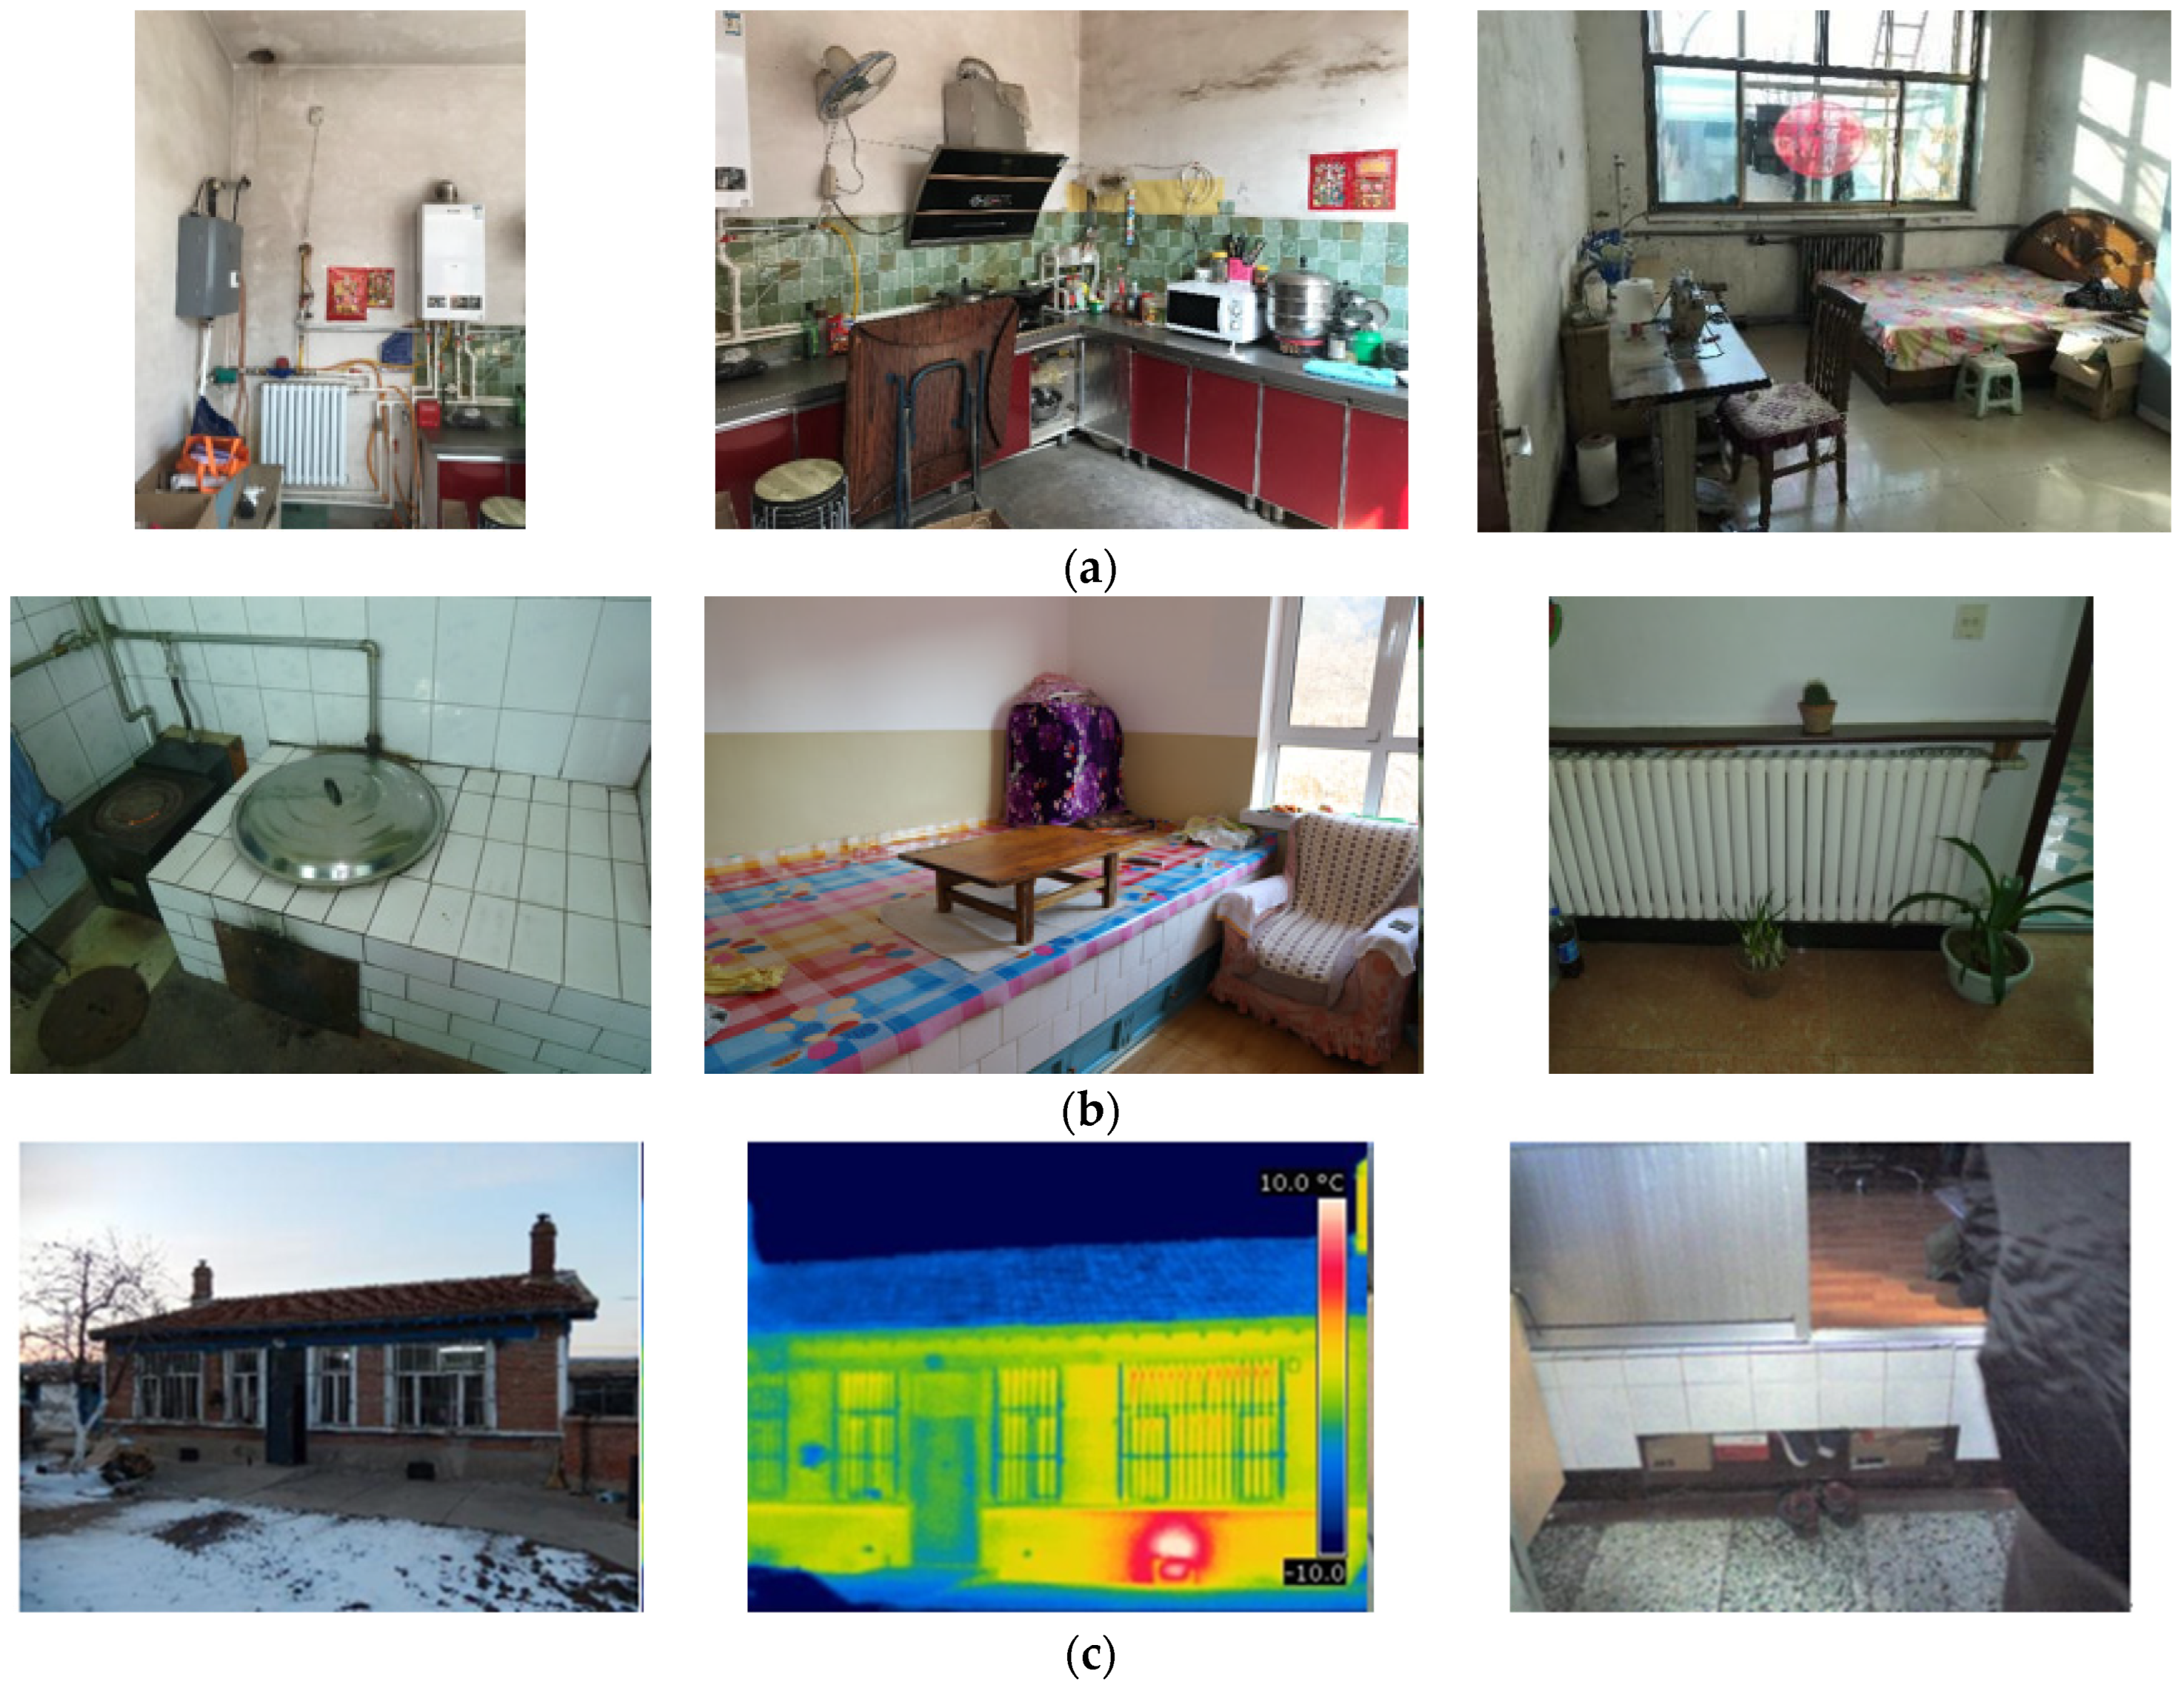
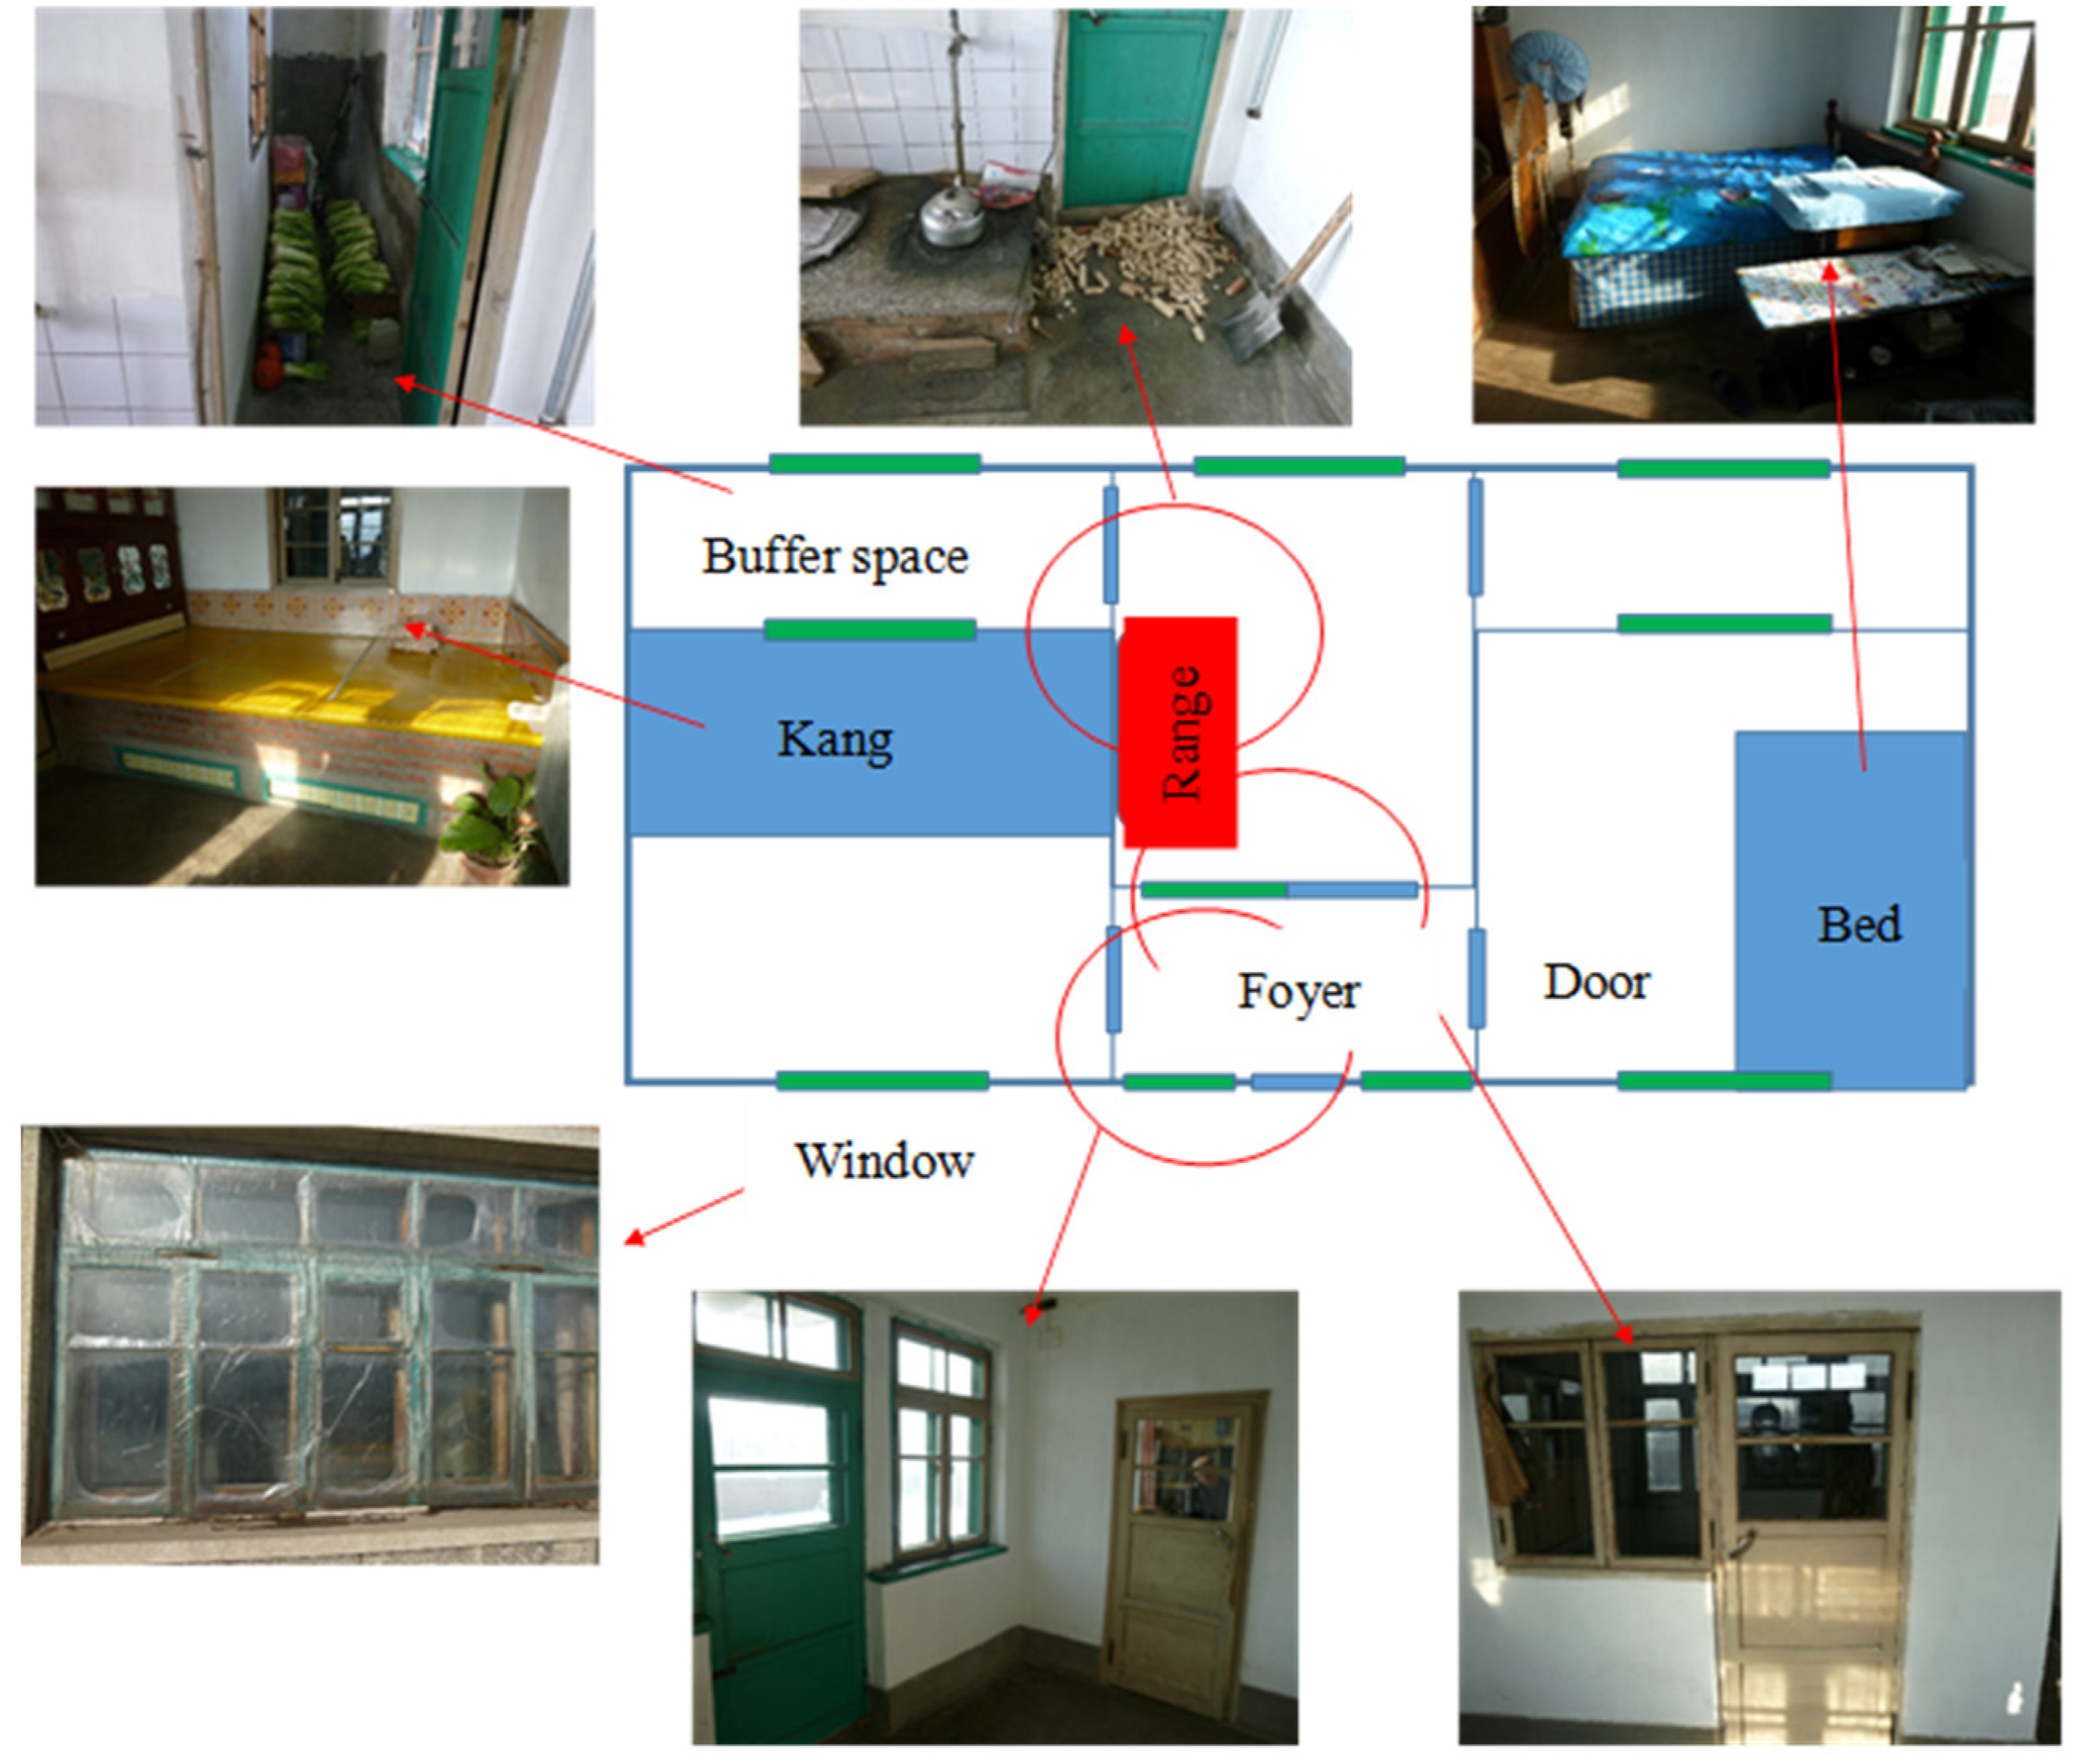
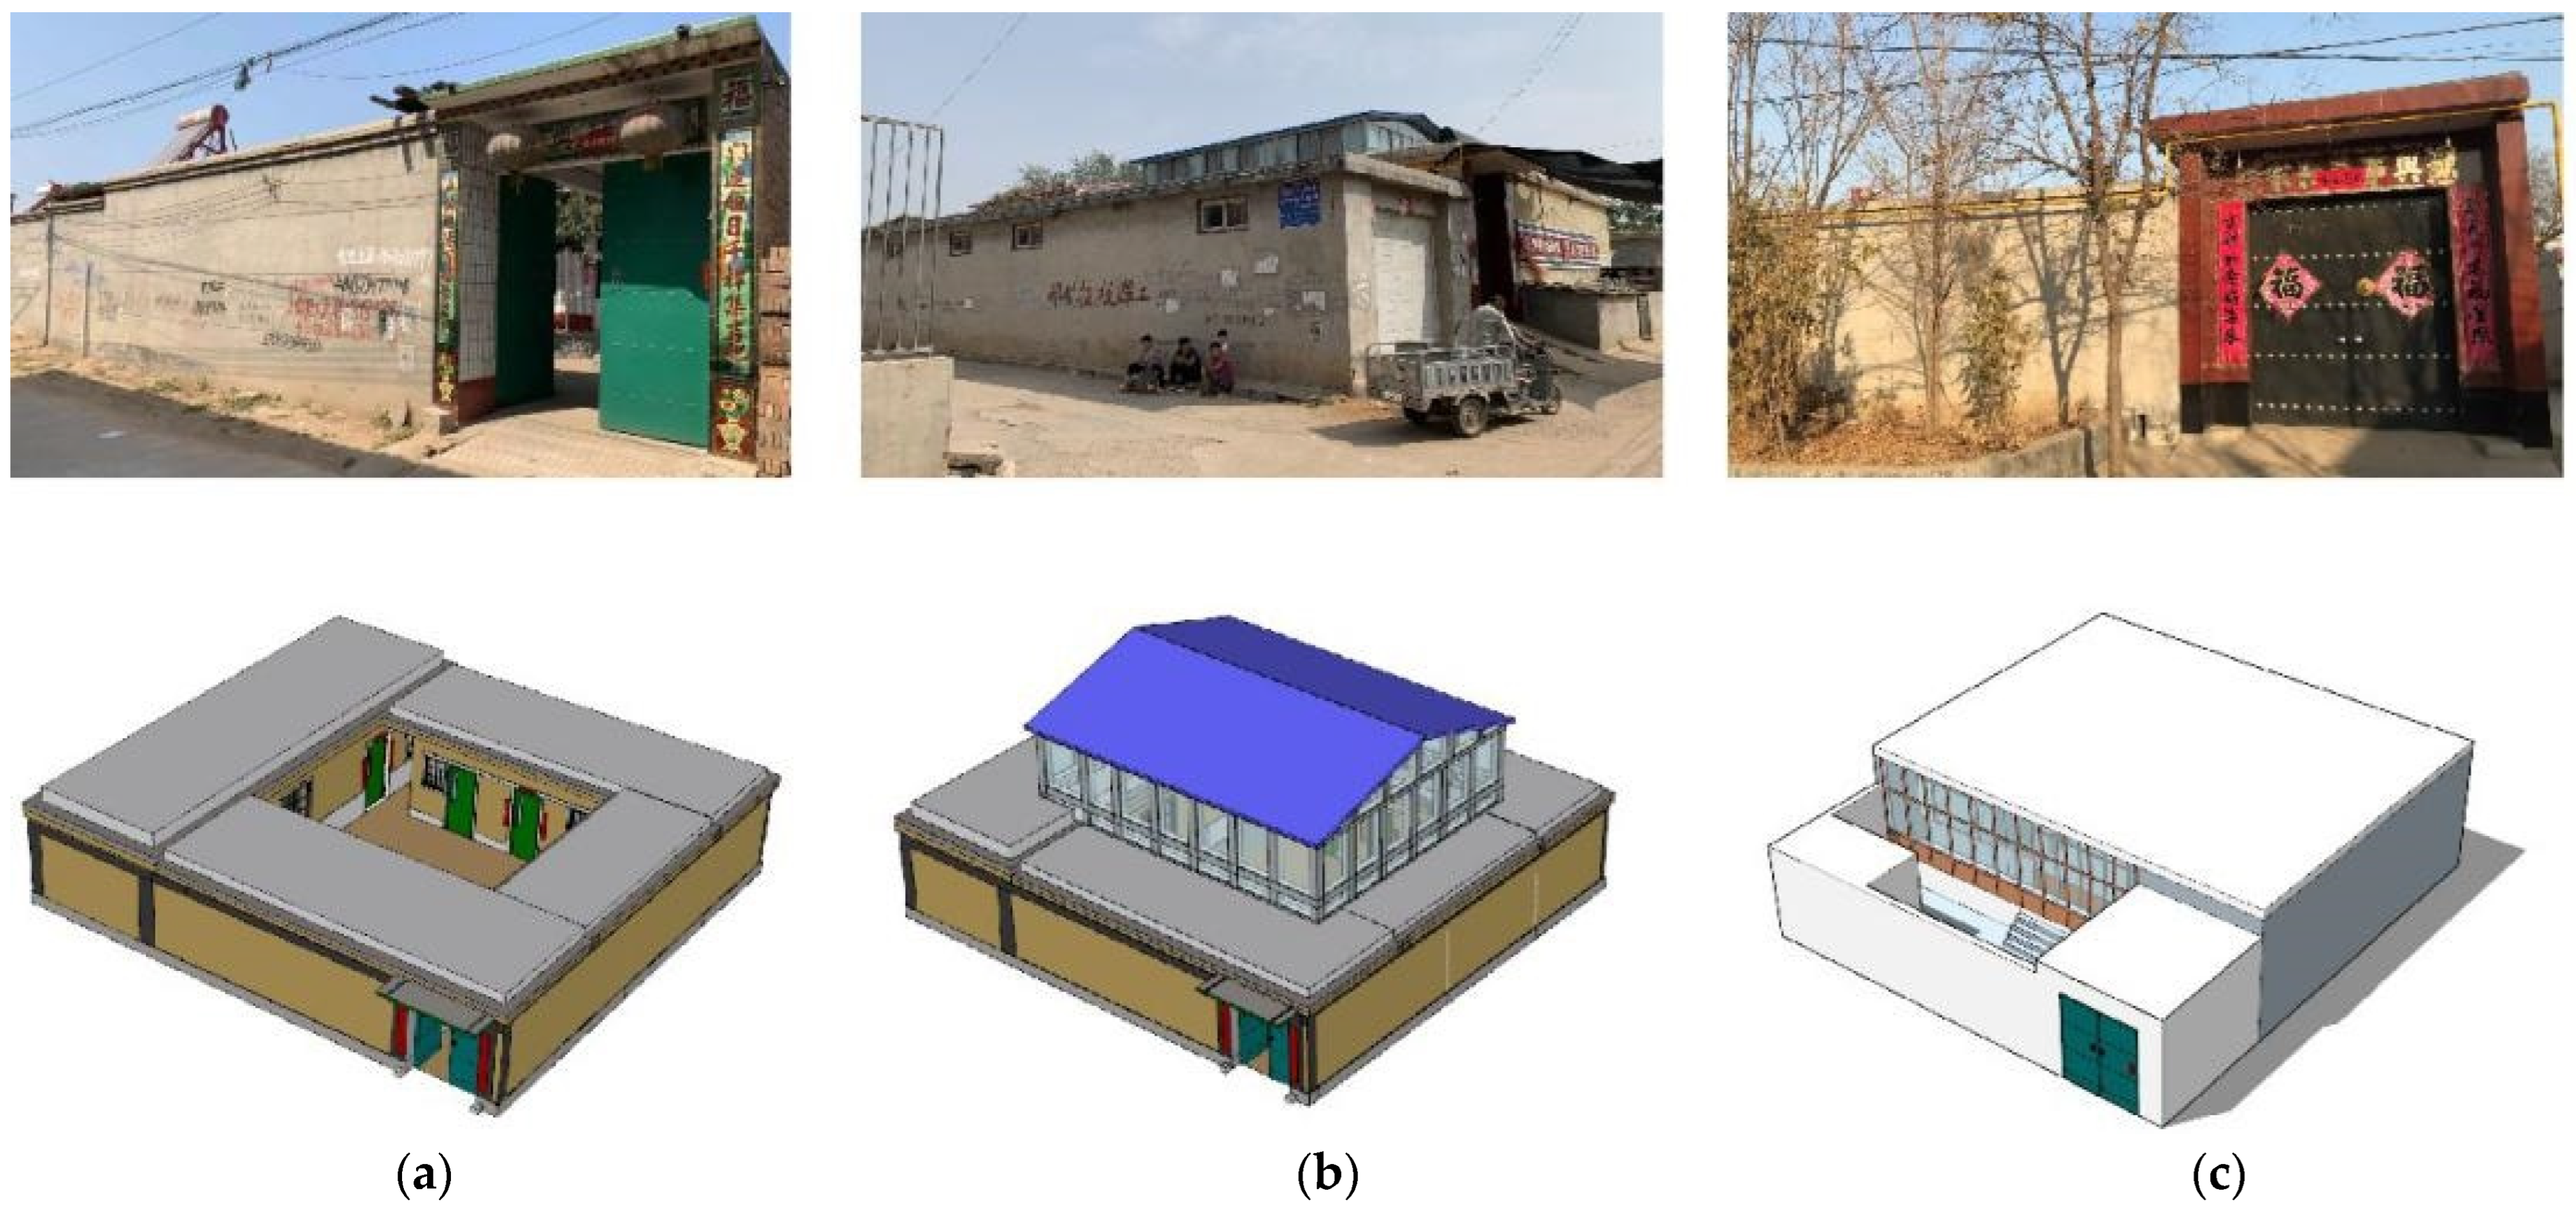
2.1. Investigation of Demand Influencing Factors

To understand the influencing factors associated with demand for rural human settlement environment in North China, this study selected more than 20 households in 14 villages from 7 provinces and cities (latitude 33°–47° N, longitude 112°–123° E) to conduct interviews and field measurements, as shown in Figure 1. In the investigated area, the lowest average temperature in winter is −30 °C (Qiqihar City, Heilongjiang Province) and the highest average temperature is approximately 5 °C (Pingdingshan City, Henan Province). The indoor and outdoor winter environments of four farmhouses located in Zhengding, Fuxin, and Lvshun were measured onsite with farmers of different incomes and ages as the interviewees. Multiple interviews were conducted from 2011 to 2020, and field measurements were conducted from December 2019 to January 2020 and December 2020 to January 2021, respectively.
Through the visit and actual survey in the rural areas of north China, it was found that there are certain differences in the architectural forms of the farm houses in northeast China and North China. Most of northeast China is located in cold areas. Walls are generally in the form of 20 mm cement mortar +370 red clay bricks +20 mm lime mortar. Roofs are 200 mm slag +50 mm cement mortar. Floors are 200 mm slag +120 red clay bricks +50 mm cement mortar. Windows are 6 mm glass single-layer wooden windows. The door is a single layer solid wooden outer door. While north China is mostly located in cold areas, walls are generally in the form of 10 mm cement mortar +370 red clay bricks +10 mm lime mortar, roofs are 50 mm cement mortar +160 alkali earth ceramsite concrete +80 irregular straw, floors are 100 mm clay +50 mm cement mortar, windows are 6 mm single-layer glass outer windows. The doors are single layer solid wooden exterior doors. Of course, the above introduction is the basic situation of the traditional farm house in northeast China and north China. Due to China’s vast territory and rapid rural development, there are still certain differences between different farm houses, even if they are located in the same area and village.
Visiting survey content includes information on personal attributes (sex, age, family members, income and source, years of residence in the area), daily life (dining time, work and rest habits, work time), human settlement environment (comfort, environmental preferences), health (illnesses of family members), dietary preferences, energy consumption (for cooking, heating), living customs, house building methods, and the surrounding environment. The test parameters, test instruments and instrument precision involved in the field survey are shown in Table 1.

2.2. Questionnaire Survey

The research data of the demand model construction were obtained based on the questionnaire survey. Based on the interview survey and the field-measured data of the household environment of farmers, the influencing factors of demand were classified into four categories, namely livability and convenience, health and comfort, daily life, energy efficiency and cost of living. The design of the questionnaire survey content was demonstrated with these classifications in mind. The content of the questionnaire was adjusted and modified through multiple pre-surveys to ensure that the questionnaire was close to the daily life of farmers. See Appendix A for the questionnaire. The principle of selecting the site for the implementation of the questionnaire was based on a combination of climatic conditions, geography (remote rural areas, and rural–urban–peri-urban areas), and interview conditions. Finally, the questionnaire survey was conducted in three typical villages, including the Songtungouli Village, Gaizhou City, Liaoning Province (Northeast China, near the sea, cold zone A, remote rural areas, good visiting conditions), Kongshan Village, Baoding City, Hebei Povince (North China, inland, cold zone B, remote rural areas, good visiting conditions), Shiwulikuang Village, Qingdao City, Shandong Province (North China, near the sea, cold zone A, rural–urban–peri-urban areas, good visiting conditions). The respondents were all the villagers that could be contacted in the selected typical villages.
Considering that the farmers might find it difficult to understand the questionnaire, and to guarantee the reliability of the questionnaire survey data, the questionnaire was designed such that the investigators and respondents were face to face and all doubts could be clarified on the spot. To conduct the questionnaire survey smoothly, some measures were enforced, such as contacting the local village committee for support, provision of appropriate rewards to motivate villagers, and execution of the survey under the leadership of local people familiar with the situation. The survey was conducted from 29 December 2021 to 2 January 2022. A total of 167 valid questionnaires were collected.

2.3. The Describe Model

2.3.1. Questionnaire Assignment and Reliability Evaluation

The research questionnaire was based on a Likert-5 scale, and four types of elements were given priority: issues of livability and convenience, health and comfort, daily life, and energy efficiency and cost of living. The questionnaire problem settings used to conduct the classifications were “very dissatisfied = 1, not satisfied = 2, generally satisfied = 3, satisfied = 4, very satisfied = 5”. The questionnaire data were then used for subsequent discussion and analysis. Before further analysis of the questionnaire data, the quality of the questionnaire was evaluated, and the reliability and validity of the measurement results were measured.
In this study, Cronbach’s alpha (α) was used to assess the reliability of the questionnaire, and the software IBM SPSS Statistics (version 24.0, version 24.0, Norman H. Nie, C. Hadlai (Tex) Hull and Dale H. Bent, New York, NY, USA) was used to calculate the results, as shown in Table 2. It can be observed that the α value of the energy efficiency and cost of living factor was less than 0.436, whereas the corresponding value of other potential variables were >0.7. However, with the continuous development of socioeconomic level and the guidance of the national energy-saving and environmental protection policy, the awareness among farmers to save energy and protect the environment has gradually been increasing. This demand element is of great importance in understanding the level of awareness of energy saving and environmental protection among farmers, and provides some reference for the implementation of national policies. The value was equal to 0.436 (>0.35); therefore, the demand element of energy efficiency and cost of living was retained in this exploratory study. In summary, it could be considered that all indicators had good reliability. Factorial analysis was used to analyze the validity of the data. Based on the calculation of the KMO value (KMO > 0.6) of variables and Bartlett sphericity test (p < 0.05), the factor load (>0.7) was used as the evaluation index of structure validity [24]. The final results are listed in Table 3. Except for the two observation variables of energy saving economic demand, the KMO value was 0.5. The values of the other items were >0.6. The Bartlett sphericity test implied p < 0.05, and the load of all observation variables was >0.7, thus suggesting that the model had good structural validity.

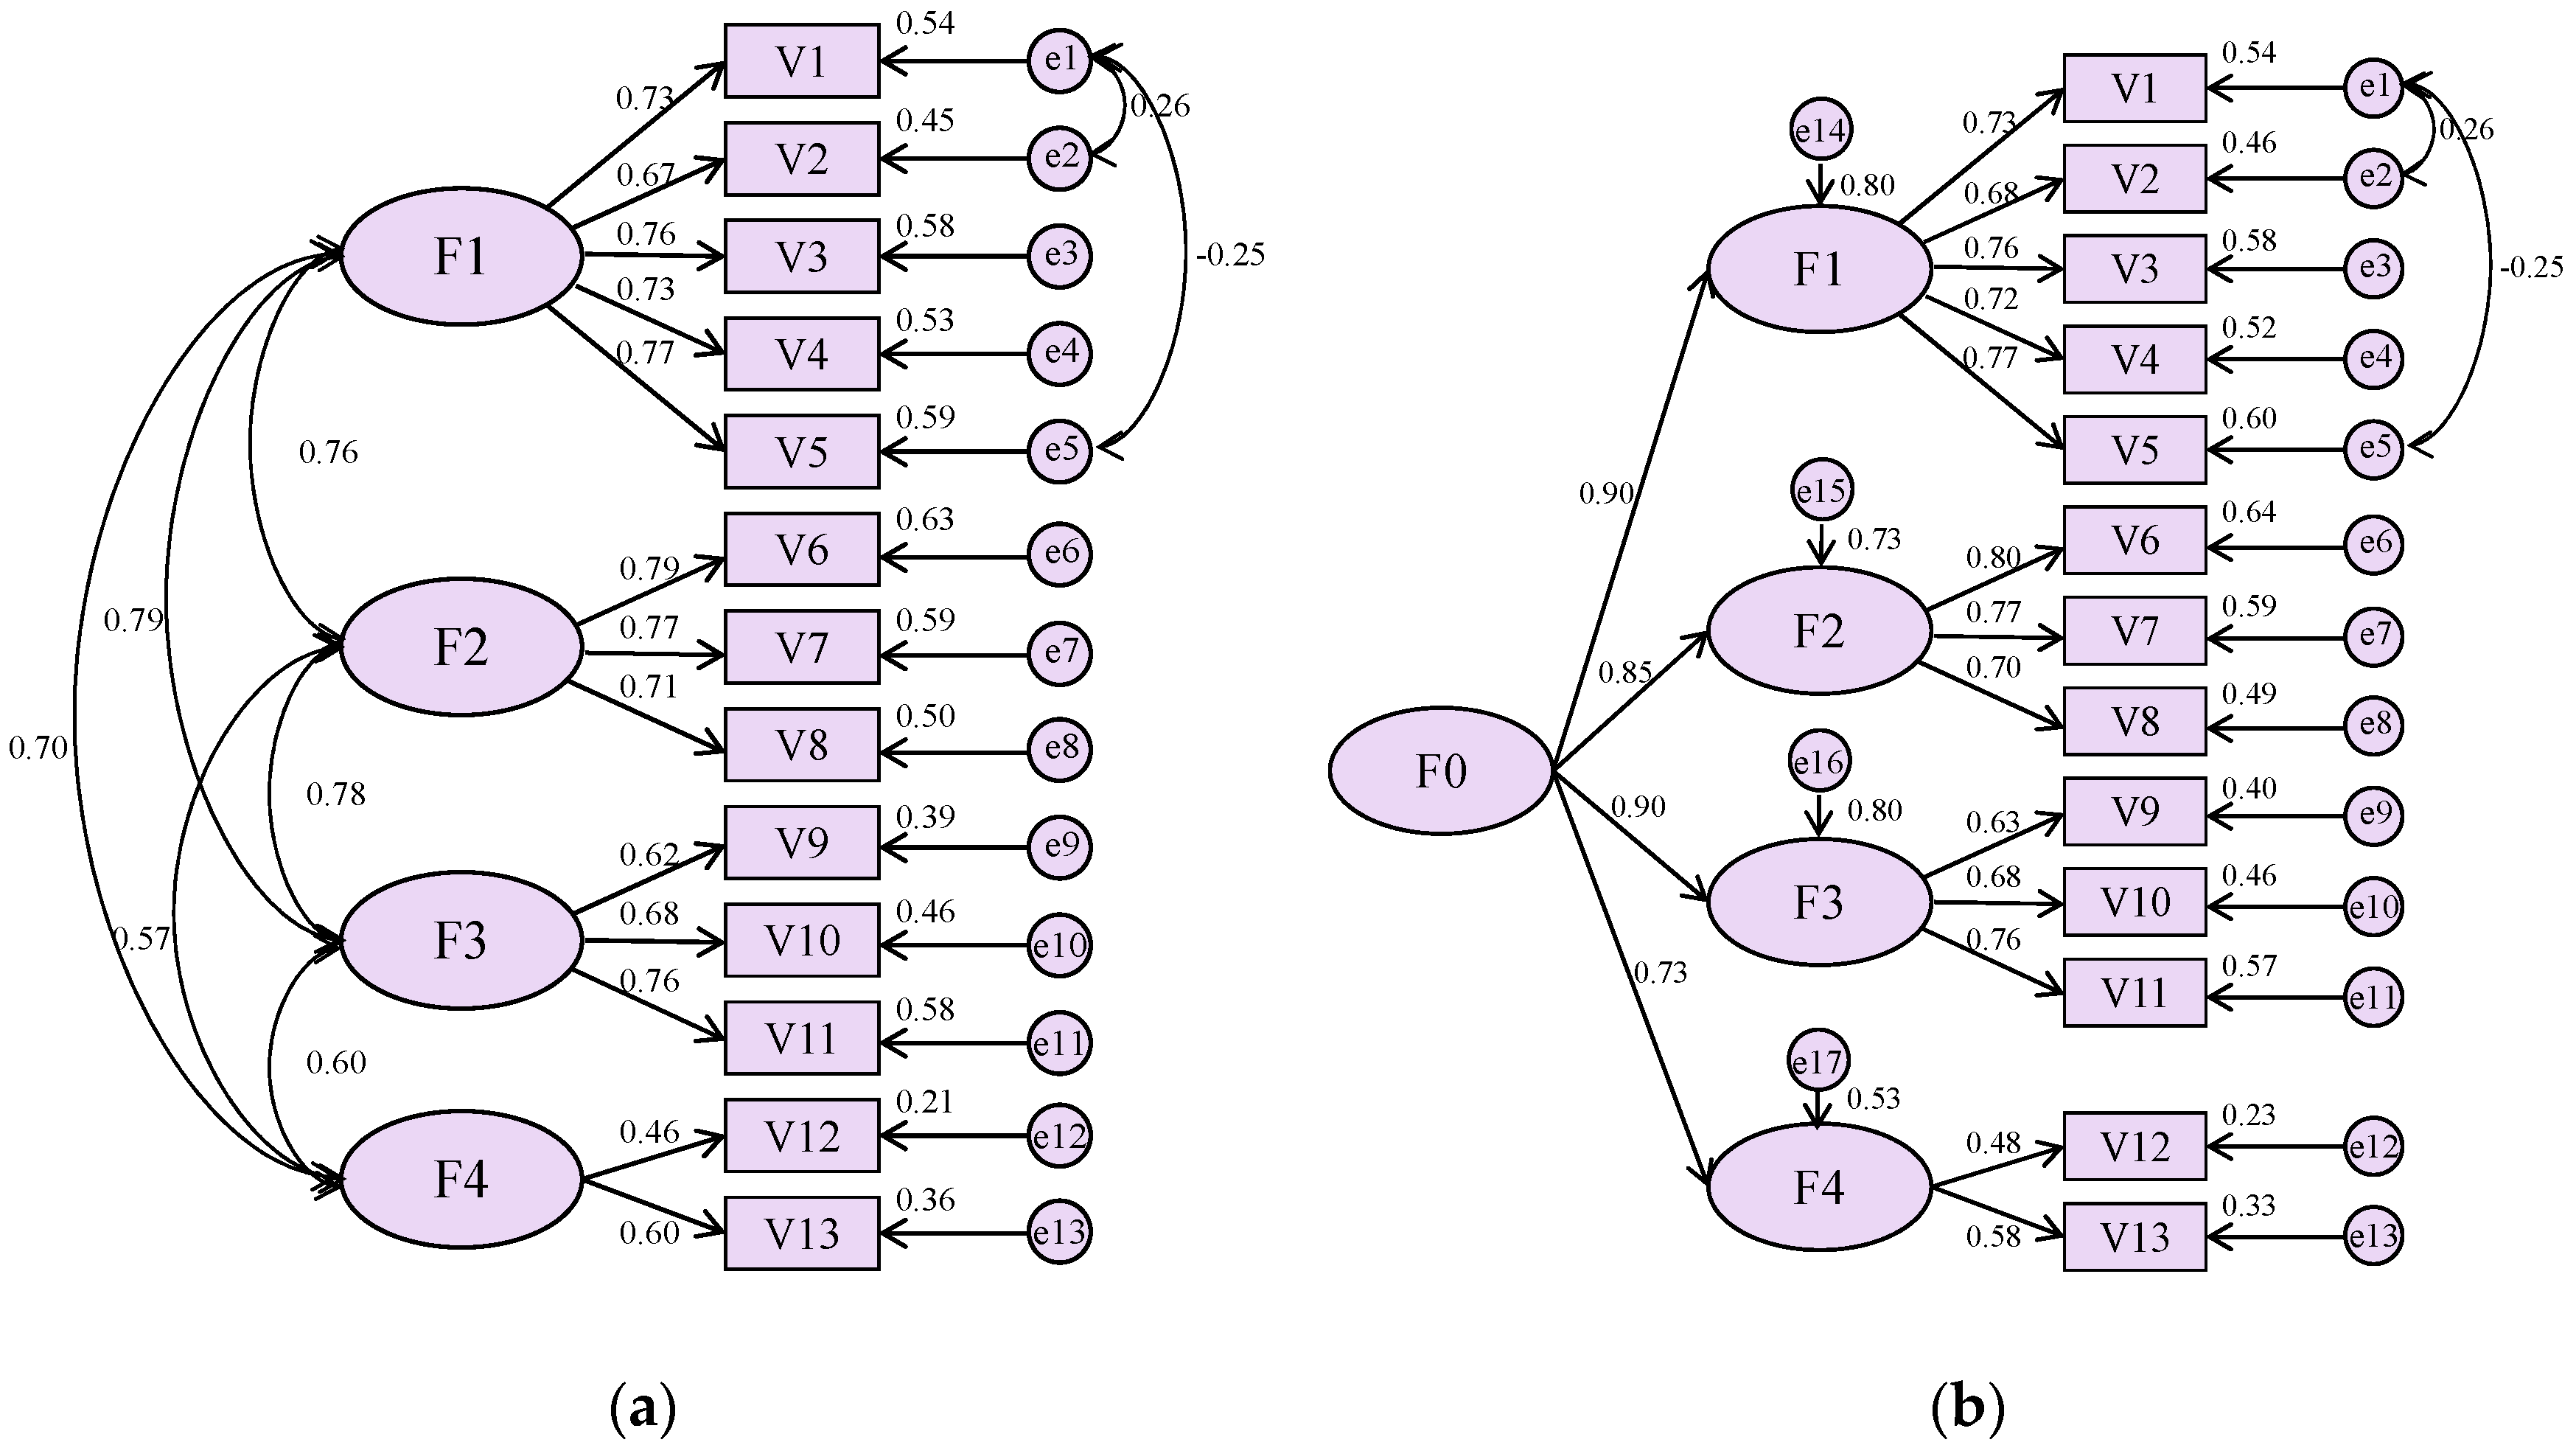
2.3.2. The Description of the Structural Equation Model

Based on the aforementioned demand factor and questionnaire surveys, this study builds a demand representation model for the residential environment of rural houses in North China. According to the purpose of the study, the demand satisfaction of the living environment of rural houses in North China was taken as the explanatory variable of the model, and the four potential variables of livability and convenience, health and comfort, daily life, and energy efficiency and cost of living, were used as explanatory variables; each potential variable contained several observation variables. For example, for the livability and convenience latent variable, the functional space was used as the classification basis for the observed variables, which were divided into toilet, kitchen, leisure, bath, and yard planning needs. For the health and comfort latent variable, this study mainly considered three indices: thermal environment, wet environment, and air quality. Regarding the latent variables of daily life, sewage and garbage treatment, drinking water, food and meals, and yard planting and breeding, were mainly considered. Regarding the potential variables of energy efficiency and cost of living, we mainly considered modern equipment, energy saving and environmental protection measures, straw burning coal, and whether the household was willing to spend money on housing reconstruction to improve comfort. From the point of view of the external impact of demand, and based on considerations of the human-centered ideas, physical health and mental pleasure factors were taken as latent variables. Meanwhile, a large amount of literature has proved that social and economic status has a significant impact on other factors, so socioeconomic status factors were included as potential variables, and education level, income level and occupational reputation were selected as observation variables [25].
To assess the rationality of model building, this study used IBM SPSS AMOS (version 24.0, Norman H. Nie, C. Hadlai (Tex) Hull and Dale H. Bent, New York, USA) for confirmatory factorial analysis of each tested variable, and yielded first-order confirmatory factorial analysis demand outcomes, as shown in Figure 2a. Accordingly, we selected a number of commonly used indicators to assess the degree of fitting of the model, such as χ2/df (Chi-square/degrees-of-freedom),RMSEA (Root Mean Square Error of Approximation), GFI (Goodness of Fit Index), AGFI (Adjusted Goodness of Fit Index), CFI (Comparative Fit Index), TLI (Tucker-Lewis index), IFI (Incremental Fit Index). Specific calculation outcomes are listed in Table 4. It can be observed that the fitting of the model was satisfactory overall, and strong correlation existed among latent variables. Demand, on the basis of the formation of the second-order confirmatory factor analysis, is shown in Figure 2b. The results showed that the various indicators of the latent variable factor loading quantity are similar to the first-order confirmatory factorial analysis outcomes, and showed good fitting characteristics, as shown in Table 5. The path coefficients associated with livability and convenience, health and comfort, daily life, and energy efficiency and cost of living, were all high, and equal to 0.90, 0.85, 0.90, and 0.73, respectively and, thus, indicated that the latent variables of demand could be explained by the other four latent variables.
In this study, a questionnaire survey-based demand representation model for residential environment of rural houses in northern China was proposed, as shown in Figure 3. First, the measurement models were classified into formative measurement and reflective measurement models. According to the causal relationship between latent variables and observed variables, and the judgment principle [26], it was determined that all the measurement models involved in this study were formative measurement models. LV represents the latent variable, MV represents the observable variable, corresponding to the latent variable, and δ represents the error term. In the formative measurement model, the relationship among the three can be expressed as follows,
LV = ∑λ MV + δ
where λ represents the weight of the observable variable to the corresponding latent variable (external weight coefficient). In addition, it is important to note that demands of livability and convenience, health and comfort, daily life, and energy efficiency and cost of living are formative indicators. These demand factors were explained by the formation of the corresponding indicators, and the relationship can be represented as
LVdemand = γ1LV1 + γ2LV2 + γ3LV3 + γ4LV4 + ε
Among them, the physical meaning of γ is the same as λ, and ε represents the error term.
The relationship among the latent variables of demand of physical health, mental pleasure, and socioeconomic status was assumed to be the following: (1) physical health, mental pleasure, and socioeconomic status, all have direct influences on demand (H0, H1, and H2), (2) physical health and socioeconomic status have a direct impact on mental pleasure (H3 and H4), (3) socioeconomic status has a direct impact on physical health (H5). The relationships between these latent variables can be expressed as
LVdemand = η1LVhealth + η2LVpleasure + η3LVses + σ demand
LVpleasure = η4LVhealth + η5LVses + σ pleasure
LVhealth = η6LVses + σ health
where η represents the normalized regression coefficient between latent variables, and σ represents the error term.
In this study, the software Smart PLS (version 3.0, Prof. Dr. Christian Ringle and Sven Wende, Germany,) was used to estimate the unknown parameters in the aforementioned structural model equation. The core algorithm of this software is PLS-SEM (Partial Least Squares Structural Equation Modeling). Compared with the other mainstream algorithms of the structural equation model, CB-SEM (Covariance Based Structural Equation Modeling), the PLS-SEM algorithm can deal more effectively with the complex structural and the formation measurement model without mandatory requirements on the data distribution and sample size, and is more suitable for theoretical testing and other exploratory studies in the early stage of model development [27].

2.3.3. Evaluation of the Degree of Fitting

After completing the construction of the demand representation model and parameter estimation, the reliability and validity of the measurements and the structural models needed to be evaluated to assess the quality of the model. All the models constructed in this study are formative measurement models, whose evaluation indices include external weight (>0.2 or 0.1), T test and its significance (p-value) [28,29], and VIF (Variance Inflation Factor) (<3.3) [30]. The specific calculation results are listed in Table 6. The evaluation indices of the structural model mainly included the path coefficient and its significance (p < 0.05) [31], determination coefficient R2 (0.67, 0.33, 0.19) [28,32], effect value f2 (0.35, 0.15, 0.02) [28,32], and predictive coefficient (Q2 > 0) [33]. The specific calculation results are listed in Table 7.
It is worth noting that although the factor load and significance of education level in socioeconomic status were not up to the standard, a large number of literature datasets have shown that the educational level is an important factor for the measurement of the socioeconomic status [34]. Thus, this index was retained in this study. Overall, although some indices still failed to reach the standard limits, the overall effect was acceptable, owing to the limited number of samples in this study. That is, the evaluation results of the degree of fitness showed that the constructed model had good reliability and validity.

3. Results

3.1. Basic Demand in Different Areas

According to the survey, the rural areas of the Hebei Province in the North China Plain, and the Liaoning Province in northeast China, show considerable differences in terms of yard forms, heating methods, and lifestyles, as indicated in Figure 4 and Figure 5. Rural houses in the Hebei Province are built with tall courtyard walls facing the street; the courtyard wall has no windows or small, open windows in high places to protect privacy. In contrast, rural houses in the Liaoning Province mostly use open courtyards. At present, natural gas cooking and heating have been extensively used in rural areas in the Hebei Province, whereas most rural households in northeast China still use the traditional stove and kang heating, and household hot-water heating systems. The main fuels used are crop waste (straw, corn cob, wood, etc.) and coal. The field measurement results show that the average indoor air temperature is approximately 14 °C in winter, the average air temperature difference between indoor and outdoor is approximately 12 K, and the heating cost is approximately 360 dollars. In Fuxin in the Liaoning Province, the average indoor air temperature is approximately 6 °C, the average air temperature difference between indoors and outdoors is approximately 13 K, and the surface temperature of the heated kang is approximately 18 °C. The heating cost is almost zero. In addition, the survey found that the indoor air pollution of northern farmhouses is more serious in the winter heating period. Therefore, the impact of every 1 °C increase in indoor temperature on lifestyle, economic cost, and health effects needs to be considered. It is thus important to determine a low-cost solution for both “warm” and “IAQ”.

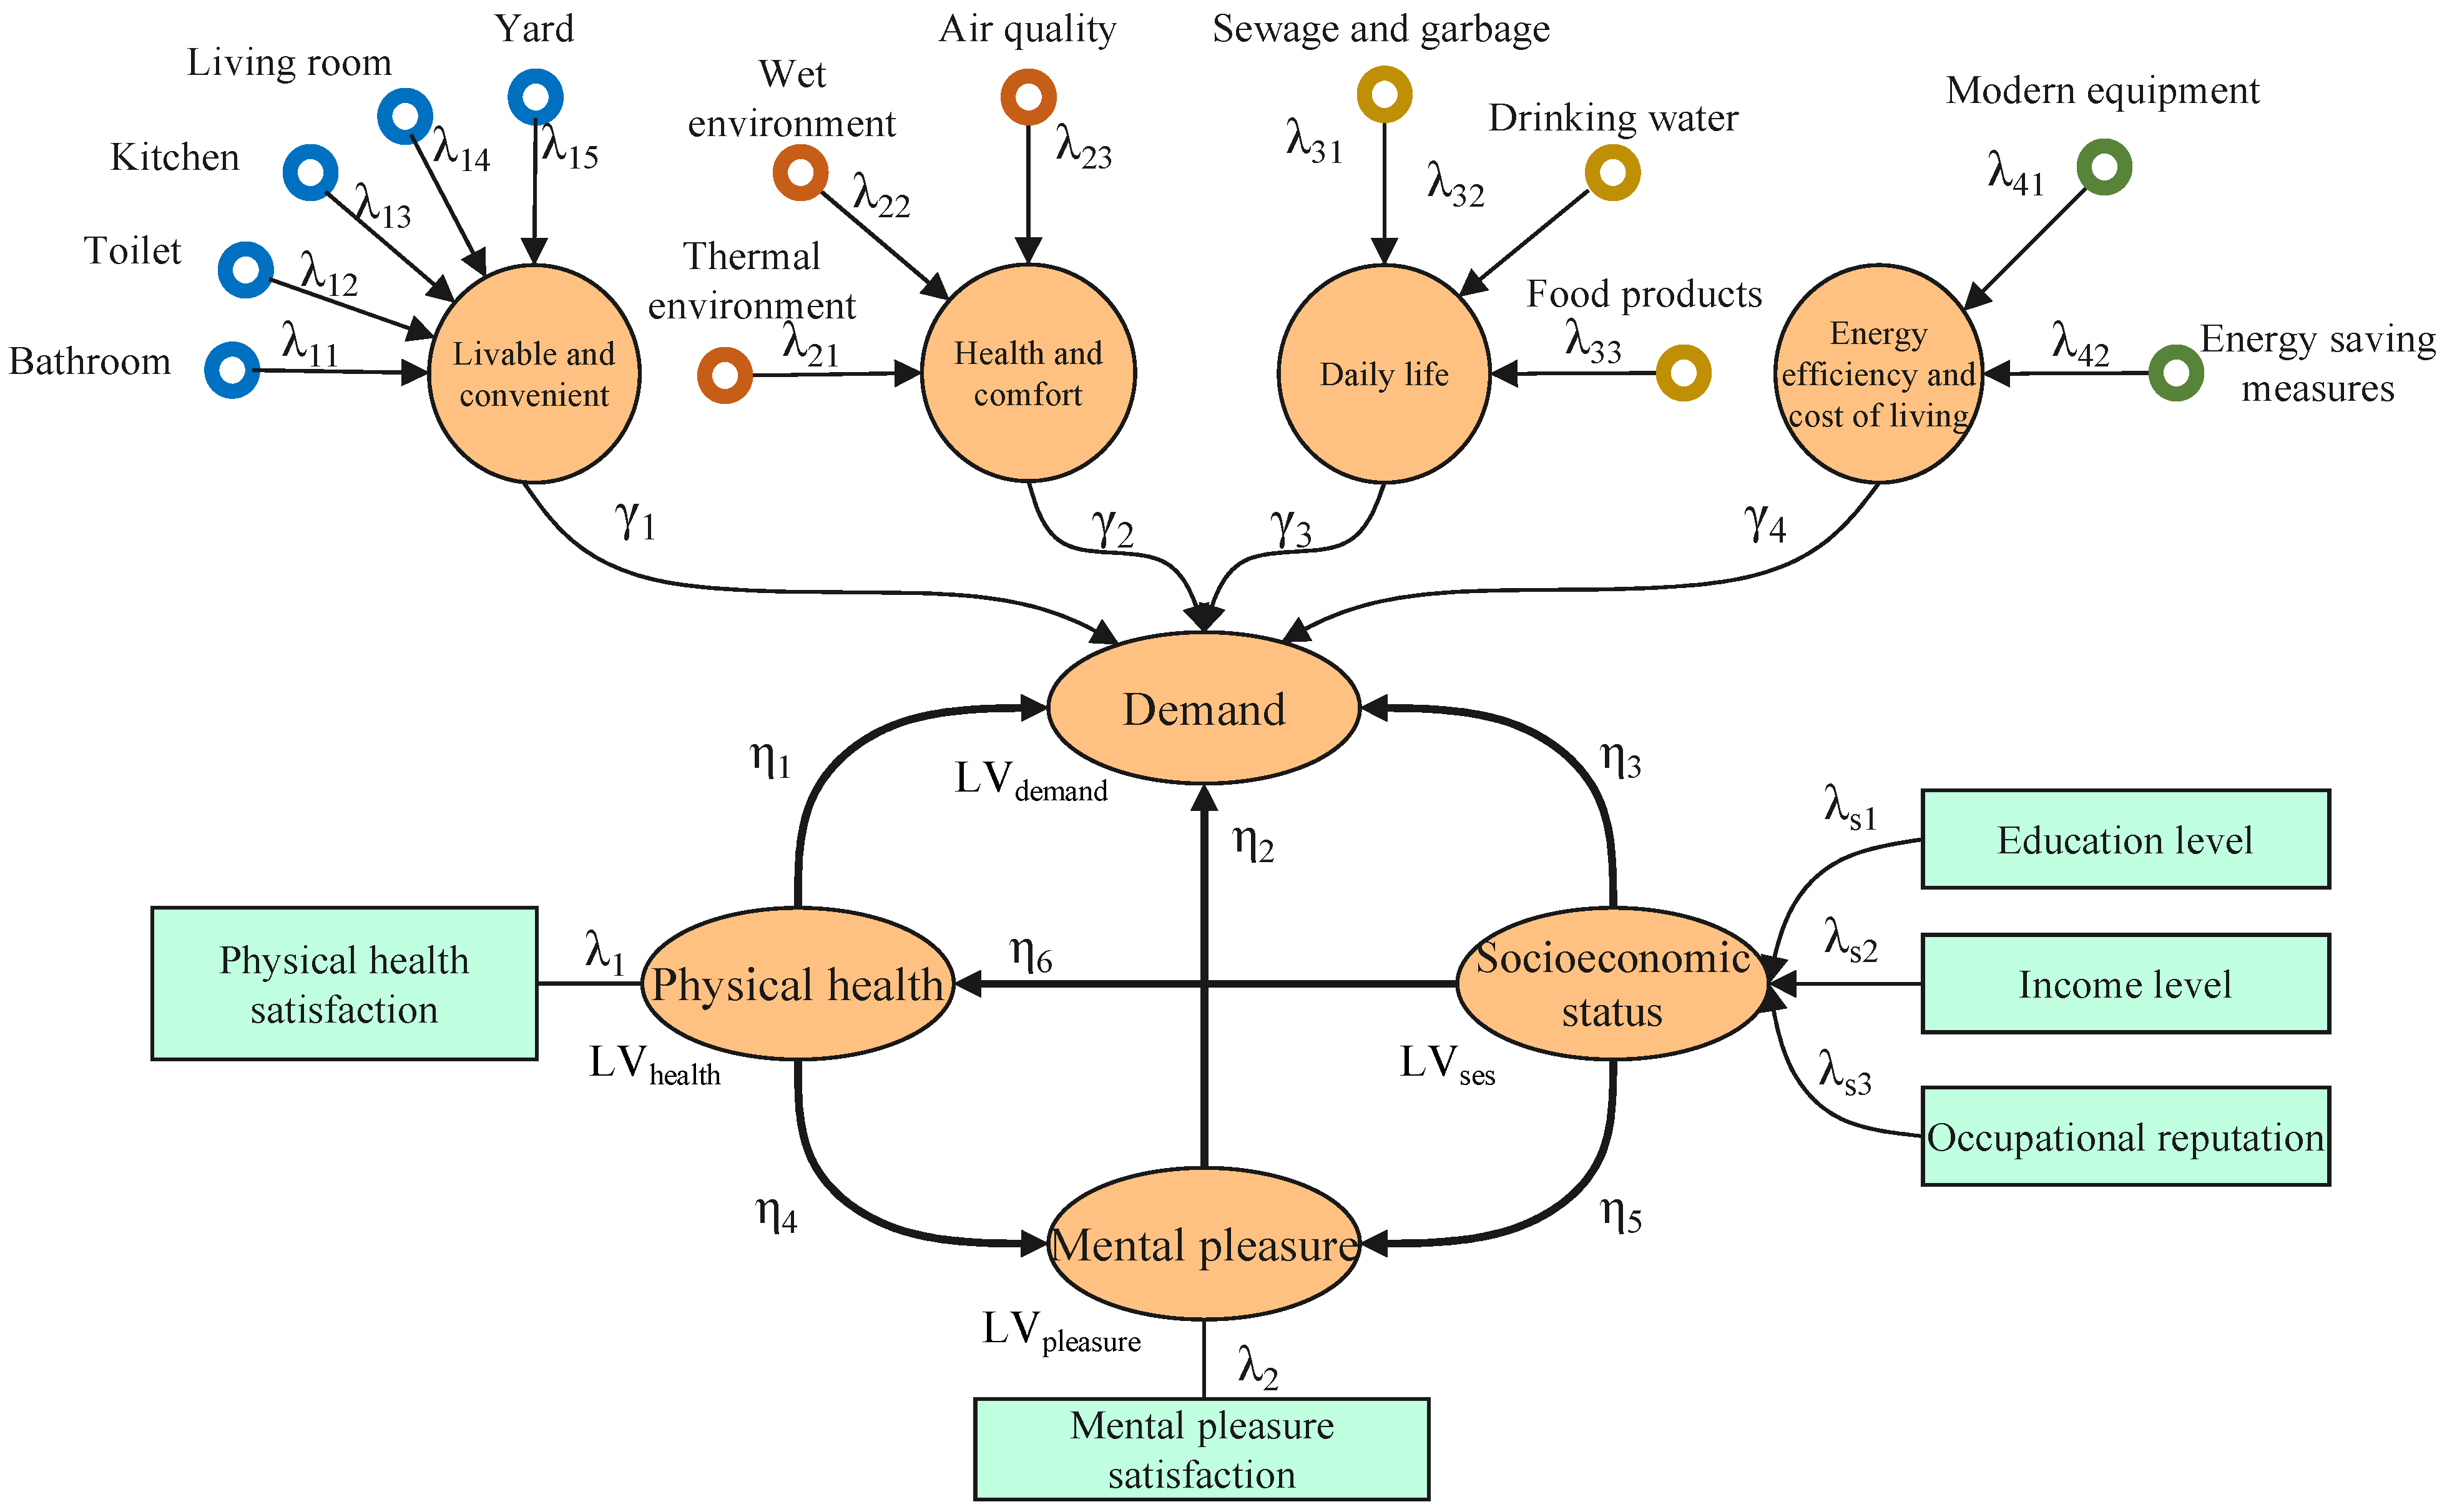
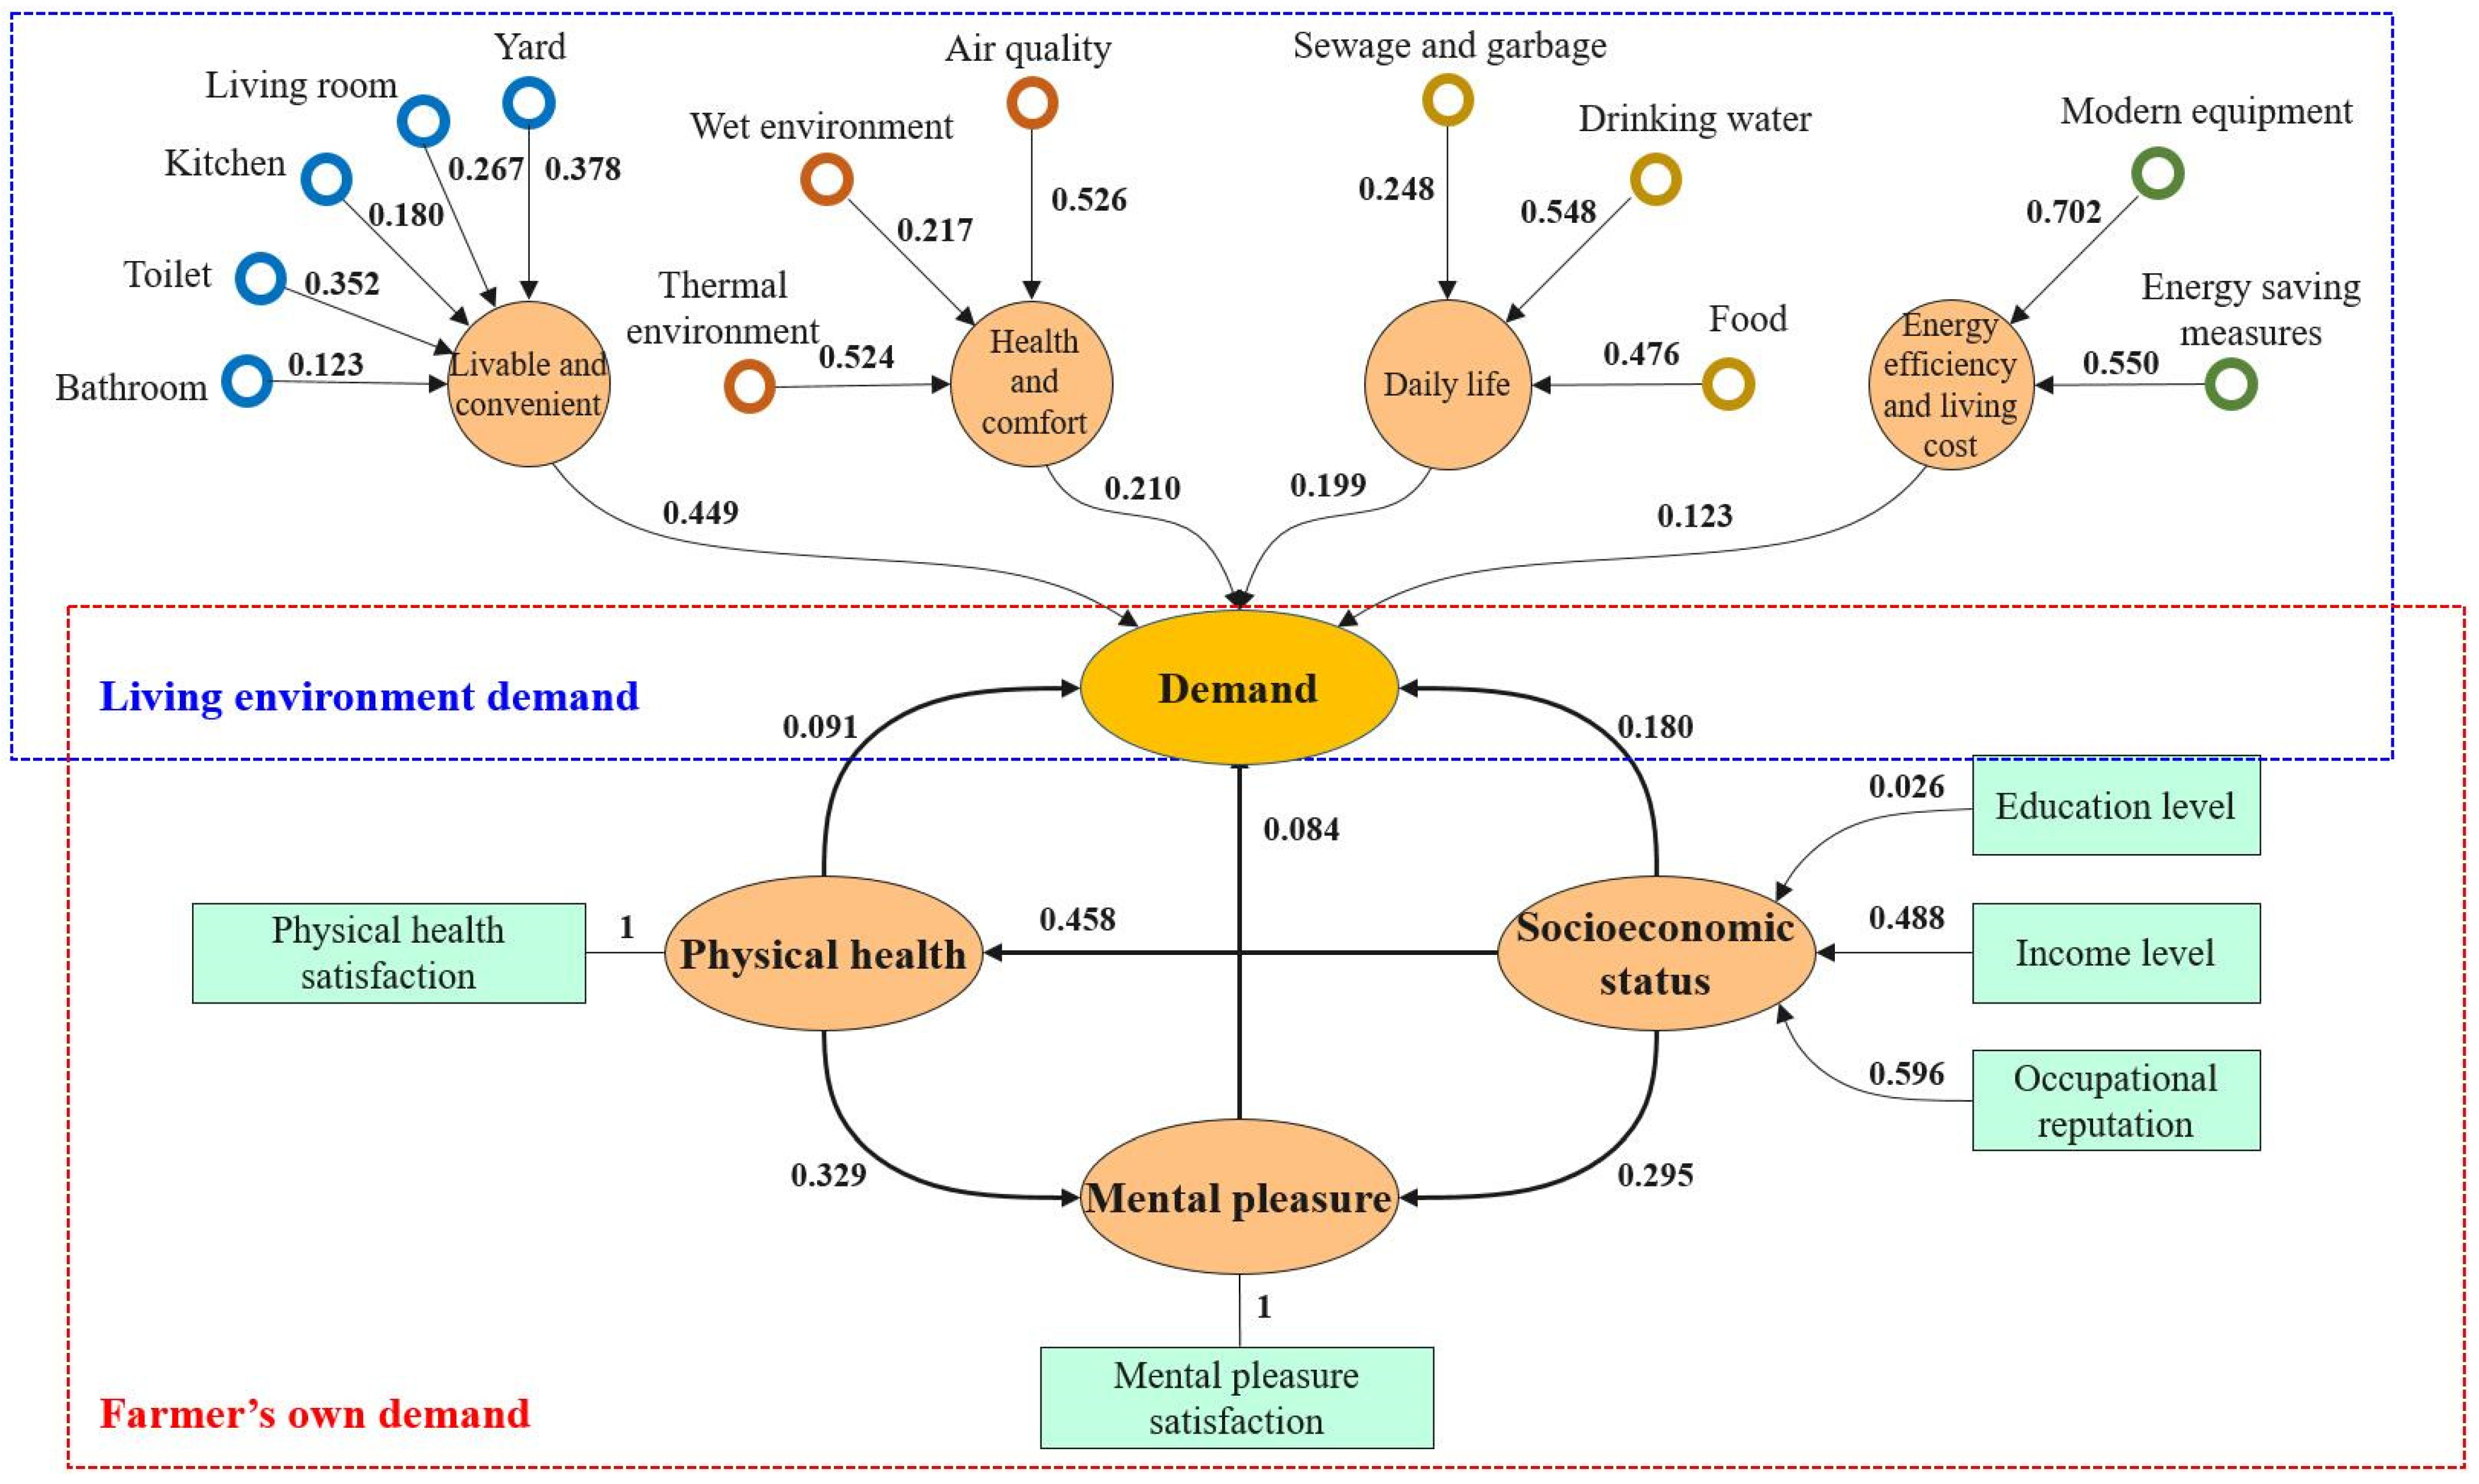
3.2. Demand Influencing Factors and Relationship Model

In this study, the structural equation model was applied to develop the demand description model using questionnaire data from a large sample of the three villages visited and studied on the basis of a preliminary interview and field survey. The results are shown in Figure 6. It can be seen from Figure 6 that from the perspective of farmers’ own demands, the weight coefficients between the influencing factors, such as physical health, mental happiness and social and economic conditions and demand satisfaction, were obtained. At the same time, from the aspect of human settlement environment demand factors, the author revealed the four main factors of human settlement environment demand of rural houses in north China and the influence weight coefficient of the secondary demand index, and obtained the influence of individual attributes, such as gender, age and region, on the quantitative representation result of the demand model through group analysis.
From the perspective of the farmers’ own demand factors, farmers’ physical health, mental pleasure, and socioeconomic status had different degrees of influence on the overall satisfaction of demand. In this study, the Bootstrapping method in Smart PLS 3.0 software was used to verify the significance of four specific indirect effects, and the calculation results are shown in Table 8. From the model (see Figure 6), socioeconomic status affects the overall demand satisfaction directly (0.180). In addition, physical health (0.458 × 0.091 = 0.042) and mental pleasure (0.295 × 0.084 + 0.458 × 0.329 × 0.084 = 0.038) could have an indirect impact on the overall demand satisfaction. Thus, the overall quantitative effect of socioeconomic status on the overall demand satisfaction was equal to 0.260. The total effect of physical health on overall demand satisfaction was the sum of direct influences (0.091) and indirect influences (0.329 × 0.084 = 0.028), that is, the total effect value was 0.119. The effect value of mental pleasure on the overall demand satisfaction was 0.084. In other words, compared with mental pleasure (0.084) and physical health (0.119), socioeconomic status (0.260) had a greater influence on the weight of the overall satisfaction demand.
From the perspective of the four demand factors of human living environment, livability and convenience (0.449) had a great impact on the overall satisfaction demand, followed by the demands on health and comfort (0.210), daily life (0.199), and energy efficiency and cost of living demand (0.123). That is to say, as the rural living standards and quality of the living environment exhibited specific improvements, farmers’ consideration of economic costs became less important. To improve convenience of living space layout and spatial functionality of the residence, the focus should be on indoor thermal environment and air quality. At the same time, residential sewage, garbage treatment and diet also require increased attention. Furthermore, the demand for energy saving, in conjunction with the environmental pollution resource shortage problem, is becoming increasingly prominent, and organizations at all levels of government attach great importance to energy conservation and environmental protection, the launch of “coal to gas”, “coal to electricity”, and many other measures. However, the farmers’ energy efficiency and cost of living demand was low (0.123); this might be attributed to policy implementation and the promotion of the problem.

3.3. Quantification of Rural Housing Demand Model in North China

In addition to the aforementioned five elements of external influencing factors on demand and demand satisfaction, there were the influences of various secondary demand indicators on demand satisfaction, This research focused on the influences of their weight sizes to directly explain northern farmhouse demands and their influences, owing to specific problems. Specifically, in the case of northern farmhouses, the residential environment quality has the reference value of the reference data.
Based on the questionnaire survey conducted to build a northern farmhouse, the living environment demand representation model, the various weights of the factors that affected the demand’s overall satisfaction were obtained. Accordingly, weight value adjustment was expressed by the following equation; the demand outcomes are listed in Table 9. Please refer to Figure 3 for the index meanings.
λ ij * = λ ij × γ i λ ij × γ i
where λ ij * represents the weight of adjusted demand factors, λij the represents the unadjusted weights, γi represents the weight value of the overall satisfaction of demand from convenient and livable demand side, i = 1, 2, 3, 4, and j = 1, 2, 3, 4, and 5.
From the perspective of the livability and convenience demands of the functional space of the farm house, the farmers focus on the planning of the yard (0.135), and on the toilet (0.126), followed by entertainment (0.095), cooking (0.064), and bathing (0.044). Courtyard planning of farm houses is different from urban housing, and farmers assign more importance to this problem. However, owing to the lack of theoretical knowledge support, the farmers rely more on experience, which makes the planting, breeding, and storage of agricultural products and storage of farm tools in the yard more chaotic. Regarding the toilet situation, most farmers still use outdoor dry toilets because the problems of water scarcity, low water pressure, and frozen pipes are difficult to solve, which introduces considerable inconvenience to farmers. As the country vigorously promotes the “toilet revolution”, farmers are also willing to improve toilet conditions. Most rural houses consider economic cost, and provide room heating only to the bedroom. Thus, most entertainment and leisure activities mainly occur in the bedroom, resulting in infrequent use of the living room functions. Regarding the needs of kitchen and bath, most of farm houses are built following the traditional mode. Some farmers directly apply the urban kitchen and bathroom design mode to their houses, but as they do not consider the particularity of the countryside drainage, lampblack, and other new problems arise. In general, farmers pay the highest attention to the needs of convenience and livable housing. Identification of ways to meet the needs of convenient and livable requirements of residents, while maintaining the characteristics of rural housing, is a problem that needs further analysis and solution.
From the perspective of the indoor physical environment, i.e., health and comfort demands, the main concerns of farmers were thermal environment comfort (0.088), air quality (0.088), and lack of understanding of possible health risks introduced by the wet environment (0.036). For the indoor environment, the view of “temperature” as the core was still the key to some farmers. However, with the development of the economy and society, more and more farmers realize that indoor air quality has a great impact on health. How to improve the indoor wet environment and air quality of rural houses under the premise of ensuring a comfortable indoor temperature is the key problem to be solved urgently at present.
From the point-of-view of the daily life demands of farmers, the main concerns of farmers were food and meals (0.087), sewage and garbage treatment (0.075), and drinking water (0.039). More visiting surveys found that most of the rural elderly and children were at home, and the old men took care of the children only by visiting stores to buy meat, milk, eggs, green vegetables, and foods, such as noodles and steamed bread. However, this scenario will be difficult to change. Furthermore, for drinking water and residential sewage and garbage treatment problems, some farmers buy water dispensers and bottled water, but most farmers drink water directly. Additionally, residential sewage and garbage disposal did not adhere to a standardized disposal process. There were indoor and outdoor sewage splashing and random garbage piles so that it was difficult to keep the farm house clean and tidy.
Compared with other demands, farmers paid less attention to energy efficiency and cost of living demands, focusing 0.069 on energy savings, environmental protection measures, and 0.054 on modern equipment. As energy shortage has become more prominent, following the implementation of national policies, peasant household energy conservation and environmental protection consciousness has grown stronger. Thus, farmers take the initiative to include measures, such as adding a sunny room, increasing the partition to ensure appropriate indoor environments, and reducing energy consumption and economic costs. However, most of the farmers did not understand these issues in depth. Thus, it would be difficult for such farmers to take the initiative to adopt appropriate measures of energy conservation and environmental protection technology. At the same time, farmers have low demands for modern equipment, such as exhaust fans and range hoods. Most farmers have not realized the impacts of these types of equipment in improving the indoor environment. They consider economic cost more, and believe that opening windows for ventilation when cooking can achieve better results.

4. Discussion

As mentioned in the above section, the demand description model of farmers was constructed according to the survey results. However, some influencing factors were not well integrated into the relational framework of the demand description model, which are further discussed in this section.

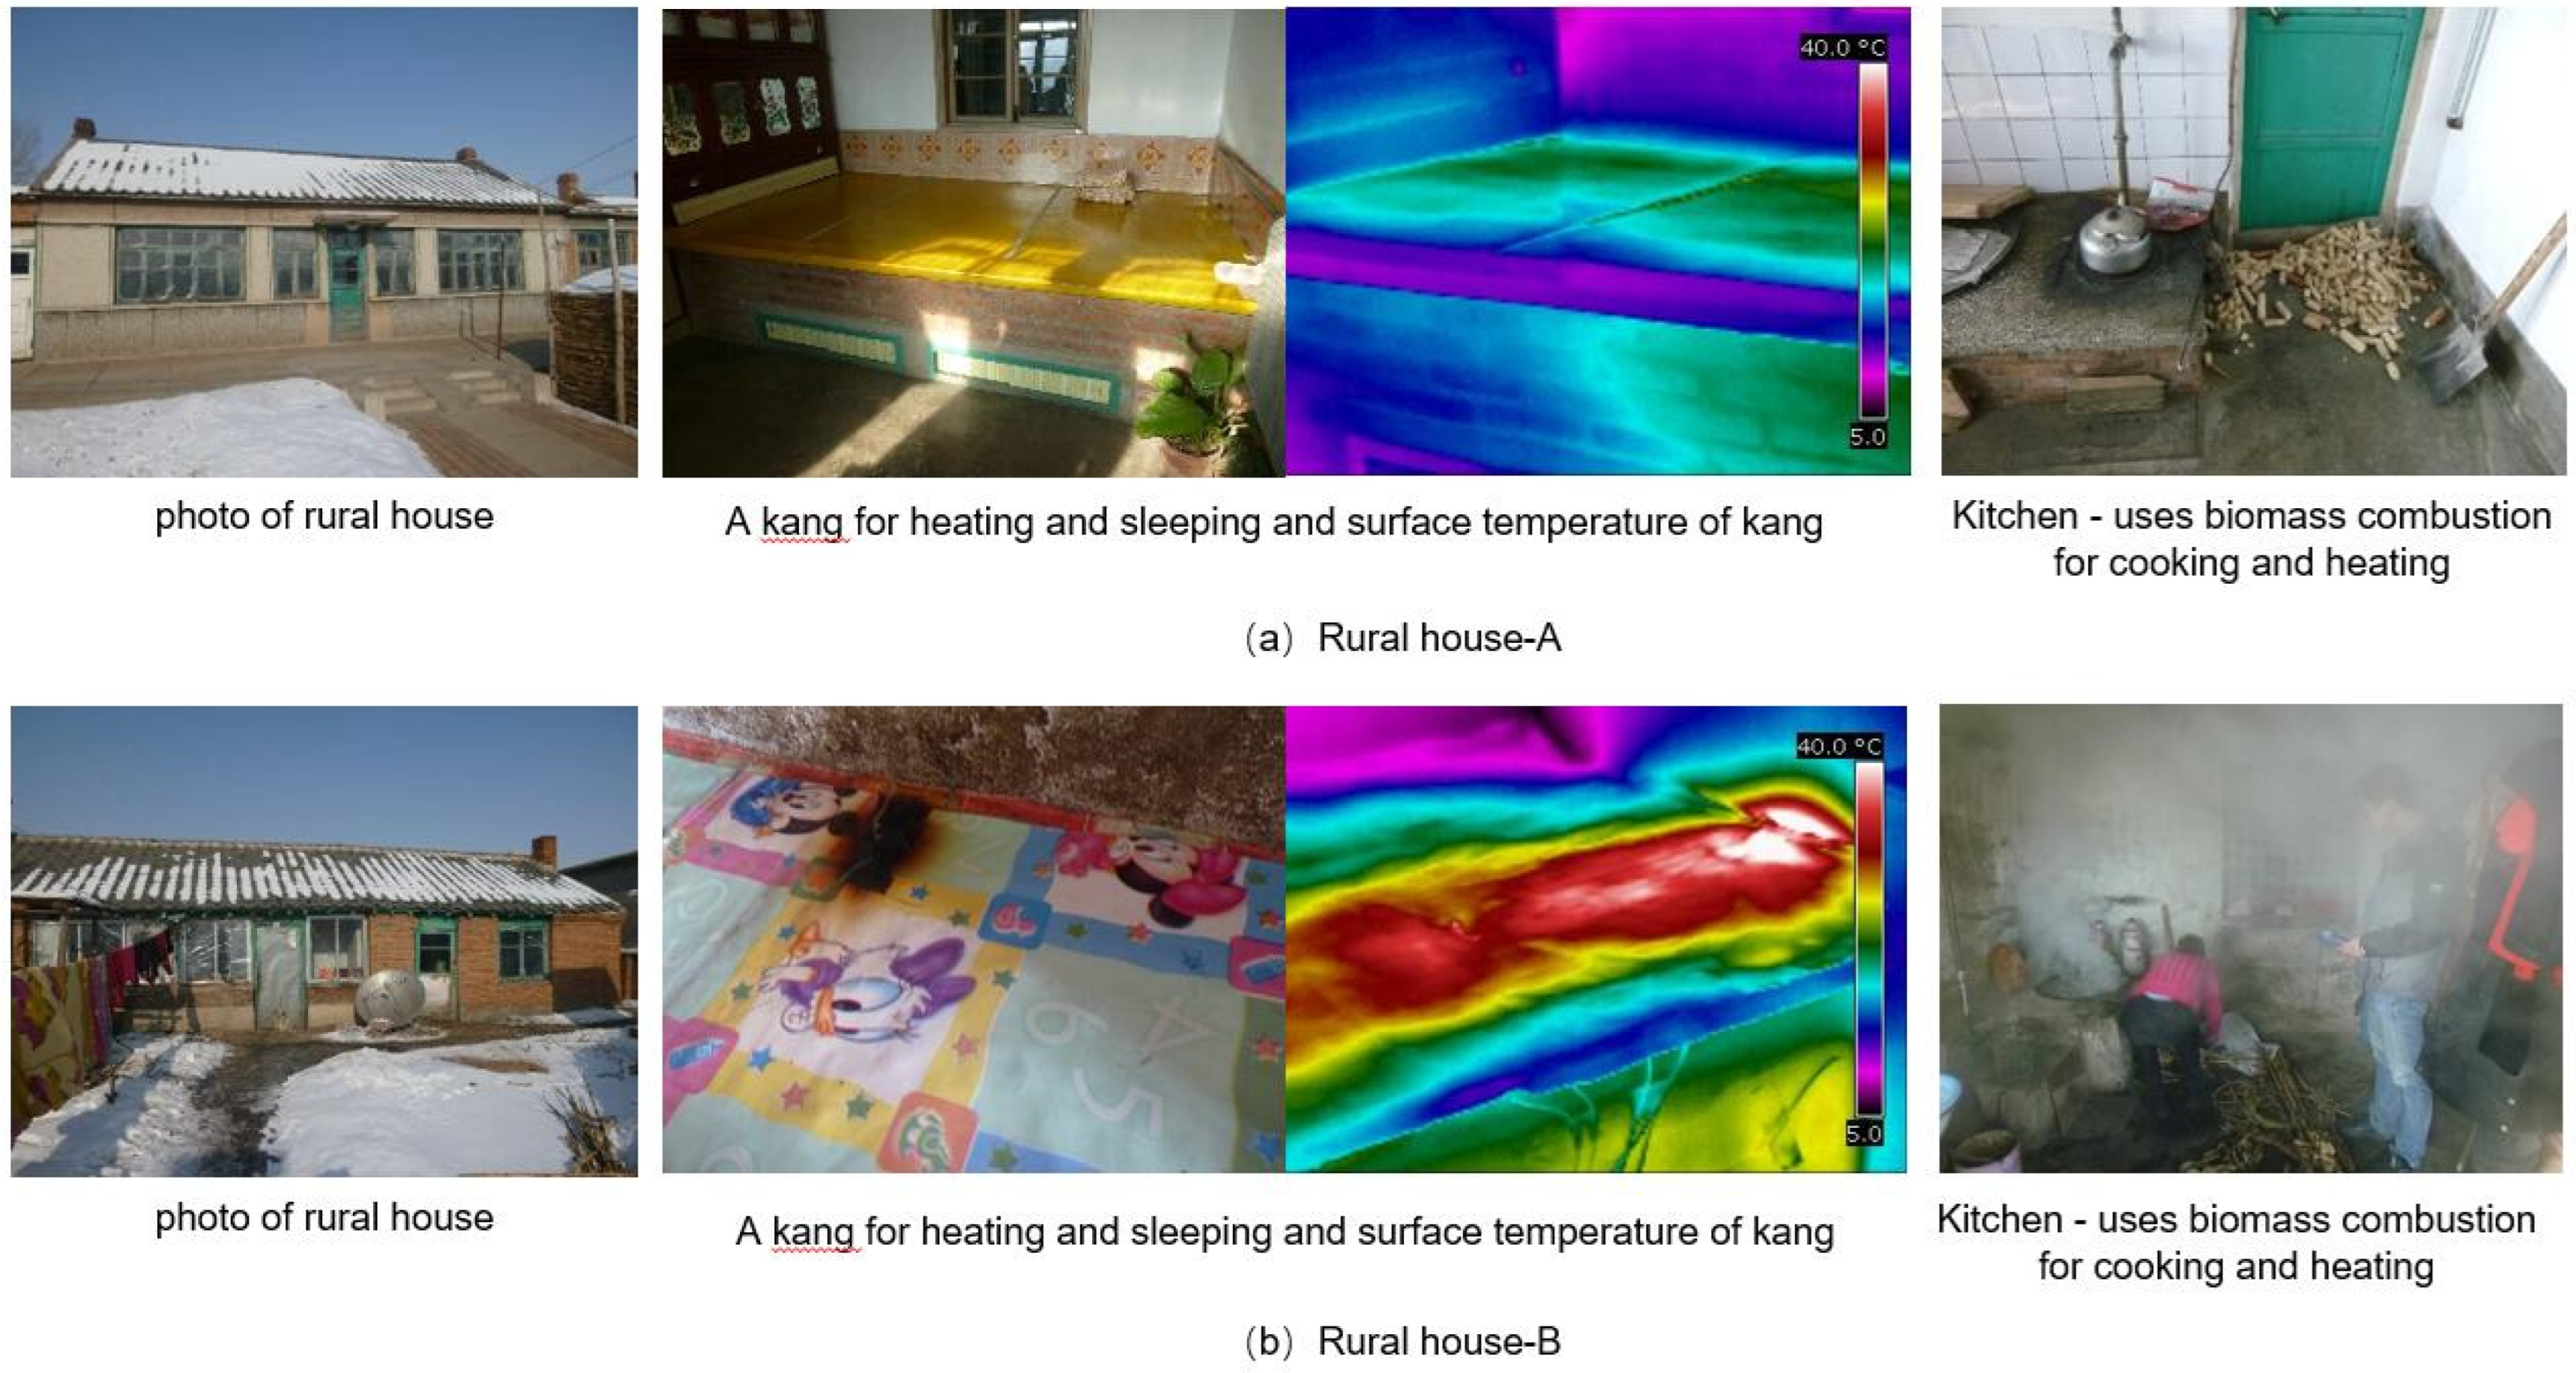
4.1. Low-Cost Clean Heating from Experience of Life

According to the survey in the mountain villages in the west of Shenyang city in northeast China, when the average outdoor temperature is −17 °C, the indoor environmental conditions of different agricultural households in the same village were considerably different, even if the same stove and kang heating method was adopted, as shown in Figure 7. The farm house was clean and tidy. The average indoor temperature of the bedroom was approximately 15 °C, and the maximum temperature difference on the surface of the heated kang was 15.8 °C. The kitchen wall was clean (and there was no evidence of smoked walls), and the IAQ was good. The average indoor temperature in the bedroom of farmhouse B was approximately 10 °C, and the maximum temperature difference on the surface of the heated kang was 44.5 °C (as observed from Figure 7b, the cover of the heated kang was burnt). The kitchen was also polluted by the combustion of biomass.
House A was warmer than House B. A closer look at the thermal protection measures of farm house A is shown in Figure 8 (in conjunction with the house layout). A schematic of the potential improvements to a farm house illustrates how three measures could be enforced to maintain warm conditions, namely: (1) Set up a door hopper. In the hallway there would be two bedrooms (through a door bucket); the kitchen and exterior door would be separated. From one perspective, this would reduce cold air infiltration from outside, and from another perspective, this would be used to block cooking air from polluting the bedroom; (2) The window is sealed with plastic film. This would not only reduce the cold air infiltration, by combatting the window gap, but also increase the temperature of the outer window and inner wall surface; (3) A buffer space is set on the north side of the house to effectively reduce the impact of heat transfer of the north envelope on the bedroom and play a role in heat preservation. These measures did not add much cost, but the insulation and indoor air quality improved considerably, and cultural practices were inherited and protected.

4.2. Ventilation

In rural North China, there are no central heating systems like in cities. Thus, heating and insulation is a basic requirement. To improve the heating demand, farmers have enforced some simple and easy measures, such as setting buffer spaces, hanging thick curtains on doors, and sealing window cracks with plastic film. These methods have raised indoor temperatures to a certain extent, but indoor air quality is poor because of poor ventilation.
Based on the investigation in the Hebei area, it was found that there were three main forms of local farm houses: (1) open-air patio enclosure type, (2) closed patio enclosure type of transparent cover plate, (3) single side courtyard enclosure type, as shown in Figure 9. Figure 9a shows the most common form of rural courtyard in North China. Generally, there are no windows on the wall facing the street or smaller windows on high ground, which is said to be for safety and due to local customs. Figure 9b is developed from Figure 9a. A roof with open windows is added above the courtyard to prevent sand and keep warmth in winter, and the upper windows are opened in summer to realize natural ventilation. However, the problem of overheating in summer and poor indoor air quality in winter, due to poor ventilation, is still very serious. The measured survey results show that, even in summer, the average indoor CO2 concentrations of the two farms in Figure 9a,b were still as high as about 1800 ppm. As shown in Figure 9c, the farm house is set in the south between the courtyard and the sun, so the warmth effect is better in winter, but the problem of the lack of a ventilation path still exists.
As mentioned earlier, because of extremely cold winter weather in northeast China, farmers use plastic film to close windows, or in the heating room. Additionally, a thick layer of cotton curtain enhances heat preservation. Heat preservation measures are further aggravated as a result of poor ventilation, owing to the poor indoor air quality, and, thus, resulting in great health risks.

4.3. Integration of Production and Life

According to the survey, although large-scale urbanization construction in recent years has caused some farmers to give up land farming and reduce farmland work, farmers have homesteads and some land to engage in planting, breeding and processing of supplied materials to improve their lives and increase their incomes. Therefore, we should consider the actual needs of farmers’ production and life according to local conditions, and engage in reasonable planning and design so that farmers can have a healthy, comfortable, clean, and tidy living environment that is convenient for work.

4.4. Limitations of This Study

The number of questionnaire samples collected for constructing the demand description model was affected by the epidemic and were not adequate, and the reasonable description of the relationship between demand model elements need to be improved on the basis of further investigation and research. The most important value of this study lies in the adoption of the structural equation model to establish a quantitative relationship model construction method to account for the numerous factors that affect the demand of the farmers’ living environment.

5. Conclusions

From the perspective of farmers’ demand, this study took rural houses in North China as the research object, adopted the structural equation model to establish the demand description model, and completed a quantitative description of the weight coefficient of influencing factors of farmers’ demand regarding living environment. The main conclusions are as follows:
  • Based on field research, a demand relationship model was constructed, which contained four major demand factors and 13 secondary indicators, namely livability and convenience, health and comfort, daily life, energy saving and living costs.
  • According to the weight coefficient of the description model, the order of the degree of influence of demand was as follows: socioeconomic status (0.260) > mental pleasure status (0.084) > physical health status (0.119). Farmers’ overall satisfaction with the four factors of demand was livability and convenience (0.449) > health and comfort (0.210) > daily life (0.199) > energy saving economy (0.123).
  • From the weight coefficients of the 13 secondary indicators obtained from the description model, it could be seen that farmers focused on the following issues: courtyard planning (0.135) > toilet use (0.126) > recreation (0.095) > thermal comfort (0.088) > air quality (0.088) > diet (0.087) > sewage and garbage treatment (0.075), etc.
  • The quantitative analysis results of the demand representation model obtained in this study could provide theoretical reference for the formation of technical approaches to improve the demand-adaptive living environment of rural houses in north China in the future, as well as the formulation and implementation of policy schemes.

Author Contributions

Conceptualization, B.C.; methodology, B.C., Y.C. (Yajing Chen) and Y.C. (Yu Chen); software, Y.C. (Yajing Chen) and Y.C. (Yu Chen); investigation, Y.C. (Yajing Chen) and B.C.; data curation, Y.C. (Yajing Chen).; writing—original draft preparation, B.C., Y.C. (Yajing Chen), J.G. and Y.C. (Yu Chen); writing—review and editing, B.C. and Y.C. (Yu Chen). All authors have read and agreed to the published version of the manuscript.

Funding

This research was funded by National Science Technology Major Project of China during the 13th Five-year Plan Period (Grant No. 2018YFD1100701-02) and National Natural Science Foundation of China (Grant No. 51978121).

Acknowledgments

The authors would like to thank the survey participants to carry out this research.

Conflicts of Interest

The authors declare no conflict of interest.

Appendix A. Questionnaire

A.
Basic information of the respondent
  • Gender
    ☐Male ☐Female
  • Age
    ☐0–18 ☐18–35 ☐36–50 ☐51–65 ☐Aged 66 or above
  • Education Level
    ☐Primary and below ☐Middle school ☐Specialized subject ☐Undergraduate course ☐Master’s degree or above
  • Are you satisfied with your financial income?
    ☐Very dissatisfied ☐Not satisfied ☐Generally satisfied ☐Satisfied ☐Very satisfied
  • Are you satisfied with your career?
    ☐Very dissatisfied ☐Not satisfied ☐Generally satisfied ☐Satisfied ☐Very satisfied
  • Are you satisfied with your health?
    ☐Very dissatisfied ☐Not satisfied ☐Generally satisfied ☐Satisfied ☐Very satisfied
  • Are you satisfied with your state of mental well-being?
    ☐Very dissatisfied ☐Not satisfied ☐Generally satisfied ☐Satisfied ☐Very satisfied
B.
Livable and convenient
  • The bathroom
    ☐Very dissatisfied ☐Not satisfied ☐Generally satisfied ☐Satisfied ☐Very satisfied
  • The toilet
    ☐Very dissatisfied ☐Not satisfied ☐Generally satisfied ☐Satisfied ☐Very satisfied
  • The kitchen
    ☐Very dissatisfied ☐Not satisfied ☐Generally satisfied ☐Satisfied ☐Very satisfied
  • The living room
    ☐Very dissatisfied ☐Not satisfied ☐Generally satisfied ☐Satisfied ☐Very satisfied
  • The yard
    ☐Very dissatisfied ☐Not satisfied ☐Generally satisfied ☐Satisfied ☐Very satisfied
C.
Health and comfort
  • What do you think of the indoor thermal environment in winter?
    ☐Very dissatisfied ☐Not satisfied ☐Generally satisfied ☐Satisfied ☐Very satisfied
  • How do you find the indoor wet environment in winter (dry)?
    ☐Very dissatisfied ☐Not satisfied ☐Generally satisfied ☐Satisfied ☐Very satisfied
  • What do you think of indoor air quality in winter?
    ☐Very dissatisfied ☐Not satisfied ☐Generally satisfied ☐Satisfied ☐Very satisfied
D.
Daily life
  • How about sewage and refuse disposal in the house?
    ☐Very dissatisfied ☐Not satisfied ☐Generally satisfied ☐Satisfied ☐Very satisfied
  • What about drinking water?
    ☐Very dissatisfied ☐Not satisfied ☐Generally satisfied ☐Satisfied ☐Very satisfied
  • What about the food situation?
    ☐Very dissatisfied ☐Not satisfied ☐Generally satisfied ☐Satisfied ☐Very satisfied
  • How about the planting and breeding in the yard?
    ☐Very dissatisfied ☐Not satisfied ☐Generally satisfied ☐Satisfied ☐Very satisfied
E.
Energy efficiency and cost of living
  • What about exhaust fans, range hoods, and other equipment?
    ☐Very dissatisfied ☐Not satisfied ☐Generally satisfied ☐Satisfied ☐Very satisfied
  • Are you willing to spend money on renovations to improve comfort?
    ☐Very dissatisfied ☐Not satisfied ☐Generally satisfied ☐Satisfied ☐Very satisfied
  • Straw and coal burning?
    ☐Very dissatisfied ☐Not satisfied ☐Generally satisfied ☐Satisfied ☐Very satisfied
  • How about the measures of energy conservation and environmental protection?
    ☐Very dissatisfied ☐Not satisfied ☐Generally satisfied ☐Satisfied ☐Very satisfied

References

  1. Ling, W.; Jin, H. Vernacular. Livable. Green: Research on Improvement of Human Settlements Environment of Rural Residential Building in North Base on Survey and Field Test. Build. Sci. 2018, 34, 147–155. [Google Scholar]
  2. Wu, Z.Z. Vernacular. Discussion on the Design of New Rural Housing Based on Regional Culture. China Hous. Facil. 2022, 1, 41–43. [Google Scholar]
  3. Yin, L.J. Study on Rural Housing Construction under the Background of Beautiful Countryside Construction. Agric. Econ. 2021, 12, 40–42. [Google Scholar]
  4. Shan, M.; Liu, Y.Q.; Ding, X.L.; Nie, Y.Z.; Yang, X.D.; Yang, W.Y. Study on Economical Thermal Insulation Technologies for Rural Building Envelops in North China. Constr. Sci. Technol. 2021, 11, 17–22. [Google Scholar]
  5. Baumgartner, J.; Schauer, J.J.; Ezzati, M.; Lu, L.; Cheng, C.; Patz, J.; Bautista, L.E. Patterns and predictors of personal exposure to indoor air pollution from biomass combustion among women and children in rural China. China. Indoor Air 2011, 21, 479–488. [Google Scholar] [CrossRef]
  6. Chen, Y.C.; Shen, G.F.; Liu, W.J.; Du, W.; Su, S.; Duan, Y.H.; Lin, N.; Zhuo, S.J.; Wang, X.L.; Xing, B.S.; et al. Field measurement and estimate of gaseous and particle pollutant emissions from cooking and space heating processes in rural households, northern China. Atmos. Environ. 2016, 125, 265–271. [Google Scholar] [CrossRef]
  7. National Development and Reform Commission: Even If China Basically Realizes Urbanization, There Will Still Be about 400 Million People Living in Rural Areas. Available online: https://baijiahao.baidu.com/s?id=1726630441775002978&wfr=spider&for=pc (accessed on 8 March 2022).
  8. Mestl, H.E.S.; Aunan, K.; Seip, H.M. Potential health benefit of reducing household solid fuel use in Shanxi province, China. Sci. Total Environ. 2006, 372, 120–132. [Google Scholar] [CrossRef]
  9. Feng, G.H.; Li, Y.; Li, X.L.; Zhang, Y.X. Suitability analysis of multi-energy complementary heating technology in rural buildings. Energy Conserv. 2021, 6, 11–14. [Google Scholar]
  10. Li, Q.; Ma, L.Y.; Li, D.; Arıcı, M.; Yıldız, Ç.; Wang, Z.; Liu, Y. Thermoeconomic analysis of a wall incorporating phase change material in a rural residence located in northeast China. Sustain. Energy Technol. Assess. 2021, 44, 101091. [Google Scholar] [CrossRef]
  11. Pan, W.T.; Mei, H.Y. A Design Strategy for Energy-Efficient Rural Houses in Severe Cold Regions. Int. J. Environ. Res. Public Health 2020, 17, 6481. [Google Scholar] [CrossRef]
  12. Guan, T.; Tang, Z.X.; Liu, W.J. Ventilation Status Analysis and Optimization Strategy Research of Rural Self-built Houses in Zhengzhou. DC Stud. 2021, 3, 119–123. [Google Scholar]
  13. Zhang, H.B.; Chen, Y.; Mao, Z.D. Study on the Indoor Air Quality of Rural Residence of Elderly in Severe Cold Area. Build. Sci. 2021, 37, 130–136. [Google Scholar]
  14. Li, C.; Guo, M.M.; Li, S.Z.; Feldman, M. The Impact of the Anti-Poverty Relocation and Settlement Program on Rural Households’ Well-Being and Ecosystem Dependence: Evidence from Western China. Int. J. Soc. Nat. Resour. 2021, 34, 40–59. [Google Scholar] [CrossRef]
  15. Wang, J.; Zhao, B.L.; Fan, W.; Yang, Y.; Zhao, J.L. A Combined Shape Grammar and Housing-Space Demand Approach: Customized Mass Housing Design in rural areas of the North China Plain. Nexus Netw. J. 2022, 24, 5–23. [Google Scholar] [CrossRef]
  16. Dou, H.J.; Ma, L.B.; Li, H.; Bo, J.; Fang, F. Impact evaluation and driving type identification of human factors on rural human settlement environment: Taking Gansu Province, China as an example. Open Geosci. 2020, 12, 1324–1337. [Google Scholar] [CrossRef]
  17. Torresin, S.; Albatici, R.; Aletta, F.; Babich, F.; Oberman, T.; Stawinoga, A.E.; Kang, J. Indoor soundscapes at home during the COVID-19 lockdown in London—Part I: Associations between the perception of the acoustic environment, occupants’ activity and well-being. Appl. Acoust. 2021, 183, 108305. [Google Scholar] [CrossRef]
  18. Torresin, S.; Albatici, R.; Aletta, F.; Babich, F.; Oberman, T.; Stawinoga, A.E.; Kang, J. Indoor soundscapes at home during the COVID-19 lockdown in London—Part II: A structural equation model for comfort, content, and well-being. Appl. Acoust. 2022, 185, 108379. [Google Scholar] [CrossRef]
  19. Chen, Y.; Chen, B.; Deng, J.; Xu, S.W. The integration model of objective and subjective data of residential indoor environment quality in Northeast China based on structural equation mo deling. Build. Simul. 2022, 15, 741–754. [Google Scholar] [CrossRef]
  20. Brauer, C.; Budtz-Jrgensen, E.; Mikkelsen, S. Structural equation analysis of the causal relationship between health and perceived indoor environment. Int. Arch. Occup. Env. Health 2008, 81, 769–776. [Google Scholar] [CrossRef]
  21. Mu, J.Y.; Zhang, S.S.; Kang, J. Estimation of the quality of life in housing for the elderly based on a structural equation model. J. Hous. Built Environ. 2021, 4, 1–27. [Google Scholar] [CrossRef]
  22. Kamaruzzaman, S.N.; Egbu, C.O.; Zawawi, E.M.; Karim, S.B.; Woon, C.J. Occupants’ satisfaction toward building environmental quality structural equation modeling approach. Env. Monit. Assess. 2015, 187, 242. [Google Scholar] [CrossRef]
  23. Kim, A.; Wang, S.Q.; Kim, J.E.; Reed, D. Indoor/Outdoor Environmental Parameters and Window-Opening Behavior: A Structural Equation Modeling Analysis. Buildings 2019, 9, 94. [Google Scholar] [CrossRef] [Green Version]
  24. Chen, H.; Du, Y.K.; Jia, G.Z. Application of factor analysis in structural validity test of Family Burden scale. Chin. J. Health Stat. 2003, 02, 30–31. [Google Scholar]
  25. Chen, Y. Research on the Descriptive Model of the Correlative Influence between Health and Indoor Environment Ofresidential Buildings. Ph.D. Thesis, Dalian University of Technology, Dalian, China, 2021. [Google Scholar]
  26. Burke, J.C.; Mackenzie, S.B.; Podsakoff, P.M. A Critical Review of Construct Indicators and Measurement Model Misspecification in Marketing and Consumer Research. J. Consum. Res. 2003, 2, 199–218. [Google Scholar]
  27. Urbach, N.; Ahlemann, F. Structural Equation Modeling in Information Systems Research Using Partial Least Squares. J. Inf. Technol. Theory Appl. 2010, 11, 27–28. [Google Scholar]
  28. Chin, W.W.; Marcoulides, G. The Partial Least Squares Approach to Structural Equation Modeling. Adv. Hosp. Lsure 1998, 295, 295–336. [Google Scholar]
  29. Lohmöller, J.B. Latent Variable Path Modeling with Partial Least Squares, 2nd ed.; Physica-Verlag HD: Heidelberg, Germany, 2013; pp. 49–55. [Google Scholar]
  30. Diamantopoulos, A.; Siguaw, J.A. Formative versus Reflective Indicators in Organizational Measure Development: A Comparison and Empirical Illustration. Br. J. Manag. 2006, 17, 263–283. [Google Scholar] [CrossRef]
  31. Herrmann, A.; Huber, F.; Meyer, F.; Vogel, J.; Vollhardt, K. Kausalmodellierung mit Partial Least Squares; Betr. Verl. Dr. Th. Gabler Gmbh; Gabler Verlag Wiesbaden: Wiesbaden, Germany, 2007. [Google Scholar] [CrossRef]
  32. Sarstedt, M.; Ringle, C.M.; Hair, J.F. Partial Least Squares Structural Equation Modeling, 5th ed.; Handbook of Market Research; Springer: Berlin/Heidelberg, Germany, 2021; pp. 15–22. [Google Scholar]
  33. Stone, M.A. Cross-Validatory Choice and Assessment of Statistical Predictions. J. R. Stat. Soc. 1974, 36, 111–147. [Google Scholar] [CrossRef]
  34. Braveman, P.; Egerter, S.; Williams, D.R. The Social Determinants of Health: Coming of Age. Annu. Rev. Public Health 2011, 32, 381–398. [Google Scholar] [CrossRef] [Green Version]
Figure 1. Geographical distribution of the survey.
Buildings 12 00926 g001
Figure 2. Results of first-order and second-order confirmatory factorial analysis of demand. (a) First-order confirmatory factor analysis; (b) Second-order confirmatory fac-tor analysis.
Buildings 12 00926 g002
Figure 3. Diagram of demand description model.
Buildings 12 00926 g003
Figure 4. Courtyards of rural residential buildings in northern China. (a) Rural houses in Xingtai City in the Hebei Province. (b) Rural Houses in Shenyang and Dalian in the Liaoning Province.
Buildings 12 00926 g004aBuildings 12 00926 g004b
Figure 5. Energy consumption patterns of rural life in northern China. (a) Natural gas furnace used for cooking and heating, sleeping beds, small family workshops. Rural Houses in Xingtai City in the Hebei Province. (b) Stoves and coal heaters, kang, used for sleeping and heating. Rural houses in Dalian in the Liaoning Province. (c) Fire kang outside. Ground kang. Korean rural house in the Qiqihar City in the Heilongjiang Province.
Buildings 12 00926 g005
Figure 6. A quantitative demand description model for rural housing in northern China.
Buildings 12 00926 g006
Figure 7. Comparison of indoor environment between two rural houses in Xikoushan Village, Shenyang, Northeast China.
Buildings 12 00926 g007
Figure 8. Schematic of heat preservation measures for a rural house in the Xikaoshan village of Shenyang.
Buildings 12 00926 g008
Figure 9. Spatial layout of typical farm houses in the Hebei Province. (a) Open courtyard. (b) Enclosed courtyard. (c) Partially open courtyard.
Buildings 12 00926 g009
Table 1. Measured parameters and instruments.
Measured ParametersMeasurement InstrumentInstrument Accuracy
indoor and outdoor air temperature and humidityTokyo, Japan, T&D, TR-72UI temperature and humidity recorder±0.1 °C; ±5%
interior and exterior wall temperature of building wallsBeijing, China, Tsinghua Tongfang, RHLOG wall thermometer0.3 °C; ±5%
black bulb temperatureBeijing, China, Beijing Century Jiantong, JNT-04 black bulb radiation thermometer0.1 °C
CO2 concentrationMinnesota, USA, TSI-7515 CO2 tester±3%
PM2.5 concentrationKobe, Japan, SHINYEI, PM2.5 tester±1%
PM10 concentrationMinnesota, USA, TSI-510 explosion-proof digital dust meter0.001 mg/m3
CO concentrationMinnesota, USA, TSI-7515 CO tester±3%
smoke exhaust temperature, and pollutant concentration in the chimneyBlack Forest, Germany, Testo-350 flue gas analyzer-
Table 2. Reliability test results.
Latent VariablesNumber of ItemsCronbach’s Alpha (α)Cronbach’s Alpha (α) Based on Normalized Terms
Livability and convenience50.8500.851
Health and comfort 30.7980.799
Daily life 30.7030.720
Energy efficiency and cost of living 20.4360.436
Table 3. Validity test results.
Latent VariablesKMOBartlett’s Test
(p-Value)
Observation
Variable
Factor Loading
Livability and convenience0.822<0.001Bathroom0.802
Toilet0.776
Kitchen0.825
Living room0.780
Yard0.777
Health and comfort 0.695<0.001Thermal environment0.854
Wet environment0.873
Air quality0.805
Daily life 0.649<0.001Sewage and garbage0.721
Drinking water0.836
Food products0.844
Energy efficiency and cost of living 0.500<0.001Modern equipment0.800
Energy saving measures0.800
Table 4. Fitting coefficients for first-order confirmatory factor analysis.
Fitting Indexχ2/dfRMSEAGFIAGFICFITLIIFI
Evaluation standard<2<0.08>0.90>0.85>0.90>0.90>0.90
Model
statistics
1.9730.0750.9150.8640.9390.9170.941
Fitting effectYesYesYesYesYesYesYes
Table 5. Fitting coefficients for first-order confirmatory factor analysis.
Fitting Indexχ2/dfRMSEAGFIAGFICFITLIIFI
Evaluation standard<2<0.08>0.90>0.85>0.90>0.90>0.90
Model statistics1.9340.0730.9120.8640.9400.9200.941
Fitting effectYesYesYesYesYesYesYes
Table 6. Evaluation results of measurement model of demand description models.
Latent VariablesIndicatorsExternal WeightsTSignificance (p-Value)VIF
Livability and convenienceBathroom0.1239.1230.0002.209
Toilet0.35210.4550.0001.863
Kitchen0.1809.8030.0001.917
Sitting room0.26710.2960.0001.585
Yard0.3789.2140.0001.742
Health and comfortThermal environment0.5245.8080.0001.486
Wet environment0.2175.4610.0001.507
Air quality0.5267.4620.0001.198
Daily lifeSewage and garbage0.4766.5320.0001.153
Drinking water0.2486.5630.0001.553
Food products0.5488.0990.0001.614
Energy efficiency and cost of livingModern equipment0.7025.2240.0001.075
Energy saving measures0.5503.7400.0001.075
Socioeconomic stateEducation level0.0260.8020.4231.071
Income level0.4888.6500.0001.946
Occupational reputation0.5965.6600.0002.027
Table 7. Evaluation results of structural model of demand representation models.
RelationshipPath
Coefficient
TSignificance (p-Value)f2R2Q2
Livable and convenient → Demand0.44914.3890.00016.9450.9960.311
Health and comfort → Demand0.2106.9140.0005.6960.9960.311
Daily life → Demand0.1998.7790.0004.4770.9960.311
Energy efficiency and cost of living → Demand0.1235.2200.0002.6440.9960.311
Physical health → Demand0.0912.8960.0001.3070.9960.311
Mental pleasure → Demand0.0845.2220.0001.1190.9960.311
Socioeconomic status → Demand0.1804.1740.0004.6750.9960.311
Physical health → Mental pleasure0.3295.0990.0000.1190.2840.224
Socioeconomic status → Physical health0.4582.4660.0000.2650.2100.187
Socioeconomic status → Mental pleasure0.2956.7010.0000.0960.2840.224
Table 8. Validation of specific indirect effects of demand representation models.
RelationshipInitial SampleSample MeanStandard DeviationTp
Socioeconomic status → Physical health → Demand0.0420.0410.0133.1880.001
Socioeconomic status → Physical health → Mental pleasure → Demand0.0130.0120.0062.0660.039
Socioeconomic status → Mental pleasure → Demand0.0250.0250.0122.0930.036
Physical health → Mental pleasure→ Demand0.0280.0260.0122.3670.018
Table 9. Validation of specific indirect effects of demand representation models.
Demand FactorsDemand IndexDemand Impact Weight
Livability and convenienceBathroom0.044
Toilet0.126
Kitchen0.064
Sitting room0.095
Yard0.135
Health and comfortThermal environment0.088
Wet environment0.036
Air quality0.088
Daily lifeSewage and garbage0.075
Drinking water0.039
Food products0.087
Energy efficiency and cost of livingModern equipment0.069
Energy saving measures0.054
Publisher’s Note: MDPI stays neutral with regard to jurisdictional claims in published maps and institutional affiliations.

