1. Introduction
Since the Ministry of Housing and Urban-rural Development of the People’s Republic of China (MOHURD) issued the Evaluation Criterion of Green Buildings for the first time in 2006, China has been constantly pushing the certification of green buildings for many years, hoping to promote the transformation and uptake of green buildings. In 2013, green buildings in China saw rapid growth and renewed interest among the community. The General Office of the State Council issued the Action Plan of Green Buildings co-formulated by National Development and Reform Commission (NDRC) and MOHURD to clarify developmental goals of green buildings at the national level. This plan was upgraded as a national strategy in the central urban conference in 2015. In May 2017, MOHURD issued the “13th Five-year Plan” of the Building Industry Development, requiring all new urban green buildings in Chinese cities and towns would reach a higher energy-saving standard in 2020. In addition, it was anticipated that in urban areas, green buildings would account for at least 50% of new buildings. Since the green building rating system was implemented in 2008, the total gross floor area of green buildings in cities and towns has exceeded 2.5 billion m2 end of 2018, showing that green buildings accounted for over 40% of new urban green buildings in cities and towns. A total of 10,139 projects have received green certification which shows that green building development in China has made remarkable progress in recent years. Based on this background, it is particularly important to study the efficiency of green building implementation management in China.
It is widely believed that green buildings represent positive outcomes, including energy conservation, environmental conservation, low carbon emission, sustainable development and people friendly spaces. Its contributions and significance are increasingly being recognized and considered to be highly matured. The Building Industry Report (2018) claims that for both new and renovated green buildings, their asset values are higher than traditional buildings by about 7%, showing that going green makes commercial sense. As many countries have started promoting energy conservation and emission reduction of buildings and established green building certification schemes, the scale of development and implementation efficiency, particularly around input–output efficiency at the design and construction process has attracted the attention of researchers. For example, Son et al. (2015) studied key factors affecting operational performance of green building projects and verified the relationship between those factors and green buildings’ project performance [
1]. Li et al. (2015) analyzed the economic viability of green buildings and established incremental costs during its life circle and discussed policy tools available for governments to reduce those incremental costs [
2]. Vyas et al. (2016) considered importance of green buildings’ comprehensive design method and conducted a benchmark test for green building attributes, to utilize limited resources to enhance sustainable performance of buildings [
3]. Khoshbakht et al. (2017) used SWOT analysis to review various predictive methods of green buildings’ management efficiency and provided a tool to comprehensively evaluate green buildings’ benefits [
4]. From the above, we can get the existing studies have offered very useful ideas and methods to analyze the benefits of green buildings, however, they did not further analyze critical factors affecting green buildings’ implementation efficiency. Chinese scholars have done some work on this regard which reflect the green building situation in China. To be specific, Sun (2015) analyzed and evaluated economic benefits of green buildings from power and water saving perspectives [
5]. Mao (2015) identified and measured growth factors affecting green buildings from the perspectives of the government and private sectors [
6]. Wu et al. (2022) studied the drivers of construction waste minimization, composition, demolition management and information sharing in it, using Hong Kong as an example [
7,
8,
9,
10]. Liu et al. (2021) constructed a structural model of green building development using structural equation modeling and AMOS software and explored the key influence paths and key influencing factors that drive green building development [
11]. Wang et al. (2022) Studies have concluded that green buildings are beneficial to public health or can reduce the threat to people’s health from buildings [
12]. Du et al. (2022) effectively analyzed the factors influencing carbon emissions of green buildings in China from the perspective of space and time [
13]. Wang et al. (2022) used keyword frequency aggregation, hierarchical analysis, and entropy method to quantitatively analyze the factors influencing the cost of green buildings and used fuzzy object element method to evaluate the influencing factors of green building cost [
14]. Guo et al. (2022) studied the current situation of green building and its development mechanism based on user human-causal interaction mechanism in the context of the development of the new crown epidemic [
15]. Domestic and foreign research scholars have studied the definition and measurement of green building implementation and management efficiency, green building implementation and management efficiency and its improvement path, but through careful sorting and comparison of the existing research results, it is found that the research for the construction industry has not yet formed a unified understanding, and most of them focus on the micro level, which is still a long way from the application and implementation; the traditional efficiency measurement methods have a large number of errors and the universality is not strong; the research scope and subjects of green building influence factors are scattered, and there is a lack of systematic attention to the inner driving factors of green building eco-efficiency.
2. Literature Review
To meet the most basic survival needs, the intensity of human demand for green products and technologies is increasing, preparing the necessary conceptual and market base for the research, development, and diffusion of green technologies [
16]. Therefore, it is urgent to carry out the topic of efficiency measurement. Currently, the methods of measuring efficiency are frontier analysis represented by the exponential method and production function regression analysis and non-frontier analysis represented by parametric and non-parametric analysis. Xu et al. (2020) measured the efficiency of urbanization based on provincial panel data from 2003–2017 in China under environmental regulation using the SBM model considering non-expected output, and the study showed that both green technological innovation and environmental regulation have significant promotion effects on the improvement of urbanization efficiency [
17]. Yue et al. (2018) measured the efficiency of green technology innovation in China’s provinces through a directional distance function based on slack variables [
18]. Li et al. (2021) measured and analyzed the eco-efficiency of five northwestern provinces in the last 20 years through the SBM-DEA super-efficiency model considering non-expected output [
19]. Zhang et al. (2020) used stochastic frontier function to construct a three-stage combined efficiency measurement model to measure green technology innovation in high-tech industries [
20]. Chen et al. (2015) used stochastic frontier analysis (SFA) combined with magnitude adjustment measure (RAM) to construct a RAM-SFA-RAM model to analyze the technological R&D efficiency of large and medium-sized industrial enterprises at the provincial level in China [
21]. Peng et al. (2017) used the Super-SBM model to measure green innovation efficiency and showed that there is a single threshold between green innovation efficiency and formal environmental regulation, with a “U” shaped relationship between the two [
22]. Xiang (2020) measured carbon productivity in the construction industry by constructing a dual model with spatial Durbin and threshold regression [
23]. Kang (2016) measured the green technology innovation efficiency of 30 provinces (cities) in China from 2008 to 2013 using a three-stage DEA method and analyzed the influence of external environmental factors on green technology innovation efficiency through a second-stage SFA regression model [
24]. Chen et al. (2021) used the super-efficient SBM-DEA model to measure the provincial innovation efficiency influenced by the mismatch of innovation resources between industry, academia and research [
25]. Chi et al. used a non-Archimedean mode infinitesimal C
2R model with data envelopment approach (DEA) to measure the combined efficiency values of each bank [
26].
As the standard of living of our citizens continues to improve, the demand for a better living environment is also increasing. This demand has led to a sensational “green revolution” in the real estate industry. “The term “green efficiency” is often mentioned, which refers to the effect of resource conservation and environmental protection of buildings in the physical phase. In the field of research on the green built environment, Olgyay et al. (2004) emphasize the importance of reducing the ecological impact of energy consumption in buildings [
27]. Some scholars have conducted studies on factors related to the development of green buildings that affect them [
28,
29,
30,
31]. Due to geographical differences, scholars have also proposed corresponding energy saving measures and systems for each country’s geographical differences, among which, Qiao et al. (2019) analyzed the special characteristics of existing green building renovation and constructed a research framework of multi-objective multi-objective integration and optimization for its green building characteristics [
32]. Sattary et al. (2016) and Chel et al. (2017) analyzed the impact of energy use on building economic and environmental impacts in the pre-, mid-, and post-construction periods of the project [
33,
34]. Ayodeji et al. (2017), Chen et al. (2019), and Iftikhar et al. (2016) examine the efficiency of green building implementation and carbon emission efficiency in different geographical areas to achieve green building carbon emission reduction [
35,
36,
37]. Research targeting green buildings can not only improve the ecological performance of existing buildings, but also mitigate the negative effects of ecological pollution to a certain extent. Therefore, Liu et al. (2009) and Ibn-Mohammed et al. (2014) explored the economic benefits, investment decisions of energy efficiency retrofit projects in existing buildings [
38,
39], respectively. Wu et al. (2018) constructed a conceptual model of the factors influencing the benefit distribution of green energy efficiency retrofit projects in existing buildings and proposed a benefit sharing policy [
40].Brambilla et al. (2018), Sven Cui et al. (2014), and Ting Li et al. (2016) dissected the application effects of green building energy efficiency technologies based on different positions to reveal the energy saving rate and comprehensive benefits of improved energy efficiency technologies [
41,
42,
43]. Lai (2020) evaluated and compared the green effect of assembled buildings with traditional buildings by establishing a resource depletion index RDI calculation model [
44].Tahmasebinia, Solla et al. (2022) implemented Bim energy analysis, green building index quantification and Monte Carlo simulation for estimating building energy performance based on regression methods [
45,
46]. Lee et al. (2022) analyzed the effect of mandatory building efficiency on the price premium of green buildings [
47]. Assylbekov et al. (2022) analyzed the specific reasons affecting the development of green buildings in Kazakhstan as an example [
48]. Elshafei et al. (2021) conducted a study on the extensive use of green building parameters based on genetic algorithms [
49]. Ouchao Zhang et al. (2022) analyzed the risk factors of green building projects based on AHP-Kaiser model from the perspective of disaster vulnerability analysis of green building projects [
50]. Han et al. (2020) studied the relationship between safety inputs, construction employees’ safety perceptions and behavioral performance based on structural equation modeling [
51]. Fu et al. (2022) studied the public acceptance of 5G base stations and explored the factors influencing the stereotypes of wastewater treatment plants based on eye-hole tracking roommates [
52,
53]. Huo et al. (2021) studied the relationship between green buildings and carbon emissions in China [
54,
55,
56]. Zhang et al. (2021) studied the impact of environmental regulations on the efficiency of the construction industry [
57].
In recent years, the management policies, evaluation standards, and technical selection of green buildings in China have been constantly improved. However, in reality, the implementation efficiency of Chinese green buildings is relatively lower than that of the developed countries. One of the reasons for such disparity is the lack of studies that could be used to benchmark green building efficiency among different countries. There is a very clear gap in the literature on comprehensive studies that deal with the evaluation of the efficiency of green buildings, relevant computing methods, and how to benchmark green buildings from a country to another or from different regions of a country. Especially on the input–output efficiency measurement of green buildings and the regional differences in green building development. In order to overcome this knowledge gap, using Data Envelopment Analysis (DEA), this study measured the green buildings’ input–output efficiency and analyzed the regional difference of green buildings developed in China. The aim is to unearth factors that restrict the development of green buildings and how to improve their performance in order for all stakeholders including the government to benefit from green building implementation. This paper provides the findings of that study and is organized as follows. The next section discusses the research method in detail which includes an explanation of the DEA technique, the data used for the study and the parameters are selected to represent inputs and outputs of green buildings. Next, the results are presented under two headings, namely, static, and dynamic analysis which uncover the regional differences of efficiency. Finally, the paper summarizes the implications arising out of this study, limitations, and further research potential.
3. Research Method
3.1. Selection of the DEA Model
DEA is an analytical method of constructing a linear programming model to evaluate relatively efficiency (Effective DEA) of Decision-Making Units (DMUs). This method is not affected by dimensions but has objectivity, especially for evaluating efficiency of participant projects with several inputs and outputs. The efficiency measurement of Constant Returns to Scale (CRS) and Variable Return to Scale (VRS) in DEA would be used to evaluate the green buildings’ input–output efficiency. If there are
k DMUs, it means that green buildings in
k areas (provinces, municipalities, autonomous regions) participated in the evaluation. The
rth DMU is marked as DMU
r (
r = 1, 2, …,
k). Each DMU has
m input indices, showing the input in green buildings of each region. The
ith input is marked as
xir = (
i = 1, 2, …,
m). There are
n output indices, showing the output in green buildings of each region. The
jth output is marked as
vjr (
j = 1, 2, …,
n),
θ stands for the comprehensive input–output benefit index,
ε is non-Archimedean infinitesimal, and
λ refers to the input–output weight variable of each DMU,
and
represent the comprehensive value of input and output for green buildings (DMUs) respectively, to judge green buildings’ implementation efficiency,
s− is the input slack variable and
s+ represents the output slack variable to respectively show that green buildings’ management reaches effective DEA, but needs to reduce input and to increase output. To sum up, the specific CRS model (Charnes et al. 1978) of the input–output efficiency as implementing green buildings is expressed as [
58]:
In the formula, Suppose that there are n decision units, denoted as DMUj (j = 1, 2, …, n), each decision unit has m inputs, denoted as Xi (i = 1, 2, …, m), the input weights denoted as vi (i = 1, 2, …, m), and the output of S, denoted as Yr (r = 1, 2, …, s), the output weight is expressed as ur (r = 1, 2, …, s).
When there is the optimal solution θ = 1, s+ = 0, and s = 0, DMUr has the strongest Effective DEA, showing that this region has reached the optimal output under the existing input for implementing green buildings; if θ = 1, s+ ≠ 0 or s− ≠ 0, DMUr has a weak DEA effective, showing that the green buildings’ implementation efficiency in this region is relatively good, and some input–output adjustments need to be made; if θ < 1, DMUr is non-effective DEA, showing that the implementation of green buildings in this area is invalid, and the original output can be maintained by reducing the input to the ratio of original input θ through combination. Moreover, if θ gets closer to 1, it shows that the overall efficiency green buildings’ in this region is more effective. On the contrary, the efficiency is lower.
By adding constraint condition to CRS model and transforming it into VRS model with variable returns to scale, we can effectively measure its pure technical efficiency (vrste) and scale efficiency, and . Among them, pure technical efficiency refers to the production efficiency of DMU input factors in a certain (optimal scale), which reflects the effectiveness of green building management and technology use. Scale efficiency refers to the effect of industrial structure on output unit through optimal allocation, which reflects the matching degree between the input and output of green building implementation.
3.2. The Malmquist Index Model
The DEA-Malmquist exponential model has its own advantages in studying the dynamic development law of green building implementation efficiency. The exponential method achieves effective decomposition of total factor productivity (TFP) by constructing distance function. Its principle is: assuming that within
t period, there are
k DMUs. The ith of the rth DMU is
, while the
jth output of the
rth DMU is
. According to the DEA model, the distance function of Malmquist index
and Malmquist index from
t to
t + 1 gives as follows:
M > 1 shows that productivity in green buildings is present in the rising tendency,
M = 1 indicates that change is relatively stagnant, otherwise, it is declining. Under the assumption of the CRS model, this formula decomposes the index into the technical progress change index (techch) and technical efficiency change data (effch) to stand for technical progress and technical efficiency respectively. If effch > 1, it shows that relative technical efficiency of green buildings is improved; otherwise, If techch > 1, it shows that technological progress and innovation can promote green building management, and vice versa. Any index of 1 indicates relative stationary and no obvious change. Furthermore, in 1994, Fare et al. further decomposed effch into pure technical efficiency change (pech) and scale efficiency change (sech) combined with variable returns to scale (VRS), expressed as [
59]:
Pech measures the gap (the management level of DMUs) between actual technical efficiency and benchmark technical efficiency in implementation of green buildings, while sech measures the gap (the investment scale) between actual technical scale and optimal technical scale in green buildings’ implementation. pech > 1 shows that technical management level of green buildings has improved; if sech > 1, the DMU is gradually getting closer to the optimal scale. Moreover, tfpch > 1 shows the improvement of total efficiency; tfpch = 1 represents total efficiency is unchanged; while tfpch < 1 means the reduction of total efficiency.
3.3. Construction of the Index System and Data Sources
The DEA was used to measure the input–output efficiency of green buildings implementation by selecting suitable parameters. Among which, “input” parameters represent the changes of direct and indirect factors affecting green buildings’ implementation and operation. The “output” parameters show operational achievements through volume measures. These are reflected in output measures, such as gross floor area, value and number of projects obtaining green certification. There is a quantity restraint between DMUs and the number of parameters used in DEA. DMUs should be no less than double the total number of all input and output parameters to avoid distortion of model’s operation. In order to avoid high correlation between input parameters or output parameters, Pearson Correlation analysis was carried out for the parameters, so as to verify rationality of their inclusion. Through collecting and reviewing relevant literature, input and output indicators were compiled, and on this basis, five input parameters and three output parameters were selected by combining the current availability of data in China and the requirements of DEA model and data availability, as shown in
Table 1. Among the input parameters, the employees of construction companies mainly refer to those who have been involved in the construction, consultation, and evaluation of green buildings. The per capita disposable income indicator refers to the value of consumption as an input which is 30% of the total per capita income of Chinese residents living in those areas, reflecting the operation potential of green buildings. labor productivity refers to the efficiency of green building products produced by construction workers during the reporting period. Technical equipment ratio refers to the ratio of the net value of machinery and equipment owned by construction companies to the total number of workers at the end of the year, which shows the degree of efficiency of these machinery and equipment. Power equipment ratio refers to the total energy consumption of self-owned machinery and equipment used in construction to the total number of workers at the end of the year. The ratios regarding equipment reflect their efficiency as well their environmental sustainability measured using energy consumption. Among the output indicators, the value addition of the green building sub-sector refers to the total value created in the production and operation of green construction projects and their products; the number and area of green certified buildings reflect the scale of green building development in the region. These indicators can better reflect the development status and value orientation of green building sub-sector in Chinese provinces, municipalities, and autonomous regions.
Green building construction became extremely popular during 2011–2012, the number of green buildings completed and certified in 2013 was extraordinarily high. Hence, this year was used as the beginning of the review period in this research. Based on Chinese green buildings’ development status a total number of 30 provinces (districts and cities, excluding Tibet, Hong Kong, Macao and Taiwan) were selected for this research. The input–output panel data from 2017 to 2021 as used to estimate the implementation efficiency of green buildings. The descriptive statistical characteristics of the sample are shown in
Table 2. Data were sourced from the National Green Buildings’ Evaluation Identification Statistics Report (2017–2021) compiled by Technology and Industry Development Center of MOHURD, Chinese Statistical Yearbook (2017–2021), the China Construction Statistical Yearbook (2017–2021) as well statistical yearbooks in provinces, municipalities, and autonomous regions.
Explanation on the sample size of 150: 5 ∗ 30 = 150, where 5 refers to the five years from 2017–2021 and 30 refers to the 30 provincial areas that are the object of the study.
It could be observed from
Table 2 that the standard deviation and range between parameters were very high, showing a considerable difference among the provinces.
4. Static Measurement of Green Buildings’ Management Efficiency
Input–output data of Green buildings’ provinces, municipalities and autonomous regions were imported to DEAP2.1 software. The VRS model and CRS model were used to measure the overall efficiency, pure technical efficiency and scale efficiency of implementation efficiency of green buildings in each region during 2017–2021.
4.1. Overall Efficiency and Regional Differences of Green Buildings’ Implementation Management
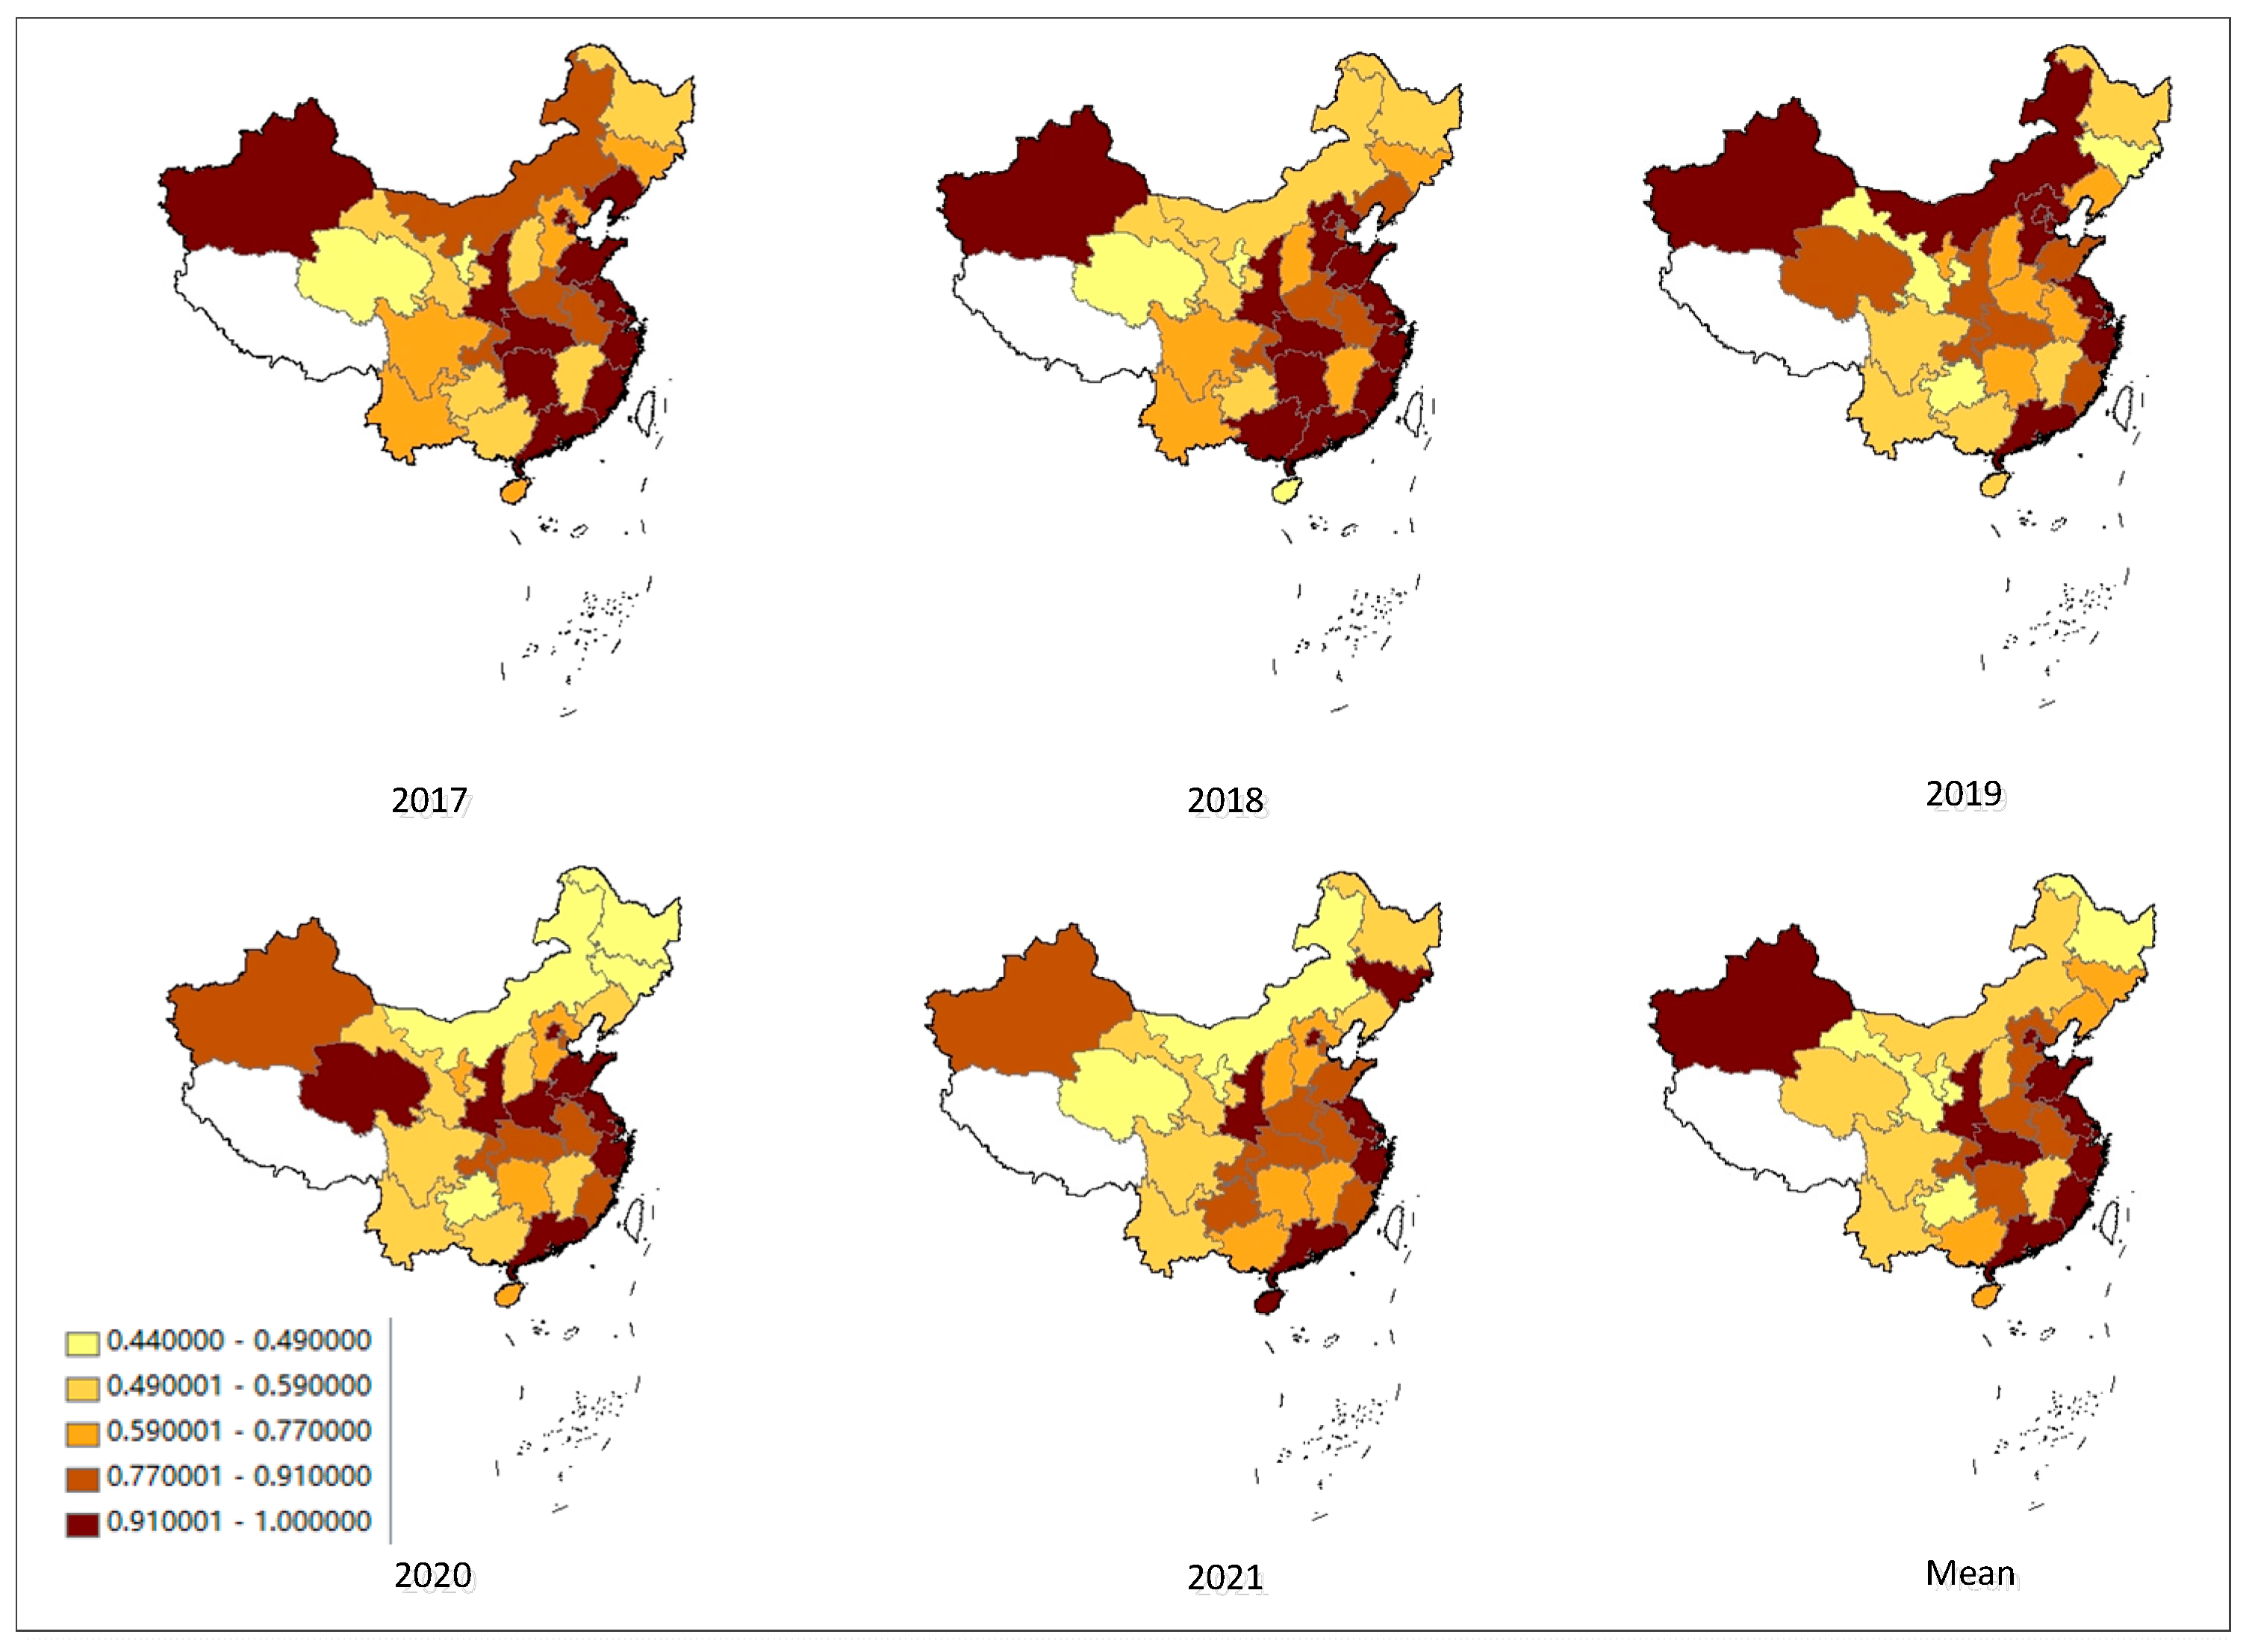
The overall efficiency reflects the comprehensive level of the provincial implementation of green buildings in China. As shown in
Table 3 and
Figure 1, from the national perspective, the mean overall efficiency was only 0.77, implying that Chinese green buildings had a lower management level and still have potential for growth.
From the provincial perspective, Chinese green buildings’ implementation efficiency had considerable regional differences, Ranging from a maximum of 1 to a minimum of 0.33. Only Beijing, Shanghai, Jiangsu, and Zhejiang could achieve maximum DEA efficiency throughout the review period, and the existing investment in DMU’s such as Tianjin, Guangdong, Fujian and Shandong could be utilized more effectively. The annual mean value of these regions was 0.90, showing that they took the lead in production and their input resources could satisfy development demands of green buildings with little more effort. Unfortunately, the efficiency levels in Ningxia, Gansu, Yunnan, and Sichuan were always lower than the national mean. Meanwhile, the efficiency trend over the review period was quite different. For example, Shanxi, Anhui, Jiangxi, and Guizhou showed a stable trend with lower efficiency levels. While Chongqing and Shaanxi were stable but with the higher efficiency levels. Hebei, Jilin, Inner Mongolia, etc. fluctuated dramatically. The efficiency levels in Hainan and Henan were continuously rising, while those in Liaoning, Hubei and Hunan were declining.
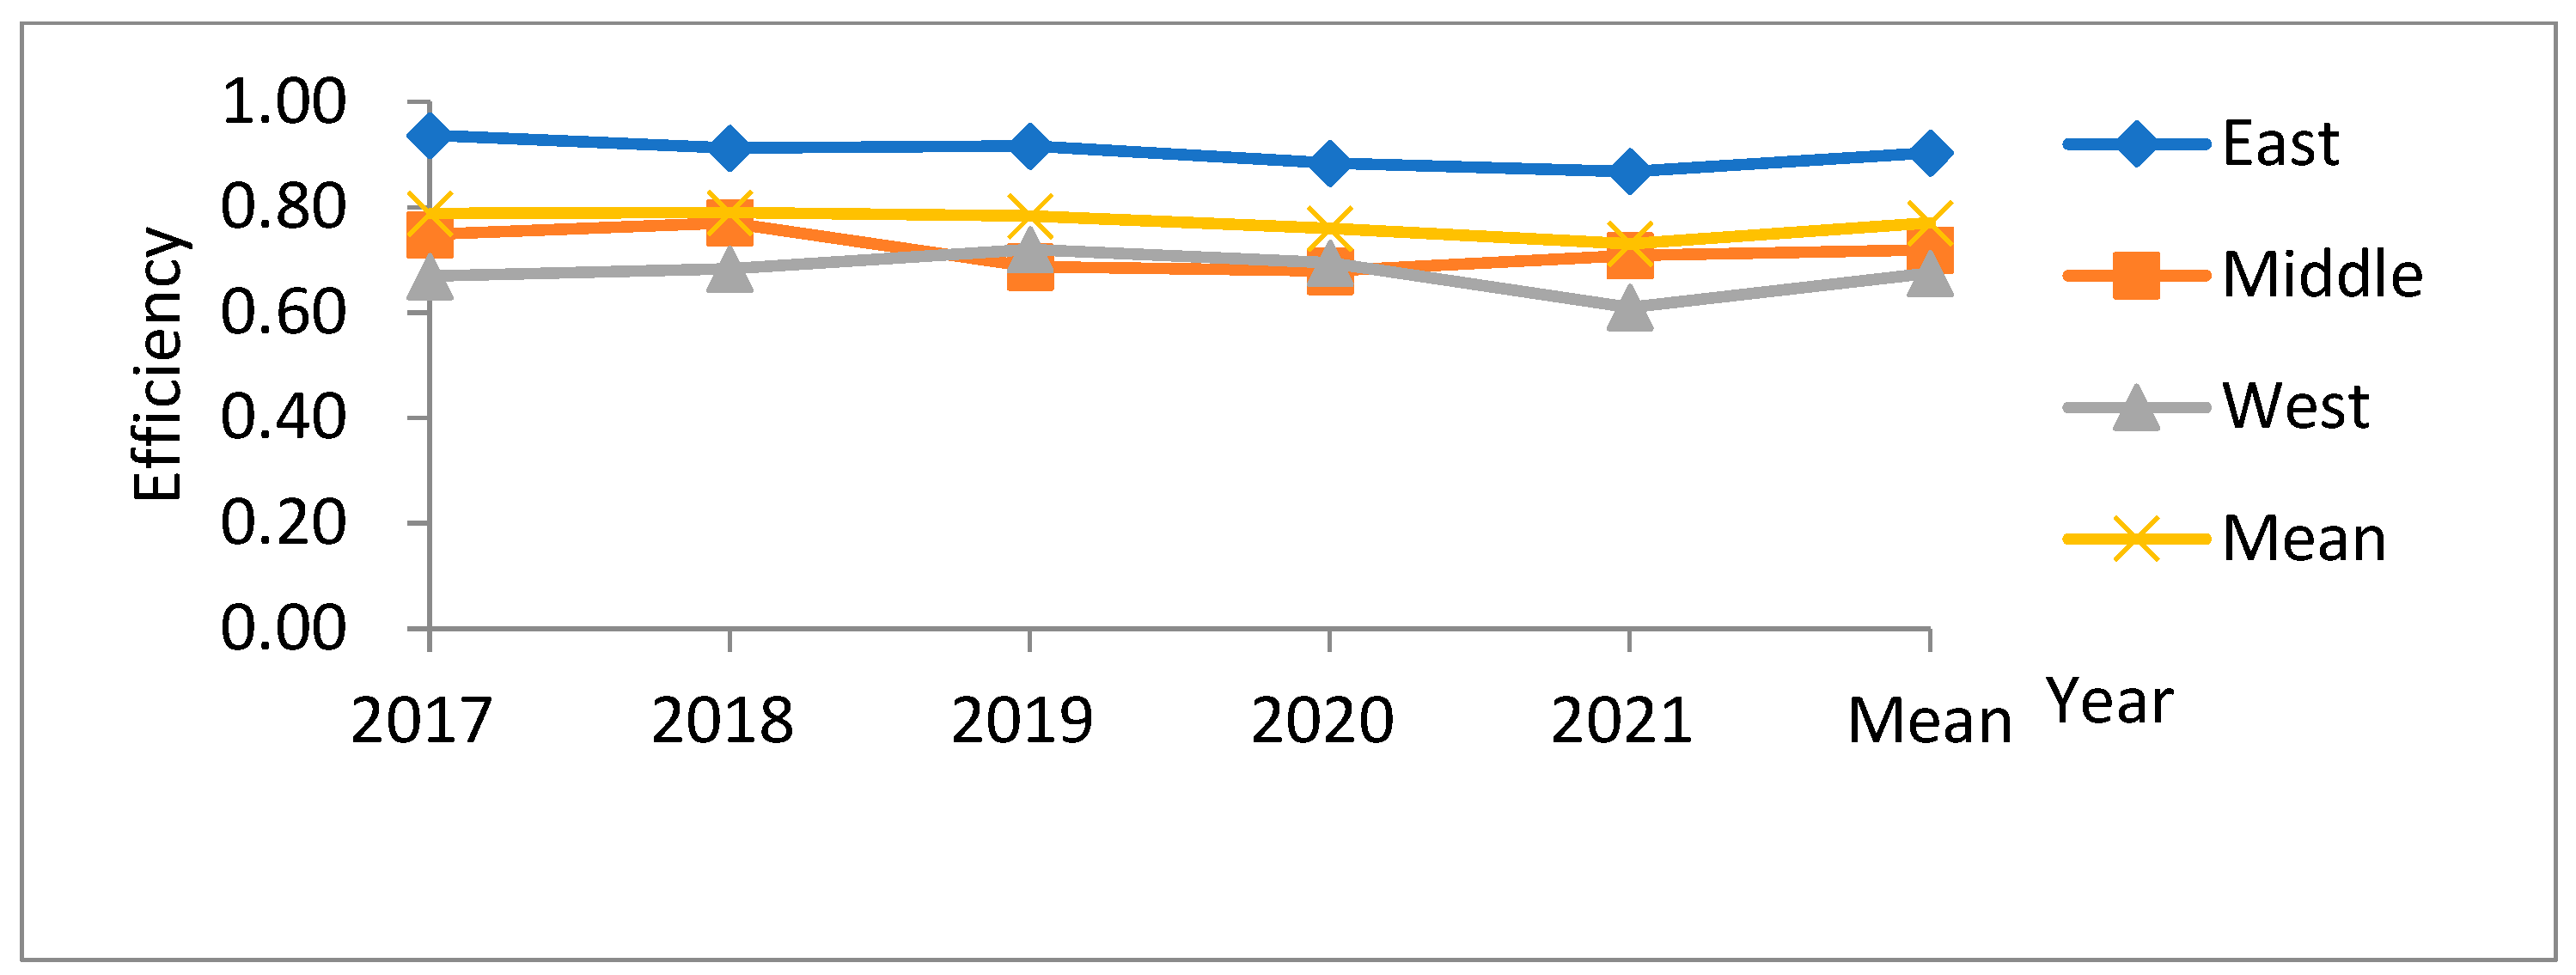
From a regional perspective, the provinces and municipalities that have achieved higher DEA efficiencies are mainly concentrated in the eastern region. Their means exceeded 0.90, which is above the national average, indicating that green buildings’ implementation strength and efficiency in economically developed regions such as Eastern tend to be valid. The efficiency in middle and western regions were lower than the national average, implying that their relatively lower economic development has impacted the green building efficiency. This conformed to some extent that regions such as eastern whose economy is well developed could help improve green building efficiency, while middle and western regions who are relatively far behind in economic development could not help to sustain a higher green building efficiency level. While generalization discuss above could be true in an overall sense, there are few outliers. For instance, the mean efficiency level of Liaoning Province located in the eastern region was only 0.71. Similarly, Hebei in the middle region and Shaanxi in the western region showed very promising mean efficiency levels that are over 0.90. Despite few outliers, it could be observed that overall efficiency of green building implementation is affected by a regions’ development.
Figure 2 clearly shoes that the overall efficiency levels of east > middle > west follows the regional economic development pattern of China.
4.2. Pure Technical Efficiency
Pure technical efficiency refers to the production efficiency of DMU input factors at a certain (optimal scale), which can be improved by optimizing management methods and systems. If vrste is less than scale, it shows that insufficient overall efficiency in this region is attributed to the insufficient pure technical efficiency. As shown in
Table 4 and
Figure 3, from a national perspective, mean pure technical efficiency of regions fluctuated around 0.98, without huge disparity between them. The mean pure technical efficiency of most of provinces was above 0.90, except Liaoning and Inner Mongolia. In each region, pure technical efficiency values in the middle areas were slightly lower than the national mean. The provinces with pure technical efficiency of 1 mainly concentrated in the Western and East regions.
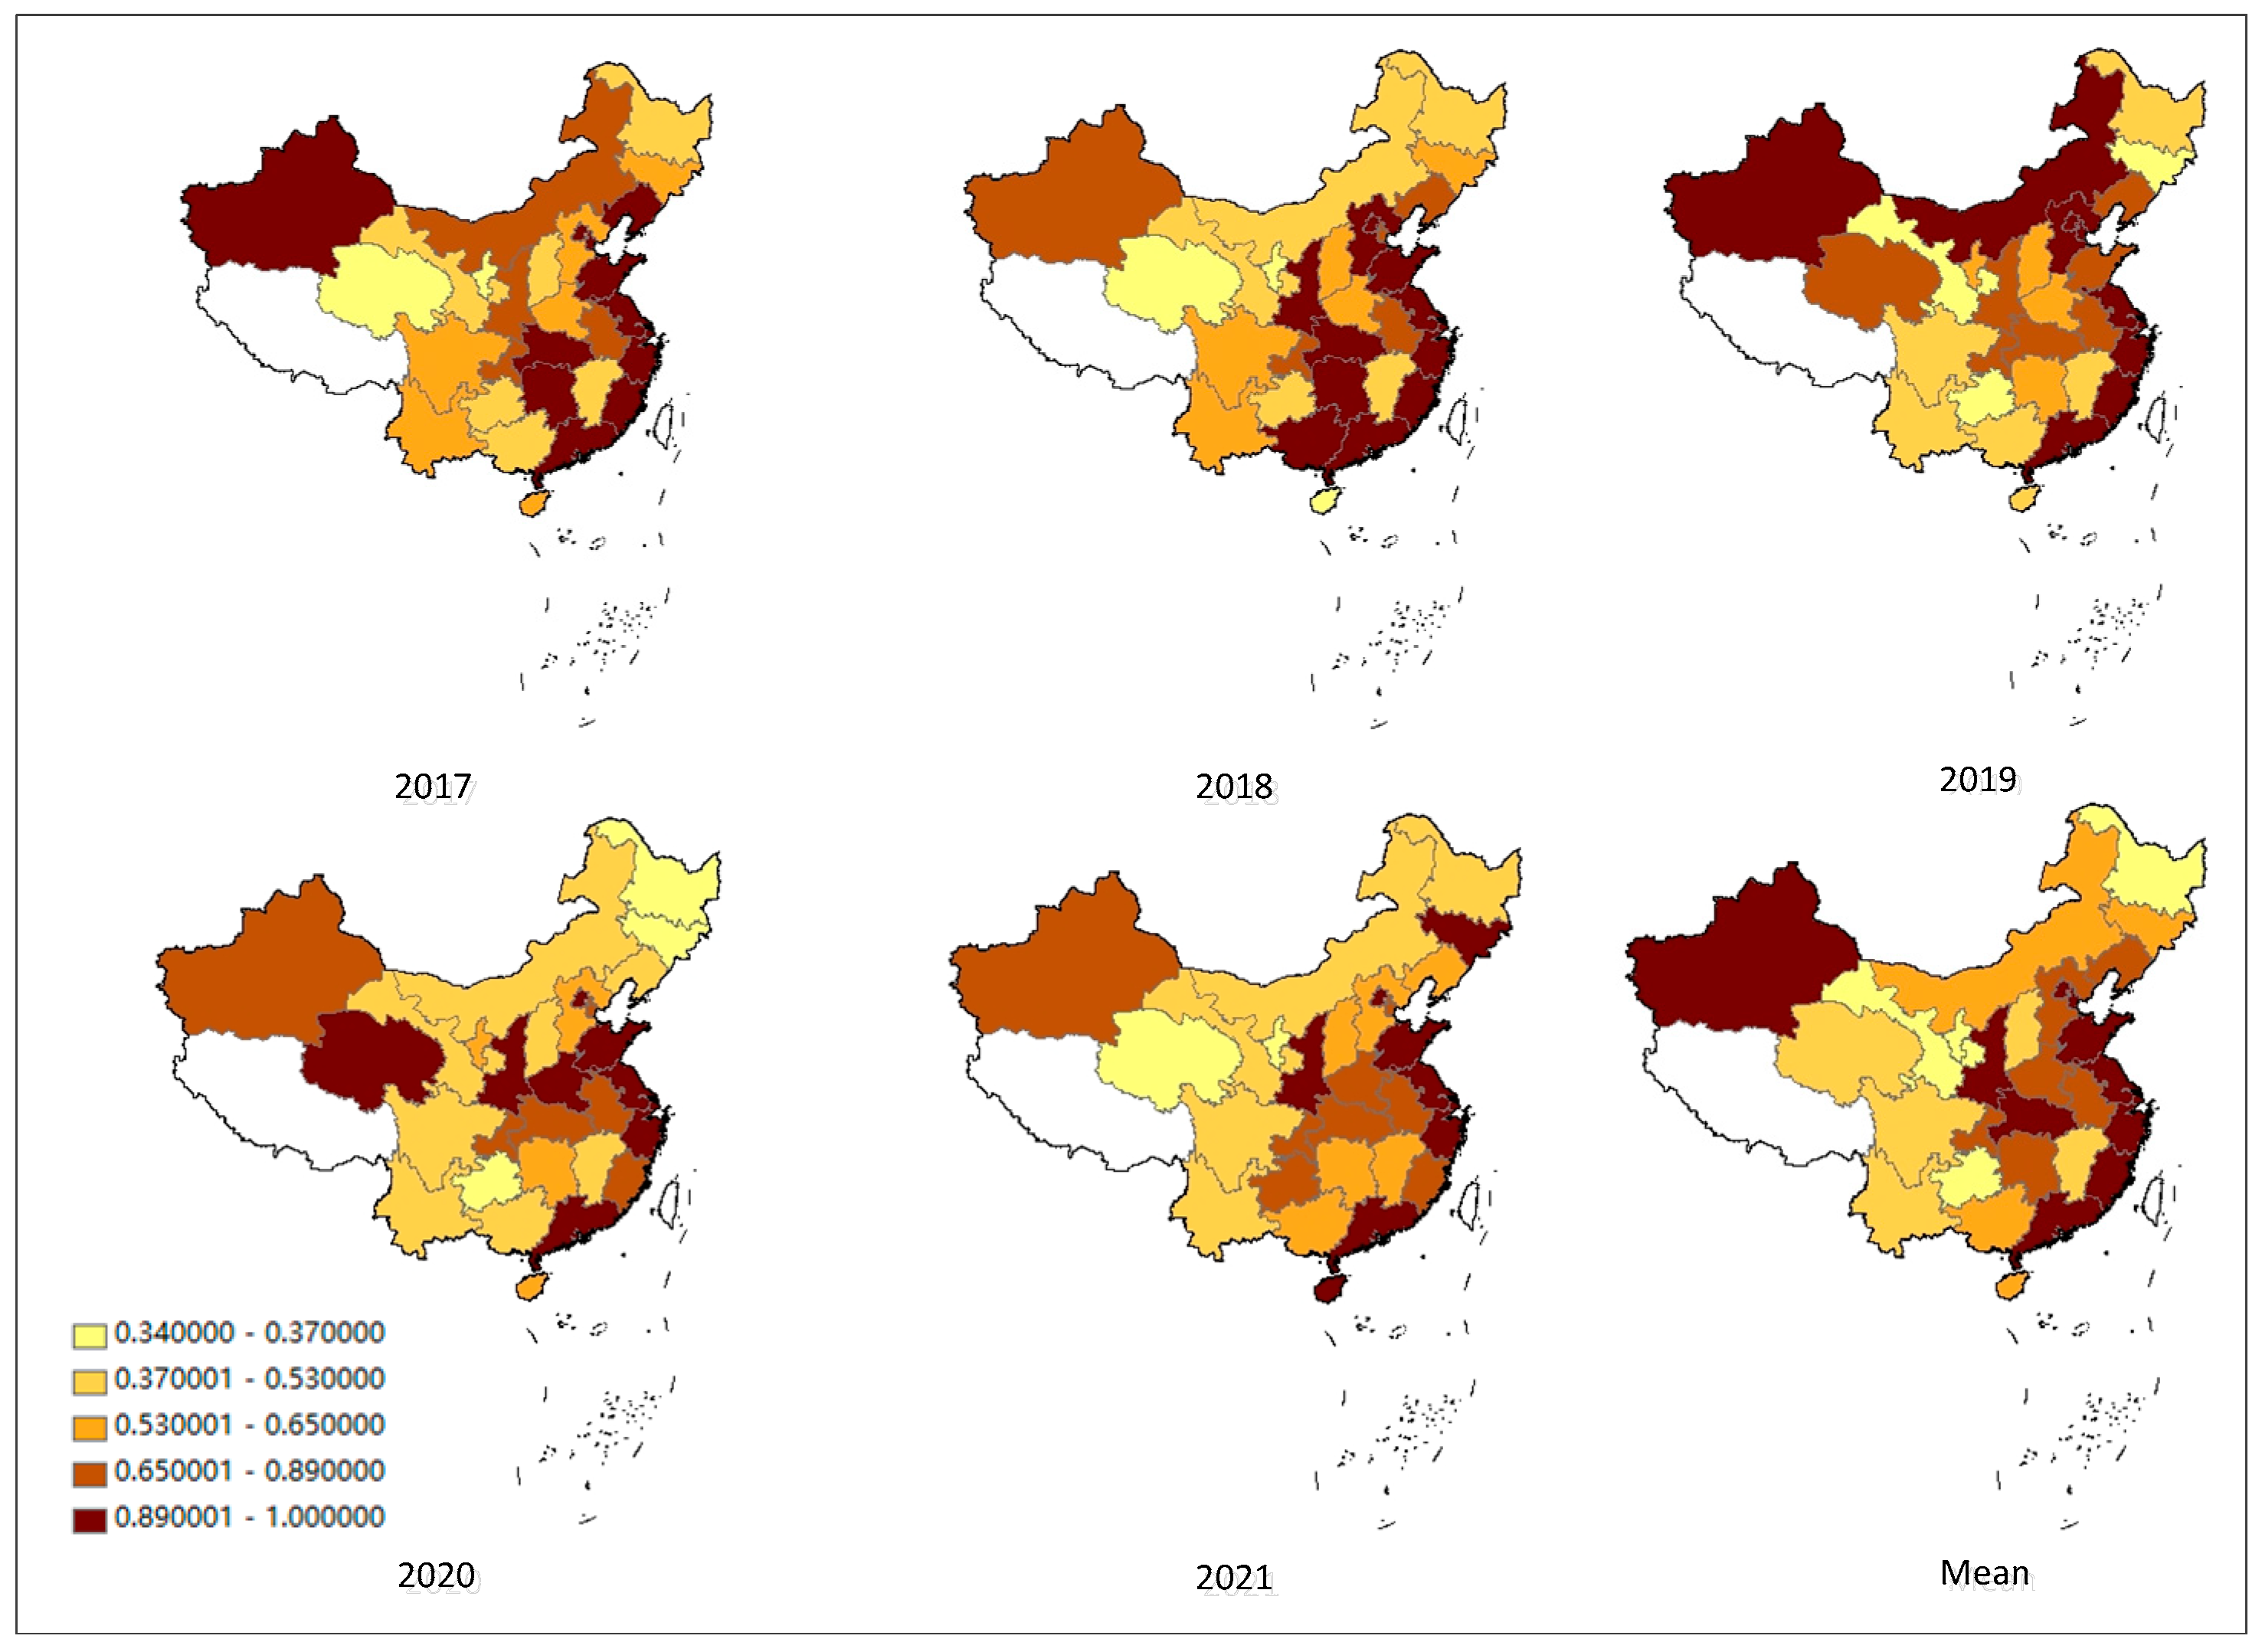
4.3. Scale Efficiency
The scale efficiency measures how efficient the provinces in terms of their size of operation regarding production and maintenance of green buildings. A province is said to be scale efficient with advice of 1 when its size of operations is optimal. The level of scale efficiency is obtained by dividing the overall efficiency by the technical efficiency. Scale efficiency measures the gap between actual technical scale and the optimal technical scale in implementing green buildings. It could be observed from
Table 5 and
Figure 4 that the mean scale efficiency during 2017–2021 was 0.78 and this value reached a maximum value of 0.80. From a provincial perspective, only Beijing, Shanghai, Jiangsu, and Zhejiang had reached the optimal scale efficiency for all years, while that of Tianjin, Fujian, Shandong, Hubei, Shanxi, and Xinxiang exceeded 0.90. Other provinces showed lower values with Heilongjiang recording the minimum mean value of 0.50. At a regional level, scale efficiency declined in the order of east, middle and west, which was identical to that of overall efficiency.
With regards to the trend over time, except Beijing, Shanghai, Jiangsu and Zhejiang which had optimum scale efficiency, returns to scale in other provinces were fluctuating, showing that the input was insufficient and investment could be increased appropriately. However, too high an input might not always bring output with efficiency. Therefore, each region should moderately adjust the input scale in accordance with the ground reality.
According to
Table 3,
Table 4 and
Table 5, it could be observed that the mean pure technical efficiency and mean scale efficiency in Beijing, Tianjin, Shanghai, Jiangsu, Zhejiang, Guangdong, and Fujian were more than 0.90. Moreover, their overall efficiency outclassed the national average. Most of the provinces in western region had higher technical and management capabilities, and the established investment had been effectively utilized. Therefore, the main reason for the decline of overall efficiency in most regions was the small-scale efficiency, i.e., inadequate capacity of resource allocation, and the gap between the actual investment and the optimal level.
4.4. Correlation Analysis
As the above calculated results have shown, there were significant differences in the distribution of green buildings in China. In order to further explore the potential causes of the great disparity in the distribution of green buildings, combined with the urban macroeconomic environment and the real estate market environment, the influencing factors, such as gross domestic product (GDP), resident population, disposable income, completed area of commercial housing, sales price of commercial housing, cost of commercial housing and so on, are selected SPSS software (IBM SPSS Statistics 26, IBM Corporation, Chicago, IL, USA) was used to analyze the correlation between the comprehensive efficiency of green buildings and each variable. The results were shown in
Table 6 and
Table 7.
As shown in
Table 6. The overall efficiency of green buildings was positively related to the six influencing factors, of which GDP was the most relevant. Obviously, the non-uniformity of GDP value had the greatest impact on the implementation efficiency of green buildings. See
Table 7 shows the result for the correlation between GDP and comprehensive efficiency in each region. Secondly, the correlation between the completed area of commercial housing and the selling price of commercial housing indicated that the development of green building projects is subjected to the acceptance of the real estate market and the expected market value (selling price). Moreover, the correlation of commercial housing cost reflected the consideration of developers on the consumer side of green building projects.
Obviously, the difference of economic strength (GDP) and real estate conditions in different regions resulted in the difference of market-oriented development efficiency of green buildings in China, which greatly affects the speed and scale of green building construction, resulting in the obvious non-uniformity of the geographical distribution of green buildings, that is, green building projects were relatively more in the provinces or regions with strong economic strength. This was because green buildings have higher construction and transaction costs than conventional projects, which can be supported by strong urban economic strength.
Based on the above static output of green building implementation efficiency and comparison with green building implementation efficiency in Europe and the United States, it could be seen that the overall efficiency of Chinese green building development was low, and regional difference was significant. However, in order to effectively clarify the key factors restricting the development of green buildings in various regions, as well as the relationship between efficiency changes and the changing trend of industry production capacity, it was necessary to quantitatively analyze the dynamic characteristics of green buildings.
5. Dynamic Measurement and Trend of the Implzementation Management Efficiency of Green Buildings
DEAP2.1 software (DEAP2.1, The University of Queensland, Brisbane, Australia) was used to calculate the Malmquist Index, which represents Total Factor Productivity (TFP) and its decomposition of the management efficiency in various regions from year 2017 to 2021. This was conducted in order to intuitively judge the actual level and trend characteristics of the management efficiency. TFP refers to the efficiency of production activities in a certain period, which can measure the degree of technological progress and to judge the change of benefits of the industry. In the decomposition index, the change of technical efficiency refers to the relationship between input and output, that is, the maximization of output under the given input or the minimization of input when the given output is produced. The change of technical progress refers to the inspection of all elements, chains and processes of scientific and technological progress affecting social economy in the macro industry. The change of pure technical efficiency refers to the change of production efficiency influenced by management and technology under the assumption of VRS, while the change of scale efficiency refers to the change of production efficiency influenced by structure and scale under the conditions of CRS and VRS.
5.1. The Dynamic Efficiency Analysis Based on Time Dimension
As shown in
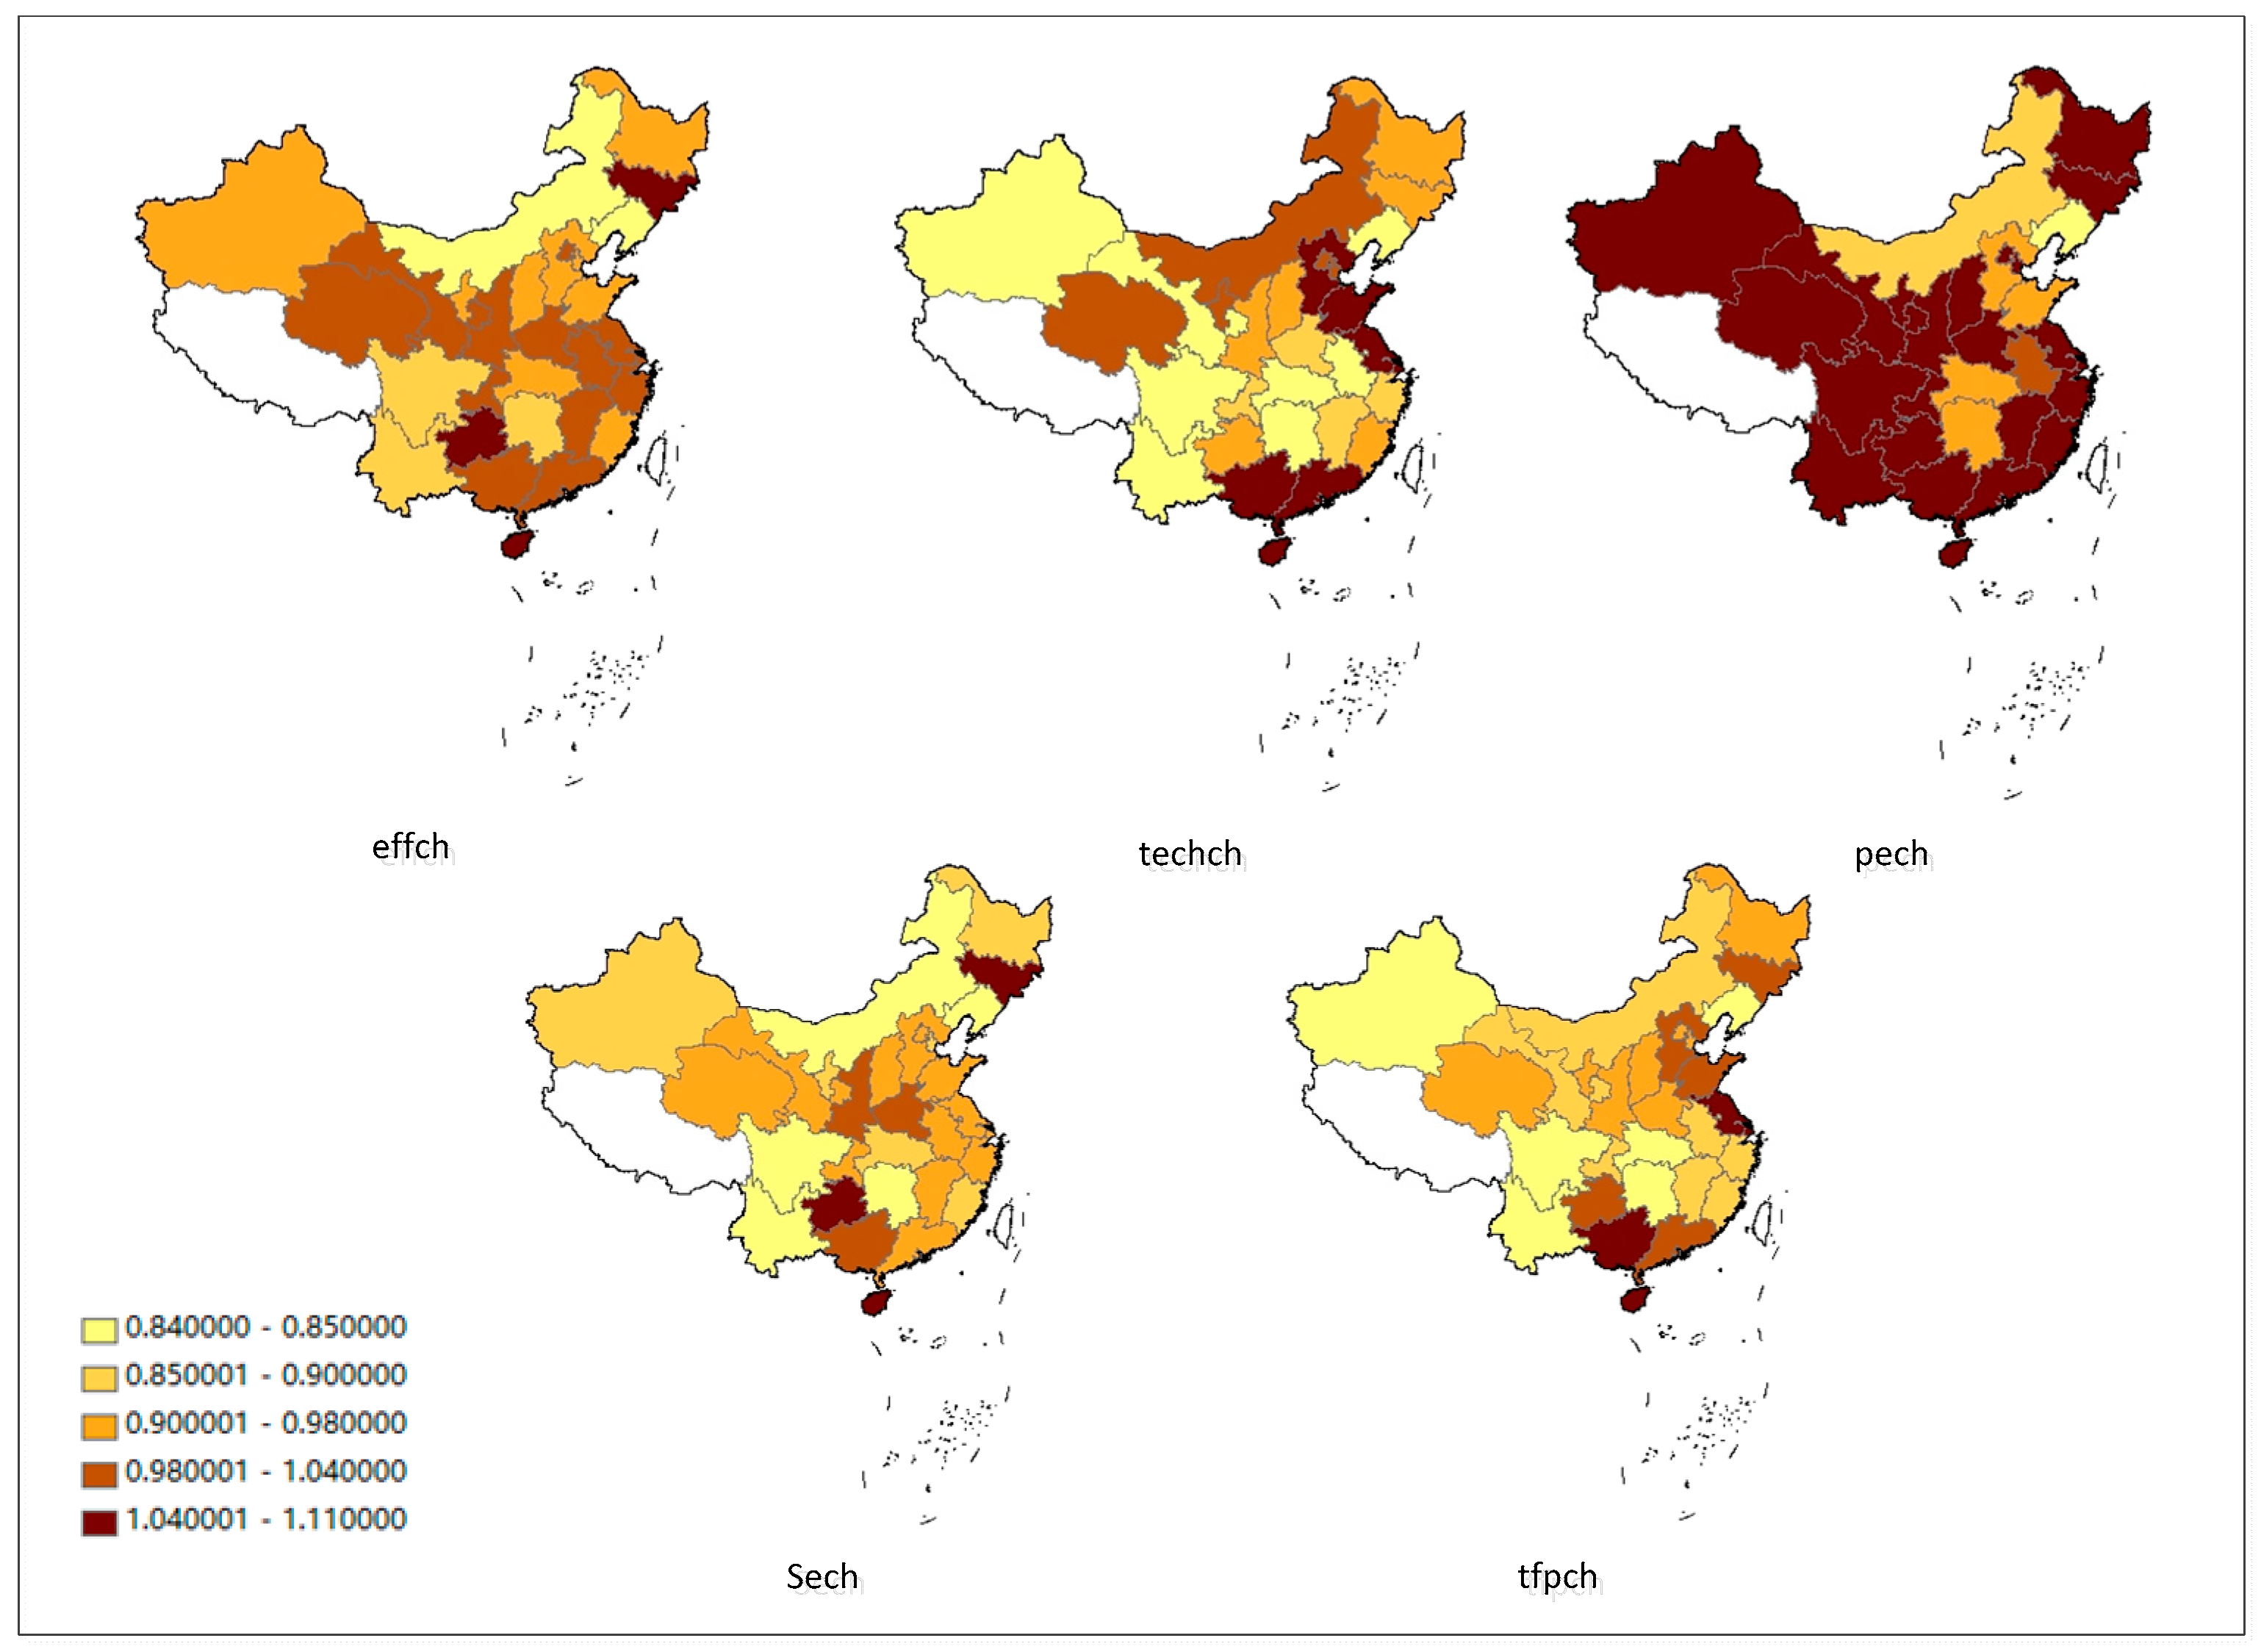
Table 8. TFP of implementation management Chinese green buildings’ during year 2017–2021 was slightly increasing. The overall development tendency was good. Mean TFP was 1.148 and it was present in increase of different degrees in each time period. The growth reached 19.90%, 17%, 13.60% and 8.60%, respectively, showing that under relevant policy orientation within 5 years, implementation input–output efficiency of Chinese green buildings’ has improved.
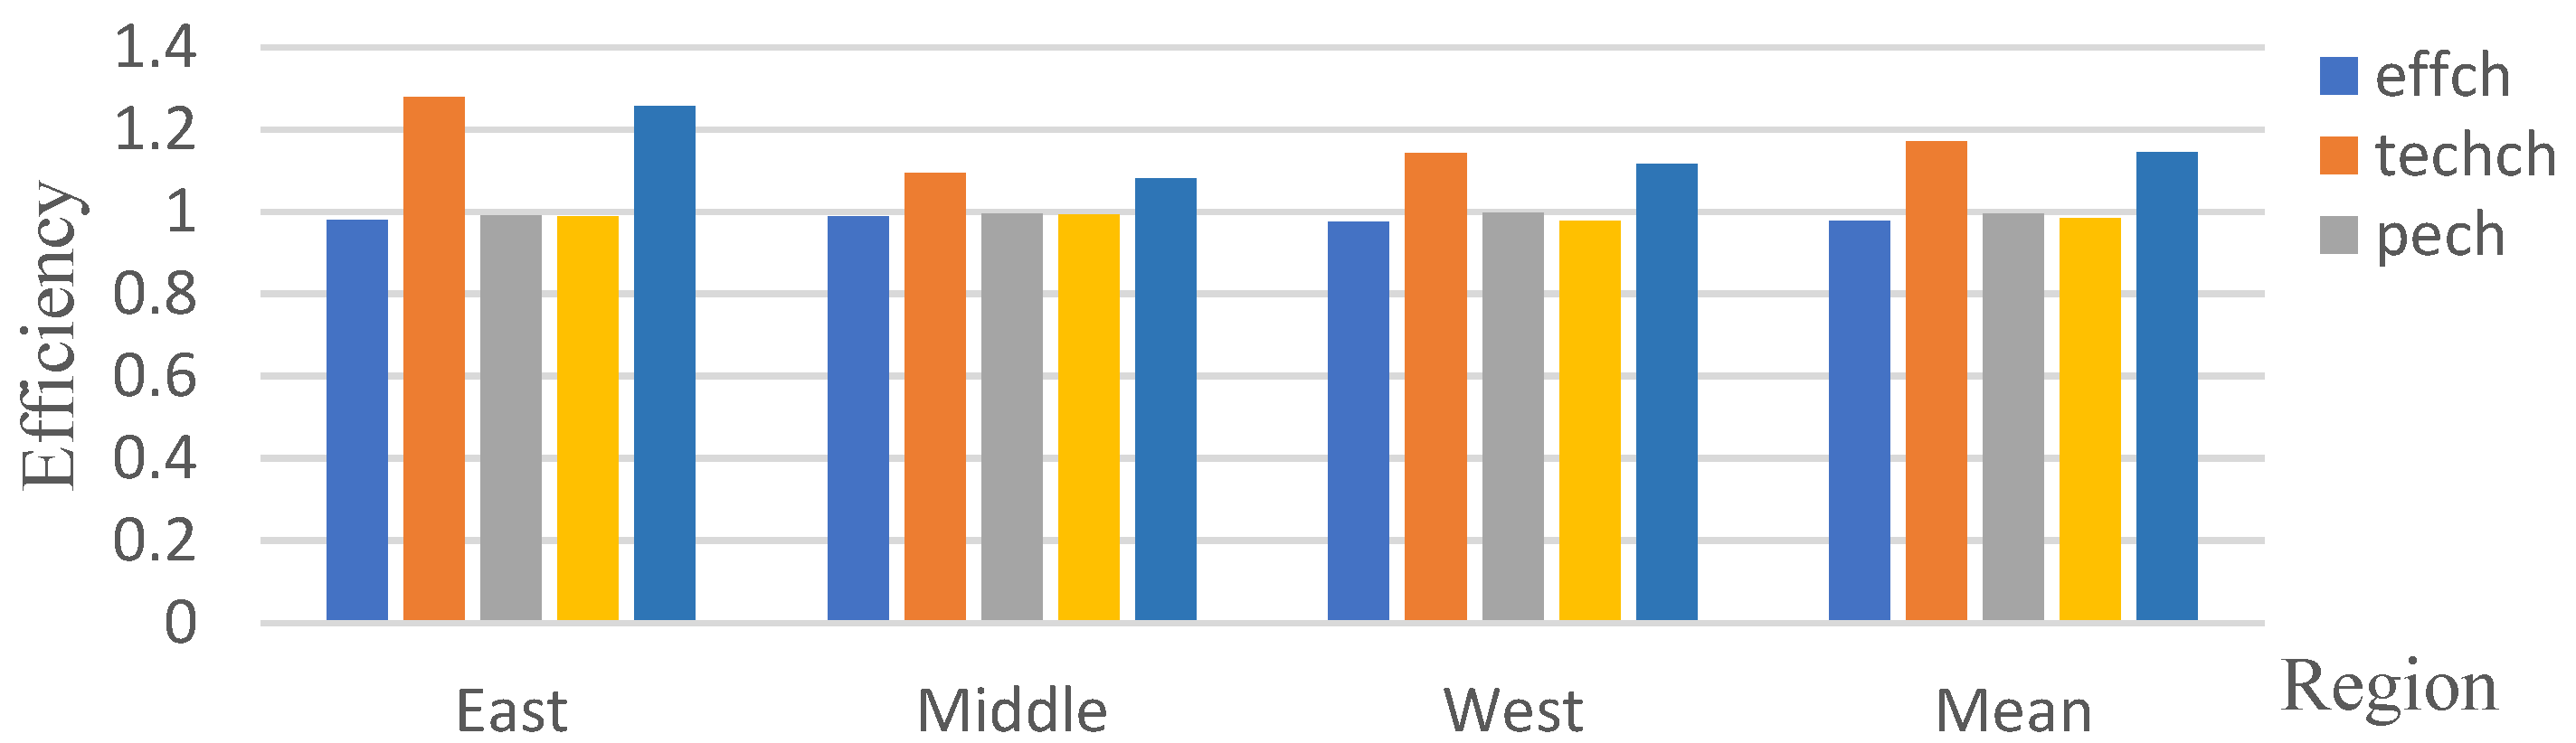
In terms of its composition, only technical efficiency variation index(effch) during year 2018–2019 was greater than 1 and mean effch was 0.99, indicating that comprehensive technical efficiency development was benign but slow. However, technical progress index(techch) in each time period was greater than 1, with a mean of 1.16. Obviously, the growth of TFP was mainly affected by the technical progress change. Further, the evolution tendency between techch and tfpch in
Figure 5 was similar, indicating that sustainable stable development of Chinese green buildings during 2017–2021 was the support of the innovation technology. From the perspective of decomposition, pure technical efficiency(pech) was fluctuated at 1 and the mean was also 1 during the review period, indicating that green buildings’ management level was relatively stable. However, the mean scale efficiency(sech) was less than 1. Moreover, within the review period, mostly it was less than 1, implying that green buildings’ returns to scale might be worse. The annual mean decline was 1.20%, failing to reach the optimal technical scale state. This was identical to the management scale in the static analysis. To sum up, technical progress had the biggest contribution to Chinese green buildings’ implementation efficiency. The fluctuations of TFP were restrained by technical variation, indicating that the green building industry should devote itself to improving the technical management and innovative ability.
5.2. Dynamic Efficiency Analysis Based on Regional Dimension
Among the decomposition indices, the annual average growth of effch was −2.30%. The mean in the eastern, middle and western regions did not exceed 1. Effch in 10 provinces and cities including Beijing, Shanghai, Jiangsu and Zhejiang reached 1, indicating that comprehensive technical efficiency change in these regions was slightly increased, while other regions fell behind. The annual average growth of techch was 17.10%. Besides, the eastern provonces had the fastest growth. Particularly, Jiangsu Province took the lead in the whole country with Techch recording 1.49. By combining
Figure 6 with this discussion, it could be seen that TFP growth in each region was affected by the technical progress change. The regions with higher TFP generally had higher techch. Furthermore, within the entire review period, pech and sech were slightly reduced. The annual reduction rate reached 0.60% and 1.70%, respectively, showing lesser contributions to development efficiency of green buildings in each region. Besides, pure technical efficiency change in most of the western provinces and municipalities was in a static state.
The rate of changes of green building management efficiency in Chinese provinces are shown in
Table 9 and
Figure 7. The national mean of TFP was 1.15, indicating that green buildings’ management efficiency was growing at an average rate of 14.80%. The growth rates in the eastern, middle, and western regions were 25.50%, 81% and 11.50%, respectively. From the provincial level, TFP in most of regions was greater than 1, implying an improvement in TFP in these regions. However, the degree of growth in each region still had a significant difference. Among which, the annual average growth in Jiangsu and Shanghai exceeded 40%. The annual average growth in Zhejiang, Anhui and Jiangxi were less than 10%. However, TFP in Liaoning, Hubei, Hunan, Sichuan, Yunnan, and Xinjiang were very low.
To sum up, technological progress had greatly promoted the outward movement of production frontier, which was a decisive factor of TFP growth in various provinces. Therefore, local governments should constantly improve relevant management systems, institutional operation and the technical inputs of green buildings, so as to raise input–output efficiency.
6. Discussions
(1) Green buildings’ implementation management efficiency in provinces and municipalities had the remarkable differences, conforming to the complicated geographical factors and actual distribution in China. Most of the existing studies were based on the implementation-oriented analysis of incremental cost-benefit, evolutionary game model and performance management of green buildings, and was a lack of quantitative analysis of input–output efficiency and constraints of green buildings based on spatial and temporal characteristics.
(2) The high correlation between the indicators will lead to large errors in the calculation results of DEA model. Therefore, before the study, the eligible indicators were screened through correlation analysis and based on the availability of indicators. In this study, construction enterprise employees, per capita disposable income, labor productivity, technical equipment rate and power equipment rate were taken as input indicators, and building industry added value, number of green construction evaluation and identification items, green building area were taken as output indicators. This technically avoids the strong linear relationship between input indicators and output indicators, and also takes into account the basic demands of green building implementation and operation guarantee.
(3) The DEA model requires the number of input and output indicators and their correlation. The inappropriate indicators easily lead to the distortion of model operation results. In order to reduce the error sensitivity of point variables constituting data envelopment curves and to ensure the discriminatory ability of DEA to DMU efficiency, the number of DMUs in this paper was not grew for less than the product of the number of input and output indicators, but not less than twice the total number of input and output indicators, and each input variable was required to be associated with multiple output variables. In this way, it could provide a scientific basis for enhancing the management efficiency, operation capacity and environmental protection benefits of green buildings.
7. Conclusions
On the basis of the dynamic and static analysis of the management efficiency of green buildings in China from 2017 to 2021, conclusions can be drawn as follows:
(1) Implementation management efficiency of Chinese green buildings’ during 2017–2021 was lower, but the overall development tendency was good. The annual average efficiency was 0.77, showing about 23% of progress space for the cutting edge of production. Green buildings still have had the huge development potential. As a whole, there was a development pattern of “east >middle > west”. However, regional, and provincial differences were significant. The east regions include Jiangsu, Shanghai, and other provinces with the effective DEA, showing good input utilization. Efficiency in the middle areas and west areas were relatively lagging, pulling down the national average level. Pure technical efficiency in each region did not have a big gap, indicating that green buildings’ management system and technical level in each province and municipality was similar. This was consistent with the uniform administrative management system in China. Unfortunately, scale efficiency in majorities of regions was kept in the invalid scale state, which was the primary factor for low overall efficiency. As a result, by aiming at the remarkable regional differences, China should devote itself to destroying green buildings’ regional limitations to form the situation with the radiant promotion of upstream regions and linkage development of midstream and downstream regions.
(2) According to static measurement, pure technical efficiency and scale efficiency caused an impact on implementation efficiency of green buildings’ comprehensive, but the overall efficiency differences were mainly restrained by the scale efficiency variation. Within the inspection period, each region had the good returns to scale, but the growth amplitude was slightly lower, still having some differences from the optimal state of technical scale. The input–output matching degree in local green buildings’ implementation operation was far away from saturated. As a result, lagging regions in the middle areas and west areas not only should pay much attention to green technology and management level, but also should improve their scale system urgently. It is unfortunate that minorities of developed areas had the poor scale, indicating that too many inputs might not gain the effective output, so the production scale should be adjusted moderately and the resource configuration should be optimized to further enhance technical innovation and control capacity of green buildings.
(3) On the basis of dynamic analysis of TFP, it could be found that in terms of time dimension, Chinese green buildings’ TFP during 2017–2021 was improved. The annual average amplitude was 14.80%. Within the inspection period, technical efficiency was reduced by 1.30% averagely, but average amplitude of technical progress reached 16.30%, showing the maximum contributions to TFP growth. With regards to the regional dimension, TFP in the east regions was slightly higher than the middle areas and west areas. Majorities of provinces and municipalities were present in the growth tendency. Management efficiency of green buildings only in six regions including Liaoning, Hubei and Hunan showed retroversion to their output growth contributions with varying degrees. The findings indicated that even if the local management level and technical efficiency were key factors to restrain increase and decrease of TFP, purely technical efficiency and scale efficiency did not have the remarkable impacts on TFP. Technical progress of green buildings and innovative degree should be decisive factors to promote TFP in each region. Therefore, Chinese green buildings’ implementation should value the impacts of technical efficiency and technical progress and pay attention to technical innovation and development, so as to enhance production efficiency and overall efficiency of input factors.


