
Assessment of the Exterior Quality of Traditional Residences: A Genetic Algorithm–Backpropagation Approach


 , and
, and
Abstract
:1. Introduction
2. Materials and Methods
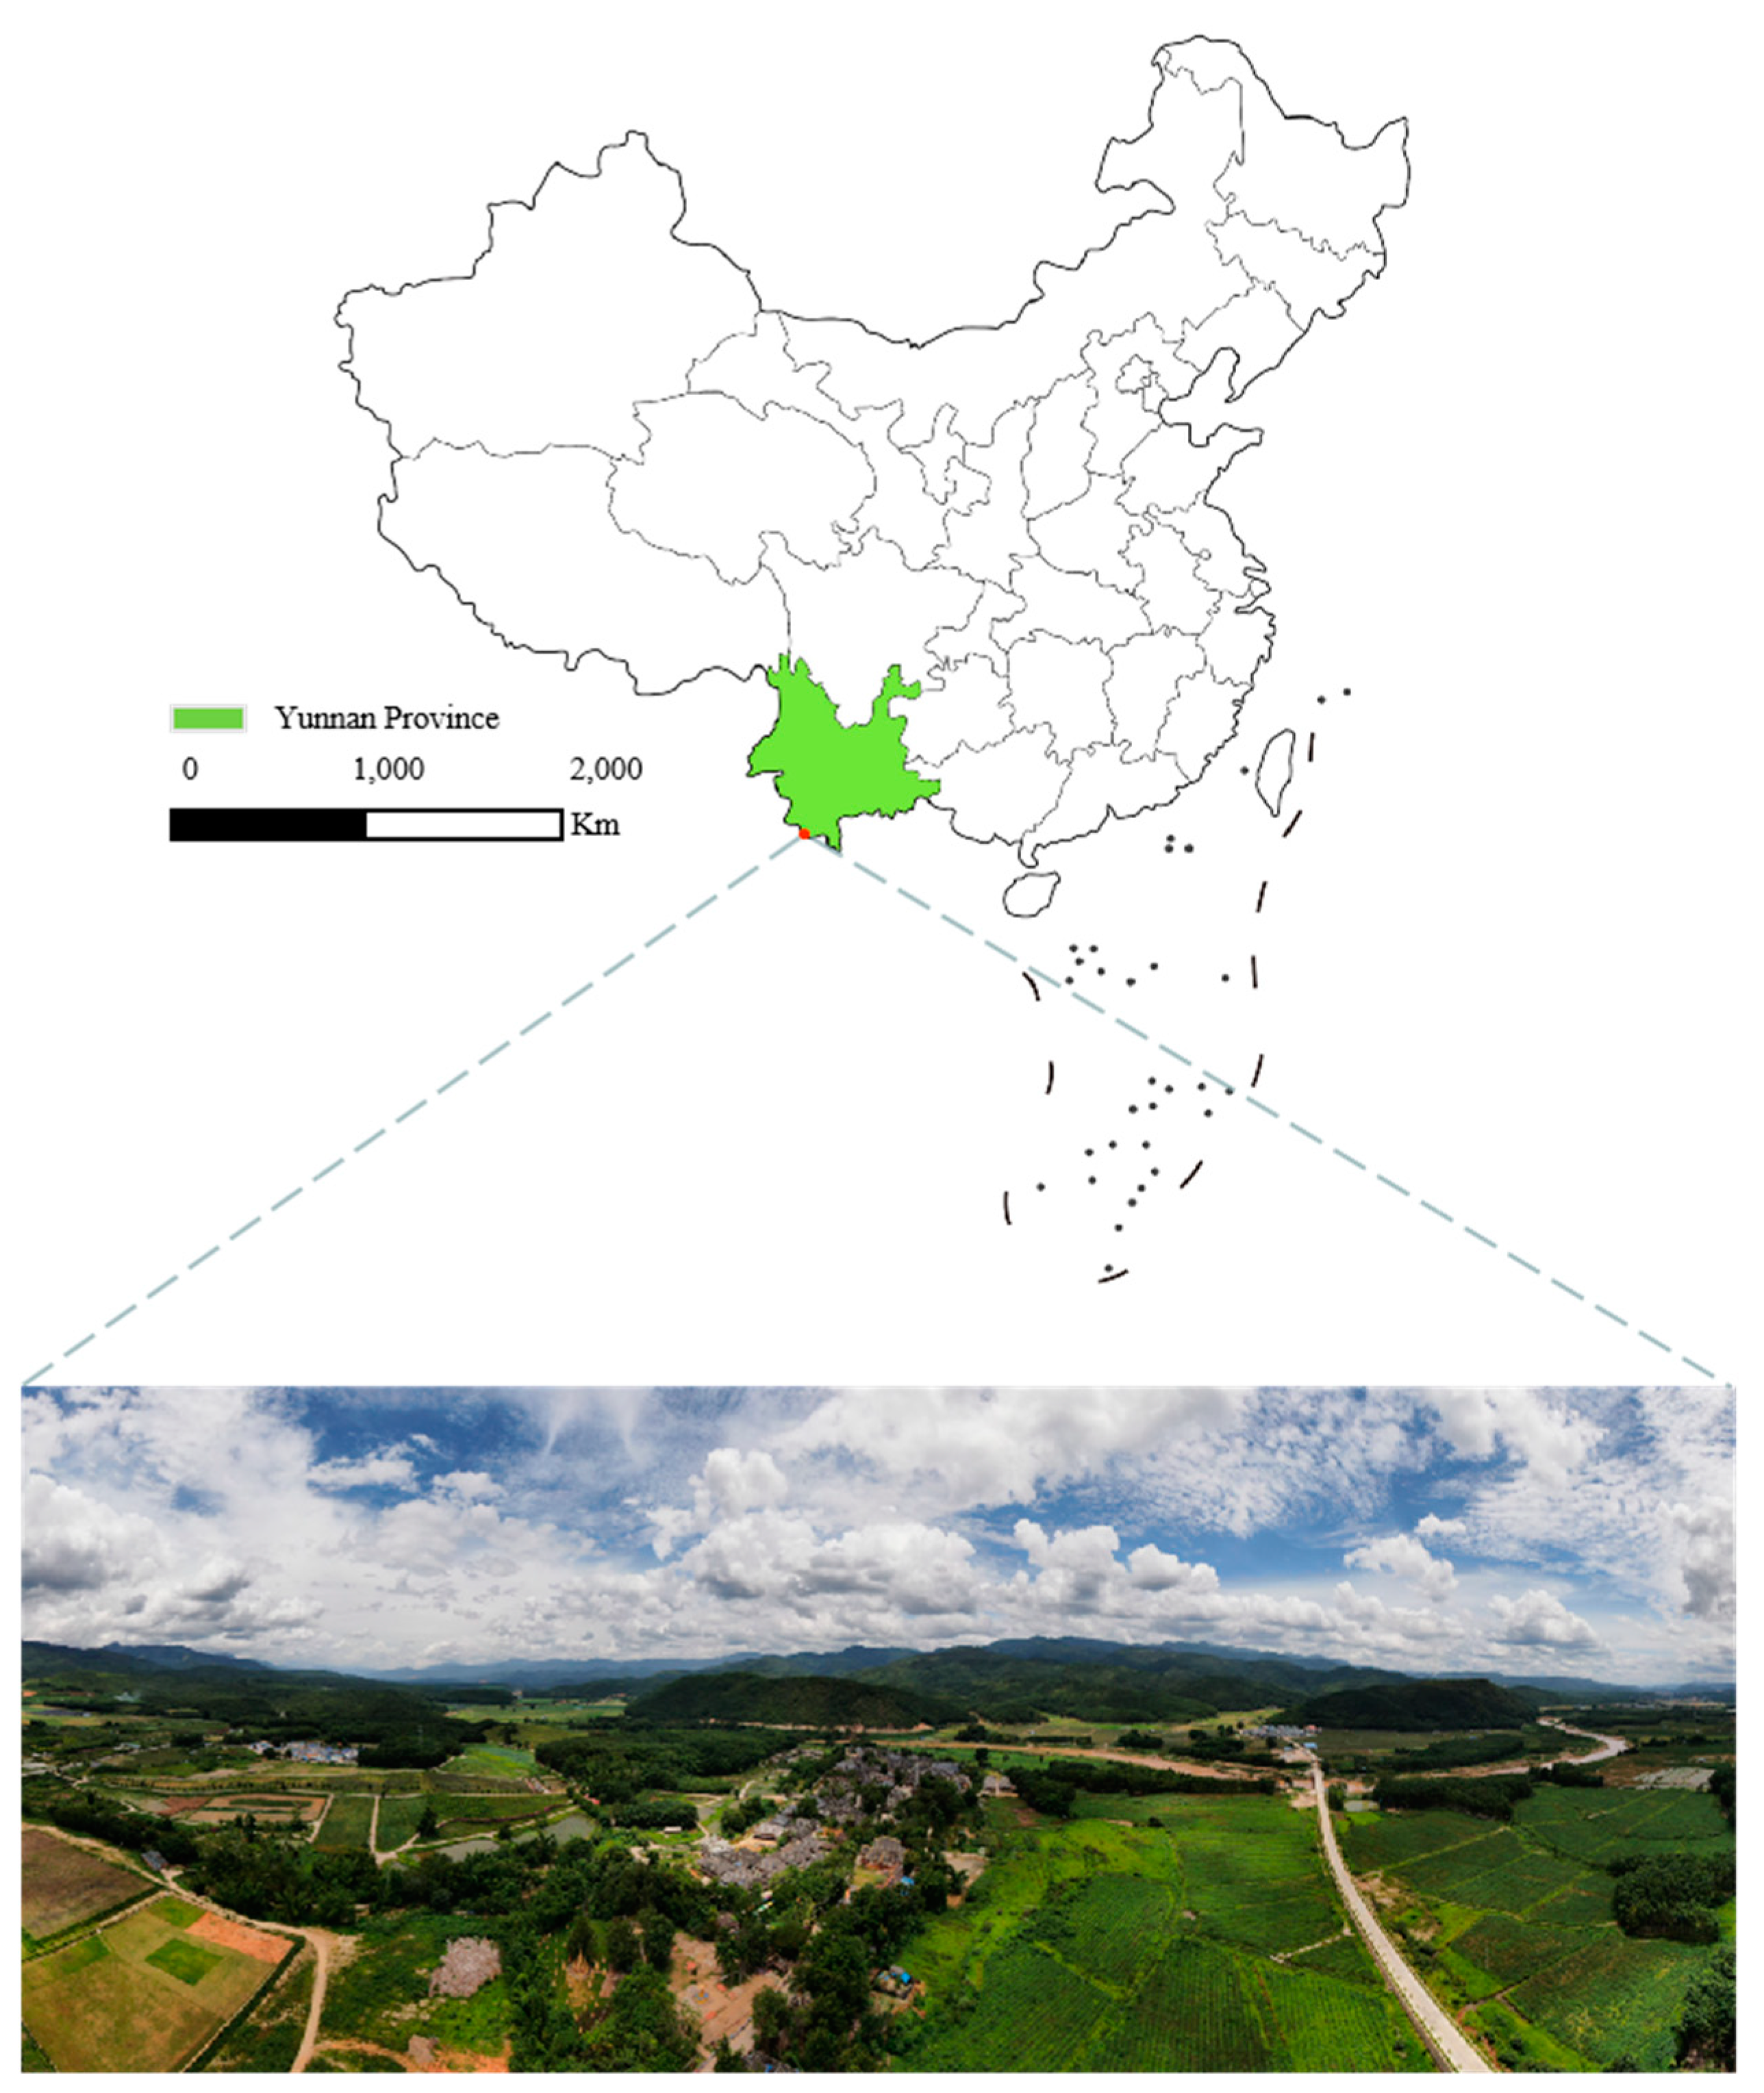
2.1. Study Area
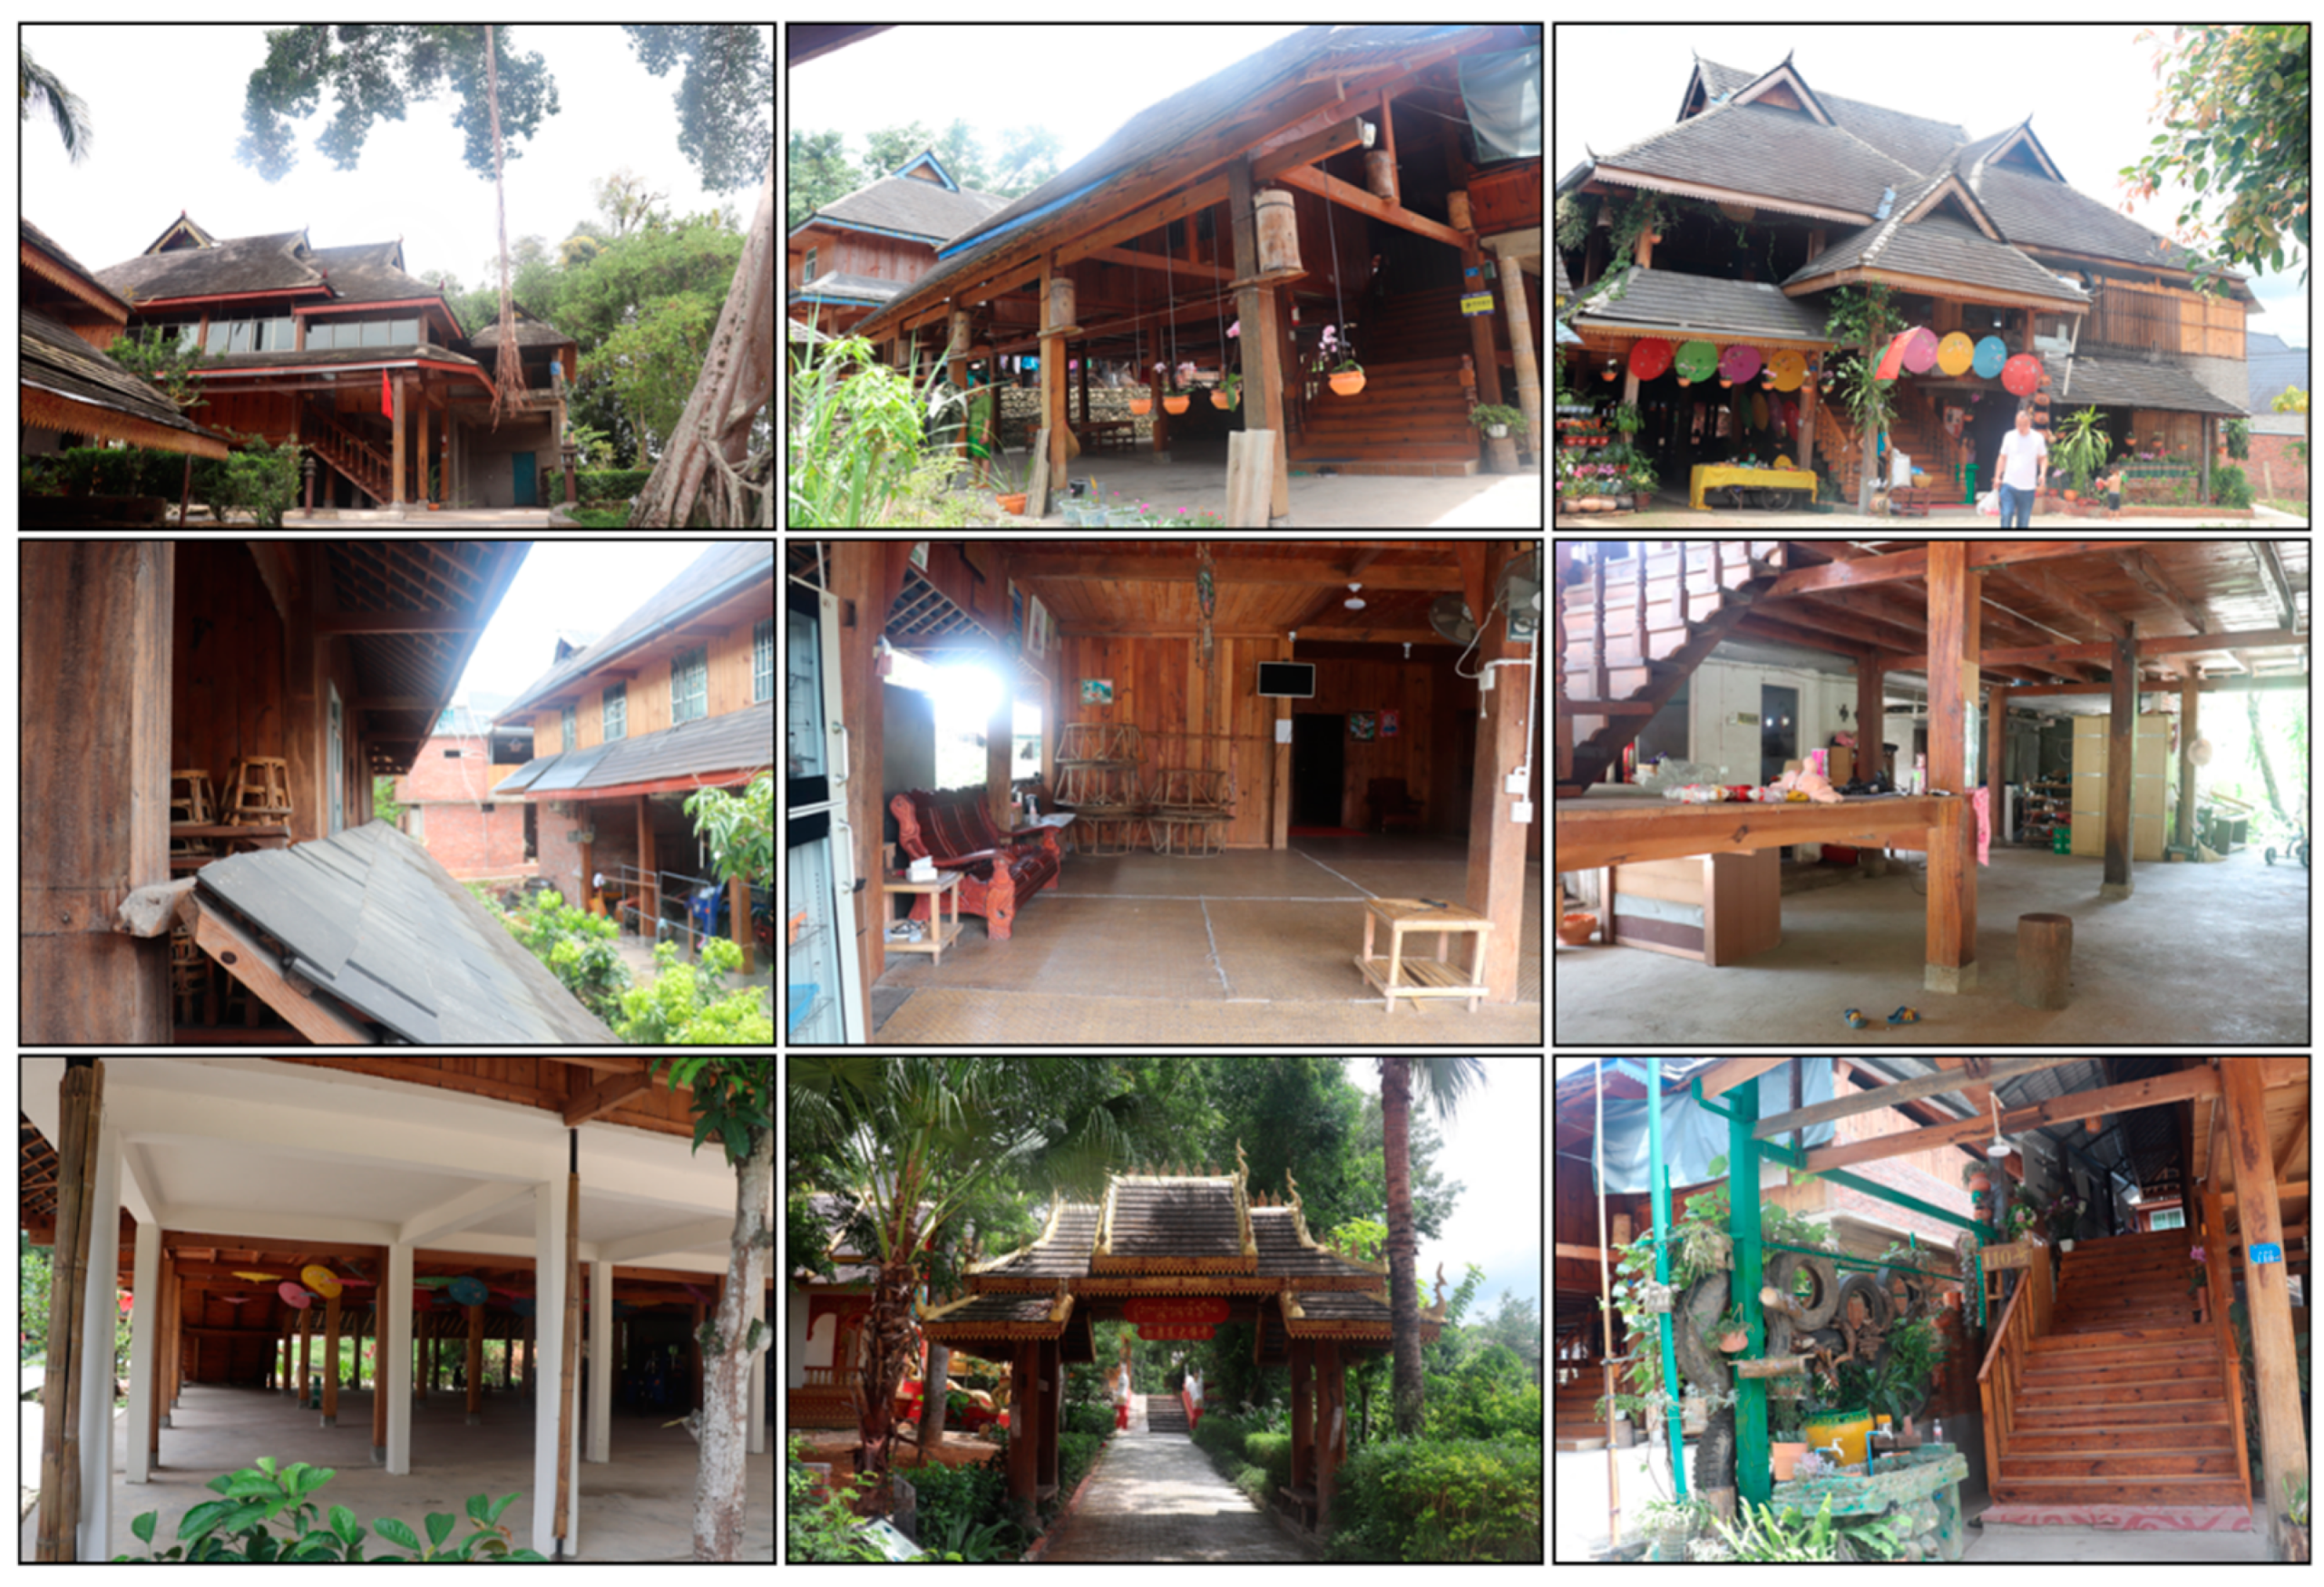
2.2. Data Sources
2.3. Exterior Quality Evaluation of Traditional Residences and Value Grading
2.4. GA–BP Neural Network
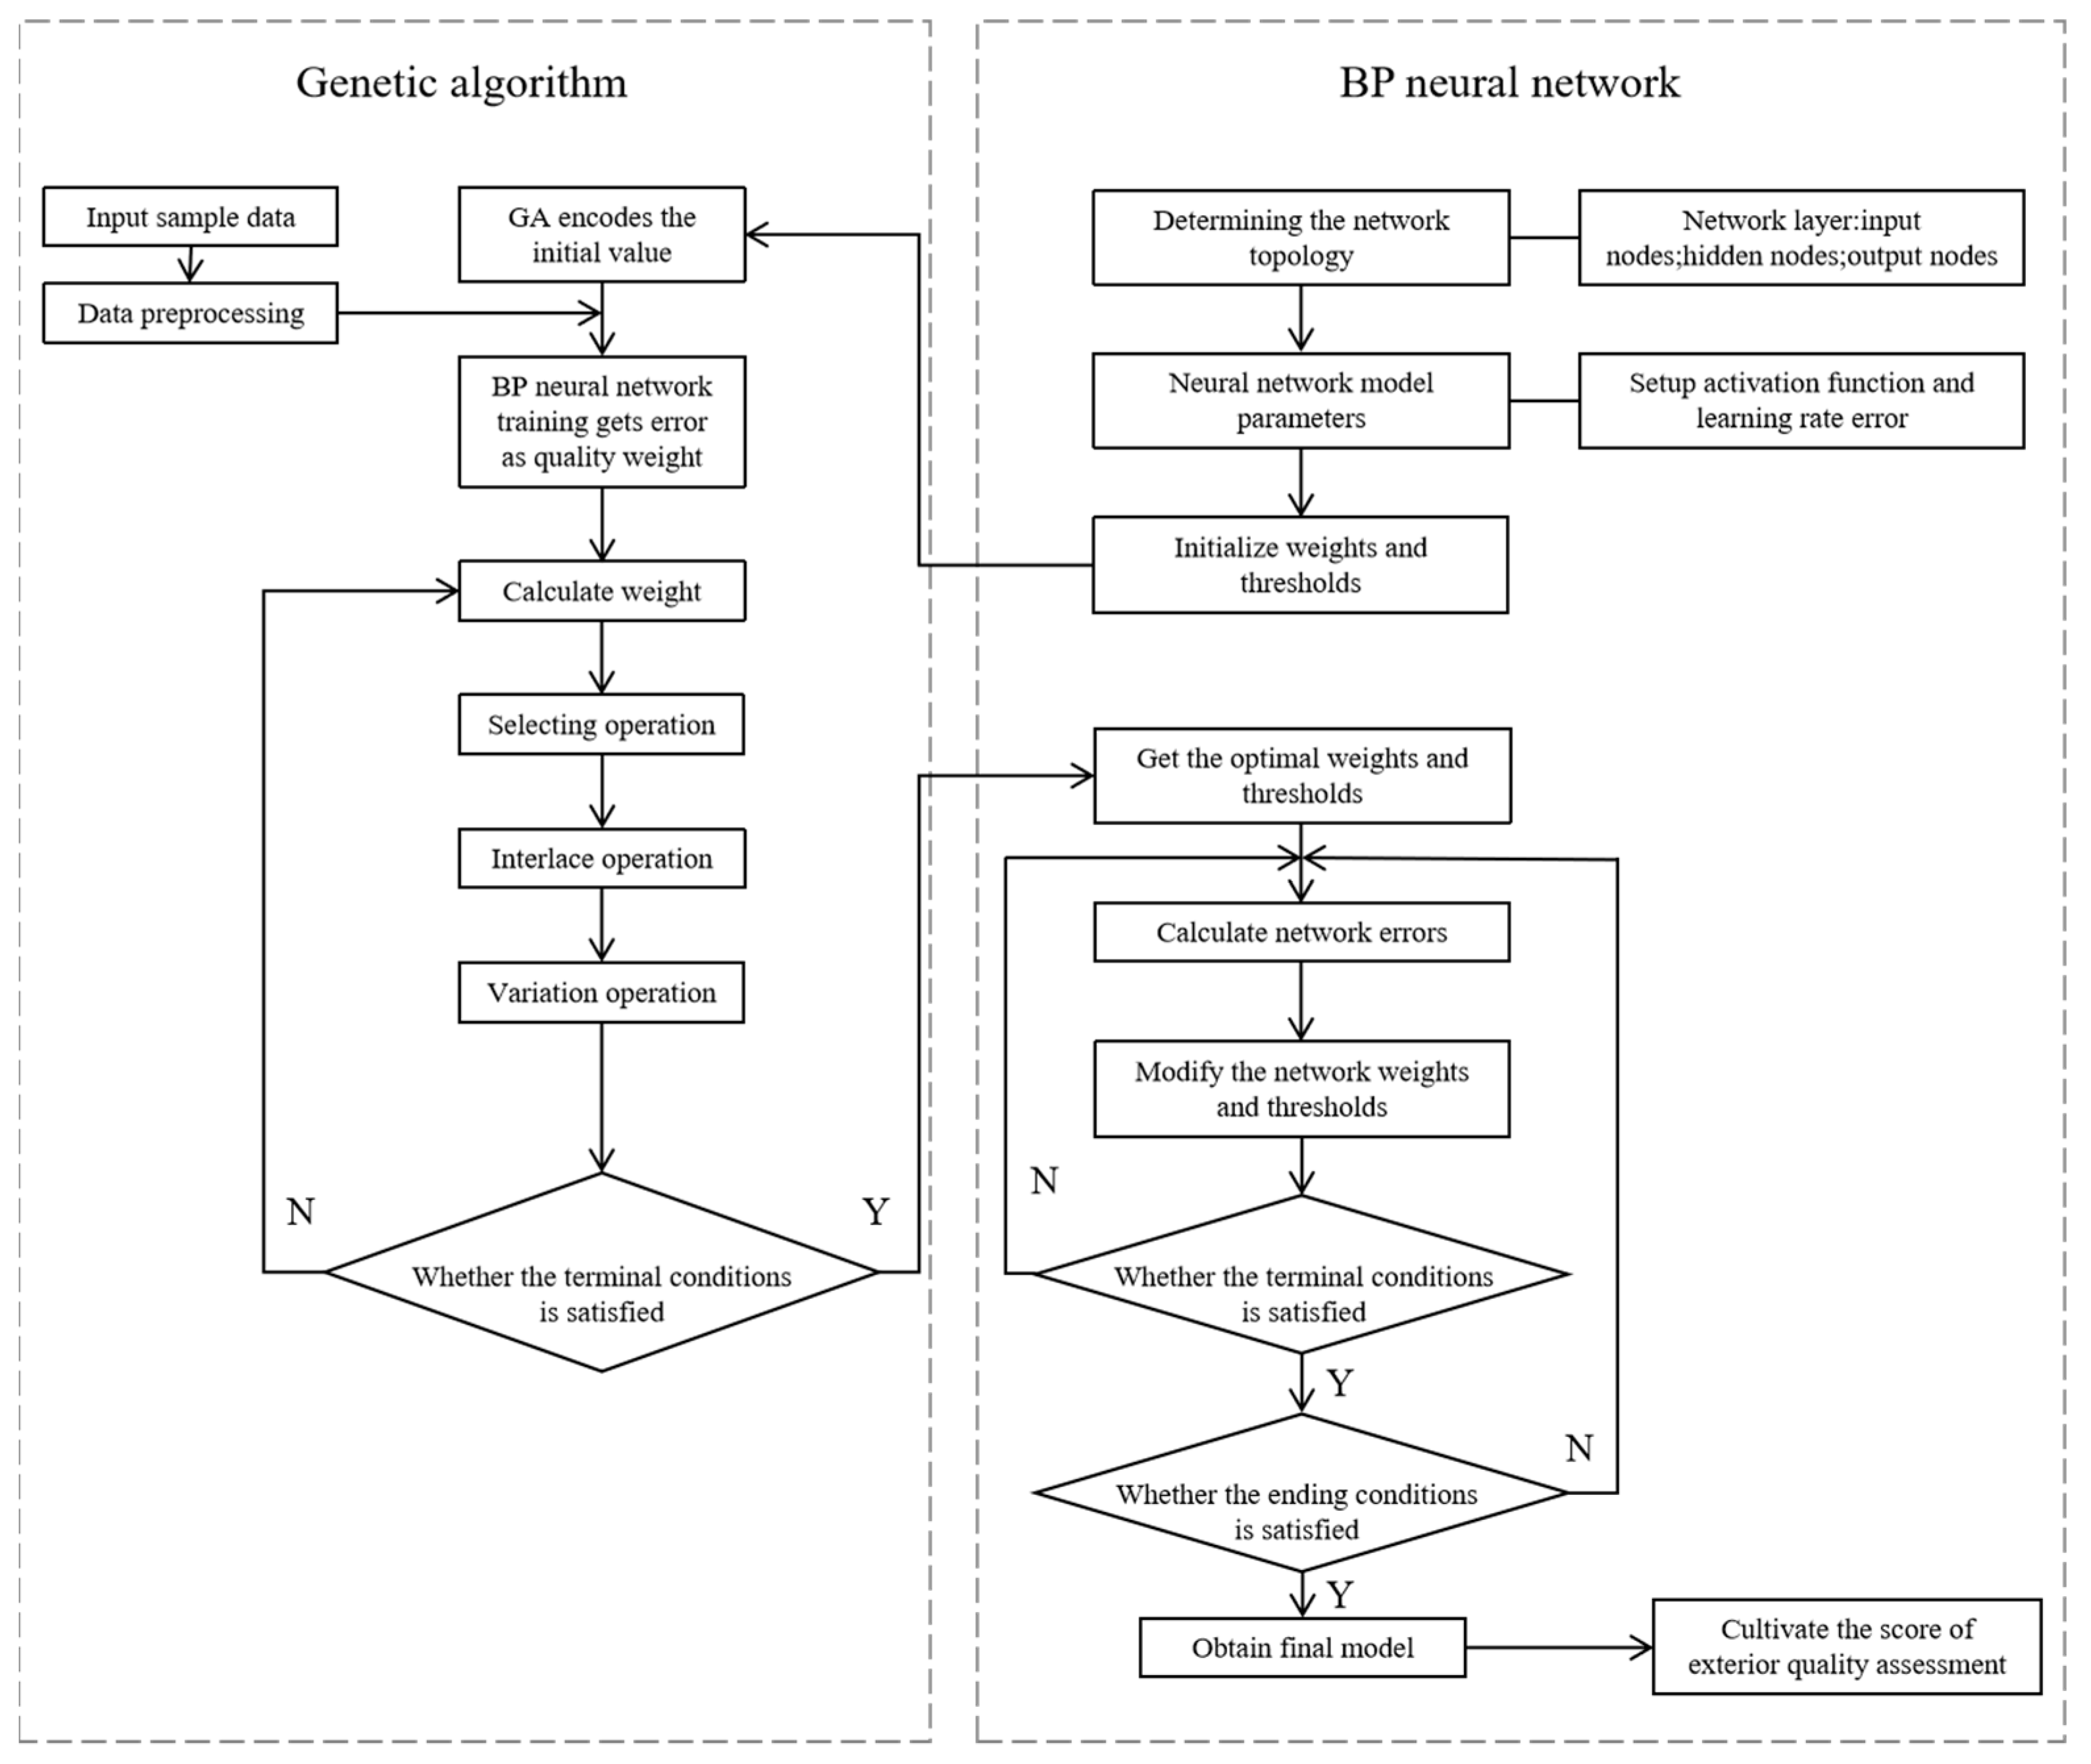
2.4.1. GA–BP Neural Network Process
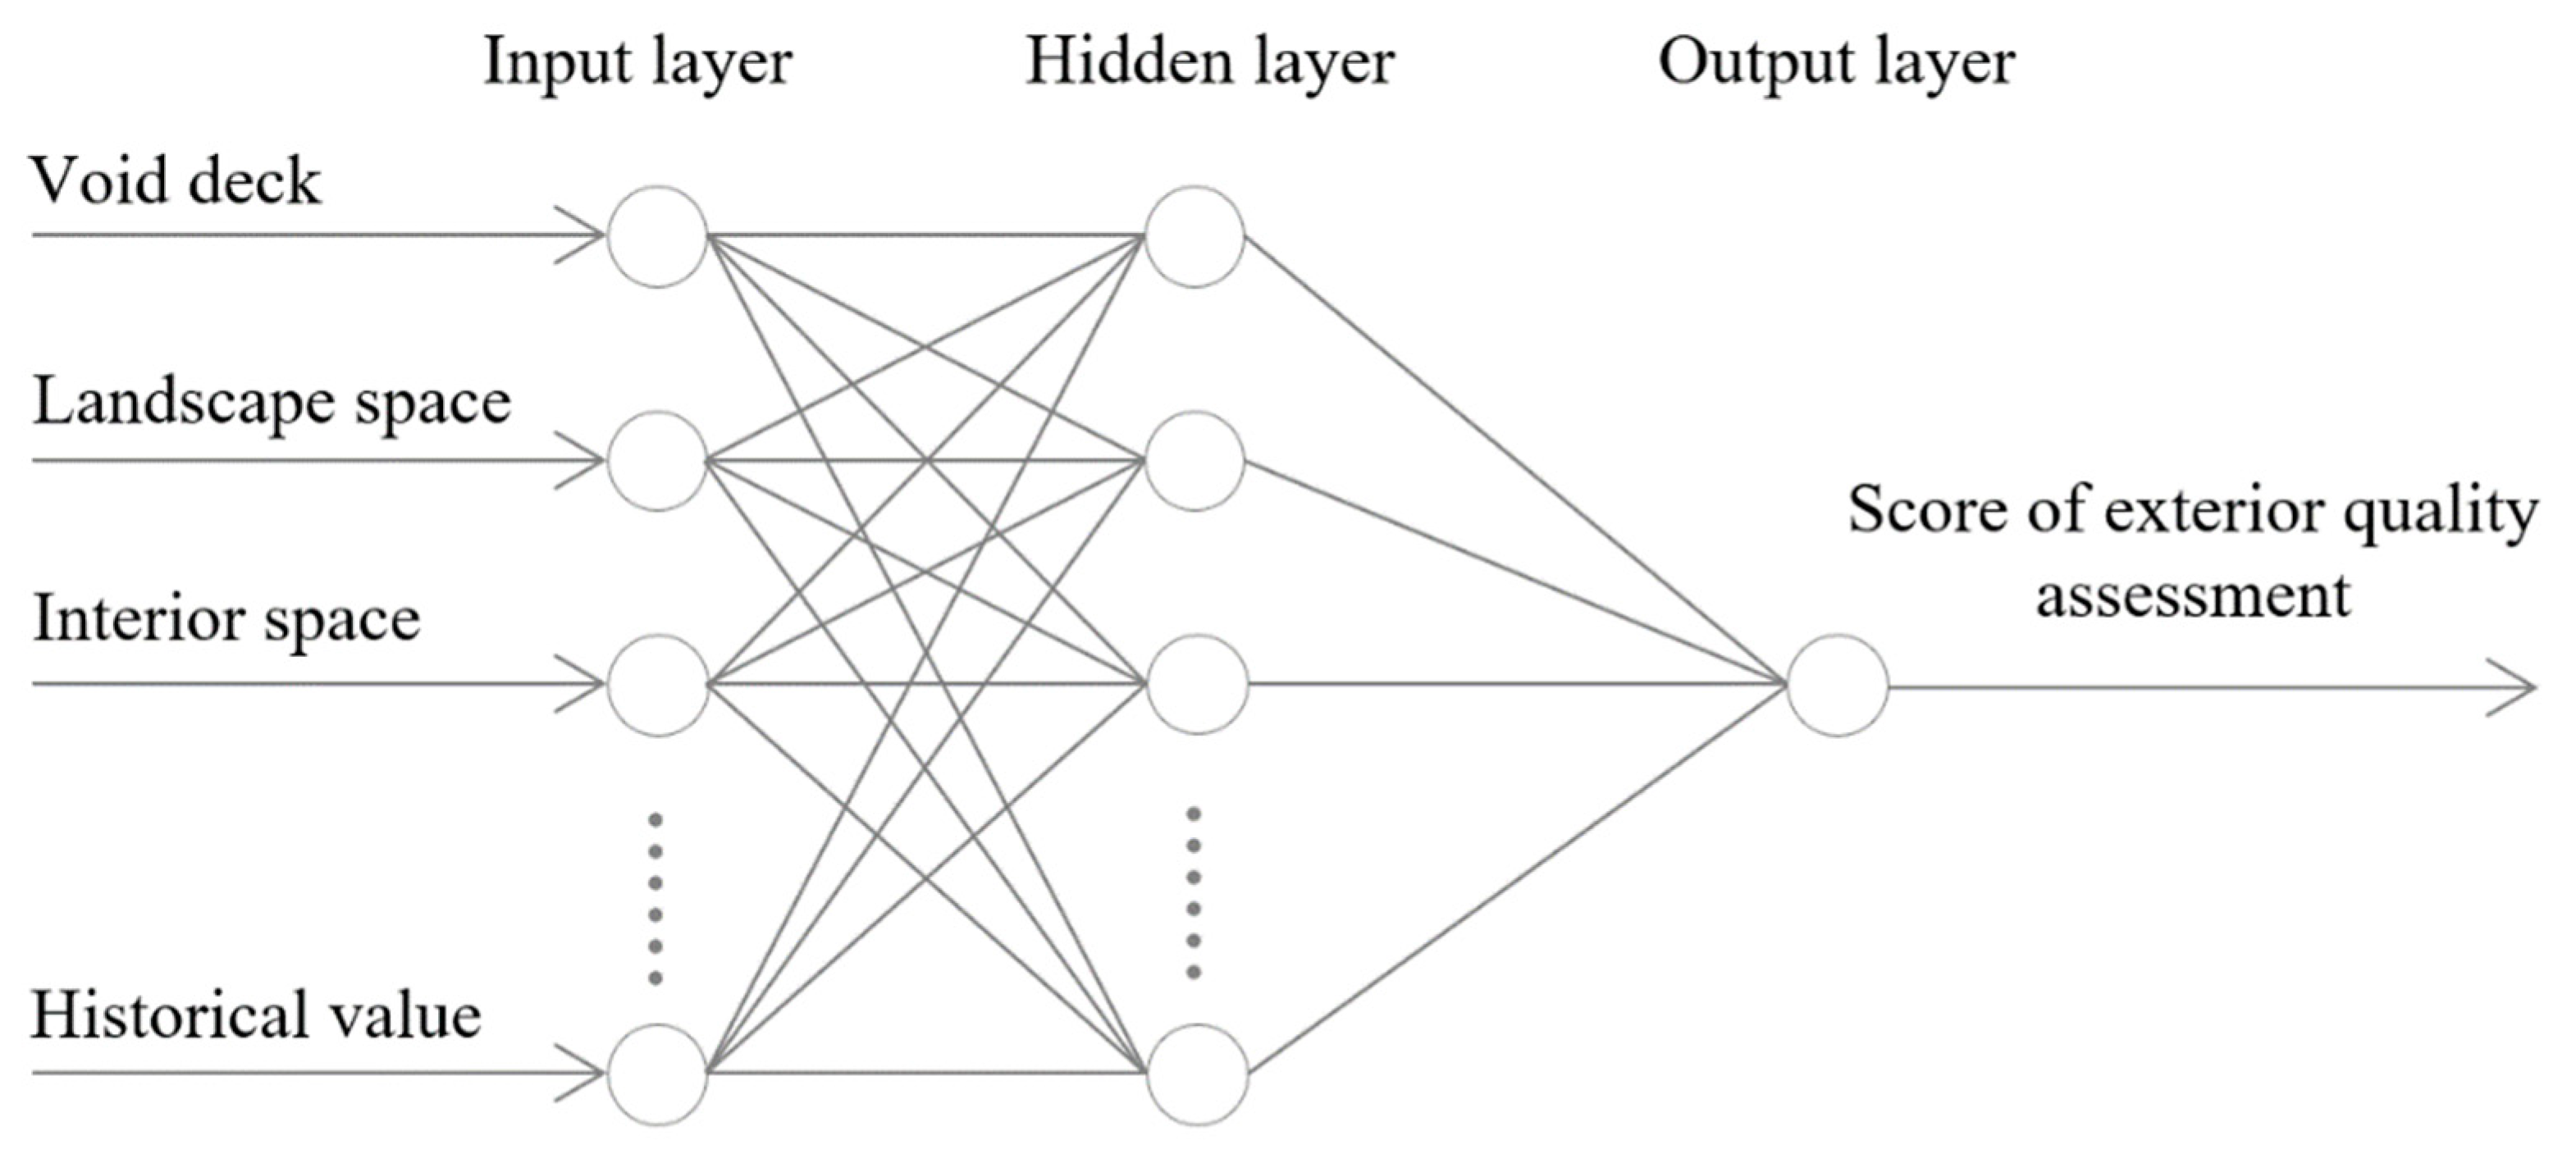
2.4.2. Design of GA–BP Neural Network Model
- 1.
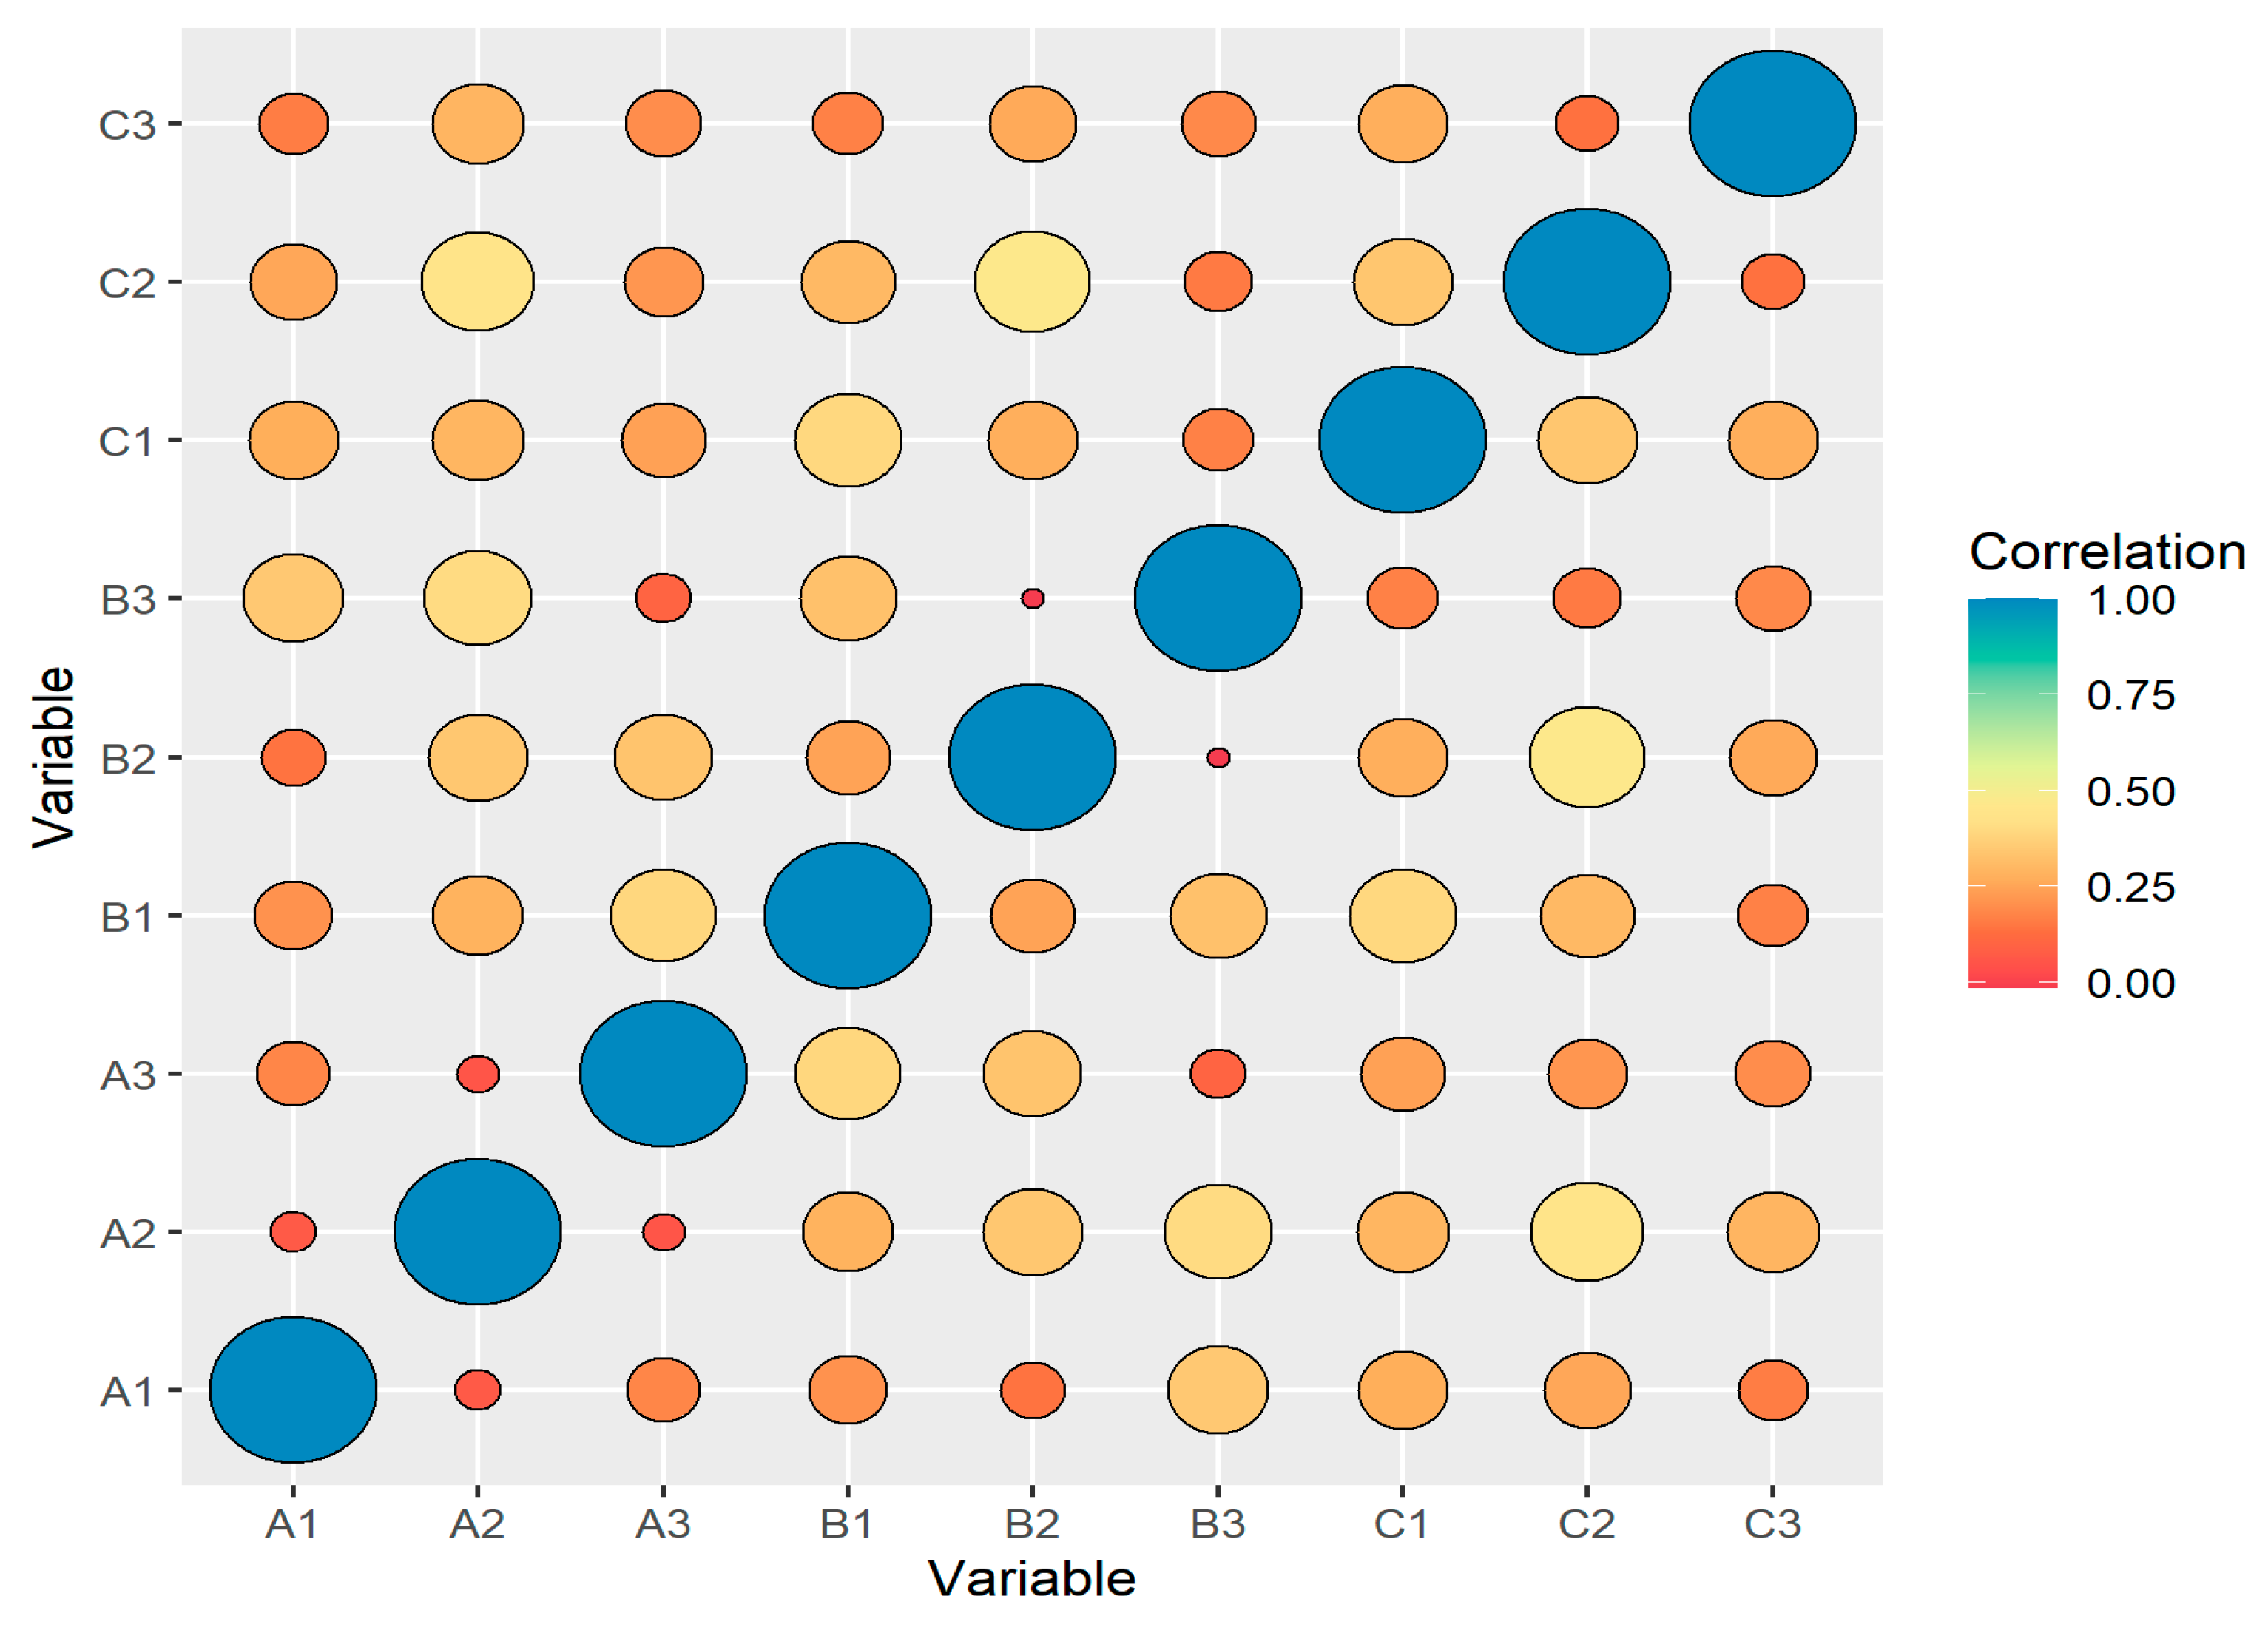
- Correlation analysis of indicators
- 2.
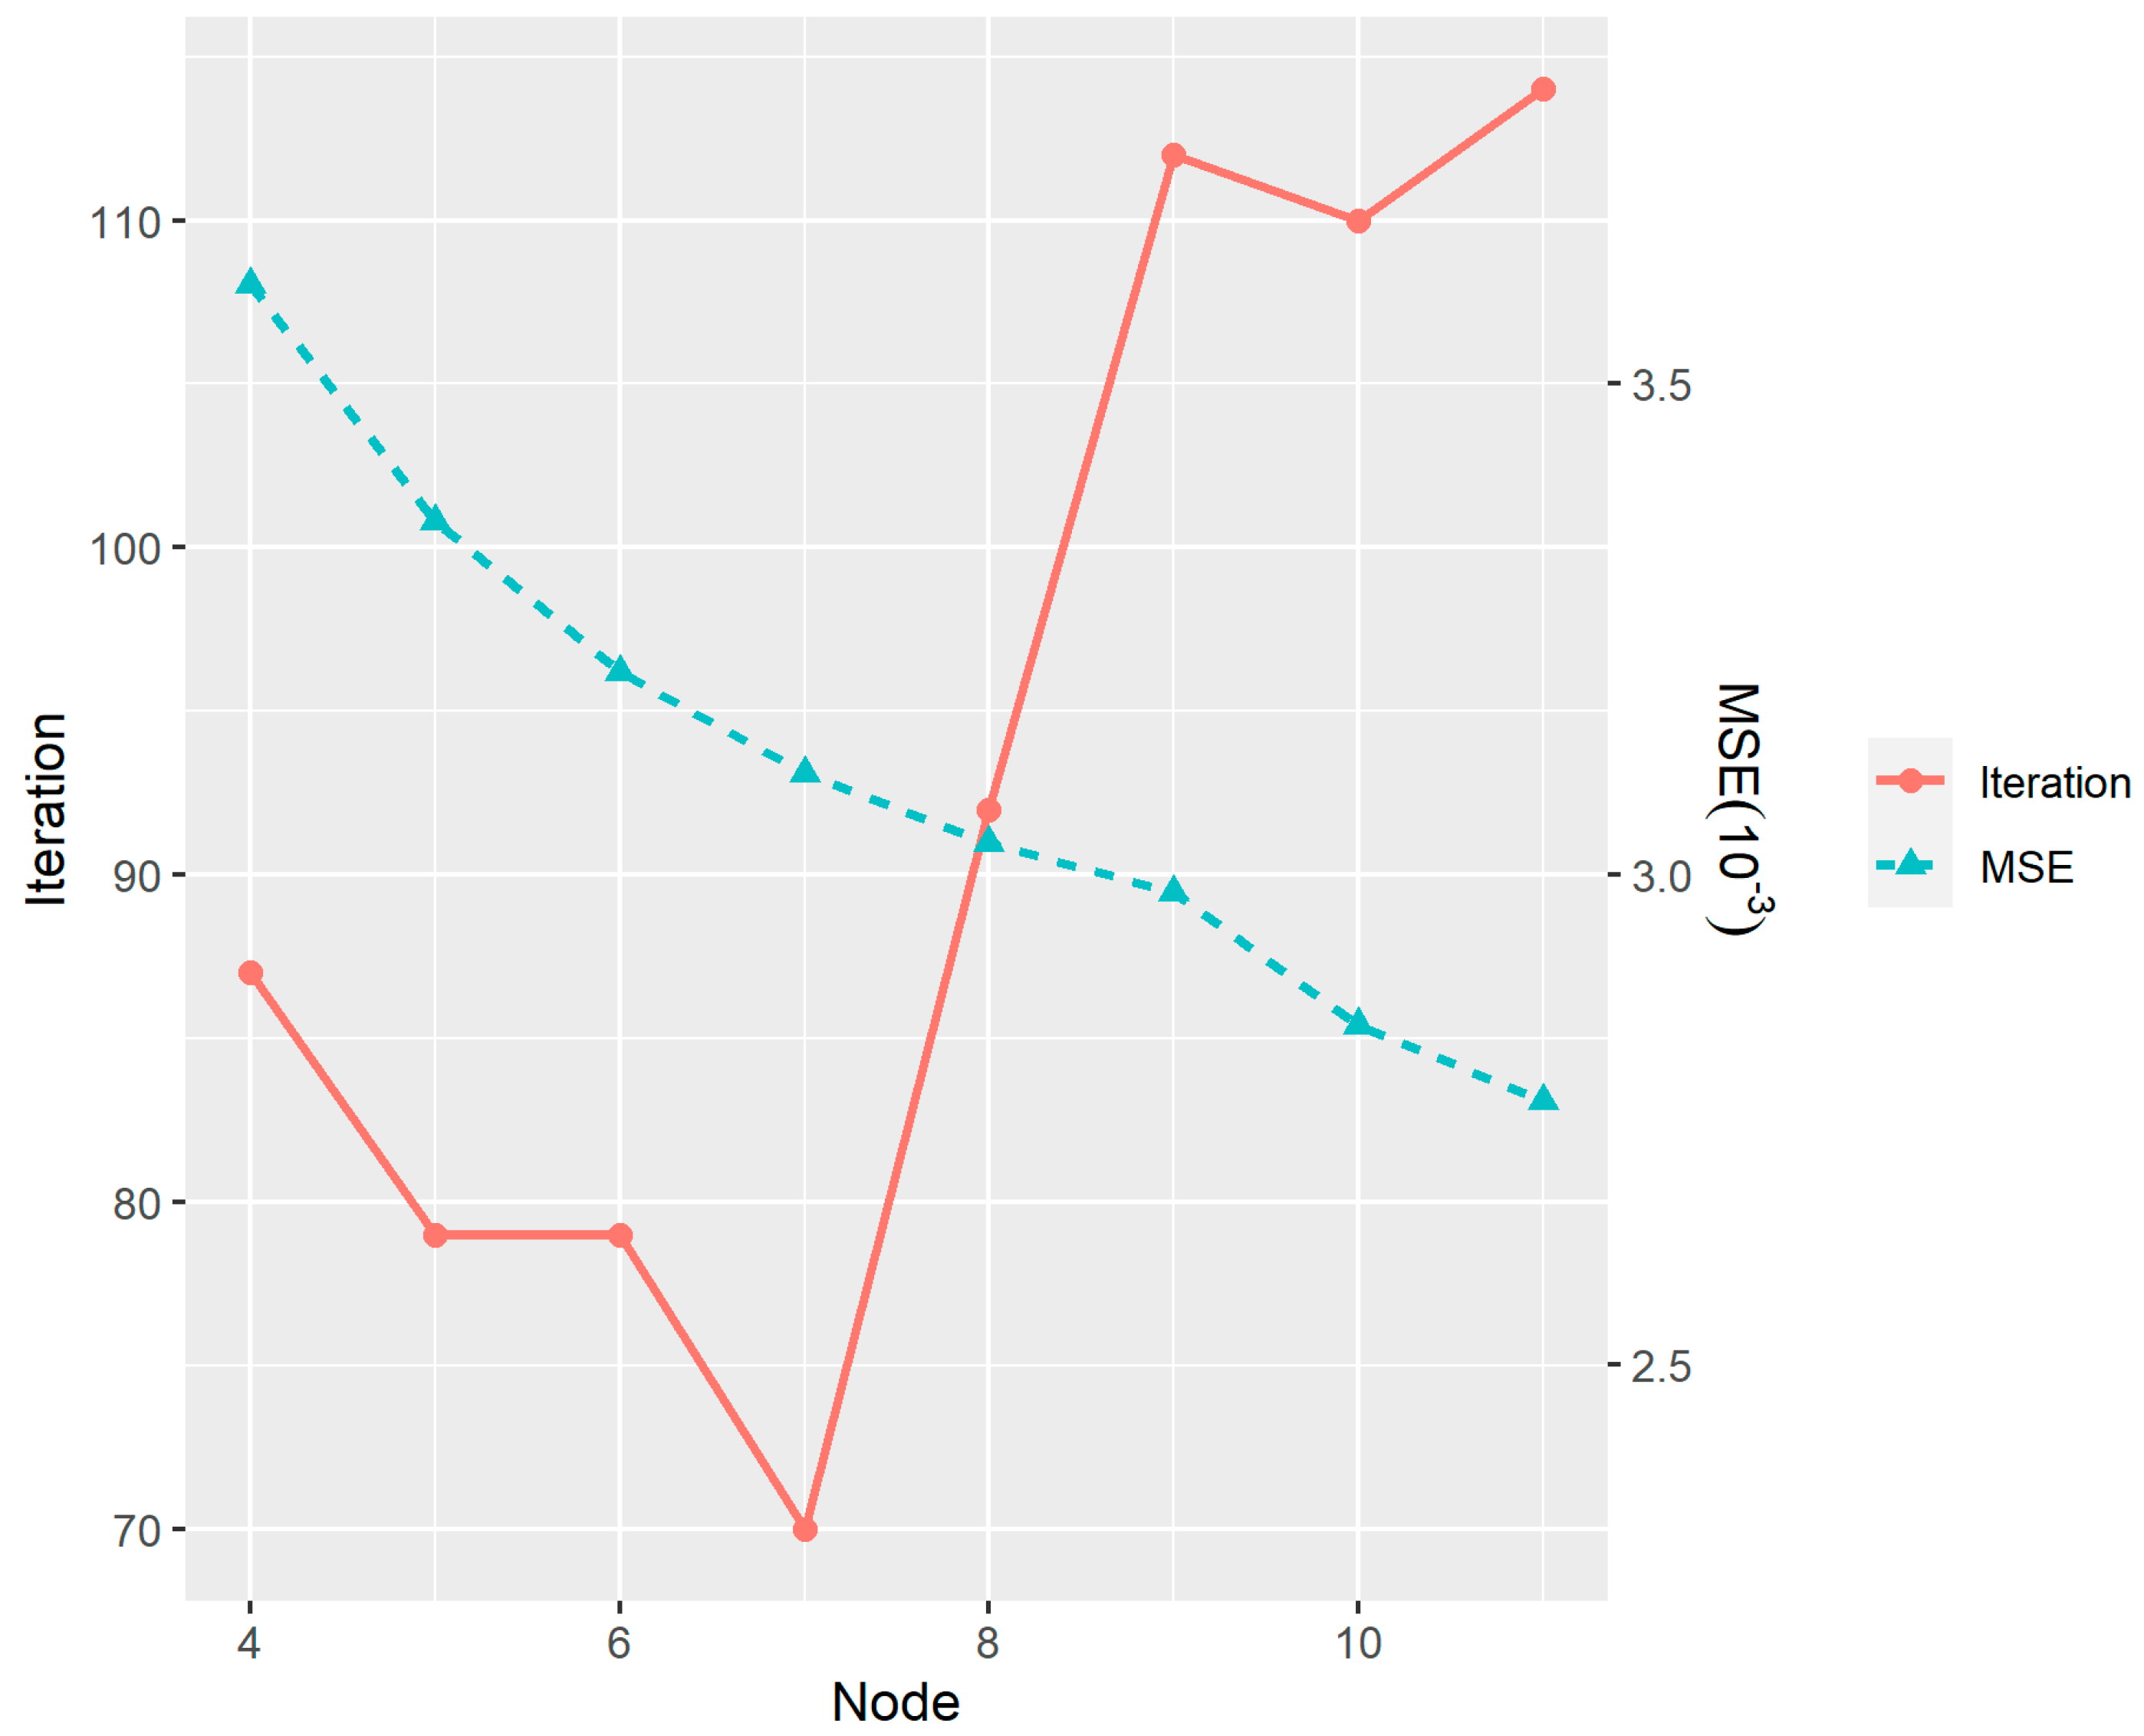
- BP neural network model setup
3. GA Setting
3.1. Selection and Learning of Training Samples
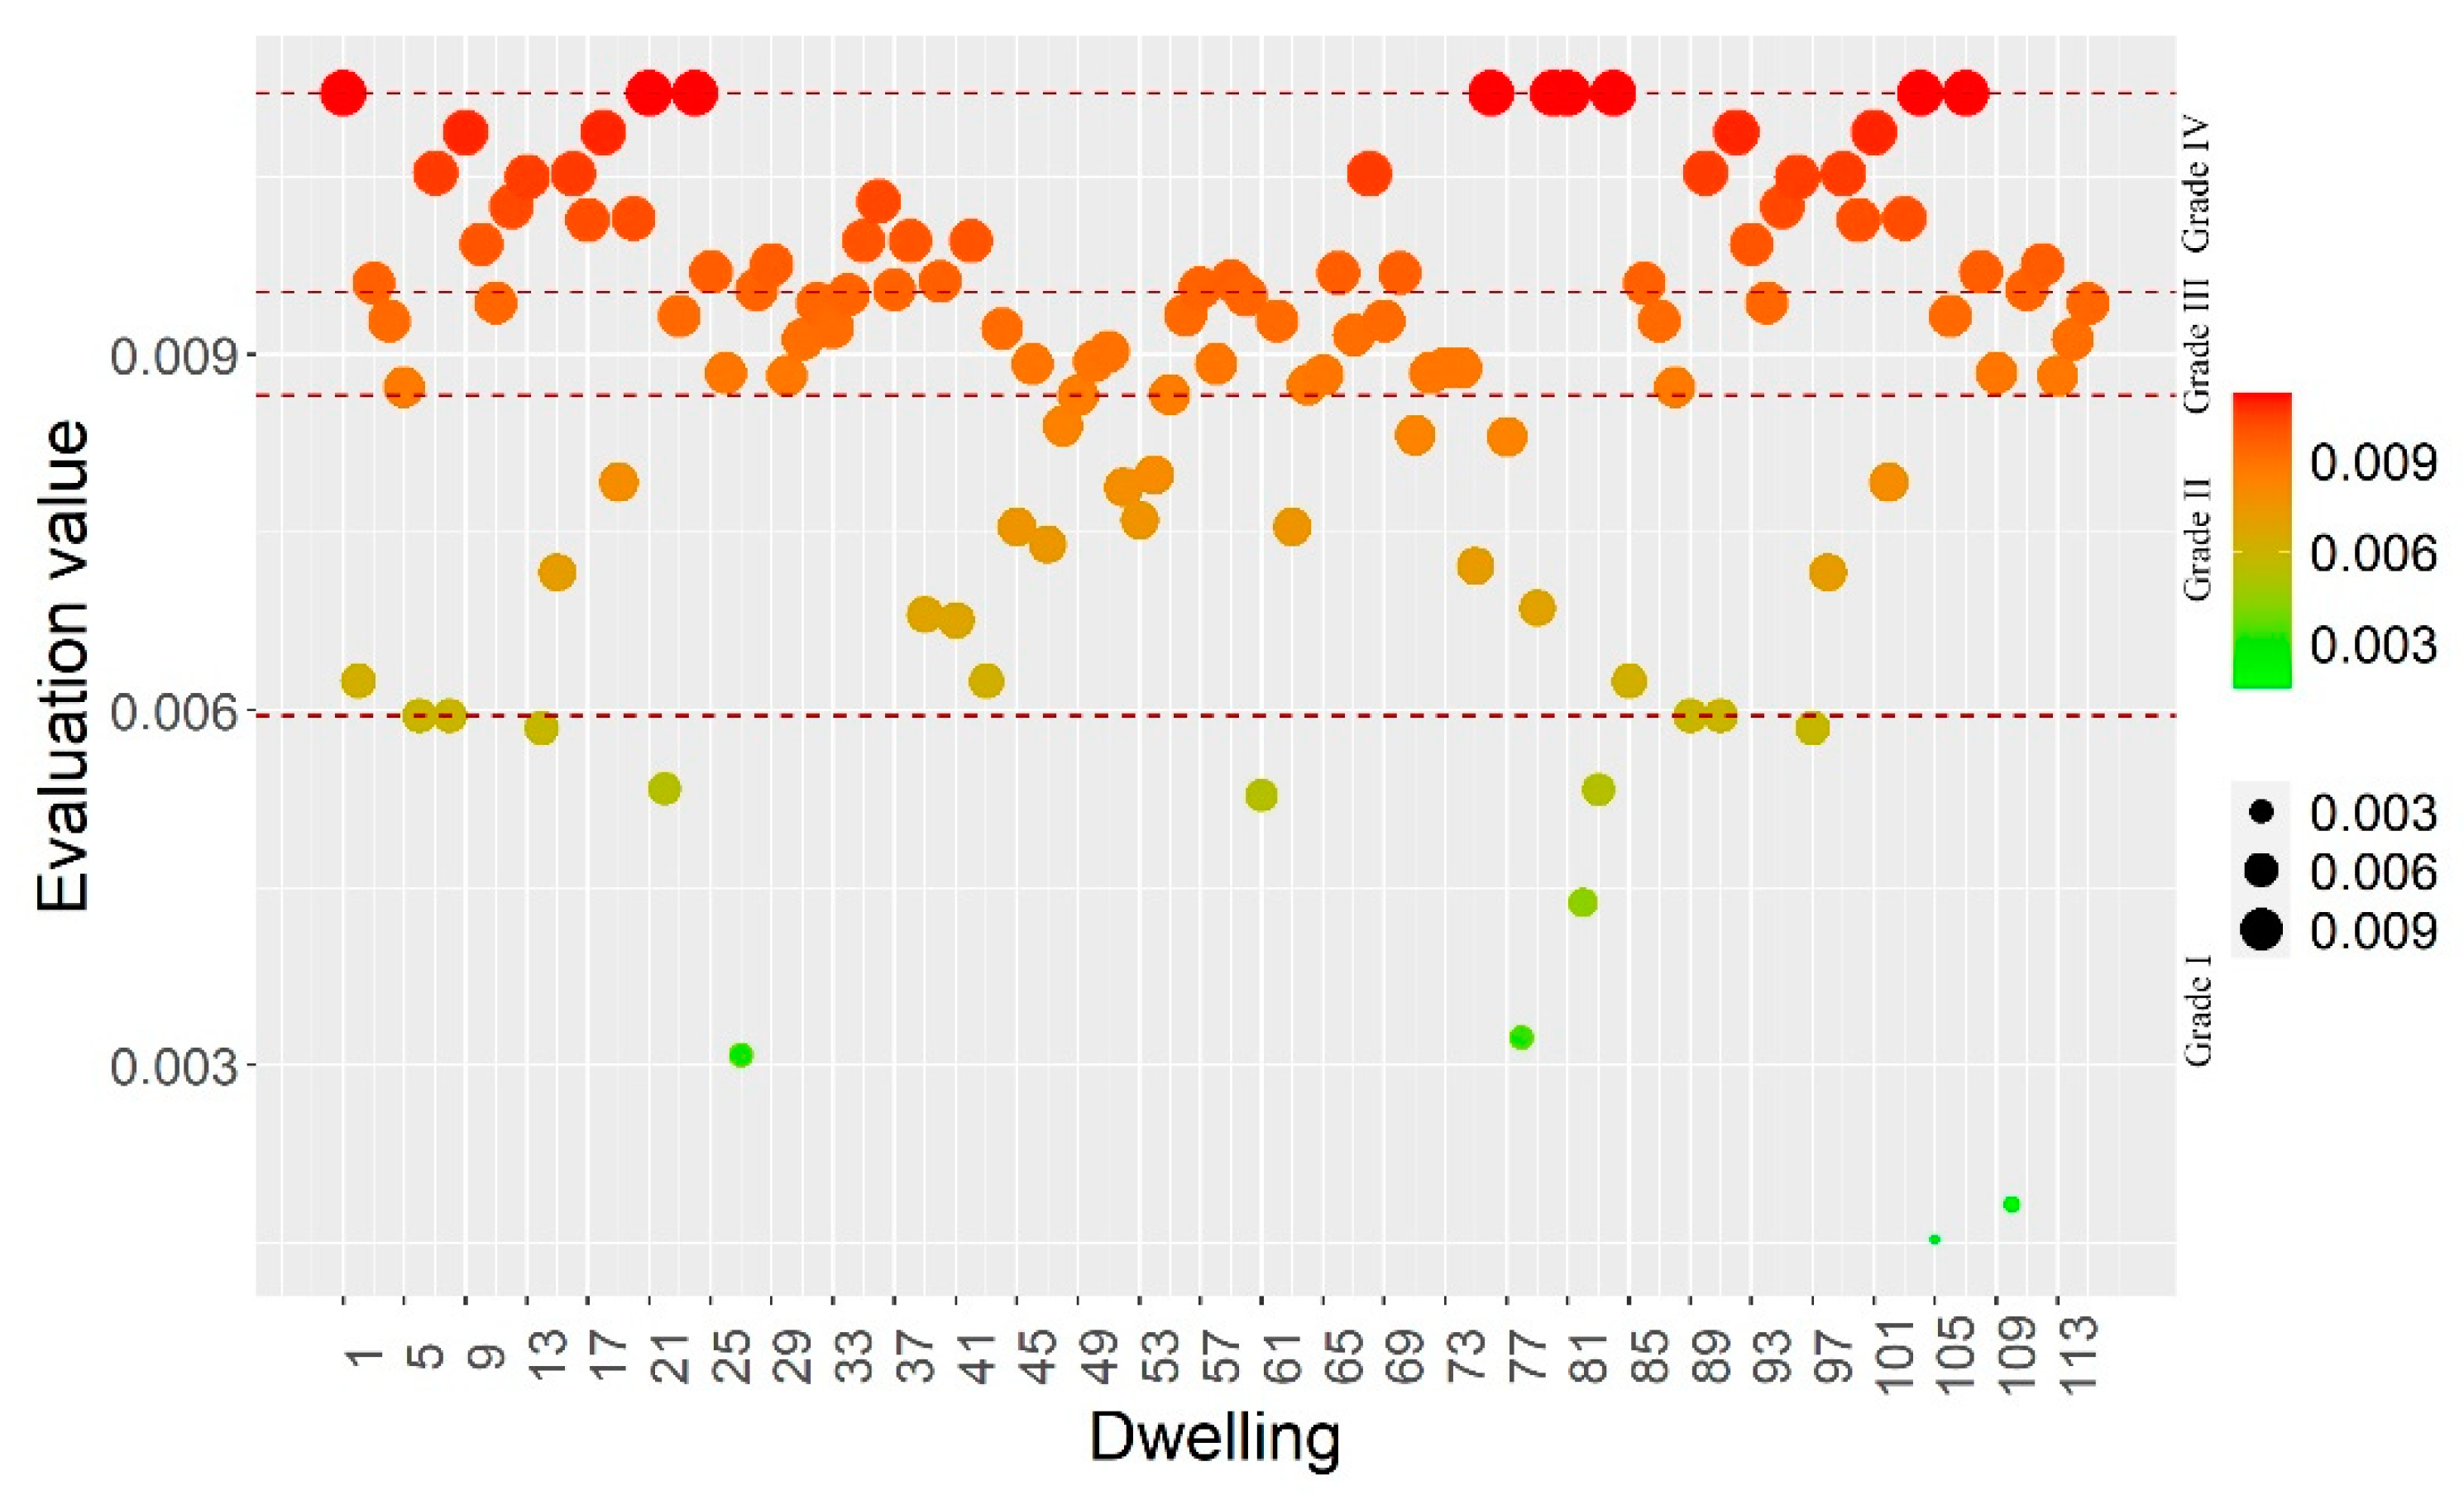
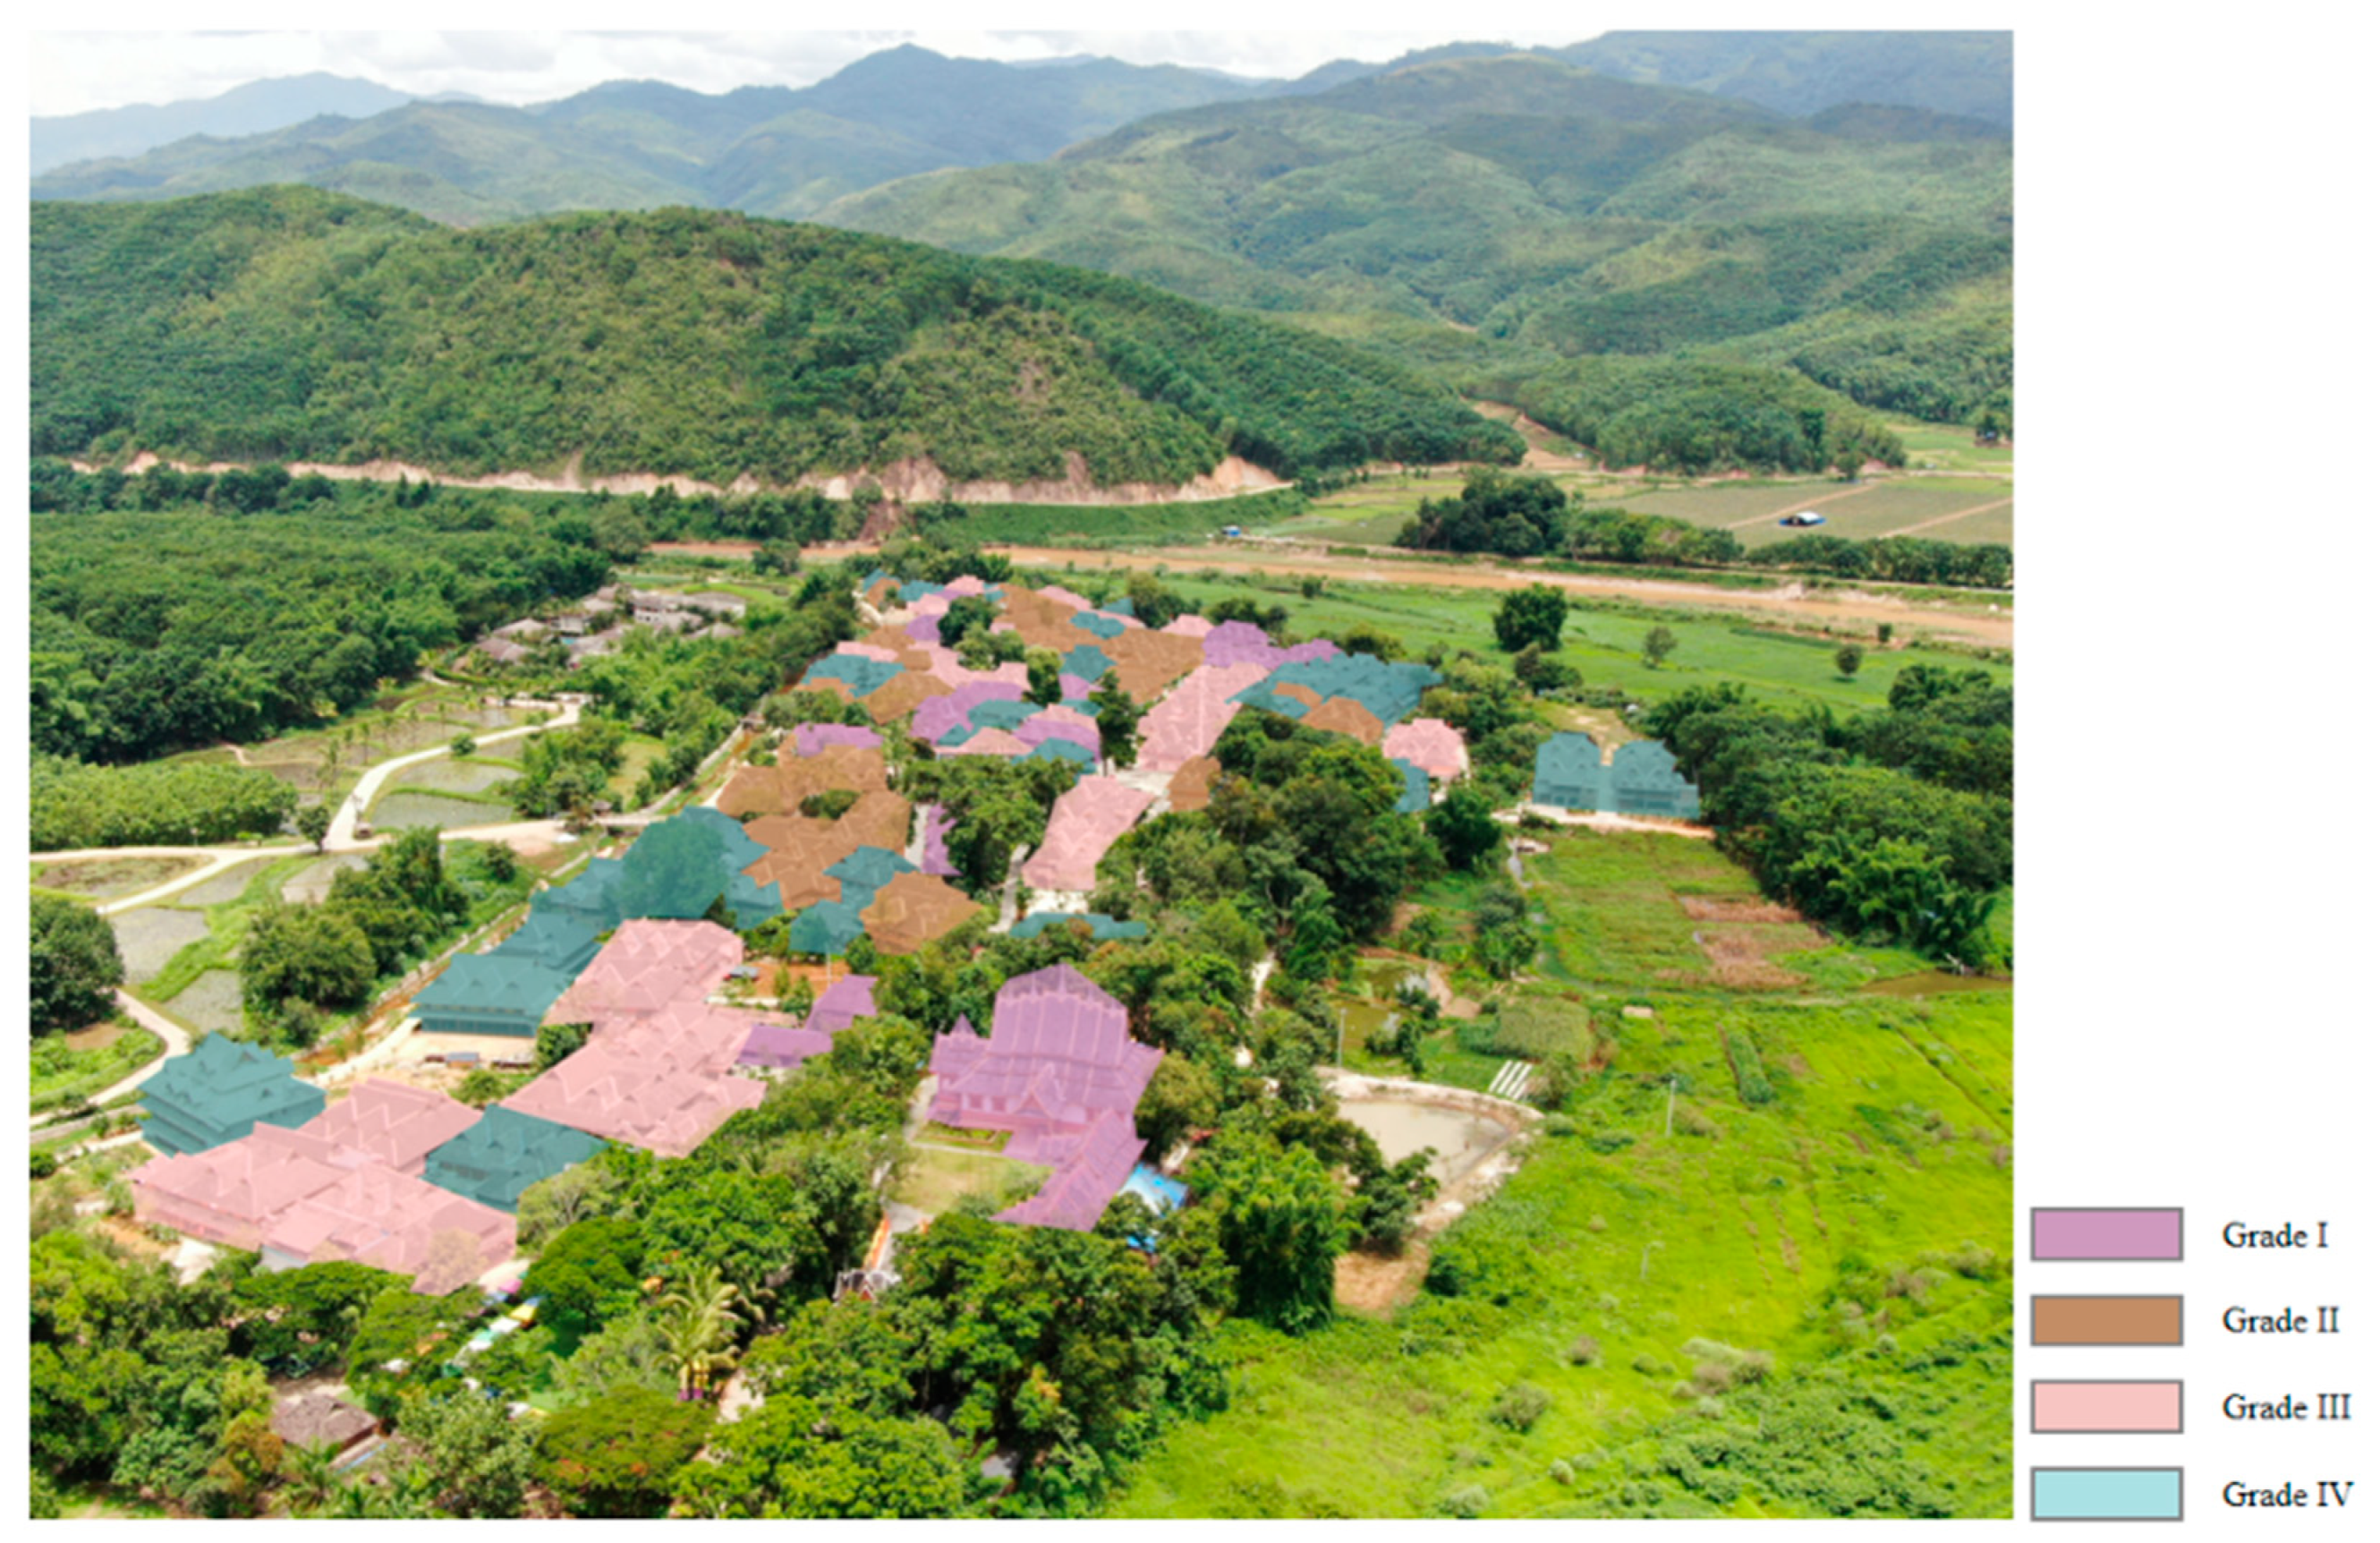
3.2. Analysis of Evaluation Results
4. Discussion
5. Conclusions
Author Contributions
Funding
Institutional Review Board Statement
Informed Consent Statement
Data Availability Statement
Acknowledgments
Conflicts of Interest
References
- Philokyprou, M.; Michael, A. Environmental sustainability in the conservation of vernacular architecture. The case of rural and urban traditional settlements in Cyprus. Int. J. Archit. Herit. 2021, 15, 1741–1763. [Google Scholar] [CrossRef]
- Verdini, G.; Frassoldati, F.; Nolf, C. Reframing China’s heritage conservation discourse. Learning by testing civic engagement tools in a historic rural village. Int. J. Herit. Stud. 2017, 23, 317–334. [Google Scholar] [CrossRef]
- Hearn, K.P. Mapping the past: Using ethnography and local spatial knowledge to characterize the Duero river borderlands landscape. J. Rural Stud. 2021, 82, 37–53. [Google Scholar] [CrossRef]
- Karahan, F.; Davardoust, S. Evaluation of vernacular architecture of Uzundere district (Architectural typology and physical form of building) in relation to ecological sustainable development. J. Asian Archit. Build. Eng. 2020, 19, 490–501. [Google Scholar] [CrossRef] [Green Version]
- Tobi, H.; Kampen, J.K. Research design: The methodology for interdisciplinary research framework. Qual. Quant. 2018, 52, 1209–1225. [Google Scholar] [CrossRef] [Green Version]
- Fu, J.; Zhou, J.L.; Deng, Y.Y. Heritage values of ancient vernacular residences in traditional villages in Western Hunan, China: Spatial patterns and influencing factors. Build. Environ. 2021, 188, 107473. [Google Scholar] [CrossRef]
- Astuti, K.A. Community-based tourism: Measuring readiness of artificial intelligence on traditional village. Int. J. Soc. Sci. Humanit. 2019, 3, 81–89. [Google Scholar] [CrossRef] [Green Version]
- Hecht-Nielsen, R. Theory of the Backpropagation Neural Network. Neural Networks for Perception; Academic Press, Inc.: Cambridge, MA, USA, 1992. [Google Scholar]
- Whitley, D. A genetic algorithm tutorial. Stat. Comput. 1994, 4, 65–85. [Google Scholar] [CrossRef]
- Hammouche, K.; Diaf, M.; Siarry, P. A multilevel automatic thresholding method based on a genetic algorithm for a fast image segmentation. Comput. Vis. Image Underst. 2008, 109, 163–175. [Google Scholar] [CrossRef]
- Sotomayor, G.; Hampel, H.; Vázquez, R.F. Water quality assessment with emphasis in parameter optimisation using pattern recognition methods and genetic algorithm. Water Res. 2018, 130, 353–362. [Google Scholar] [CrossRef]
- Zhang, A.; Bokel, R.; van den Dobbelsteen, A.; Sun, Y.; Huang, Q.; Zhang, Q. Optimization of thermal and daylight performance of school buildings based on a multi-objective genetic algorithm in the cold climate of China. Energy Build. 2017, 139, 371–384. [Google Scholar] [CrossRef]
- Al Ohali, Y. Computer vision based date fruit grading system: Design and implementation. J. King Saud Univ.-Comput. Inf. Sci. 2011, 23, 29–36. [Google Scholar] [CrossRef] [Green Version]
- Wang, L.; Bi, X. Risk assessment of knowledge fusion in an innovation ecosystem based on a GA-BP neural network. Cogn. Syst. Res. 2021, 66, 201–210. [Google Scholar] [CrossRef]
- Li, Z.; Wang, Y.; Olgun, C.G.; Yang, S.; Jiao, Q.; Wang, M. Risk assessment of water inrush caused by karst cave in tunnels based on reliability and GA-BP neural network. Geomat. Nat. Hazards Risk 2020, 11, 1212–1232. [Google Scholar] [CrossRef]
- Zhu, C.; Zhang, J.; Liu, Y.; Ma, D.; Li, M.; Xiang, B. Comparison of GA-BP and PSO-BP Neural Network Models with Initial BP Model for Rainfall-Induced Landslides Risk Assessment in Regional Scale: A Case Study in Sichuan, China; Springer: Dordrecht, The Netherlands, 2020; Volume 100, ISBN 0123456789. [Google Scholar]
- Dai, Z.; Sun, C.; Zhao, L.; Li, Z. Assessment of smart learning environments in higher educational institutions: A study using AHP-FCE and GA-BP methods. IEEE Access 2021, 9, 35487–35500. [Google Scholar] [CrossRef]
- Kastenholz, E.; Carneiro, M.J.; Peixeira Marques, C.; Lima, J. Understanding and managing the rural tourism experience—The case of a historical village in Portugal. Tour. Manag. Perspect. 2012, 4, 207–214. [Google Scholar] [CrossRef]
- Polo López, C.S.; Lucchi, E.; Leonardi, E.; Durante, A.; Schmidt, A.; Curtis, R. Risk-benefit assessment scheme for renewable solar solutions in traditional and historic buildings. Sustainability 2021, 13, 5246. [Google Scholar] [CrossRef]
- İpekoğlu, B. An architectural evaluation method for conservation of traditional dwellings. Build. Environ. 2006, 41, 386–394. [Google Scholar] [CrossRef] [Green Version]
- Yang, L.; Wall, G. Minorities and tourism: Community perspectives from Yunnan, China. J. Tour. Cult. Chang. 2009, 7, 77–98. [Google Scholar] [CrossRef]
- Yang, L.; Wall, G. The evolution and status of tourism planning: Xishuangbanna, Yunnan, China. Tour. Hosp. Plan. Dev. 2008, 5, 165–182. [Google Scholar] [CrossRef]
- Gao, J.; Ryan, C.; Cave, J.; Zhang, C. Tourism border-making: A political economy of China’s border tourism. Ann. Tour. Res. 2019, 76, 1–13. [Google Scholar] [CrossRef]
- Kokorsch, M.; Benediktsson, K. Prosper or perish? The development of Icelandic fishing villages after the privatisation of fishing rights. Marit. Stud. 2018, 17, 69–83. [Google Scholar] [CrossRef] [Green Version]
- Shang, Y.; Zheng, X.; Han, R.; Liu, W.; Xiao, F. Long-term evaluation on urban intensive land use in five fast-growing cities of Northern China with GEE support. Sci. Rep. 2021, 11, 20734. [Google Scholar] [CrossRef] [PubMed]
- Chew, L.W.; Norford, L.K. Pedestrian-level wind speed enhancement in urban street canyons with void decks. Build. Environ. 2018, 146, 64–76. [Google Scholar] [CrossRef] [Green Version]
- Nawre, A.; Wong, T.W.; Boyle-Milroy, L. Landscape architecture in rural India—Lessons for developing countries from Dhamori village. Landsc. Res. 2021, 46, 1089–1105. [Google Scholar] [CrossRef]
- Suryono, A. Preservation of the manifestation of balinese cultural traditions in the current architecture of public buildings: A case study of the Mandala Agung building of the Puri Ahimsa resort in Mambal village–Bali. J. Archit. Conserv. 2021, 27, 53–65. [Google Scholar] [CrossRef]
- Su, K.; Hu, B.; Shi, K.; Zhang, Z.; Yang, Q. The structural and functional evolution of rural homesteads in mountainous areas: A case study of Sujiaying village in Yunnan province, China. Land Use Policy 2019, 88, 104100. [Google Scholar] [CrossRef]
- Pappas, A.; Da Porto, F.; Modena, C. Seismic vulnerability assessment form for free-standing columns based on a simplified numerical analysis. Int. J. Archit. Herit. 2016, 10, 281–299. [Google Scholar] [CrossRef]
- Bláha, J.; Kloiber, M.; Serafini, A. A comparison of two distinct roof timber frame systems implemented in the past in house no. 414/I in Prague. Int. J. Archit. Herit. 2018, 12, 749–759. [Google Scholar] [CrossRef]
- Oakes, T. Villagizing the city: Turning rural ethnic heritage into urban modernity in Southwest China. Int. J. Herit. Stud. 2016, 22, 751–765. [Google Scholar] [CrossRef]
- Masuda, A.D.; Sortheix, F.M.; Beham, B.; Naidoo, L.J. Cultural value orientations and work–family conflict: The mediating role of work and family demands. J. Vocat. Behav. 2019, 112, 294–310. [Google Scholar] [CrossRef]
- Zeng, Y.R.; Zeng, Y.; Choi, B.; Wang, L. Multifactor-influenced energy consumption forecasting using enhanced back-propagation neural network. Energy 2017, 127, 381–396. [Google Scholar] [CrossRef]
- Hasanova, N. A comparative study of particle swarm optimization and genetic algorithm. Qubahan Acad. J. 2020, 1, 33–45. [Google Scholar] [CrossRef]
- Geng, Z.; Zhang, Y.; Li, C.; Han, Y.; Cui, Y.; Yu, B. Energy optimization and prediction modeling of petrochemical industries: An improved convolutional neural network based on cross-feature. Energy 2020, 194, 116851. [Google Scholar] [CrossRef]
- Wu, Y.; Gao, R.; Yang, J. Prediction of coal and gas outburst: A method based on the BP neural network optimized by GASA. Process Saf. Environ. Prot. 2020, 133, 64–72. [Google Scholar] [CrossRef]
- Pan, L.; Zhao, L.; Song, A.; She, S.; Wang, S. Research on gear fault diagnosis based on feature fusion optimization and improved two hidden layer extreme learning machine. Meas. J. Int. Meas. Confed. 2021, 177, 109317. [Google Scholar] [CrossRef]
- Pan, Y.; Ou, S.; Zhang, L.; Zhang, W.; Wu, X.; Li, H. Modeling risks in dependent systems: A copula-Bayesian approach. Reliab. Eng. Syst. Saf. 2019, 188, 416–431. [Google Scholar] [CrossRef]
- Cheng, S.; Wu, Y.; Li, Y.; Yao, F.; Min, F. TWD-SFNN: Three-way decisions with a single hidden layer feedforward neural network. Inf. Sci. 2021, 579, 15–32. [Google Scholar] [CrossRef]
- Adame, B.O.; Salau, A.O. Genetic algorithm based optimum finger selection for adaptive minimum mean square error rake receivers discrete sequence-CDMA ultra-wide band systems. Wirel. Pers. Commun. 2021, 123, 1537–1551. [Google Scholar] [CrossRef]
- Veller, C.; Edelman, N.B.; Muralidhar, P.; Nowak, M.A. Variation in genetic relatedness is determined by the aggregate recombination process. Genetics 2020, 216, 985–994. [Google Scholar] [CrossRef]
- Fok, W.W.T.; He, Y.S.; Yeung, H.H.A.; Law, K.Y.; Cheung, K.; Ai, Y.; Ho, P. Prediction Model for Students’ Future Development by Deep Learning And Tensorflow Artificial Intelligence Engine. In Proceedings of the 2018 4th International Conference on Information Management (ICIM), Oxford, UK, 25–27 May 2018; pp. 103–106. [Google Scholar] [CrossRef]
- Yan, C.; Li, M.; Liu, W.; Qi, M. Improved adaptive genetic algorithm for the vehicle insurance fraud identification model based on a BP neural network. Theor. Comput. Sci. 2020, 817, 12–23. [Google Scholar] [CrossRef]
- Wang, S.; Zhang, N.; Wu, L.; Wang, Y. Wind speed forecasting based on the hybrid ensemble empirical mode decomposition and GA-BP neural network method. Renew. Energy 2016, 94, 629–636. [Google Scholar] [CrossRef]


| Primary Indicators | Secondary Indicators | Scoring Criteria | References | |||
|---|---|---|---|---|---|---|
| 1 Point | 2 Points | 3 Points | ||||
| A—Architectural spatial elements | A1 | Void deck | Substantial replacement of timber-frame materials with modern materials and untidy interiors | Partly timber-framed materials and largely furnished interiors | Complete with timber-frame materials and well-furnished interior of the space | [26] |
| A2 | Landscape space | The interior and exterior are largely devoid of landscaped surroundings | Interior and exterior design with partially landscaped surroundings | Interior and exterior design with good landscape setting | [27] | |
| A3 | Interior space | Less use of timber-frame materials, confusing interior layout, and poor lighting and ventilation | Partly timber-framed materials, average interior layout, average lighting and ventilation | Well-preserved timber-frame materials, good interior layout, good lighting and ventilation | [28] | |
| B—Architectural construction elements | B1 | Building materials | The materials used are heavily influenced by the overall Dai style of the dwelling | The materials used have a lighter influence on the overall Dai style of the dwelling | The materials used largely do not detract from the overall Dai style of the dwelling | [29] |
| B2 | Architectural form | A lighter representation of the characteristic Dai style of dwelling | A larger display of the characteristic Dai residential style | A full display of the characteristic Dai style of dwelling | [30] | |
| B3 | Roof frame | Traditional materials are less well preserved and more rarely used | General conservation, mostly in traditional materials | Well-preserved and largely traditional materials | [31] | |
| C—Historical and cultural elements | C1 | Architectural style | Fairly well preserved and not very in keeping with the style of the village | More uniformly preserved and in keeping with the style of the village | The overall architectural style is uniform and in complete harmony with the village | [32] |
| C2 | Cultural value | Has fewer cultural elements | Has general cultural elements | Has significant cultural elements | [33] | |
| C3 | Historical value | Has fewer historical elements | Has general historical elements | Has very strong historical elements | [34] | |
Publisher’s Note: MDPI stays neutral with regard to jurisdictional claims in published maps and institutional affiliations. |
© 2022 by the authors. Licensee MDPI, Basel, Switzerland. This article is an open access article distributed under the terms and conditions of the Creative Commons Attribution (CC BY) license (https://creativecommons.org/licenses/by/4.0/).
Share and Cite
Xu, L.; Liu, K.; Sang, K.; Lin, G.; Luo, Q.; Huang, C.; Giordano, A. Assessment of the Exterior Quality of Traditional Residences: A Genetic Algorithm–Backpropagation Approach. Buildings 2022, 12, 559. https://doi.org/10.3390/buildings12050559
Xu L, Liu K, Sang K, Lin G, Luo Q, Huang C, Giordano A. Assessment of the Exterior Quality of Traditional Residences: A Genetic Algorithm–Backpropagation Approach. Buildings. 2022; 12(5):559. https://doi.org/10.3390/buildings12050559
Chicago/Turabian StyleXu, Lu, Ke Liu, Kun Sang, Guiye Lin, Qingliu Luo, Caizhu Huang, and Andrea Giordano. 2022. "Assessment of the Exterior Quality of Traditional Residences: A Genetic Algorithm–Backpropagation Approach" Buildings 12, no. 5: 559. https://doi.org/10.3390/buildings12050559
APA StyleXu, L., Liu, K., Sang, K., Lin, G., Luo, Q., Huang, C., & Giordano, A. (2022). Assessment of the Exterior Quality of Traditional Residences: A Genetic Algorithm–Backpropagation Approach. Buildings, 12(5), 559. https://doi.org/10.3390/buildings12050559