
Ultrasonic Coda Wave Experiment and Simulation of Concrete Damage Process under Uniaxial Compression


Abstract
:1. Introduction
2. Experimental Study
2.1. Test Specimen
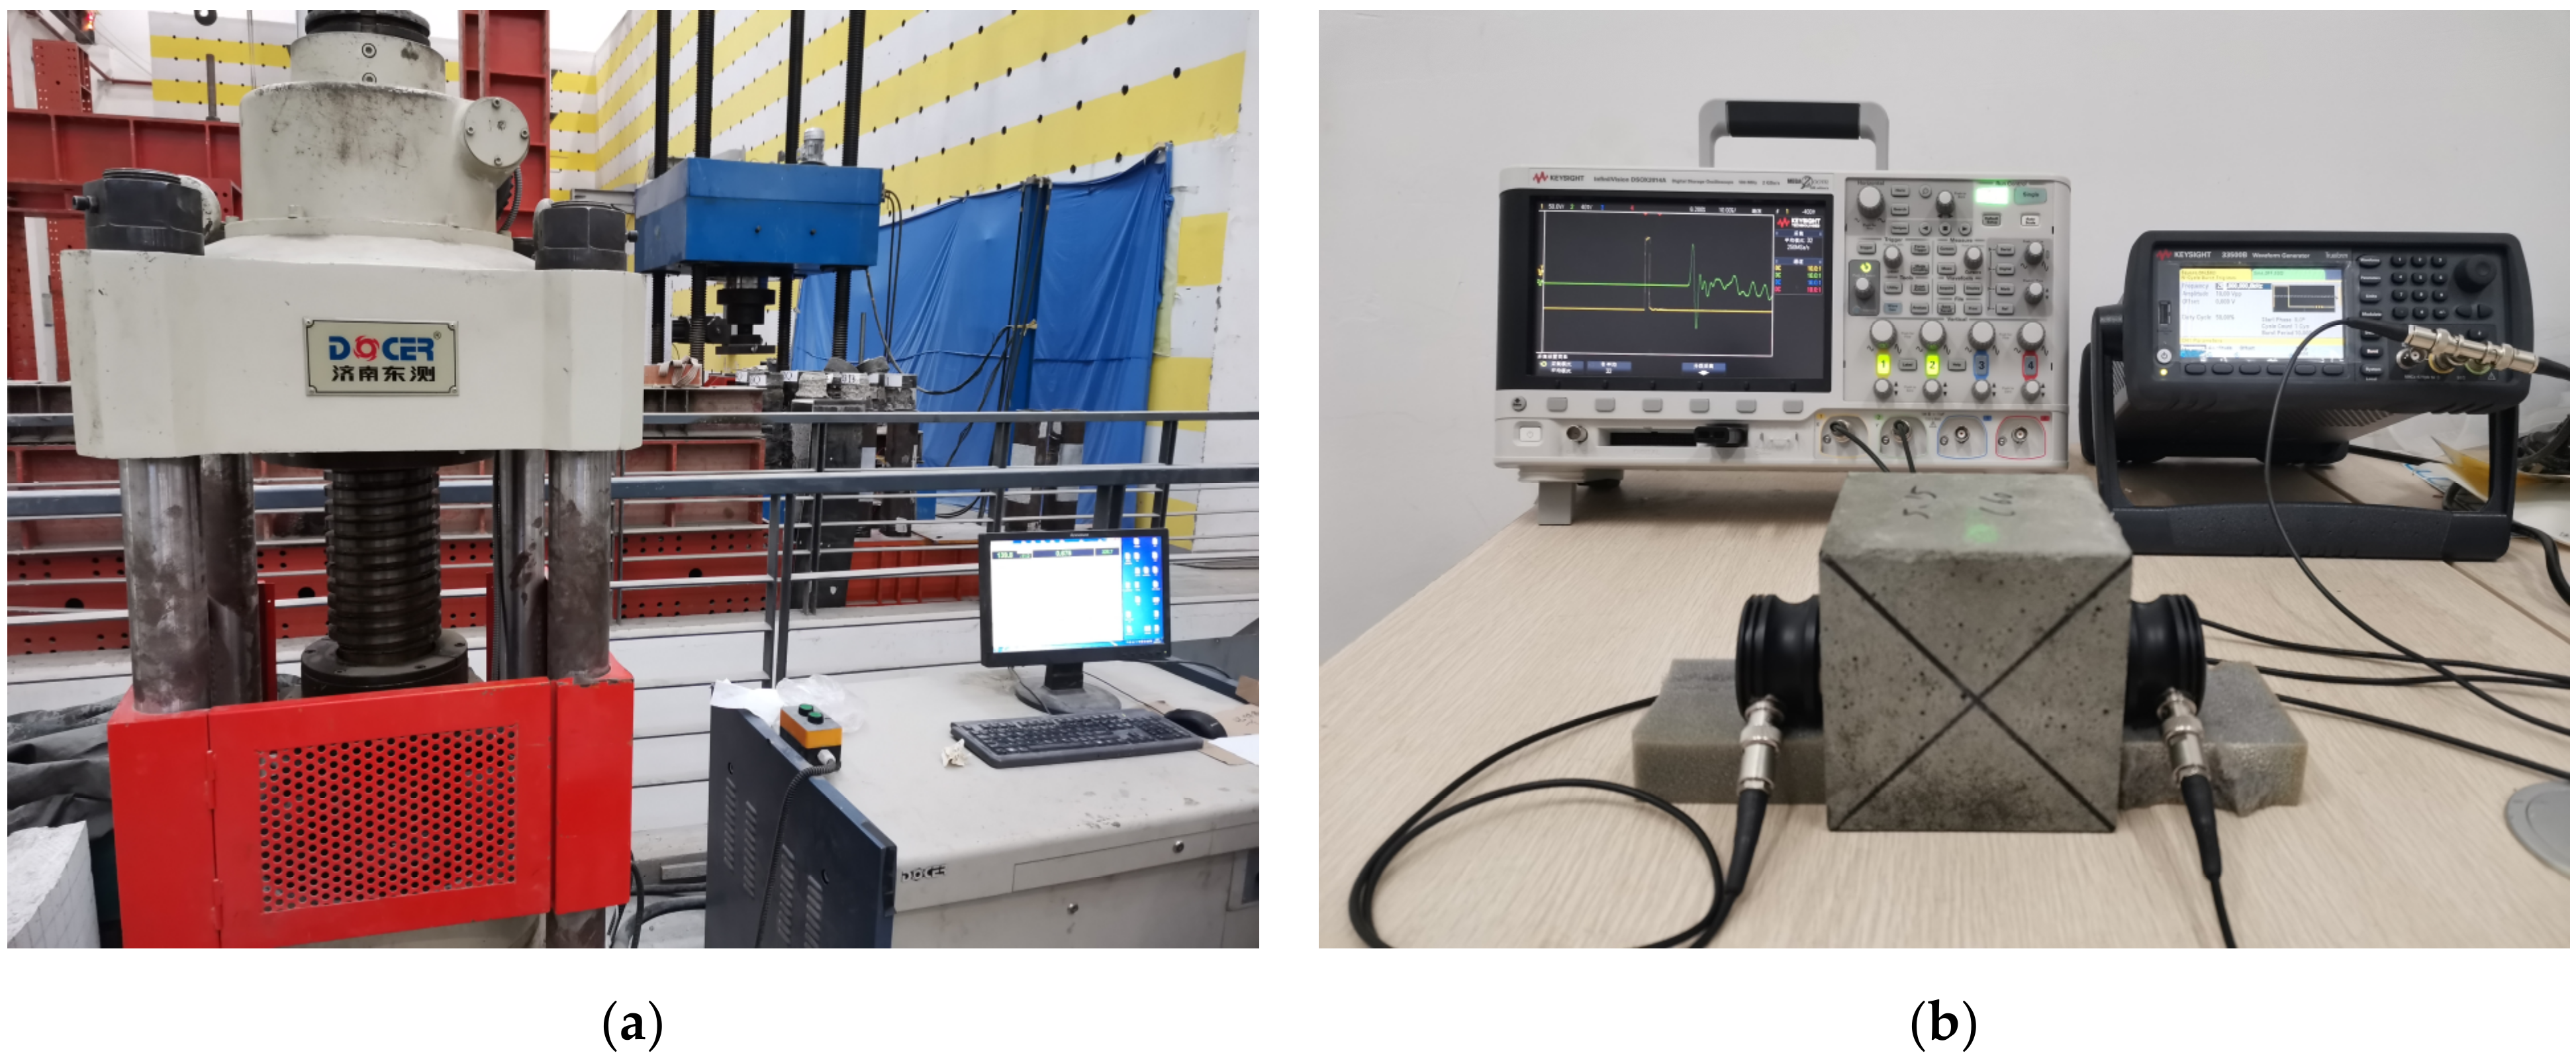
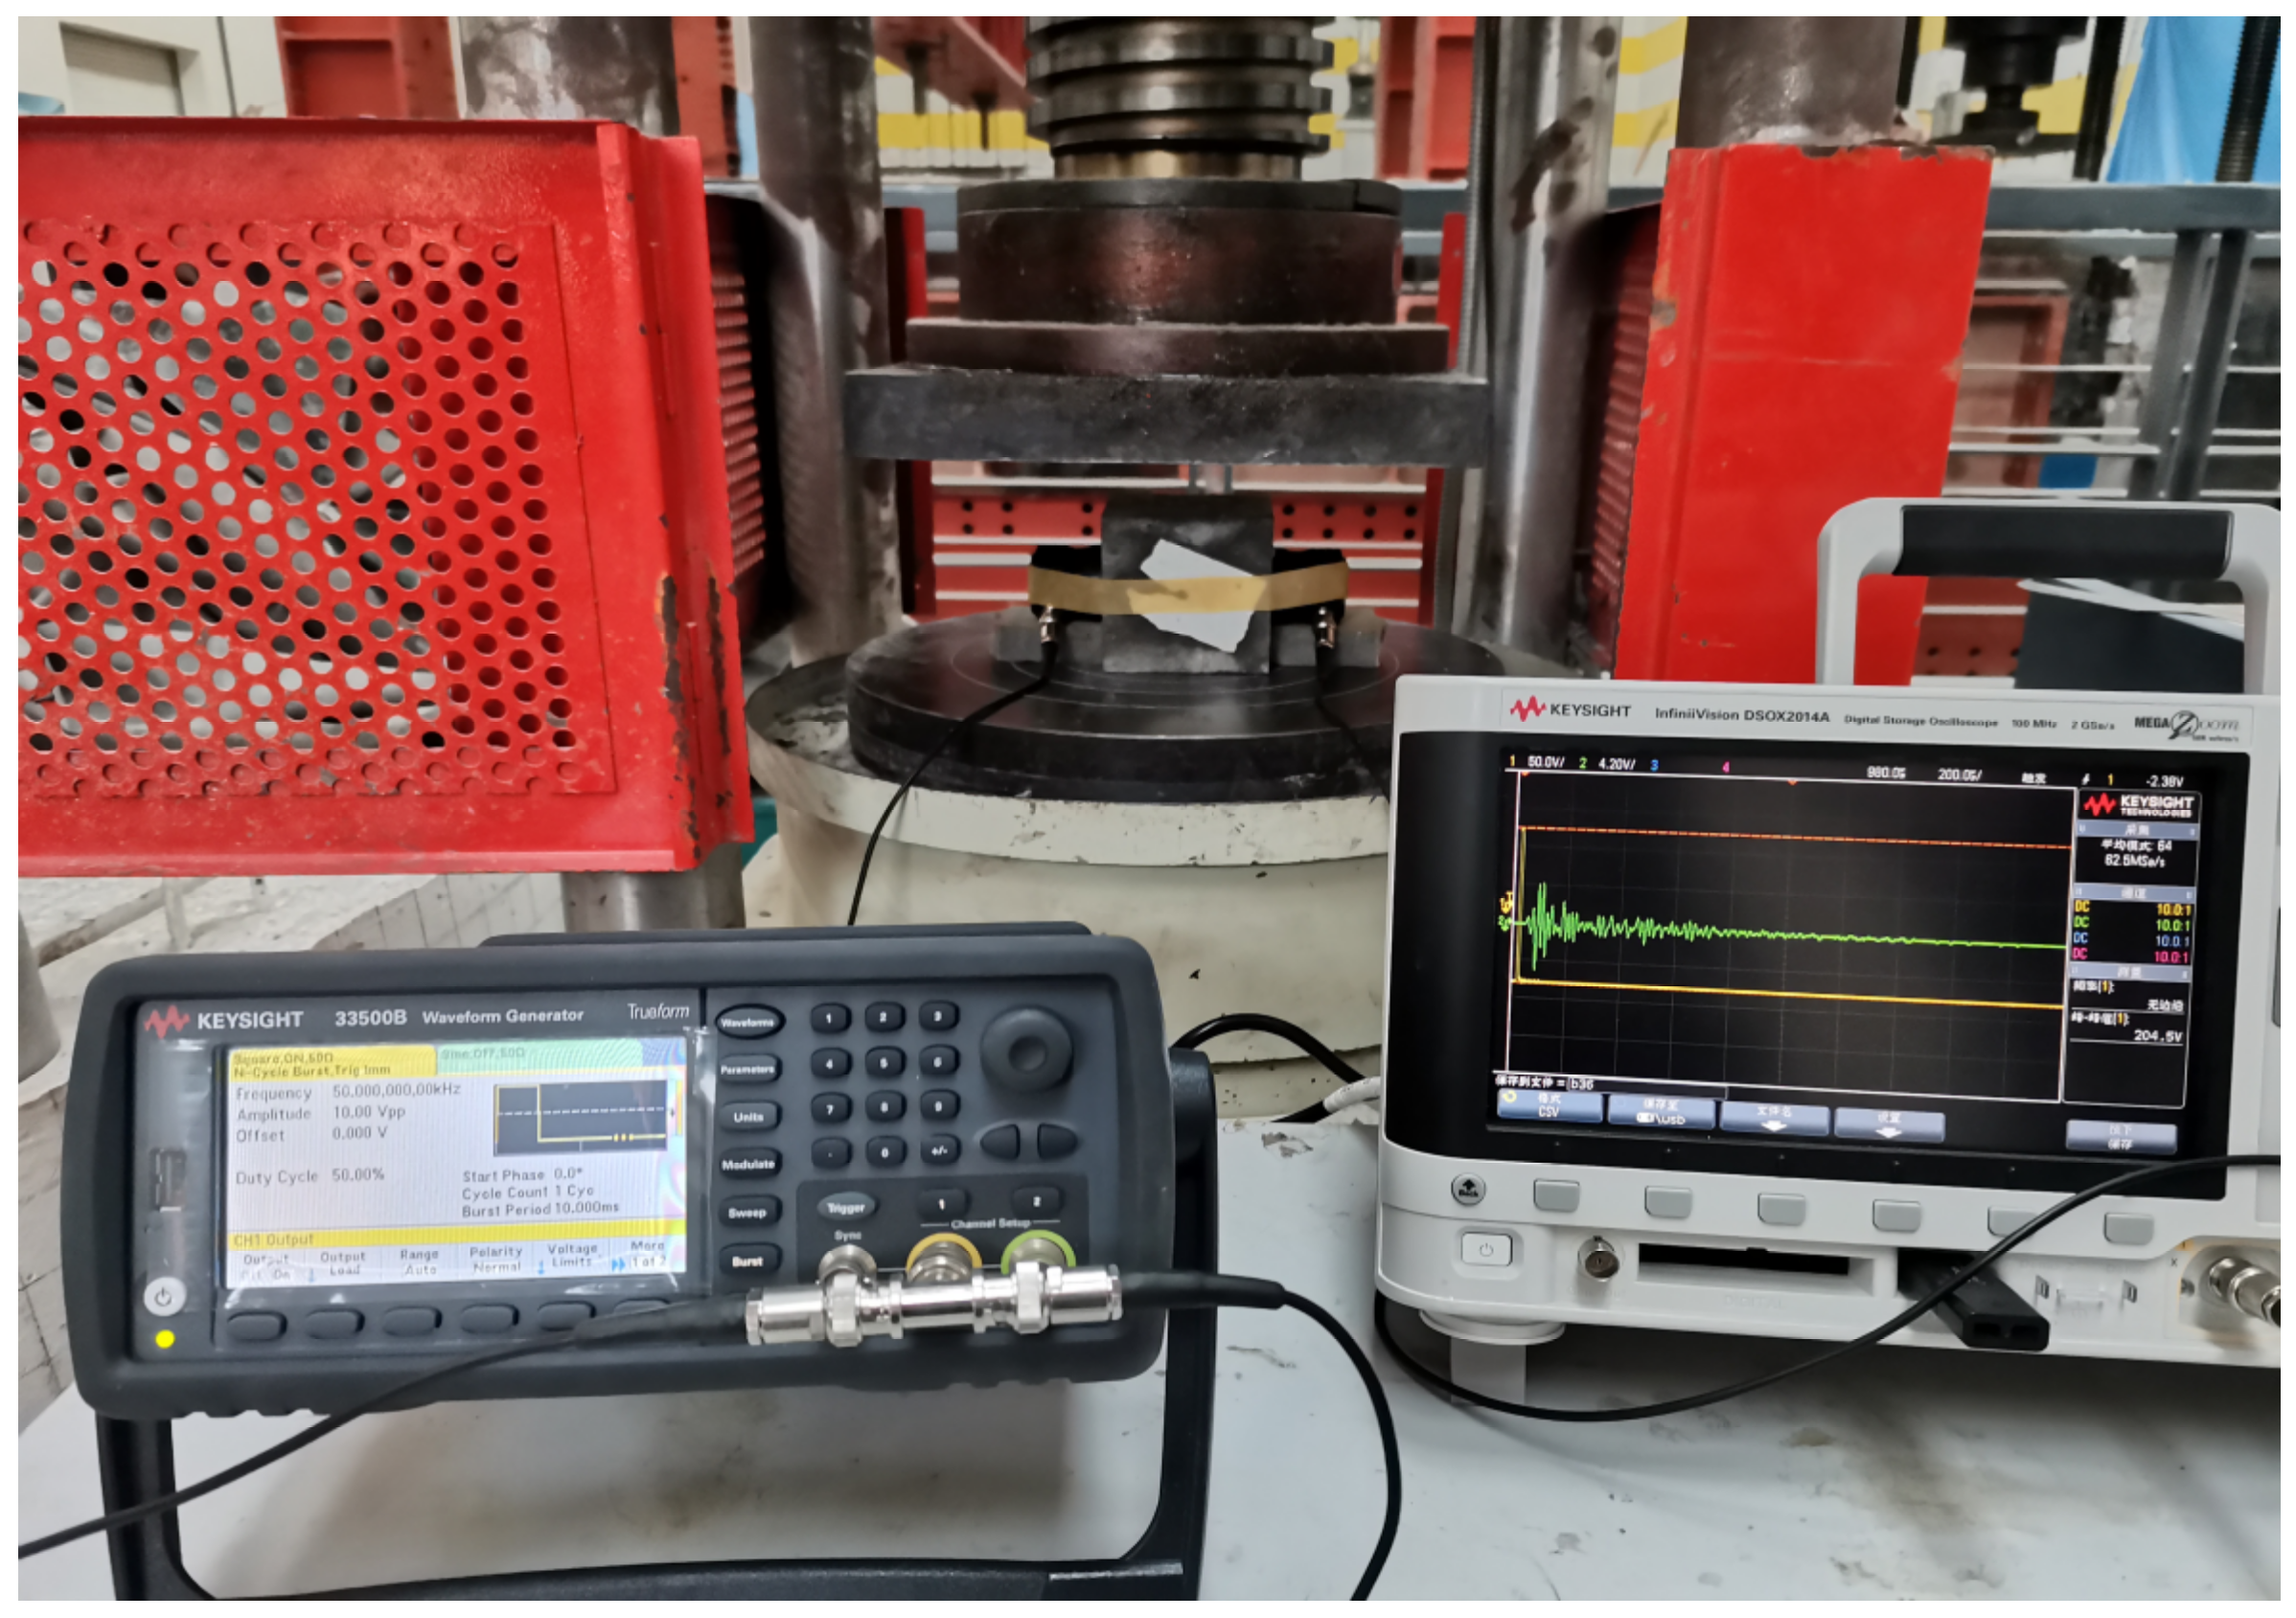
2.2. Test Device and Coda Wave Test Parameters
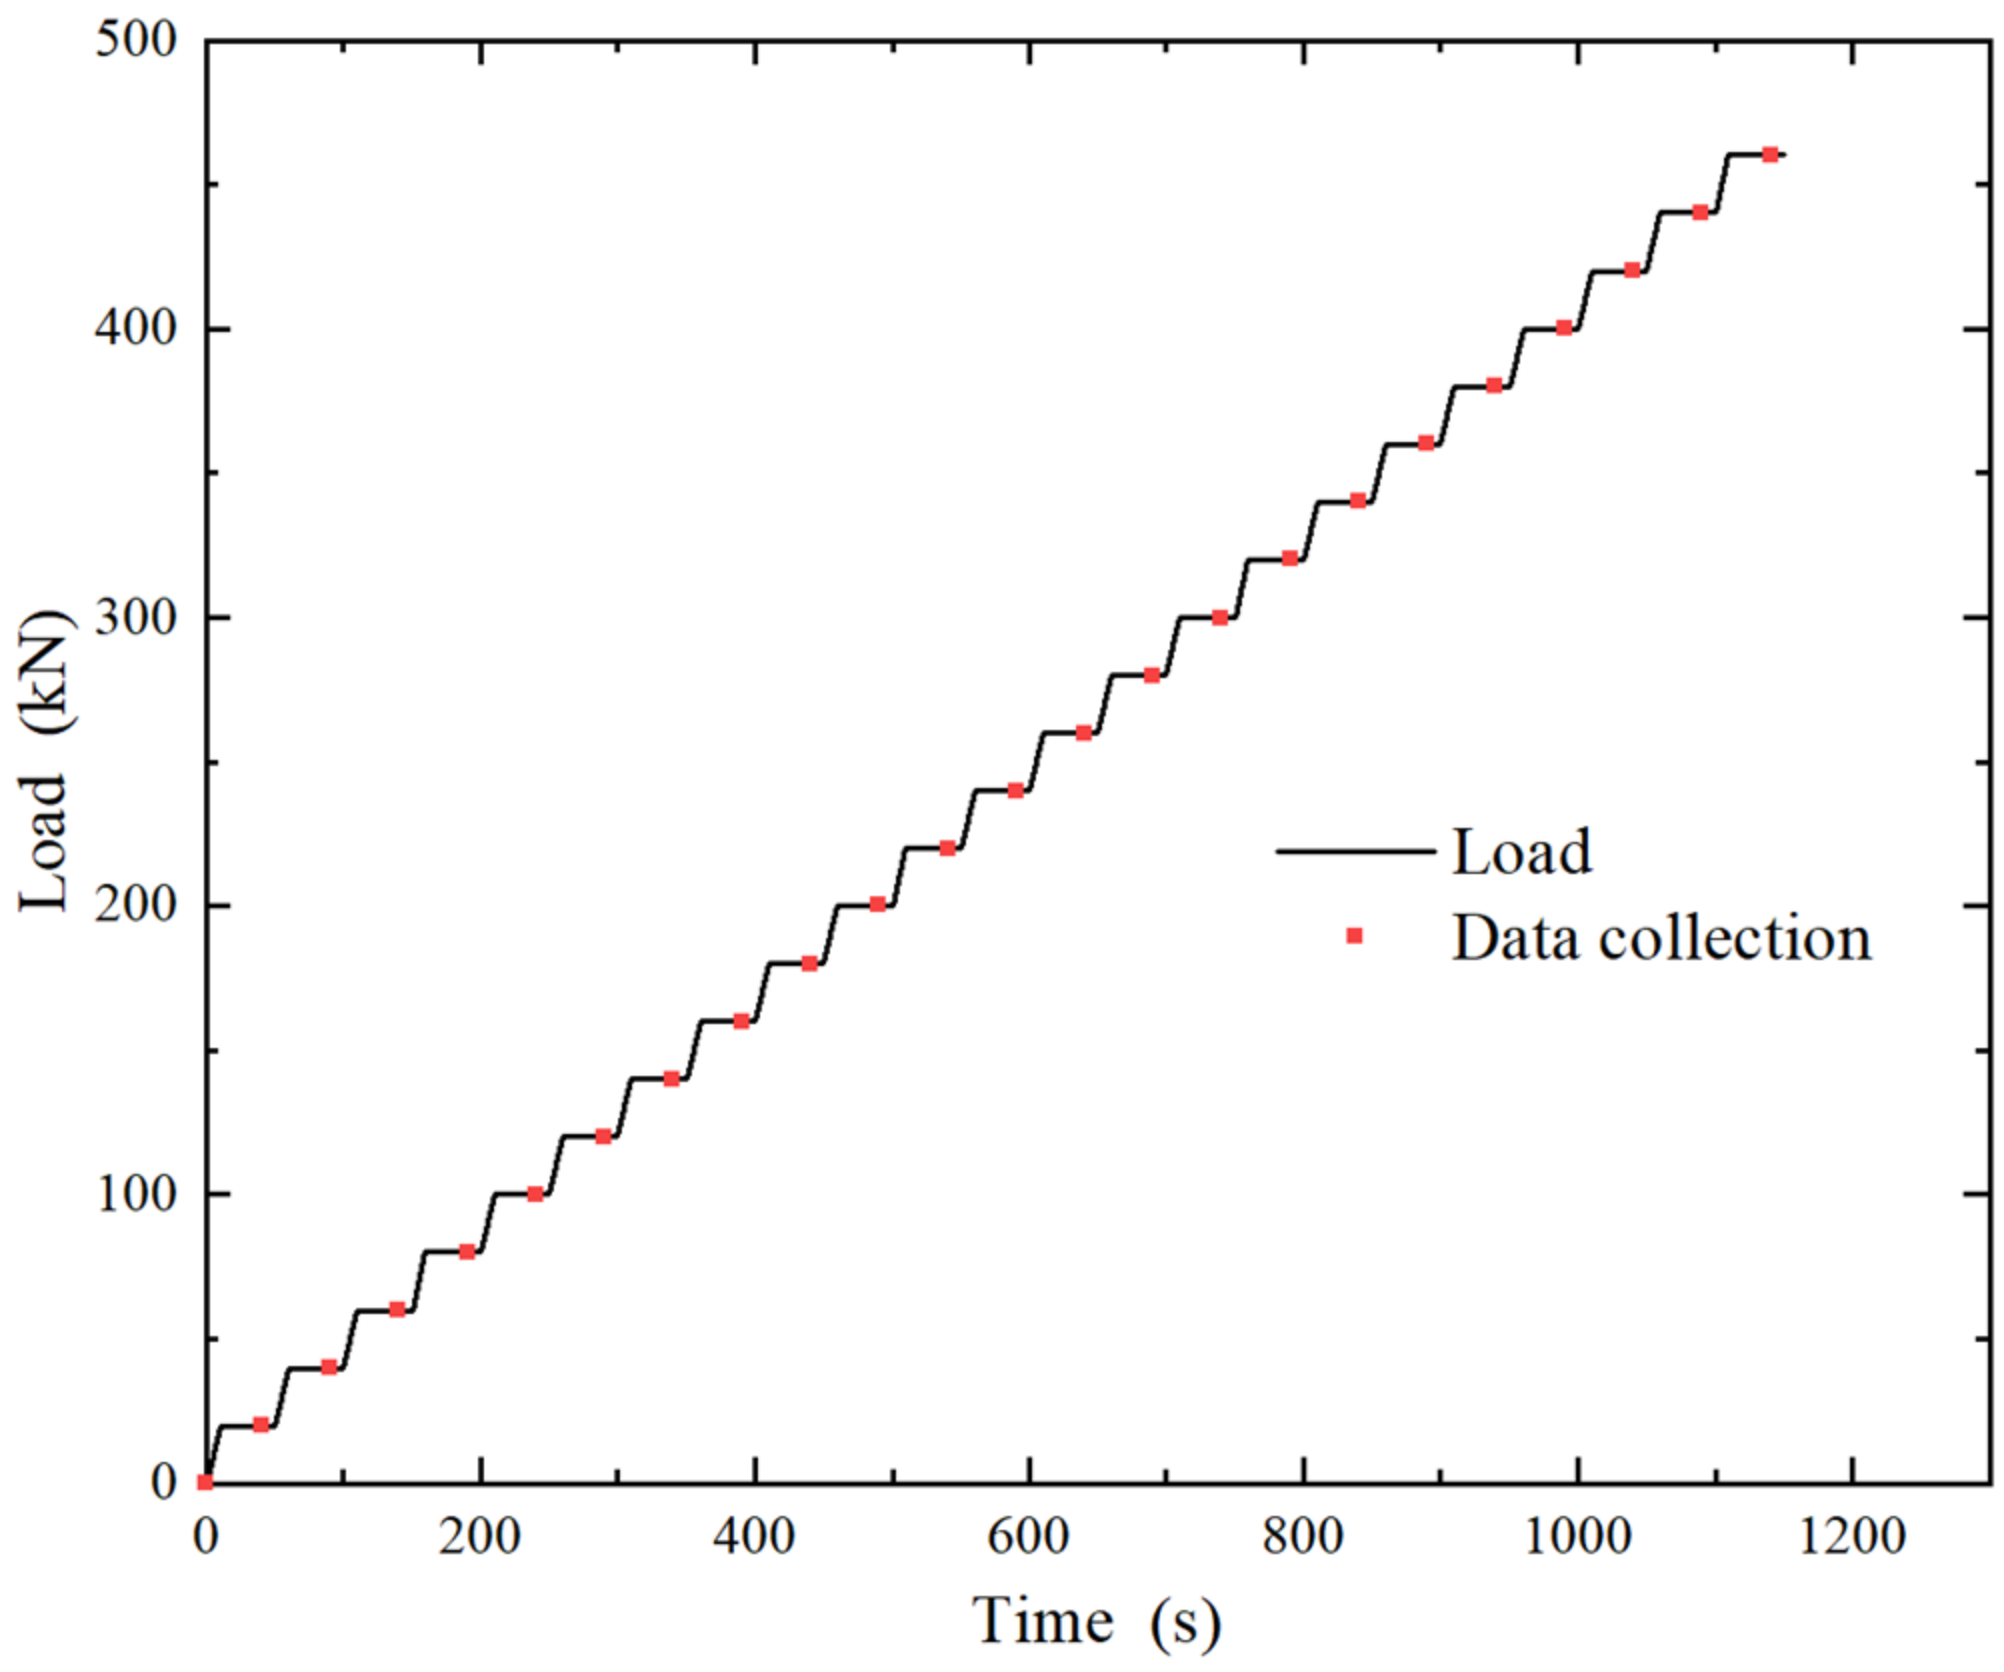
2.3. Loading Plan and Coda Wave Test Process Control
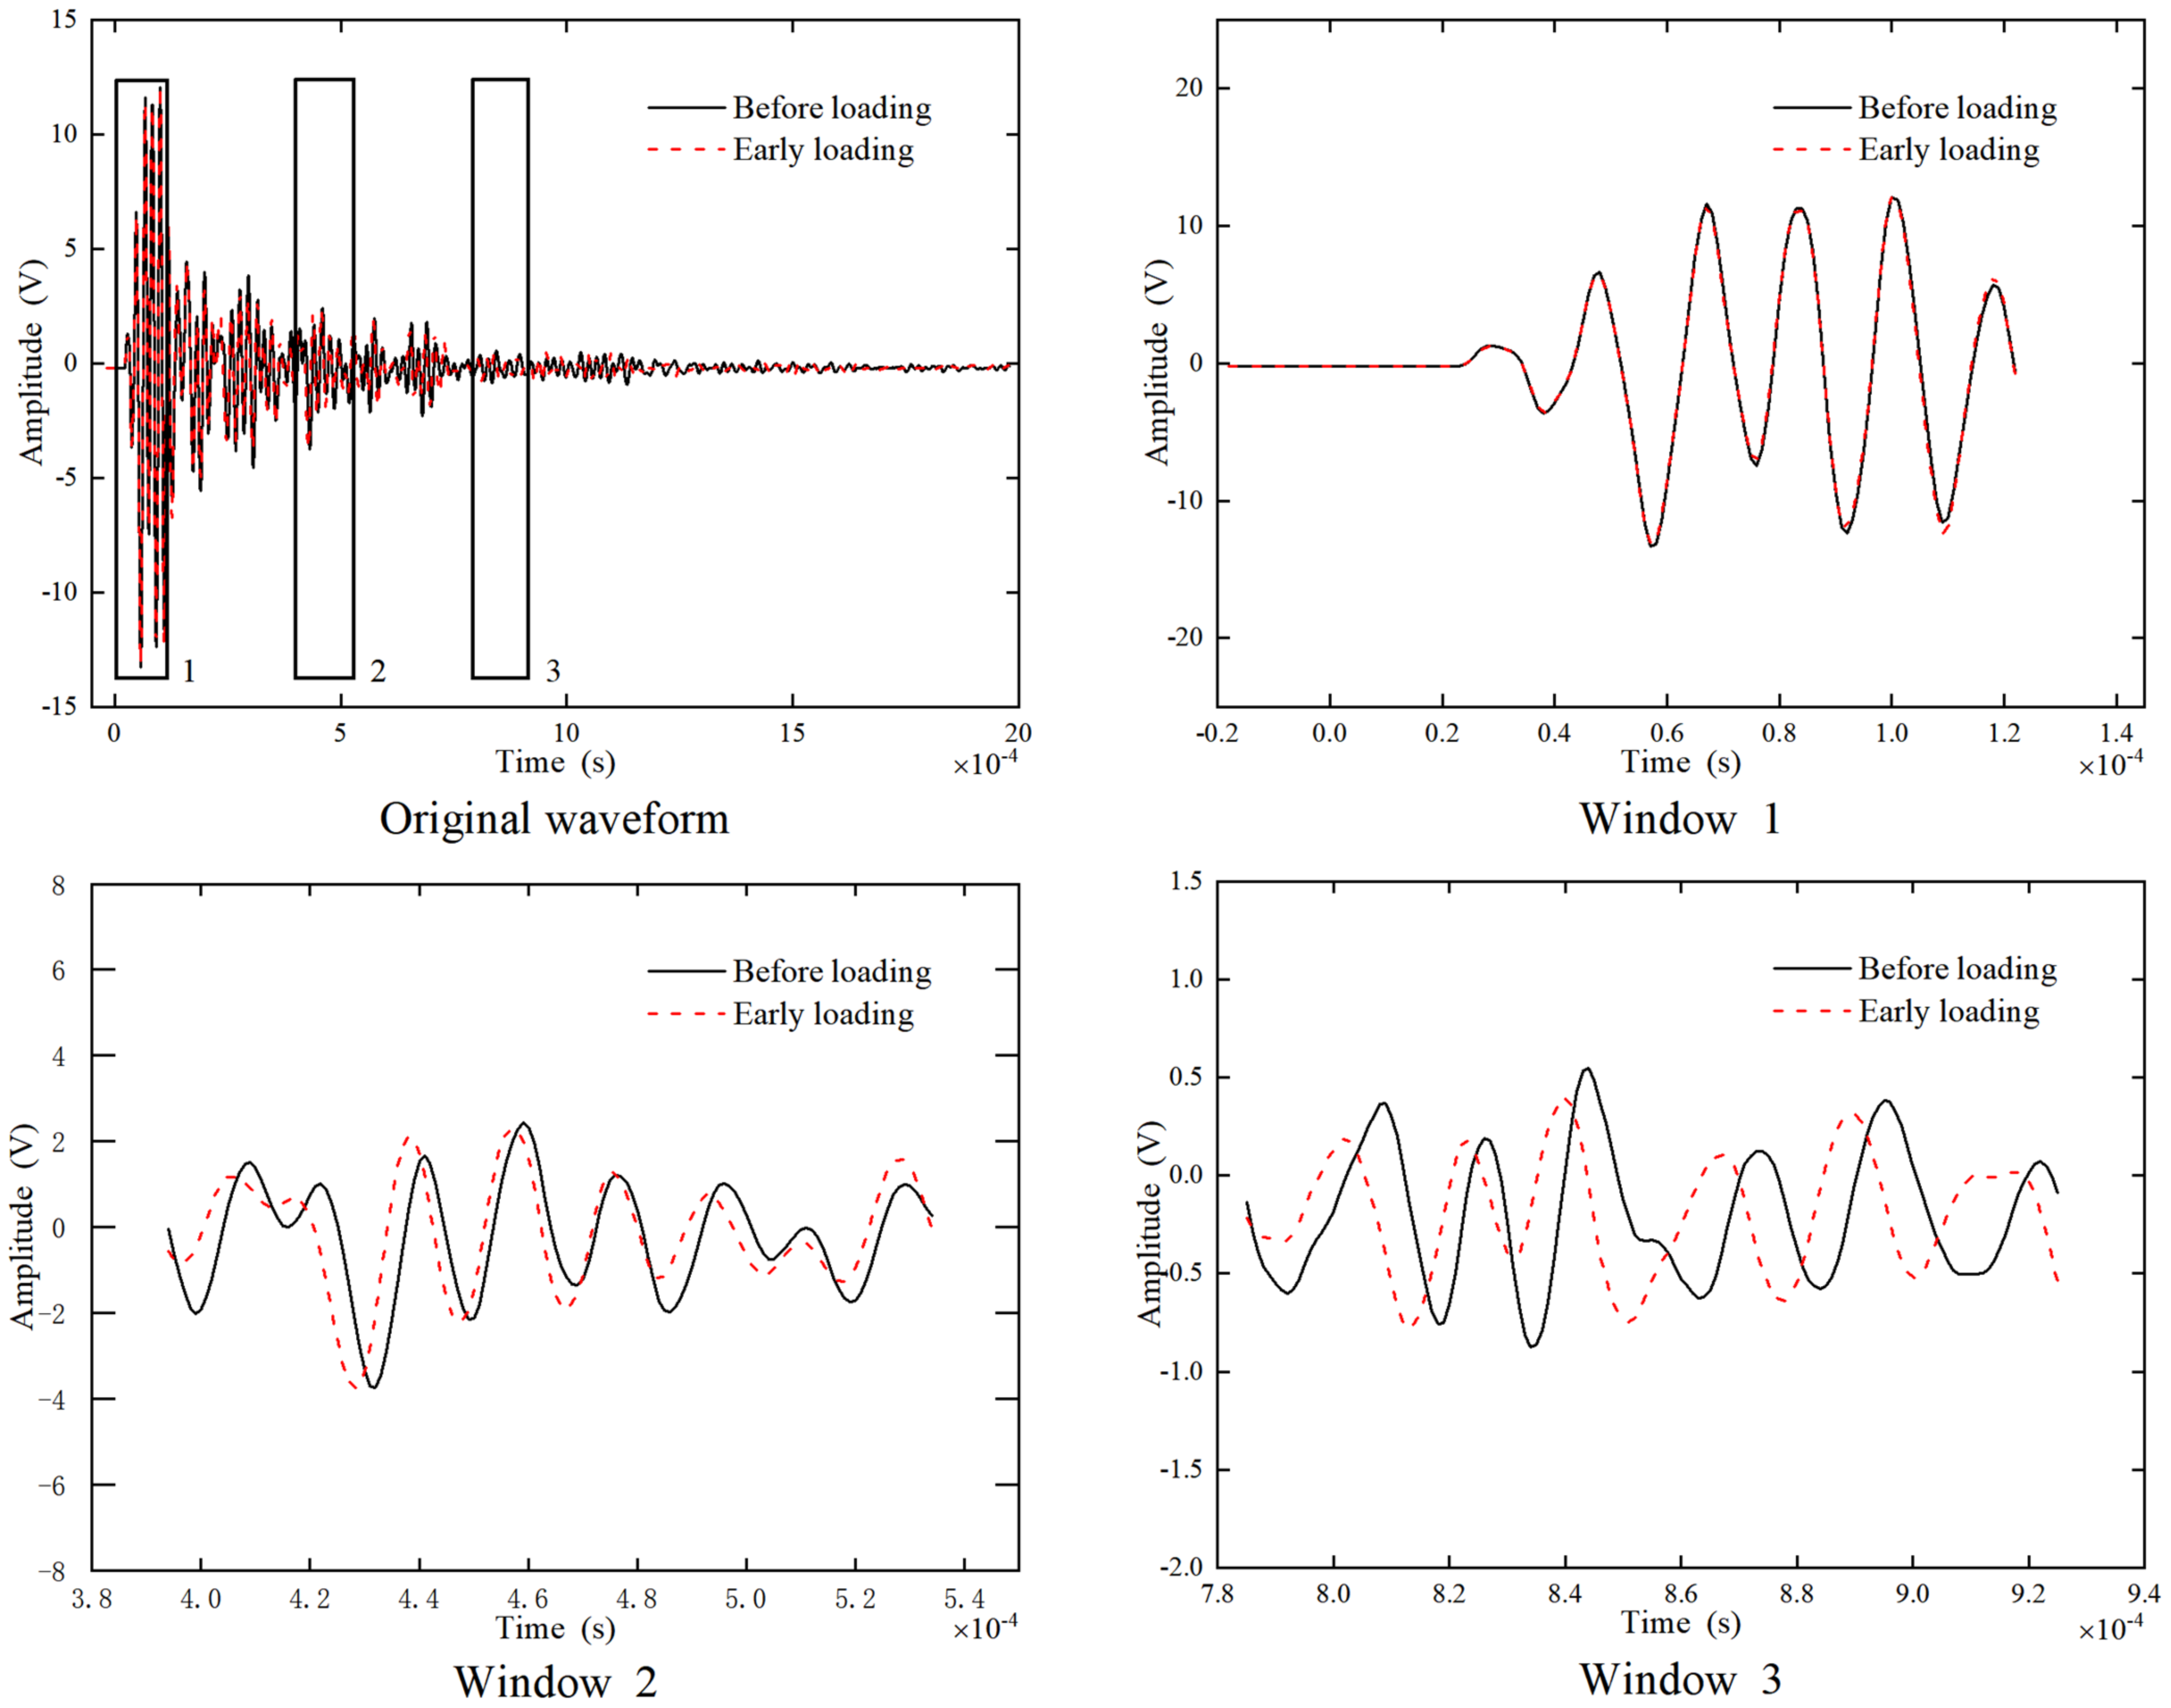
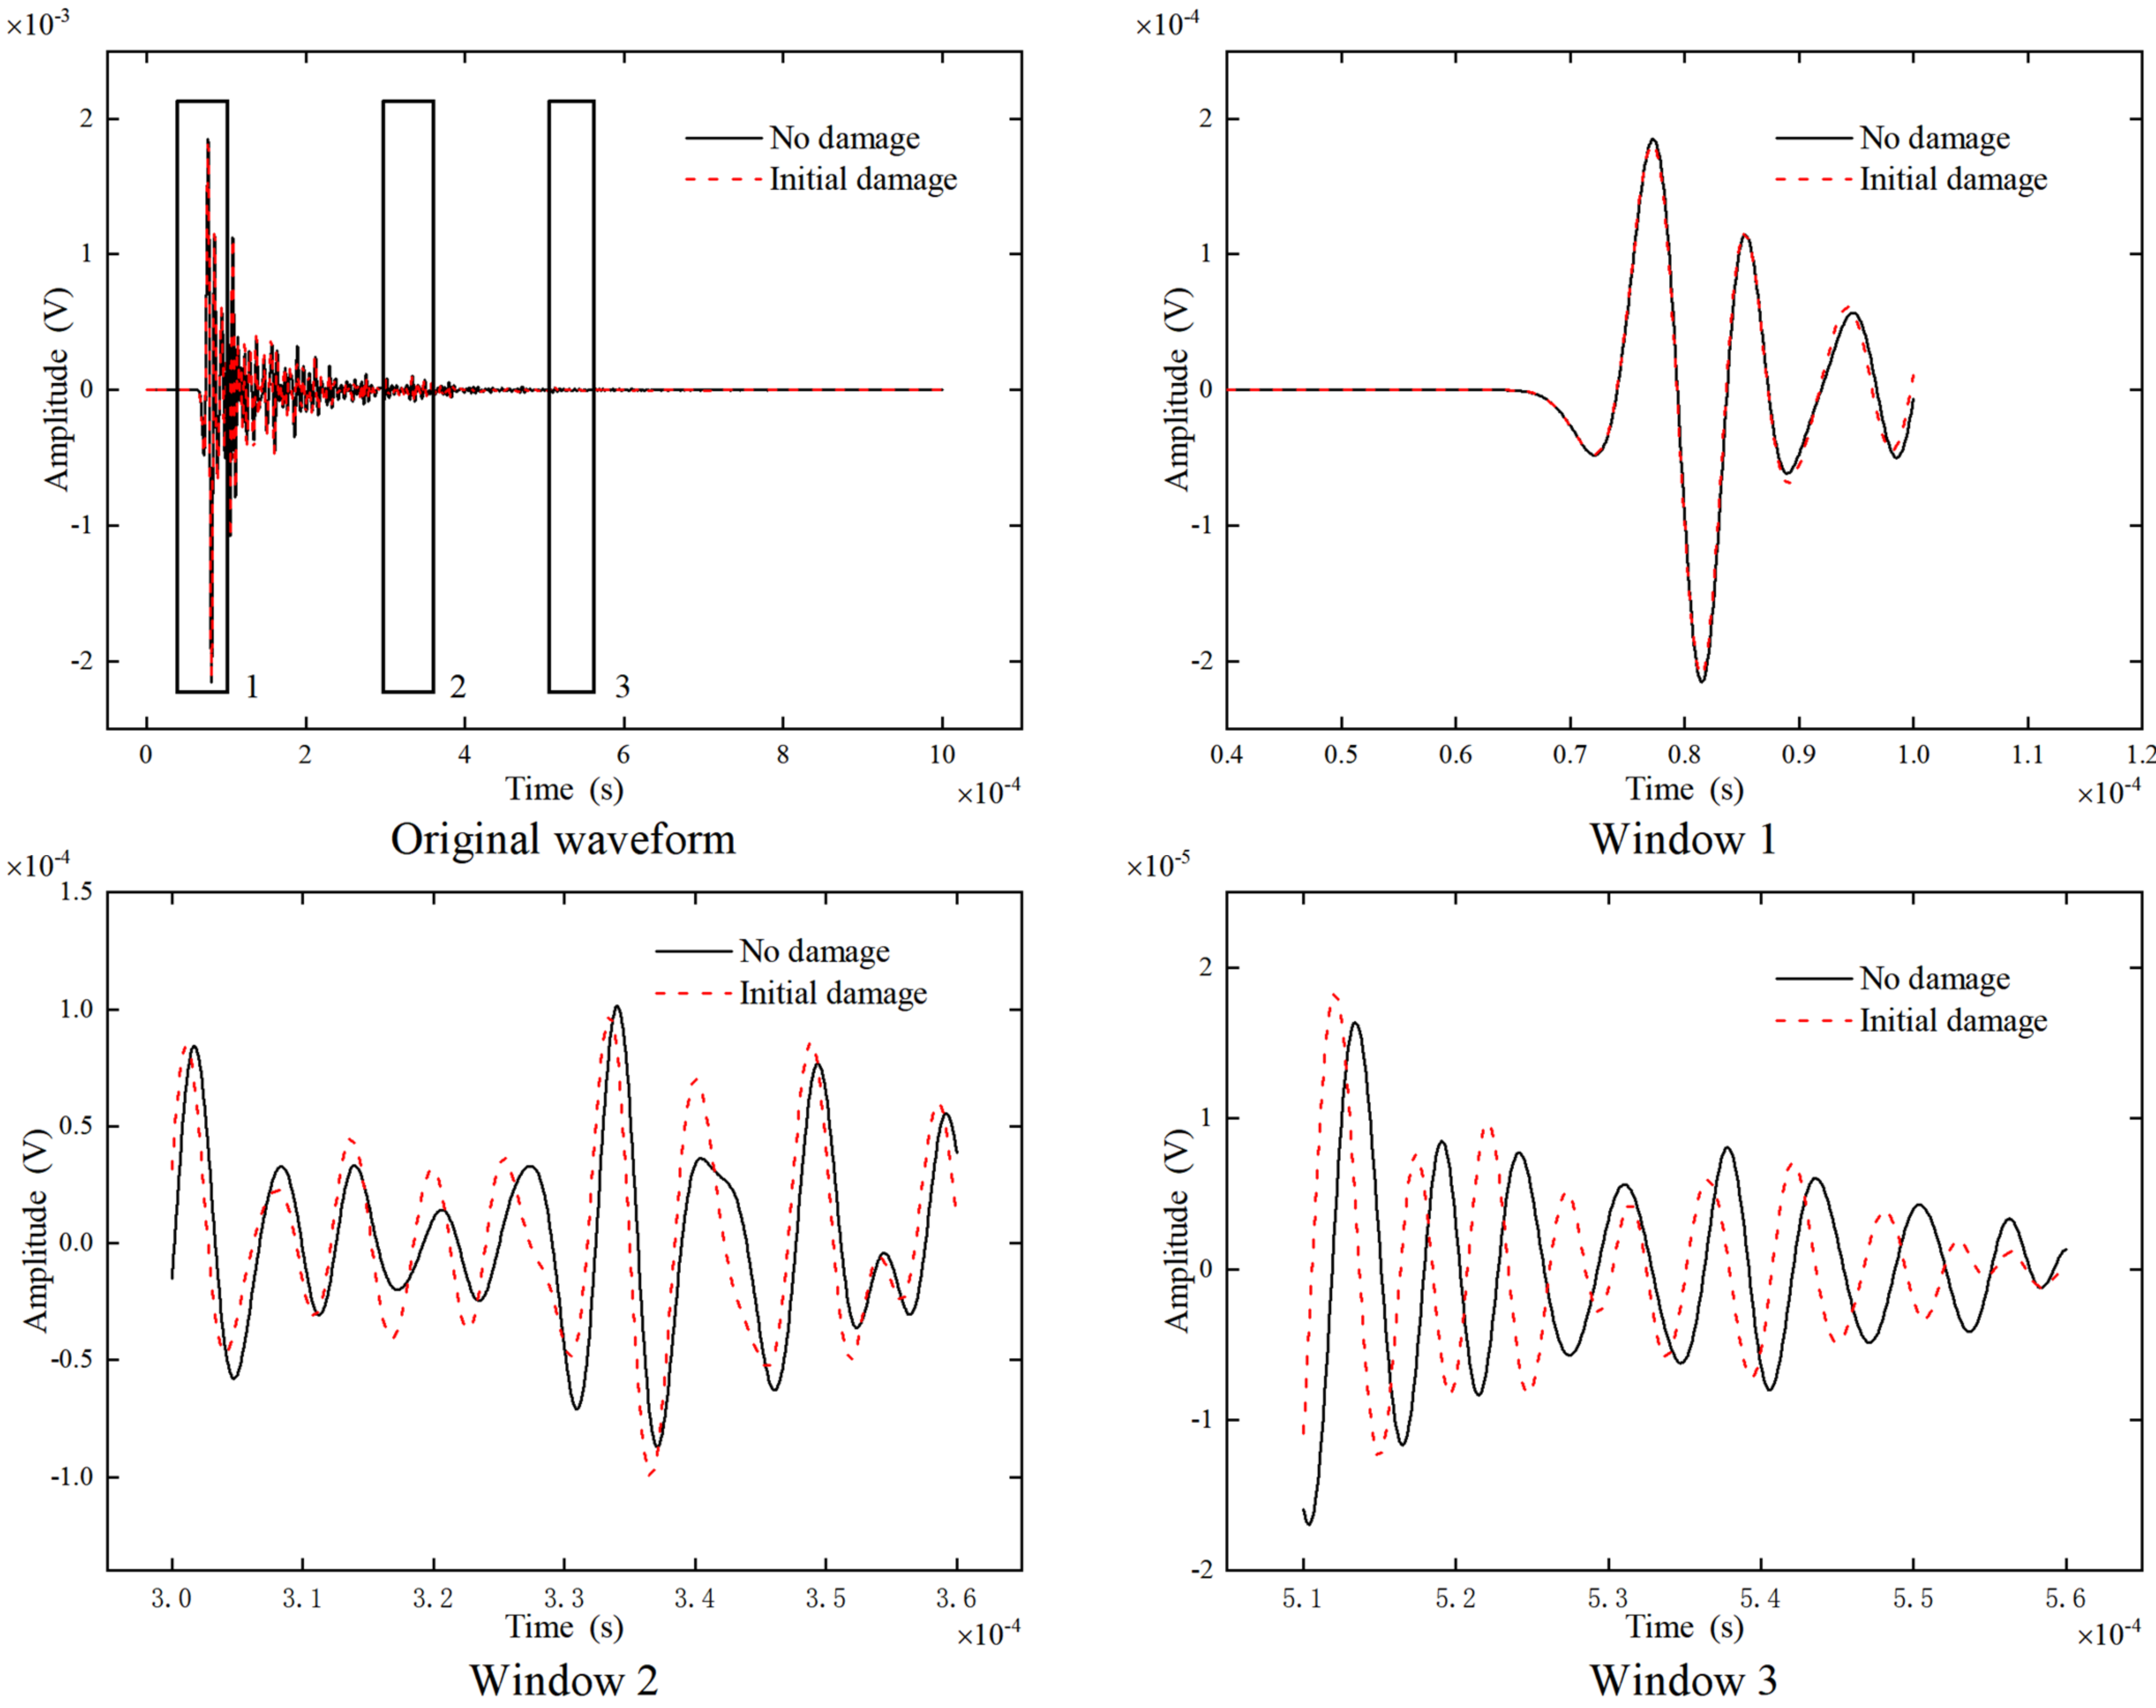
2.4. Coda Wave Test Data Processing
3. Experimental Results and Discussion
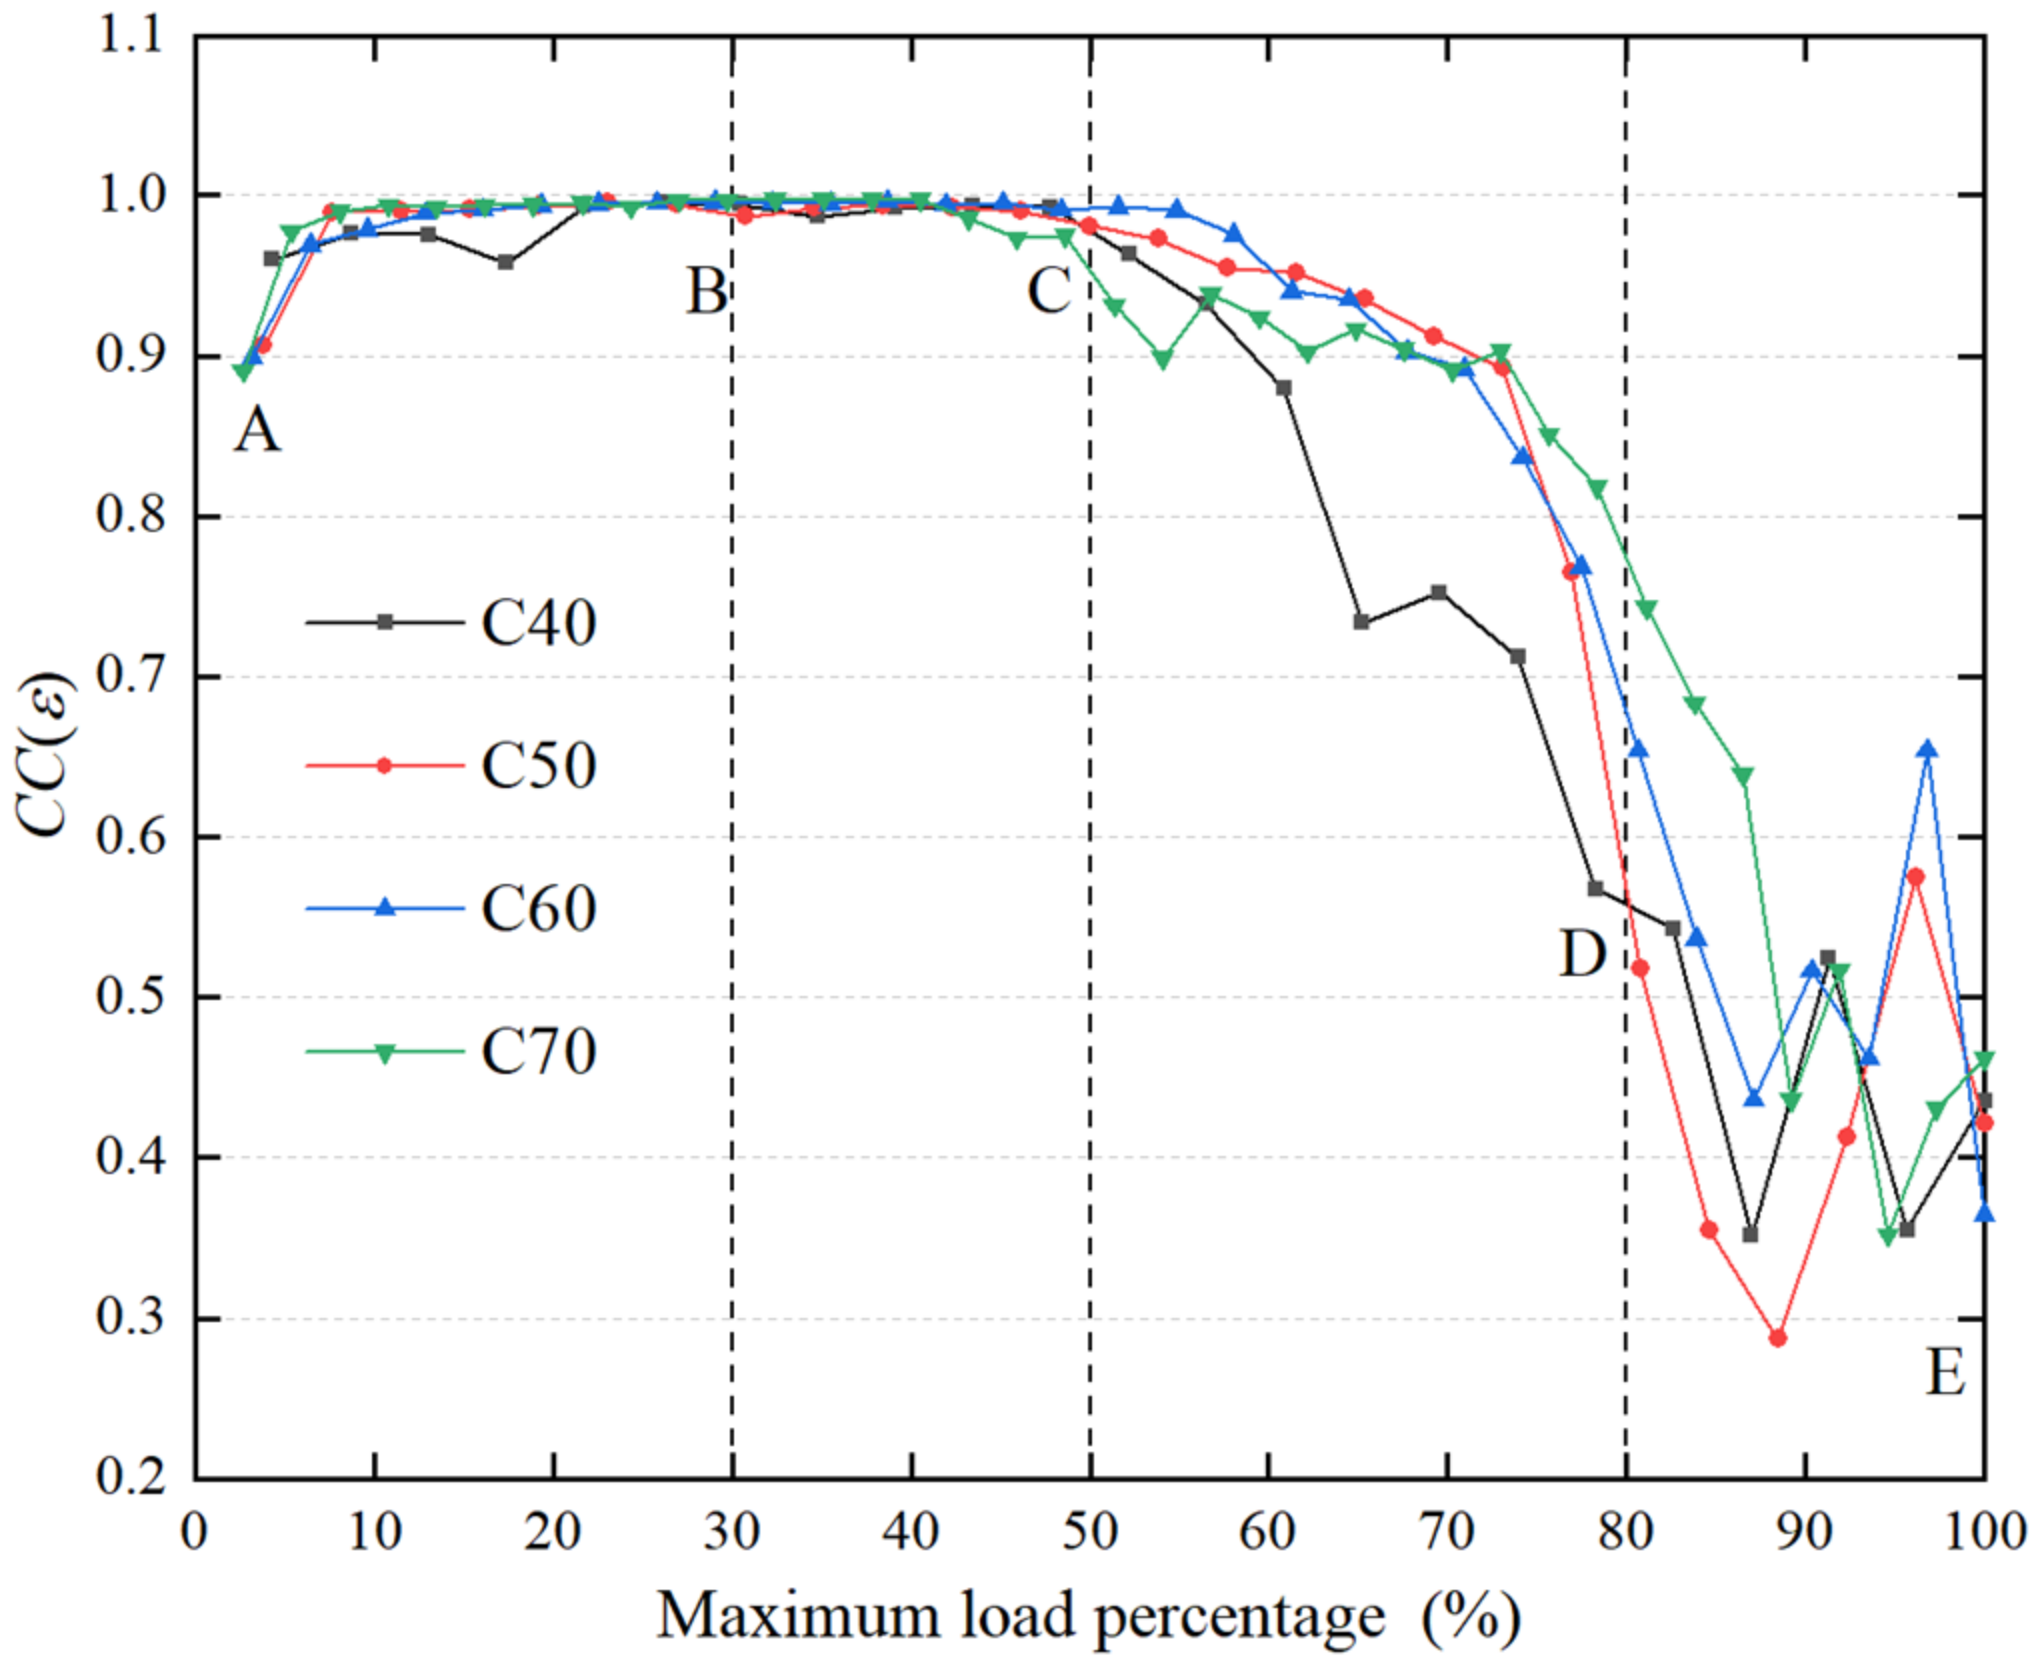
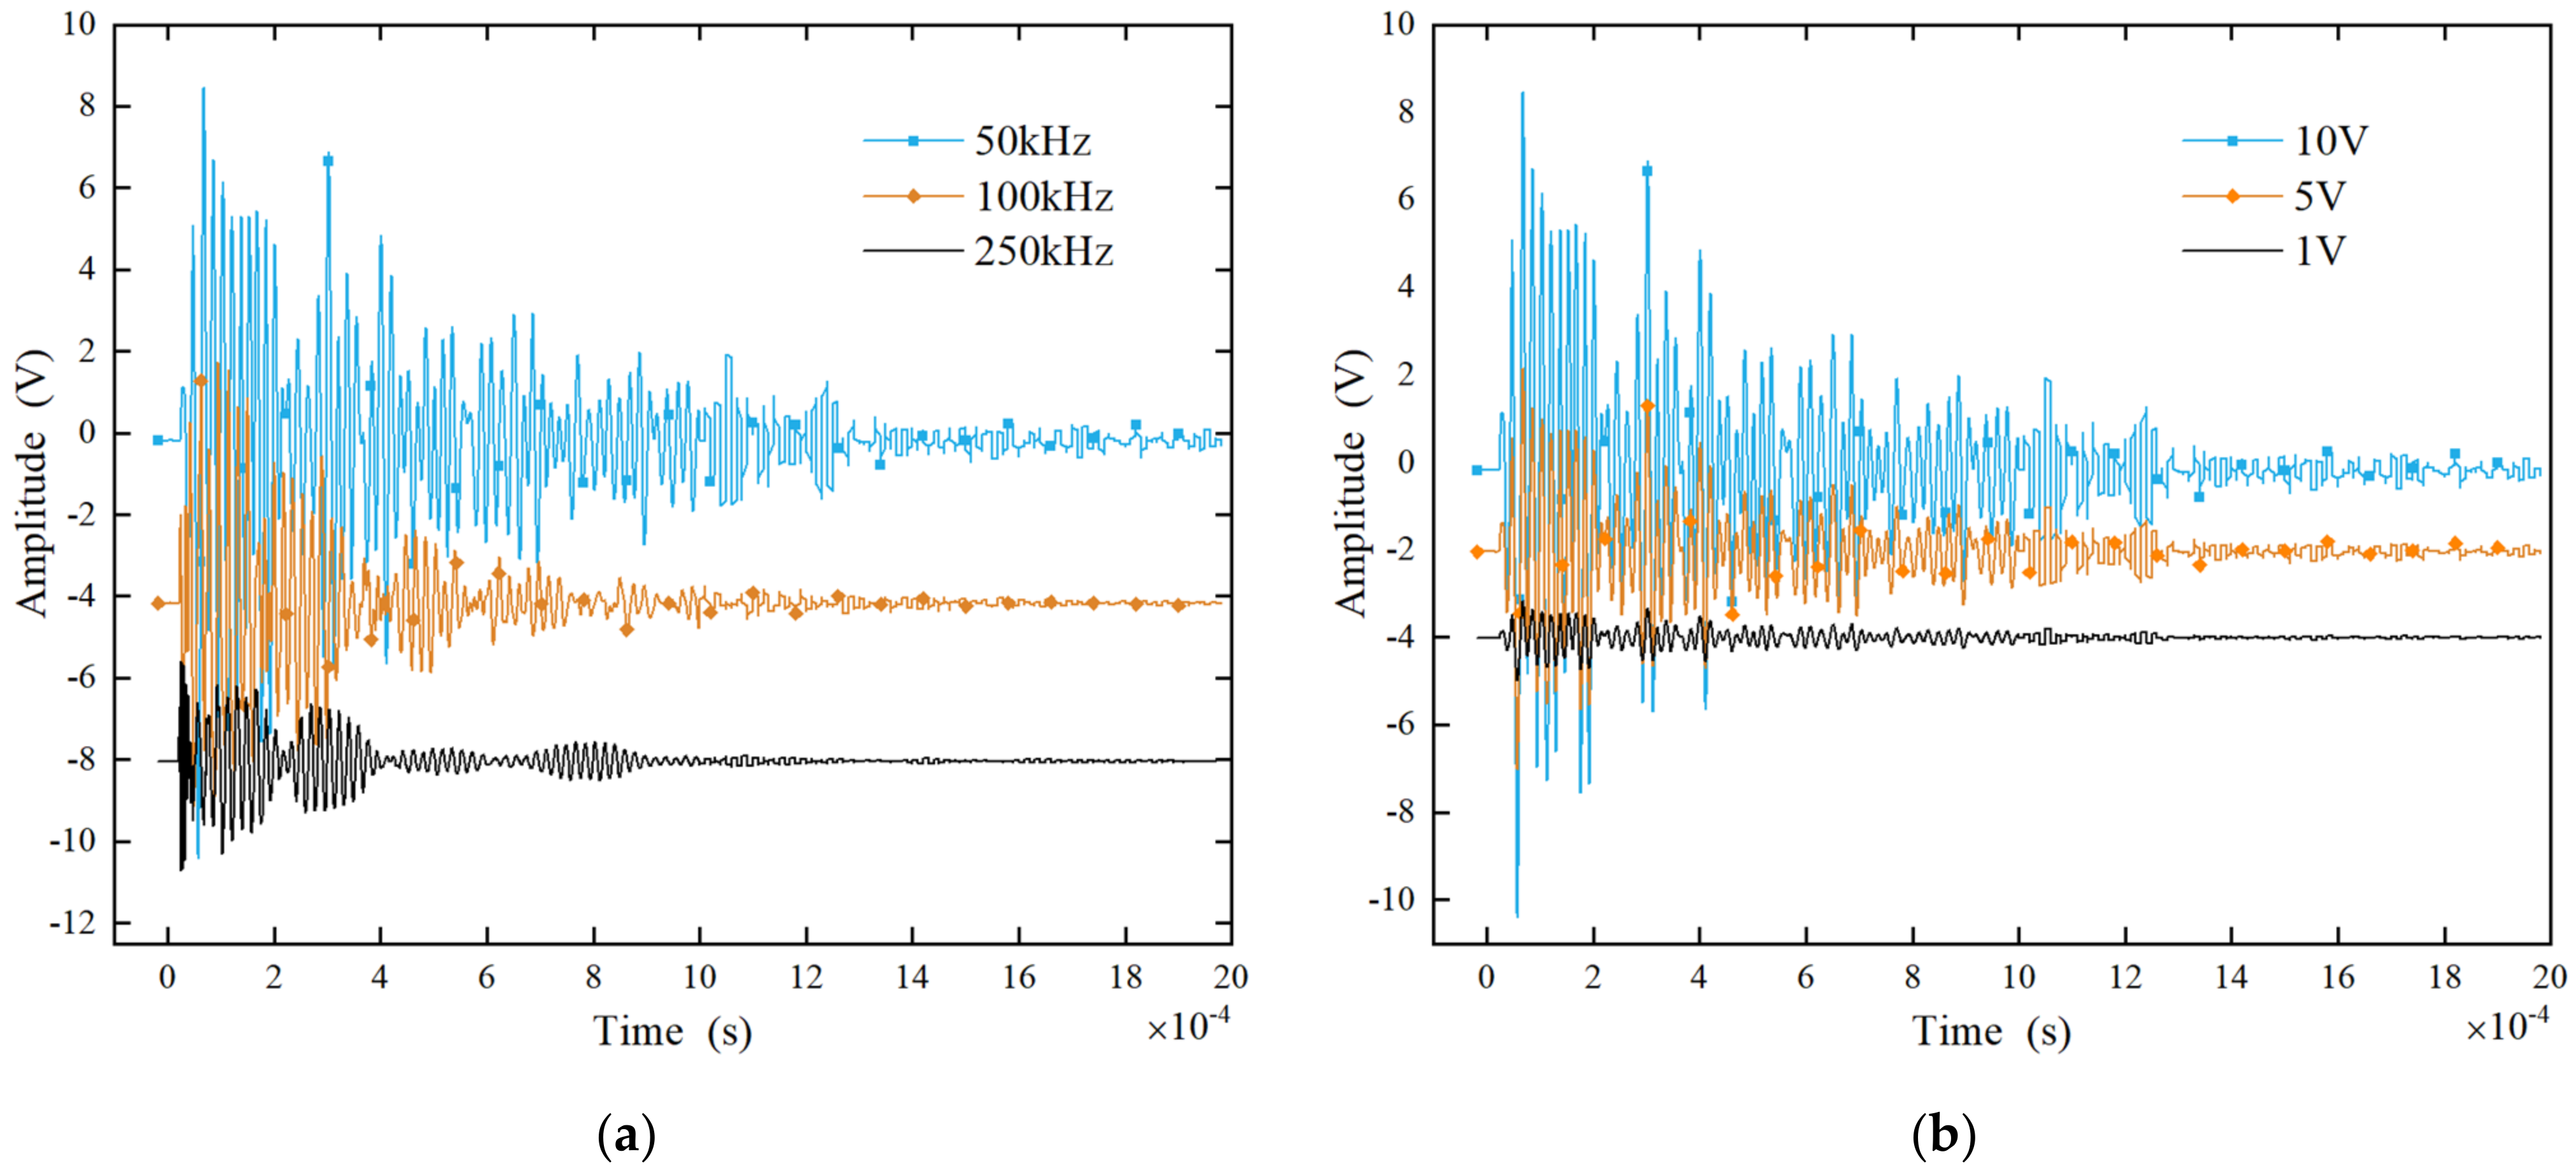
3.1. Waveform Cross-Correlation Analysis
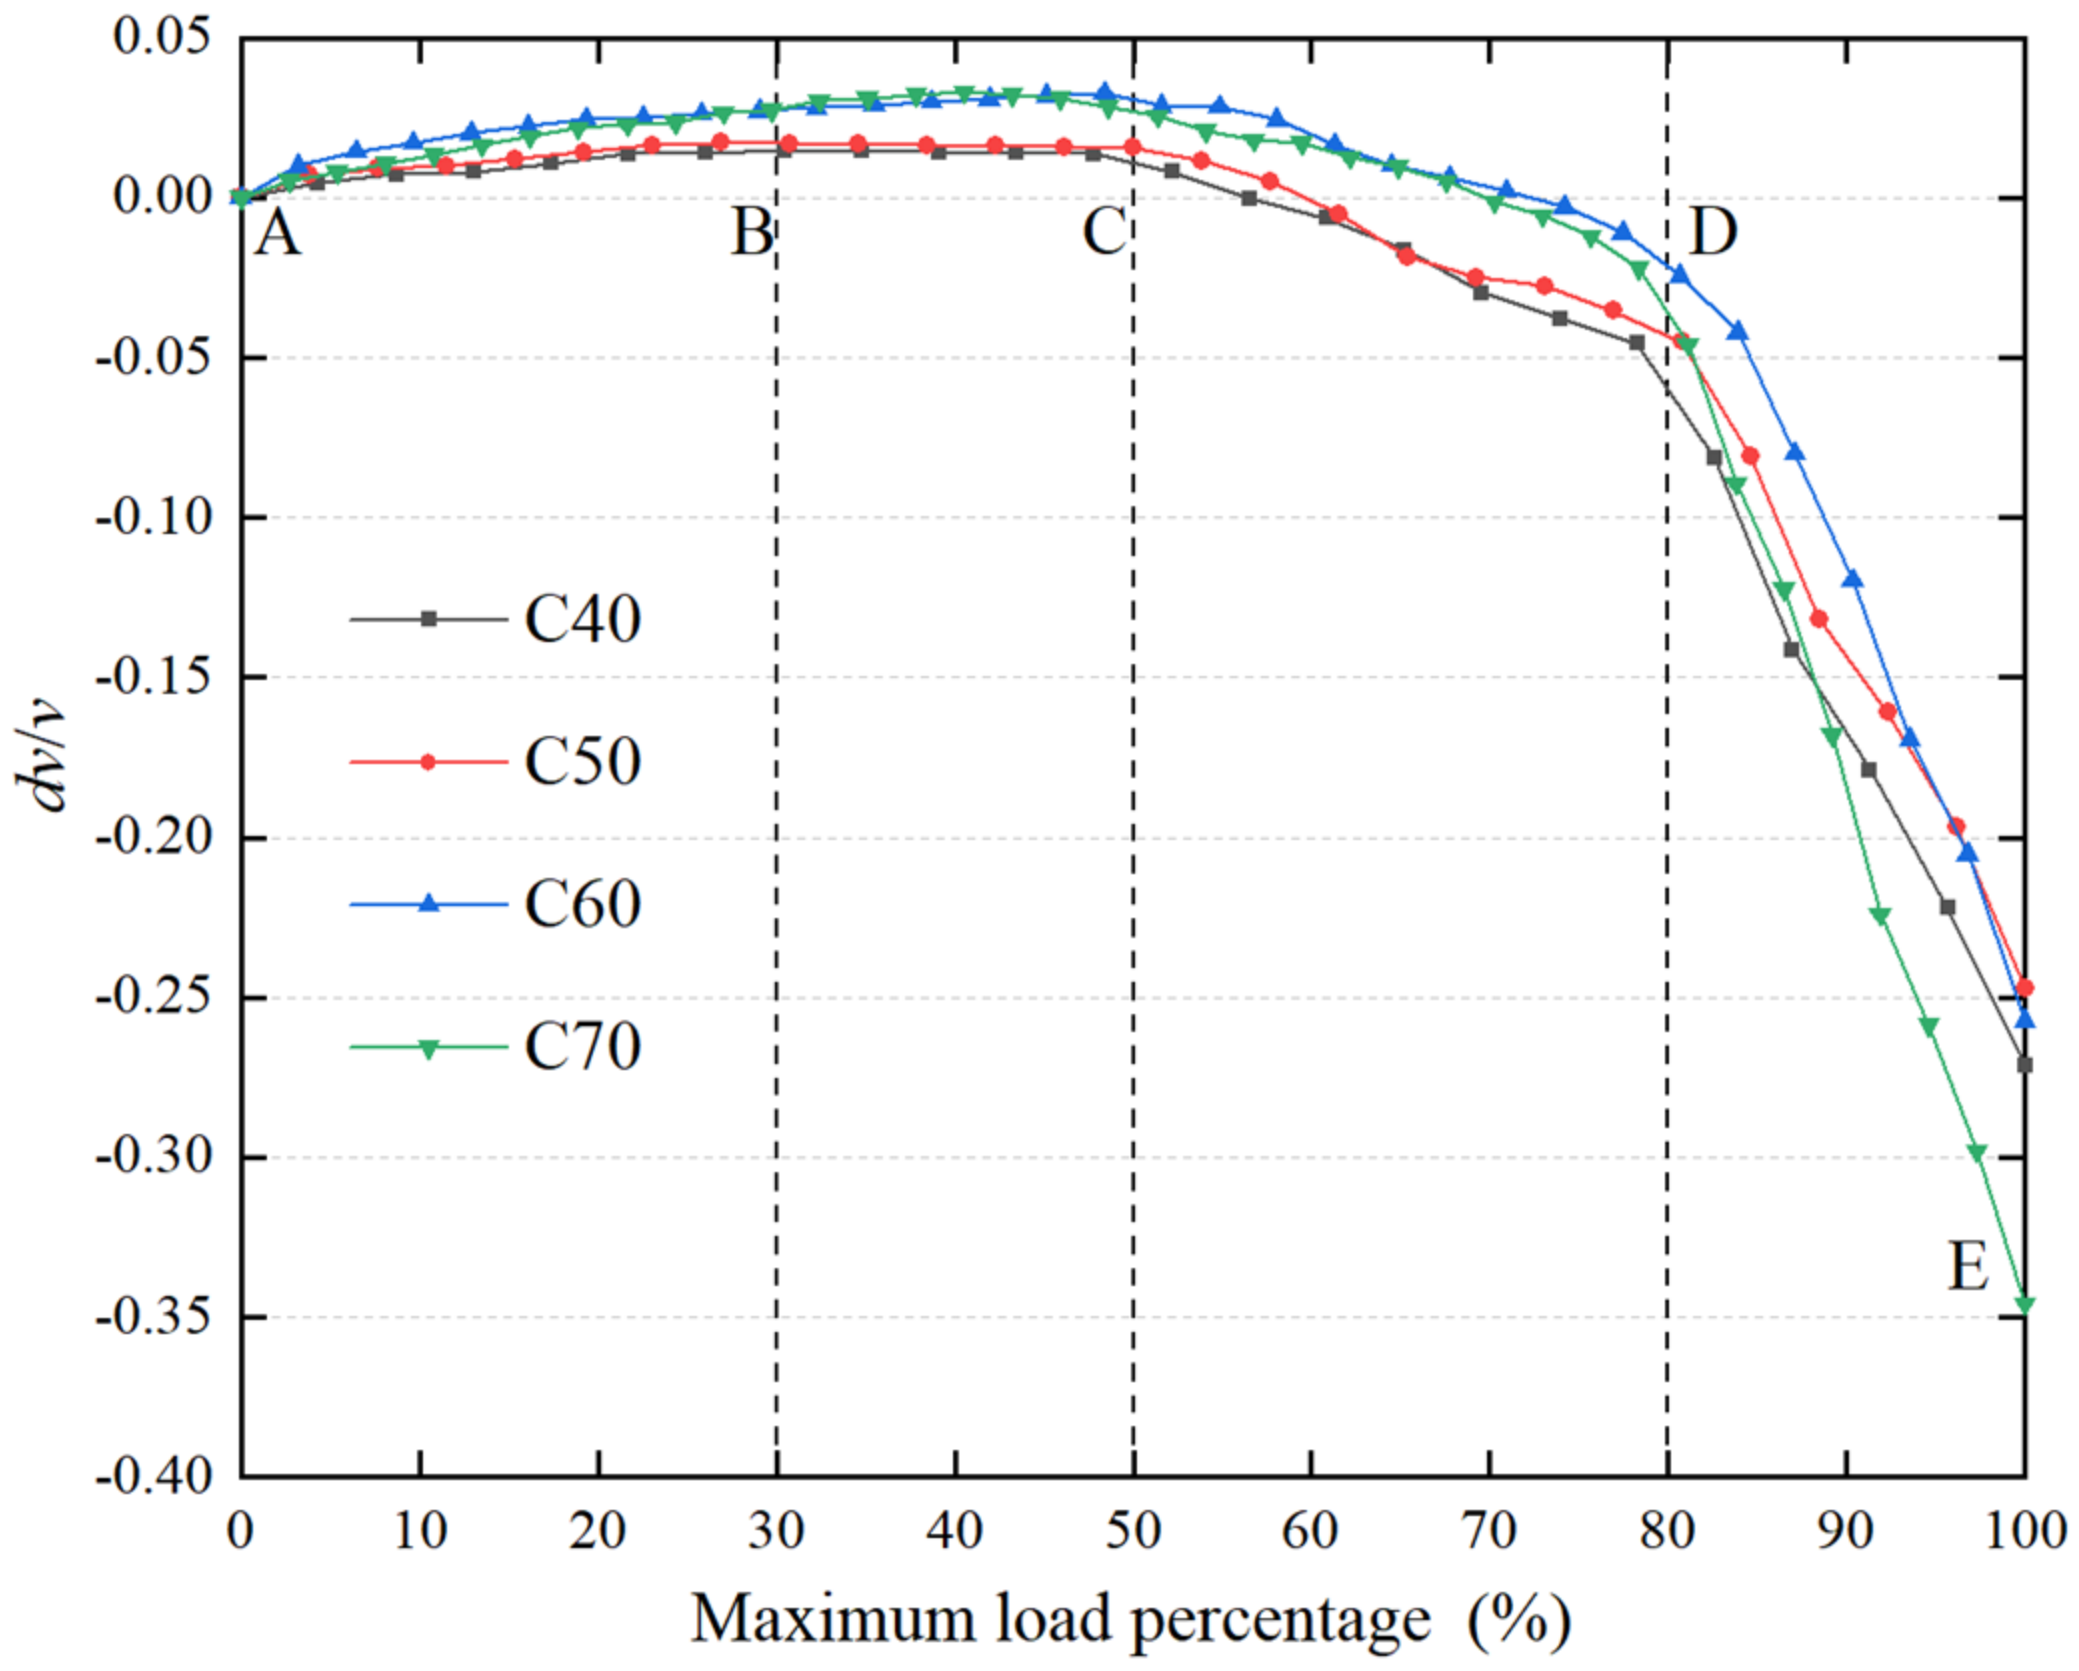
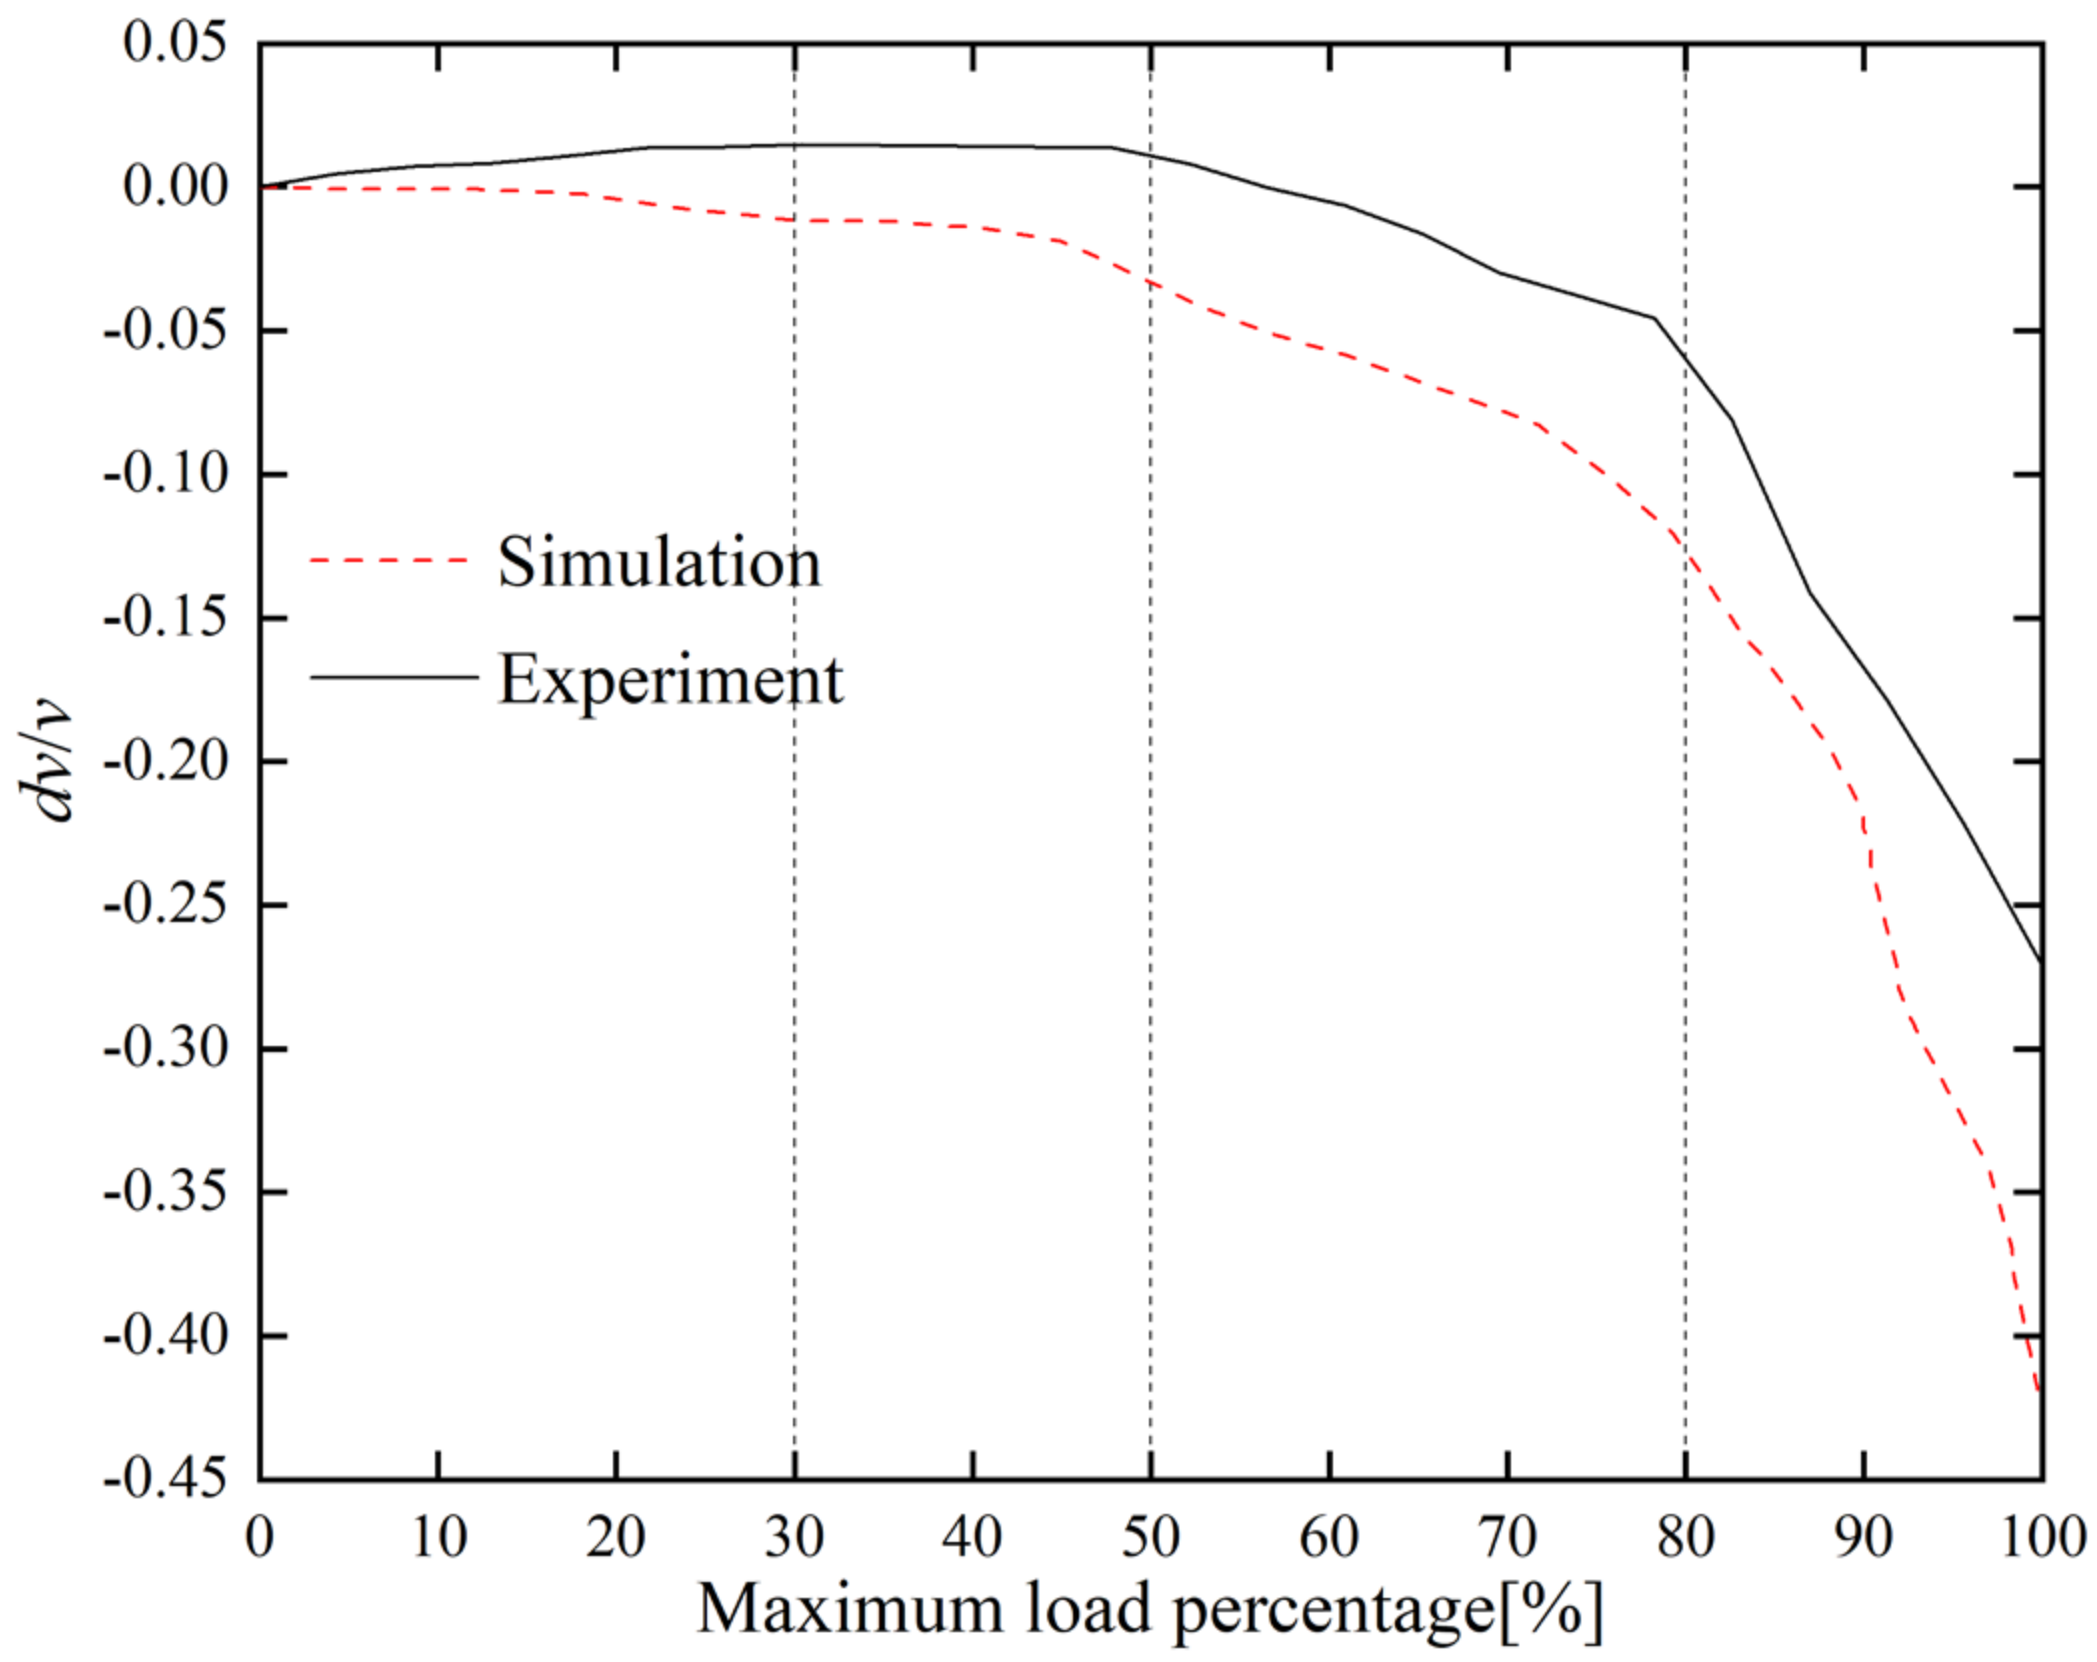
3.2. Coda Wave Velocity Change Rate Analysis
3.3. Coda Wave Velocity Change Rate Fitting
4. Numerical Simulation
4.1. Numerical Simulation of Damaged Concrete under Uniaxial Compression
4.1.1. Concrete Model Establishment
4.1.2. Calibration of the Meso-Parameters of the Concrete Model
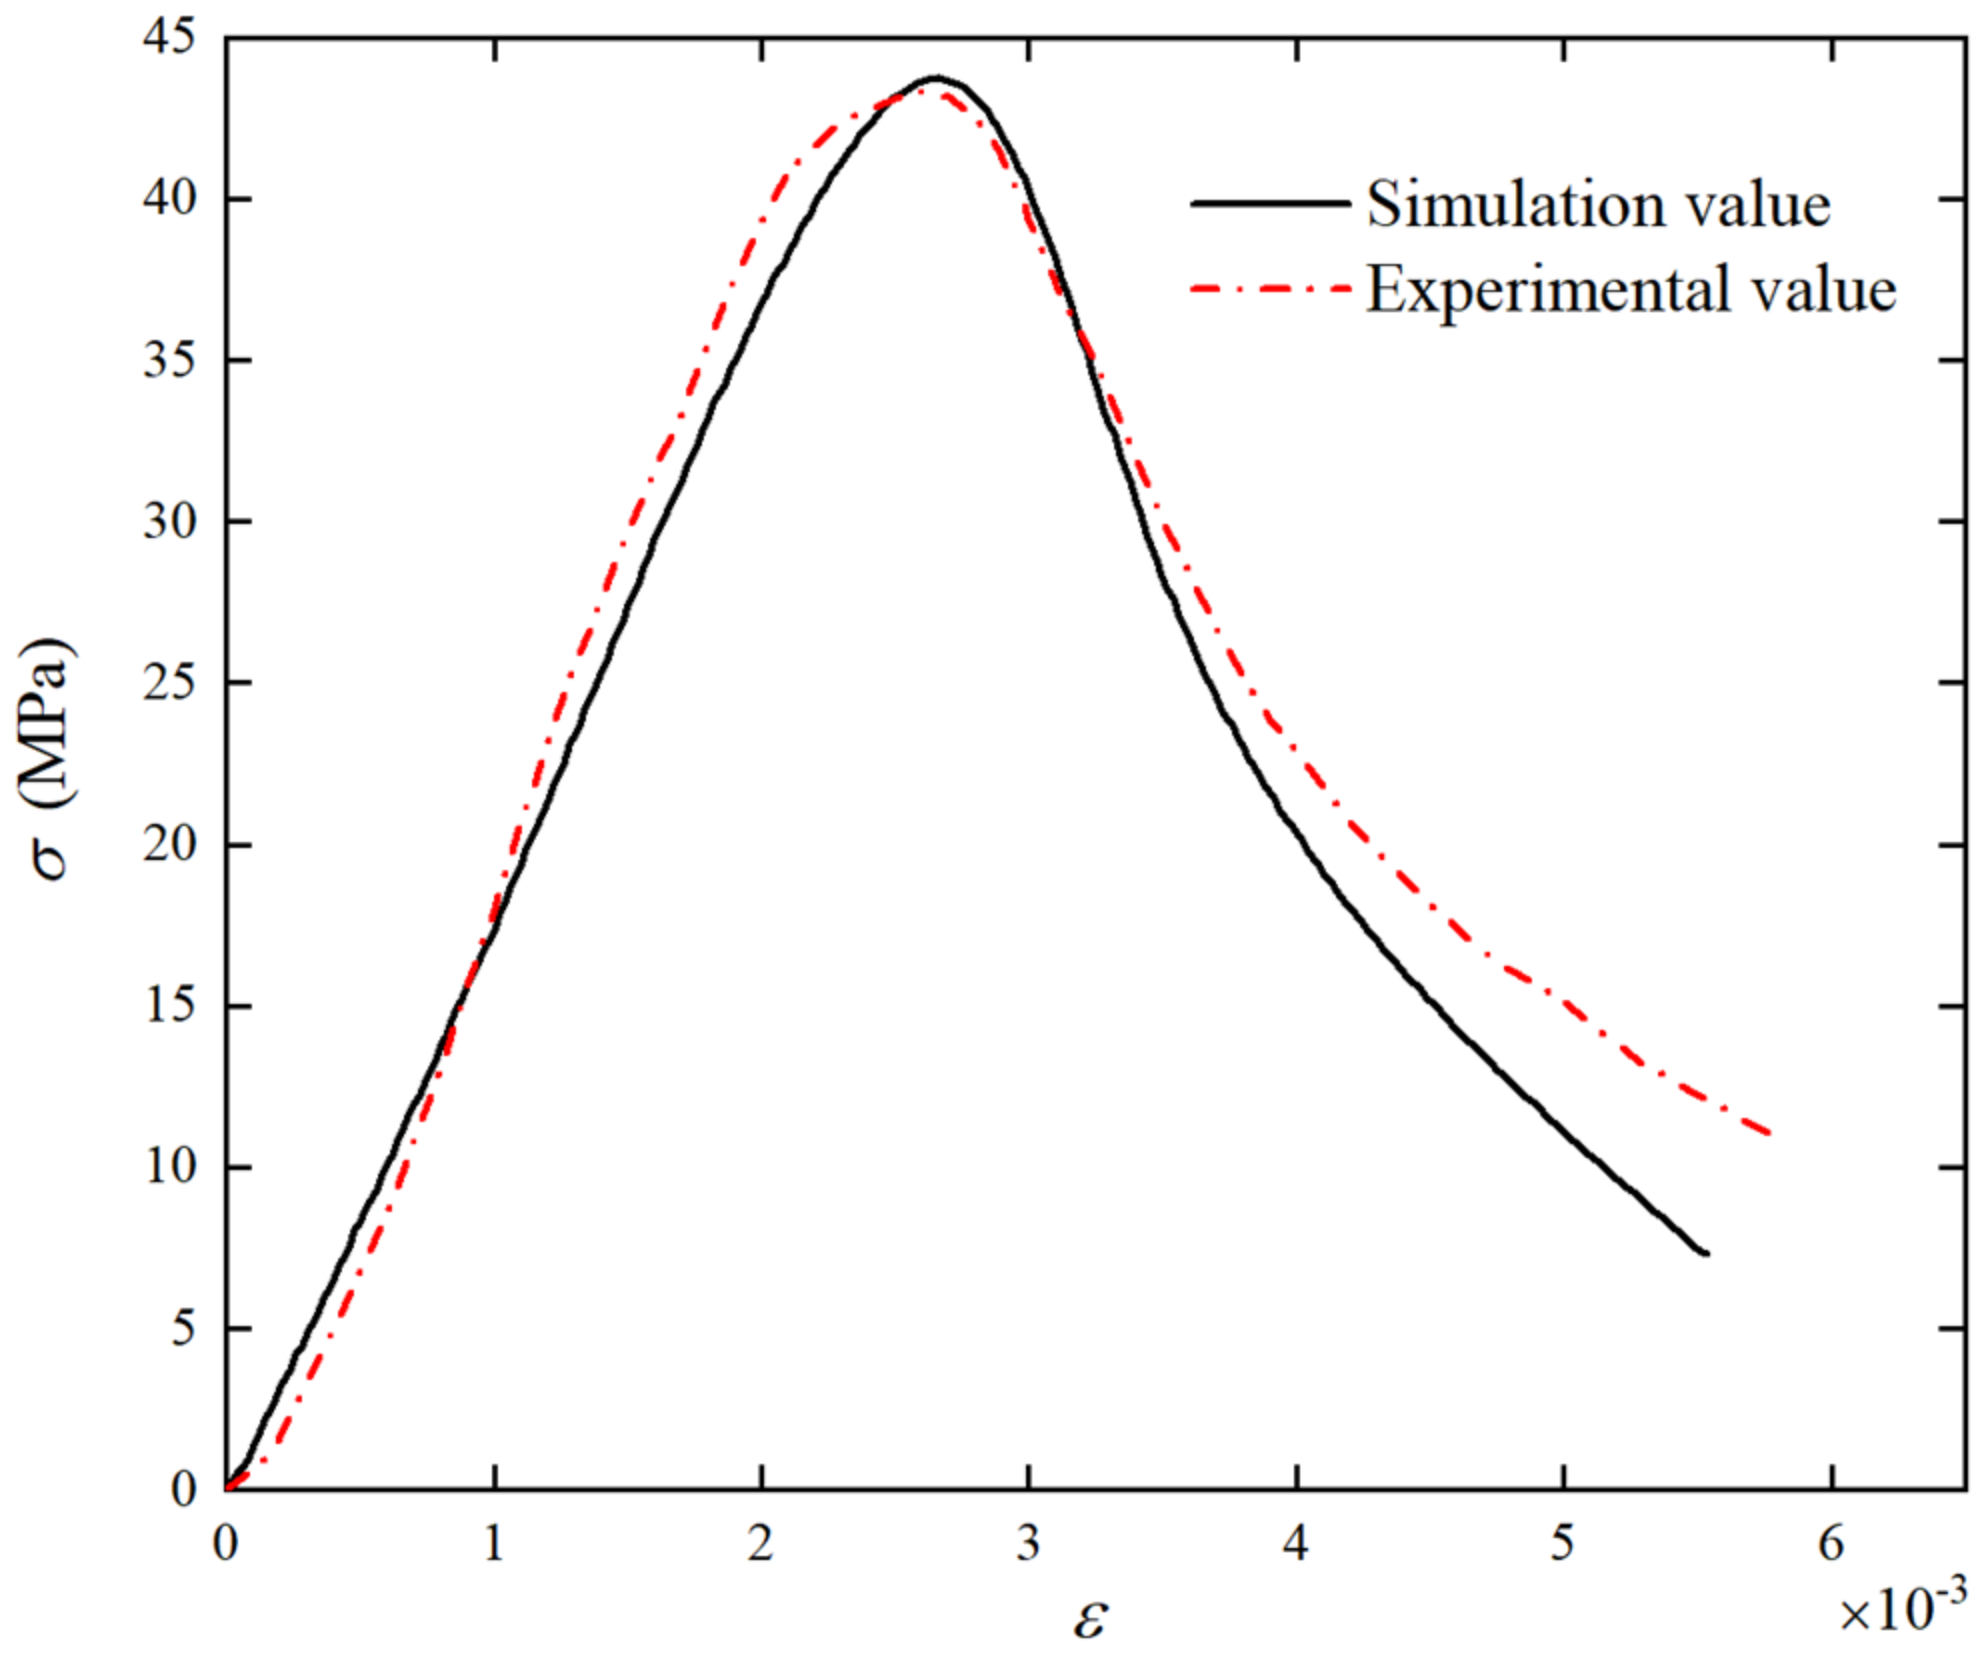
4.1.3. Numerical Simulation Results of Concrete Uniaxial Compression
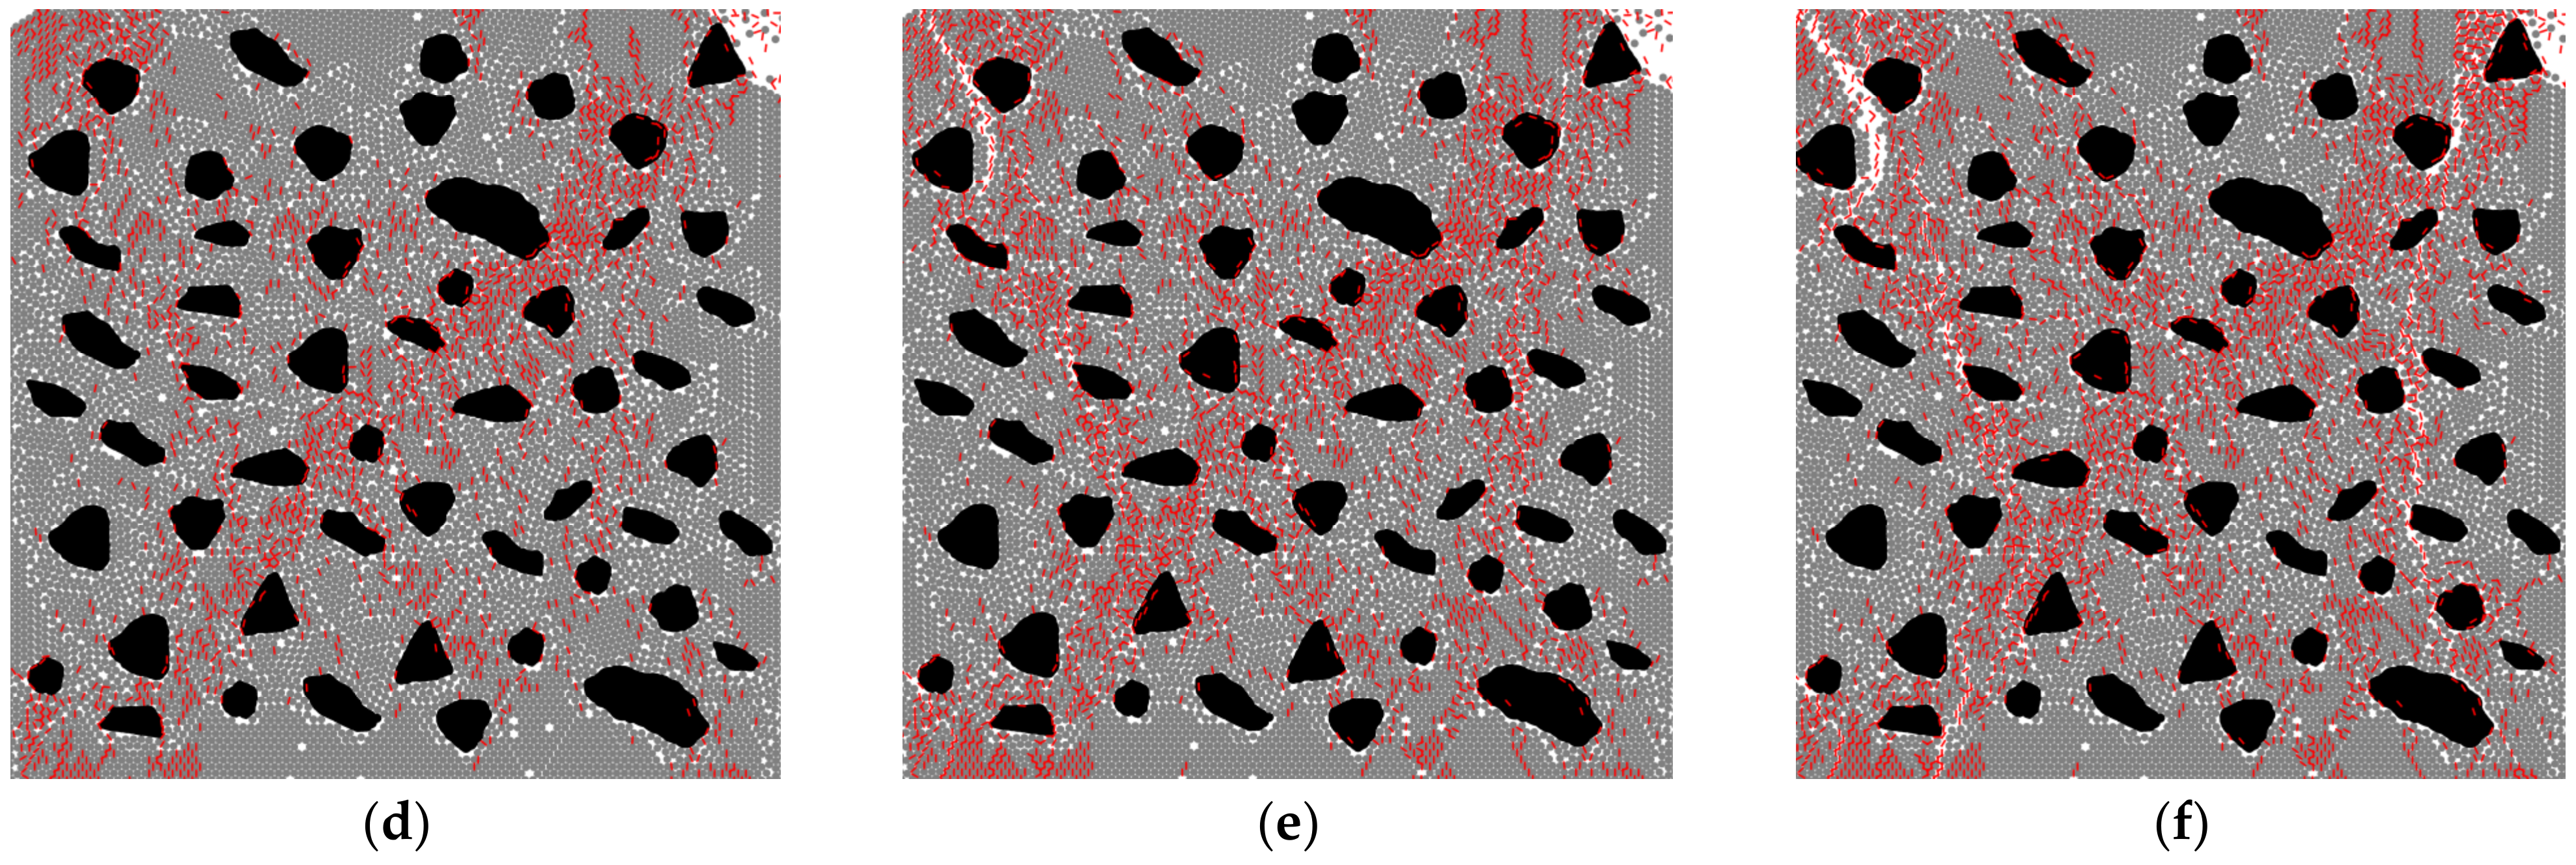
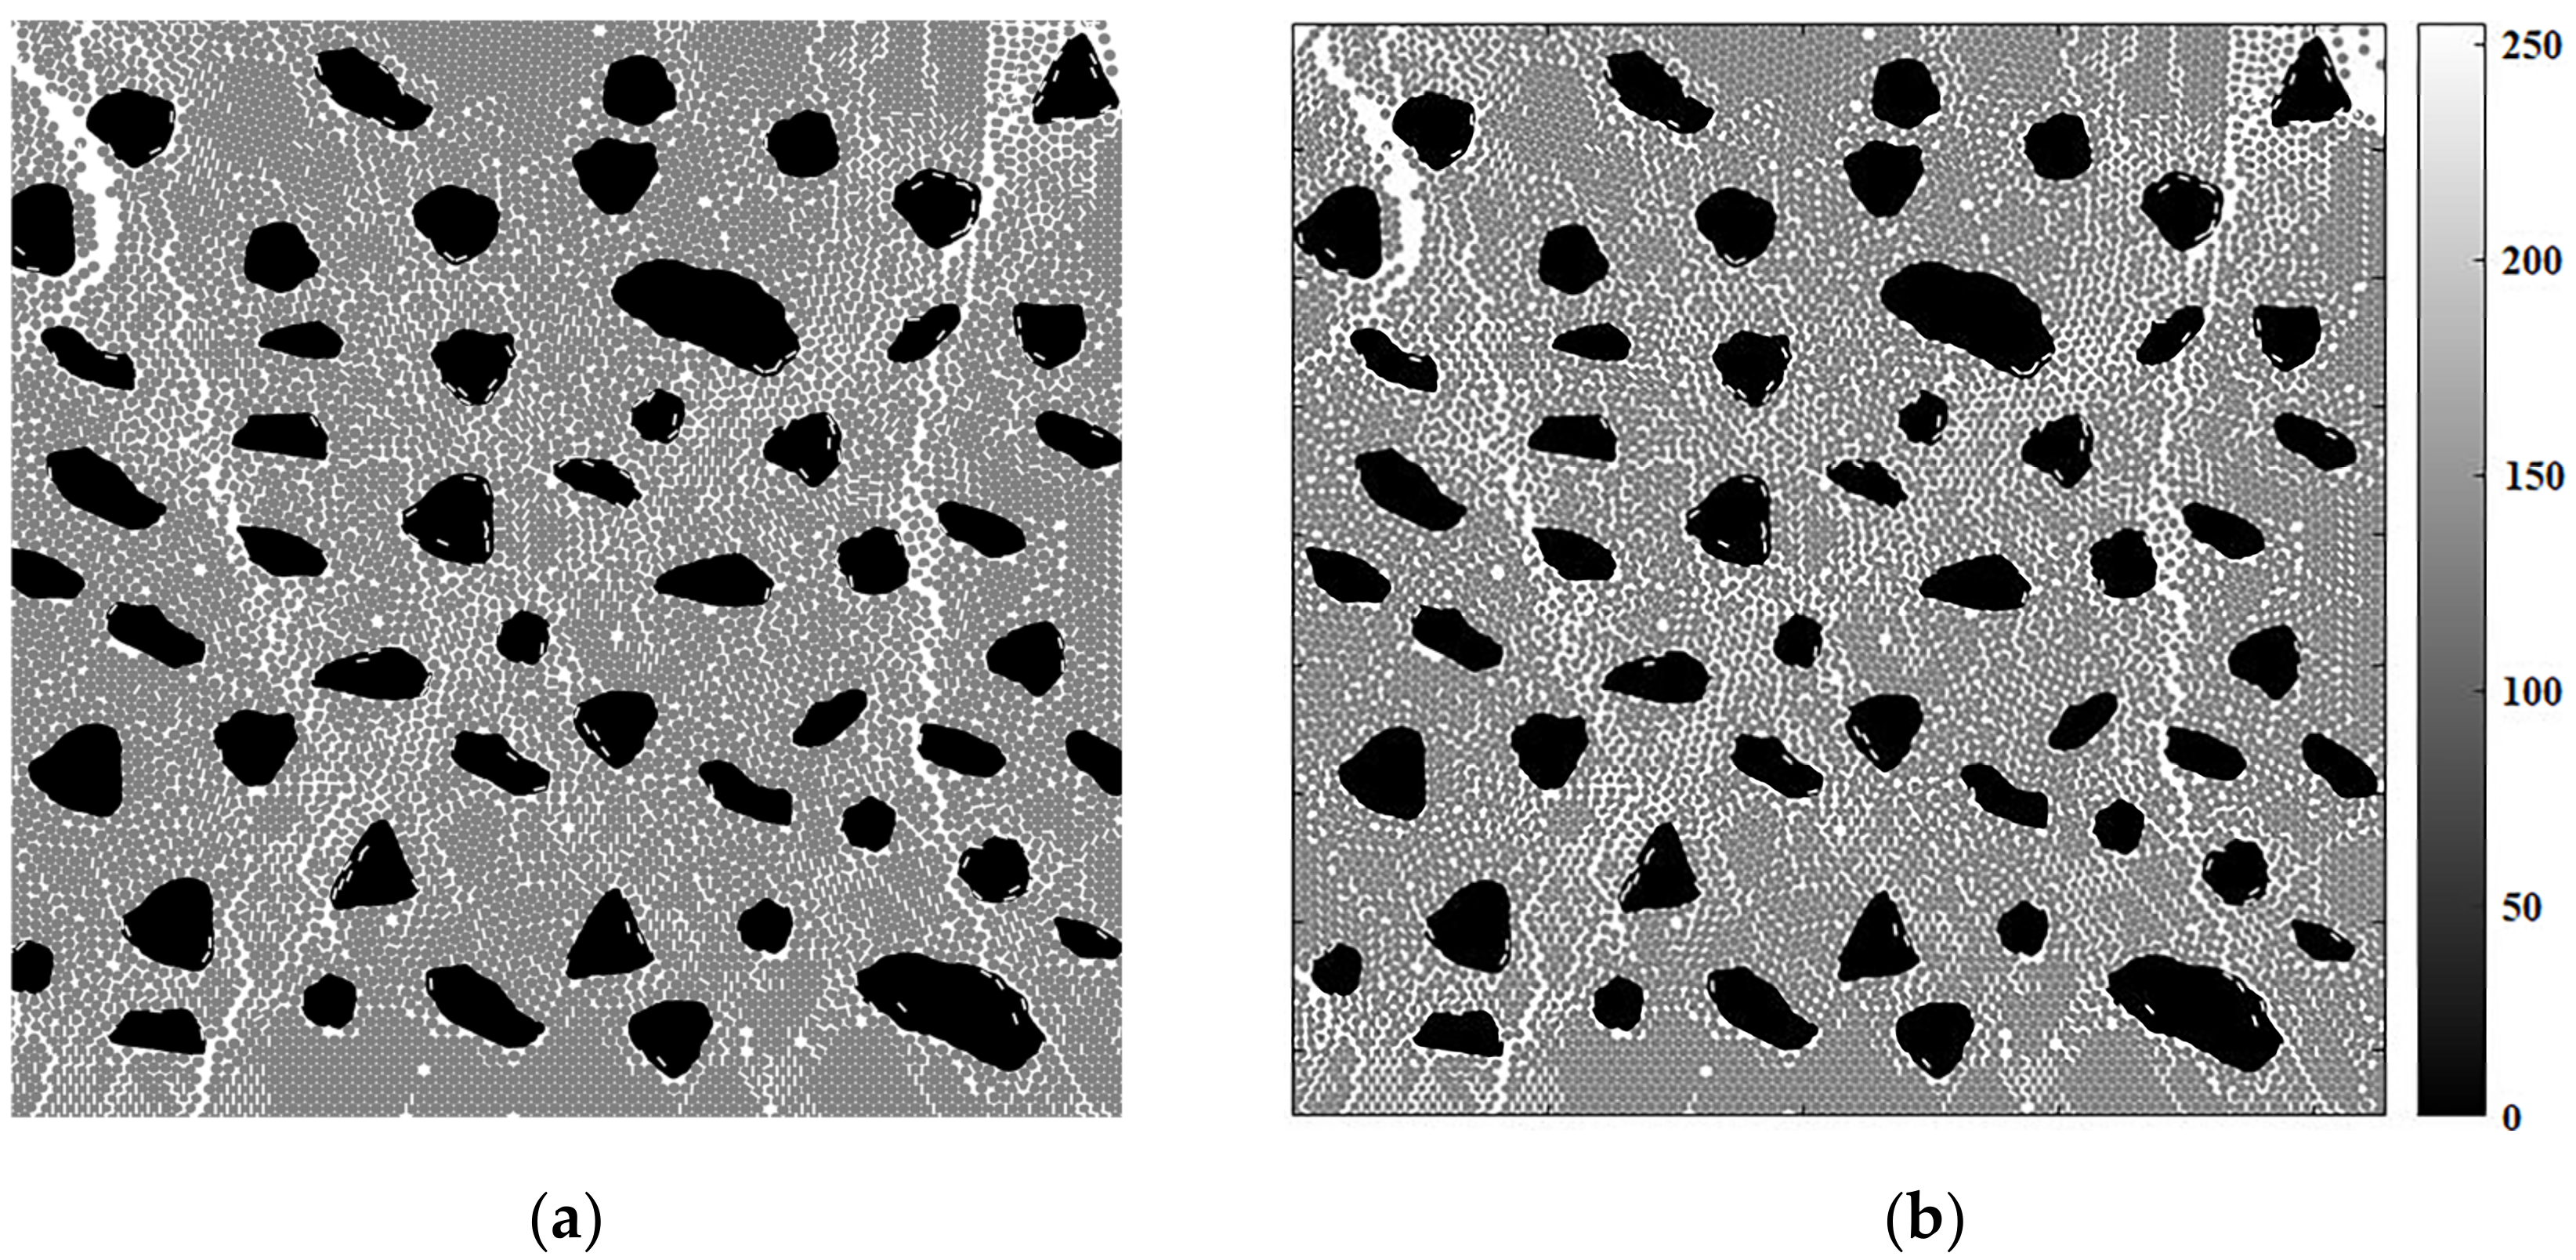
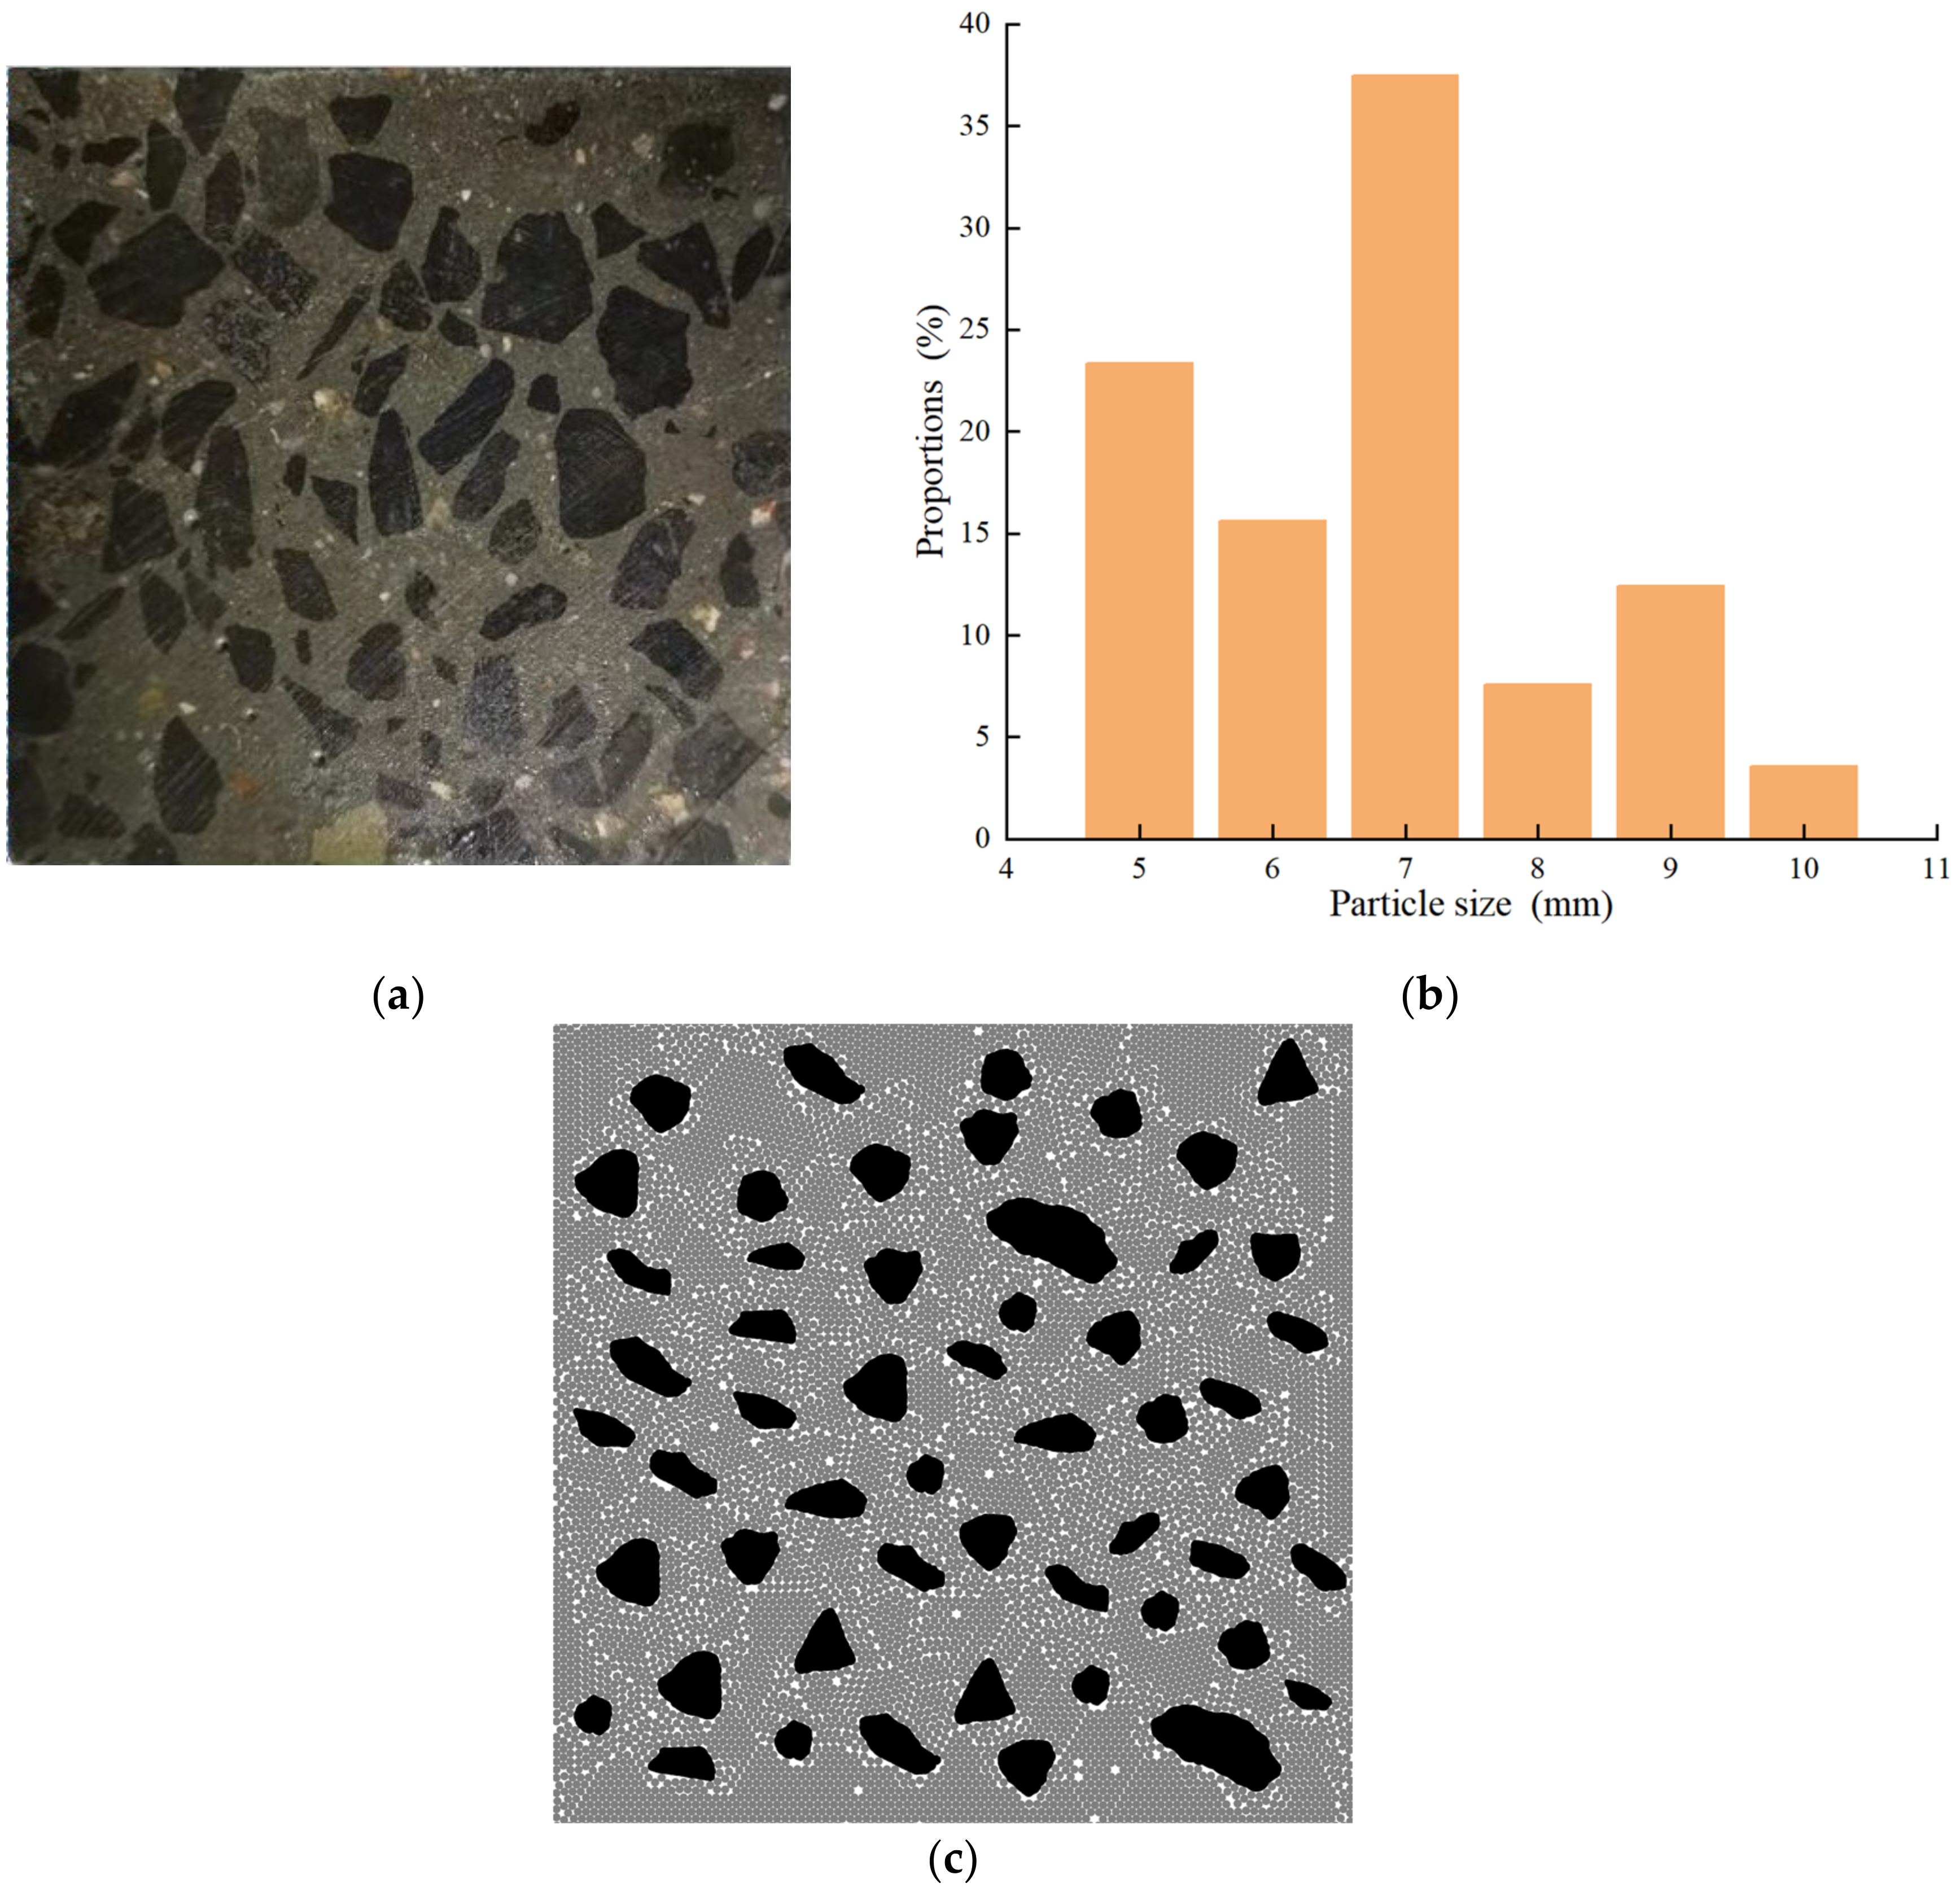
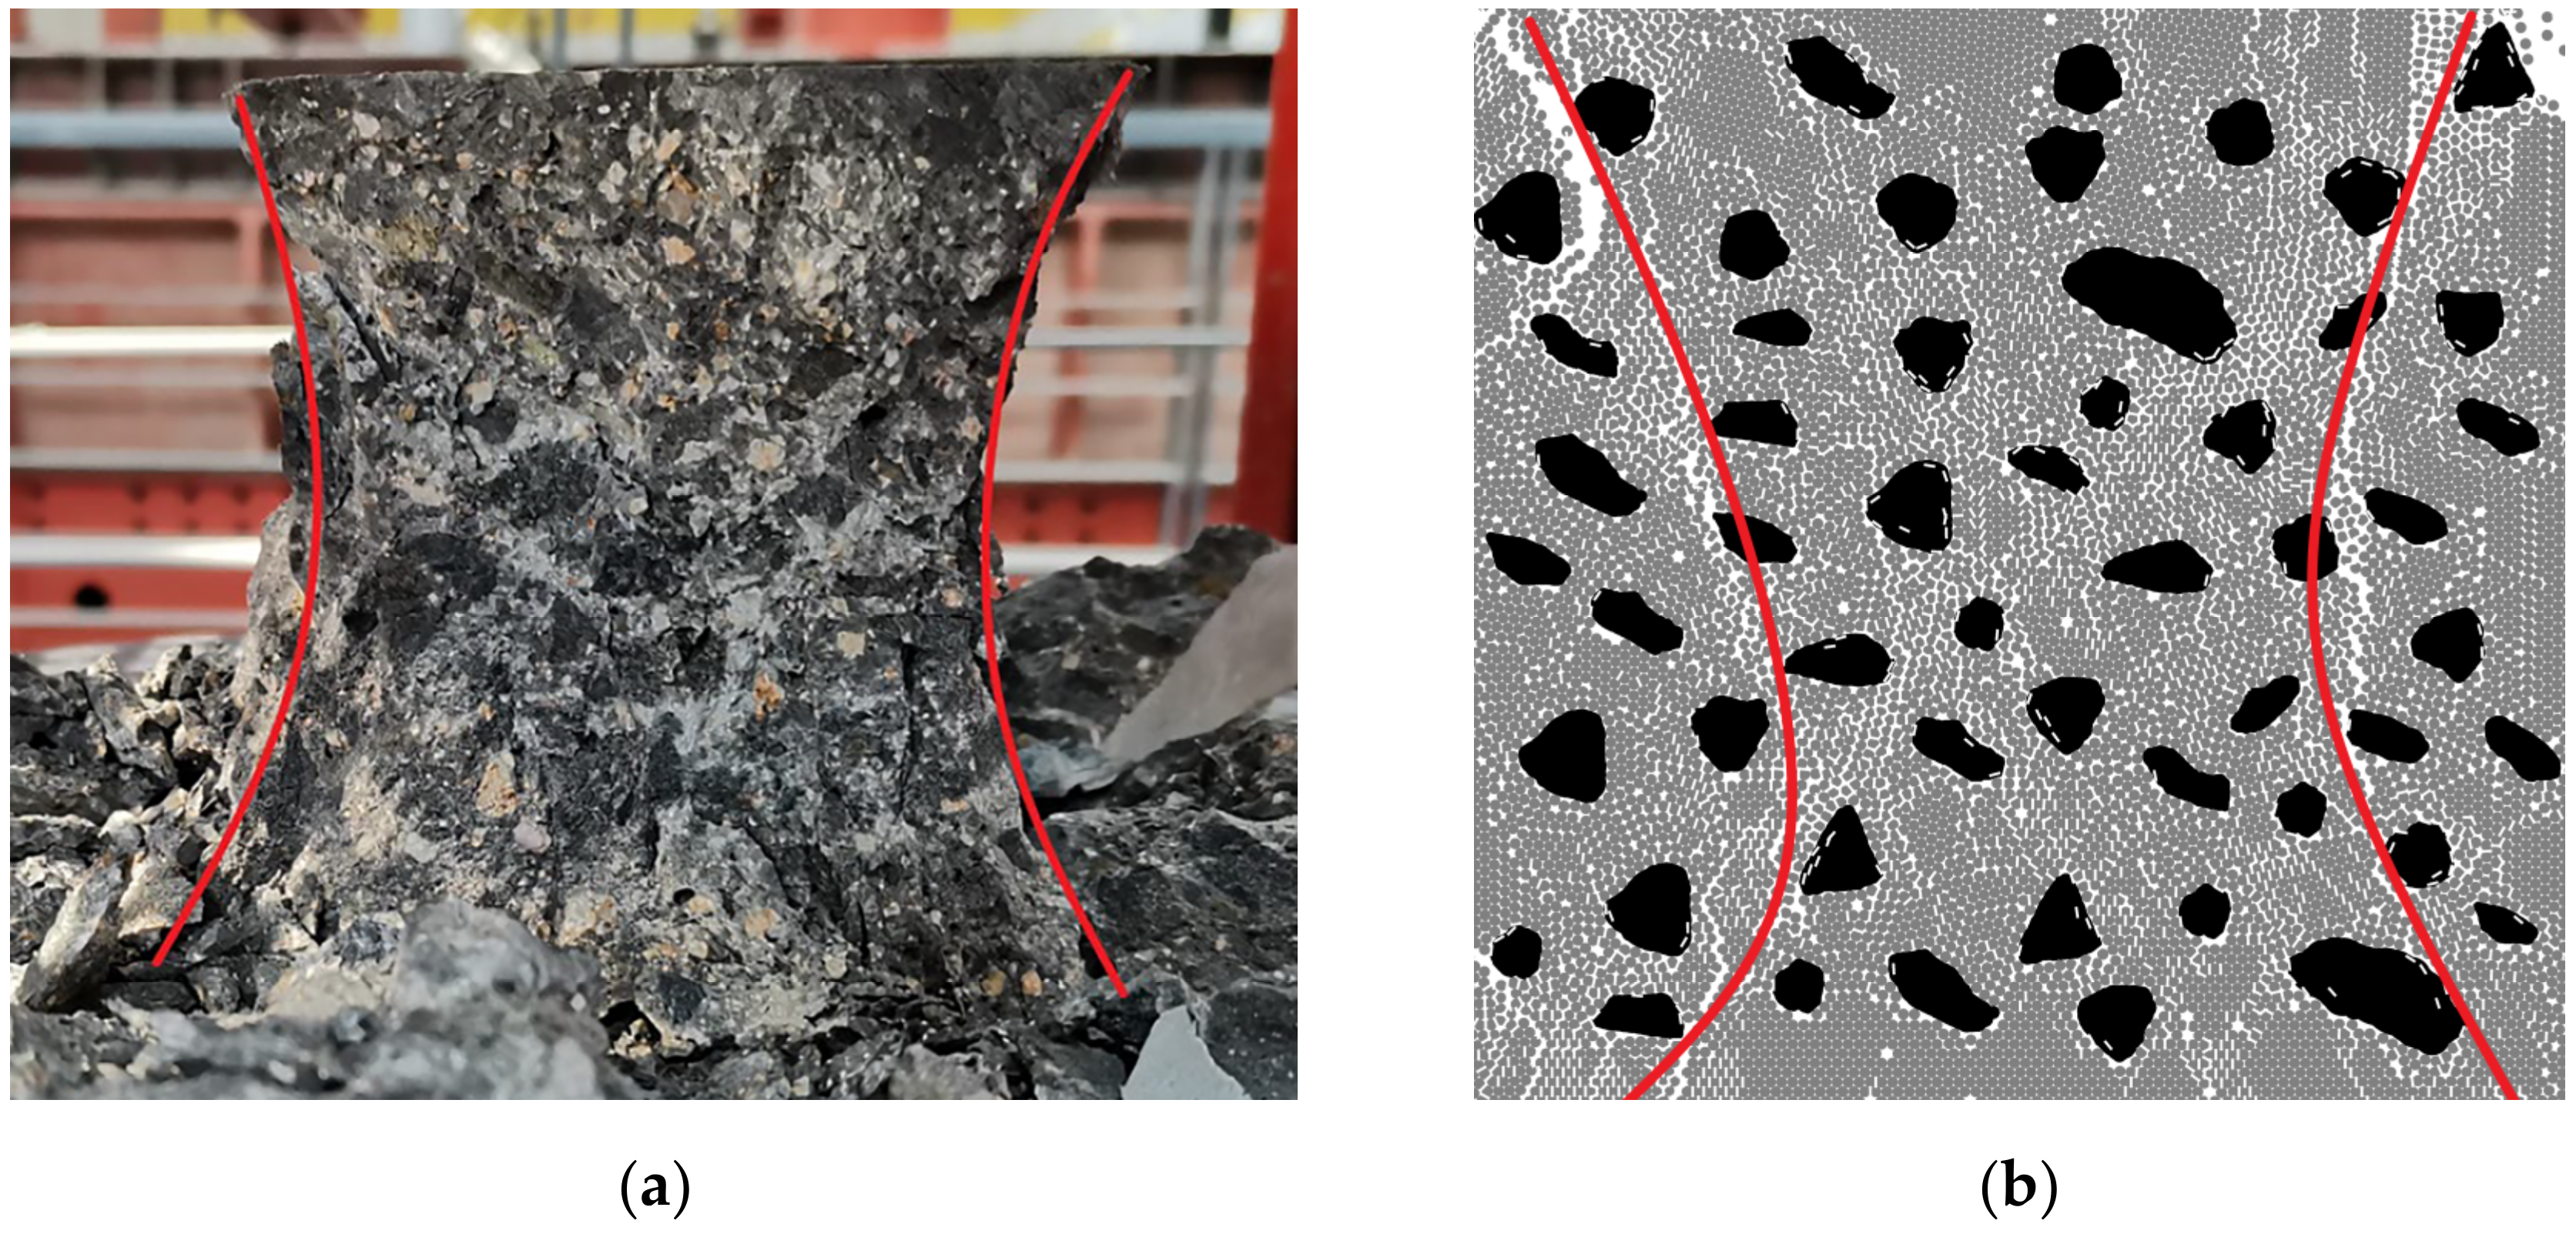
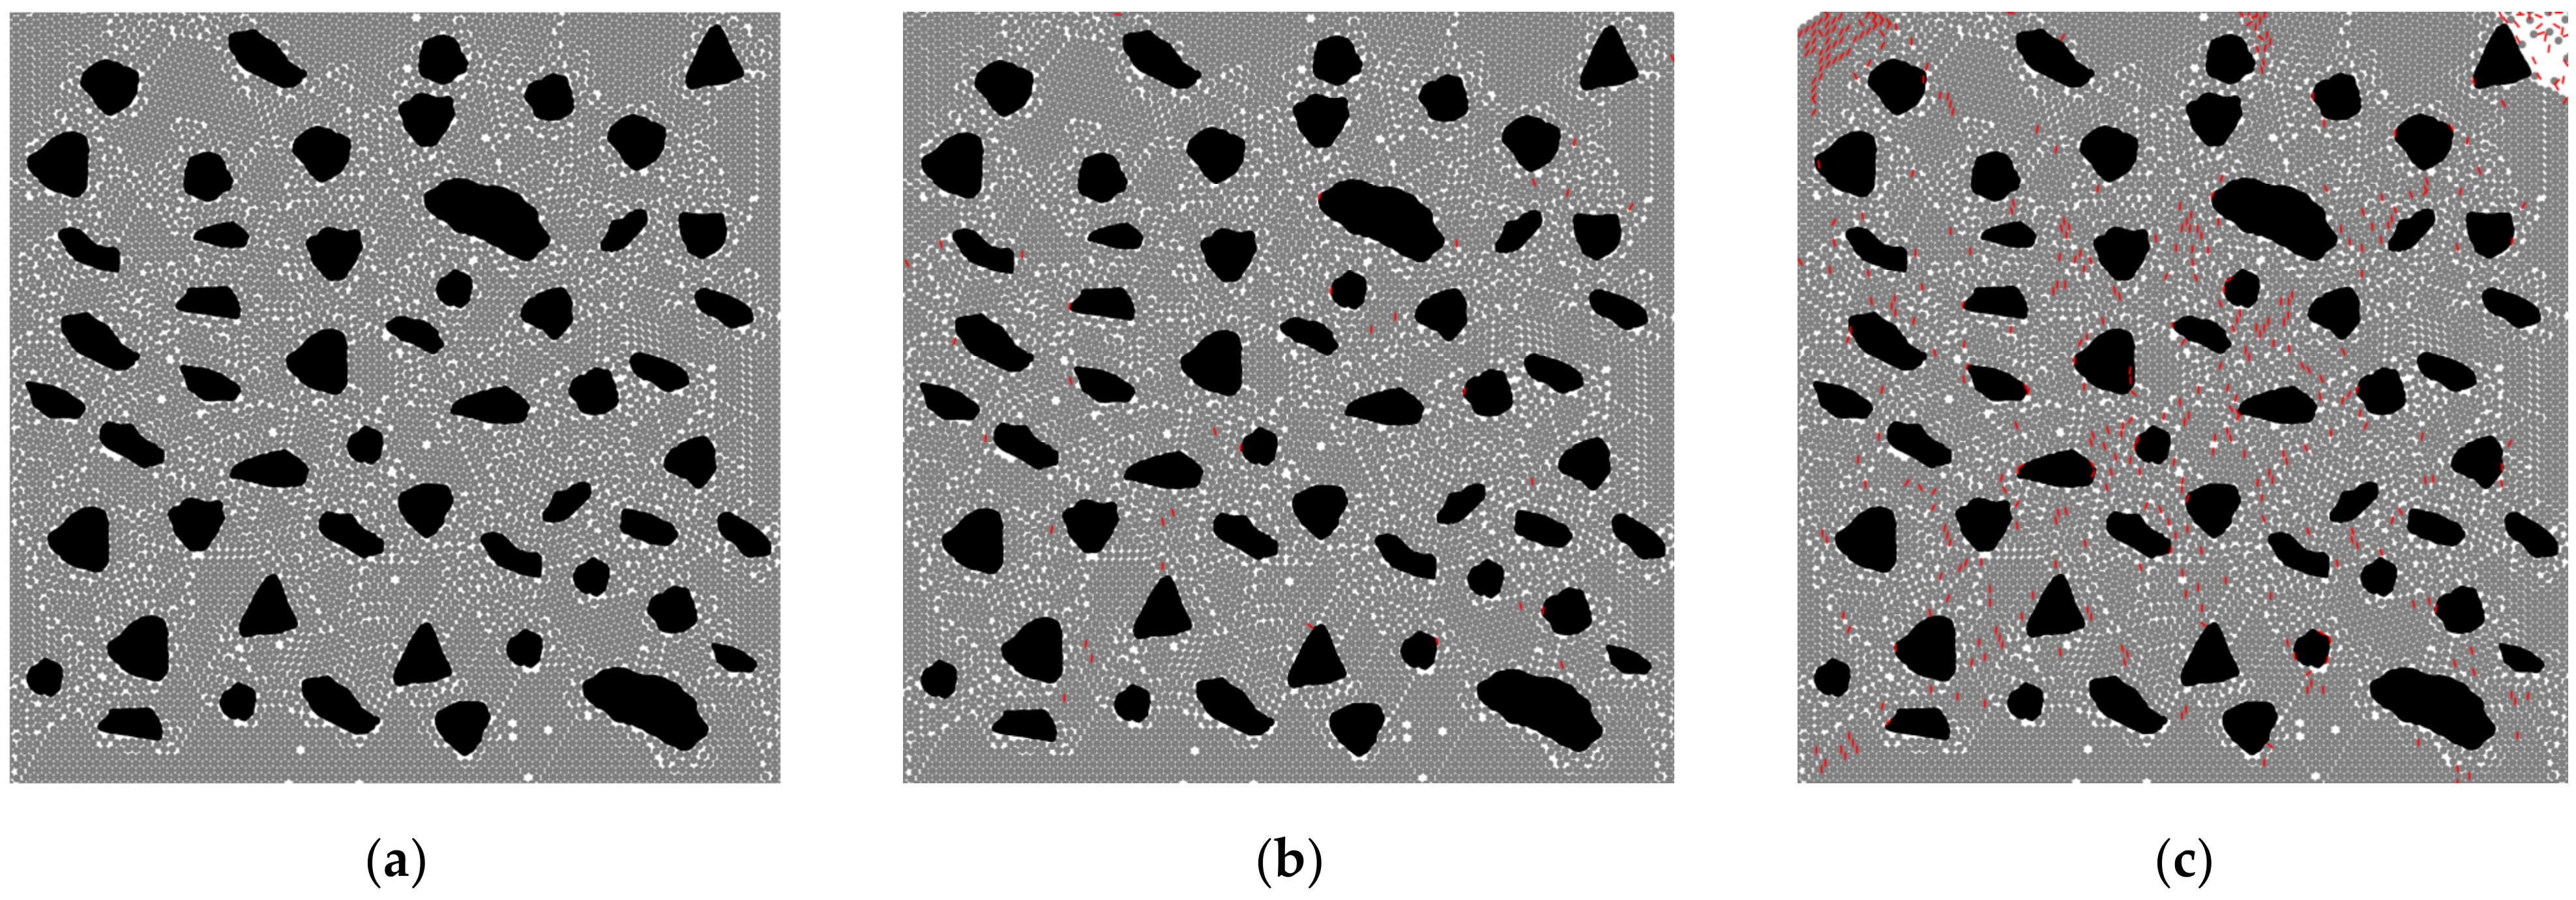
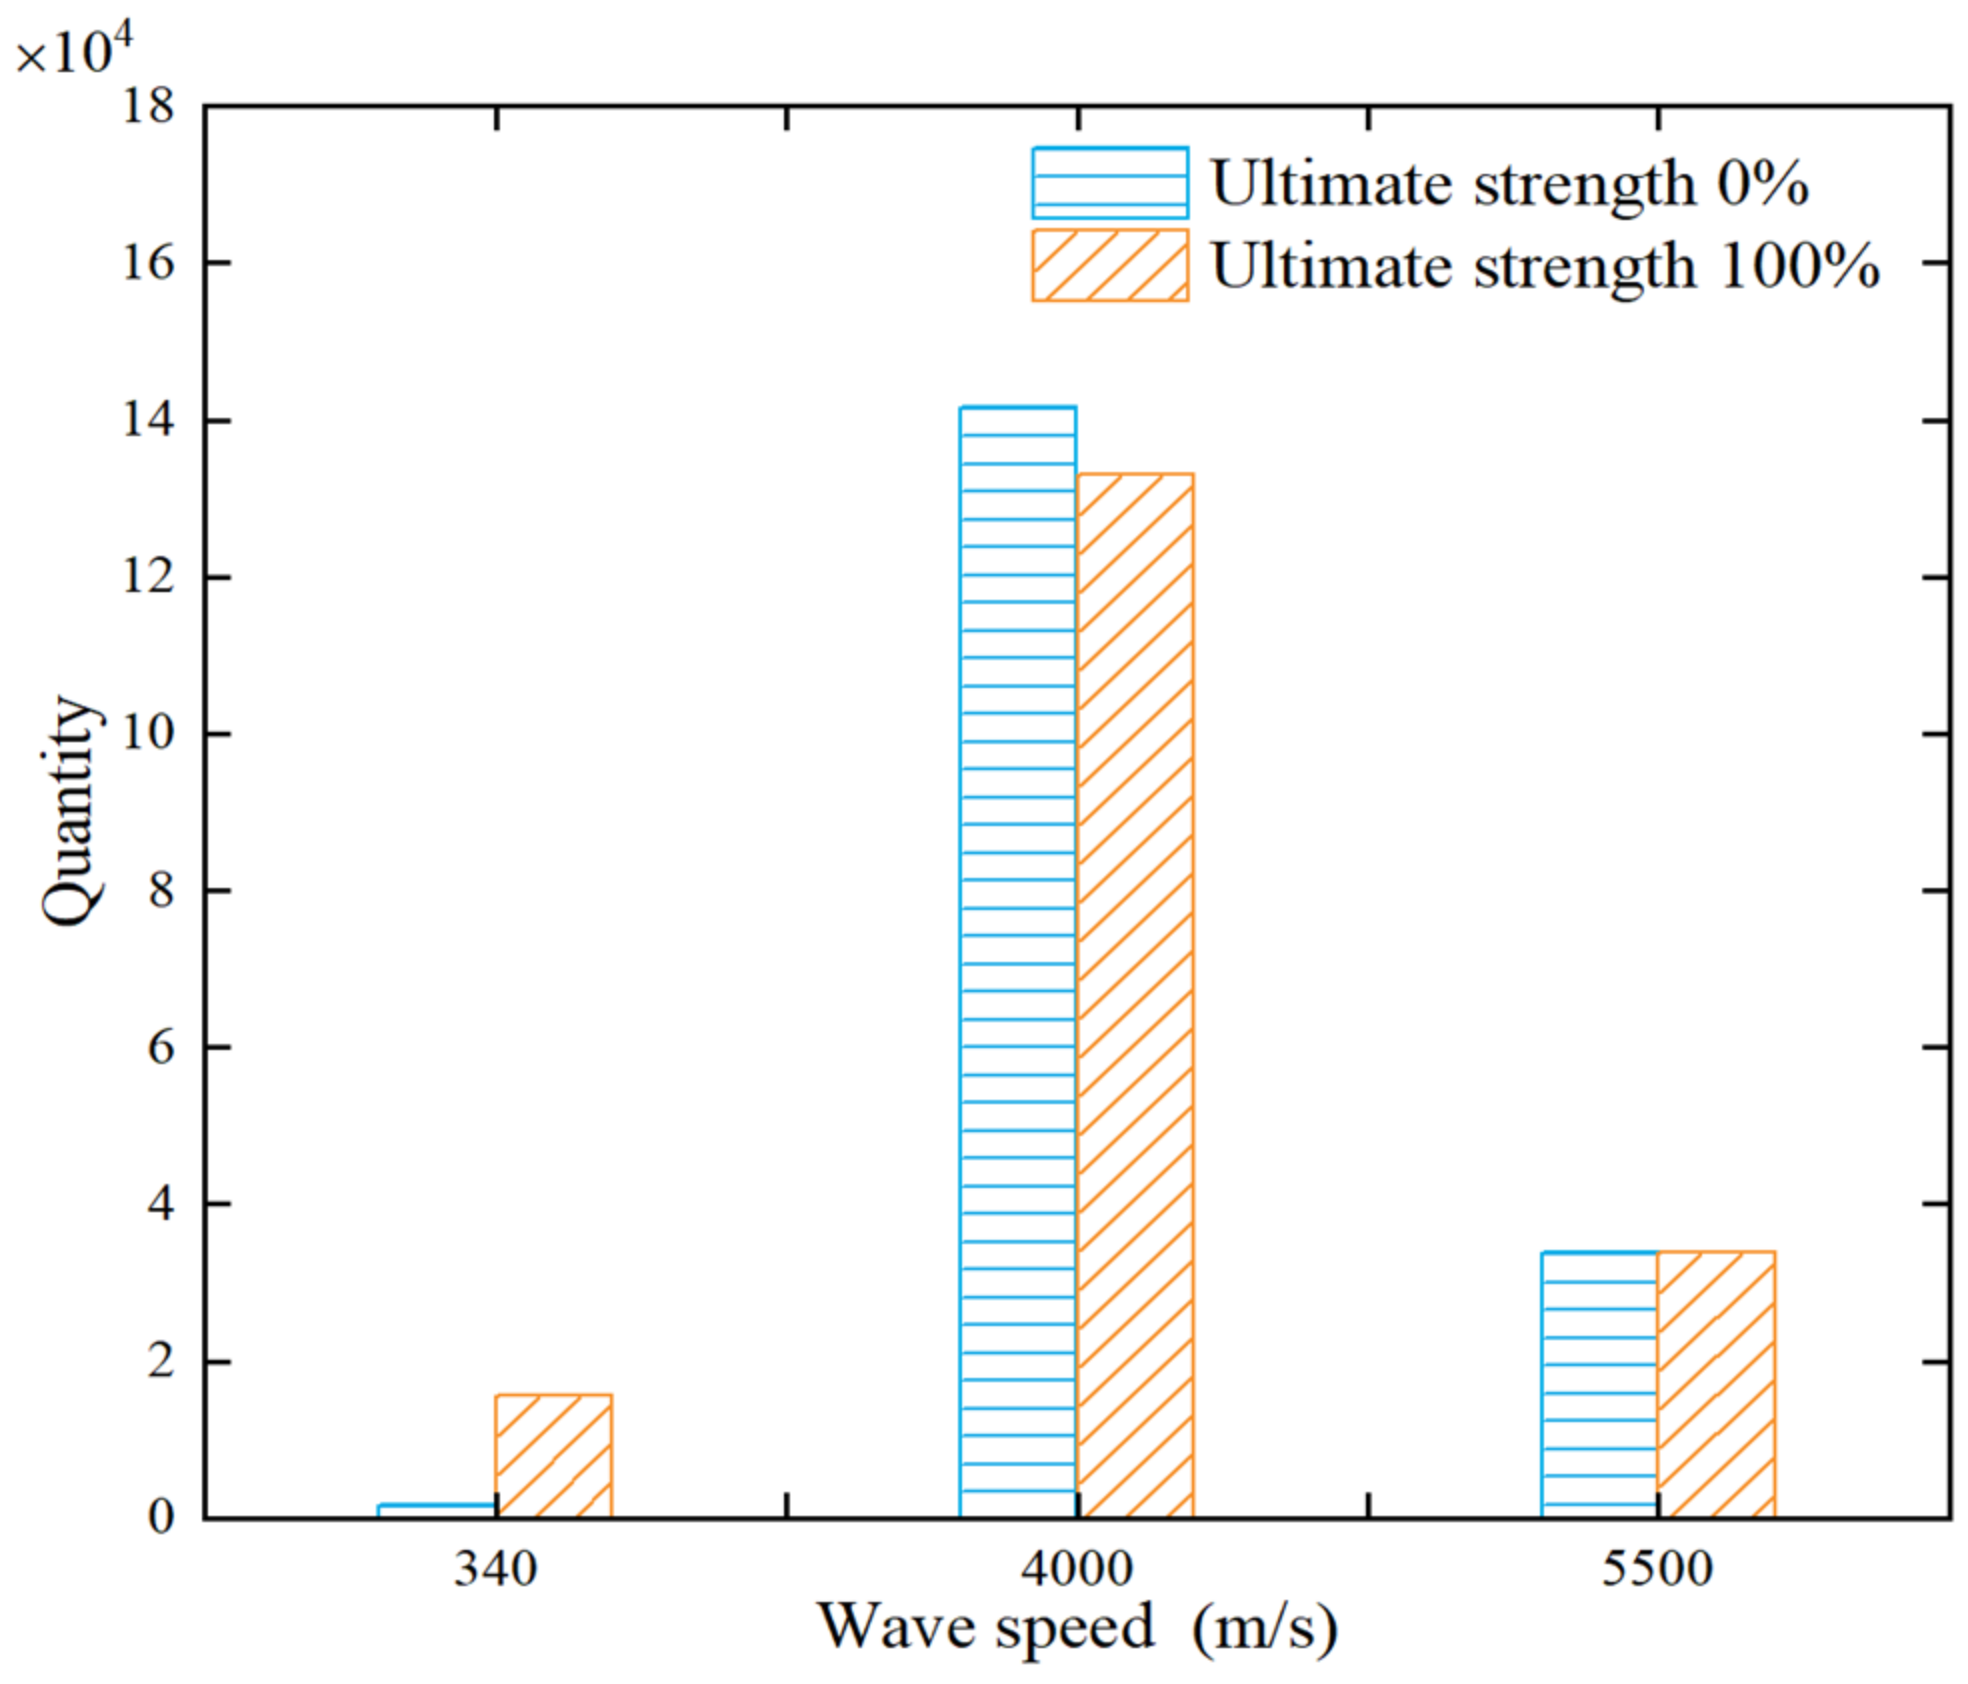
4.2. Ultrasonic Field Simulation Based on Damaged Concrete Images
4.2.1. Ultrasonic Field Model of Damaged Concrete
- Ultrasonic field setting
- Digital image processing
- Threshold segmentation and assignment
4.2.2. Analysis of the Ultrasonic Field of Damaged Concrete
5. Discussion
6. Conclusions
Author Contributions
Funding
Institutional Review Board Statement
Informed Consent Statement
Data Availability Statement
Conflicts of Interest
References
- McCann, D.M.; Forde, M.C. Review of NDT methods in the assessment of concrete and masonry structures. NDT E Int. 2001, 34, 71–84. [Google Scholar] [CrossRef]
- Anugonda, P.; Wiehn, J.S.; Turner, J.A. Diffusion of ultrasound in concrete. Ultrasonics 2001, 39, 429–435. [Google Scholar] [CrossRef]
- Snieder, R.; Gret, A.; Douma, H.; Scales, J. Coda wave interferometry for estimating nonlinear behavior in seismic velocity. Science 2002, 295, 2253–2255. [Google Scholar] [CrossRef] [Green Version]
- Aki, K.; Chouet, B. Origin of coda waves: Source, attenuation, and scattering effects. J. Geophys. Res. 1975, 80, 3322–3342. [Google Scholar] [CrossRef]
- Larose, E.; de Rosny, J.; Margerin, L.; Anache, D.; Gouedard, P.; Campillo, M.; van Tiggelen, B. Observation of multiple scattering of kHz vibrations in a concrete structure and application to monitoring weak changes. Phys. Rev. 2006, 73 Pt 2, 016609. [Google Scholar] [CrossRef] [PubMed]
- Rossetto, V.; Larose, É.; Margerin, L.; Planès, T.; Hadziioannou, C. Locating a small change in a multiple scattering environment. IESC Proc. Mesoscopic Phys. Complex Media 2010, 2010, 03001. [Google Scholar] [CrossRef] [Green Version]
- Snieder, R. The Theory of Coda Wave Interferometry. Pure Appl. Geophys. 2006, 163, 455–473. [Google Scholar] [CrossRef]
- Larose, E.; Hall, S. Monitoring stress related velocity variation in concrete with a 2 × 10⁻⁵ relative resolution using diffuse ultrasound. J. Acoust. Soc. Am. 2009, 125, 1853–1856. [Google Scholar] [CrossRef] [PubMed] [Green Version]
- Jiang, H.; Zhang, J.; Jiang, R. Stress Evaluation for Rocks and Structural Concrete Members through Ultrasonic Wave Analysis: Review. J. Mater. Civ. Eng. 2017, 29, 04017172. [Google Scholar] [CrossRef]
- Planès, T.; Larose, E. A review of ultrasonic Coda Wave Interferometry in concrete. Cem. Concr. Res. 2013, 53, 248–255. [Google Scholar] [CrossRef]
- Zhan, H.; Jiang, H.; Zhuang, C.; Zhang, J.; Jiang, R. Estimation of Stresses in Concrete by Using Coda Wave Interferometry to Establish an Acoustoelastic Modulus Database. Sensors 2020, 20, 4031. [Google Scholar] [CrossRef] [PubMed]
- Zhang, Y.; Planes, T.; Larose, E.; Obermann, A.; Rospars, C.; Moreau, G. Diffuse ultrasound monitoring of stress and damage development on a 15-ton concrete beam. J. Acoust. Soc. Am. 2016, 139, 1691. [Google Scholar] [CrossRef] [PubMed] [Green Version]
- Grabke, S.; Clauss, F.; Bletzinger, K.U.; Ahrens, M.A.; Mark, P.; Wuchner, R. Damage Detection at a Reinforced Concrete Specimen with Coda Wave Interferometry. Materials 2021, 14, 5013. [Google Scholar] [CrossRef] [PubMed]
- Liu, S.; Bundur, Z.B.; Zhu, J.; Ferron, R.D. Evaluation of self-healing of internal cracks in biomimetic mortar using coda wave interferometry. Cem. Concr. Res. 2016, 83, 70–78. [Google Scholar] [CrossRef]
- Legland, J.B.; Zhang, Y.; Abraham, O.; Durand, O.; Tournat, V. Evaluation of crack status in a meter-size concrete structure using the ultrasonic nonlinear coda wave interferometry. J. Acoust. Soc. Am. 2017, 142, 2233. [Google Scholar] [CrossRef]
- Wang, X.; Chakraborty, J.; Bassil, A.; Niederleithinger, E. Detection of Multiple Cracks in Four-Point Bending Tests Using the Coda Wave Interferometry Method. Sensors 2020, 20, 1986. [Google Scholar] [CrossRef] [Green Version]
- Zhan, H.; Jiang, H.; Jiang, R. Three-dimensional images generated from diffuse ultrasound wave: Detections of multiple cracks in concrete structures. Struct. Health Monit. 2019, 19, 12–25. [Google Scholar] [CrossRef]
- Niederleithinger, E.; Wunderlich, C. Influence of small temperature variations on the ultrasonic velocity in concrete. AIP Conf. Proc. 2013, 1511, 390–397. [Google Scholar] [CrossRef]
- Moradi-Marani, F.; Kodjo, S.A.; Rivard, P.; Lamarche, C.-P. Effect of the Temperature on the Nonlinear Acoustic Behavior of Reinforced Concrete Using Dynamic Acoustoelastic Method of Time Shift. J. Nondestruct. Eval. 2014, 33, 288–298. [Google Scholar] [CrossRef]
- Zhang, Y.; Abraham, O.; Tournat, V.; le Duff, A.; Lascoup, B.; Loukili, A.; Grondin, F.; Durand, O. Validation of a thermal bias control technique for Coda Wave Interferometry (CWI). Ultrasonics 2013, 53, 658–664. [Google Scholar] [CrossRef] [Green Version]
- Hughes, D.S.; Kelly, J.L. Second-Order Elastic Deformation of Solids. Phys. Rev. 1953, 92, 1145–1149. [Google Scholar] [CrossRef]
- Shokouhi, P.; Niederleithinger, E.; Zoëga, A.; Barner, A.; Schöne, D. Using Ultrasonic Coda Wave Interferometry for Monitoring Stress-Induced Changes in Concrete. In Proceedings of the 23rd SAGEEP Symposium on the Application of Geophysics to Engineering and Environmental Problems, Denver, CO, USA, 11–15 April 2010; pp. 650–654. [Google Scholar] [CrossRef]
- Stahler, S.C.; Sens-Schonfelder, C.; Niederleithinger, E. Monitoring stress changes in a concrete bridge with coda wave interferometry. J. Acoust. Soc. Am. 2011, 129, 1945–1952. [Google Scholar] [CrossRef] [PubMed] [Green Version]
- Schurr, D.P.; Kim, J.-Y.; Sabra, K.G.; Jacobs, L.J. Damage detection in concrete using coda wave interferometry. NDT E Int. 2011, 44, 728–735. [Google Scholar] [CrossRef]
- Hu, H.; Li, D.; Wang, L.; Chen, R.; Xu, X. An improved ultrasonic coda wave method for concrete behavior monitoring under various loading conditions. Ultrasonics 2021, 116, 106498. [Google Scholar] [CrossRef]
- Zhang, Y.; Abraham, O.; Grondin, F.; Loukili, A.; Tournat, V.; le Duff, A.; Lascoup, B.; Durand, O. Study of stress-induced velocity variation in concrete under direct tensile force and monitoring of the damage level by using thermally-compensated Coda Wave Interferometry. Ultrasonics 2012, 52, 1038–1045. [Google Scholar] [CrossRef] [PubMed] [Green Version]
- Jiang, H.; Zhan, H.; Zhang, J.; Jiang, R.; Zhuang, C.; Fan, P. Detecting Stress Changes and Damage in Full-Size Concrete T-Beam and Slab with Ultrasonic Coda Waves. J. Struct. Eng. 2021, 147, 04021140. [Google Scholar] [CrossRef]
- Wang, X.; Niederleithinger, E.; Hindersmann, I. The installation of embedded ultrasonic transducers inside a bridge to monitor temperature and load influence using coda wave interferometry technique. Struct. Health Monit. 2021; online. [Google Scholar] [CrossRef]
- Xie, F.; Larose, E.; Moreau, L.; Zhang, Y.; Planes, T. Characterizing extended changes in multiple scattering media using coda wave decorrelation: Numerical simulations. Waves Random Complex Media 2018, 28, 1–14. [Google Scholar] [CrossRef]
- Chen, G.; Pageot, D.; Abraham, O.; Zhang, Y.; Chekroun, M.; Tournat, V. Nonlinear Coda Wave Interferometry: Sensitivity to wave-induced material property changes analyzed via numerical simulations in 2D. Ultrasonics 2019, 99, 105968. [Google Scholar] [CrossRef]
- Chen, G.; Zhang, Y.; Abraham, O.; Pageot, D.; Chekroun, M.; Tournat, V. Numerical parametric study of Nonlinear Coda Wave Interferometry sensitivity to microcrack size in a multiple scattering medium. Ultrasonics 2021, 116, 106483. [Google Scholar] [CrossRef]
- Chen, G.; Pageot, D.; Legland, J.-B.; Abraham, O.; Chekroun, M.; Tournat, V. Numerical modeling of ultrasonic coda wave interferometry in a multiple scattering medium with a localized nonlinear defect. Wave Motion 2017, 72, 228–243. [Google Scholar] [CrossRef]
- Finger, C.; Saydak, L.; Vu, G.; Timothy, J.J.; Meschke, G.; Saenger, E.H. Sensitivity of Ultrasonic Coda Wave Interferometry to Material Damage-Observations from a Virtual Concrete Lab. Materials 2021, 14, 4033. [Google Scholar] [CrossRef] [PubMed]
- Hafiz, A.; Schumacher, T. Monitoring of Stresses in Concrete Using Ultrasonic Coda Wave Comparison Technique. J. Nondestruct. Eval. 2018, 37, 73. [Google Scholar] [CrossRef]
- Clauß, F.; Epple, N.; Ahrens, M.A.; Niederleithinger, E.; Mark, P. Correlation of Load-Bearing Behavior of Reinforced Concrete Members and Velocity Changes of Coda Waves. Materials 2022, 15, 738. [Google Scholar] [CrossRef] [PubMed]
- Niederleithinger, E.; Wang, X.; Herbrand, M.; Muller, M. Processing Ultrasonic Data by Coda Wave Interferometry to Monitor Load Tests of Concrete Beams. Sensors 2018, 18, 1971. [Google Scholar] [CrossRef] [Green Version]
- Cho, N.; Martin, C.D.; Sego, D.C. A clumped particle model for rock. Int. J. Rock Mech. Min. 2007, 44, 997–1010. [Google Scholar] [CrossRef]
- Manso, J.; Marcelino, J.; Caldeira, L. Effect of the clump size for bonded particle model on the uniaxial and tensile strength ratio of rock. Int. J. Rock Mech. Min. Sci. 2019, 114, 131–140. [Google Scholar] [CrossRef]
- Collino, F.; Tsogka, C. Application of the perfectly matched absorbing layer model to the linear elastodynamic problem in anisotropic heterogeneous media. Geophysics 2001, 66, 294–307. [Google Scholar] [CrossRef] [Green Version]
- Pled, F.; Desceliers, C. Review and Recent Developments on the Perfectly Matched Layer (PML) Method for the Numerical Modeling and Simulation of Elastic Wave Propagation in Unbounded Domains. Arch. Comput. Methods Eng. 2021, 29, 471–518. [Google Scholar] [CrossRef]
- Mamand, H.; Chen, J. Extended Digital Image Correlation Method for Mapping Multiscale Damage in Concrete. J. Mater. Civ. Eng. 2017, 29, 04017179. [Google Scholar] [CrossRef] [Green Version]
- Yu, Q.L.; Yang, T.H.; Zhu, W.C.; Zheng, C. Digital Image-Based Model for Concrete Fracturing Process Analysis. In Proceedings of the 6th International Conference on Physical and Numerical Simulation of Materials Processing, Guilin, China, 16 November 2010; Volume 704–705, pp. 980–988. [Google Scholar] [CrossRef]


| Concrete Strength Grade | Material Consumption (Weight Ratio) | ||||||
|---|---|---|---|---|---|---|---|
| Cement | Water | Sand | Pebble | Mineral Powder | Fly Ash | Water Reducing Agent | |
| C40 | 1.000 (P.O42.5) | 0.450 | 1.360 | 3.030 | / | / | / |
| C50 | 1.000 (P.O42.5) | 0.350 | 0.910 | 2.380 | / | / | / |
| C60 | 1.000 (P.O52.5) | 0.359 | 1.663 | 2.298 | 0.138 | 0.069 | 0.032 |
| C70 | 1.000 (P.O52.5) | 0.380 | 1.620 | 2.650 | 0.235 | 0.117 | 0.054 |
| Concrete Strength | Axial Compressive Strength/MPa | Maximum Load/kN |
|---|---|---|
| C40 | 44.1 | 460 |
| C50 | 53.87 | 520 |
| C60 | 63.8 | 620 |
| C70 | 73.6 | 740 |
| Concrete Strength | x = F/Fmax | a | b | R2 |
|---|---|---|---|---|
| C40 | 0–30% | 0.0526 | 0.00153 | 0.94931 |
| 30–50% | −0.00707 | 0.01709 | 1 | |
| 50–80% | −0.21354 | 0.12101 | 0.99099 | |
| 80–100% | −1.06024 | 0.78913 | 0.99304 | |
| C50 | 0–30% | 0.05787 | 0.00301 | 0.9146 |
| 30–50% | −0.00801 | 0.01954 | 1 | |
| 50–80% | −0.20256 | 0.11869 | 0.97374 | |
| 80–100% | −1.03074 | 0.78799 | 0.99365 | |
| C60 | 0–30% | 0.08213 | 0.00686 | 0.84953 |
| 30–50% | 0.02818 | 0.01879 | 1 | |
| 50–80% | −0.15884 | 0.11397 | 0.98072 | |
| 80–100% | −1.23438 | 0.98672 | 0.98572 | |
| C70 | 0–30% | 0.08939 | 0.00305 | 0.96862 |
| 30–50% | −0.00745 | 0.03426 | −0.10323 | |
| 50–80% | −0.16207 | 0.11139 | 0.95158 | |
| 80–100% | −1.93605 | 1.53482 | 0.99379 |
| Meso-Parameters | /GPa | /MPa | /MPa | ||
|---|---|---|---|---|---|
| Discussed Value | 27.9 | 0.38 | 0 | 8.5 | 33 |
| 32.9 | 1.38 | 0.3 | 13.5 | 38 | |
| 37.9 | 2.38 | 0.6 | 18.5 | 43 | |
| 42.9 | 3.38 | 0.9 | 23.5 | 48 | |
| 47.9 | 4.38 | 1.2 | 28.5 | 53 | |
| 52.9 | 5.38 | 1.5 | 32.5 | 58 | |
| The best value for simulation | 42.9 | 3.38 | 0.9 | 23.5 | 48 |
| Comparison | Elastic Modulus/GPa | Peak Stress/MPa | Peak Strain |
|---|---|---|---|
| Simulation | 33.43 | 43.85 | 0.002603 |
| Experiment | 33.32 | 43.35 | 0.002593 |
| Deviation percentage | 0.33% | 1.12% | 0.38% |
| Slope | 0–30% | 30–50% | 50–80% | 80–100% |
|---|---|---|---|---|
| Simulation | −0.03845 | −0.06839 | −0.27649 | −1.48015 |
| Experiment | 0.052 | −0.00707 | −0.21354 | −1.06024 |
| Fitting formula |
Publisher’s Note: MDPI stays neutral with regard to jurisdictional claims in published maps and institutional affiliations. |
© 2022 by the authors. Licensee MDPI, Basel, Switzerland. This article is an open access article distributed under the terms and conditions of the Creative Commons Attribution (CC BY) license (https://creativecommons.org/licenses/by/4.0/).
Share and Cite
He, Y.; Song, L.; Xue, K.; Liu, S.; Li, H.; Yang, W.; Huang, J. Ultrasonic Coda Wave Experiment and Simulation of Concrete Damage Process under Uniaxial Compression. Buildings 2022, 12, 514. https://doi.org/10.3390/buildings12050514
He Y, Song L, Xue K, Liu S, Li H, Yang W, Huang J. Ultrasonic Coda Wave Experiment and Simulation of Concrete Damage Process under Uniaxial Compression. Buildings. 2022; 12(5):514. https://doi.org/10.3390/buildings12050514
Chicago/Turabian StyleHe, Yameng, Lei Song, Keke Xue, Shukui Liu, Haipeng Li, Weihao Yang, and Jiahui Huang. 2022. "Ultrasonic Coda Wave Experiment and Simulation of Concrete Damage Process under Uniaxial Compression" Buildings 12, no. 5: 514. https://doi.org/10.3390/buildings12050514
APA StyleHe, Y., Song, L., Xue, K., Liu, S., Li, H., Yang, W., & Huang, J. (2022). Ultrasonic Coda Wave Experiment and Simulation of Concrete Damage Process under Uniaxial Compression. Buildings, 12(5), 514. https://doi.org/10.3390/buildings12050514