Article

Improving Life Cycle Sustainability and Profitability of Buildings through Optimization: A Case Study

1
Division of Civil Engineering and Built Environment, Department of Civil and Industrial Engineering, Uppsala University, 751 05 Uppsala, Sweden
2
Division of Industrialized and Sustainable Construction, Department of Civil, Environmental and Natural Resources Engineering, Luleå University of Technology, 971 87 Luleå, Sweden
*
Author to whom correspondence should be addressed.
Buildings 2022, 12(4), 497; https://doi.org/10.3390/buildings12040497
Submission received: 23 March 2022 / Revised: 6 April 2022 / Accepted: 14 April 2022 / Published: 16 April 2022
(This article belongs to the Section Architectural Design, Urban Science, and Real Estate)

Abstract

:
Building developers are continuously seeking solutions to increase saleable/rentable floor area and thus the profitability of investments, especially in large/dense cities where the real estate/rental values are high and shortage of available land results in smaller building footprints. Application of passive energy efficiency measures (e.g., thick insulation in walls) not only affects the life cycle sustainability of buildings, but also the floor area and its profitability. This can affect the decisions made on the choice of measures when aiming to improve sustainability. In line with limited studies in this context, a case study is presented here in which multi-objective optimization was used to explore the impact of various passive energy efficiency measures on the life cycle sustainability when accounting for the profitability of the floor area. The building case was a high-rise apartment based on a standardized building concept situated in different locations in Sweden, namely Vindeln, Gothenburg, and Stockholm. The findings indicated that, regardless of the location, use of (1) thick cellulose coating for the roof, and (2) moderately thick expanded polystyrene for the floor, were necessary to improve the life cycle sustainability. However, the optimal wall insulation was dependent on the location; in locations with high real estate values, the scope for using thick and conventional insulations (mineral wool/cellulose) was limited due to the significant economic loss caused by floor area reductions. In general, the optimization identified optimal solutions that could save up to 1410.7 GJ energy, 23 tonnes CO2e, and 248.4 TEUR cost from a life cycle perspective relative to the building’s initial design.

1. Background

Increasing the useful floor area of buildings is of significance for building developers as it can raise the profitability of the investments due to higher rental and real estate gains [1,2]. This can be even more important in large and dense cities where the real estate/rental values are high and shortage and preciousness of available land result in smaller building footprints [1,2]. Application of passive energy efficiency measures (i.e., well insulated building envelope, energy-efficient windows, minimized thermal bridges, and airtight constructions) for improving the sustainability performance of buildings in terms of environmental and economic perspectives can, however, indirectly affect the useful floor area of buildings and thus profitability of investments [3]. For instance, using thick insulation in the exterior walls of new buildings or retrofitting buildings by insulating exterior walls from inside (e.g., heritage buildings) will reduce the saleable/rentable floor area and result in economic losses. This is especially of importance as most of the buildings are currently built or retrofitted to fulfil current and future low energy requirements, necessitating use of passive energy efficiency measures [4,5]. Alam et al. [1] and Fantucci et al. [2] have recently highlighted this issue and compared the performance of the Vacuum Insulation Panels (VIP) with Expanded Polystyrene (EPS) insulation when retrofitting walls from the inside in the large cities with high rental values. They found that the higher thermal performance of VIP compared to the EPS insulation provided the possibility to adopt thinner insulation and thus save floor area, which eventually resulted in larger economic gains. Despite these two studies, which mainly compared the performance of VIP and EPS insulations, limited studies have explored how passive energy efficiency measures can affect the environmental and economic sustainability performance of buildings when accounting for the economic effects of the saleable/rentable floor area.

2. Literature Study and Research Objective

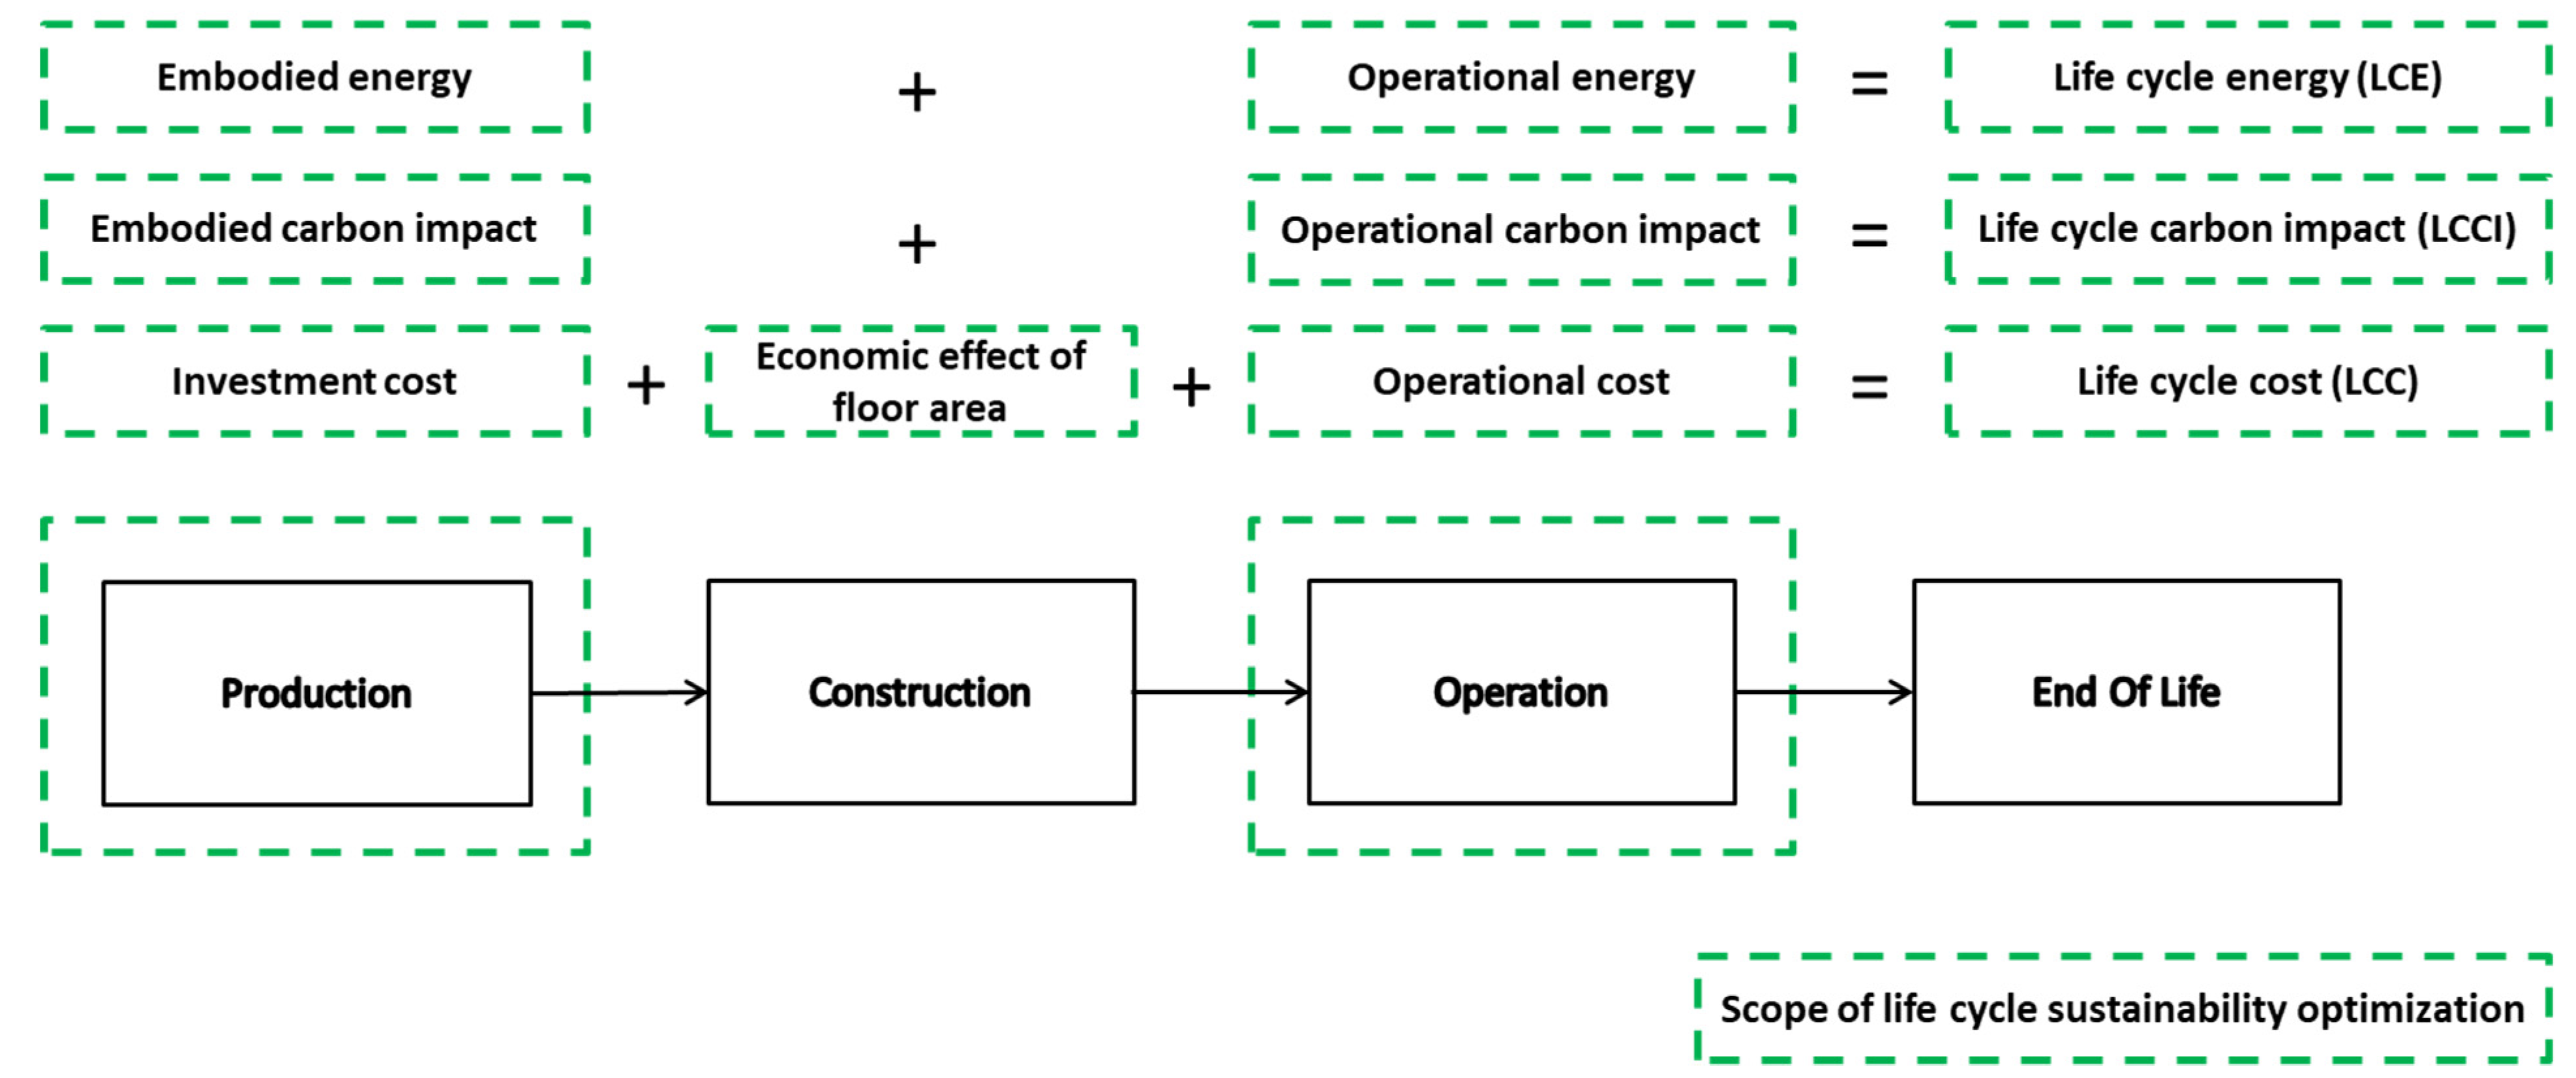
2.1. Life Cycle Sustainability

Buildings are responsible for a significant amount of final energy use and CO2 emissions in the European Union (EU) [5]. The EU energy performance of buildings directive [5] therefore plans to take action and achieve a highly energy-efficient and decarbonized building stock by 2050. This directive requires member states to set sustainable measures and strategies in order to ensure cost-efficient solutions for minimizing the energy use and carbon impact of new and existing buildings [5]. Passive energy efficiency measures are considered a promising approach to maximize building sustainability and ensure cost-effective solutions that minimize buildings’ operational energy use and related CO2 emissions [4,6]. Nevertheless, recent studies emphasize the significance of adopting a life cycle approach and considering the whole life cycle of a building when aiming to adopt measures in order to improve the sustainability performance of buildings [7,8]. This is because, although adopting passive energy efficiency measures reduces the energy use, carbon impact, and costs of a building’s operation, it may increase the investment costs (i.e., cost of material procurement) as well as the embodied energy and its related carbon impact (i.e., the energy use and carbon impact required for, and caused by, production of new materials and components) more than offsetting reductions obtained during the operational phase [9,10,11,12,13]. It is likewise important to account for the economic effects of saleable/rentable floor area as a by-product of adopting passive energy efficiency measures when aiming to improve the sustainability performance of buildings [1,2,3]. This is because the profitability of the investments is dependent on the saleable/rentable floor area, and therefore the decisions that building developers make on the choice of passive energy efficiency measures to improve a building’s sustainability performance [1,2,3]. However, considering the effects of such measures on both sustainability performance and useable floor area makes for a challenging task due to the complexity of the problem, inclusion of many parameters, several criteria (i.e., costs, energy use, and CO2 emissions) with inherent trade-offs, and a comprehensive system boundary (i.e., life cycle) [14].

2.2. Multi-Objective Optimization

Multi-objective optimization has been identified to be a useful approach for such complex problems as it (1) enables to successfully consider the inherent trade-offs between multiple criteria, (2) takes into account potentially important non-linear interactive effects of various parameters, and (3) is less time-consuming compared to the full trial-and-error parametric analyses (which are generally carried out by changing one parameter while the others are kept constant) [14,15,16,17]. Therefore, several studies have been conducted in recent decades to improve the sustainability performance of buildings in terms of environmental and/or economic perspectives by adopting a multi-objective optimization approach [18,19,20]. For instance, Wang et al. [21,22] developed a multi-objective optimization model to assist designers in the process of finding green building design solutions. Stamoulis et al. [23] used multi-objective optimization to find the optimal choice of insulation that improved the thermal comfort and cost performance in an industrial shed roof. Hamdy et al. [24] used multi-objective optimization to minimize CO2 emissions and investment cost for a two-story house along with its HVAC system. Shao et al. [25] used multi-objective optimization to minimize operational energy use and investment costs of passive energy efficiency measures for rural residences in northwest China. Antipova et al. [26] coupled multi-objective optimization with life cycle assessment to minimize the costs and environmental impacts of a building retrofit. Similarly, Carreras et al. [27] used a life cycle multi-objective optimization model to optimize the thermal insulation materials in terms of cost and environmental impacts. Ascione et al. [28] used a multi-objective optimization to find optimal design solutions of an office building in Milan with respect to the operational primary energy use, costs, and CO2 emissions. A multi-objective optimization approach was used by Mostavi et al. [29] to minimize a commercial building’s Life Cycle Cost (LCC) and emission while simultaneously maximizing the occupants’ thermal comfort. Wu et al. [30] used multi-objective optimization to identify design solutions that minimize LCC and operational energy use of buildings while maximizing the occupants’ comfort level. Amani and Kiaee [31] used a multi-objective optimization approach to rank thermal insulation materials that maximize energy saving and minimize the environmental impact. Sandberg et al. [32] developed a BIM-based master model to optimize the life cycle energy and cost of a multi-family residential building. They found that when the economic effect of floor space as a by-product of passive energy efficiency measures is excluded from the system boundary of life cycle analysis, thickening the roof and exterior wall insulation yields more than 12% savings in life cycle energy and cost. Finally, Sharif and Hammad [13] developed a two-criteria optimization approach to identify optimal renovation solutions for institutional buildings in terms of operational energy use, carbon impact, and life cycle cost.
Although these studies indicate the applicability of multi-objective optimization techniques in improving the sustainability performance of buildings, none of them accounted for the economic impact of saleable/rentable floor area as a by-product of adopting passive energy efficiency measures when optimizing various sustainability criteria. Only two recent studies have investigated the economic impact of floor area (as a by-product of retrofitting walls internally with VIP or EPS insulations) on the heating energy demand and discounted payback period of buildings [1,2]. However, these studies (1) do not adopt a life cycle approach and exclude the impact of other stages in a building’s life cycle (i.e., embodied energy and embodied carbon impact caused by production of materials), (2) only investigate and compare the performance of VIP and EPS insulations in retrofitting walls and do not account for a wide range of materials and passive energy efficiency measures, and (3) adopt mainly a trial-and-error parametric analysis to find optimal solution(s) instead of a multi-objective optimization approach which enables to account for the inherent trade-offs between multiple life cycle sustainability criteria (i.e., energy use, CO2 emissions, and costs) and also the non-linear interactive effects of various parameters (i.e., passive energy efficiency) [15,17].

2.3. Research Objective and Scope
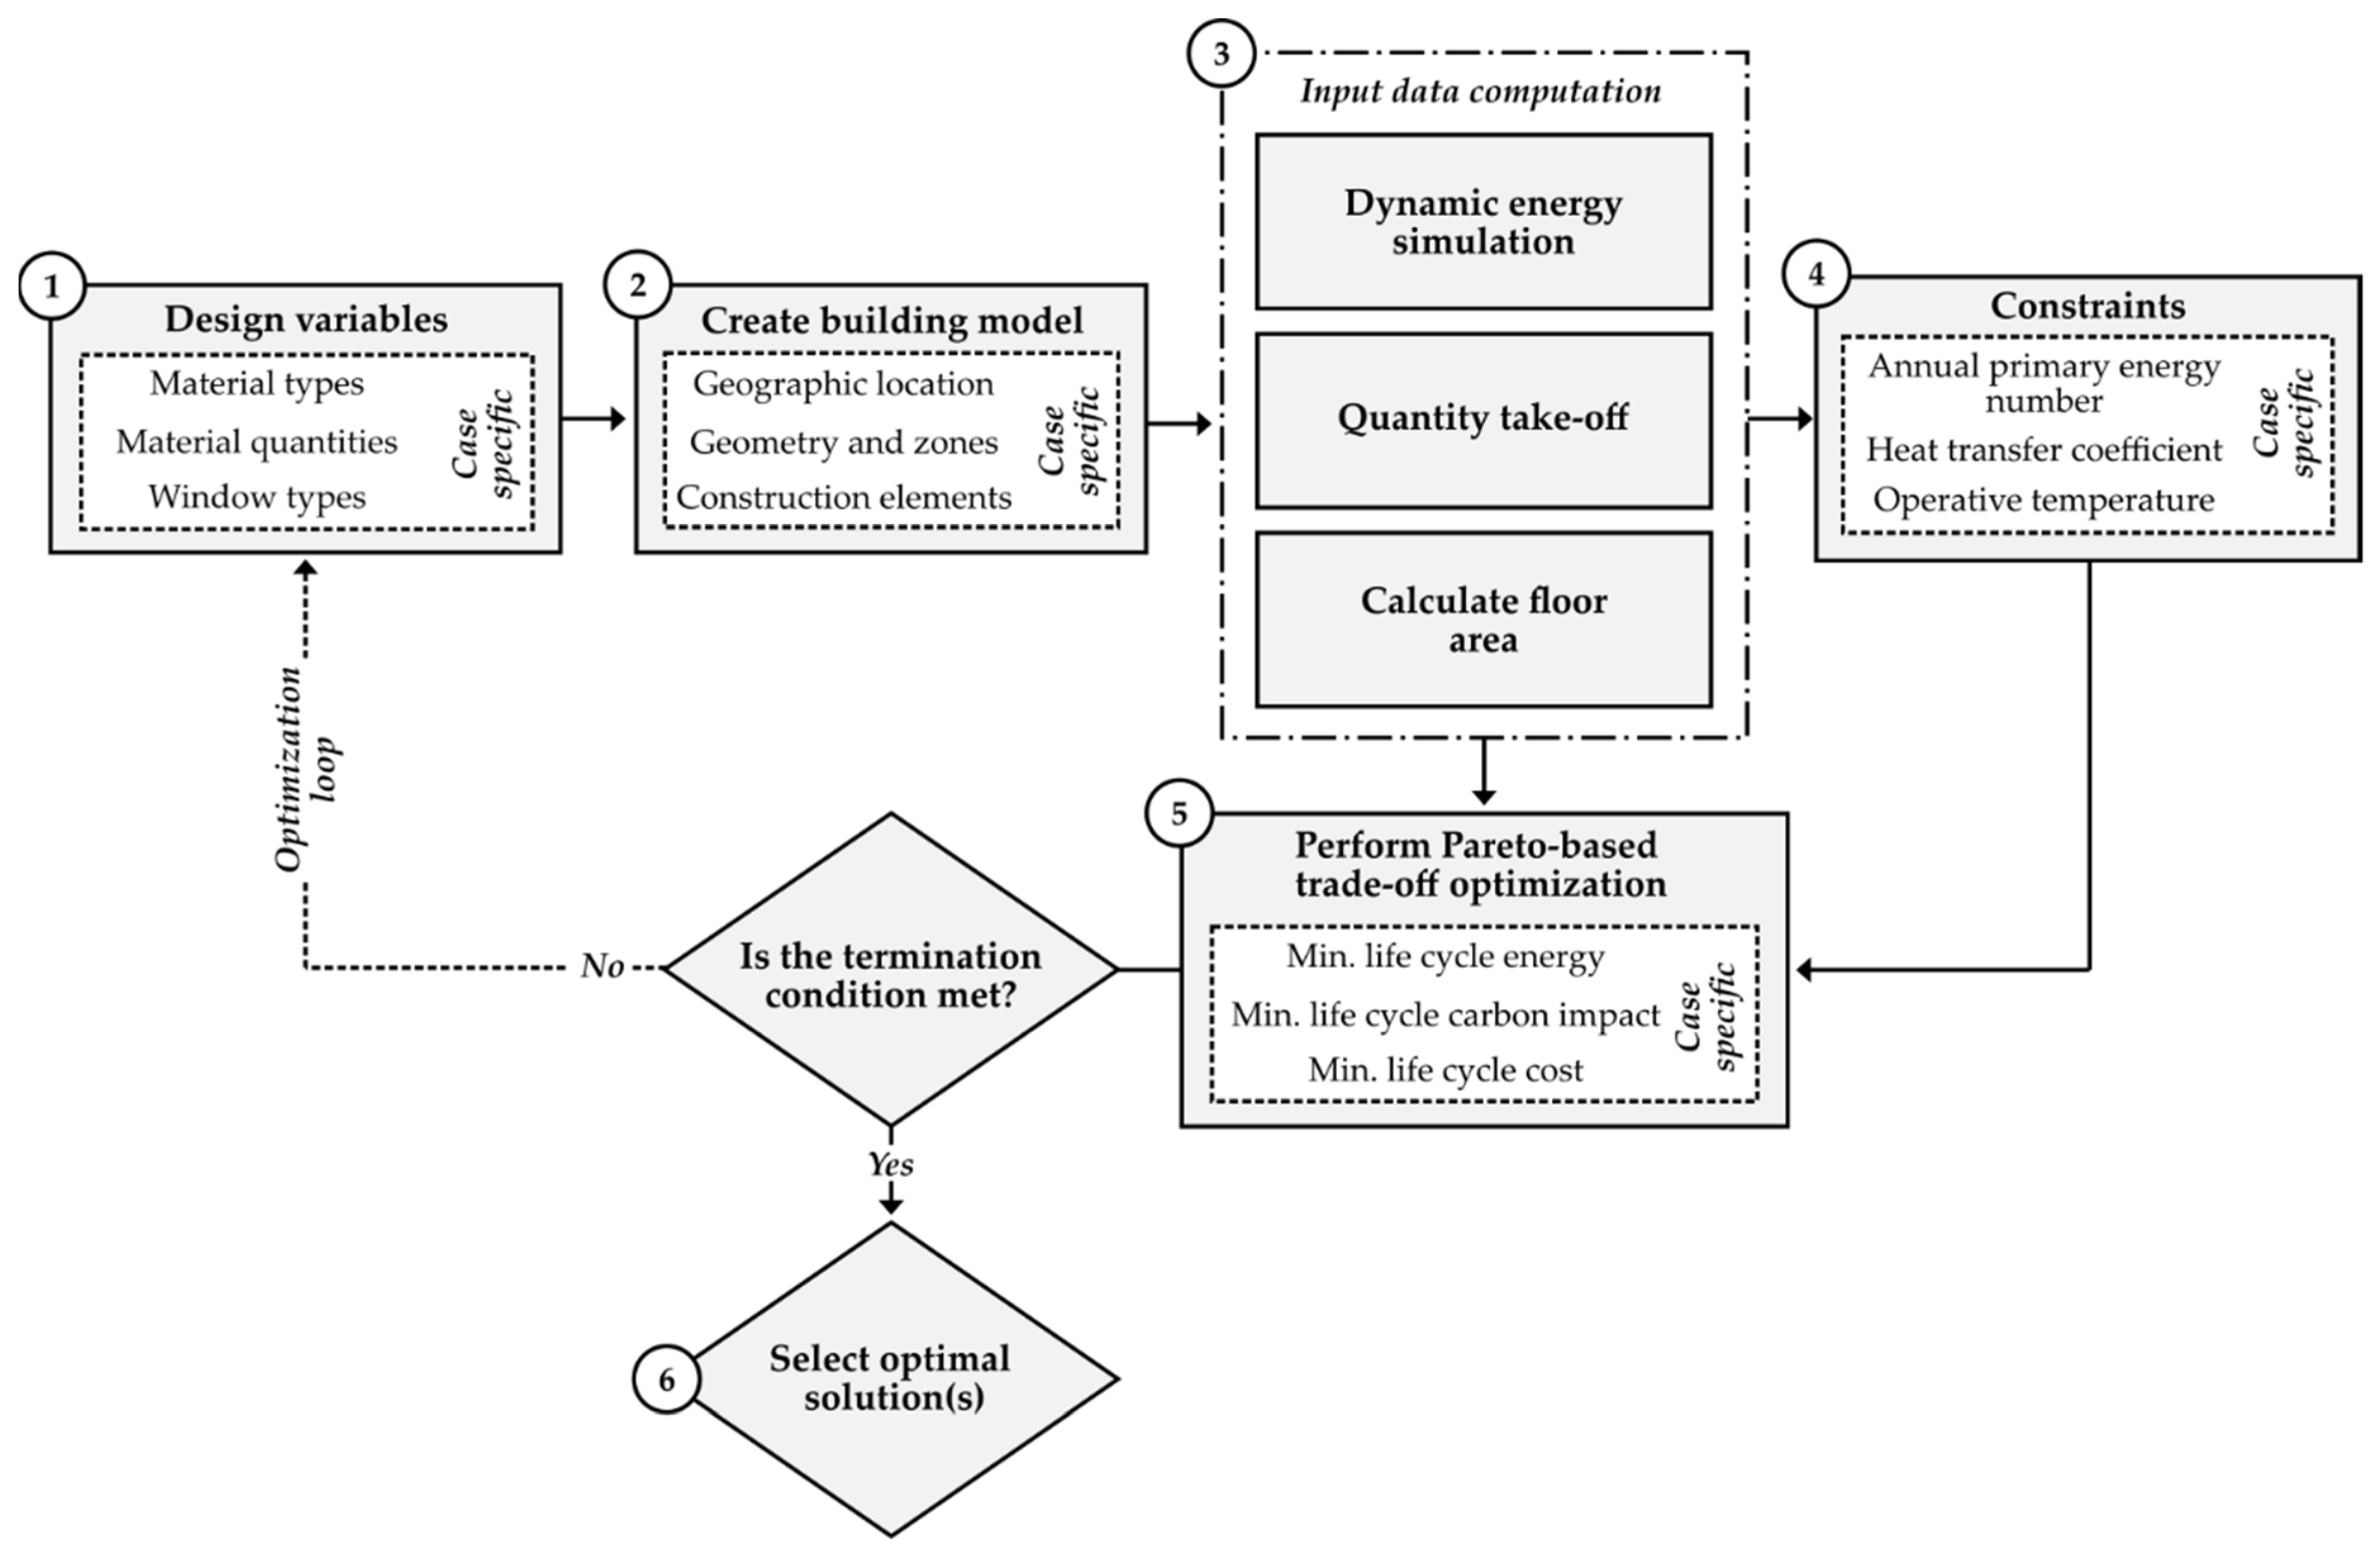
In line with the limited studies on the interaction between sustainability and profitability of buildings, there is a definite need to better understand how the application of passive energy efficiency measures can affect the life cycle sustainability performance of a building when the floor area and its profitability are accounted for in the system boundary. Due to the potential of multi-objective optimization to successfully consider the trade-offs between different sustainability criteria, a case study is presented in this article in which multi-objective optimization is used for exploring this topic. The case study represents a high-rise apartment based on a standardized and pre-engineered building concept which can be built identically in different locations in Sweden. Thereby, due to the variation in climate conditions, real estate values, as well as emissions and prices of energy supply sources in various locations, the life cycle sustainability of this building concept is optimized and compared in three different locations in Sweden, namely Vindeln, Gothenburg, and Stockholm. The scope of life cycle sustainability optimization in this case study is illustrated in Figure 1.
As shown in Figure 1, the sustainability optimization in this study focuses on energy use, carbon impact, and costs from a life cycle perspective. In terms of energy use and carbon impact, the study includes (1) the embodied primary energy use and CO2 emissions caused by off-site production of materials and components from raw material acquisition, as well as (2) the primary energy use and CO2 emissions caused by heating, hot water use, and operational electricity during the building operational phase. In order to make the results of optimization comparable, the life cycle cost analysis in this study has a similar scope as the Life Cycle Energy (LCE) and Life Cycle Carbon Impact (LCCI), which is the sum of the present value of (1) the investment cost for materials and components procurement, (2) the operational costs associated with the energy use over the building’s life, as well as (3) the profitability of saleable/rentable floor area, which can be affected as a by-product of using passive energy efficiency measures. The main reason for only including the embodied energy and embodied carbon impact of the production phase in this study is because the previous studies indicate that, when the operational phase is excluded from the system boundary, the production phase can account for up to 75% of the total life cycle energy use and carbon impact [33,34,35]. Further, the building’s lifespan is assumed to be 50 years in this study, based on the previous studies carried out in the context of LCE and LCCI analyses [33].

3. Method

3.1. Multi-Objective Optimization

The multi-objective optimization was performed by combining an optimization algorithm with different computations (e.g., energy simulation), and finding optimal solutions using a multi-objective optimization method. This set-up enabled the search for optimal solutions based on a set of design variables, objectives (e.g., various sustainability criteria), and constraints. For the optimization algorithm, a stochastic population-based genetic algorithm was used. These algorithms have been described in previous research as being robust when used for large-scale problems, and especially with respect to discontinuities that may occur if discrete variables are used or from the output of energy simulation engines [20,36,37]. Pareto optimization [38] was used as the multi-objective optimization method, which identifies optimal solutions by searching a set of feasible trade-off solutions. Pareto optimization was used instead of, for example, scalarization, where weight factors are used in the construction of objective functions, as estimating these weight factors have inherent difficulties [20]. Lastly, Pareto optimization also has the benefit of exposing the optimization problem and the optimal solutions to a more in-depth analysis, where the optimal solutions can be further analysed to gain knowledge [39]. The process that was used to carry out the multi-objective optimization is outlined in Figure 2.
This section describes the six steps (see Figure 2) involved in the multi-objective optimization. Additionally, note that some of the steps contain aspects related to the case study building. Implementation of the multi-objective optimization was primarily achieved using the programming language Python, with support from the optimization package Pymoo [40]. Additionally, the visual programming extension Grasshopper [41], together with the 3D computer-aided design software Rhinoceros [42], was used to carry out the initial set up.

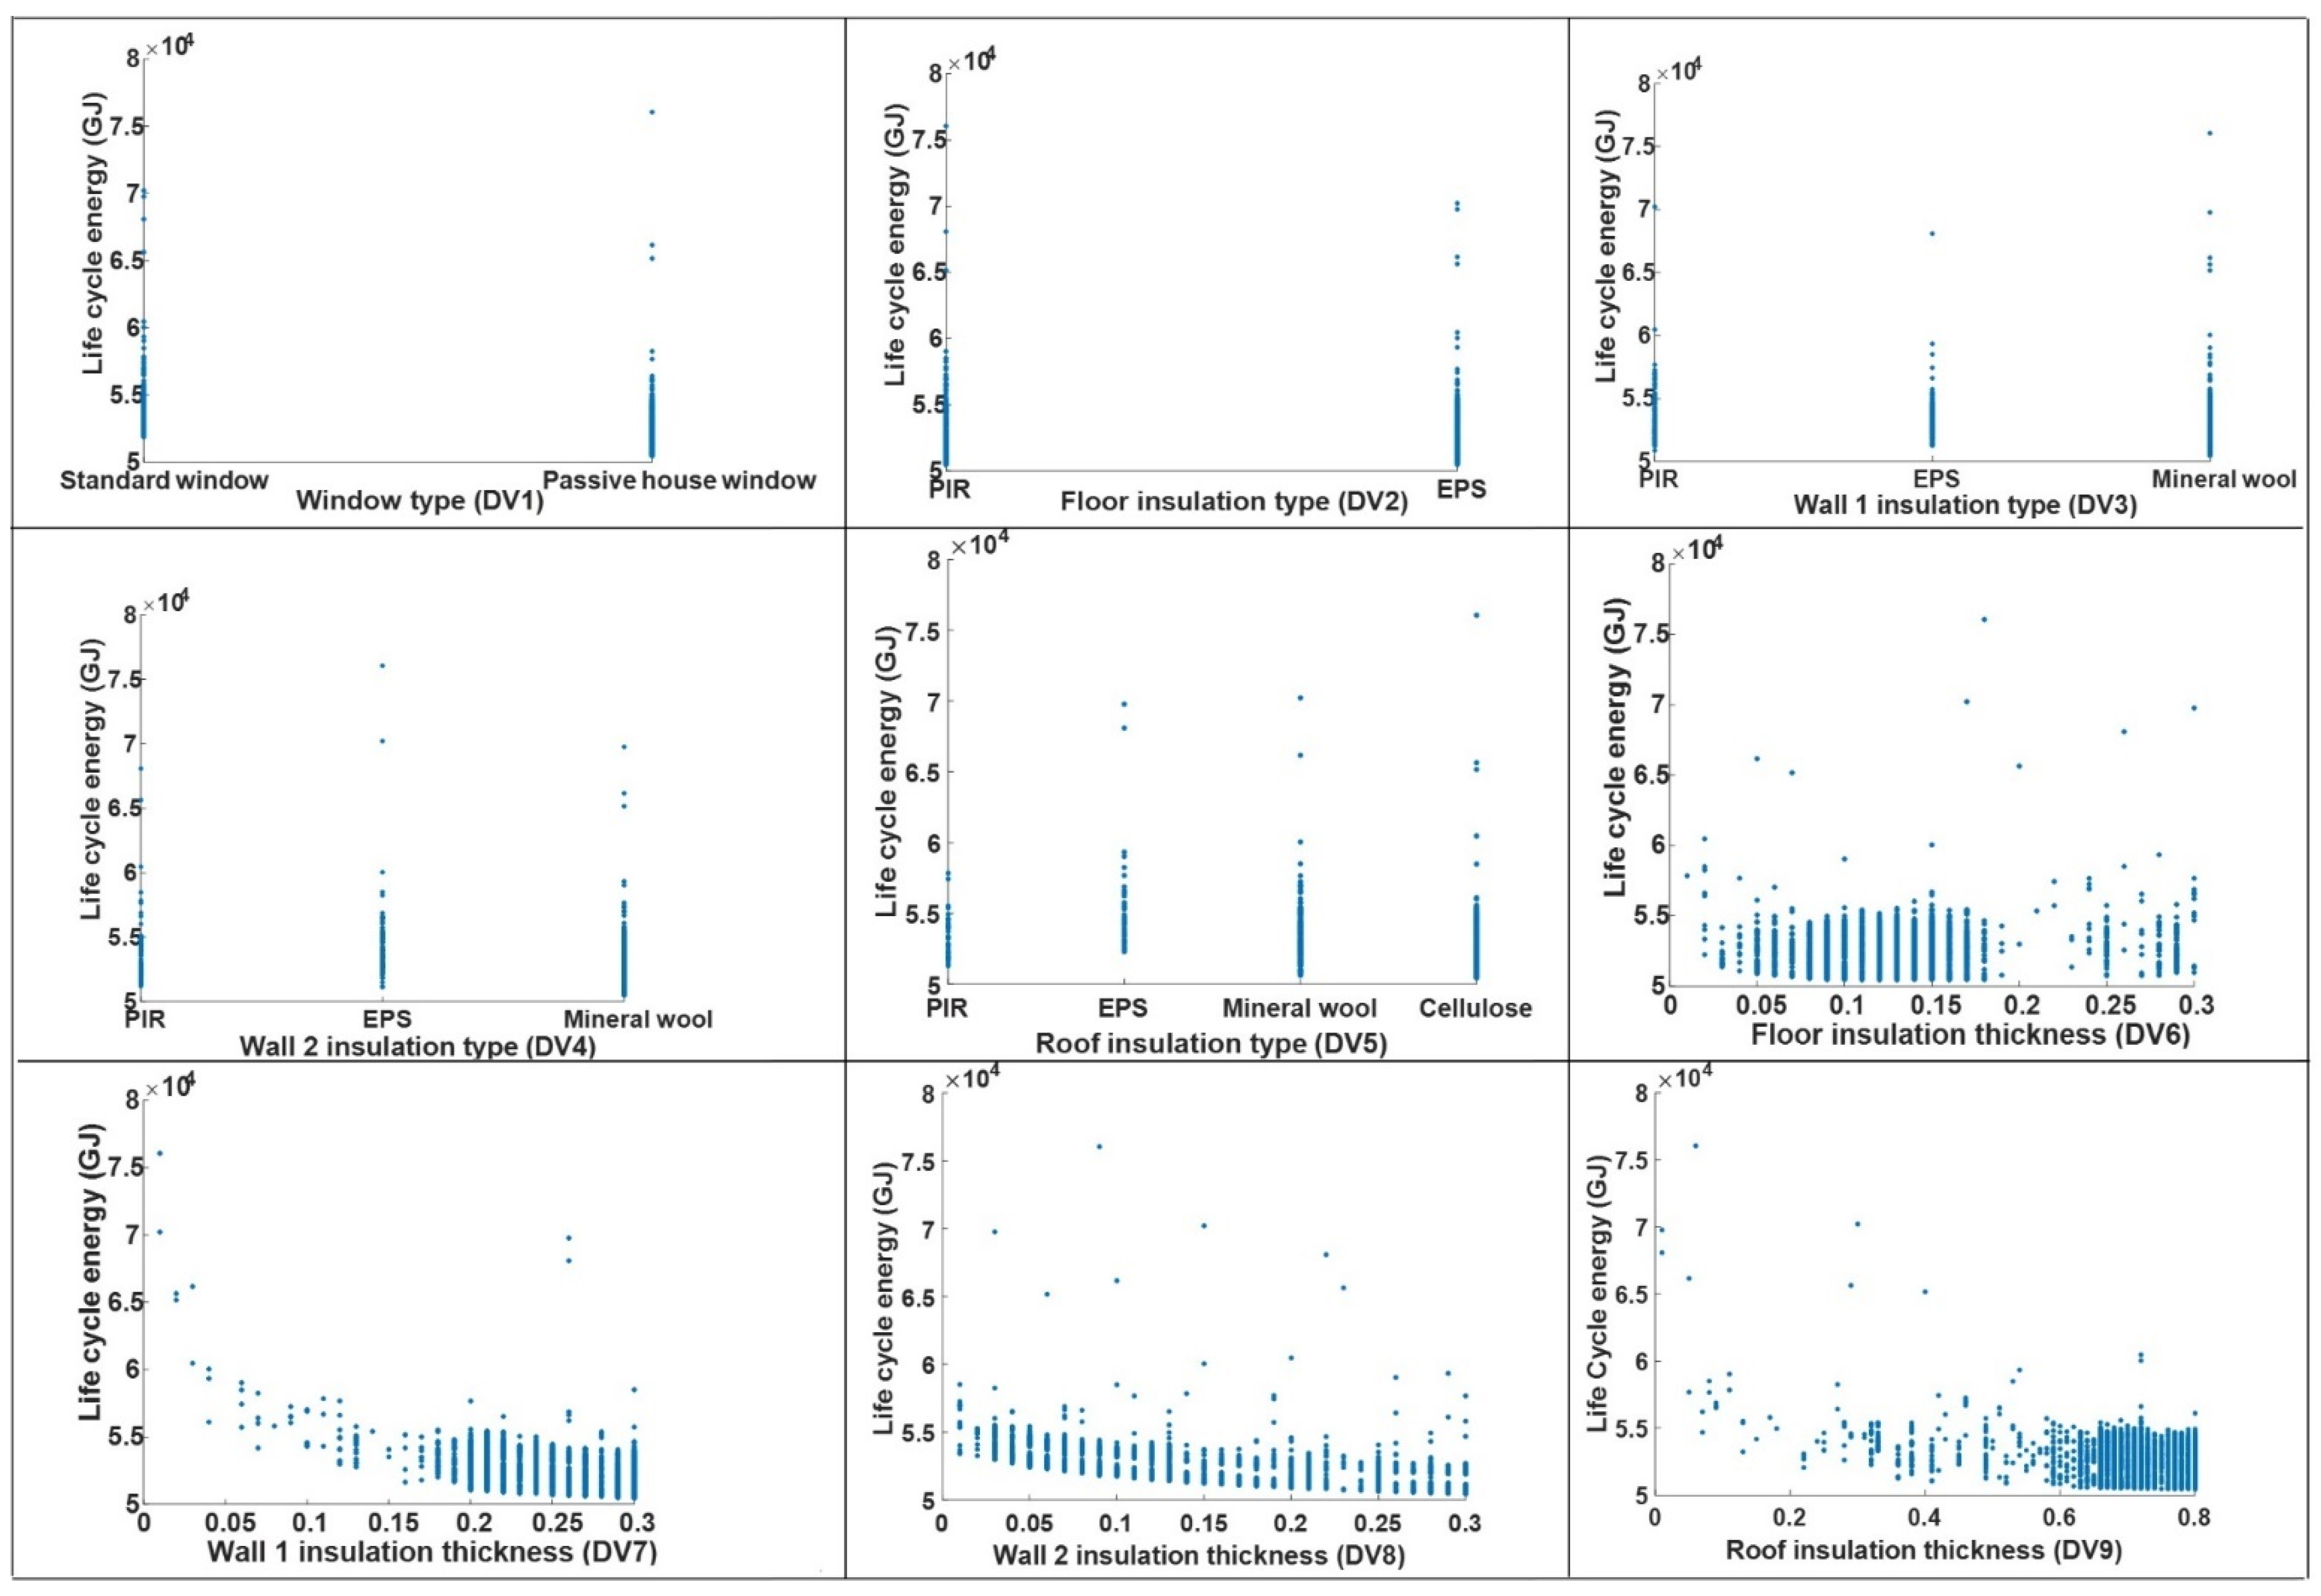
3.1.1. Design Variables

To carry out the multi-objective optimization, a set of design variables was defined. These describe the boundaries of the passive energy efficiency measures within which a solution can exist. These are what the optimization algorithm interacts with when searching for optimal solution(s). The case specific design variables related to the passive energy efficiency measures are described briefly below, and in more detail in Section 3.2, where the case study building is detailed.
  • Material types were used to find the optimal insulation materials in the building’s envelope (e.g., type of insulation in the slab) and were defined in discrete form.
  • Material quantities were used to find the optimal quantities of insulation materials in the building’s envelope (e.g., thickness of insulation in the slab) and were defined in continuous form.
  • Window types were used to find the optimal type of windows and were defined in discrete form.

3.1.2. Create Building Model

A representation of the building to be used for the multi-objective optimization needed to be set up in the form of a model. This model included the building’s geographic location, geometry, zones, and its construction elements. Through interaction between the model and the design variables, different new design solutions related to the passive energy efficiency measures could be created and analysed. For the case study, the model was defined and created using a combination of the Python programming language and the Input Data Format (IDF) of EnergyPlus, an energy simulation engine. A baseline for the IDF file was created using Honeybee [43], a plug-in for Grasshopper that enables the creation of models compatible with EnergyPlus for carrying out dynamic energy simulation of buildings. This baseline IDF file contained the geometry of the building with all relevant construction elements and zones, as well as a configuration of the HVAC system in the building. A Python script was then used to modify this baseline IDF file, using the design variables to create solutions specified by the optimization algorithm.

3.1.3. Input Data Computation

To derive the relevant input data for both the evaluation of constraints (step 4) and calculation of the objective functions (i.e., various sustainability criteria in step 5), a series of computations was required. For each iteration of the optimization loop, these computations were carried out for each solution. In total, three computations were set up as follows:
  • Dynamic energy simulation was set up using EnergyPlus to simulate the annual energy performance and the operative temperature in different zones.
  • Quantity take-off was set up using a Python script that calculated the quantities of each construction element using their surface area and constituent material quantities (i.e., thicknesses).
  • Floor area calculation was set up using a Python script where the building’s floor area could be calculated based on changes in the thicknesses of the exterior walls and insulations. This was achieved by offsetting the edges of a polygon representing the outline of the building according to the changes in exterior wall thicknesses, followed by calculating the enclosed area of the polygon.

3.1.4. Constraints

A set of constraints was used to ensure that the optimization could find solutions of the passive energy efficiency measures that fulfil relevant requirements imposed on the building. As the case study presented in this paper was located in Sweden, a set of case-specific constraints was based on requirements and calculation methods specified in the Swedish building codes [44]. These constraints were as follows:
  • Annual primary energy number was used to ensure that the solutions satisfy the building’s maximum allowed annual primary energy number (85 kWh/m2 heated floor area for multi-family residential buildings). Note that this value is different from the operational energy use and is calculated based on the guidelines of the Swedish building code.
  • Heat transfer coefficient was used to ensure that the solutions satisfy the maximum allowed overall heat transfer coefficient (Um = 0.4 W/m2K).
  • Operative temperature was used to ensure that the solutions obtain at least the minimum occupied zone operative temperature (18 °C).

3.1.5. Perform Trade-Off Optimization

In this step, a multi-objective optimization algorithm was used to execute iterations to search for optimal solutions of design variables (i.e., passive energy efficiency measures) that fulfilled the defined constraints and optimized the trade-off between the conflicting objectives (i.e., sustainability criteria) when the profitability of floor area was accounted for. The iterations of the optimization algorithm were executed until the termination criteria (e.g., number of generations) were met. The optimization algorithm was implemented in the Python programming language using the Pymoo package [40]. The Pymoo package offers a host of different algorithms to choose from, however, for this study the non-dominated sorting genetic algorithm (NSGA-II) [45] was chosen as it is commonly used for trade-off problems with respect to building design [46]. In addition, previous studies have generally indicated that genetic algorithms, such as NSGA-II, are robust at large-scale problems and concerning discontinuities that may occur due to the use of discrete variables [19,20,37].
The multi-objective optimization problem was defined as follows:
M i n { f 1 ( x ˜ ) ,   f 2 ( x ˜ ) ,   f 3 ( x ˜ ) } ,   x ˜ = [ x 1 , x 2 , ,   x n ]
where f 1 is the first objective function (life cycle energy), f 2 is the second objective function (life cycle carbon impact), f 3 is the third objective function (life cycle cost) need to be minimized, and x ˜ is a combination of design variables related to the passive energy efficiency measures x 1 , x 2 , x n where n is the number of design variables.
The first and second objective functions, f 1 and f 2 , were estimated using the following equations:
f 1 ( x ˜ )   o r   f 2 ( x ˜ ) = E + O
where
E = e = 1 j E e A e
E e = m = 1 u E m ρ m t m
O = ( s = 1 y E d , s f s ) l
Equation (2) shows that the first and second objective functions are the sum of the embodied ( E ) and operational ( O ) energy (MJ) or carbon impact (kgCO2e).
The embodied ( E ) energy (MJ) or carbon impact (kgCO2e) were estimated using Equation (3), where E e is either the embodied energy (MJ/m2) or embodied carbon impact (kgCO2e/m2) of construction element e (where e ranges from zero to the total number of construction elements, j ), and A e (m2) is the enclosing area of construction element e . Generally, E e represents the embodied energy (MJ) or embodied carbon impact (kgCO2e) for 1 m2 of construction element e and can be calculated using Equation (4), where E m is either the embodied energy (MJ/kg) or embodied carbon impact (kgCO2e/kg) of material m (where m ranges from zero to the total number of materials used in each construction element, u ), ρ m (kg/m3) is the density of material m , and t m (m) is the thickness of material m in each construction element. The embodied energy and embodied carbon impact data for different materials were mainly gathered from the Bath Inventory of Carbon and Energy (ICE) [47] except for some components, such as windows and window-doors, where the data were gathered from EPD databases [48,49]. The Bath ICE is used in this study as (1) it is an open access database that only includes data for building materials, unlike other databases that include data for materials from many other sectors, and (2) there is lack of a national embodied energy and carbon impact database for building materials in Sweden.
The operational (O) energy (MJ) or carbon impact (kgCO2e) were estimated using Equation (5), where E d , s (MJ) is the annual energy use for energy supply source s (where s ranges from zero to the total number of relevant energy supply sources, y ). The annual energy use for each energy supply source was given by the output of EnergyPlus, obtained from the input data computations in step 3. f s is either the primary energy factor or carbon impact factor for energy supply source s , which were obtained from [44,50,51], and l (yr) is the lifespan of the building.
Payback time, Net Present Value (NPV), and Internal Rate of Return (IRR) are the most common methods used for estimating economic impact of investments from a life cycle perspective [29,52,53,54,55,56]. Payback time estimates the required time to recover the cost of an investment [56]. On the other hand, NPV determines the present value of all future cash flows, including the investment costs [29,54,55,56]. Finally, IRR shows the discount (or interest) rate when the NPV is equal to zero, at the end of the assessed time interval [52,53]. The main differences between NPV and IRR are that the NPV method accounts for the discount rate and supports the results in the form of a currency value, while IRR results are in the form of a percentage where the higher the IRR, the more satisfactory the project becomes [52,56]. Some studies have identified NPV as a robust method for decision making and estimating the impact of various energy efficiency measures on a building’s life cycle cost [29,54,55,56]. The main reason for that is because the NPV method provides the results in the form of a currency value which can make it easier for investors to understand and compare the long-term impact of different measures, whereas some other studies [52,53] have identified IRR as a better choice as it does not deal with uncertainties in the discount (or interest) rates [57,58,59]. In this study, NPV has been selected for estimating the LCC of the building case mainly due to its potential to present the results in the form of a currency value, which could increase the possibility to compare and understand feasible solutions obtained from the optimization output. The following equations show how the third objective function, f 3 or LCC (EUR), was estimated in this study.
f 3 ( x ˜ ) = I C + O C F C
where
I C = e = 1 j I C e A e
I C e = m = 1 u I C m t m
O C = ( s = 1 y E d , s P r s ) d e  
d e = ( 1 ( 1 + r e ) l ) / r e  
r e = ( r e ) / ( 1 + e )  
F C = R e A
or
F C = R n A d r n
d r n = ( 1 ( 1 + r i ) l ) / r i  
r i = ( r i ) / ( 1 + i )  
Equation (6) shows that the third objective function (life cycle cost (EUR)) is the sum of the present value of the investment cost ( I C ), and operational cost ( O C ), subtracted by the profitability of saleable/rentable floor area ( F C ).
The investment cost ( I C ) was estimated using Equation (7) where I C e (EUR/m2) is the investment cost of construction element e (where e ranges from zero to the total number of construction elements, j ), and A e (m2) is the enclosing area of construction element e . I C m (EUR/m3) in Equation (8) is the investment cost of material m (where m ranges from zero to the total number of materials in each construction element, u ), and t m (m) is the thickness of material m in each construction element.
The operational cost (OC) was estimated using Equation (9), where E d , s (MJ) is the annual energy use for energy supply source s (where s ranges from zero to the total number of relevant energy supply sources, y ). The annual energy use for each energy supply source was given by the output of EnergyPlus which was obtained from the input data computations in step 3. P r s (EUR/MJ) is the energy price for energy supply source s , and d e is the discount factor which considers the real interest rate and the escalation rate of energy price. The discount rate ( d e ) was estimated using Equation (10) where r e is the real interest rate which also includes the effect of the escalation rate of energy price and l (yr) is the lifespan of the building. Using Equation (11), r e was estimated where r is the real interest rate and e is the escalation rate of energy price.
The profitability of the floor area (FC) could be estimated using Equation (12) or Equation (13), where the former equation estimates the profitability from selling the facility and the latter estimates profitability from renting the facility. The R e (EUR/m2) in Equation (12) is the average real estate value per m2 in different cities and A (m2) is the total floor area. The R n (EUR/m2) in Equation (13) is the average rental value per m2 in different cities,   A (m2) is the total floor area, and d r n is the discount factor accounting for the real interest rate and the rental increase rate. The discount rate ( d r n ) could be estimated using Equation (14), where r i is the real interest rate which also includes the effect of the rental increase rate and l (yr) is the lifespan of the building. Using Equation (15), r i could be estimated where r is the real interest rate and i is the rental increase rate.

3.1.6. Select Optimal Solution(s)

The process of optimization (step 5) provided results in the form of a set of trade-off Pareto solutions where each solution in the set could potentially be considered as the optimal one. As such, a posteriori decision making is necessary, where the Pareto solutions characteristics are considered in order to select an optimal solution based on criteria related to the design problem.

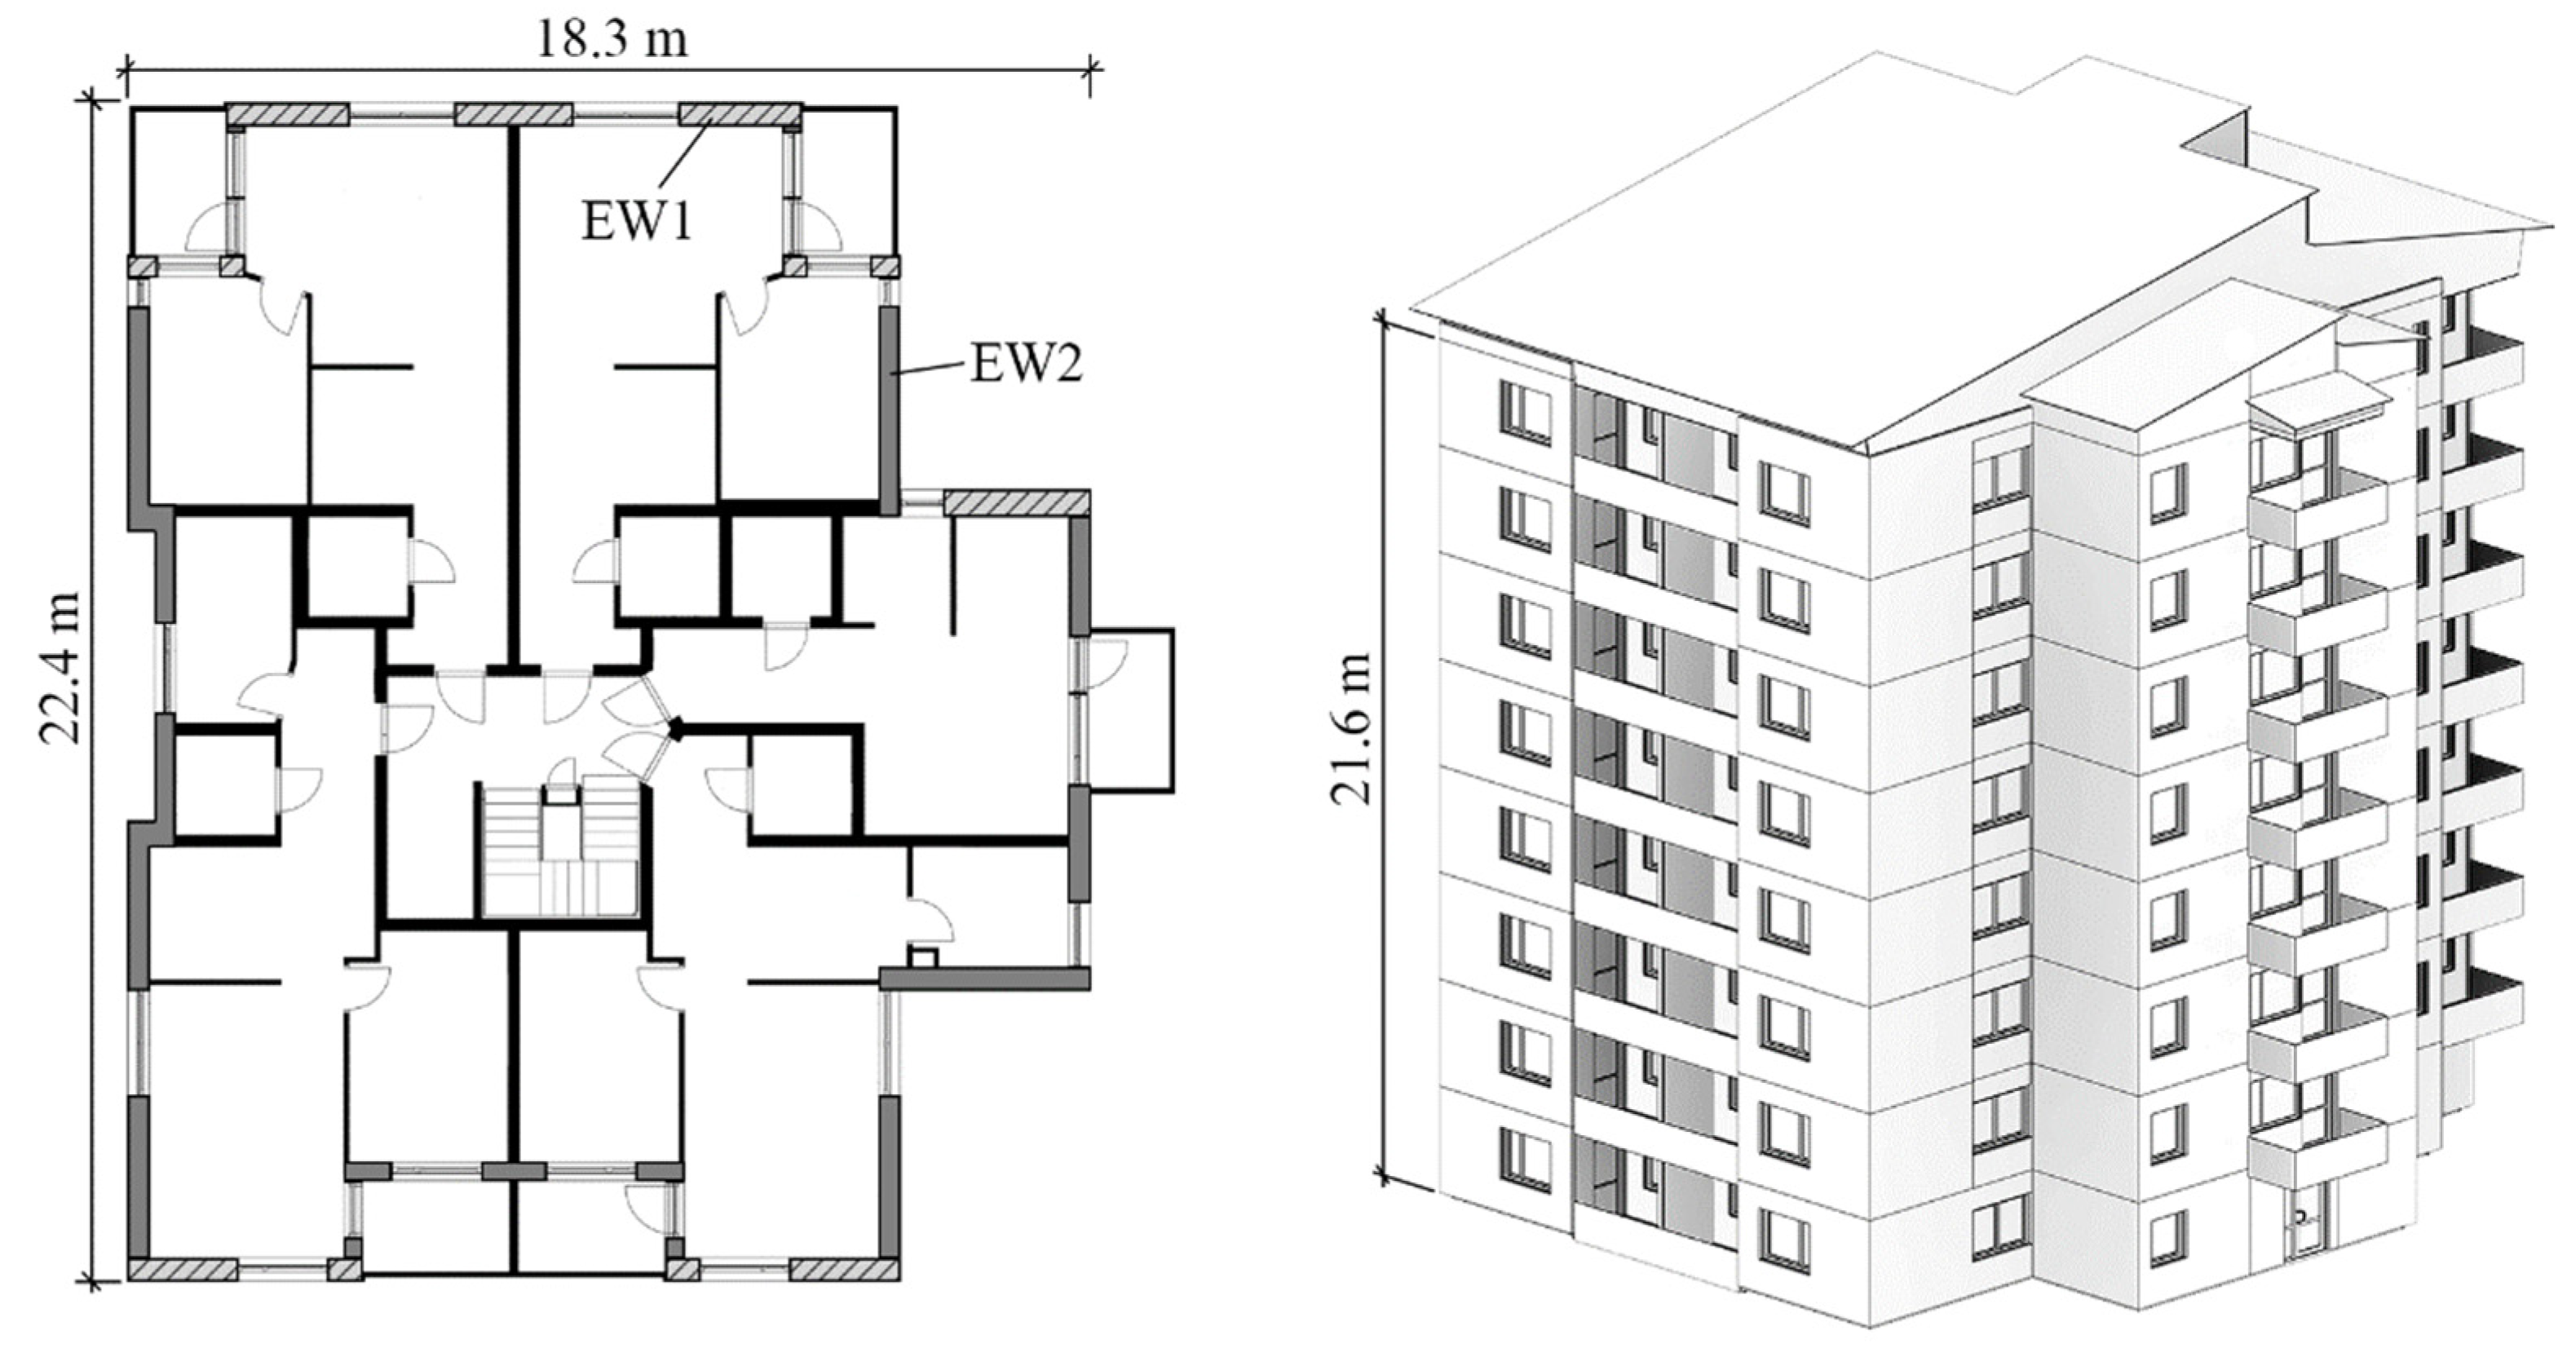
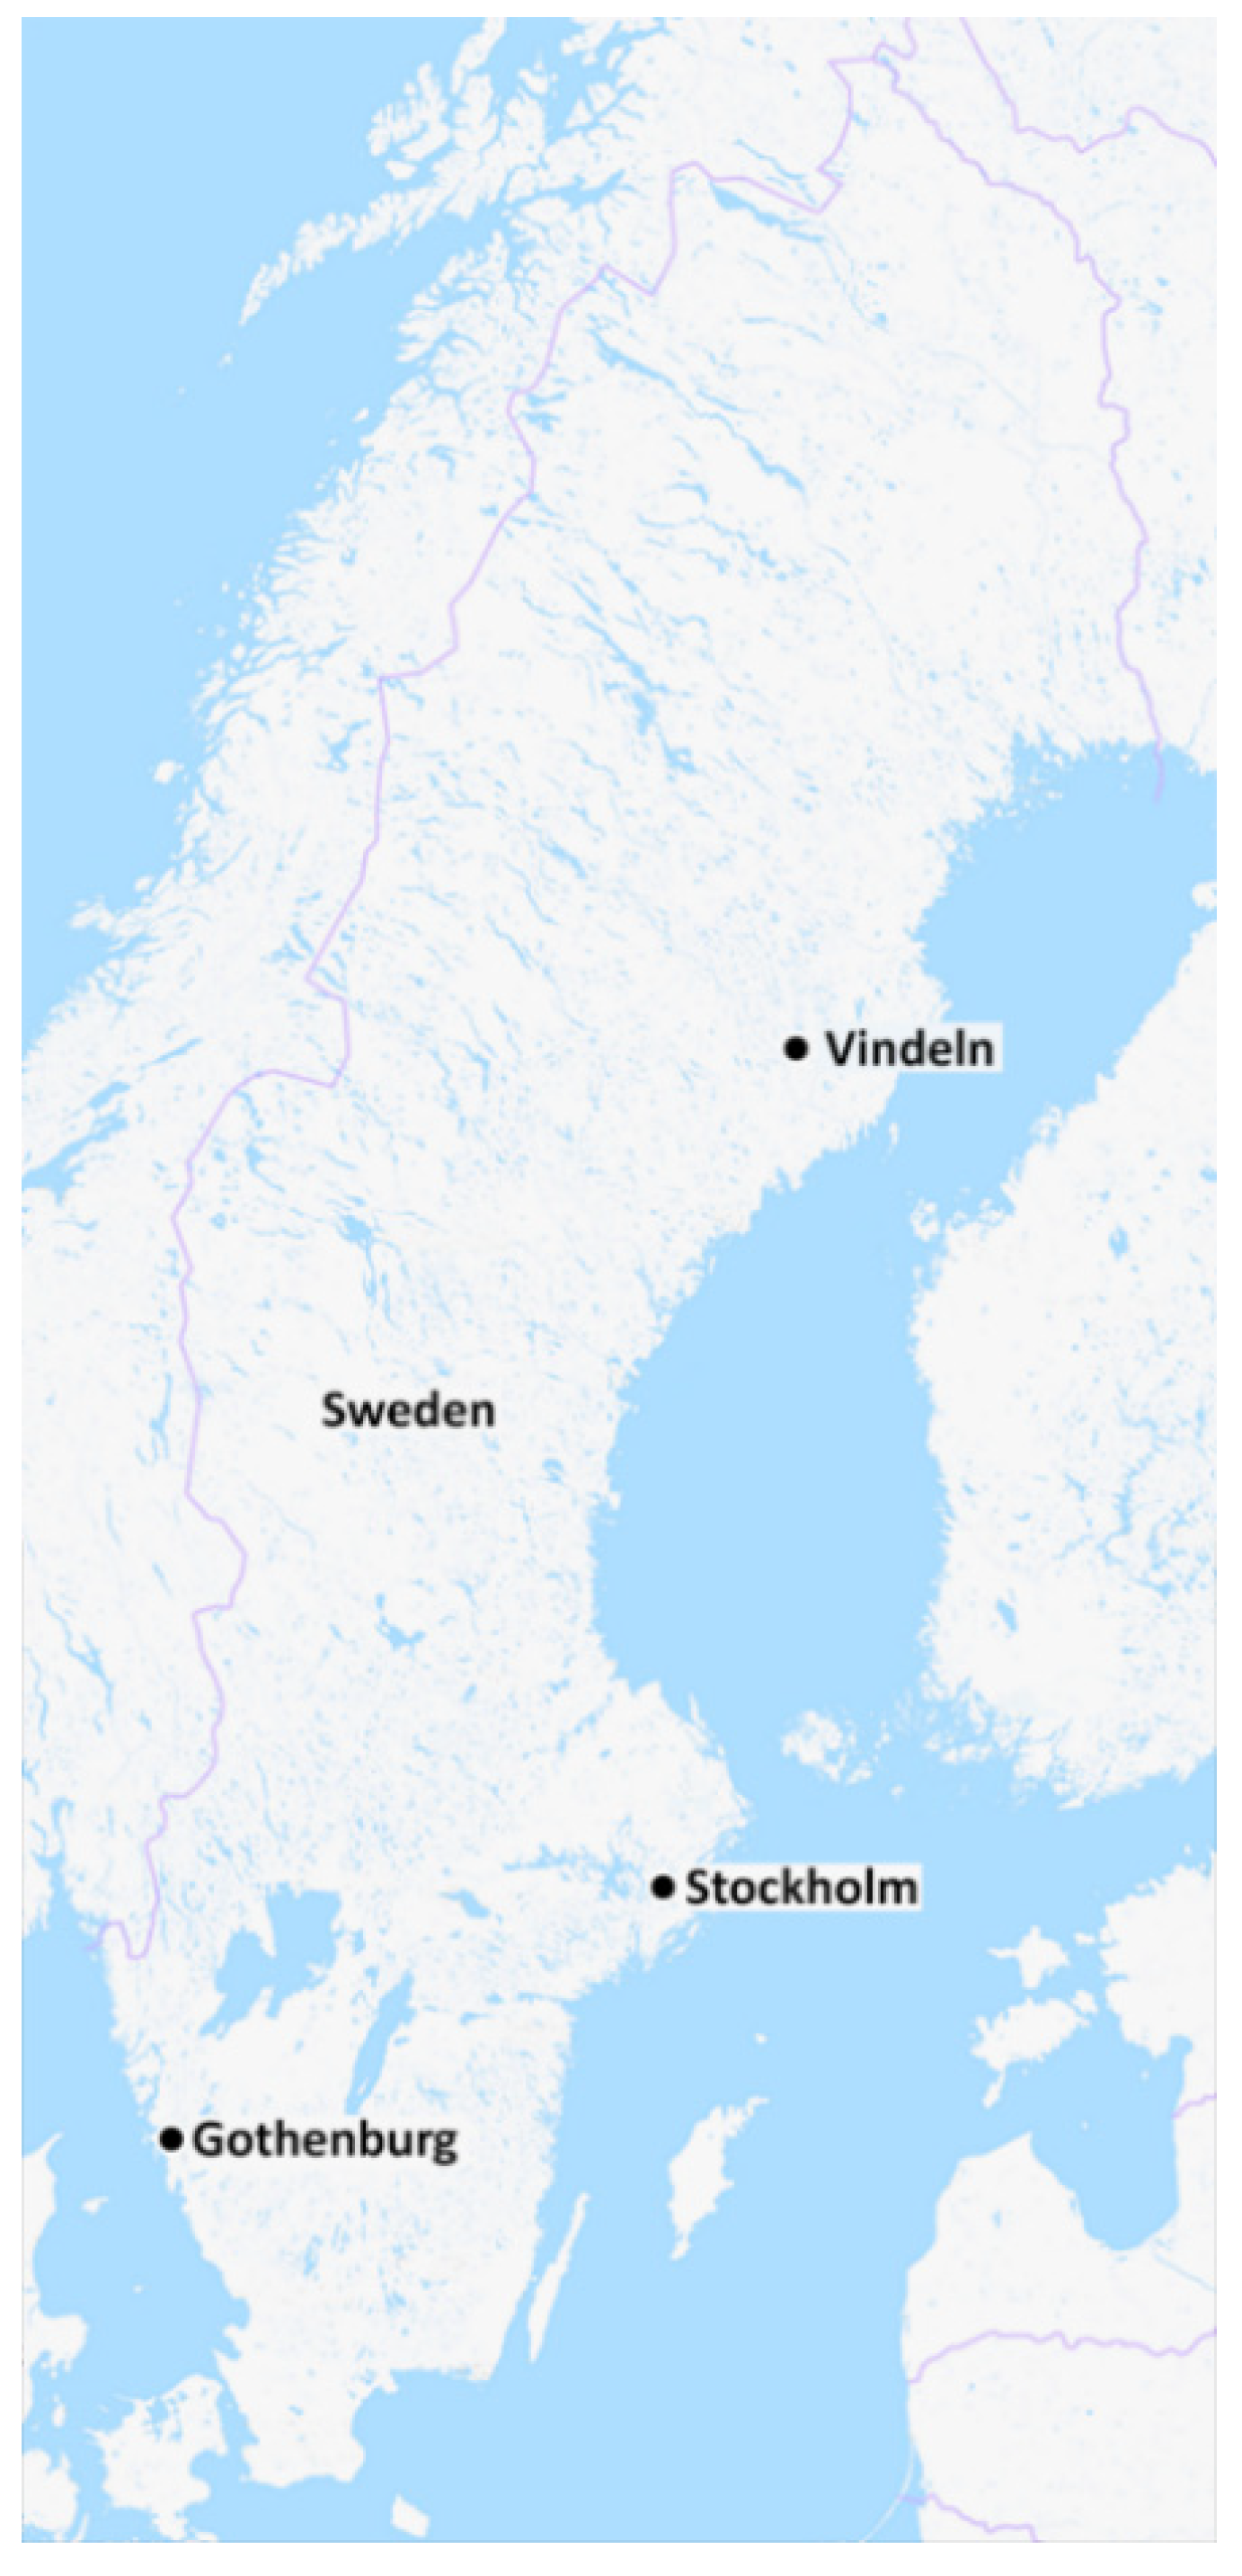
3.2. Description of the Case Study Building

The building studied in this case study is an apartment based on a standardized building concept that is developed for the possibility of being built in different locations in Sweden. This standardized concept has a high level of pre-engineering with a short design process because the architectural and other technical designs have been largely prepared and developed through iterative approaches. Hence, the short design process and pre-prepared design solutions contribute to cost-effectiveness in this standardized building concept compared with conventional building design approaches. Although the annual energy use and investment costs of this building concept have been improved through standardization and iterative approaches, its selection for this study may have great potential for new design solutions to further improve their sustainability performances from a life cycle perspective. The building concept has eight stories (21.6 m height which is considered a high-rise apartment based on [60]) where each story has 2.4 m internal height. The high-rise building consists of 39 apartments, a total heated floor area of 2478 m2, and 340 m2 glazing area (almost 14% of the heated floor area). The heating system in each apartment comprises hydronic radiators which are connected to the city’s district heating grid through heat distribution units. The building is also equipped with an air-to-air heat exchange ventilation system (with 80% efficiency) which recovers and transfers the heat in the exhaust air to the supply air. Figure 3 shows a plan view and 3D view of the high-rise apartment building concept.
This high-rise apartment building is located in Vindeln, a small city situated almost 680 km north of Stockholm, Sweden. Vindeln has a subarctic climate, characterized by dark and cold winter days ranging from −3 °C to −14 °C, and an annual mean outdoor temperature of 3.4 °C. As this standard building concept could be built in other locations with the same design, the building was modelled and optimized as if it was situated in two other cities, namely Stockholm and Gothenburg (see Figure 4). This enabled the exploration and understanding of how the life cycle sustainability performance of this building concept could be affected due to the variation in climate conditions, real estate values (where the building is sold after construction), energy supply prices, etc., in other locations. The possibility of this building concept to be built in different locations with the same design made it a representative case for the purpose of this study and therefore was selected and explored herein.
The as-built and pre-prepared design of the high-rise apartment building in Vindeln was used as a starting point.
In terms of passive energy efficiency measures, the case study mainly focused on the impact of various types and thicknesses of insulation materials used in the building envelope, as well as different types of windows. Hence, the impact of measures that minimize air leakage and thermal bridges in the building envelope are not accounted for in this study, mainly because the building case was new-build and constructed based on recent knowledge with limited air leakage and thermal bridges. In addition, the impact of active energy efficiency measures is excluded because, although such measures can affect the life cycle sustainability performance of a building, their impact on the profitability of floor area is limited. In total, nine design variables related to these passive energy efficiency measures were investigated using the optimization, with eight of them related to the type and thickness of insulation materials used in the construction elements and one related to the type of windows. Table 1, Table 2, Table 3 and Table 4 show the construction elements of the building and the variables related to the passive energy efficiency measures which were included in the optimization in this case study. As shown in Table 2, Table 3 and Table 4, out of nine variables, five were defined in discrete form (i.e., type of windows and insulation materials used in the construction elements) and four were defined to be continuous (i.e., thickness of insulation materials). The insulation materials considered in this study included both conventional ones, e.g., cellulose, mineral wool, and expanded polystyrene (EPS), as well as high-performance polyisocyanurate (PIR). As shown in Table 2, high-performance PIR insulation has a higher embodied impact and investment cost compared to conventional insulation (e.g., cellulose, mineral wool, and EPS). However, to minimize the operational impact and its related costs, use of conventional insulation materials requires a thick building envelope which may not be feasible due to the limited space and architectural appearance. A high-performance insulation material is included in this study as it offers lower thermal conductivity (see Table 2) and thus a thinner building envelope, which may result in economic gains due to the increased saleable floor area. Cellulose (index number 6, see Table 2) is only considered as an applicable insulation material for the roof as its use is not common in concrete-based exterior floor and walls in Sweden. Further, the maximum insulation thicknesses that are presented in Table 4 are defined from practical consideration of appearance and space.
Table 5 shows the parameters that were used for optimizing the sustainability performance of the building case in different locations. These parameters were either initial design parameters provided by the construction company or parameters that were assumed based on the current Swedish building codes and guidelines [44,61].

3.3. Genetic Algorithm Parameters

To perform the optimization, a computer fitted with a 3.4 GHz Intel® Xeon® CPU, 64 GB RAM, and Windows 7 as the operating system was used. Using this setup, approximately 25 s was needed for each simulation. The optimization was also run using parallelization, where up to 12 individual solutions were evaluated simultaneously to reduce the overall time. To increase the reliability of the findings, the GA parameters were set up with maximum generations = 100, population size = 50, mutation probability = 1/n (where n is the number of design variables), crowding degree = 20, and crossover probability = 0.9. These values were based on a previous study by Ascione et al. [28], where they suggested using a population size 2–6 times the number of design variables and 10–100 generations. For each location, the parallelized optimization process took approximately 6 h to reach completion on the specified computer.

4. Results

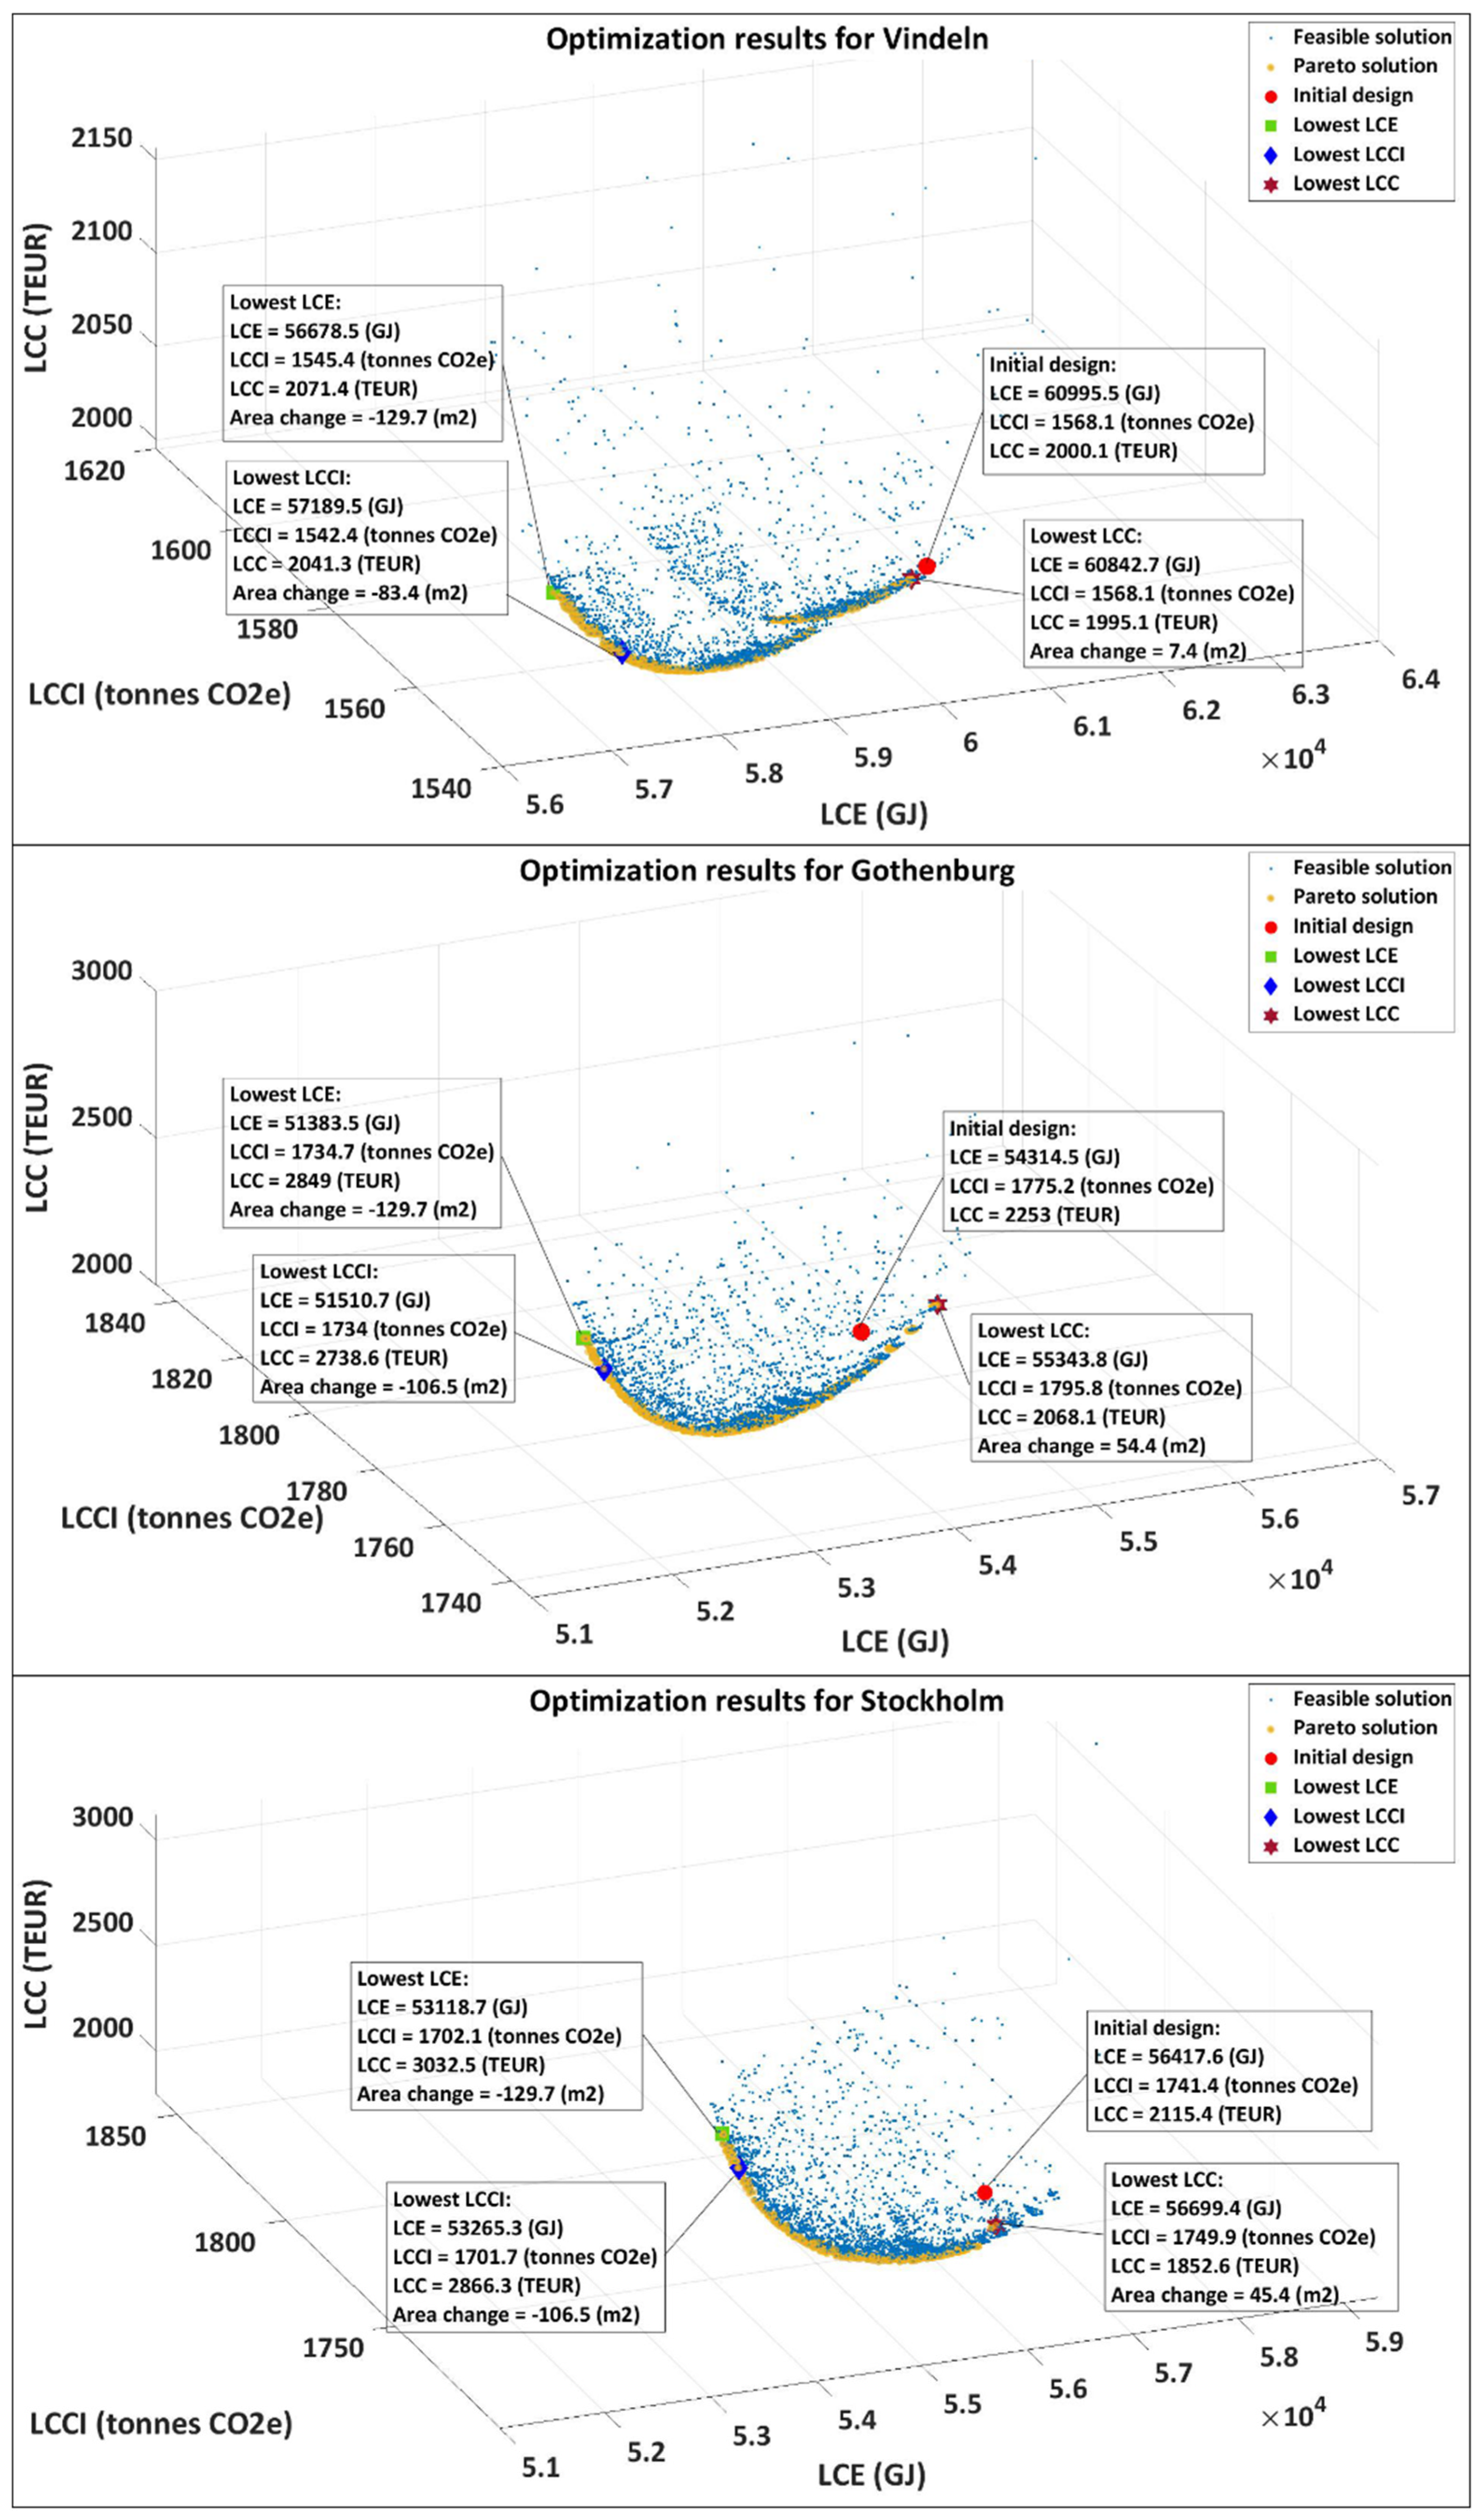
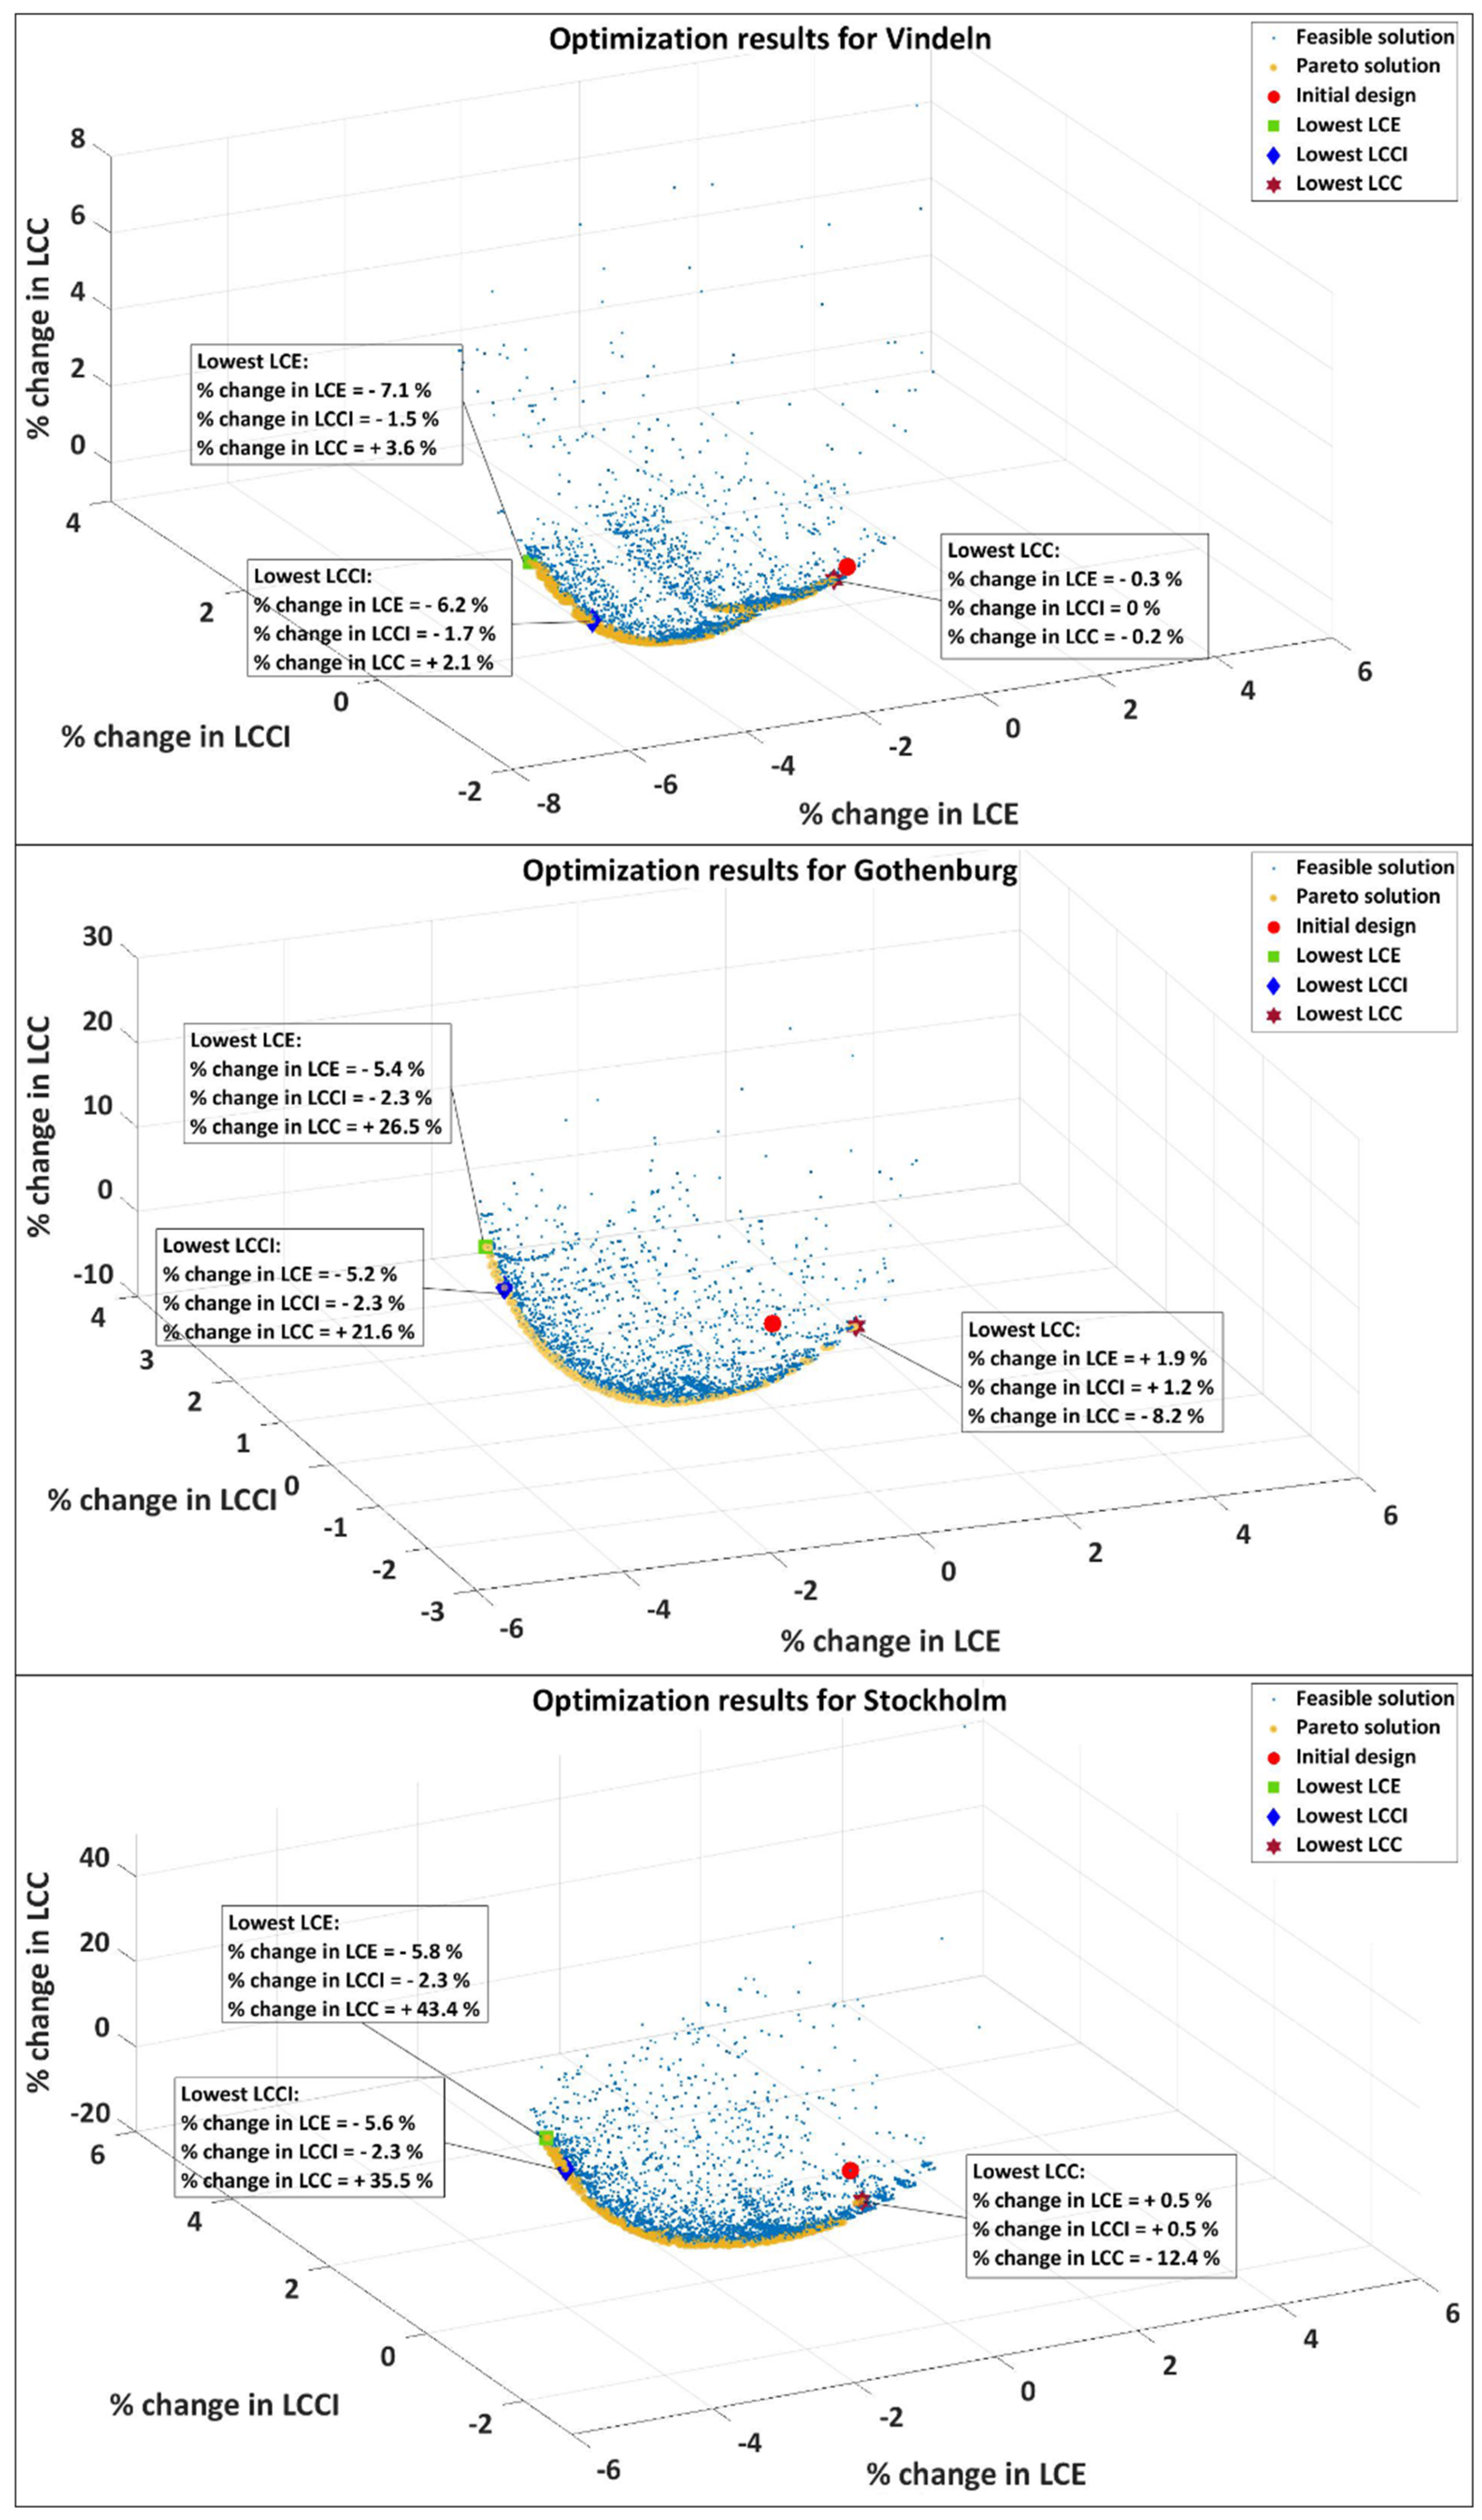
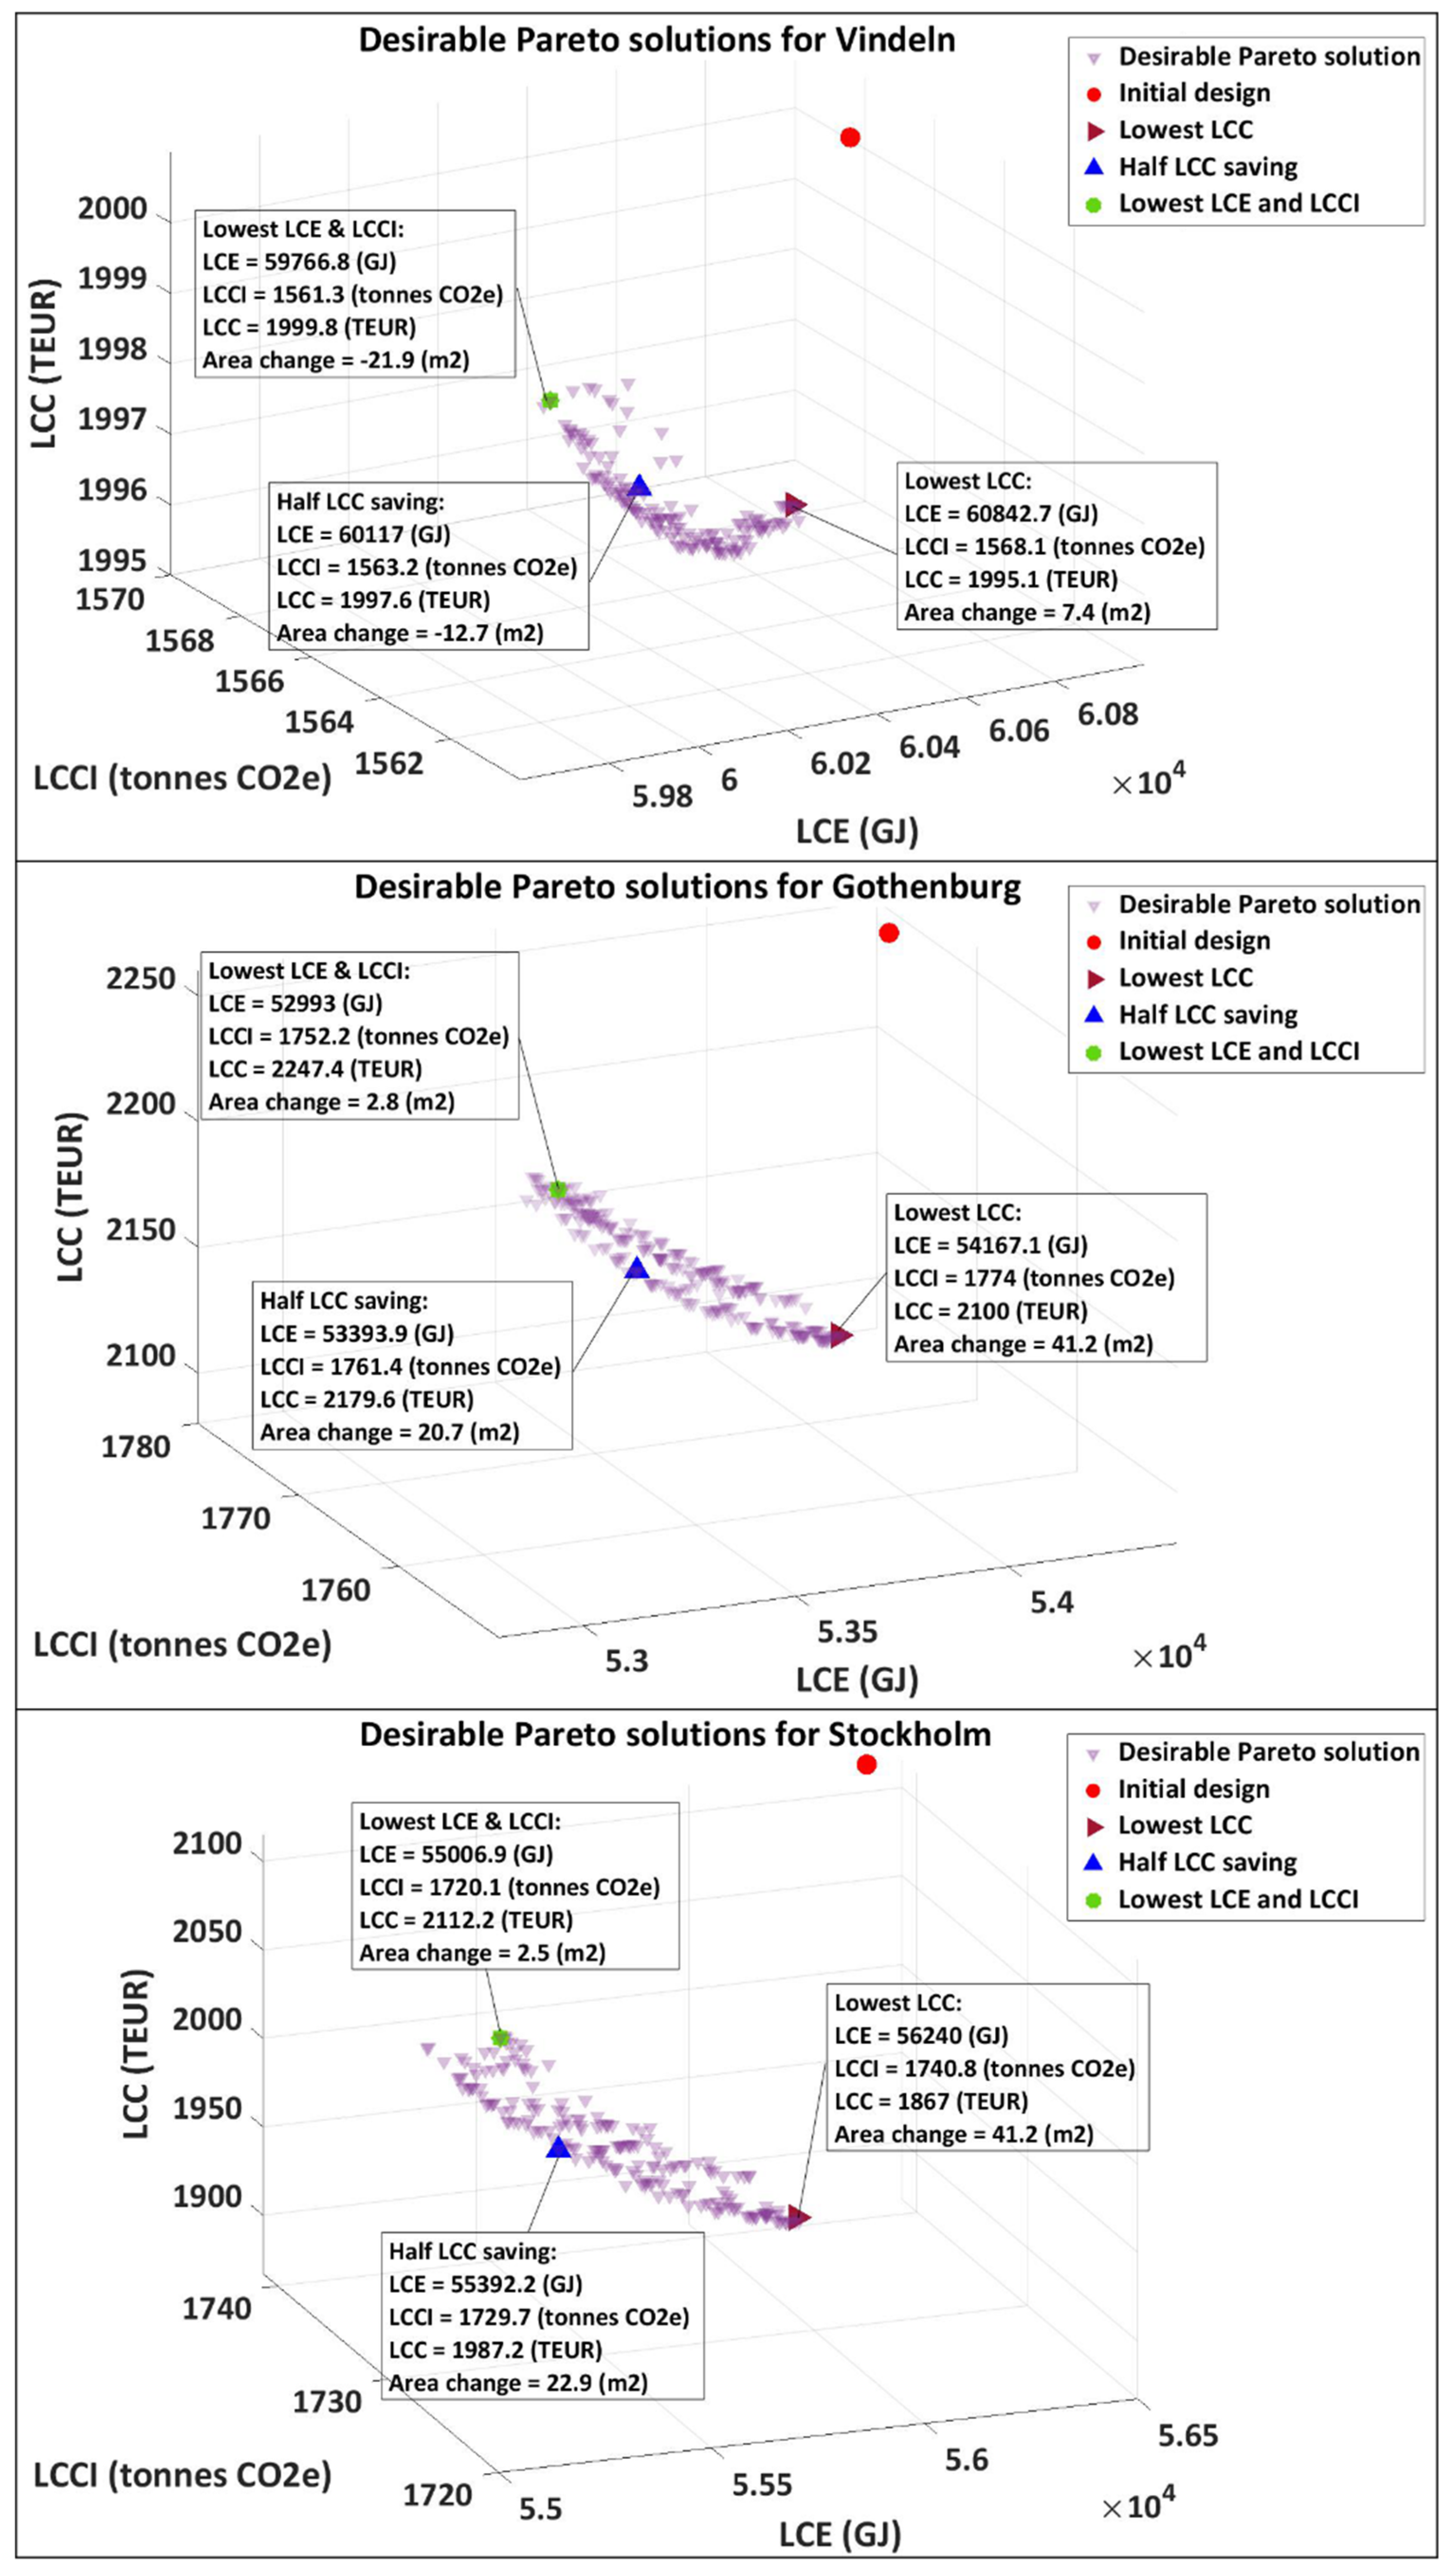
4.1. Results and Analysis

The scope of life cycle sustainability optimization was described earlier in Section 2.3. It should be noted that the embodied energy, embodied carbon impact, and investment cost associated with the production and procurement of mechanical systems (i.e., plumbing, heating, and air-conditioning systems) are excluded in the sustainability analysis and optimization of the building example presented here. The main reasons for excluding the impact of mechanical systems were lack of appropriate embodied data for such systems as well as the focus of the case study, which was mainly on finding optimal solution(s) for passive energy efficiency measures rather than active energy systems. Furthermore, when evaluating energy use, carbon impact, and cost of building operation for the case study, the household electricity usage was excluded as it is mainly dependent on occupant behaviour as well as household devices. Additionally, apart from investment and operational costs, the LCC results presented further below only indicate the economic losses/gains associated with the changes in floor area for each new solution relative to the initial design’s total floor area. This is mainly due to the dominance of the building’s total real estate value (where the building is sold after construction) in the LCC result, especially in locations with high real estate values, which would make it potentially difficult to show changes in the LCC value for each new solution.
Figure 5 and Figure 6 show all the feasible solutions obtained from the multi-objective optimization approach for the high-rise apartment buildings located in Vindeln, Stockholm, and Gothenburg. The feasible solutions in Figure 5 and Figure 6 show the set of design solutions that fulfil Swedish building codes and standards, where each solution represents a unique combination of design variables and passive energy efficiency measures listed in Table 3 and Table 4. Figure 5 shows the result of energy use, carbon impact, and cost for each feasible solution from a life cycle perspective, and Figure 6 shows the percentage change in energy, carbon impact, and cost values of the feasible solutions relative to the initial design of the building concept (as specified in Table 1). Thus, minus signs in Figure 6 indicate the percentage reductions or savings in energy use, carbon impact, and costs, while plus signs indicate percentage increases in energy use, carbon impact, and costs relative to the initial design of the building concept in different locations. Furthermore, the initial design (or red circle point) in Figure 5 shows the sustainability performance of the building concept starting with initial materials, thicknesses, and components from a life cycle perspective. In Figure 6, only percentage changes in energy, carbon impact, and cost values are shown, so the graphs have zero points on each axis which represent the initial design in different locations.
Pareto solutions indicate a set of non-dominated solutions where there are no other feasible solutions that can improve one objective without worsening another. Each Pareto solution shown in Figure 5 and Figure 6 has the potential to be chosen as the optimal one, depending on what the purpose of study is. For instance, the green square, blue diamond, and dark red hexagram points in Figure 5 and Figure 6 indicate Pareto solutions that extensively minimize each individual sustainability criteria in isolation (i.e., life cycle energy use, carbon impact, or cost, respectively) in different locations in Sweden. These points indicate the significant trade-off between different sustainability criteria, as considerable reductions in LCE or LCCI in isolation can significantly increase the LCC. This is especially obvious when one compares the Pareto solutions providing lowest LCE (the green square) or LCCI (the blue diamond) in Gothenburg and Stockholm in Figure 5 and Figure 6, as significant reductions in LCE or LCCI in isolation can increase the LCC between 21.6% and 43.4%, relative to the initial design cost values. This increase in LCC is more than four times and nine times larger than the savings obtained in LCE and LCCI, respectively. The results thus indicate that the increase in LCC is generally significant in the locations where the real estate value is high, such as Gothenburg and Stockholm. The main reason for this is that a significant reduction in LCE or LCCI in isolation requires the use of thick mineral wool insulation in exterior walls, which reduces the saleable floor space by up to 129.7 m2 and results in significant economic losses in locations with high real estate values (compare the results of Gothenburg and Stockholm with Vindeln in Figure 5 and Figure 6). Conversely, a significant reduction in LCC in isolation (i.e., up to 12.4% LCC savings relative to the initial design cost values) can only be achieved when using thinner insulations in exterior walls in order to maximize the saleable floor area (i.e., up to 54.4 m2 more), especially in locations having high real estate values (compare the dark red hexagram points in different locations in Figure 5 and Figure 6). This reduction in LCC can, however, result in environmental burden and in some cases result in up to 1.9% and 1.2% increases in the LCE and LCCI, respectively.
As this case study aimed to find and explore the optimal solutions that improve the life cycle sustainability performance of the building concept in different locations, the further analysis mainly focuses on those Pareto solutions that outperform the initial design in terms of energy use, carbon impact, and cost from a life cycle perspective (see Figure 7). As with Figure 5 and Figure 6, the red circle point in Figure 7 indicates the initial design’s energy, carbon impact, and cost values from a life cycle perspective. The purple inverted triangles show those Pareto solutions that outperform the initial design’s sustainability performance (i.e., in terms of LCE, LCCI, and LCC), henceforth referred to as “desirable Pareto solutions”. Table 6 shows how the combination and variation of the design variables related to the passive energy efficiency measures (listed in Table 3 and Table 4) provide desirable Pareto solutions for different locations.
As shown in Table 6 for all the locations, use of a thick cellulose coating (0.66–0.8 m) on the roof improves the sustainability performance of the building concept in terms of LCE, LCCI, and LCC. For Gothenburg and Stockholm, except the floor insulation, the rest of the design variables provide quite similar outcomes for the Pareto solutions that outperform the initial design’s sustainability performance. Hence, use of passive house windows and adopting 0.13–0.24 m mineral wool/PIR insulation in exterior wall 1 and 0–0.07 m mineral wool/PIR insulation in exterior wall 2 can generally improve the sustainability performance of the building concept relative to the initial design in Gothenburg and Stockholm. Comparing these results with the insulation materials and thicknesses used in the initial design’s exterior walls (see Table 1), it can be observed that, in terms of exterior wall 2, which has almost double the enclosed area compared with wall 1, use of thinner insulation than specified in the initial design is necessary to improve the sustainability performance. However, with respect to exterior wall 1, it is also possible to use thicker insulation than specified in the initial design (see Table 1) and improve the sustainability performance. This is because this combination still provides between 2.5 to 41.2 m2 floor area increase and thus economic gains when the building is located in Gothenburg and Stockholm, where the real estate value is high. The results are, however, quite the opposite for Vindeln, where generally the use of standard windows and thick mineral wool in the exterior walls provide Pareto solutions that outperform the initial design’s sustainability performance. Although Vindeln is located in a subarctic and colder climate compared to Gothenburg and Stockholm, use of standard windows instead of passive house windows improves the sustainability performance of the building concept. This is because, in Vindeln, real estate value (or economic gain from saleable floor area) is low, so the potential for reducing energy use, carbon impact, and costs from a life cycle perspective by use of thicker insulation in exterior walls which have almost five times more enclosed area than the windows, is higher. Furthermore, comparison of the insulation types in exterior walls for different locations shows that when moving from Vindeln to Gothenburg and Stockholm, use of PIR insulation, apart from mineral wool, also improves the sustainability performance of the building concept. In these locations, due to the high real estate values, use of high-performance PIR insulation in exterior walls offers less increased insulation thicknesses and profitability (due to increased saleable floor area) despite its high embodied impact and investment cost.
From the Pareto solutions that outperform the initial design’s sustainability performance, three were chosen for further analysis and discussion (see Figure 7): (1) the desirable Pareto solution with lowest LCC (dark red rotated triangle), (2) the desirable Pareto solution providing lowest LCE and LCCI (the green square point) and, finally, (3) the desirable Pareto solution that is located between the aforementioned points and provides half LCC savings relative to the solution with the lowest LCC (blue triangle point). Table 7 lists these solutions along with their design variables and sustainability performance. Figure 8 shows the changes in life cycle energy, carbon impact, and cost values for these solutions relative to the initial design.
As shown in Table 7, of all the design variables, the floor and roof insulation converged to quite similar outcomes for all the solutions in various locations. This indicates that, regardless of where the building concept is built, use of a moderately thick (0.12–0.15 m) EPS insulation for the floor and thick (0.67–0.8 m) cellulose coating for the roof is necessary to improve sustainability performance in terms of energy use, carbon impact, and costs from a life cycle perspective. For Vindeln, which has a colder climate than other cities, all the desirable Pareto solutions listed in Table 7 use standard windows, while in Gothenburg and Stockholm, use of passive house windows can only improve the sustainability performance of the building concept. This is because, in Vindeln, a combination of standard windows with thick mineral wools in exterior walls significantly reduces the energy use, carbon impact, and costs of the operational phase with relatively small increases and changes to the embodied energy, embodied carbon impact, investment cost, and economic loss of floor area reduction due to low real estate values (the changes in energy, carbon impact, and cost values for the three desirable Pareto solutions in Vindeln are shown in Figure 8). It is also notable that, in the studied building concept, the exterior walls have almost five times more enclosed area than the windows, resulting in their impact in minimizing the energy use, carbon impact, and costs of the operational phase being greater. However, in Gothenburg and Stockholm, which have significantly higher real estate values compared with Vindeln, the potential for using wall insulation as thick as that used in Vindeln’s desirable Pareto solutions is low. For Gothenburg and Stockholm, a combination of passive house windows with moderately thick insulation in exterior walls is thus needed to improve sustainability performance of the building concept relative to its initial design. The results also show that, in all locations, the desirable Pareto solutions that provide lowest LCE and LCCI values use mineral wool insulation in exterior walls, with its thickness decreasing with increasing real estate values in different locations (the desirable Pareto solutions with “lowest LCE and LCCI” are shown in Table 7 for Vindeln, Gothenburg, and Stockholm, where the locations are listed in order of increase in real estate values). This is, however, different for the desirable Pareto solutions that provide “lowest LCC” and “half LCC savings”. As shown in Table 7 and Figure 8, for these solutions with increasing real estate values (i.e., Vindeln, Gothenburg, and Stockholm, which are listed in order of increasing real estate values), the use of high-performance PIR insulation in exterior walls, instead of mineral wool, becomes essential for improving sustainability performance of the building concept. Although use of PIR insulation increases the embodied energy, carbon impact, and investment costs compared with mineral wool, its use offers thinner insulation in exterior walls (due to its low thermal conductivity) and thus significant economic gains due to the increase in saleable floor area, specifically in Gothenburg and Stockholm, which have high real estate values (the changes in energy, carbon impact, and cost values for the desirable Pareto solutions providing “Lowest LCC” and “half LCC saving” in Gothenburg and Stockholm are shown in Figure 8). This relationship becomes clearer when one compares the desirable Pareto solutions that provide “half LCC saving” in Gothenburg and Stockholm. Stockholm has higher real estate value than Gothenburg, so only by using PIR insulation in all the exterior walls can an improvement in the building’s sustainability performance be achieved (see Table 7).
The amount of energy use, carbon impact, and costs that can be saved varies depending on the aim of the optimization, and on which desirable Pareto solution is selected as optimal. For instance, if the aim of the optimization is to improve the sustainability performance of the building and simultaneously obtain maximum profitability, then the solution that provides lowest LCC in Table 7 becomes the optimal one. This solution provides highest cost savings relative to the initial design’s cost values, i.e., up to 248.4 TEUR depending on where the building concept is built. These cost savings correspond to up to 40 years of heating costs in the initial design. Conversely, if the main purpose of optimization is to improve the building’s sustainability performance and simultaneously gain maximum environmental benefits, then the desirable Pareto solution that provides “lowest LCE and LCCI” becomes optimal. Thereby, this solution provides up to 1410.7 GJ energy and 23 tonnes CO2e carbon impact savings relative to the initial design, corresponding, respectively, to up to 6 and 5 years of primary energy use and carbon footprint of the initial design’s heating demand. However, if the optimization problem is aimed at improving the building’s sustainability performance and minimizing environmental impacts and costs more or less equally, then the desirable Pareto solution “half LCC saving” in Table 7 and Figure 8 becomes optimal. In this solution, depending on the location, it is possible to obtain up to 128.2 TEUR cost savings and minimize the energy use and carbon impact, respectively, by a maximum of 1025.4 GJ and 13.8 tonnes CO2e relative to the initial design. These cost savings and environmental gains correspond to almost 23 years’ cost and 4 years’ environmental impact caused by the initial design’s heating demand.
The results indicate that the cost saving is more severe compared with the environmental gains (i.e., the amounts of energy and carbon impact that can be saved). This is due to the economic gains of floor area increases (up to 41.2 m2), specifically in Gothenburg and Stockholm, which have high real estate values (see Table 7 and Figure 8). Therefore, in Vindeln, which has low real estate values, the cost saving is limited relative to its initial design, i.e., maximum 4.9 TEUR (see Table 7 and Figure 8). The results thus indicate that considering the impact of floor area as a consequence of adopting passive energy efficiency measures (i.e., exterior wall insulation) is of significance when aiming to improve the sustainability performance of buildings specifically in locations where the real estate values are high. The results also show the potential of the multi-objective optimization to successfully account for the interaction between building sustainability and saleable floor area in order to eventually identify combinations of design variables related to the passive energy efficiency measures that can, together, maximize the profitability and sustainability performance of a building in different locations.

4.2. Validation

In accordance with Si et al. [62] one of the indicators that can be used to validate the findings and performance of an optimization study is coverage, which relates to the ability of optimization algorithms to locate an optimal solution within the solution space. Coverage mainly reflects the ability of optimization to avoid getting stuck in local optimum based on the diversity of all searched solutions [62]. Hence, coverage is evaluated by considering the distribution of all identified solutions in the solution space, where a wide distribution validates the performance of the optimization and implies its capability to converge to the global optimum [62]. Figure 9 shows the life cycle energy performance and distribution of all identified solutions in the solution space for the nine design variables (i.e., passive energy efficiency measures) studied herein. The three graphs shown at the top and the two middle-left graphs in Figure 9 relate to the different types of windows and insulation materials used in the building envelope, which were set up as discrete variables in this case study optimization. The rest of the graphs relate to the different thicknesses of insulation in the building envelope, which were set up as continuous variables. As shown in Figure 9, all the identified solutions by the optimization are widely distributed in the solution space, demonstrating that the optimization has an acceptable coverage index and thus validating its performance to converge to the global optimum.

5. Discussion and Conclusions

In line with the limited studies on the interaction between profitability of floor area and choice of passive energy efficiency measures to improve life cycle sustainability performance of buildings (in terms of energy, carbon impact, and cost), a case study was presented here to explore this topic. For this aim, multi-objective optimization was used, as previous studies recognized it a robust approach in handling complex problems that include various parameters and multiple criteria with inherent trade-offs [14,15,16,17]. The findings of the case study indicated the importance of considering the profitability of floor area and the trade-off between different sustainability criteria when aiming to adopt passive energy efficiency measures and improve the life cycle sustainability of buildings, as a reduction in each sustainability criterion in isolation (i.e., either life cycle energy, carbon impact, or cost) can significantly increase the others’ contribution. This is especially obvious when one compares the Pareto solutions that provide minimum LCE, LCCI, or LCC in Gothenburg and Stockholm, where the real estate values are relatively high. In these locations, a reduction of 5.2% LCE or 2.3% of the LCCI could yield between 21.6% and 43.4% increase in the LCC, relative to the initial design’s cost value. This increase in the LCC is at least four and nine times larger than the savings obtained for the LCE and LCCI, respectively. The main reason was that, in these locations, apart from measures such as the use of passive house windows and thick cellulose coating on the roof, it was necessary to use thick mineral wool insulation in exterior walls to significantly reduce LCE and LCCI. The use of thick mineral wool insulation in the exterior walls resulted in a reduction of almost 130 m2 saleable floor area relative to the initial design’s floor area. This produced an economic loss from a life cycle perspective (i.e., up to 43.4% increase in the LCC relative to the initial design’s cost values, depending on the location).
In general, analysis of the Pareto solutions that outperformed the initial design’s sustainability performance shows that, regardless of the location, (1) use of thick cellulose coating for the roof as well as (2) use of a moderately thick EPS insulation for the floor are necessary to improve the sustainability performance of the building concept in terms of energy use, carbon impact, and cost from a life cycle perspective. However, the optimal solution for exterior wall insulation and window types was dependent on the location of the building concept. The results indicated that, in the location where real estate values are low, a combination of thick insulation in the exterior walls and standard windows yields an improvement in the building concept’s sustainability performance. In the locations where the real estate values are high, due to the economic loss caused by floor area reduction, the scope for improving a building’s sustainability by the use of thick insulation in exterior walls is limited. Therefore, in such locations, generally, a combination of moderately thick insulation in the exterior walls with passive house windows is necessary to improve the building concept’s sustainability performance. A study by Sandberg et al. [32] indicated that if the profitability of floor area is disregarded, a significant reduction in LCE and LCC can be obtained when thickening the roof and exterior wall insulation. Our study shows that this is not the case when the economic effect of floor area is included in the system boundary of the life cycle analysis. This is especially of significance in regions where the real estate values are relatively high, as the findings indicated that use of thick insulation in exterior walls in such regions can result in significant economic losses due to the reduction in saleable floor area. In addition, although high-performance insulation (e.g., PIR) generally has higher embodied energy, embodied impact, and investment cost compared with normal performance insulation (e.g., mineral wool), the results indicated that in the locations where real estate values are high, such as Stockholm, their use can mainly yield optimal sustainable solutions for the building concept (see desirable Pareto solutions providing lowest LCC and half LCC saving in Stockholm as shown in Table 7). This is because in such locations the use of high-performance insulation, which has low thermal conductivity, offers thinner insulation in the exterior walls and thus significant economic gains as a consequence of increased floor area. The results thus confirm the studies of Alam et al. [1] and Fantucci et al. [2], who found that high-performance VIP insulation is more economically viable from an energy perspective, compared with the normal performance insulation, when allowing for the economic gains from increased floor space in retrofit buildings, specifically in locations with high rental values. Although standardized building concepts are considered cost-effective, as they can be built in different locations based on pre-prepared design solutions, the findings of this study indicate that their design needs to be adjusted and adapted to their specific location when aiming to use passive energy efficiency measures (more specifically, wall insulation and windows) to eventually improve the life cycle sustainability performance.
In general, analysis of the Pareto solutions that outperformed the initial design’s sustainability performance indicated that, depending on the location, use of the multi-objective optimization enables the identification of solutions that can save up to 1410.7 GJ of energy, 23 tonnes CO2e carbon footprint, and 248.4 TEUR cost from a life cycle perspective relative to the building concept’s initial design. These savings amount to, respectively, 6 years’ primary energy use, 5 years’ carbon impact, and 40 years’ costs for operational heating caused by the building concept’s initial design. The optimal solutions of the passive energy efficiency measures identified in this study can also guide designers, construction companies, and building developers in meeting environmental and economic targets of sustainability in buildings. The findings thus also suggest that multi-objective optimization is an applicable approach to successfully identify combinations of passive energy efficiency measures and design solutions that can improve life cycle sustainability of buildings, while simultaneously allowing the profitability of investments based on floor area.
Additionally, the findings suggest that ensuring a highly energy-efficient and decarbonized building stock needs policymakers to set strategies that target the interaction between energy efficiency measures and the long-term profitability of investments (which also account for the rental and real estate gains) in different locations.

6. Limitation and Future Research

To ensure a representative study, a standardized new building concept was used in this study to explore the impact of various passive energy efficiency measures on life cycle sustainability performance when the profitability of floor area is accounted for. The main reason for investigating different locations only in Sweden in this study was because the building concept is designed for and built in the Swedish market. Future studies could thus investigate other building cases in locations with different climates in order to consolidate findings. The passive energy efficiency measures and strategies that were investigated in this study were related to new buildings and identified through discussions with the associated construction company who develop and build the building concept. Future studies could investigate other energy efficiency measures in order to provide new findings in the context of sustainable buildings. Furthermore, the scope and system boundary of the life cycle sustainability optimization in this study includes mainly production and operational phases, as previous research indicated that these two phases contribute significantly to the total environmental impacts caused by a building during its life cycle. Future studies thus could include other phases (i.e., construction, operational maintenance, and end-of-life stages) in order to consolidate the results and account for the sustainability performance of buildings over their entire life.
To keep the focus of the presented study more specific, the sustainability analysis and optimization in the case study were implemented and presented assuming that the apartments in the building would be sold after construction. Future studies should compare the findings by exploring solutions that maximize the life cycle sustainability benefits of buildings that are to be rented after construction/renovation.
Several parameters can potentially affect a building’s sustainability performance, such as the lifespan of the building (assumed to be 50 years here, based on previous research), variations in the discount (or interest) rate and energy prices, as well as the energy, carbon impact, and cost data/databases used in the analysis. Investigating the robustness of findings with respect to the variation in such parameters was beyond the scope of this research and needs to be explored in any future research.

Author Contributions

Conceptualization, F.S. and J.M.; Methodology, F.S. and J.M.; Software, J.M.; Validation, F.S.; Formal Analysis, F.S.; Writing—Original Draft Preparation, F.S.; Writing—Review and Editing, J.M.; Visualization, F.S. and J.M.; and Funding Acquisition, F.S. All authors have read and agreed to the published version of the manuscript.

Funding

This research was funded by the Swedish Energy Agency grant number [49535-1].

Data Availability Statement

Not applicable.

Acknowledgments

The authors would like to thank the NCC Construction Company and especially Christina Claeson-Jonsson and Magnus Österbring for providing data and feedback relating to the building case studied.

Conflicts of Interest

The authors declare no conflict of interest.

References

  1. Alam, M.; Singh, H.; Suresh, S.; Redpath, D.A.G. Energy and economic analysis of Vacuum Insulation Panels (VIPs) used in non-domestic buildings. Appl. Energy 2017, 188, 1–8. [Google Scholar] [CrossRef] [Green Version]
  2. Fantucci, S.; Garbaccio, S.; Lorenzati, A.; Perino, M. Thermo-economic analysis of building energy retrofits using VIP-Vacuum Insulation Panels. Energy Build. 2019, 196, 269–279. [Google Scholar] [CrossRef]
  3. Zalejska-Jonsson, A.; Lind, H.; Hintze, S. Energy-Efficient Technologies and the Building’s Saleable Floor Area: Bust or Boost for Highly-Efficient Green Construction? Buildings 2013, 3, 570–587. [Google Scholar] [CrossRef] [Green Version]
  4. Gil-Baez, M.; Padura, Á.B.; Huelva, M.M. Passive actions in the building envelope to enhance sustainability of schools in a Mediterranean climate. Energy 2019, 167, 144–158. [Google Scholar] [CrossRef]
  5. EU Directive. Directive (EU) 2018/844 of the European Parliament and of the Council of 30 May 2018 Amending Directive 2010/31/EU on the Energy Performance of Buildings and Directive 2012/27/EU on Energy Efficiency. 2018. Available online: https://www.legislation.gov.uk/eudr/2018/844 (accessed on 23 March 2022).
  6. Friess, W.A.; Rakhshan, K. A review of passive envelope measures for improved building energy efficiency in the UAE. Renew. Sustain. Energy Rev. 2017, 72, 485–496. [Google Scholar] [CrossRef]
  7. Rivera, M.L.; MacLean, H.L.; McCabe, B. Implications of passive energy efficiency measures on life cycle greenhouse gas emissions of high-rise residential building envelopes. Energy Build. 2021, 249, 111202. [Google Scholar] [CrossRef]
  8. Shadram, F.; Mukkavaara, J. Exploring the effects of several energy efficiency measures on the embodied/operational energy trade-off: A case study of swedish residential buildings. Energy Build. 2019, 183, 283–296. [Google Scholar] [CrossRef]
  9. Audenaert, A.; De Cleyn, S.H.; Vankerckhove, B. Economic analysis of passive houses and low-energy houses compared with standard houses. Energy Policy 2008, 36, 47–55. [Google Scholar] [CrossRef]
  10. Chastas, P.; Theodosiou, T.; Bikas, D. Embodied energy in residential buildings-towards the nearly zero energy building: A literature review. Build. Environ. 2016, 105, 267–282. [Google Scholar] [CrossRef]
  11. Schwartz, Y.; Raslan, R.; Mumovic, D. The life cycle carbon footprint of refurbished and new buildings—A systematic review of case studies. Renew. Sustain. Energy Rev. 2018, 81, 231–241. [Google Scholar] [CrossRef] [Green Version]
  12. Shadram, F.; Bhattacharjee, S.; Lidelöw, S.; Mukkavaara, J.; Olofsson, T. Exploring the trade-off in life cycle energy of building retrofit through optimization. Appl. Energy 2020, 269, 115083. [Google Scholar] [CrossRef]
  13. Sharif, S.A.; Hammad, A. Simulation-Based Multi-Objective Optimization of institutional building renovation considering energy consumption, Life-Cycle Cost and Life-Cycle Assessment. J. Build Eng. 2019, 21, 429–445. [Google Scholar] [CrossRef]
  14. Soares, N.; Bastos, J.; Pereira, L.D.; Soares, A.; Amaral, A.R.; Asadi, E.; Rodrigues, E.; Lamas, F.; Monteiro, H.; Lopes, M.; et al. A review on current advances in the energy and environmental performance of buildings towards a more sustainable built environment. Renew. Sustain. Energy Rev. 2017, 77, 845–860. [Google Scholar] [CrossRef]
  15. Tuhus-Dubrow, D.; Krarti, M. Genetic-algorithm based approach to optimize building envelope design for residential buildings. Build. Environ. 2010, 45, 1574–1581. [Google Scholar] [CrossRef]
  16. Amini Toosi, H.; Lavagna, M.; Leonforte, F.; Del Pero, C.; Aste, N. Life Cycle Sustainability Assessment in Building Energy Retrofitting; A Review. Sustain. Cities Soc. 2020, 60, 102248. [Google Scholar] [CrossRef]
  17. Shadram, F.; Mukkavaara, J. An integrated BIM-based framework for the optimization of the trade-off between embodied and operational energy. Energy Build. 2018, 158, 1189–1205. [Google Scholar] [CrossRef]
  18. Longo, S.; Montana, F.; Riva Sanseverino, E. A review on optimization and cost-optimal methodologies in low-energy buildings design and environmental considerations. Sustain. Cities Soc. 2019, 45, 87–104. [Google Scholar] [CrossRef]
  19. Machairas, V.; Tsangrassoulis, A.; Axarli, K. Algorithms for optimization of building design: A review. Renew. Sustain. Energy Rev. 2014, 31, 101–112. [Google Scholar] [CrossRef]
  20. Nguyen, A.-T.; Reiter, S.; Rigo, P. A review on simulation-based optimization methods applied to building performance analysis. Appl. Energy. 2014, 113, 1043–1058. [Google Scholar] [CrossRef]
  21. Wang, W.; Zmeureanu, R.; Rivard, H. Applying multi-objective genetic algorithms in green building design optimization. Build. Environ. 2005, 40, 1512–1525. [Google Scholar] [CrossRef]
  22. Wang, W.; Rivard, H.; Zmeureanu, R. Floor shape optimization for green building design. Adv. Eng. Inform. 2006, 20, 363–378. [Google Scholar] [CrossRef]
  23. Stamoulis, M.N.; Santos, G.H.D.; Lenz, W.B.; Tusset, A.M. Genetic Algorithm Applied to Multi-Criteria Selection of Thermal Insulation on Industrial Shed Roof. Buildings 2019, 9, 238. [Google Scholar] [CrossRef] [Green Version]
  24. Hamdy, M.; Hasan, A.; Siren, K. Applying a multi-objective optimization approach for Design of low-emission cost-effective dwellings. Build. Environ. 2011, 46, 109–123. [Google Scholar] [CrossRef]
  25. Shao, T.; Zheng, W.; Cheng, Z. Passive Energy-Saving Optimal Design for Rural Residences of Hanzhong Region in Northwest China Based on Performance Simulation and Optimization Algorithm. Buildings 2021, 11, 421. [Google Scholar] [CrossRef]
  26. Antipova, E.; Boer, D.; Guillén-Gosálbez, G.; Cabeza, L.F.; Jiménez, L. Multi-objective optimization coupled with life cycle assessment for retrofitting buildings. Energy Build. 2014, 82, 92–99. [Google Scholar] [CrossRef]
  27. Carreras, J.; Pozo, C.; Boer, D.; Guillén-Gosálbez, G.; A Caballero, J.; Ruiz-Femenia, R.; Jiménez, L. Systematic approach for the life cycle multi-objective optimization of buildings combining objective reduction and surrogate modeling. Energy Build. 2016, 130, 506–518. [Google Scholar] [CrossRef] [Green Version]
  28. Ascione, F.; Bianco, N.; Mauro, G.M.; Vanoli, G.P. A new comprehensive framework for the multi-objective optimization of building energy design: Harlequin. Appl. Energy 2019, 241, 331–361. [Google Scholar] [CrossRef]
  29. Mostavi, E.; Asadi, S.; Boussaa, D. Development of a new methodology to optimize building life cycle cost, environmental impacts, and occupant satisfaction. Energy 2017, 121, 606–615. [Google Scholar] [CrossRef]
  30. Wu, M.H.; Ng, T.S.; Skitmore, M.R. Sustainable building envelope design by considering energy cost and occupant satisfaction. Energy Sustain. Dev. 2016, 31, 118–129. [Google Scholar] [CrossRef] [Green Version]
  31. Amani, N.; Kiaee, E. Developing a two-criteria framework to rank thermal insulation materials in nearly zero energy buildings using multi-objective optimization approach. J. Clean Prod. 2020, 276, 122592. [Google Scholar] [CrossRef]
  32. Sandberg, M.; Mukkavaara, J.; Shadram, F.; Olofsson, T. Multidisciplinary Optimization of Life-Cycle Energy and Cost Using a BIM-Based Master Model. Sustainability 2019, 11, 286. [Google Scholar] [CrossRef] [Green Version]
  33. Chau, C.K.; Leung, T.M.; Ng, W.Y. A review on Life Cycle Assessment, Life Cycle Energy Assessment and Life Cycle Carbon Emissions Assessment on buildings. Appl. Energy. 2015, 143, 395–413. [Google Scholar] [CrossRef]
  34. Giesekam, J.; Barrett, J.; Taylor, P.; Owen, A. The greenhouse gas emissions and mitigation options for materials used in UK construction. Energy Build. 2014, 78, 202–214. [Google Scholar] [CrossRef]
  35. Shadram, F.; Mukkavaara, J.; Schade, J.; Sandberg, M.; Olofsson, T. Trade-off optimization of embodied versus operational carbon impact for insulation and window to wall ratio design choices: A case study. In Proceedings of the International Conference on Sustainability in Energy and Buildings, Gold Coast, Australia, 20–22 June 2018; Springer: Cham, Switzerland, 2018; Volume 131, pp. 12–20. [Google Scholar] [CrossRef]
  36. Colorni, A.; Dorigo, M.; Maniezzo, V. Genetic algorithms and highly constrained problems: The time-table case. In Proceedings of the International Conference on Parallel Problem Solving from Nature, Dortmund, Germany, 1–3 October 1990; pp. 55–59. [Google Scholar]
  37. Deb, K. Multi-objective Genetic Algorithms: Problem Difficulties and Construction of Test Problems. Evol. Comput. 1999, 7, 205–230. [Google Scholar] [CrossRef]
  38. Pareto, W. Course of Political Economy. 1896. Available online: https://www.britannica.com/topic/Cours-dEconomie-Politique (accessed on 23 March 2022).
  39. Deb, K. Multi-objective Optimisation Using Evolutionary Algorithms: An Introduction. In Multi-Objective Evolutionary Optimisation for Product Design and Manufacturing; Springer: London, UK, 2011; pp. 3–34. [Google Scholar] [CrossRef]
  40. Blank, J.; Deb, K. Pymoo: Multi-Objective Optimization in Python. IEEE Access. 2020, 8, 89497–89509. [Google Scholar] [CrossRef]
  41. Grasshopper. Grasshopper. Available online: https://www.rhino3d.com/6/new/grasshopper/ (accessed on 1 January 2022).
  42. Rhinoceros. Rhinoceros. Available online: https://www.rhino3d.com/ (accessed on 1 January 2022).
  43. Honeybee. Honeybee. Available online: https://www.ladybug.tools/ (accessed on 1 January 2022).
  44. Swedish Building Code. Boverket’s Mandatory Provisions and General Recommendations. The Swedish National Board of Housing, Building and Planning (Boverket). 2019. Available online: https://www.boverket.se/globalassets/publikationer/dokument/2019/bbr-2011-6-tom-2018-4-english-2.pdf (accessed on 18 January 2021).
  45. Deb, K.; Pratap, A.; Agarwal, S.; Meyarivan, T. A fast and elitist multiobjective genetic algorithm: NSGA-II. IEEE Trans. Evol. Comput. 2002, 6, 182–197. [Google Scholar] [CrossRef] [Green Version]
  46. Evins, R. A review of computational optimisation methods applied to sustainable building design. Renew. Sustain. Energy Rev. 2013, 22, 230–245. [Google Scholar] [CrossRef]
  47. Geoffrey, P.; Hammond, C.I.J. Inventory of Carbon & Energy (ICE); Version 23; Sustainable Energy Research Team, Department of Mechanical Engineering, University of Bath: Bath, UK, 2019; Published online. [Google Scholar]
  48. The International EPD System. The International EPD System. Available online: https://www.environdec.com/home (accessed on 1 January 2022).
  49. The Norwegian EPD Foundation. The Norwegian EPD Foundation. Available online: https://www.epd-norge.no/epder_2/ (accessed on 1 January 2022).
  50. District Heating Impact. Carbon Impact Caused by Swedish District Heating. Available online: https://www.energiforetagen.se/statistik/fjarrvarmestatistik/miljovardering-av-fjarrvarme/ (accessed on 1 January 2022).
  51. Electricity impact. Carbon Impact Caused by Swedish Electricity. Available online: https://www.vattenfall.se/elavtal/energikallor/elens-ursprung/ (accessed on 1 January 2022).
  52. Conci, M.; Konstantinou, T.; van den, D.A.; Schneider, J. Trade-off between the economic and environmental impact of different decarbonisation strategies for residential buildings. Build. Environ. 2019, 155, 137–144. [Google Scholar] [CrossRef]
  53. Tadeu, S.; Alexandre, R.; Tadeu, A.; Antunes, C.; Simões, N.A.V.; da Silva, P. A comparison between cost optimality and return on investment for energy retrofit buildings—A real options perspective. Sustain. Cities Soc. 2016, 21, 12–25. [Google Scholar] [CrossRef]
  54. Penna, P.; Prada, A.; Cappelletti, F.; Gasparella, A. Multi-objectives optimization of Energy Efficiency Measures in existing buildings. Energy Build. 2015, 95, 57–69. [Google Scholar] [CrossRef]
  55. Hamdy, M.; Hasan, A.; Siren, K. A multi-stage optimization method for cost-optimal and nearly-zero-energy building solutions in line with the EPBD-recast 2010. Energy Build. 2013, 56, 189–203. [Google Scholar] [CrossRef]
  56. Lopes, J.; Oliveira, R.A.; Banaitiene, N.; Banaitis, A. A Staged Approach for Energy Retrofitting an Old Service Building: A Cost-Optimal Assessment. Energies 2021, 14, 6929. [Google Scholar] [CrossRef]
  57. Steinbach, J.; Staniaszek, D. Discount Rates in Energy System Analysis Discussion Paper; BPIE: Berlin, Germany, 2015. [Google Scholar]
  58. Hermelink, A.H.; de Jager, D. Evaluating our future-The crucial role of discount rates in European Commission energy system modelling. In The European Council for an Energy Efficient Economy & Ecofys; Energy Efficient Economy (eceee) & Ecofys: Berlin, Germany, 2015. [Google Scholar]
  59. Schleich, J.; Gassmann, X.; Faure, C.; Meissner, T. Making the implicit explicit: A look inside the implicit discount rate. Energy Policy 2016, 97, 321–331. [Google Scholar] [CrossRef]
  60. Craighead, G. High-rise building definition, development, and use. In High-Rise Cecurity and Fire Life Safety, 3rd ed.; Butterworth-Heinemann: Boston, MA, USA, 2009. [Google Scholar]
  61. Sveby Swedish Standard. Standards for Energy in Buildings. Input Data for Calculation of Building’s Energy Use. 2012. Available online: http://www.sveby.org/wp-content/uploads/2012/10/Sveby_Brukarindata_bostader_version_1.0.pdf (accessed on 1 January 2021).
  62. Si, B.; Tian, Z.; Jin, X.; Zhou, X.; Tang, P.; Shi, X. Performance indices and evaluation of algorithms in building energy efficient design optimization. Energy 2016, 114, 100–112. [Google Scholar] [CrossRef]
Figure 1. An overview of the scope of life cycle sustainability optimization in this study.
Buildings 12 00497 g001
Figure 2. An overview of the process used to carry out multi-objective optimization in this study.
Buildings 12 00497 g002
Figure 3. A plan view and 3D view of the high-rise apartment building.
Buildings 12 00497 g003
Figure 4. The locations and cities investigated in this case study.
Buildings 12 00497 g004
Figure 5. The life cycle energy, carbon impact, and cost values of feasible solutions obtained from the multi-objective optimization for the building concept in Vindeln, Gothenburg, and Stockholm. A colour print is recommended.
Buildings 12 00497 g005
Figure 6. The percentage change in energy, carbon impact, and cost values of the feasible solutions relative to the initial design of the building concept for different locations. A colour print is recommended.
Buildings 12 00497 g006
Figure 7. The life cycle energy, carbon impact, and cost values of Pareto solutions that outperform the initial design’s sustainability performance (referred as desirable Pareto solutions) in different locations. A colour print is recommended.
Buildings 12 00497 g007
Figure 8. The changes in life cycle energy, carbon impact, and cost values for desirable Pareto solutions listed in Table 7 relative to the initial design. Minus signs indicate savings or reductions while plus signs indicate increase in energy use, carbon impact, and cost relative to the initial design’s performance in different locations. A colour print is recommended.
Buildings 12 00497 g008
Figure 9. Distribution of all identified solutions in the solution space for the nine design variables studied in the case study.
Buildings 12 00497 g009
Table 1. The windows and construction elements related to the as-built design of the high-rise apartment building, as well as the design variables related to the passive energy efficiency measures that were subjected to optimization (i.e., components and materials that are highlighted in bold italics).
Component/Construction ElementEnclosed Area (m2)Initial U-Value (W/m2K)Initial Type/Initial Material in the Related Construction ElementInitial Thickness (m)Design Variable
Number
(Component/Material Type)
Design Variable
Number (Material Thickness)
Window and window-doors3401Standard Triple-glazedN/ADV1N/A
Exterior floor3400.21Expanded polystyrene (EPS)0.1DV2DV6
Exterior wall (EW) 15020.178Mineral wool (MW)0.17DV3DV7
Exterior wall (EW) 210680.15Mineral wool0.08DV4DV8
Roof3400.11Cellulose0.45DV5DV9
Table 2. A list of the windows and insulation materials that are treated as discrete variables in the optimization. The embodied energy and embodied carbon data were gathered from the Bath ICE [47], the Norwegian EPD foundation [49], and The International EPD system [48].
Index NumberComponent/MaterialFunctional UnitThermal Conductivity (W/m·K)Embodied Energy (MJ)Embodied Carbon (kg CO2eq)Investment Cost (EUR )
1Standard Triple-glazed window (U = 1 W/m2K)m2N/A146269392.2
2Passive house window (U = 0.8 W/m2K)m2N/A158576.4522.2
3Polyisocyanurate (PIR) insulationkg0.028102.14.848.1
4Expanded polystyrene (EPS) insulationkg0.03588.63.293.2
5Mineral woolkg0.03616.61.281.4
6Cellulosekg0.0422.50.51.2
Table 3. The discrete variables and their ranges used as design variables in the optimization.
Design Variable Number (Component and Material Types)Index MinIndex Max
Window type (DV1)12
Exterior floor insulation (DV2)34
Wall 1 insulation (DV3)35
Wall 2 insulation (DV4)35
Roof insulation (DV5)36
Table 4. The insulation material thicknesses and their ranges that are treated as continuous variables in the optimization.
Design Variable Number (Material Thicknesses)Lower Bound (m)Upper Bound (m)
Exterior floor insulation thickness (DV6)00.3
Wall 1 insulation thickness (DV7)00.3
Wall 2 insulation thickness (DV8)00.3
Roof insulation thickness (DV9)00.8
Table 5. Parameters used for optimizing the building’s sustainability performance.
ParametersValue
Building’s lifespan50 years
Room’s temperature set point (heating)21 °C
CoolingN/A
Hot water demand25 kWh/(m2·yr)
Internal gains from domestic hot water usage20%
Number of occupants0.033 occupants/m2
Occupant presence14 h/day
Effect per occupant80 W
Internal gains from occupants’ heat100%
Mechanical ventilation (air flow)0.35 l/(s·m2)
Infiltration rate (constant)0.6 l/(s·m2 surface area)
Additional energy use and losses (e.g., distribution system losses, plant losses, and thermal bridges)10% of the heating demand
Escalation rate of energy price (e)3%
Real interest rate (r)2% *
Average real estate valueVindeln = 710 (EUR/m2)
Gothenburg = 4810 (EUR/m2)
Stockholm = 7187 (EUR/m2)
* Sweden’s central bank, real interest rate and inflation in Sweden. https://www.riksbank.se/en-gb (accessed on 1 January 2022).
Table 6. Combination and variation of the design variables related to the passive energy efficiency measures that provide desirable Pareto solutions in different locations.
LocationWindow Type (DV1)Exterior Floor Insulation Type (DV2)Wall 1 Insulation Type (DV3)Wall 2 Insulation Type (DV4)Roof Insulation Type (DV5)Exterior Floor Insulation Thickness (DV6) (m)Wall 1 Insulation Thickness (DV7) (m)Wall 2 Insulation Thickness (DV8) (m)Roof Insulation Thickness (DV9) (m)Change in Floor Area (m2)
MinMaxMinMaxMinMaxMinMaxMinMax
VindelnStandad windowEPSMineral woolMineral woolCellulose0.090.160.20.270.050.10.660.8−22.27.4
Gothenb-urgPassive house windowEPSMineral wool/PIRMineral wool/PIRCellulose0.110.180.130.2300.070.670.82.841.2
Stockho-lmPassive house windowEPS/PIRMineral wool/PIRMineral wool/PIRCellulose0.070.210.130.2400.070.690.82.541.2
Table 7. List of three desirable Pareto solutions and their design variables for different locations. These solutions are (1) the desirable Pareto solution with lowest LCC, (2) the desirable Pareto solution with the lowest environmental impact (i.e., LCCI and LCC), and (3) the desirable Pareto solution with half LCC saving relative to the solution providing lowest LCC. Minus signs in this table indicate a reduction in floor area relative to the initial design’s total floor area.
LocationSolutionWindow Type (DV1)Exterior Floor Insulation (DV2)Wall 1 Insulation (DV3)Wall 2 Insulation (DV4)ROOF Insulation (DV5)Exterior Floor Insulation Thickness (DV6) (M)Wall 1 Insulation Thickness (DV7) (m)Wall 2 Insulation Thickness (DV8) (m)Roof Insulation Thickness (DV9) (m)Change in Floor Area (m2)LCE (GJ)LCCI (Tonnes CO2e)LCC (TEUR)LCE Saving Relative to Initial Design (GJ)LCCI Saving Relative to Initial Design(Tonnes CO2e)LCC Saving Relative to Initial Design (TEUR)Corresponds to X Years Primary Energy Use in Initial Design’s Heating DemandCorresponds to X Years Carbon Footprint in Initial Design’s Heating DemandCorresponds to X Years Cost of Initial Design’s Heating Demand
VindelnLowest LCCStandard windowEPSMineral woolMineral woolCellulose0.130.20.050.677.460,842.71568.11995.1152.80.34.9001
Half LCC savingStandard windowEPSMineral woolMineral woolCellulose0.140.250.070.68−12.760,1171563.21997.6878.55.22.5310
Lowest LCE and LCCIStandard windowEPSMineral woolMineral woolCellulose0.140.250.090.77−21.959,766.81561.31999.81228.77.10.3420
GothenburgLowest LCCPassive house windowEPSPIRNACellulose0.150.13NA0.741.254,167.117742100147.41.21531025
Half LCC savingPassive house windowEPSPIRMineral woolCellulose0.150.160.040.7520.753,393.91761.42179.6920.613.873.44313
Lowest LCE and LCCIPassive house windowEPSMineral woolMineral woolCellulose0.130.20.060.82.852,9931752.22247.41321.5235.6651
StockholmLowest LCCPassive house windowEPSPIRNACellulose0.150.13NA0.741.256,2401740.81867177.60.5248.41040
Half LCC savingPassive house windowEPSPIRPIRCellulose0.120.150.040.822.955,392.21729.71987.21025.411.7128.24223
Lowest LCE and LCCIPassive house windowEPSMineral woolMineral woolCellulose0.120.180.070.82.555,006.91720.12112.21410.721.33.2551
Publisher’s Note: MDPI stays neutral with regard to jurisdictional claims in published maps and institutional affiliations.

