Abstract
Intelligent construction (IC) is an innovative development model of the construction industry in which construction is integrated with digital technologies against the backdrop of the new technological revolution. The development of IC involves many influencing factors which are actively promoting IC development. However, investigations focusing on identifying and examining the relationships among the factors necessary for IC development are limited. In contributing to bridging this gap, this paper investigated and analyzed influencing factors for IC development by developing structural equation modeling (SEM) based on 5 variables and 28 measures, including (1) identifying the factors and examining their influence on IC development in China and (2) clarifying the paths and key measures for successful IC development. The results showed that (1) the three variables of government, company, and technology had a direct and significant impact on the development of IC, (2) the three variables of industry, company, and technology actually formed a “closed-loop” within which they interact and promote each other, and (3) it was widely realized and accepted that IC development has bright prospects in China. Furthermore, four paths for IC development were obtained and the key measures of the five variables were further analyzed. This research contributes to the body of knowledge on IC by identifying the factors influencing IC development. The four paths and key measures were proposed to clarify the relationship between factors. Recommendations were put forward to promote IC development.
1. Introduction
The global construction industry is booming, increasing building projects and demand for intellectual development [1]. Furthermore, given the increasingly frequent transfer of technologies such as building information modeling (BIM) and additive manufacturing, the intelligent development of the construction industry is inevitable [2].
At present, the expression “the process or product of construction using emerging digital technologies” primarily refers to “digital construction” [3], “smart construction” [4], or “construction 4.0” [5,6]. “digital construction”, “smart construction”, “intelligent construction”, and “construction 4.0” have similar connotations; that is, the use of emerging technologies to achieve integrated collaboration of project approval decision making, planning and design, construction, and operation and maintenance services. Such integrated collaboration can significantly improve the efficiency and effectiveness of the construction industry. IC is an innovative development model of the construction industry [7]. Especially in China, IC is greatly advocated. In July 2020, the “Guiding Opinions on Promoting the Coordinated Development of Intelligent Construction and Building Industrialization” jointly issued by 13 Chinese government ministries and commissions proposed increasing the application of IC in all aspects of construction to form an IC industry.
In recent years, the application of IC technologies in construction has become increasingly extensive [8,9], and the research on IC has mainly focused on the application of BIM [10,11,12,13], intelligent equipment [14,15,16], information and communication technology [17], and additive manufacturing [18,19,20] in the construction industry.
It can be seen from previous studies that most of the research on IC development is concerned with IC technology, and investigations focusing on identifying and examining the relationships of the influencing factors necessary for IC development are limited. However, identifying the factors and their impact is crucial for IC development. Therefore, this paper investigated and analyzed factors for IC development by (1) taking IC development in China as an example and identifying the factors and examining their influence on IC development, and (2) clarifying the paths and key measures for IC development.
2. Theoretical Framework
The conceptual research model is constructed, hypotheses are provided, and the conceptual hypothesis model is presented in this section.
2.1. Conceptual Research Model
Explanatory factors and their relationships are discussed in classical theories of industrial development. A variety of analytical frameworks were proposed to analyze industry development. Bain (1956) proposed the structure-conduct-performance (SCP) analysis paradigm to explore the impact between national policies, technological upgrades, and corporate behavior. Porter (1990) presented four factors for determining industry development, namely production, demand conditions, the performance of related industries and supporting industries, and corporate strategy, structure, and competition in the industry, and claimed that two variables influenced these factors: opportunity and government. Industrial development theory studies the problems of technological innovation, industrial clusters, companies, and product service changes [21]. The theory assumes that the motivation of industrial development includes scientific and technological innovation and other factors related to production, policies, and markets.
In the case of the influencing factors of IC development, Ding [7] proposed that the government needs to actively support IC technology innovation to provide new opportunities, promote the transformation of construction companies to seize market opportunities, and encourage cross-border industries to extend the engineering market. Wang [22] believed that the current IC technology development is unusually rapid and technology upgrading assumes the role of a pioneer, promoting the high-quality development of the construction industry. Chen & Ding [23] also pointed out that the development of domain technology plays a key role in IC development. In July 2020, the “Guiding Opinions on Promoting the Coordinated Development of IC and Building Industrialization” pointed out that IC development involves the transformation and upgrading of technology, company, and industry.
From the above research review, this paper studied the following four factors that influence IC development: government, industry, company, and technology. Moreover, we built a conceptual model, as shown in Figure 1. Then, we clarified how these factors act on IC development by examining their relationships. Finally, we discussed the influencing paths and critical measures for IC development in China.
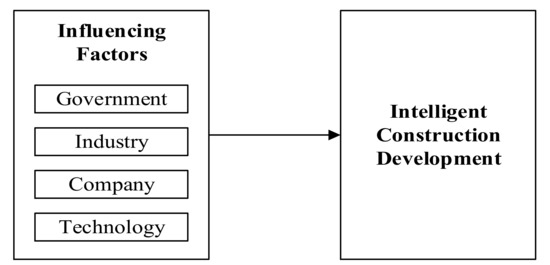
Figure 1.
Conceptual research model.
2.2. Research Hypothesis
Based on a review of the research literature and expert interviews, five items including ten research hypotheses were proposed, then the conceptual hypothesis model was constructed.
2.2.1. The Relationship between Various Influencing Factors
- (1)
- The relationship between the government and other factors
The government is an essential driver of IC development. IC development in China is driven by macro-development [24]. The role of the government affects the development of industry, company, and technology: government subsidies reduce economic risks to businesses and boost industry development [25], directly reducing the cost of research and development, encouraging companies to engage in research and development, and improving the degree of technological growth in the industry [26]. On the other hand, subsidy funds help reverse the disadvantage of cash flow shortages, reduce the risk of debt repayment, and provide more protection for the business development of companies [27]. Moreover, subsidies impact technological innovation output [28]. They make a significant contribution to technological advances [29], which also impact technological innovation behavior. Based on the above literature, we made the following assumptions:
Hypothesis 1 (H1).
Government has a positive impact on the industry;
Hypothesis 2 (H2).
Government has a positive impact on the company;
Hypothesis 3 (H3).
Government has a positive impact on technology;
- (2)
- The relationship between industry and other factors
The industry development trend has led to a mandatory structural adjustment on the supply of companies [30]. It has induced companies to carry out technological innovation [31]. According to the questionnaire survey, the industry development has had an important impact on individual companies. Based on the above literature, we made the following assumption:
Hypothesis 4 (H4).
The industry has a positive impact on business development;
- (3)
- The relationship between the company and other factors
Corporate strategy, innovation expectations, and research and development investment impact technology innovation [32,33,34]. Under the premise of pursuing their interests, companies have increased their investment in research, forming a virtuous circle that promotes technological progress [35]. For example, with the development of intelligent technology, architectural design companies need to study intelligent integrated systems to meet design requirements, solve difficulties, improve efficiency, and complete transformation and upgrading [36].
Based on the above literature, we made the following assumption:
Hypothesis 5 (H5).
The Company has a positive impact on technological development;
- (4)
- The relationship between technology and other factors
Schumpeter [37] argued that technology drove new market demand, incredibly innovative technology combined with marketing, which guides industry development. Many scholars have recognized this conclusion. With the current exponential growth of information technology, digital applications, networked applications, and intelligent integration innovation are the three driving forces of new technology [38]. Based on the above literature, we made the following assumption:
Hypothesis 6 (H6).
Technology has a positive impact on the industry.
2.2.2. The Relationship between Various Influencing Factors and the IC Development
- (1)
- The relationship between the government and IC development
IC development is a complex system. The government plays a key driving role in industrial development through overall planning and careful arrangements to create an effective environment for development [39]. The principle of market allocation and government guidance should be followed to realize IC development [40], which requires the government to actively cultivate new industries for IC and strengthen the transformation and promotion of scientific and technological achievements [41].
Based on the above literature, we made the following assumption:
Hypothesis 7 (H7).
The government has a positive impact on IC development.
- (2)
- The relationship between the industry and IC development
Industry development affects the production, development, and structural adjustment of the industry. IC development is not limited to the reform of the traditional construction industry, but other sectors are also gradually entering the field of the IC industry. Therefore, the rise and change of the industry is an important force driving the development of IC. Based on this, we made the following assumption:
Hypothesis 8 (H8).
The industry has a positive impact on the development of IC.
- (3)
- The relationship between the company and IC development
Companies make up the main body of the IC industry. At present, the intelligent transformation of the construction industry in China still relies on leading companies to drive change. The industry is gradually reaching a higher level of development through the competition and cooperation between companies. Mao et al. believed that traditional companies could use existing emerging technologies to achieve construction and management innovation [42]. While Xia [43] believed that construction companies, as the main body of IC development, should build a combination of production, research, and development of technological innovation systems, scientifically select the path of technological innovation, and carry out construction and exploration.
Based on the above literature, we made the following assumption:
Hypothesis 9 (H9).
The company has a positive impact on IC development.
- (4)
- The relationship between technology and IC development
The development of industry relies on the progress of technology. Therefore, the current integration of intelligent technology and construction technology is the key issue of IC development. Chen et al. [44] pointed out that recent IC technology development is unusually rapid and technology upgrading in the construction industry assumes the role of a pioneer, promoting the high-quality development of the construction industry. Chen & Ding [45] proposed that the development of domain technology as a hub connecting the underlying general technology with the upper business can play a key role in the development of IC.
Based on the above literature, we made the following assumption:
Hypothesis 10 (H10).
Technology has a positive impact on IC development.
2.3. Hypothesis Model
We constructed a conceptual hypothesis model based on the previous assumptions to clarify the relationship between the influencing factors and IC development, as shown in Figure 2. Then we examined the model by conducting empirical research through a questionnaire and a structural equation model in the following sections.
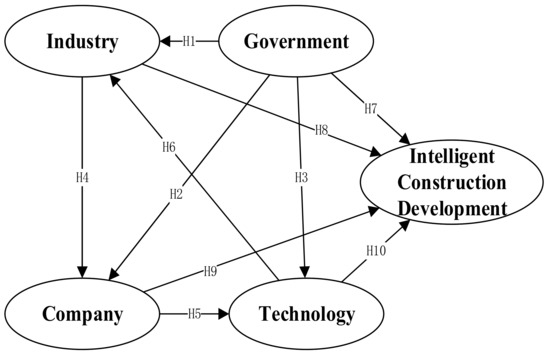
Figure 2.
The conceptual model of the structural equation.
3. Research Methodology
We adopted a three-stage approach to achieve the set objectives shown in Figure 3. First, we proposed 28 measures through relevant literature and expert interviews to assess the five variables in the hypothesis model. Second, we conducted the questionnaires using a five-point Likert scale. Third, we analyzed the questionnaire data through the Harman single-factor test, measures statistical analysis, reliability and validity analysis, and structural equation modeling analysis.
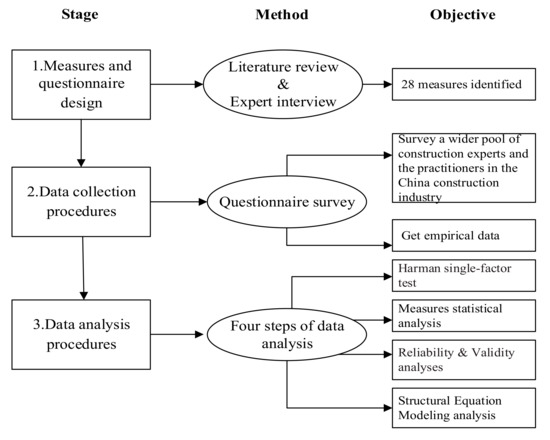
Figure 3.
Three-stage research methodology.
3.1. Stage 1: Measures and Questionnaire Design
The influencing factors for IC development are latent. They are not directly measured and thus need to be specified by some measurement indicators. The measures were proposed in several ways, as listed in the following.
- The mature measurement scales are quoted as far as possible; and
- Most measures are designed based on literature reviews.
The appropriate revision and suggestions from a seven-expert group were incorporated to guarantee the rationality and completeness of the questionnaire measures. The seven-expert group included three practitioners in the construction industry, two government officials, and two scholars involved in IC. In the end, we proposed 28 measures to assess the five variables in the hypothesis model: government (four measures), industry (six measures), company (seven measures), technology (four measures), and trends of IC development (seven measures), as listed in Table 1.

Table 1.
Influencing factors for IC development.
Then we designed the questionnaire based on the 28 measures of the five categories of influencing factors from the Porter Diamond Model Theory. The purpose of the questionnaire was to survey a wider pool of construction experts and practitioners in China’s construction industry to obtain empirical data and determine the relationships of the identified factors. We used a five-point Likert scale [85,86] in the questionnaire: 1–5 respectively represented “strongly disagree”, “disagree”, “neutral”, “agree”, and “strongly agree”, and all the measurement indices were declarative sentences.
3.2. Stage 2: Data Collection Procedure
We collected data by questionnaire. A total of 200 questionnaires were distributed online via a web-based platform. After recovery, 160 valid questionnaires were obtained and the effective recovery rate was 80%. The profile of the respondents is presented in Table 2.
Table 2.
Respondents’ characteristics.
3.3. Stage 3: Data Analysis Procedure
We analyzed the data in the four steps shown in Figure 4.
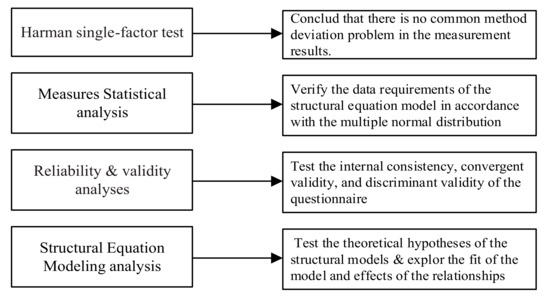
Figure 4.
Four steps of data analysis.
First, all questionnaire questions were analyzed for gender factors through the Harman single-factor test. The variance interpretation rate of the first principal component obtained in the absence of rotation was 10.642%, which did not account for the majority. From the result of the composition matrix, the load of no question on the first main component exceeded 0.5. Therefore, it can be concluded that there was no common method deviation problem in the measurement results.
Second, we examined the correlation, collinearity, and normality of the variables. The thresholds of absolute skewness, absolute kurtosis, and variance inflation factor (VIF) were all less than or equal to 2, 7, and 5, respectively [87,88]. Finally, since the parameter estimation method in structural equation model analysis requires sample data to satisfy the multiple normal distributions, we tested the survey results for normal distribution. Table 3 shows the data that meet the requirements of the structural equation model under the multiple normal distributions.
Table 3.
The result of measures statistical analysis.
Third, we used the Kaiser-Meyer-Olkin (KMO) measure and Bartlett samples to test whether the data are suitable for factor analysis and the validity of the data. Experience showed that a KMO greater than 0.7 is suitable for factor analysis and KMO below 0.5 indicates unsuitable [89,90]. KMO and Barclay spherical significance tests of the study data were performed using SPSS and the results are shown in Table 4 and Table 5, indicating that the research data were suitable for the principal component analysis.
Table 4.
The result of Kaiser-Meyer-Olkin.
Table 5.
The result of Bartlett.
Reliability is the overall consistency of a measure [91]. Cronbach’s alpha test was performed to check the reliability of questions or items, which is much higher than the threshold of 0.70 [92], indicating internal consistency of the items and high data reliability. The Cronbach values of the five variables were higher than 0.7, as shown in Table 6, which denotes the high robustness and stability of the questionnaire.
Table 6.
Results of measuring model validity.
Fourth, as SEM is an appropriate technique for multivariate analysis that integrates factor analysis, path analysis, and multiple regression analysis [17,93], we used it to create the conceptual model and test the theoretical hypotheses of the structural models.
4. Research Results
We tested the aforementioned hypothesized model (Figure 2) with the SEM technique.
First, we used the standardized factor loading test for the measures, then we estimated the path coefficient by the maximum likelihood method and removed the path data indexes. Furthermore, we tested the model by factor analysis and repeated the above steps until the indexes were qualified. Finally, we got the verified model.
4.1. Data Results
First, through the calculation results, the 28 measures in which the loadings of the measurement variables and potential variables are more than 0.6 were retained. The revised indicators and the standardized load of each index are shown in Table 7.
Table 7.
Results of the measures.
Second, the maximum likelihood method was used to estimate the path coefficient, in which C.R. (i.e., t-test value) is the critical ratio. (1) in H1, T = 2.612, p = 0.319 > 0.05, indicating that the government has no direct relationship to industry development; (2) in H3, T = 0.124, p = 0.409 > 0.05, indicating that the government has no direct relationship to technology; (3) in H8, T = −1.012, p = 137 > 0.05, indicating that the industry has no direct relationship to the development of IC. Therefore, H1, H3, and H8 were removed, and the revised model test results are shown in Table 8, where all hypothesis tests passed.
Table 8.
Results of the model test.
The revised model was again tested for factor analysis. Each fitted indicator is shown in Table 9, and each indicator was within the standard range, so it could be considered that the model’s overall fit is acceptable without the need for another correction.
Table 9.
Calculation results of the fitting index of the modified model.
Three main indices of the overall model fit were adopted in this paper to confirm the measurement model: the relative χ2 (χ2/degree of freedom), root-mean-square error of approximate (RMSEA), and comparative fit index (CFI). The upper thresholds of the relative χ2/df and RMSEA were 3 and 0.08, respectively, while the lower threshold of CFI was 0.90 [94]. As shown in Table 9, χ2/df of the model was less than 3; RMSEA was less than 0.08, indicating that the model was reasonable and not affected by the sample size; and CFI was greater than 0.9, meaning that the sample was stable.
4.2. Verified Model
The hypothesis model was verified through SEM, as shown in Figure 5.
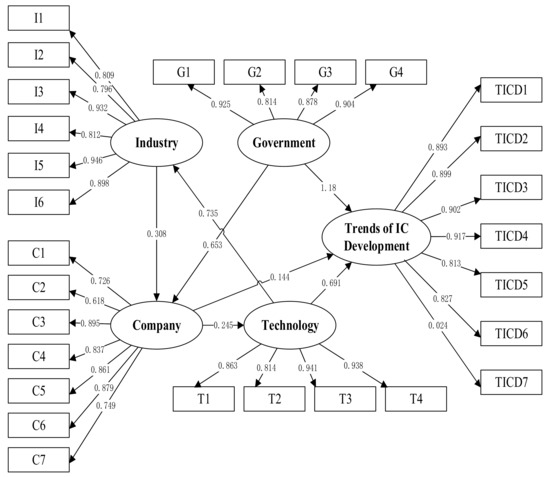
Figure 5.
Influencers acting on the IC development mechanism model.
Taking into account these results of the model test, we summarized further conclusions as follows:
- (1)
- The three variables of government, company and technology directly and significantly impacted IC development. These path coefficients were 1.18, 0.144, and 0.691, respectively. Although each path was significant, the coefficient load values were generally low, especially the impact of company, which means that the impact of company on IC was still at a low level.
- (2)
- Industry did not directly affect the development of IC but rather indirectly affected the development of IC through company and technology. These three endogenous variables of industry, company, and technology form a “closed-loop” within which the three elements interact and promote each other.
- (3)
- The standardized factor loading of TICD7 was 0.024 and less than the factor loadings of the trend of IC development, which shows that it was widely accepted that IC development has a bright outlook in China and IC can certainly change the relative backwardness of China’s construction industry through the upgrading of technology, industry, and company.
5. Discussion
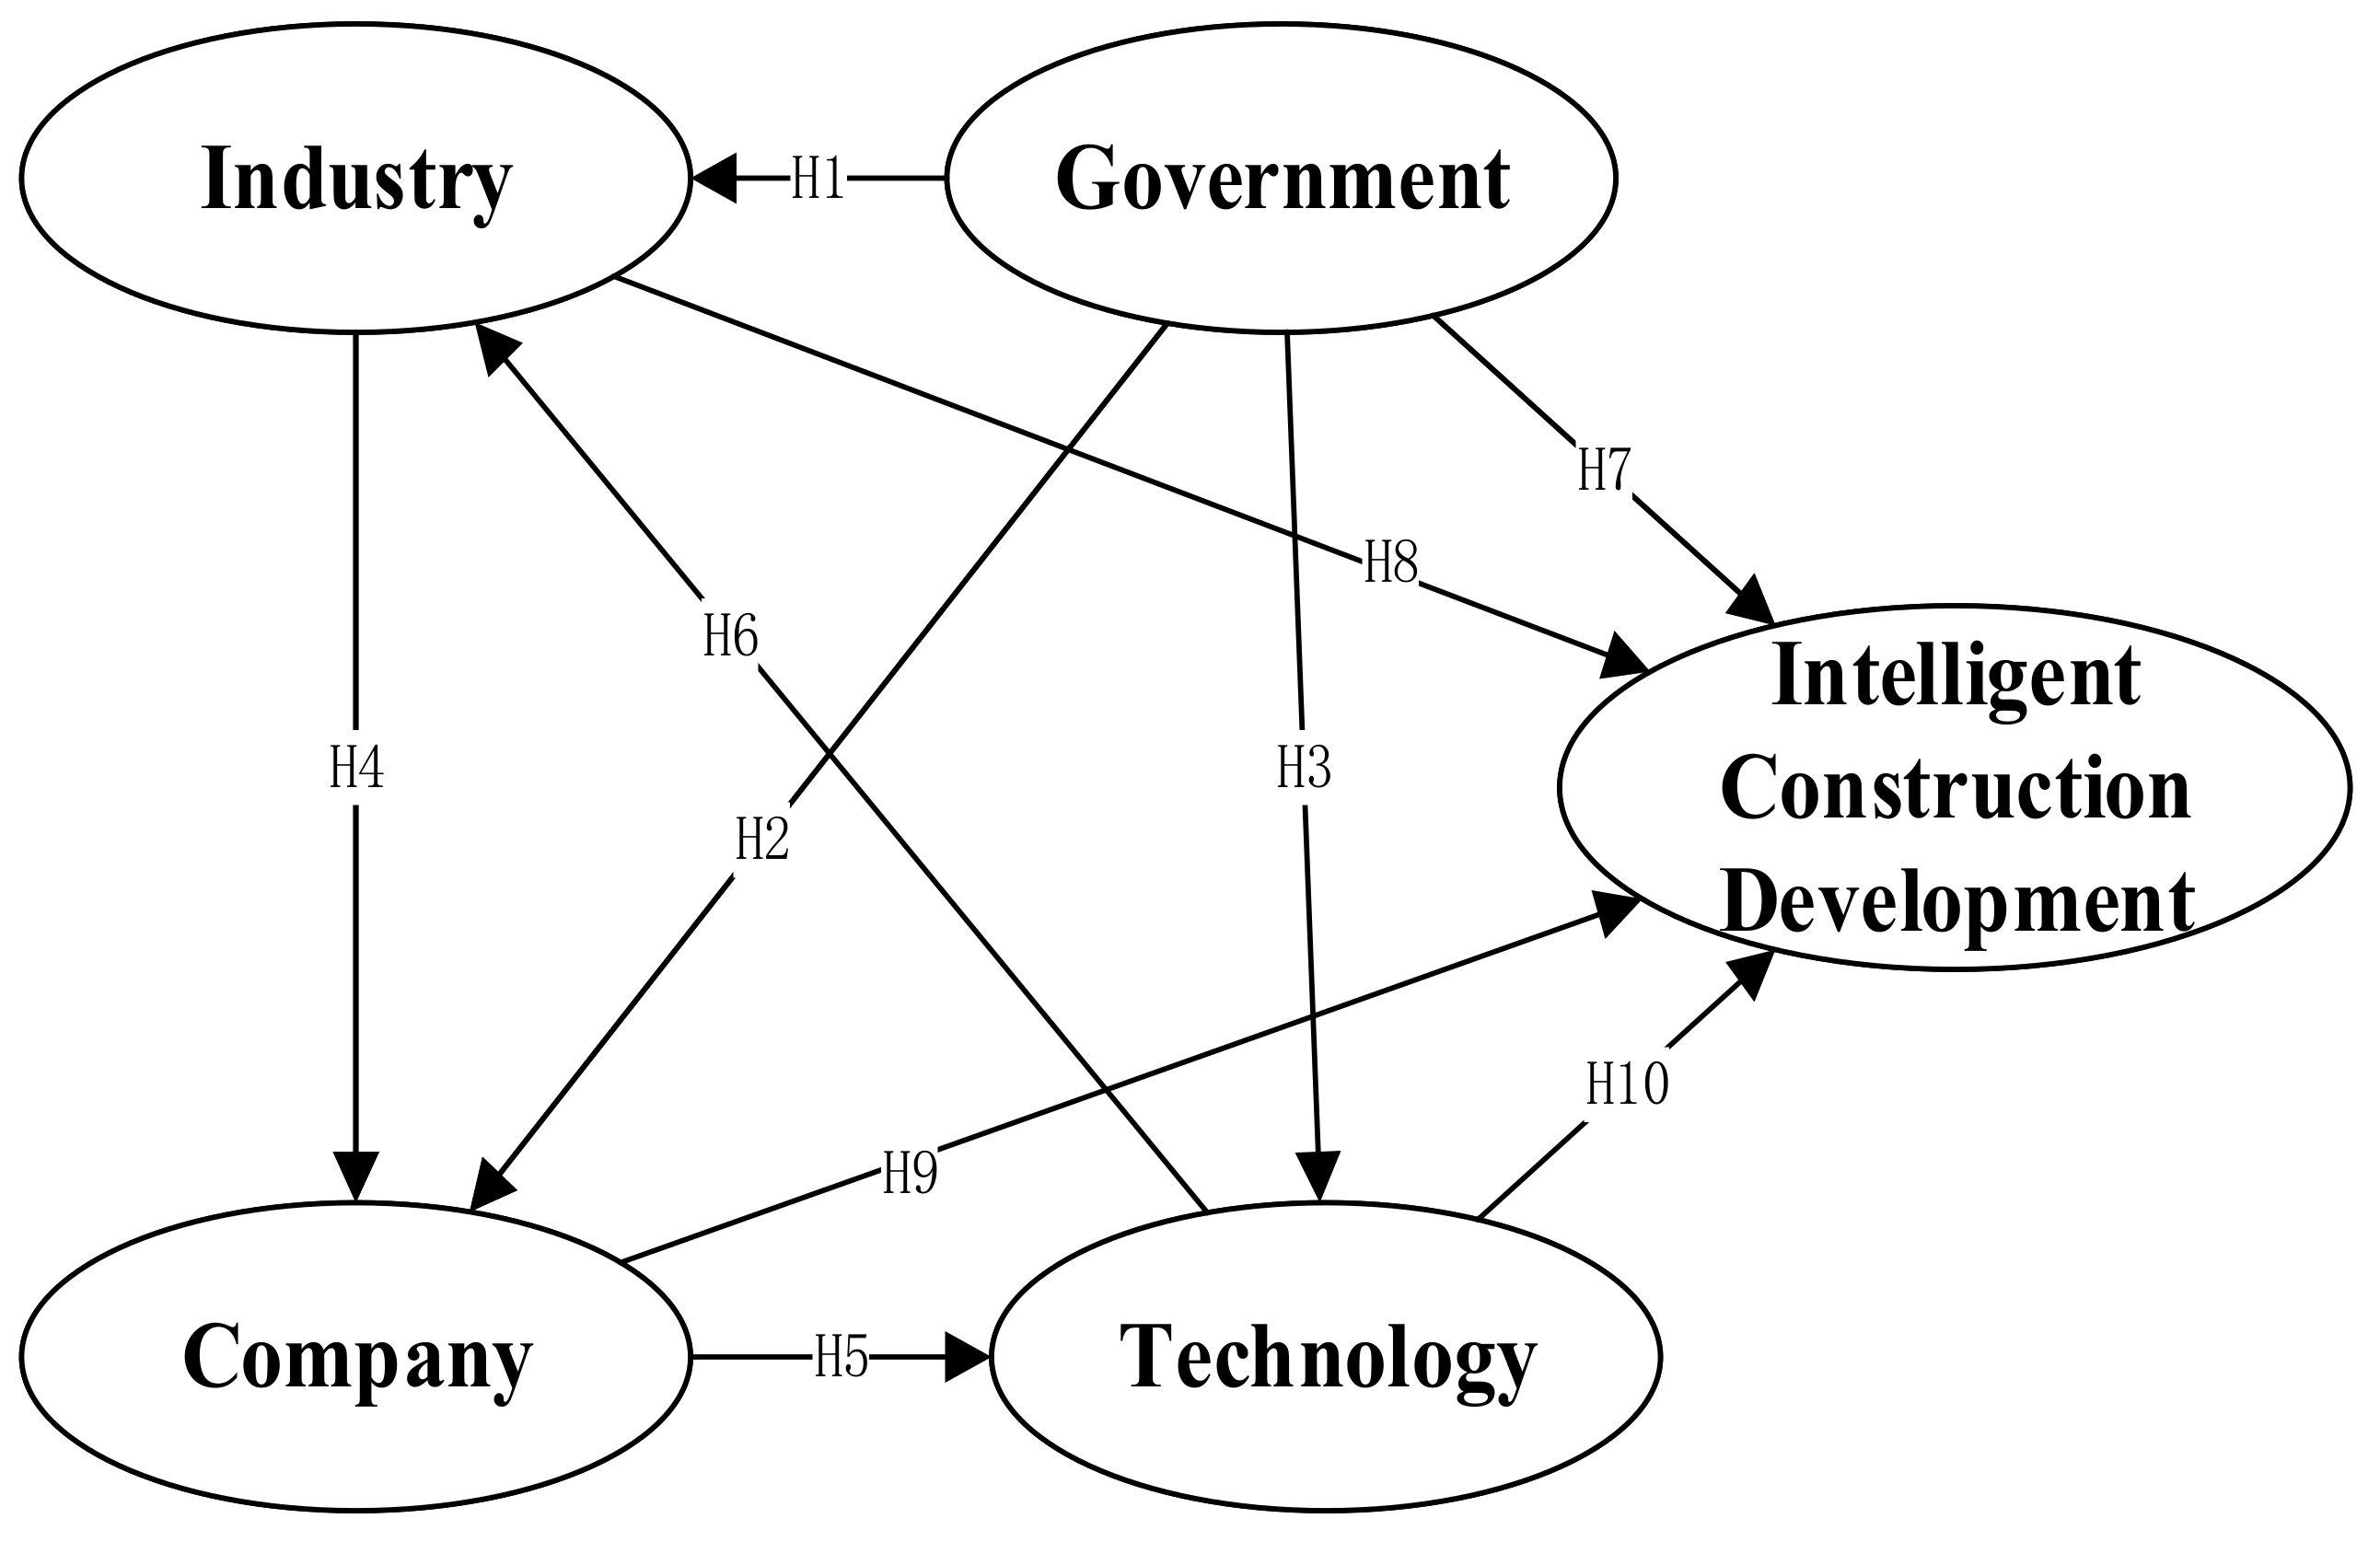
Based on the final model, we further summarized the paths among factors and identify key measures, hoping to provide a reference for the government and companies to formulate development strategies.
5.1. Path Analyses
- (1)
- Government→Company→Technology→IC development. On the one hand, the introduction of policies forces companies to carry out IC development; on the other hand, preferential subsidies support companies in carrying out IC activities. As a result, companies vigorously carry out relevant practical activities, form a new industrial system, stimulate construction activities and the application of innovative technology, and improve the basic endowment of the development of the construction industry. The emergence of innovative technology also contributes to the development of the construction industry.
- (2)
- Government→Company→Industries→IC development. The government’s initiation and support has given birth to various companies with new business in the field of IC, increasing the complexity of corporate relations and the degree of competition within the industry. In contrast, this trend forces companies to change their management models and improve effectiveness to adapt to environmental changes. The adjustments and changes in corporate relationships reconstruct the industrial ecology, including the business model, business philosophy, market form, and industry management, creating a new steady state of IC industry development.
- (3)
- Technology→Industry→Company→Technology→IC development. The iterative application of technology innovation affects the adjustment and development status of the industry’s development. Therefore, industry development trends guide the direction of company development and companies adjust their development strategies, paying attention to investment in technological innovation and application and gradually forming a certain scale and level of economic benefits of IC and development of new industrial forms.
- (4)
- Company→Technology→Industry→Company→IC development. Companies are the core of technological innovation and development. Intelligent technologies change the traditional working model of the construction industry which provides a realistic basis for IC development. Following the trend, more companies participate in the intelligent transformation.
5.2. Measures Analyses
The measures of the variables in the model were further analyzed. The standardized factor loading indicates the relationship between the variables and the measure; the higher the loading is, the closer the relationship with the corresponding variables. The indicator can be used as the basis for ordering the importance of the observed variables, and the order is shown in Table 10.
Table 10.
Order of measures.
- (1)
- Among the government measures, the degree of government attention was the most important. This result is in line with the current state of IC development in China. At present, most companies have recognized the necessity of upgrading and have a positive attitude toward development prospects. However, companies directly engaged in IC projects need to pay huge costs, so most have been in a wait-and-see state. In the above environment, the government was the most critical stakeholder. Survey data and the state of IC development in China showed that IC development depends on government policies. On the one hand, the government has a certain mandatory role; on the other hand, it provides preferential subsidies to encourage companies to carry out IC activities to protect companies motivated to undertake IC.
- (2)
- Among the industry measures, the number and type of IC companies were of the utmost importance. In the infancy of IC development, most IC technology still belongs to the companies of developed countries. There is an urgent need for more companies to improve the ability to develop IC technology with independent intellectual property rights.
- (3)
- Among the company measures, the resource input of companies was the most important. Most Chinese construction companies did not pay attention to IC in the past. Therefore, there currently exists a huge gap between actual development and the vision of IC. In contributing to bridging this gap, a significant amount of resource input is needed to compensate for the backward development caused by traditional production methods so that it is possible to meet the current stage of IC development.
- (4)
- Among the measures of technology, hardware and software facilities were the most important. Since most of the core technologies related to IC still belong to companies in developed countries, the application of IC technologies is limited. It is difficult for companies in China to find suitable hardware and software services companies to assist in construction projects.
5.3. Recommendations
Based on the above analysis, we propose the following strategies to enhance IC development:
- (1)
- Understand the general path driving the development of IC. The process of influencing the development of IC has a certain regularity. Therefore, it is necessary to understand the influencing factors that employ the important role for its maximum utility and vigorously promote the development process of IC.
- (2)
- Emphasize and play the role of policies. It is necessary to promulgate effective policies to ensure and encourage the willingness of relevant entities to practice IC, develop and improve the market, and establish a long-term force to promote IC development. In addition, the government should pay attention to the development and changes of IC to make corresponding policy adjustments to form a virtuous circle.
- (3)
- Increase investment in research and development and overcome technical barriers. Different companies need to formulate appropriate integrated development plans and policy choices according to their business characteristics and foundation and carry out innovative research and development to promote the coordinated development of the IC industry.
6. Conclusions
IC is the key to adapting to the trend of intelligent development of the global construction industry, which involves multiple factors. This paper contributed to identifying and determining these factors through literature analysis and clarifying paths and key measures through SEM, which can help the government and companies better understand IC development and provide a basis for the later introduction of policies and practice acceleration. Simultaneously, this paper offered a generalizable reference for other countries to develop IC.
In this paper, we analyzed the influence paths and key measures affecting IC development by SEM. This paper achieved the following results:
- (1)
- We identified the following four variables that influence IC development: government, industry, company, and technology. Moreover, we built the conceptual model.
- (2)
- Based on SEM method, we obtained four influence paths: (1) Government→company→technology→IC development; (2) Government→company→industries→IC development; (3) Technology→industry→company→technology→IC development; and (4) Company→technology→industry→company→IC development, which indicates that the government has a significant direct impact on the development of IC.
- (3)
- We further analyzed the key measures of government, industry, company, and technology: the degree of government attention, the number and development capability of IC technology development companies, resource input, and hardware and software facilities.
- (4)
- We proposed some recommendations to promote IC development.
This research contributed to the body of knowledge on IC by identifying the factors that influence IC development. The four paths and key measures were proposed to clarify the relationship between factors. Recommendations were put forward to promote IC development. Construction industries globally can leverage the factors influencing IC development in this research, which provides a valuable reference for further contextual investigations in their regions. Although the context of this study was China, the study findings can provide references for IC development in the construction industry globally, especially in those countries whose construction industries are in similar stages of development.
Author Contributions
Conceptualization, X.Y. and T.L.; writing—original draft preparation, X.Y. and T.L.; writing—review and editing, X.Y. and T.L.; investigation, W.G. and F.Z.; Data collection, W.G.; Data analysis, F.Z.; project administration, X.Y.; funding acquisition, X.Y. All authors have read and agreed to the published version of the manuscript.
Funding
This research was funded by the Project of 2020 Scientific and Innovative Action Plan of the Shanghai Science and Technology Commission: “Research on the Key Issues and Countermeasures of the Transformation of Traditional Industries Driven by Digital Technology-The Origin, Architecture and Realization of the Intelligent Construction Mode of the Construction Industry”, grant number 20692101300.
Data Availability Statement
Some or all data, models, or code generated or used during the study are available from the corresponding author by request.
Acknowledgments
The authors are very thankful for the anonymous referees and editors whose suggestions and comments helped to improve the manuscript quality.
Conflicts of Interest
The authors declare that they have no conflict of interest. The funders had no role in the design of the study; in the collection, analyses, or interpretation of data; in the writing of the manuscript, or in the decision to publish the results.
References
- Guo, P.; Tian, W.; Li, H.; Zhang, G.; Li, J. Global characteristics and trends of research on construction dust: Based on bibliometric and visualized analysis. Environ. Sci. Pollut. Res. 2020, 27, 37773–37789. [Google Scholar] [CrossRef] [PubMed]
- Giel, B.K.; Issa, R. Return on investment analysis of using building information modeling in construction. J. Comput. Civ. Eng. 2013, 27, 511–521. [Google Scholar] [CrossRef]
- Arunothayan, A.R.; Nematollahi, B.; Ranade, R.; Bong, S.H.; Sanjayan, J. Development of 3D-printable ultra-high performance fiber-reinforced concrete for digital construction. Constr. Build. Mater. 2020, 257, 119546. [Google Scholar] [CrossRef]
- Štefanič, M.; Stankovski, V. A review of technologies and applications for smart construction. Proc. Inst. Civ. Engineers. 2018, 172, 83–87. [Google Scholar] [CrossRef] [Green Version]
- Perrier, N.; Bled, A.; Bourgault, M.; Cousin, N.; Danjou, C.; Pellerin, R.; Roland, T. Construction 4.0: A survey of research trends. J. Inf. Technol. Constr. 2020, 25, 416–437. [Google Scholar] [CrossRef]
- Sawhney, A.; Riley, M.; Irizarry, J.; Perez, T.C. A proposed framework for Construction 4.0 based on a review of Literature. In Proceedings of the 56th Annual Associated Schools of Construction (ASC) International Conference_ASC, Liverpool, UK, 15–18 April 2020; EasyChair: Lancaster, UK, 2020. [Google Scholar]
- Ding, L.Y. Digital Construction Introduction; China Building Industry Press: Beijing, China, 2019. [Google Scholar]
- Zhong, D.; Liu, X.; Cui, B.; Wu, B.; Liu, Y. Technology and application of real-time compaction quality monitoring for earth-rockfill dam construction in deep narrow valley. Autom. Constr. 2018, 90, 23–38. [Google Scholar] [CrossRef]
- Zhang, D. Application of GIS+BIM technology in underground Pipe Gallery. Low Temp. Archit. Technol. 2019, 41, 121–123+133. [Google Scholar]
- Al-Hammadi, M.A.; Tian, W. Challenges and barriers of building information modeling adoption in the Saudi Arabian construction industry. Open Constr. Build. Technol. J. 2020, 14, 98–110. [Google Scholar] [CrossRef]
- Liao, L. Research on the application of BIM technology in the cost management of construction projects. IOP Conf. Ser. Earth Environ. Sci. 2021, 783, 012098. [Google Scholar] [CrossRef]
- Zaid, N.U.B.M.; Hamzah, N.; Khoiry, M.A. Review building information modelling for infrastructure: Benefits for constructor. J. Comput. Theor. Nanosci. 2020, 17, 620–628. [Google Scholar] [CrossRef]
- Jia, H.; Dong, S.; Fu, S. Application of BIM technology in intelligent construction and installation of prefabricated buildings. Constr. Technol. 2018, 22, 40–43. [Google Scholar]
- Zhang, Q.; Liu, T.; Zhang, Z.; Huang, F.Z.; Li, Q.; An, Z. Unmanned rolling compaction system for rockfill materials. Autom. Constr. 2019, 100, 103–117. [Google Scholar] [CrossRef]
- Kim, S.; Peavy, M.; Huang, P.C.; Kim, K. Development of BIM-integrated construction robot task planning and simulation system. Autom. Constr. 2021, 127, 103720. [Google Scholar] [CrossRef]
- Pan, M.; Pan, W. Determinants of adoption of robotics in precast concrete production for buildings. J. Manag. Eng. 2019, 35, 05019007. [Google Scholar] [CrossRef]
- Huang, Y.; Trinh, M.T.; Le, T. Critical factors affecting intention of use of augmented hearing protection technology in construction. J. Constr. Eng. Manag. 2021, 147, 04021088. [Google Scholar] [CrossRef]
- Besklubova, S.; Skibniewski, M.J.; Zhang, X. Factors affecting 3D printing technology adaptation in construction. J. Constr. Eng. Manag. 2021, 147, 04021026. [Google Scholar] [CrossRef]
- Craveiroa, F.; Duartec, J.P.; Bartoloa, H.; Bartolod, P.J. Additive manufacturing as an enabling technology for digital construction: A perspective on Construction 4.0. Autom. Constr. 2019, 103, 251–267. [Google Scholar] [CrossRef]
- Ghaffar, S.H.; Corker, J.; Fan, M. Additive manufacturing technology and its implementation in construction as an eco-innovative solution. Autom. Constr. 2018, 93, 1–11. [Google Scholar] [CrossRef]
- Yuan, X.; Chen, Y.W.; Fan, H.B.; He, W.H.; Ming, X.G. Collaborative construction industry integrated management service system framework based on Big Data. In Proceedings of the 2019 IEEE International Conference on Industrial Engineering and Engineering Management (IEEM), Macao, China, 15–18 December 2019; IEEE: Piscataway, NJ, USA, 2019; pp. 1521–1525. [Google Scholar] [CrossRef]
- Wang, Y.; Lee, H.W.; Tang, W.; Whittington, J.; Qiang, M. Structural equation modeling for the determinants of international infrastructure investment: Evidence from Chinese contractors. J. Manag. Eng. 2021, 37, 04021033. [Google Scholar] [CrossRef]
- Chen, K.; Ding, L.Y. Strategic thinking on technology development in key fields of intelligent construction in China. Strateg. Study CAE 2021, 23, 64–70. [Google Scholar]
- Xiahou, X.; Yuan, J.; Liu, Y.; Tang, Y.; Li, Q. Exploring the driving factors of construction industrialization development in China. Int. J. Environ. Res. Public Health 2018, 15, 442. [Google Scholar] [CrossRef] [PubMed] [Green Version]
- Simachev, Y.; Kuzyk, M.; Feygina, V. Public support for innovation in Russian firms: Looking for improvements in corporate performance quality. Int. Adv. Econ. Res. 2015, 21, 13–31. [Google Scholar] [CrossRef]
- David, P.A.; Hall, B.H.; Toole, A.A. Is public R&D a complement or substitute for private R&D? A review of the econometric evidence. Res. Policy 2000, 29, 497–529. [Google Scholar]
- Tzelepis, D.; Skuras, D. The effects of regional capital subsidies on firm performance: An empirical study. J. Small Bus. Enterp. Dev. 2004, 11, 121–129. [Google Scholar] [CrossRef]
- Czarnitzki, D.; Toole, A.A. Business R&D and the interplay of R&D subsidies and product market uncertainty. Rev. Ind. Organ. 2007, 31, 169–181. [Google Scholar]
- Yan, J.J.; Feng, J.Y. An empirical study on the impact of government innovation subsidy timing on enterprise technology leapfrogging. Theory Pract. Financ. Econ. 2021, 42, 98–105. [Google Scholar]
- Li, X.A.; Shi, G.Q. On the influence of consumption demand change to industrial structure adjustment. J. Hohai Univ. (Philos. Soc. Sci.) 2002, 4, 34–36. [Google Scholar]
- Wang, M.Y.; Li, Y.M.; Zhang, H.; Wang, H. Model construction and path analysis of green technology innovation driven by market orientation. Sci. Technol. Prog. Policy 2019, 36, 112–120. [Google Scholar]
- Zhang, G.L.; Zhou, H.R.; Liao, J.Q. The impact of organizational structure on technological innovation from the perspective of knowledge transfer. Sci. Sci. Manag. S. T. 2009, 30, 78–84. [Google Scholar]
- Miu, G.H.; Chen, W.M.; Tang, C.Y. A study on the influencing factors of talent aggregation in high-tech Enterprises—A case study of Commercial Aircraft Corporation of China LTD. Sci. Technol. Manag. Res. 2013, 33, 120–122+128. [Google Scholar]
- Duan, X. Research on the effectiveness of enterprise R&D investment, technological innovation and resource investment. Stat. Decis. 2020, 36, 183–186. [Google Scholar]
- Perkmann, M.; Walsh, K. The two faces of collaboration: Impacts of university-industry relations on public research. Ind. Corp. Change 2009, 18, 1033–1065. [Google Scholar] [CrossRef]
- Fang, C.; Lai, Y.; Wen, Z. Research on key technologies of intelligent integrated system for architectural design enterprises. IOP Conf. Ser. Earth Environ. Sci. 2020, 455, 012209. [Google Scholar] [CrossRef]
- Schumpeter, J. Capitalism, Socialism and Democracy; George Allen & Unwin Publishers: London, UK, 1942. [Google Scholar]
- Zhou, J.; Li, P.; Zhou, Y.; Wang, B.; Zang, J.; Meng, L. Toward new-generation intelligent manufacturing. Engineering 2018, 4, 11–20. [Google Scholar] [CrossRef]
- Luo, X.F.; Li, B.Z. The driving mechanism of new product demand on original innovation of large enterprises: An empirical study based on the comparison between domestic market and foreign market. Sci. Technol. Prog. Policy 2013, 30, 73–76. [Google Scholar]
- Lu, C.; Liu, J.; Liu, Y.; Liu, Y. Intelligent construction technology of railway engineering in China. Front. Eng. Manag. 2019, 6, 503–516. [Google Scholar] [CrossRef]
- Wang, Y.S.; Su, B.Y.; Zhang, Y.B.; Wu, T.Y. Study on the influence of industrial agglomeration on total factor Productivity of construction industry. Build. Econ. 2020, 41, 9–14. [Google Scholar]
- Mao, C.; Zhou, Y. Analysis of core enterprise supply chain organization structure of intelligent construction industry. Constr. Econ. 2021, 42, 14–18. [Google Scholar]
- Xia, X.G. Technological innovation practice of railway construction enterprises under the background of intelligent construction. Constr. Econ. 2020, 41, 43–47. [Google Scholar]
- Chen, F.; Zhu, J.; Wang, W. Driving force of industrial technology innovation: Coevolution of multistage overseas M&A integration and knowledge network reconfiguration. J. Bus. Ind. Mark. 2021, 36, 1344–1357. [Google Scholar]
- Zhang, J.; Long, Y.; Lv, S.; Xiang, Y. BIM-enabled modular and industrialized construction in China. Procedia Eng. 2016, 145, 1456–1461. [Google Scholar] [CrossRef] [Green Version]
- Ogunrinde, O.; Nnaji, C.; Amirkhanian, A. Application of emerging technologies for highway construction quality management: A review. In Proceedings of the Construction Research Congress 2020: Project Management and Controls, Materials, and Contracts, Tempe, AZ, USA, 8–10 March 2020; pp. 1030–1039. [Google Scholar] [CrossRef]
- Mao, C.; Zhang, L.M. Core industry selection of intelligent construction industry chain. J. Eng. Manag. 2021, 35, 1–6. [Google Scholar] [CrossRef]
- Liu, Z.S.; Liu, S.N.; Zhao, Y.H.; Du, X.L. Development status and future trend of intelligent construction technology. Constr. Technol. 2019, 50, 772–779. [Google Scholar]
- Hsiao, J.S.; Chen, J.C.P.; Shin-Jyun, T.L. Implementation of certified intelligent building in Taiwan. IOP Conf. Ser. Mater. Sci. Eng. 2019, 652, 012006. [Google Scholar] [CrossRef]
- Shi, F.; Wang, Q.; Wang, Y. Research on Top-Level redesign of smart construction system based on case study. In Proceedings of the ICCREM 2019: Innovative Construction Project Management and Construction Industrialization, Banff, AB, Canada, 21–24 May 2019; pp. 117–124. [Google Scholar] [CrossRef]
- Lin, M.; Wang, Q.; Wang, M.; Li, J. Exploration and practice of intelligent construction in island tunnel project of Hong Kong-Zhuhai-Macao Bridge. Sci. Technol. Prog. Policy 2018, 5, 81–85. [Google Scholar]
- Binesmael, M.; Li, H.; Lark, R. Meta-standard for collaborative BIM standards: An analysis of UK BIM level 2 standards. Work. Conf. Virtual Enterp. 2018, 534, 661–668. [Google Scholar]
- Chen, Y.; Yin, Y.; Browne, G.J.; Li, D. Adoption of building information modeling in Chinese construction industry: The technology-organization-environment framework. Engineering, construction and architectural management. Eng. Constr. Archit. Manag. 2019, 26, 1878–1898. [Google Scholar] [CrossRef]
- Wang, G.M. Research on the implementation path of promoting the collaborative development of intelligent construction and new building industrialization. Hous. Ind. 2020, 263, 12–15. [Google Scholar]
- Chen, B.; Wan, J.; Shu, L.; Li, P.; Mukherjee, M.; Yin, B. Smart factory of industry 4.0: Key technologies, application case, and challenges. IEEE Access 2018, 6, 6505–6519. [Google Scholar] [CrossRef]
- Fitz, D.V.; Saleeb, N. Examining the quality and management of non-geometric building information modelling data at project hand-over. Archit. Eng. Des. Manag. 2019, 15, 297–310. [Google Scholar] [CrossRef]
- Zhu, W. Intelligent construction and management of thermal power plant based on internet+ mode. IOP Conf. Ser. Earth Environ. Sci. 2019, 252, 032068. [Google Scholar] [CrossRef]
- Shilan, L. Application research of computer information technology in intelligent building engineering management. In Proceedings of the 2019 11th International Conference on Measuring Technology and Mechatronics Automation (ICMTMA),Qiqihar, China, 28–29 April 2019; IEEE: Piscataway, NJ, USA, 2019; pp. 136–140. [Google Scholar]
- He, R.; Li, M.; Gan, V.J.; Ma, J. BIM-enabled computerized design and digital fabrication of industrialized buildings: A case study. J. Clean. Prod. 2021, 278, 123505. [Google Scholar] [CrossRef]
- Siebelink, S.; Voordijk, J.T.; Adriaanse, A. Developing and testing a tool to evaluate BIM maturity: Sectoral analysis in the Dutch construction industry. J. Constr. Eng. Manag. 2018, 144, 05018007. [Google Scholar] [CrossRef]
- Mesároš, P.; Mandičák, T.; Behúnová, A. Use of BIM technology and impact on productivity in construction project management. Wirel. Netw. 2020, 28, 855–862. [Google Scholar] [CrossRef]
- Bahrami, S.; Atkin, B.; Landin, A. Innovation diffusion through standardization: A study of building ventilation products. J. Eng. Technol. Manag. 2019, 54, 56–66. [Google Scholar] [CrossRef]
- Bademosi, F.; Issa, R.R. Factors Influencing Adoption and Integration of Construction Robotics and Automation Technology in the US. J. Constr. Eng. Manag. 2021, 147, 04021075. [Google Scholar] [CrossRef]
- Cesnik, J.; Zibert, M.; Lah, M.; Skalja, M. Required model content and information workflows enabling proficient BIM usage. IOP Conf. Ser. Mater. Sci. Eng. 2019, 603, 032074. [Google Scholar] [CrossRef]
- Becerik-Gerber, B.; Jazizadeh, F.; Li, N.; Calis, G. Application areas and data requirements for BIM-enabled facilities management. J. Constr. Eng. Manag. 2012, 138, 431–442. [Google Scholar] [CrossRef]
- Pishdad-Bozorgi, P.; Gao, X.; Eastman, C.; Self, A.P. Planning and developing facility management-enabled building information model (FM-enabled BIM). Autom. Constr. 2018, 87, 22–38. [Google Scholar] [CrossRef]
- Villena, F.; García-Segura, T.; Pellicer, E. Drivers of innovation using BIM in architecture, engineering, and construction firms. In Proceedings of the Construction Research Congress 2020: Project Management and Controls, Materials, and Contracts, Tempe, AZ, USA, 8–10 March 2020; pp. 210–222. [Google Scholar] [CrossRef]
- Yafeng, W. Research on the intelligent construction of prefabricated building and personnel training based on BIM5D. J. Intell. Fuzzy Syst. 2021, 40, 8033–8041. [Google Scholar]
- Joshi, S.; Hamilton, M.; Warren, R.; Faucett, D.; Tian, W.; Wang, Y.; Ma, J. Implementing virtual reality technology for safety training in the precast/prestressed concrete industry. Appl. Ergon. 2021, 90, 103286. [Google Scholar] [CrossRef] [PubMed]
- Qi, B.; Razkenari, M.; Li, J.; Costin, A.; Kibert, C.; Qian, S. Investigating US industry practitioners’ perspectives towards the adoption of emerging technologies in industrialized construction. Buildings 2020, 10, 85. [Google Scholar] [CrossRef]
- Ahuja, R.; Sawhney, A.; Arif, M. Developing organizational capabilities to deliver lean and green project outcomes using BIM. Eng. Constr. Archit. Manag. 2018, 25, 1255–1276. [Google Scholar] [CrossRef]
- Nasir, A.R.; Bargstädt, H.J. An approach to develop video tutorials for construction tasks. Procedia Eng. 2017, 196, 1088–1097. [Google Scholar] [CrossRef]
- Pradeep, A.S.E.; Yiu, T.W.; Zou, Y.; Amor, R. Blockchain-aided information exchange records for design liability control and improved security. Autom. Constr. 2021, 126, 103667. [Google Scholar] [CrossRef]
- McNamara, A.; Sepasgozar, S.M. Barriers and drivers of Intelligent Contract implementation in construction. Management 2018, 143, 02517006. [Google Scholar]
- McNamara, A.J.; Sepasgozar, S.M. Intelligent contract adoption in the construction industry: Concept development. Autom. Constr. 2021, 122, 103452. [Google Scholar] [CrossRef]
- Wang, X.; Wang, S.; Song, X.; Han, Y. IoT-Based intelligent construction system for prefabricated buildings: Study of operating mechanism and implementation in China. Appl. Sci. 2020, 10, 6311. [Google Scholar] [CrossRef]
- Kochovski, P.; Stankovski, V. Supporting smart construction with dependable edge computing infrastructures and applications. Autom. Constr. 2018, 85, 182–192. [Google Scholar] [CrossRef]
- Vishnivetskaya, A.; Mikhailova, A. Employment of BIM technologies for residential quarters renovation: Global experience and prospects of implementation in Russia. IOP Conf. Ser. Mater. Sci. Eng. 2019, 497, 012020. [Google Scholar] [CrossRef] [Green Version]
- Davtalab, O.; Kazemian, A.; Khoshnevis, B. Perspectives on a BIM-integrated software platform for robotic construction through Contour Crafting. Autom. Constr. 2018, 89, 13–23. [Google Scholar] [CrossRef]
- Zhao, Z.Y.; Xu, K.; Zuo, J.; Tang, C. Developing the international construction contracting market: Enterprise niche approach. J. Manag. Eng. 2017, 33, 04016027. [Google Scholar] [CrossRef]
- Osorio-Gomez, C.C.; Moreno-Falla, M.J.; Ospina-Alvarado, A.; Ponz-Tienda, J.L. Lean construction and BIM in the value chain of a construction company: A case study. In Proceedings of the Construction Research Congress 2020: Project Management and Controls, Materials, and Contracts, Tempe, AZ, USA, 8–10 March 2020; pp. 368–378. [Google Scholar] [CrossRef]
- Tranchant, A.; Beladjine, D.; Beddiar, K. BIM in French smes: From innovation to necessity. WIT Trans. Built Environ. 2017, 169, 135–142. [Google Scholar]
- Meng, Q.; Zhang, Y.; Li, Z.; Shi, W.; Wang, J.; Sun, Y.; Wang, X. A review of integrated applications of BIM and related technologies in whole building life cycle. Eng. Constr. Archit. Manag. 2020, 27, 1647–1677. [Google Scholar] [CrossRef]
- Xu, X.; Wang, Y.; Tao, L. Comprehensive evaluation of sustainable development of regional construction industry in China. J. Clean. Prod. 2019, 211, 1078–1087. [Google Scholar] [CrossRef]
- Dawes, J. Do data characteristics change according to the number of scale points used? An experiment using 5-point, 7-point and 10-point scales. Int. J. Mark. Res. 2008, 50, 61–104. [Google Scholar] [CrossRef]
- Joshi, A.; Kale, S.; Chandel, S.; Pal, D.K. Likert scale: Explored and explained. Br. J. Appl. Sci. Technol. 2015, 7, 396. [Google Scholar] [CrossRef]
- O’Brien, R.M. A caution regarding rules of thumb for variance inflation factors. Qual. Quant. 2007, 41, 673–690. [Google Scholar] [CrossRef]
- Pektas, A.O. Determining the essential parameters of bed load and suspended sediment load. Int. J. Glob. Warm. 2015, 8, 335–359. [Google Scholar] [CrossRef]
- Hadi, N.U.; Abdullah, N.; Sentosa, I. An easy approach to exploratory factor analysis: Marketing perspective. J. Educ. Soc. Res. 2016, 6, 215. [Google Scholar]
- Williams, B.; Onsman, A.; Brown, T. Exploratory factor analysis: A five-step guide for novices. Australas. J. Paramed. 2010, 8, 1–13. [Google Scholar] [CrossRef] [Green Version]
- Elhendawi, A.I.N. Methodology for BIM Implementation in KSA in AEC Industry. Master’s Thesis, Edinburgh Napier University, Edinburgh, UK, 2018. [Google Scholar]
- Nunnally, J.; Bernstein, I. Psychometric Theory; McGraw-Hill: New York, NY, USA, 1994. [Google Scholar]
- Zhang, Q.; Yang, S.; Liao, P.C.; Chen, W. Influence mechanisms of factors on project management capability. J. Manag. Eng. 2020, 36, 04020045. [Google Scholar] [CrossRef]
- Xiong, B.; Skitmore, M.; Xia, B. A critical review of structural equation modeling applications in construction research. Autom. Constr. 2015, 49, 59–70. [Google Scholar] [CrossRef] [Green Version]


Publisher’s Note: MDPI stays neutral with regard to jurisdictional claims in published maps and institutional affiliations. |
© 2022 by the authors. Licensee MDPI, Basel, Switzerland. This article is an open access article distributed under the terms and conditions of the Creative Commons Attribution (CC BY) license (https://creativecommons.org/licenses/by/4.0/).