Article

Prediction of Concrete Compressive Strength Using a Back-Propagation Neural Network Optimized by a Genetic Algorithm and Response Surface Analysis Considering the Appearance of Aggregates and Curing Conditions

1
Mechanical Characteristics Laboratory, Center for Laboratory Services, Sharif University of Technology, Tehran 11365, Iran
2
Department of Transport, Academy of Engineering, Peoples’ Friendship University of Russia (RUDN University), 6 Miklukho-Maklaya Street, 117198 Moscow, Russia
3
School of Mechanical Engineering, Sharif University of Technology, Tehran 11365, Iran
4
Department of Mechanical Engineering Technologies, Academy of Engineering, Peoples’ Friendship University of Russia (RUDN University), 6 Miklukho-Maklaya Street, 117198 Moscow, Russia
5
Department of Mechanical and Instrumental Engineering, Academy of Engineering, Peoples’ Friendship University of Russia (RUDN University), 6 Miklukho-Maklaya Street, 117198 Moscow, Russia
*
Author to whom correspondence should be addressed.
Buildings 2022, 12(4), 438; https://doi.org/10.3390/buildings12040438
Submission received: 12 March 2022 / Revised: 23 March 2022 / Accepted: 31 March 2022 / Published: 3 April 2022
(This article belongs to the Section Architectural Design, Urban Science, and Real Estate)

Abstract

:
In the present research, the authors have attempted to examine the compressive strength of conventional concrete, which is made using different aggregate sizes and geometries considering various curing temperatures. To this end, different aggregate geometries (rounded and angular) were utilized in various aggregate sizes (10, 20, and 30 mm) to prepare 108 rectangular cubic specimens. Then, the curing process was carried out in the vicinity of wind at different temperatures (5 °C < T < 30 °C). Next, the static compression experiments were performed on 28-day concrete specimens. Additionally, each test was repeated three times to check the repeatability of the results. Finally, the mean results were reported as the strength of concrete specimens. Response Surface Analysis (RSA) was utilized to determine the interaction effects of different parameters including the appearance of aggregates (shape and size) and curing temperature on the concrete strength. Afterwards, the optimum values of parameters were reported based on the RSA results to achieve maximum compressive strength. Moreover, to estimate concrete strength, a back-propagation neural network (OBPNN) optimized by a genetic algorithm (GA) was used. The findings of this study indicated that the developed neural network approach is greatly consistent with the experimental ones. Additionally, the compressive strength of concrete can be significantly increased (about 30%) by controlling the curing temperature in the range of 5–15 °C.

1. Introduction

Concrete is a composite material made of small and large aggregates bonded with a cementitious adhesive and hardened over time. Today, civil engineers are attempted to use reinforced concrete to increase the static and cyclic strength of the buildings. For example, large structures such as dams and multi-story car parking are made of reinforced concrete. However, there are still old constructions all over the world that need conventional concrete to be partially repaired. Therefore, trying to find practical and low-cost methods to increase the strength of conventional concrete is still valuable and efficient. Recently, various fast and acceptable techniques, including data mining methods, such as different types of regression methods and their extended models [1,2] and Taguchi experiment design technique [3,4], statistical approximations [5], artificial neural network, and machine learning techniques [6,7,8] have been used instead of costly and time-consuming experiments and finite element simulations due to computational costs.
Benidir et al. have investigated the influence of aggregate size on the concrete compressive strength [9]. They found that the strength of concrete increases by raising the size of the aggregate. However, the experimental results show that this trend is not permanent, and the strength of concrete specimens with an aggregate size of 16 increases abruptly. Additionally, a new algorithm for strength estimation of conventional concrete has been presented based on the physico-mechanical properties of aggregate rock [10]. Different types of aggregates are employed to construct concrete specimens. The experiment results reveal that the compressive strength of concrete increases by increasing both the mechanical and physical properties of rock (elastic modulus, unit weight, and strength). Additionally, Ahmad et al. have presented a novel algorithm based on the Kernel function-regression models to predict the shear strength of rockfill materials [11]. Moreover, the influences of the shape and size of test samples have been investigated on the static and cyclic behavior of concrete [12]. It was shown that the sample shape was not effective on the results of static compression tests. Additionally, the sample dimension ratio has a great impact on the concrete strength (there is an inverse relationship between these two independent and dependent parameters). Furthermore, the effects of the size and shape of concrete specimens on the static strength are completely independent of the concrete grade. Chopra et al. have predicted the concrete strength using Artificial Neural Network (ANN) and Genetic Programming (GP) [13]. In this research, different materials of mix designation (water-cementitious ratio, cement content, mix proportion between sand and coarse aggregate, and curing time) are considered as input parameters. Additionally, the failure stress of concrete samples under a static compression test is considered the output parameter. They found that the ANN model with the Levenberg–Marquardt (LM) training function is more accurate. Khademi and Behfarnia have estimated the static strength of the 28-day concrete using the multi-linear regression (MLR) technique and ANN [14]. They reported that the MLR technique is most commonly used in the design of a preliminary mix of concrete, and it is better to use the ANN technique to achieve optimal parameters in relation to maximum strength. Nikoo et al. have employed the Self Organization Feature Map (SOFM) method to predict the strength of concrete [15]. They reported that the most effective parameter is the slump and water-cement ratio, respectively. After that, they attempted to assess the concrete strength via the ANN prediction algorithm [16]. To this end, firstly, the optimal network structure, which has a special capability in nonlinear mapping, was determined using the genetic algorithm. Moreover, Khademi et al. have investigated the effect of concrete raw materials on its compressive strength by utilizing the fuzzy logic approach [17]. They found that the accuracy of the fuzzy logic approach is lower than that of the ANN technique in estimating the compressive strength of concrete. Recently, the concrete strength has been evaluated using mixture data and employing machine learning methods [18]. Additionally, the optimal mixture for concrete has been presented considering the cost analysis. Reza Kashyzadeh et al. have used various data mining techniques, including multi-linear regression, Taguchi sensitivity analysis, and decision tree analysis, to study the influence of aggregate shape and size and the drying temperature on the concrete strength under compression loading [19]. They found that aggregate size is the most important parameter to determine the strength of conventional concrete under compression loading. However, the least effect is related to the aggerate shape. In addition, they reported that the compressive strength of conventional concrete with an aggregate size of 20 and the aggerate shape of sharp and round can be increased by about 55% and 68%, respectively, if we dry the concrete using cold wind (T = 5 °C).
Mata has performed a comparative study on the behavior of a concrete dam under environmental loads using different data mining techniques, including MLR and ANN [20]. Bal and Buyle-Bodin implemented an artificial neural network to predict dimensional variations of drying shrinkage. This approach can develop models for predicting shrinkage as well [21]. Kaplan et al. have used a neural network to estimate the compressive strength and interpreted some hardened concrete properties in this way (e.g., compressive strength, ultrasonic pulse velocity, dynamic elasticity modulus, water absorption, and penetration depth) [22]. They reported that the concrete strength increases when the water-to-cement ratio decreases. Finally, they stated that the present ANN has the ability to predict the compressive strength of the conventional concrete in terms of changes in various parameters, including cement type, w/c ratio, and curing parameters, such as conditions and time. In another study, the Adaptive Neuro-Fuzzy Inference System (ANFIS) and ANN methodologies have been utilized to present the mathematical relationship between compressive strength and ultrasonic pulse velocity [23].
In general, most of the research conducted on conventional concrete dates back to previous years, and there are a limited number of scholars who use new methods such as data mining techniques, neural network algorithms, hybrid optimization methods based on the genetic algorithm, and machine learning techniques to evaluate the strength of conventional concrete under compression and shear loading conditions. However, most of the recent publications focus on improving the concrete strength by adding nanoparticles or using different types of fibers, such as reinforcing concrete with long or short synthetic or natural fibers. Moreover, this improvement can be carried out by employing fabric fibers and wrapping them around the concrete parts (e.g., columns). According to the above-mentioned literature, the authors found that in conventional concrete, the appearance of aggregates, such as size and geometry, as well as the curing conditions, have significant effects on the compressive strength. Therefore, in this study, the authors have attempted to investigate the relationship between these parameters (i.e., the appearance of aggregates and curing conditions such as wind temperature) and the strength of conventional concrete by performing various experiments. In fact, this study follows the previous achievements of the authors in this field. Therefore, the characteristics considered in this study, such as the choice of aggregate size, aggregate shape, and temperatures studied for curing conditions, are based on the authors’ previous published article (Ref No. 19) and experience in making concrete in Iran and their region. Afterwards, a back-propagation neural network optimized by a genetic algorithm and response surface analysis were used to assess the conventional concrete strength with higher accuracy than the previously presented models. Eventually, the best conditions for having strong concrete were reported.

2. Materials and Methods

To create conventional concrete and select the proportions of concrete elements, ACI-211.1–91 instructions [24] were used, a w/c ratio of 50% was also applied, and finally, 2% of superplasticizer was added to the mixture. To achieve the purpose of the current research, river stone with different aggregate appearances, such as various sizes in different geometrical forms (angular and rounded [25]), were used to fabricate concrete specimens. Figure 1 shows the geometries of the aggregates used in this research. Additionally, the size of aggregates used in this study was determined based on the BS EN 13043 standard [26] and by passing through various sieves (2.36, 4.75, 10, 12.5, 20, 25, and 32). Therefore, in each specimen batches (rounded and angular aggregates), three sizes of 10, 20, and 30 mm were used, as shown in Figure 2.
The shape of 28-day concrete laboratory specimens is in the form of a column with a square cross-section with a side length of 50 mm and a height of 150 mm (dimensions were selected in accordance with ISO 1920-3 standard [27]). For more details on sample preparation and raw material proportions, the reader is referred to Table 1 of Ref. No. 19, the previous work carried out by the corresponding author. In total, 108 specimens were prepared, and proximity to wind with different temperatures in the range of 5 to 30 degrees Celsius and a temperature interval of 5 °C was considered for curing conditions. Eventually, to name the specimens for ease of work and prevent operator error during testing and recording results data due to the great variety of specimen types, the following template (Figure 3) was used. For example, 20S-R-5T codding indicates that the concrete specimen was made of rounded aggregate with an aggregate size of 20 mm and dried in the presence of 5 °C air.

3. Experimental Data

The Amsler brand axial device was used to perform mechanical testing on the concrete and to obtain the compressive strength (Figure 4). In this device, the necessary force (maximum 60 tons) is supplied by the hydraulic system. Additionally, two thick steel plates are placed on both sides of the specimen to act rigidly under applied loads, which are responsible for compressing the concrete specimen. In fact, these plates are used to apply uniform pressure to the cross-section of the sample. All experiments were performed at a temperature of 20 °C and under controlled environmental conditions, including pressure and humidity, in accordance with the ISO 17025 standard in one of the laboratory centers in Iran (Sharif University of Technology, Tehran, Iran). Additionally, during the test, a compressive load at a constant rate of 1000 N/s was applied continuously in accordance with the ISO standard 1920-4 [28]. To achieve the results with acceptable reliability and check the reproducibility of the responses, the test of each sample was repeated three times, and the average compressive load was reported as the concrete bearing load in each of the codding (Appendix A).
The maximum compressive load borne by the concrete is considered the strength of the concrete, and the results of mechanical testing for concrete specimens made using rounded and angular aggregates are reported in Figure 5a,b, respectively. From Figure 5, it is clear that for both aggregates geometry, the compressive strength of concrete increases with increasing aggregate size. This increase is greater when the aggregate geometry is angular than when rounded aggregate is used. In addition, the results show that the compressive strength of concrete decreases with increasing curing temperature. Additionally, it is observed that this decrease in strength in terms of curing temperature while using both geometric shapes of aggregate in sample construction has the same trend. In other words, it can be inferred from laboratory results that the effect of aggregate geometry on the relationship between compressive strength of concrete and curing temperature is insignificant or negligible.
Next, Figure 6 shows the compressive strength of concrete in terms of aggregate size. In this diagram, blue and red colors indicate the use of rounded and angular aggregates, respectively. As expected in previous reports by other researchers, as well as the authors’ findings in their previous paper [19], the compressive strength of concrete specimens with rounded aggregates is far greater than the compressive strength of concrete specimens with angular aggregates (blue dots are always located higher than red dots). On the other hand, it is clear that as the size of the aggregate increases, the strength of the concrete also increases. Additionally, the results presented in Figure 6 show that the range of changes in concrete strength in terms of the curing temperature is not large when the grain size is 10 mm. In other words, as the grain size increases, the effects of curing temperature on the compressive strength of concrete are greater. In addition, in some cases, it is observed that there was no uniform trend between the results (for example, the square symbol is not everywhere at the top of the chart), which could be due to human error during testing or other factors, such as problems in making samples. However, since the tests were performed in a reputable laboratory following the ISO standard, this hypothesis is diminished; the samples are made with high accuracy, and the operator has a lot of experience in this field. Therefore, the main reason can be considered heterogeneity in the arrangement or location of aggregates in concrete. Additionally, even two samples that have exactly the same aggregate and size, with the same angle and the same aggregate properties, have a thought-provoking location in the concrete sample and uniform distribution throughout the sample, which is still a mystery to researchers. Therefore, in order to equalize the conditions, three samples were made from each test, and the average results were reported, which leads to the observed differences. Perhaps in such cases, testing more samples per batch can provide more accurate results.
The reason for proposing the use of aggregates with rounded geometry instead of angular geometry, as its name implies, is the existence of angles. Since these aggregates have three faces, in which there are three angles, the small angles make the tip of the aggregate sharper, which, in practice, acts as a concentration point in the mortar, and when the uniform compressive load is applied on the sample, it is not evenly and homogeneously distributed in the material, and the maximum stress will be locally at the interface between the mortar and the sharp points of the aggregate. In other words, the presence of an angle plays a key role as the stress concentration in the mortar. In this regard, two parameters are important:
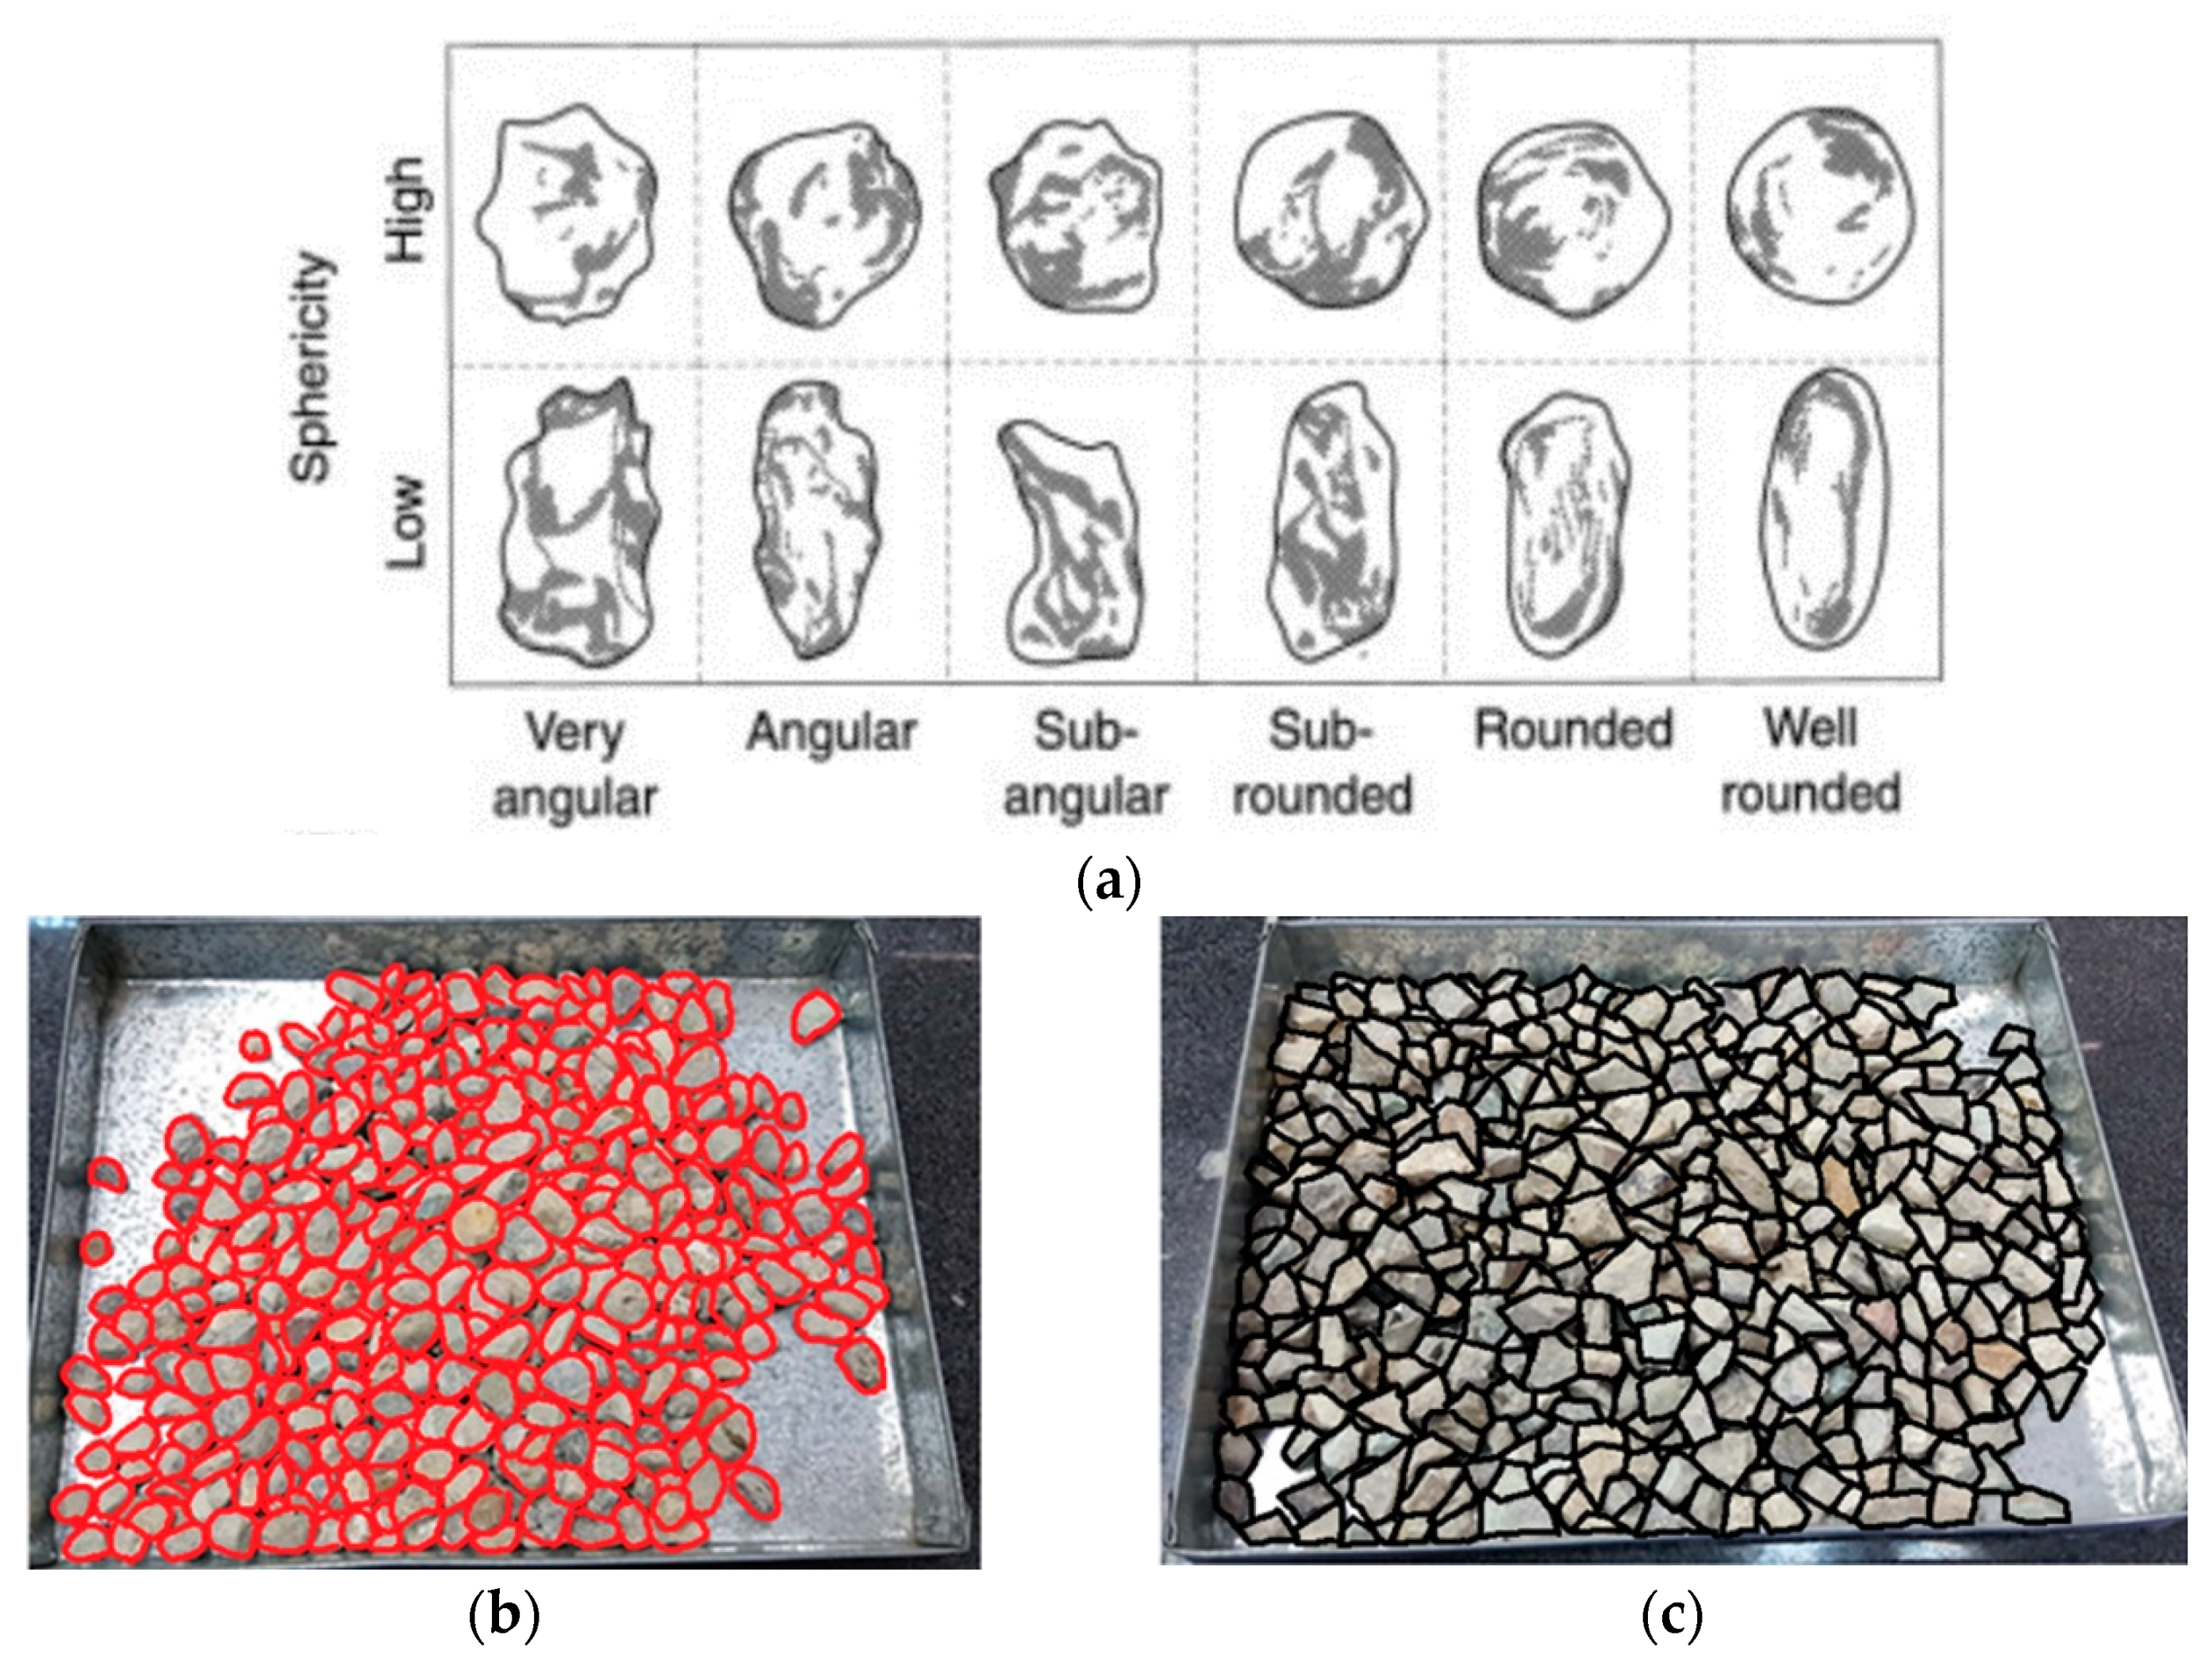
  • The number of small angles (less than 90 degrees) in concrete. As the size of the aggregate increases, the number of these angles decreases, which can greatly help increase the compressive strength of the concrete as the stress concentration points in the mortar are reduced. On the other hand, if the mechanical properties of the aggregates are suitable, the failure mode will be based on the formation of cracks in the mortar, which according to the cases mentioned above, these cracks will occur in different places, and the concrete sample will collapse at once. In other words, it can be said that the concrete sample is hollow from the inside and cannot withstand the load. Although many scientists have suggested the use of nanoparticles, fibers and the manufacture of composite concrete with the aim of strengthening the mortar and sometimes increasing the adhesion between the mortar and the aggregate, which leads to obtaining acceptable results.
  • The size of a small angle (between zero and 90 degrees) in concrete. Quadrilateral aggregates with angles close to 90 degrees should be used as much as possible to create the smallest stress concentration in the mortar. In other words, the closer the aggregate angle is to zero, the higher the concentration intensity in the mortar and the lower the compressive strength of the concrete sample.
The above-mentioned well justifies the results obtained from the experimental study of the effect of aggregate size and its geometry on the compressive strength of concrete. In addition, by placing concrete specimens in the presence of hot air (higher temperature), the moisture inside the specimens evaporates; in other words, the sudden release of moisture from the mortar causes drying, which leads the mortar to show a completely brittle behavior, and by increasing the curing temperature, this brittle behavior becomes more intense. In other words, when a compressive load is applied, the specimen does not show any load-bearing in terms of internal or general deformation, and it breaks immediately. Hence, the laboratory results also show that the compressive strength of concrete decreases when the curing temperature increases. It should be noted that it does not mean that a lower curing temperature is better. However, the optimal temperature must be determined. In Figure 5, it is clear that the 10 °C curing temperature results in the highest compressive strength in concrete specimens for both aggregate shapes. Finally, this temperature (10 °C) is more efficient than 5 °C. On the other hand, it is observed that the 15 °C curing temperature has caused a more drop in the compressive strength of the concrete. As a result, it seems that the optimum temperature for the curing operation is in the range of 5–15 °C.

4. Response Surface Analysis

Performing tests always involves cost and time. Therefore, performing effective tests that provide the most information with the least cost and time is the goal of every engineer or researcher, and the cost and time increase as the number of factors increases. Therefore, there is a need for a method in which the most information about the process can be obtained with minimal cost and time, logical conclusions can be presented, and documentary evidence about the process can be obtained. The method that best meets these goals is called the Design of Experiments (DOE). This technique is one of the most popular methods of quality improvement that was introduced in the 1980s and 1990s as a competitive advantage in Western countries and Japan. The proper use of these statistical techniques can facilitate the design and production of new products and improve existing products. These principles have been applied in most industries such as electronics and semiconductors, aerospace, automobiles, medical equipment, food, pharmaceuticals, and chemical industries. Additionally, the results of research conducted in the industry field indicate that this tool can be well used for the intended purpose and meet the demands or needs [29]. In this regard, various methods have been performed by researchers to investigate the effect of process parameters on the system’s response. In general, these developments have been based on three main objectives: (1) increasing the accuracy of examining the effect of parameters on the system response; (2) reducing the number of tests required to examine the effect of different parameters on the system response; (3) considering the simultaneous effects of several parameters on the system response because, in most methods, only the effect of one parameter on the response was focused and the value of the other parameters is assumed to be constant. Therefore, each of the methods presented or developed by researchers has advantages over other methods, and of course, it should be noted that in each of them, there are limitations. Therefore, it is necessary to select and apply the appropriate method in designing the experiment according to the purpose of the research in order to achieve the best efficiency of this tool. For example, among all the methods proposed in the field of experimental design, the Taguchi method provides the least number of experiments to examine the effect of input parameters on the response [30,31]. Additionally, using this algorithm, the most effective and least effective parameters can be specified quantitatively (percentage of effect on system response) [32]. In addition, the Taguchi prediction algorithm can be used to estimate the system response for new cases (new values for input parameters). However, one of the disadvantages of this method is that it does not investigate the interaction effect of several parameters simultaneously. In other words, it is not possible to see the effect of changes in more than one parameter at a time, and this method looks at it only one dimensionally. In order to simultaneously investigate the changes in two input parameters on the system response, the response surface method is one of the most popular experimental design techniques. In this technique, the output is a three-dimensional diagram that plots the changes in the two input parameters to the output as a three-dimensional shell [33]. In this way, the effects of two-way input parameters on the response can be observed. Additionally, the diagrams provided by this method can be used to determine the range of optimal values for various parameters, and finally, using the response surface optimization tool, the most optimal case can be extracted and reported [34].
In the present paper, the response surface method was used. For this purpose, three parameters—aggregate size (S), aggregate geometry (G), and curing temperature (T)—were considered input parameters. Additionally, the maximum compression force brone by concrete (strength) was considered the output. In this analysis, the linear effects of each parameter and the effects between them were considered (S, G, T, SG, ST, GT). In the statistical analysis performed in this study, the parameter of aggregate geometry was considered qualitatively, and as a result, a separate response surface analysis was performed for each of them. In other words, only the simultaneous interaction of two quantitative parameters of aggregate size and curing temperature is investigated. To achieve this goal, the aggregate size parameter has three levels (10, 20, and 30 mm), and the curing temperature parameter has six different levels (5, 10, 15, 20, 25, and 30 °C).

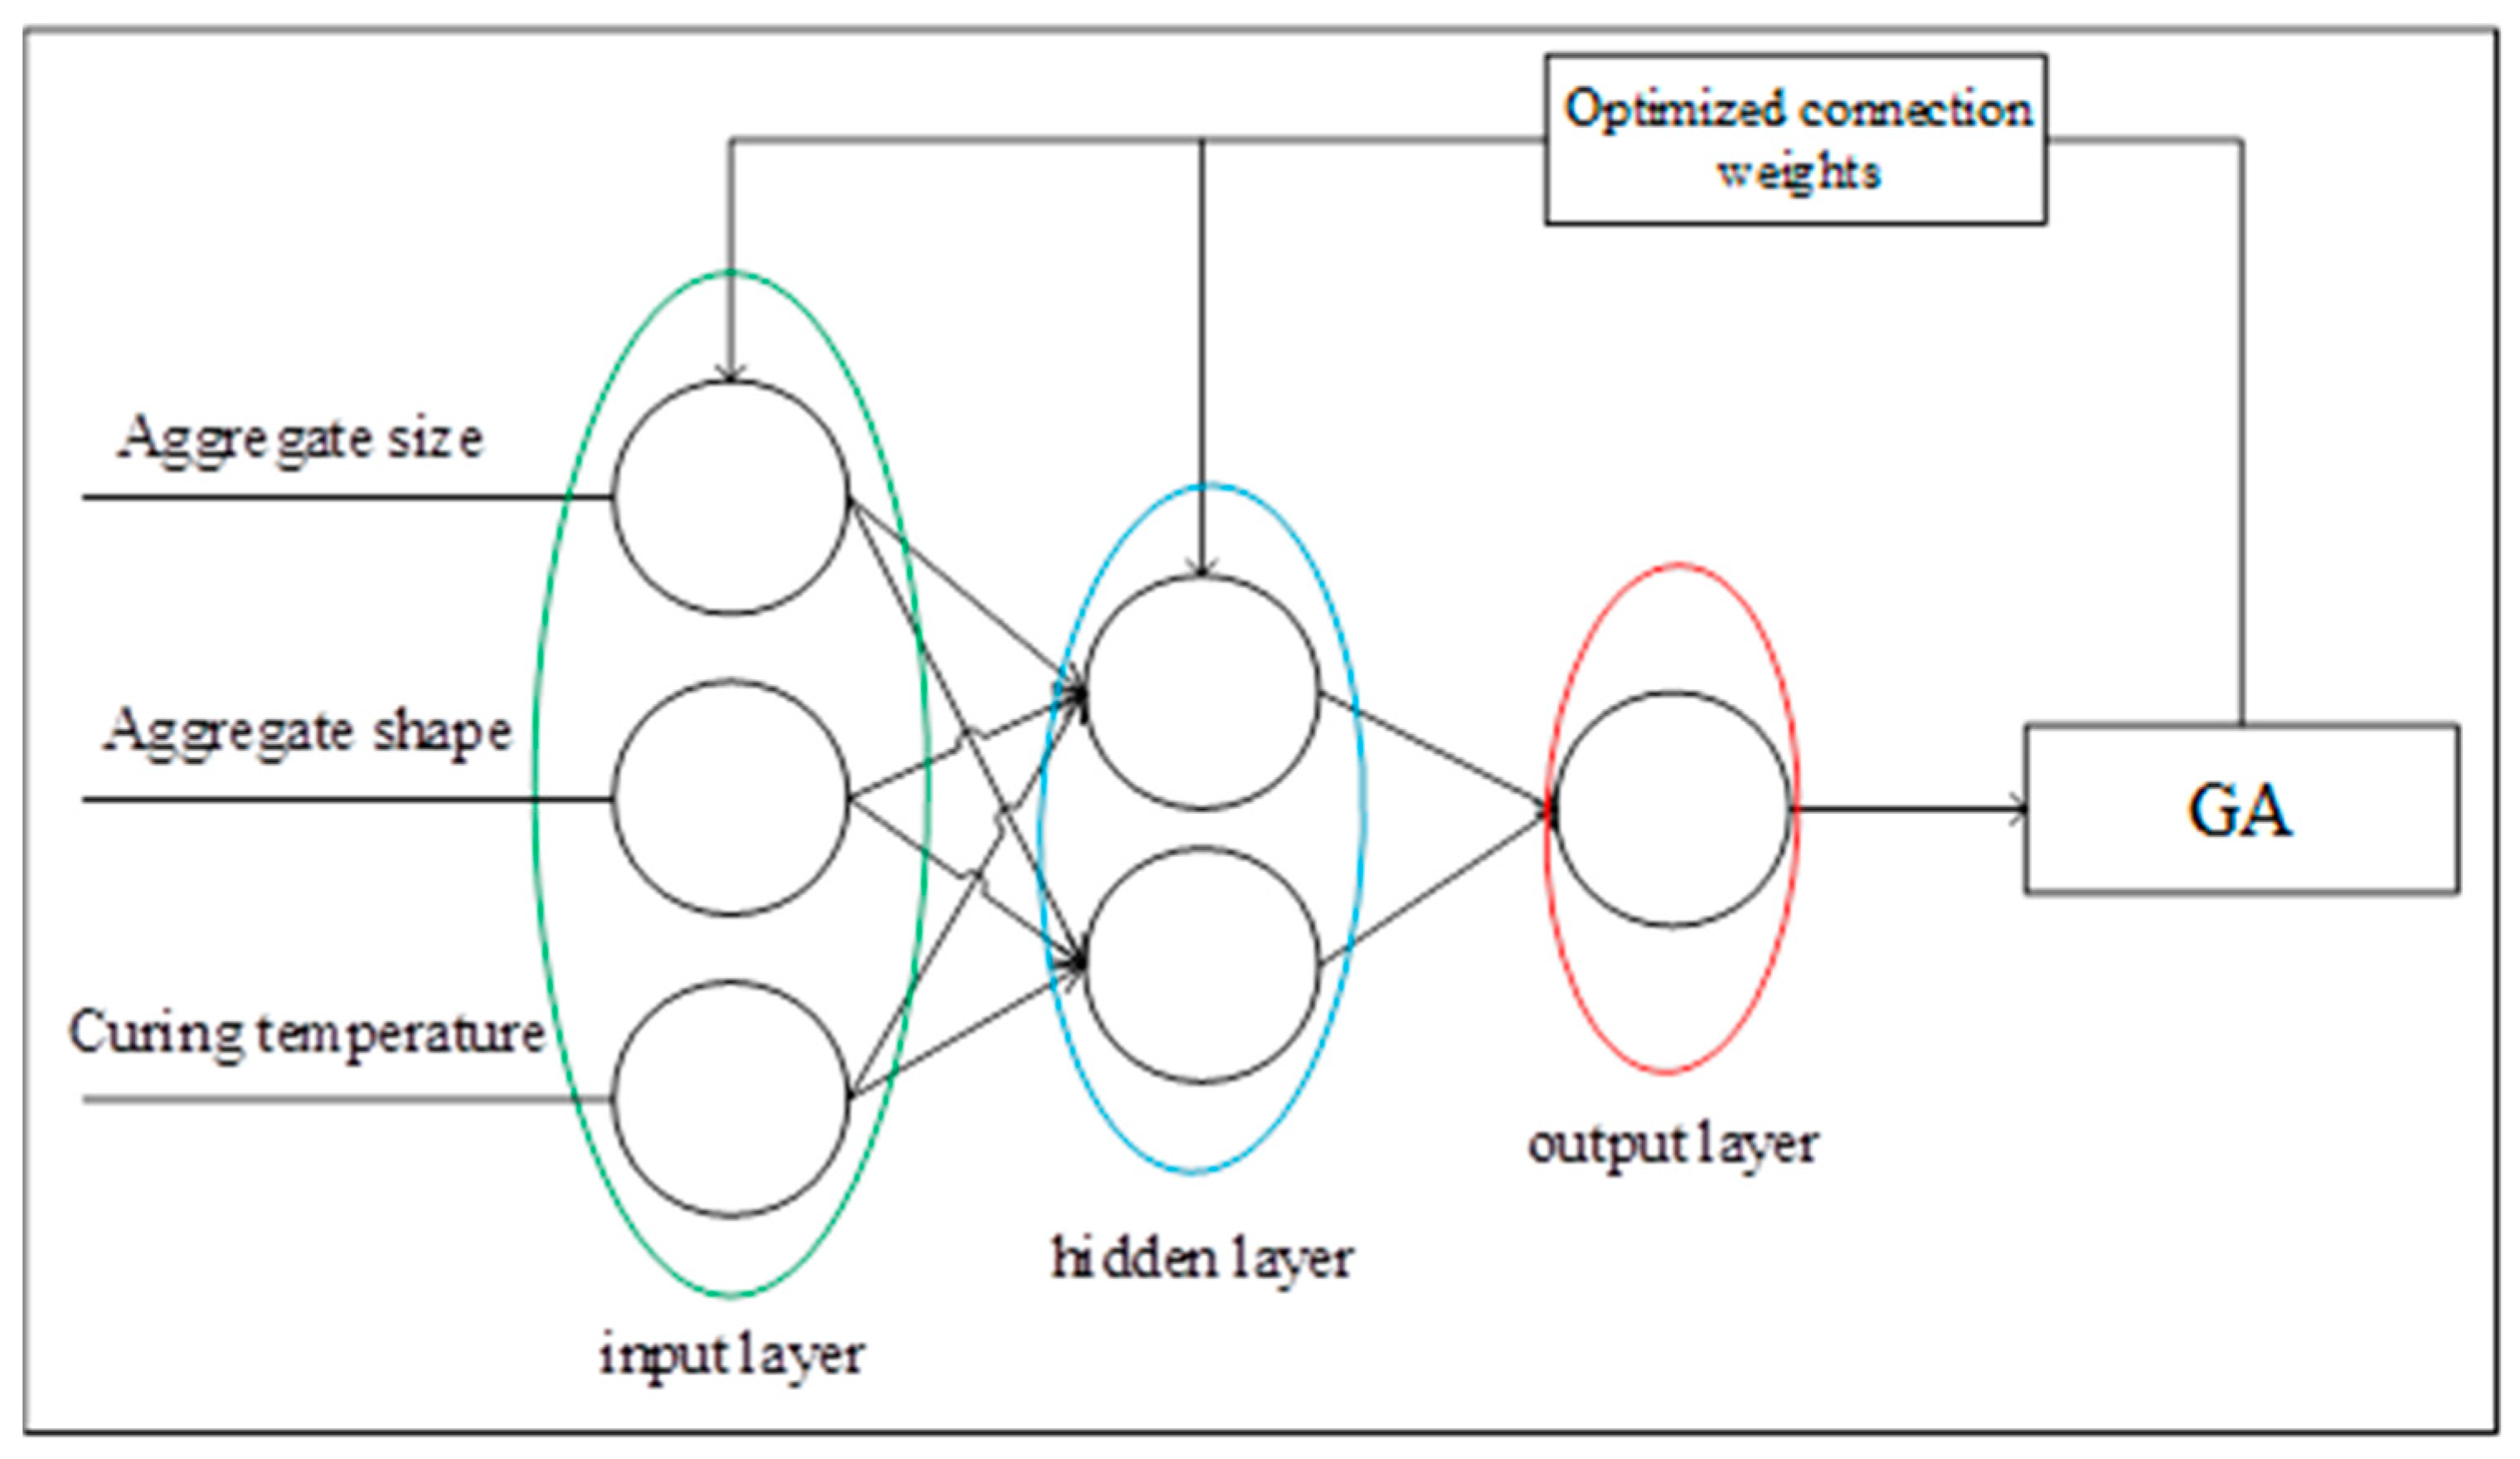
5. Neural Network and Genetic Algorithm

In the present study, a back-propagation neural network (BPNN) with three inputs, including aggregate size, aggregate shape, and curing temperature, and one output (i.e., compressive strength) was used. The whole framework of prediction by the BPNN-GA (BPNN and genetic algorithm) is shown in Figure 7. To prepare the neural network, the data are randomly divided into three categories: training data (70% of data), test data (20% of data), and validation data (10% of data) [35,36].
The initial neural network was selected using the trial-and-error method according to Table 1. Additionally, different evaluation indexes were considered to assess the performance of neural networks: the correlation coefficient (R), mean square error (MSE), root mean square error (RMSE), and mean absolute error (MAE) [37,38,39]. These statistical criteria are calculated using the following equations:
R = i = 1 n ( f E X P , i F ¯ E X P ) ( f A N N , i F ¯ A N N ) i = 1 n ( ( f E X P , i F ¯ E X P ) 2 ( f A N N , i F ¯ A N N ) 2 )
M S E = 1 n i = 1 n ( f A N N , i f E X P , i ) 2
R M S E = 1 n i = 1 n ( f A N N , i f E X P , i ) 2
M A E = 1 n i = 1 n | f A N N , i f E X P , i |
The genetic algorithm, which is based on selection and the theory of genetics, optimizes the problems. Basically, the genetic algorithm operates by exploring and exploiting based on the encoding method, which includes three principal steps: selection, crossover, and mutation [40,41]. On the other hand, neural networks contain various parameters, including network topology, learning rate, and initial weights, and correctly selecting affects the prediction accuracy [42]. Nowadays, because the genetic algorithm uses the global search method, a lot of effort has been made to combine neural networks with genetic algorithms [43,44,45,46,47]. In this study, the genetic algorithm was used to improve weights between layers. To this end, the parameters of the applied genetic algorithm are given in Table 2. Moreover, the fitness function was based on the prediction errors that the fitness value of each chromosome ( f j ) and the selection operator ( P j ) [48]:
f j = [ 1 n j = 1 m i = 1 n e i j 2 ]
P j = f i f i

6. Results and Discussion

The output contours of the response surface analysis are shown in Figure 8. In this figure, the direction of the arrows indicates an increase in the value of the parameters of each of the vertical and horizontal axes. Red color also means a critical condition to indicate the area where the concrete specimens have the lowest compressive strength. Additionally, since the main purpose of this research is to improve the compressive strength of concrete, the main focus is on purple and blue colors.
At first glance, it seems that the range of variation is the same for both rounded and angular aggregates. Of course, this general view is true, but they differ from each other in some details that must be carefully interpreted. However, the most important results extracted from the contours of Figure 8a,b are:
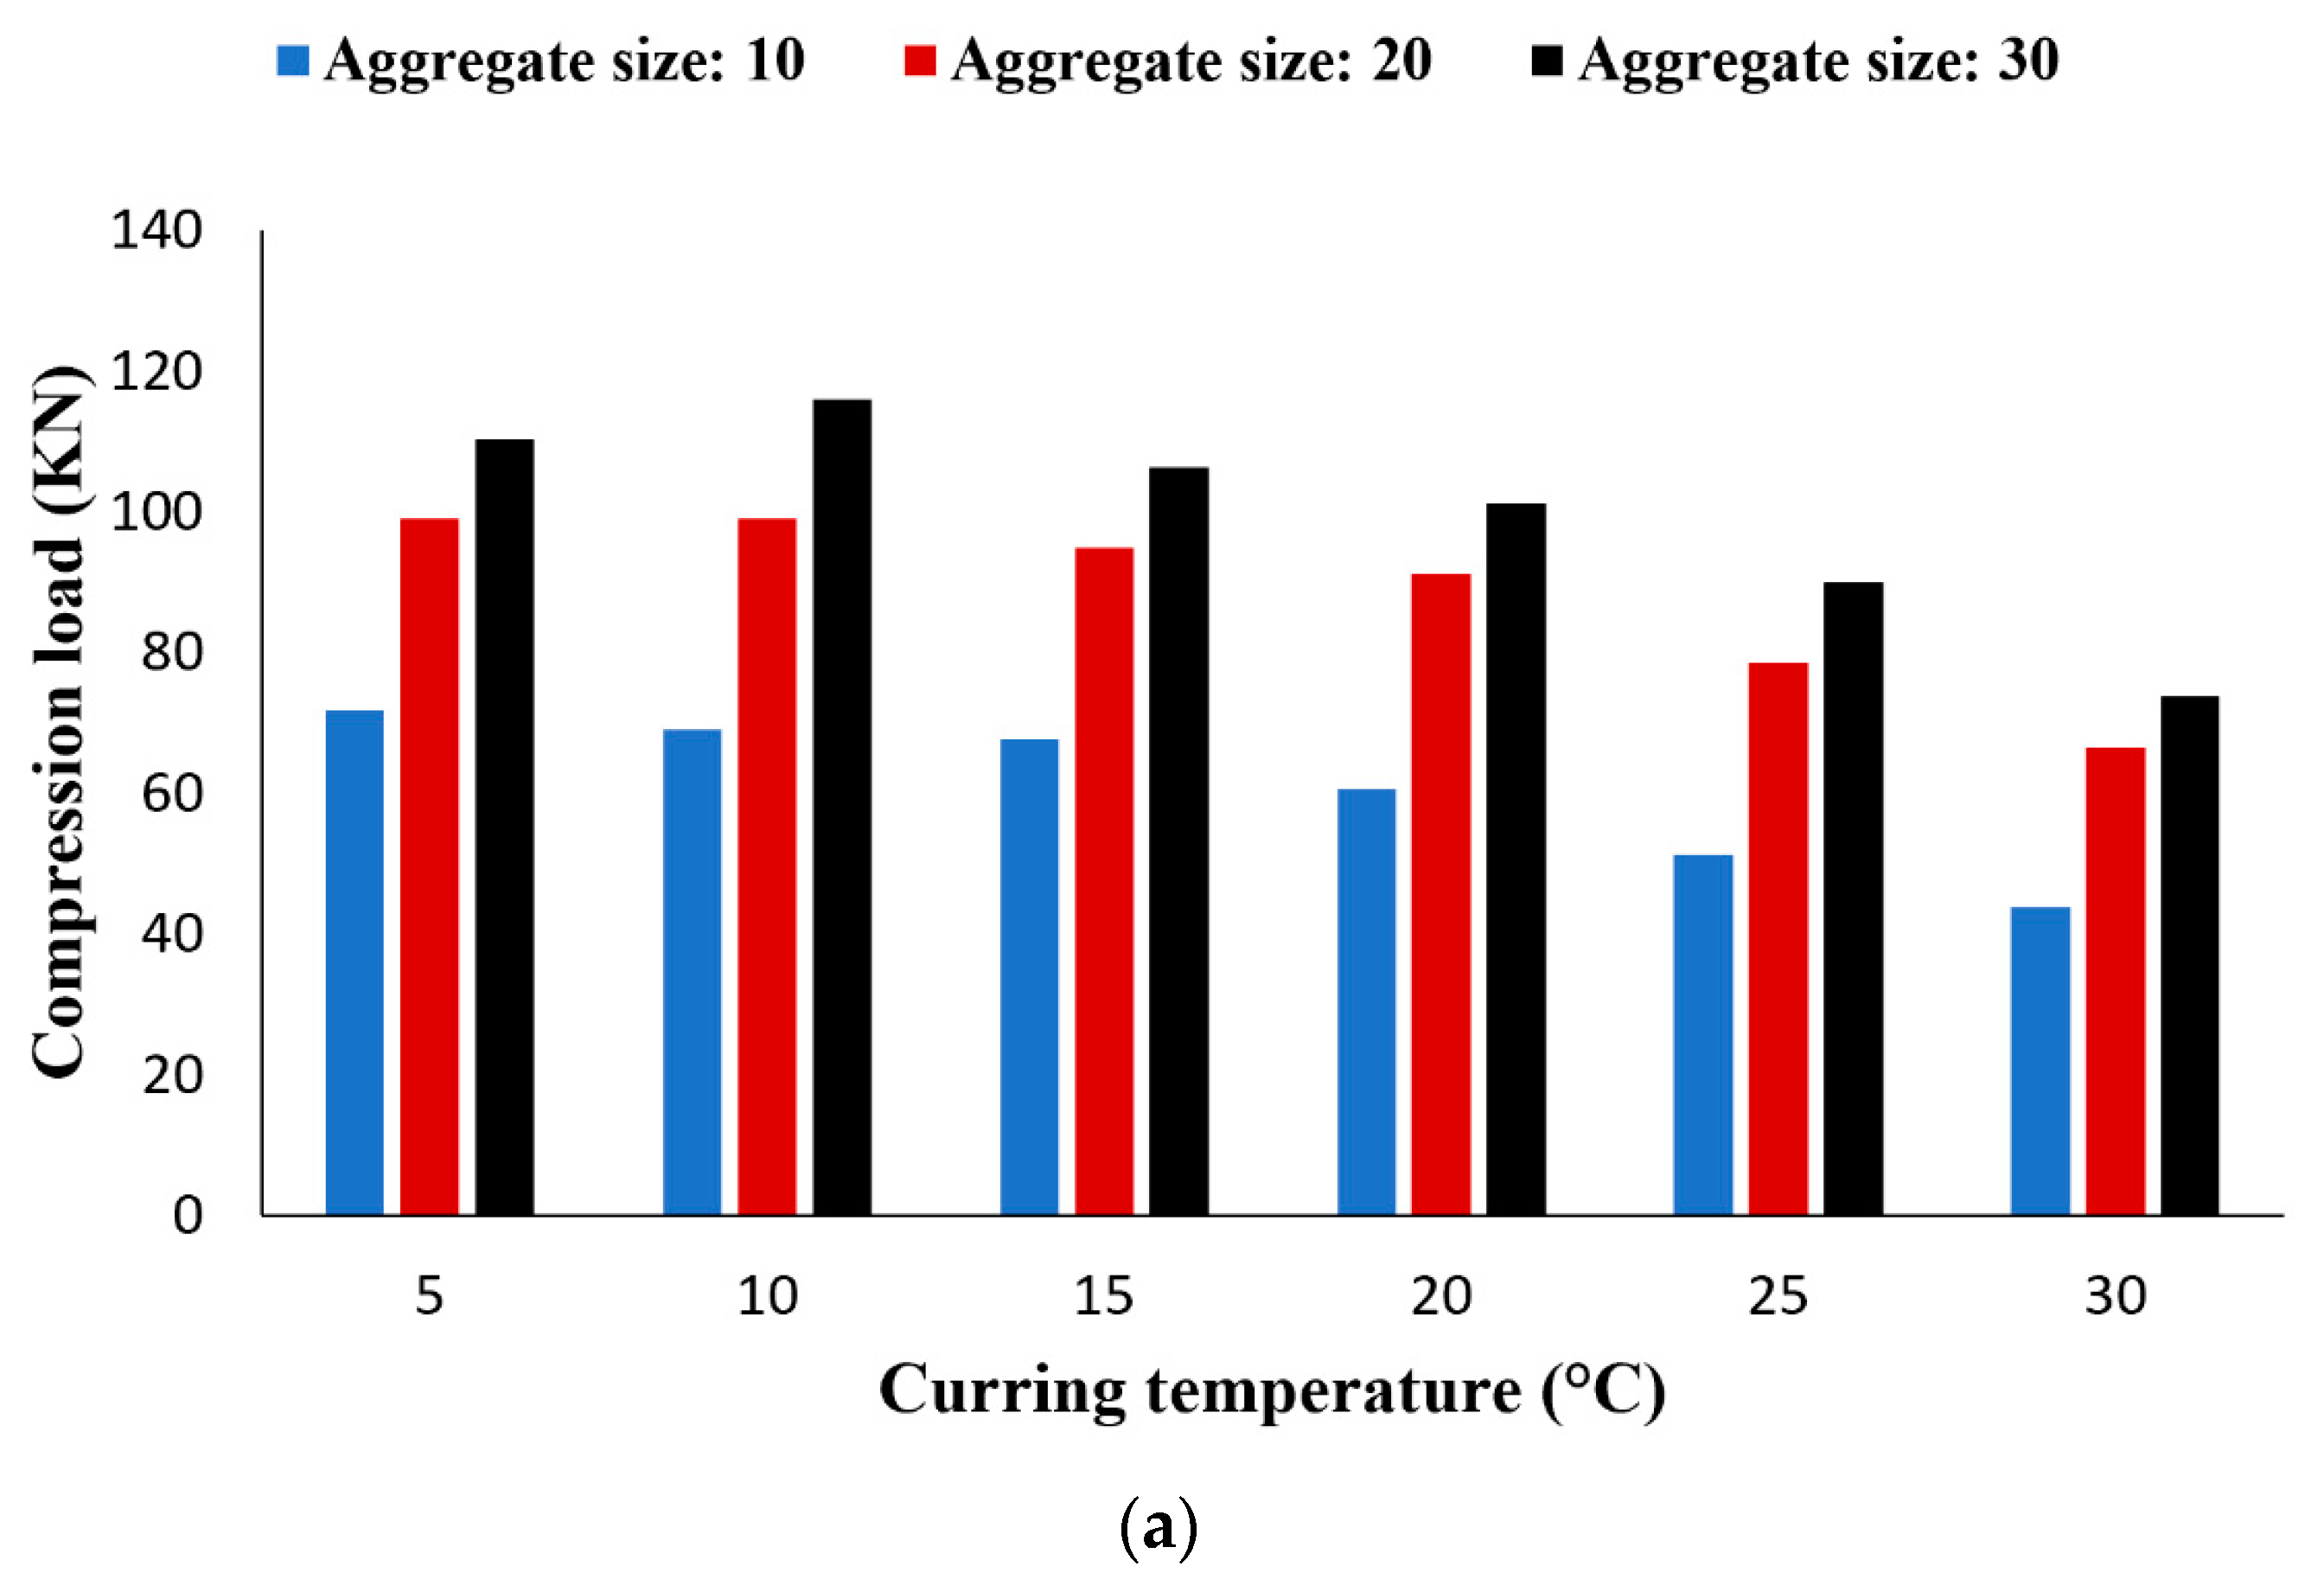
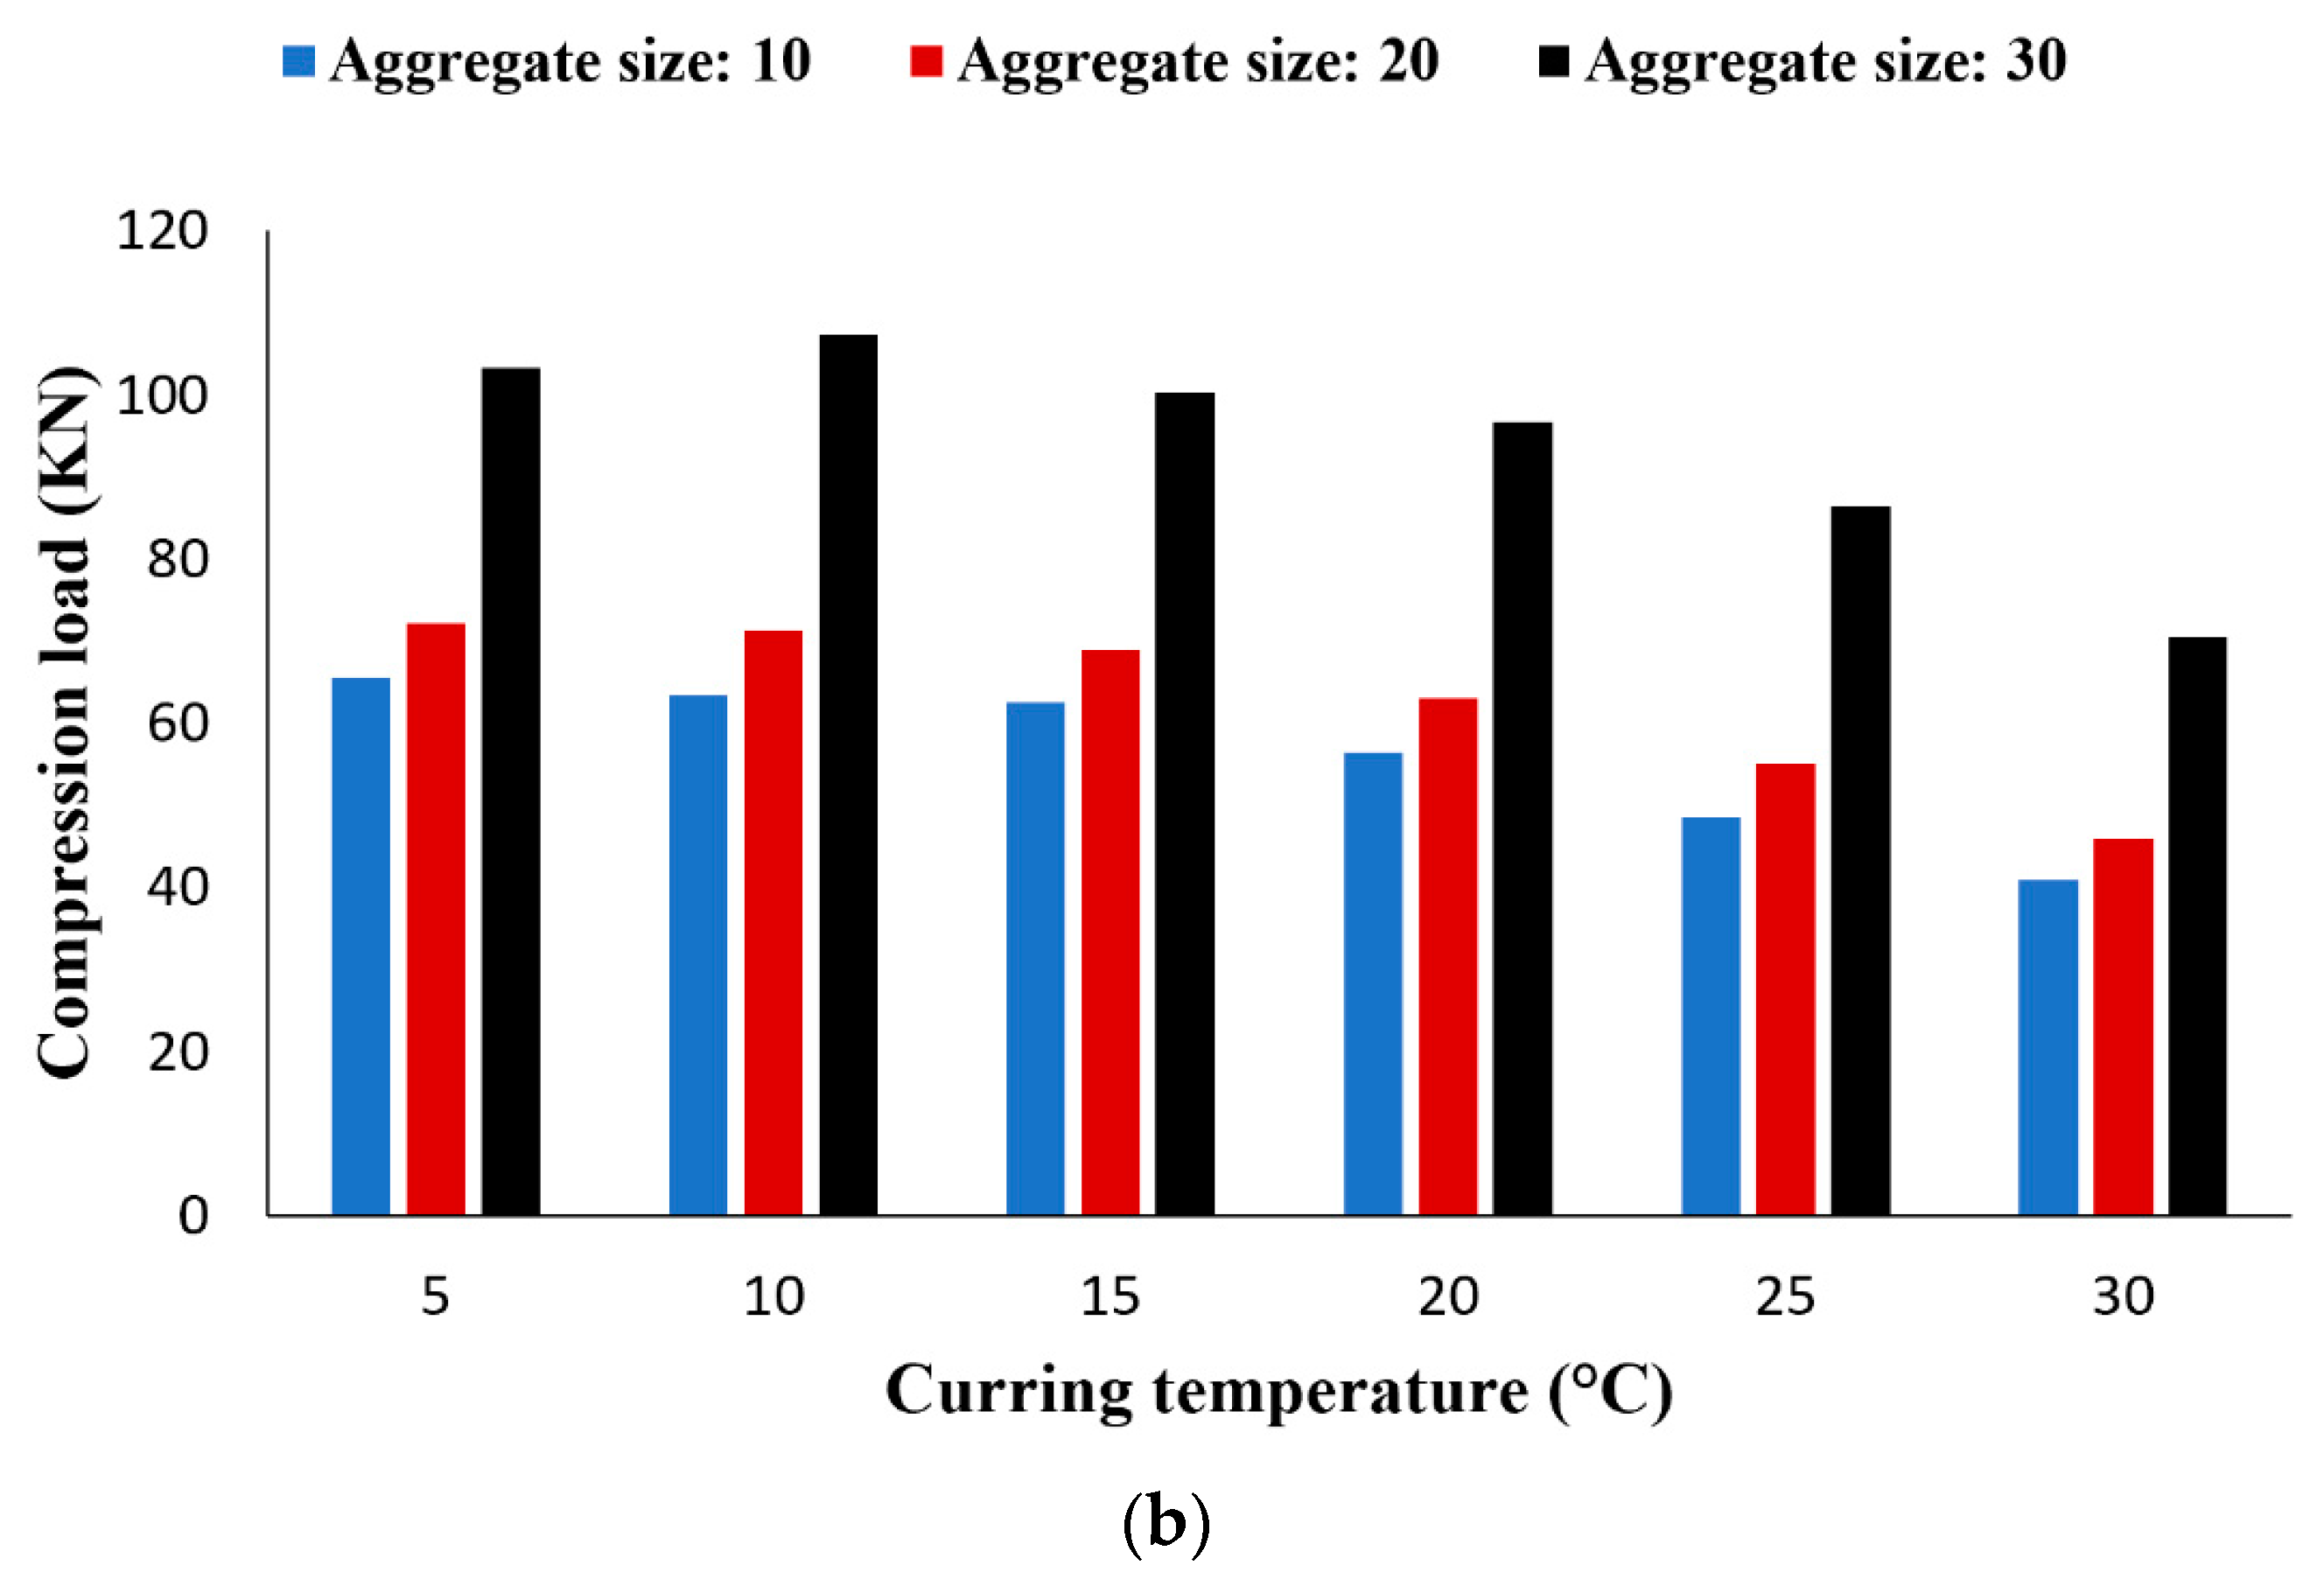
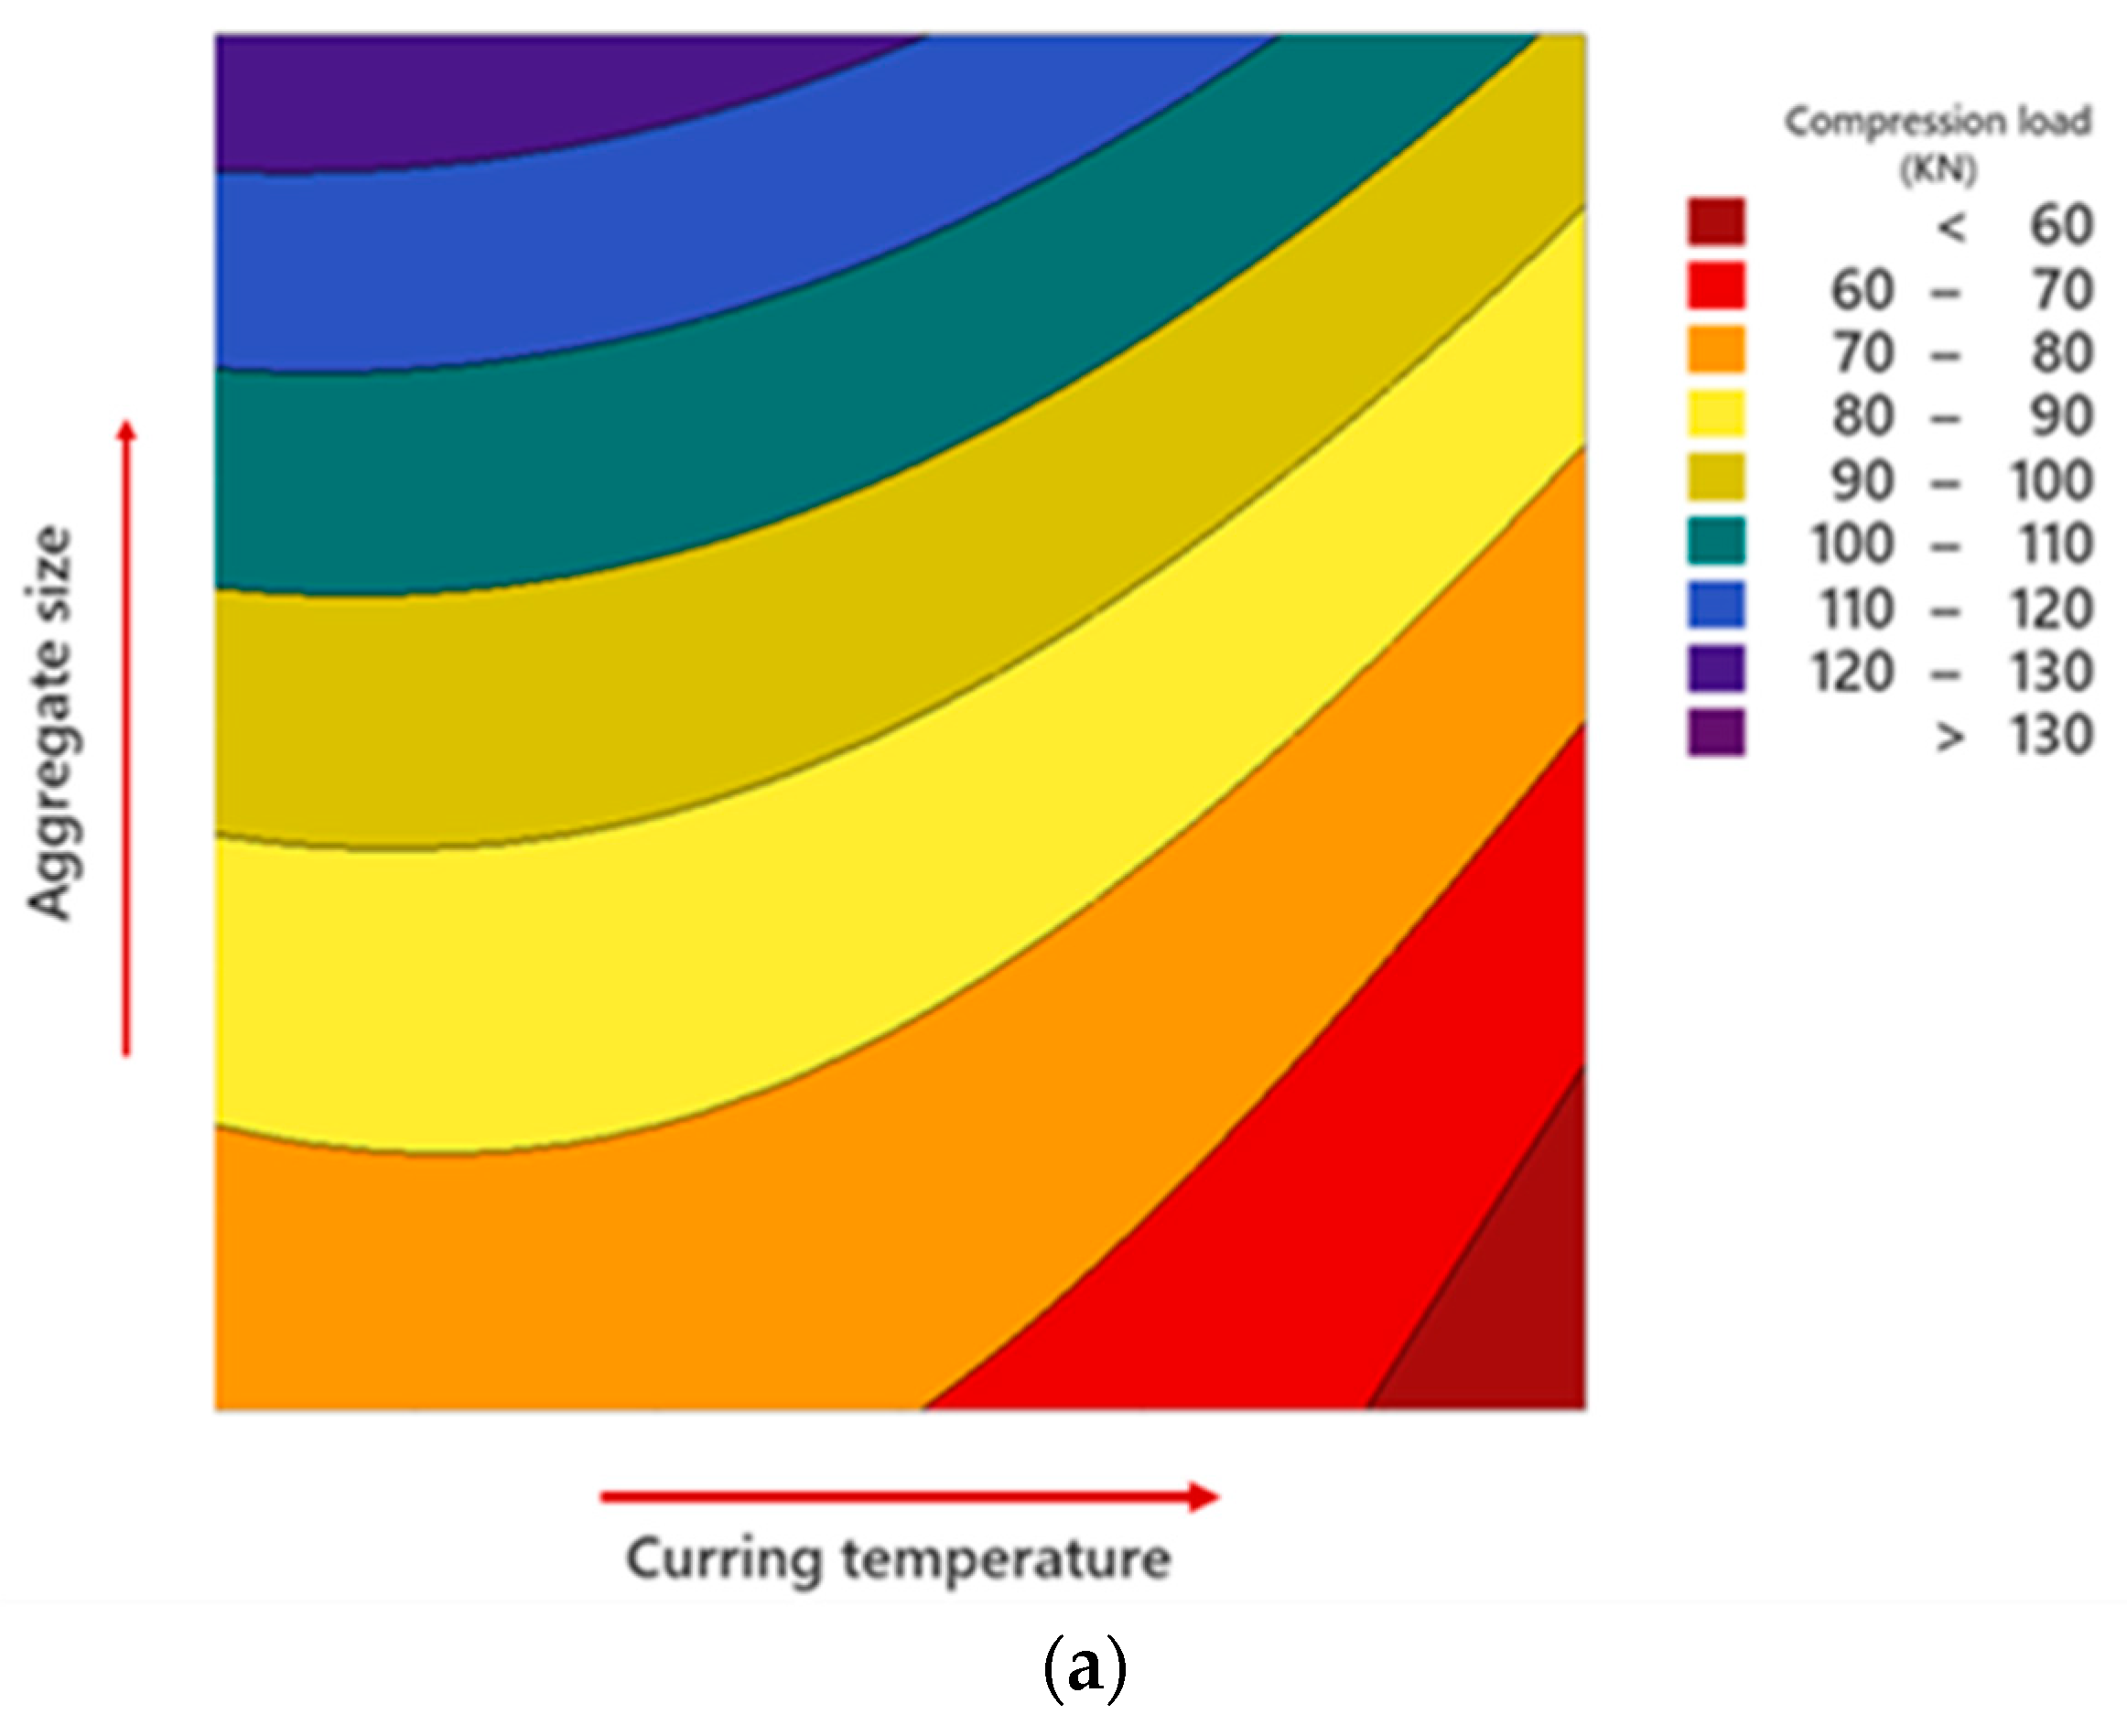
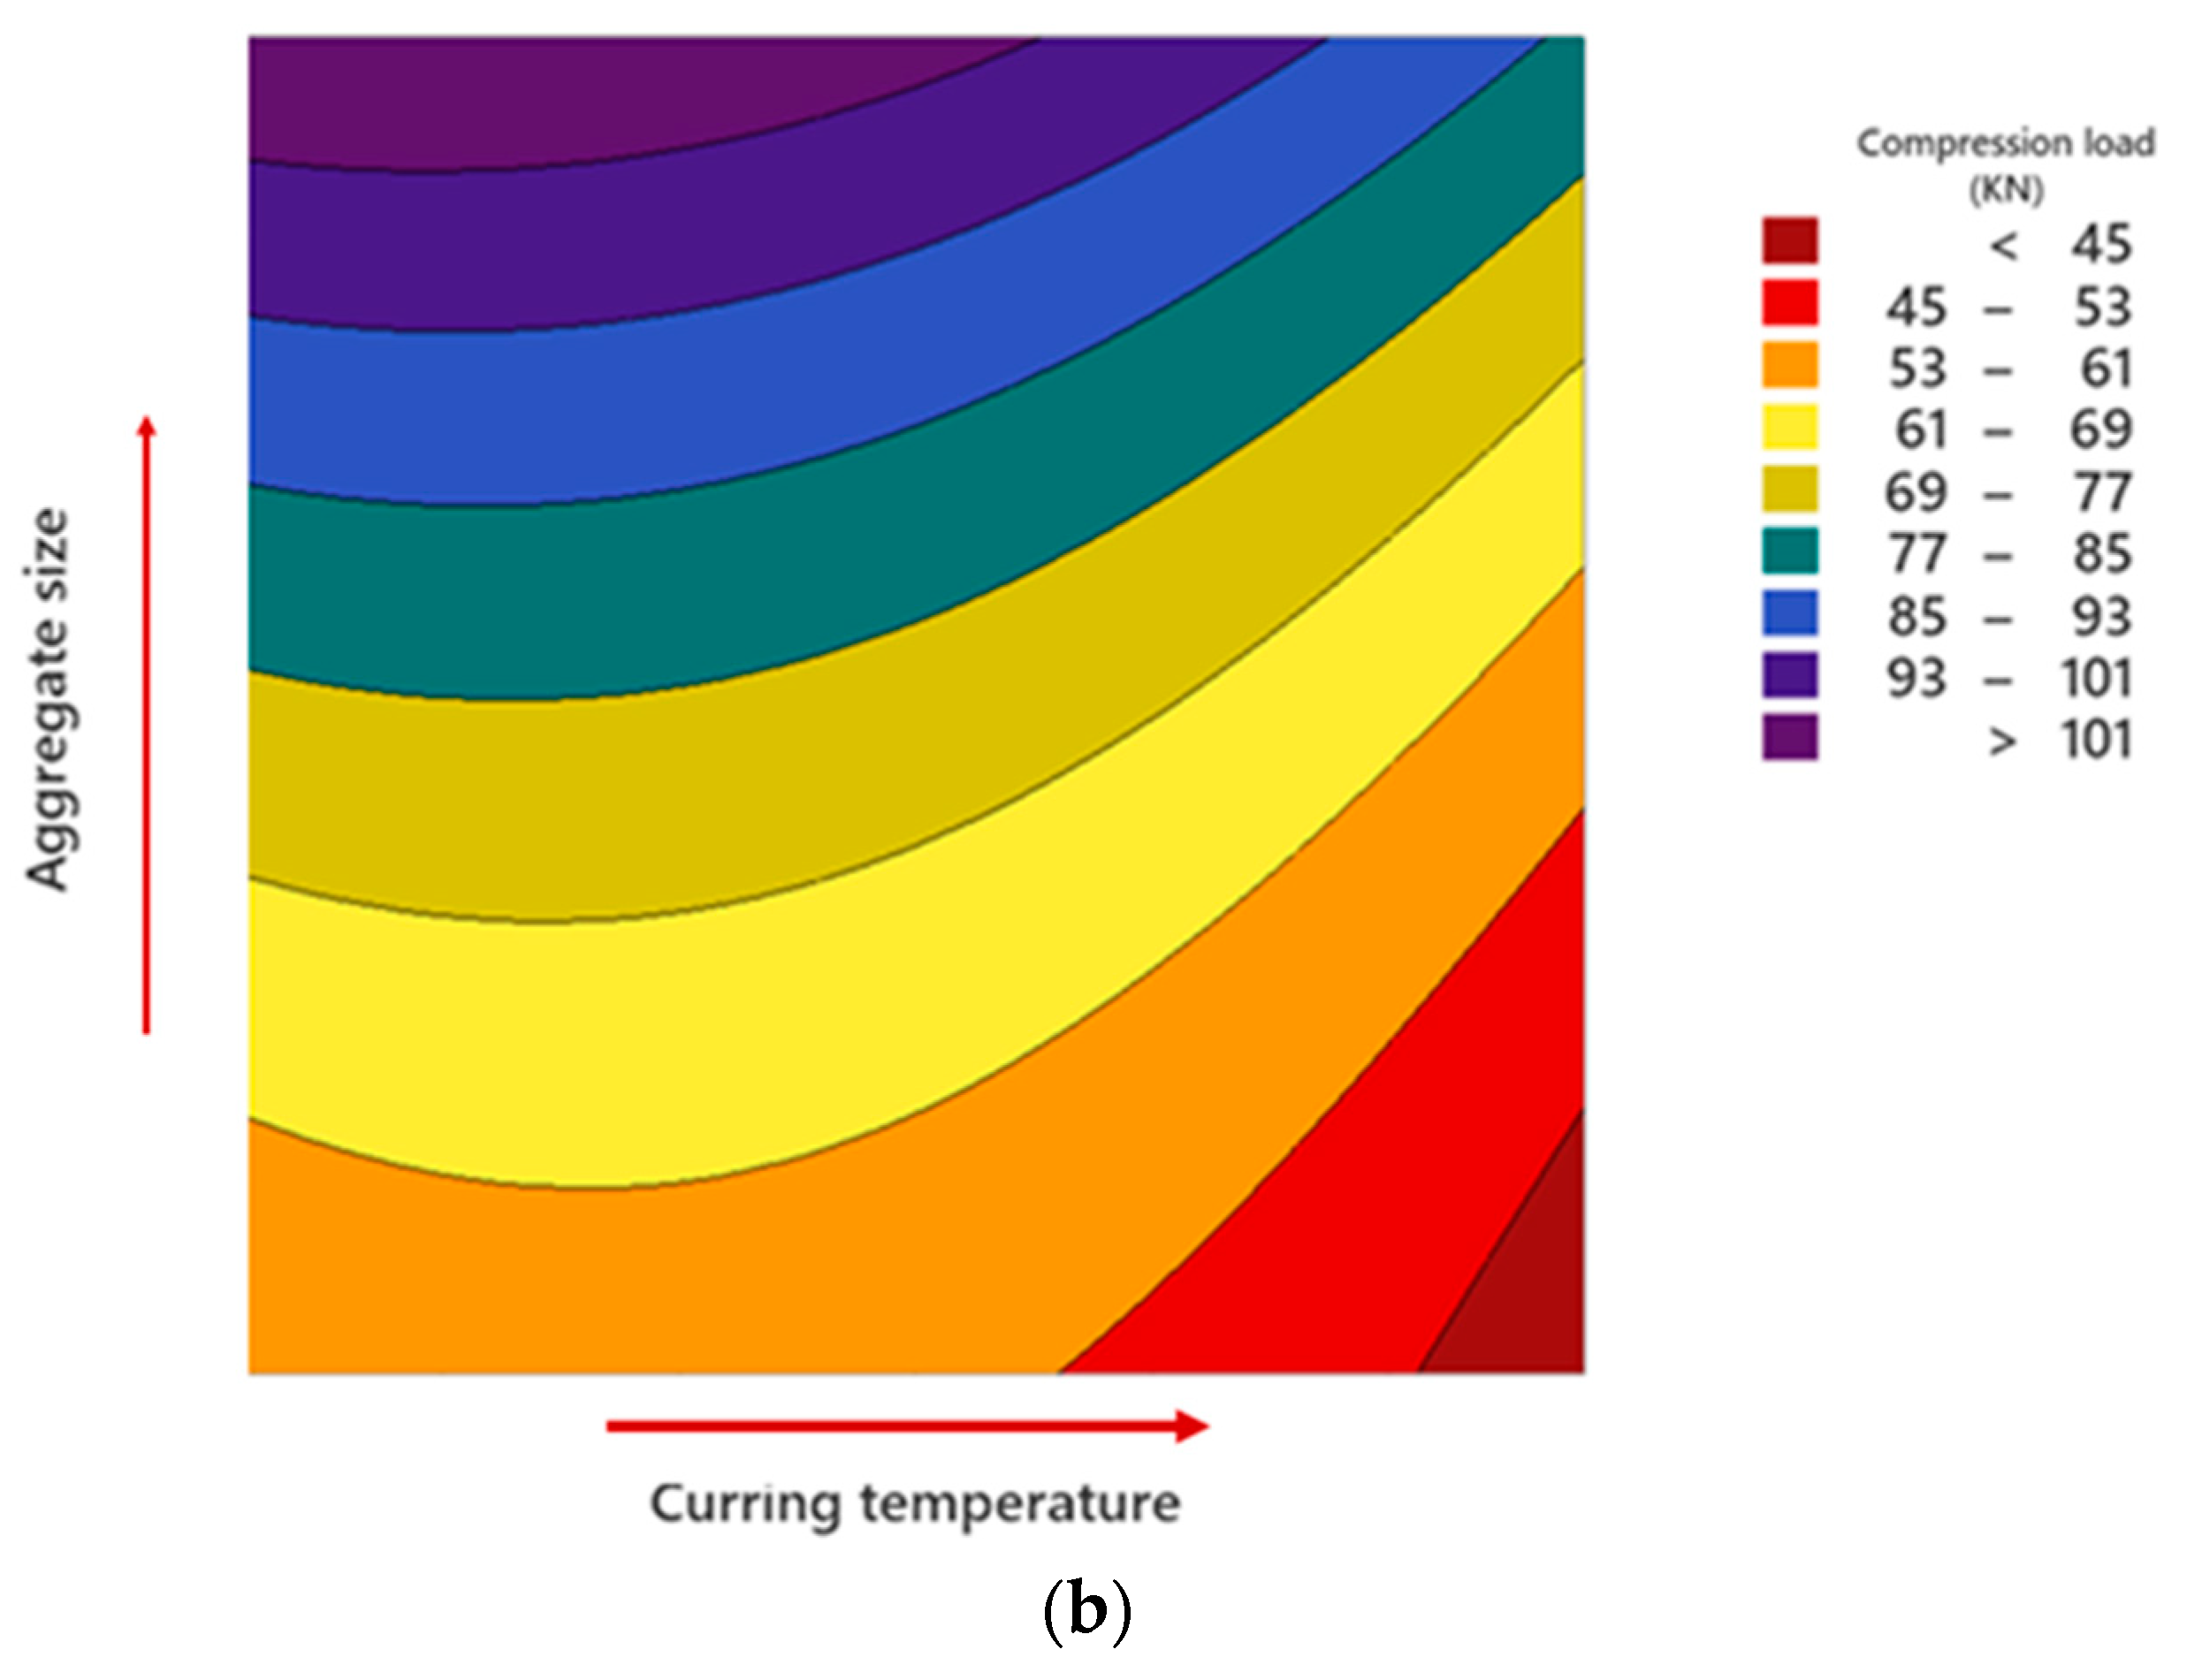
  • The results obtained from the response surface analysis for both aggregate geometries (rounded and angular) show that when the curing temperature increases, the compressive strength of the concrete decreases. Additionally, increasing the size of aggregate leads to the compressive strength of the concrete increasing. As a result, the appearance of the aggregate has no effect on this overall trend. This is fully consistent with the analysis of the data in Figure 6 and the justifications stated at the end of Section 3, which also demonstrates the accuracy of the response surface analysis.
  • According to the contours presented in the response surface analysis, it is clear that in order to have the maximum compressive strength of the concrete, the largest size of aggregate should be selected. Although it is clear that the color spectra of angular aggregates are greater than the color spectra of rounded aggregates (dark violet is not present in Figure 8a). This means that the ranges of compressive strength changes are more sensitive to the angular aggregate geometry. On the other hand, it is clear that the boundary lines separating the color spectrum are curved, which can be considered a segment of the elliptical geometric shape, which is necessary to obtain the optimal states. It is necessary to calculate and consider the minimum in the local coordinates of the curvature lines representing the best state.
  • If the maximum aggregate size is used, the results for both aggregate geometry (rounded and angular) show that in order to have the maximum compressive strength, the curing temperature should be in the range of 5–15 °C (dark blue and dark purple in Figure 8a,b, respectively). This issue is exactly in line with the interpretation provided in the last paragraph of Section 3 of this article.
  • From the compressive strength intervals presented in the results of the response surface analysis, it can be clearly seen that in the best conditions, the maximum compressive strengths for rounded and angular aggregates are equal to 101 and 130 MPa, respectively. In other words, using rounded aggregates with maximum aggregate size and considering the best curing conditions (5 < T < 15) leads to a 30% increase in compressive strength of concrete with similar conditions and the use of angular aggregates.
Next, the appropriate structure of the primary neural network was found using the trial-and-error method, and then the correlation between the results of the train and test data with the results of the primary neural network is demonstrated in Figure 9. Furthermore, to improve the performance of the prediction, the neural network and genetic algorithm were combined to decrease MSE. The comparison results of the predicted and experimental data for BPNN-GA are illustrated in Figure 10.
As mentioned earlier, different statistical criteria (i.e., R, MSE, RMSE, and MAE) were utilized to evaluate the performance of the neural networks. The values of these parameters for the training data, test data, and all data are reported in Table 3. The results of different criteria show that the performance and confident predictions of BPNN-GA are more than BPNN. Moreover, by comparing Figure 9b and Figure 10b, related to testing the presented models without and with optimizing the neural network structure with the genetic algorithm, visually, it is clear that by using the genetic algorithm, the laboratory data fit better on the prediction line. In other words, the prediction accuracy increases by using the neural network optimized by the genetic algorithm.

7. Conclusions

In this study, the response surface analysis and a newly developed back-propagation neural network optimized by the genetic algorithm were applied to determine the effect of aggregates’ size and shape and curing conditions such as wind temperature on the strength of conventional concrete. According to the results, the following conclusions are derived:
  • Concrete specimens with rounded aggregates possess much higher compressive strength compared to concrete specimens with angular aggregates;
  • With increasing the aggregate size, the compressive strength of concrete increases;
  • An increase in the curing temperature leads to a decrease in the compressive strength of the concrete;
  • An increase in aggregate size increases the effects of the curing temperature on the compressive strength of the concrete;
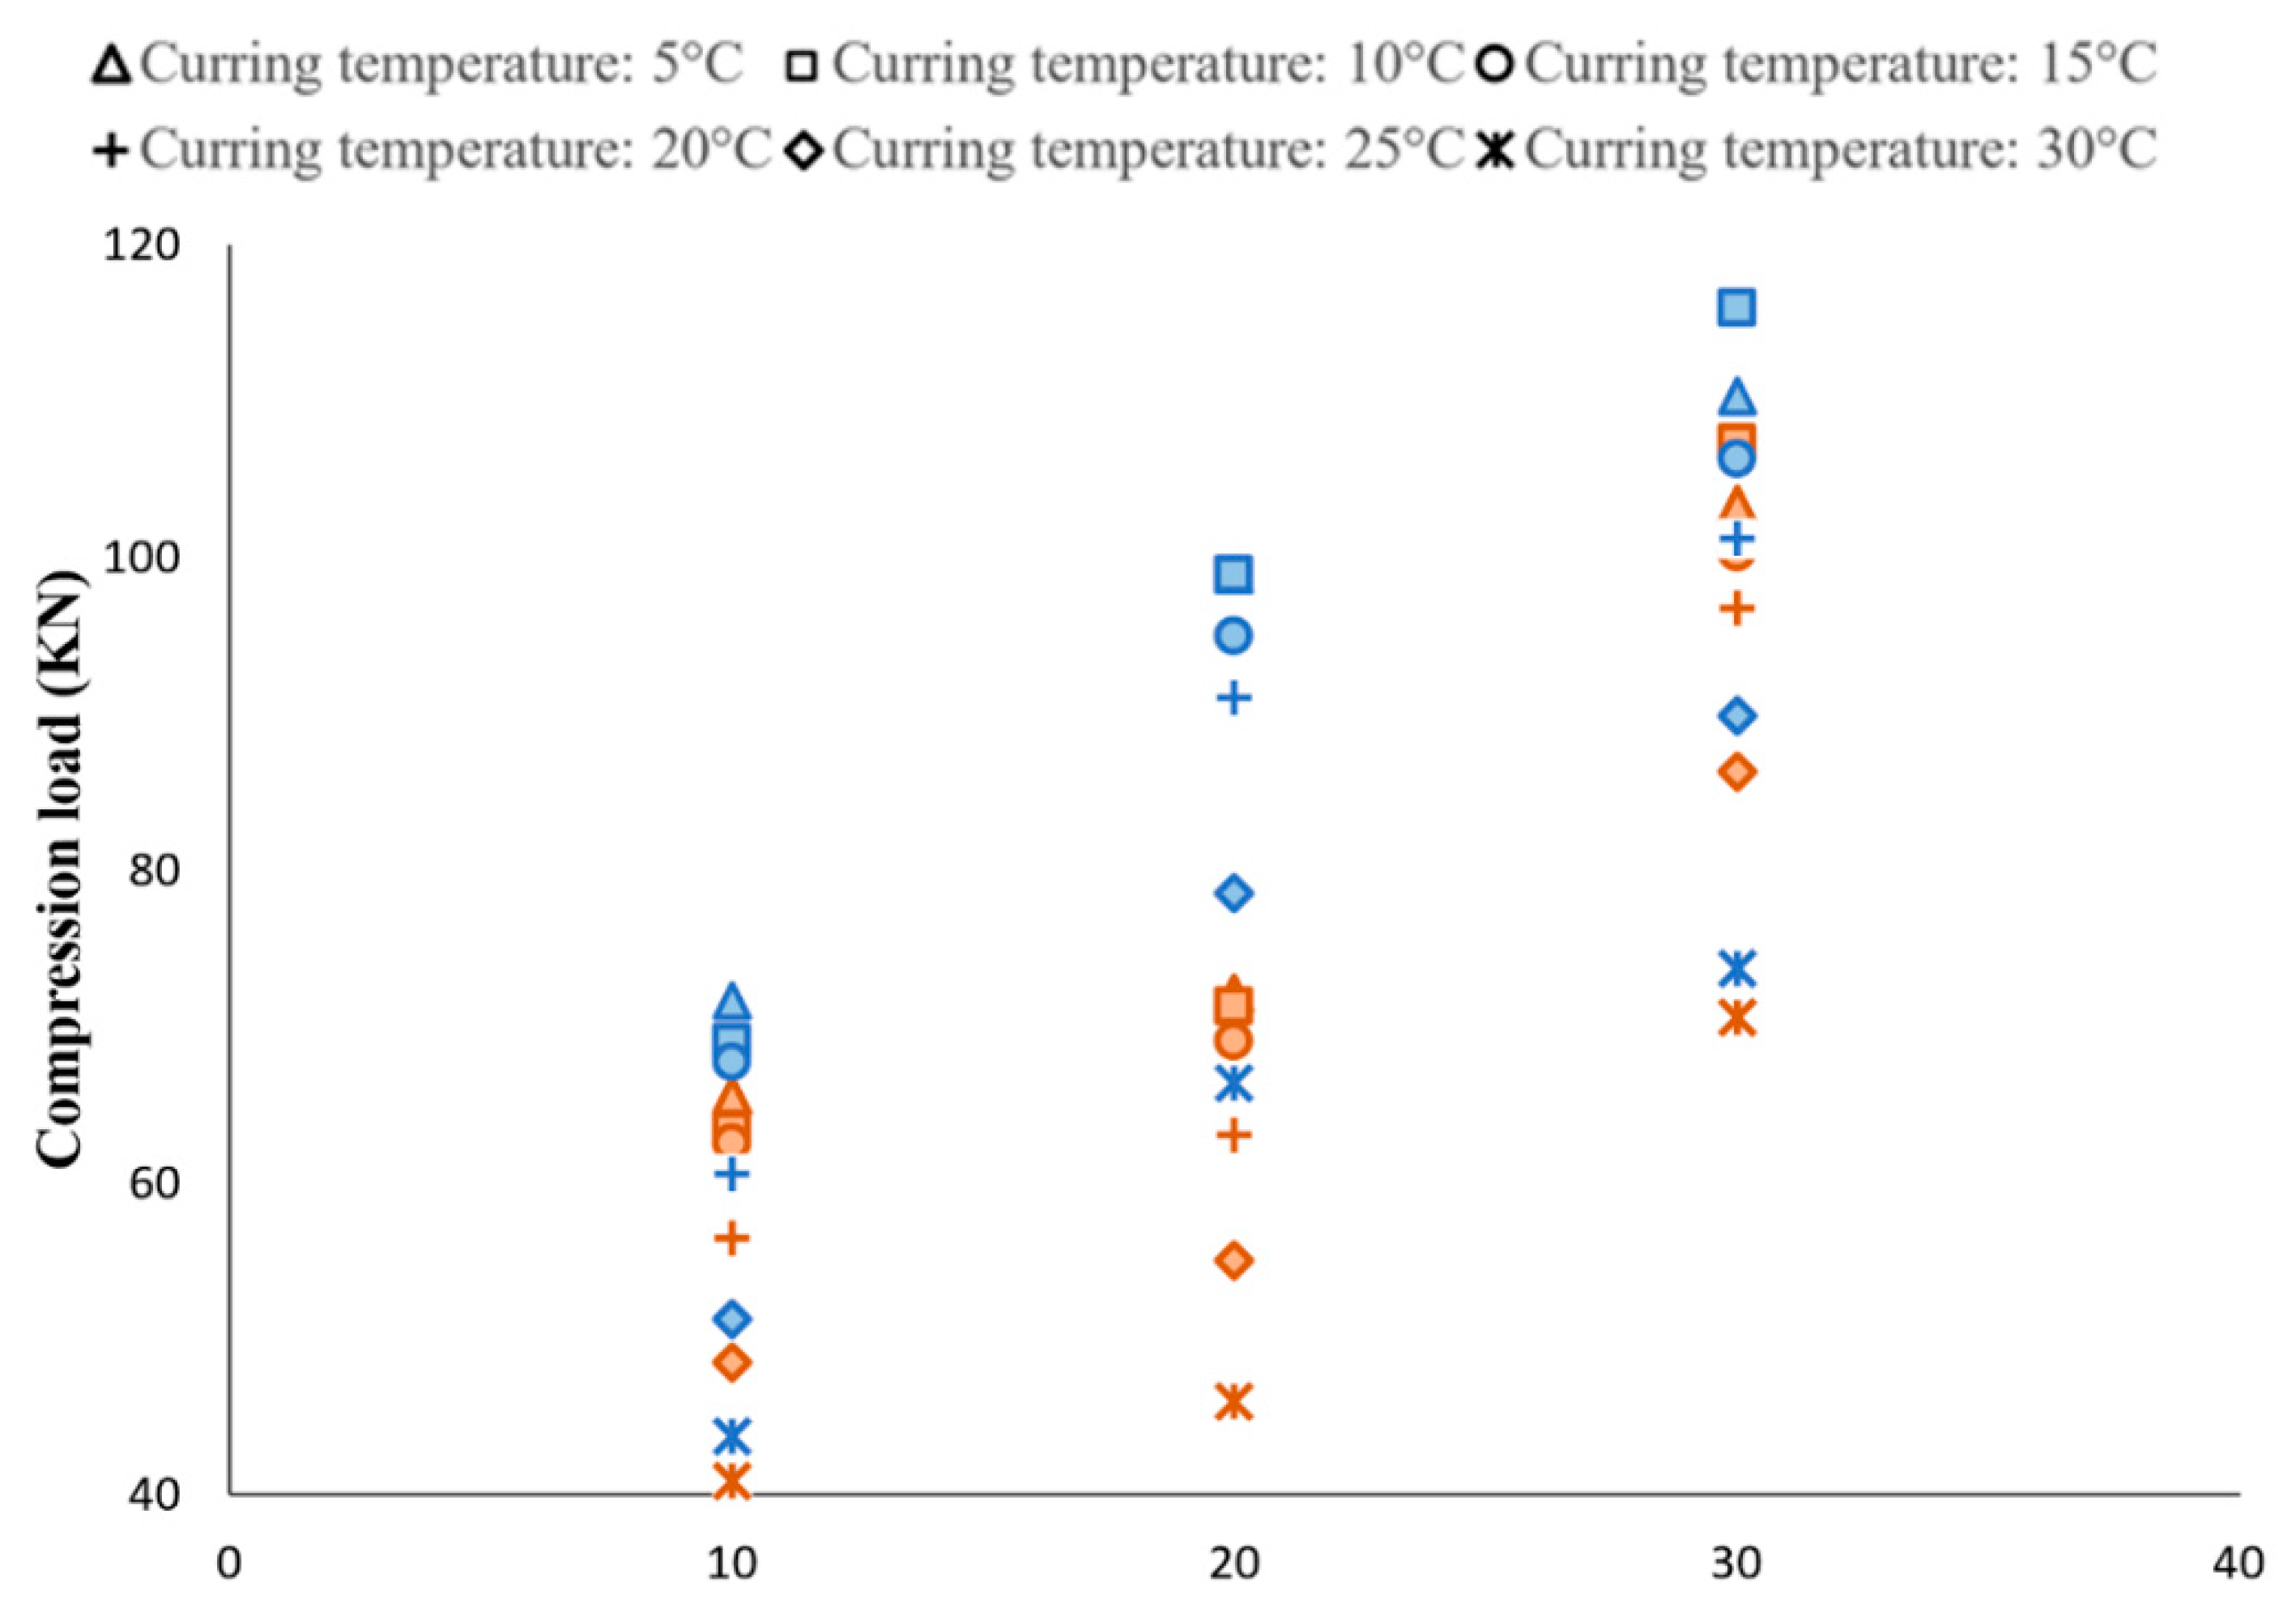
  • The observed nonuniformity trend between the results is related to the heterogeneity in the arrangement or location of aggregates in concrete;
  • The presence of an angle plays a key role as the stress concentration and the formation of cracks in the mortar, which greatly depends on the number and the size of small angles (less than 90 degrees) in the concrete. The closer the aggregate angle is to zero, the higher the concentration intensity in the mortar and the lower the compressive strength of the concrete sample;
  • The ranges of compressive strength changes are more sensitive to the angular aggregate geometry;
  • The highest compressive strength in concrete specimens for both aggregate shapes is achieved with a 10 °C curing temperature;
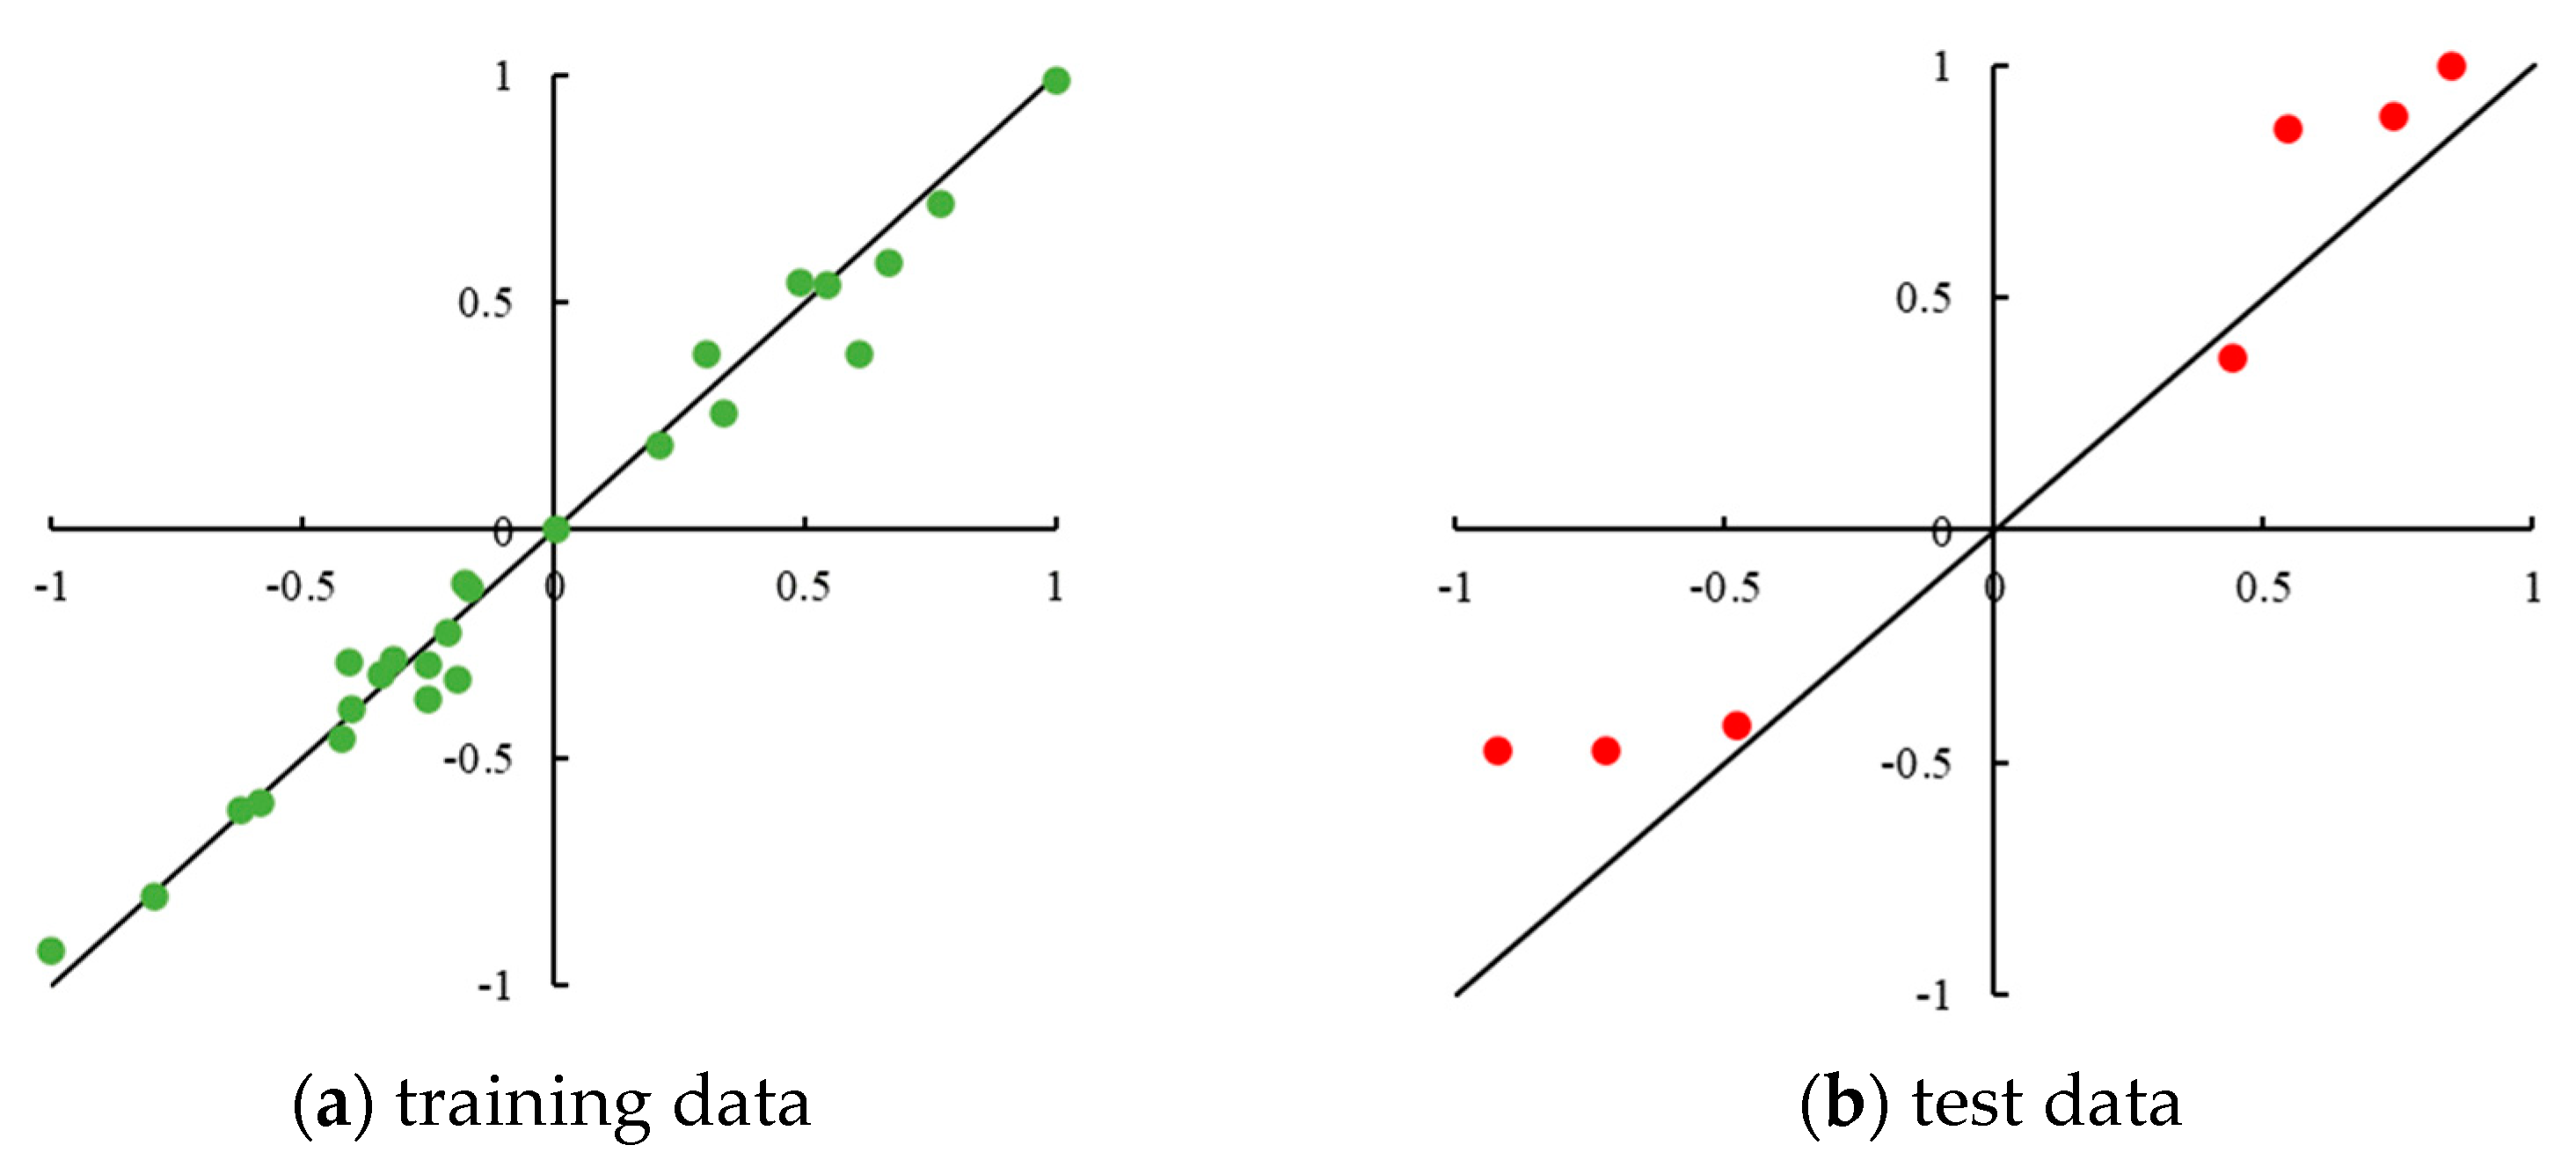
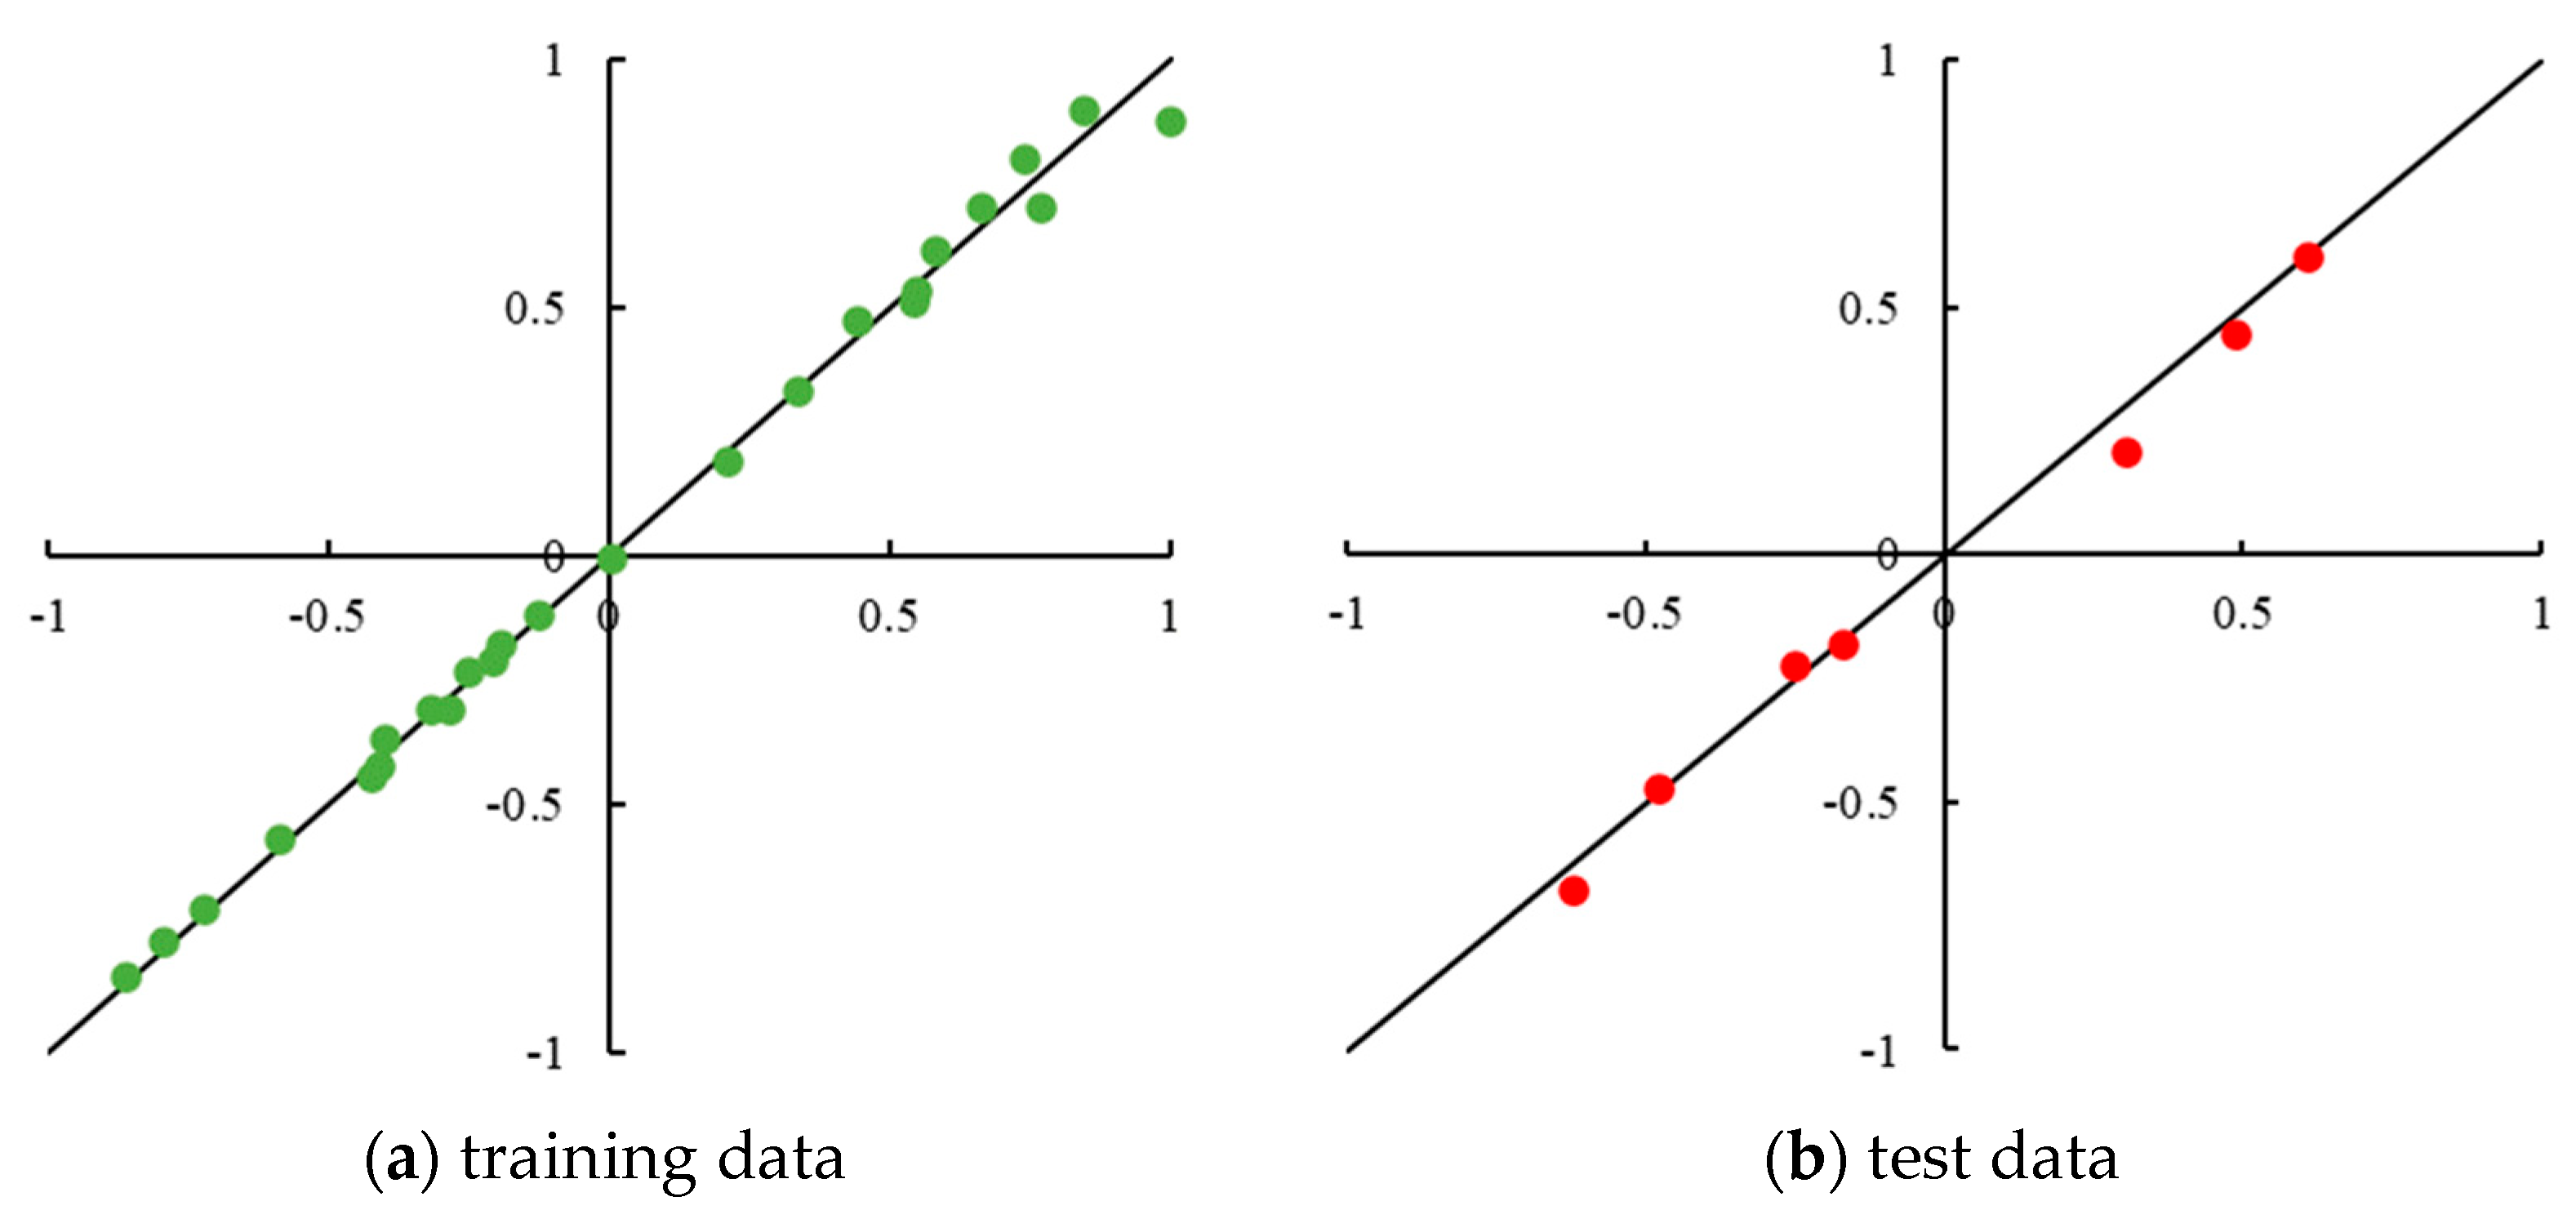
  • Neural network optimized by algorithm genetic provides more accurate results, i.e., the laboratory data fitted better on the prediction line.

Author Contributions

Conceptualization, K.R.K.; methodology, K.R.K. and N.A.; software, K.R.K., N.A. and N.A.; validation, K.R.K., N.A., S.G. and K.S.; formal analysis, K.R.K., N.A. and S.G.; investigation, K.R.K., N.A. and S.G.; resources, K.R.K., N.A., S.G. and K.S.; data curation, K.R.K. and N.A.; writing—original draft preparation, K.R.K., N.A. and K.S.; writing—review and editing, K.R.K. and S.G.; visualization, K.R.K.; supervision, K.R.K.; project administration, K.R.K.; funding acquisition, K.R.K. and S.G. All authors have read and agreed to the published version of the manuscript.

Funding

This research received no external funding.

Institutional Review Board Statement

Not applicable.

Informed Consent Statement

Informed consent was obtained from all subjects involved in the study.

Data Availability Statement

The data that support the findings of this study are available from the corresponding author upon reasonable request.

Acknowledgments

This paper has been supported by the RUDN University Strategic Academic Leadership Program.

Conflicts of Interest

The authors declare no conflict of interest.

Appendix A

Table A1. Results of the uniaxial mechanical test under compression load and the details of data used in each stage of the neural network structure.
Experiment No.Specimen No.Repeat No.Strength (N)Mean Results (N)Training (ANN)Testing (ANN)Validation (ANN)
110S-R-5T171,327.171,664.8
2270,251.4
3373,415.9
410S-R-10T168,492.368,967.4
5268,587.2
6369,822.7
710S-R-15T166,86167,674.9
8266,286.7
9369,877
1010S-R-20T159,114.760,510.3
11258,673.5
12363,742.7
1310S-R-25T149,395.251,235.9
14249,842.1
15354,470.4
1610S-R-30T146,067.543,761
17245,249.1
18339,966.4
1920S-R-5T198,55098,928.2
20298,285.3
21399,949.3
2220S-R-10T199,417.898,894.7
23299,813.5
24397,452.8
2520S-R-15T194,039.1694,939.3
26294,668.3
27396,110.44
2820S-R-20T192,579.991,000.5
29293,036.8
30387,384.8
3120S-R-25T176,488.878,499.3
32277,212.5
33381,796.6
3420S-R-30T169,37266,372
35268,044.9
36361,699.1
3730S-R-5T1110,808.3110,295.6
382112,549.1
393107,529.4
4030S-R-10T1116,790.2115,963.1
412113,983.4
423117,115.7
4330S-R-15T1105,251.8106,306.7
442108,002
453105,666.3
4630S-R-20T1103,123.3101,249.1
47299,897.5
483100,726.5
4930S-R-25T192,283.189,866.6
50295,732
51381,584.7
5230S-R-30T169,84673,665.8
53272,198.2
54378,953.2
5510S-A-5T165,210.4965,561.7
56264,937.1
57366,537.51
5810S-A-10T163,802.563,308.4
59263,489.4
60362,633.3
6110S-A-15T161,651.5462,498
62261,073.1
63364,769.36
6410S-A-20T154,939.6856,391.1
65255,791.3
66358,442.32
6710S-A-25T146,586.0748,500.4
68245,985.7
69352,929.43
7010S-A-30T143,243.4640,844.7
71240,013.68
72339,276.96
7320S-A-5T171,668.4572,082.2
74270,882.4
75373,695.75
7620S-A-10T170,673.2371,245.5
77271,964.9
78371,098.37
7920S-A-15T168,035.7569,020.5
80267,145
81371,880.75
8220S-A-20T161,283.0463,010.9
83262,435.6
84365,314.06
8520S-A-25T157,222.3955,022.9
86255,998.2
87351,848.11
8820S-A-30T149,23145,949
89240,379.6
90348,236.4
9130S-A-5T1102,781.5103,360.9
922101,729.5
933105,571.7
9430S-A-10T1106,382.9107,317.5
952105,097.8
963110,471.8
9730S-A-15T1101,490.2100,298.2
982103,727.6
99395,676.76
10030S-A-20T194,583.0596,700.9
101290,389.1
1023105,130.5
10330S-A-25T189,030.2586,299.6
104284,037.54
105385,831.02
10630S-A-30T166,212.7370,529.1
107262,824.3
108382,550.27
The black background indicates in which part of the neural network, including training, testing, and validation, the sample information was used.

References

  1. Ahmad, M.; Ahmad, F.; Wróblewski, P.; Al-Mansob, R.A.; Olczak, P.; Kamiński, P.; Safdar, M.; Rai, P. Prediction of Ultimate Bearing Capacity of Shallow Foundations on Cohesionless Soils: A Gaussian Process Regression Approach. Appl. Sci. 2021, 11, 10317. [Google Scholar] [CrossRef]
  2. Ahmad, M.; Amjad, M.; Al-Mansob, R.A.; Kamiński, P.; Olczak, P.; Khan, B.J.; Alguno, A.C. Prediction of Liquefaction-Induced Lateral Displacements Using Gaussian Process Regression. Appl. Sci. 2022, 12, 1977. [Google Scholar] [CrossRef]
  3. Omidi Bidgoli, M.; Reza Kashyzadeh, K.; Rahimian Koloor, S.S.; Petru, M. Estimation of critical dimensions for the crack and pitting corrosion defects in the oil storage tank using finite element method and taguchi approach. Metals 2020, 10, 1372. [Google Scholar] [CrossRef]
  4. Reza Kashyzadeh, K.; Mousavi Bafrouyi, S.M.S.; Khorsandijou, S.M. Effects of road roughness, aerodynamics, and weather conditions on automotive wheel force. Int. J. Eng. 2021, 34, 536–546. [Google Scholar]
  5. Ahmad, F.; Tang, X.W.; Qiu, J.N.; Wróblewski, P.; Ahmad, M.; Jamil, I. Prediction of slope stability using Tree Augmented Naive-Bayes classifier: Modeling and performance evaluation. Math. Biosci. Eng. 2022, 19, 4526–4546. [Google Scholar] [CrossRef]
  6. Ahmad, M.; Tang, X.W.; Qiu, J.N.; Ahmad, F.; Gu, W.J. Application of machine learning algorithms for the evaluation of seismic soil liquefaction potential. Front. Struct. Civil Eng. 2021, 15, 490–505. [Google Scholar] [CrossRef]
  7. Maleki, E.; Unal, O.; Seyedi Sahebari, S.M.; Reza Kashyzadeh, K.; Danilov, I. Application of Deep Neural Network to Predict the High-Cycle Fatigue Life of AISI 1045 Steel Coated by Industrial Coatings. J. Marine Sci. Eng. 2022, 10, 128. [Google Scholar] [CrossRef]
  8. Ahmad, M.; Kamiński, P.; Olczak, P.; Alam, M.; Iqbal, M.J.; Ahmad, F.; Sasui, S.; Khan, B.J. Development of Prediction Models for Shear Strength of Rockfill Material Using Machine Learning Techniques. Appl. Sci. 2021, 11, 6167. [Google Scholar] [CrossRef]
  9. Benidir, A.; Mahdad, M.H.; Brara, A. Aggregate size and lateral dimension effects on core compressive strength of concrete. In Proceedings of the IRF2018: 6th International Conference Integrity-Reliability-Failure, Lisbon, Portugal, 22–26 July 2018; pp. 479–486. [Google Scholar]
  10. Kilic, A.; Teymen, A.; Ozdemir, O.; Atis, C.D. Estimation of compressive strength of concrete using physico-mechanical properties of aggregate rock. IJST-T. Civ. Eng. 2019, 43, 171–178. [Google Scholar]
  11. Ahmad, M.; Al-Mansob, R.A.; Jamil, I.; Al-Zubi, M.A.; Sabri, M.M.S.; Alguno, A.C. Prediction of Rockfill Materials’ Shear Strength Using Various Kernel Function-Based Regression Models—A Comparative Perspective. Materials 2022, 15, 1739. [Google Scholar] [CrossRef]
  12. Li, M.; Hao, H.; Shi, Y.; Hao, Y. Specimen shape and size effects on the concrete compressive strength under static and dynamic tests. Constr. Build. Mater. 2018, 161, 84–93. [Google Scholar] [CrossRef]
  13. Chopra, P.; Sharma, R.K.; Kumar, M. Prediction of compressive strength of concrete using artificial neural network and genetic programming. Adv. Mater. Sci. Eng. 2016, 2016, 7648467. [Google Scholar] [CrossRef] [Green Version]
  14. Khademi, F.; Behfarnia, K. Evaluation of concrete compressive strength using artificial neural network and multiple linear regression models. Int. J. Optim. Civ. 2016, 6, 423–432. [Google Scholar]
  15. Nikoo, M.; Zarfam, P.; Sayahpour, H. Determination of compressive strength of concrete using Self Organization Feature Map (SOFM). Eng. Comput. 2015, 31, 113–121. [Google Scholar] [CrossRef]
  16. Nikoo, M.; Moghadam, F.T.; Sadowski, L. Prediction of concrete compressive strength by evolutionary artificial neural networks. Adv. Mater. Sci. Eng. 2015, 2015, 849126. [Google Scholar] [CrossRef]
  17. Khademi, F.; Akbari, M.; Jamal, M.S.; Nikoo, M. Multiple linear regression, artificial neural network, and fuzzy logic prediction of 28 days’ compressive strength of concrete. Front. Struct. Civ. Eng. 2017, 11, 90–99. [Google Scholar] [CrossRef]
  18. Young, B.A.; Hall, A.; Pilon, L.; Gupta, P.; Sant, G. Can the compressive strength of concrete be estimated from knowledge of the mixture proportions?: New insights from statistical analysis and machine learning methods. Cem. Concr. Res. 2019, 115, 379–388. [Google Scholar] [CrossRef]
  19. Kashyzadeh, K.R.; Ghorbani, S.; Forouzanmehr, M. Effects of drying temperature and aggregate shape on the concrete compressive strength: Experiments and data mining techniques. IJE 2020, 33, 1780–1791. [Google Scholar]
  20. Mata, J. Interpretation of concrete dam behaviour with artificial neural network and multiple linear regression models. Eng. Struct. 2011, 33, 903–910. [Google Scholar] [CrossRef]
  21. Bal, L.; Bodin, F.B. Artificial neural network for predicting drying shrinkage of concrete. Constr. Build. Mater. 2013, 38, 248–254. [Google Scholar] [CrossRef]
  22. Kaplan, G.; Yaprak, H.; Memiş, S.; Alnkaa, A. Artificial neural network estimation of the effect of varying curing conditions and cement type on hardened concrete properties. Bldg 2019, 9, 10. [Google Scholar] [CrossRef] [Green Version]
  23. Bilgehan, M. A comparative study for the concrete compressive strength estimation using neural network and neuro-fuzzy modelling approaches. Nondestruct. Test. Eval. 2011, 26, 35–55. [Google Scholar] [CrossRef]
  24. Standard Practice for Selecting Proportions for Normal, Heavyweight, and Mass Concrete (ACI-211.1-91), American Concrete Institute. Available online: https://kashanu.ac.ir/Files/aci%20211_1_91.pdf (accessed on 8 March 2002).
  25. Sims, I.; Lay, J.; Ferrari, J. Chapter 15: Concrete Aggregates. In Lea’s Chemistry of Cement and Concrete, 5th ed.; Hewlett, P.C., Liska, M., Eds.; Butterworth-Heinemann: Oxford, UK, 2019; pp. 699–778. [Google Scholar] [CrossRef]
  26. Aggregates. Aggregates for Bituminous Mixtures and Surface Treatments for Roads, Airfields and Other Trafficked Areas. Guidance on the Use of BS EN 13043. Available online: http://worldcat.org/isbn/9780580669590 (accessed on 8 March 2002).
  27. ISO-1920-3; Testing of Concrete-Part 3: Making and Curing Test Specimens. International Standardization Organization: Geneva, Switzerland, 2004.
  28. ISO-1920-4; Testing of Concrete-Part 4: Strength of Hardened Concrete. International Standardization Organization: Geneva, Switzerland, 2005.
  29. Maleki, E.; Unal, O.; Kashyzadeh, K.R. Influences of shot peening parameters on mechanical properties and fatigue behavior of 316 L steel: Experimental, Taguchi method and response surface methodology. Met. Mater. Int. 2021, 27, 4418–4440. [Google Scholar] [CrossRef]
  30. Ghorbani, S.; Ghorbani, S.; Kashyzadeh, K.R. Taguchi approach and response surface analysis for design of a high-performance single-walled carbon nanotube bundle interconnects in a full adder. IJE 2020, 33, 1598–1607. [Google Scholar]
  31. Kashyzadeh, K.R.; Farrahi, G.H.; Shariyat, M.; Ahmadian, M.T. Experimental and finite element studies on free vibration of automotive steering knuckle. IJE 2017, 30, 1776–1783. [Google Scholar]
  32. Farrahi, G.H.; Kashyzadeh, K.R.; Minaei, M.; Sharifpour, A.; Riazi, S. Analysis of resistance spot welding process parameters effect on the weld quality of three-steel sheets used in automotive industry: Experimental and finite element simulation. IJE 2020, 33, 148–157. [Google Scholar]
  33. Pahlavani, M.; Marzbanrad, J.; Kashyzadeh, K.R. Effect of annealing temperature and cutting angle of specimens on metallurgical and mechanical properties of Mg-7Li-1Zn alloy via Taguchi approach and response surface analysis. In Proceedings of the IOP Conference Series: Materials Science and Engineering, Coimbatore, India, 12–13 March 2021; Volume 1126, p. 012044. [Google Scholar] [CrossRef]
  34. Kashyzadeh, K.R.; Koloor, S.S.R.; Bidgoli, M.O.; Petrů, M.; Asfarjani, A.A. An optimum fatigue design of polymer compositecompressed natural gas tank using hybrid finite element-response surface methods. Polymers 2021, 13, 483. [Google Scholar] [CrossRef] [PubMed]
  35. Azadeh, A.; Maghsoudi, A.; Sohrabkhani, S. An integrated artificial neural networks approach for predicting global radiation. Energy Convers. Manag. 2009, 50, 1497–1505. [Google Scholar] [CrossRef]
  36. Mellit, A.; Eleuch, H.; Benghanem, M.; Elaoun, C.; Pavan, A.M. An adaptive model for predicting of global, direct and diffuse hourly solar irradiance. Energy Convers. Manag. 2010, 51, 771–782. [Google Scholar] [CrossRef]
  37. Naderpour, H.; Kheyroddin, A.; Amiri, G.G. Prediction of FRP-confined compressive strength of concrete using artificial neural networks. Compos. Struct. 2010, 92, 2817–2829. [Google Scholar] [CrossRef]
  38. Maleki, E.; Reza Kashyzadeh, K. Effects of the hardened nickel coating on the fatigue behavior of CK45 steel: Experimental, finite element method, and artificial neural network modeling. Iranian J. Mater. Sci. Eng. 2017, 14, 81–99. [Google Scholar]
  39. Reza Kashyzadeh, K.; Maleki, E. Experimental investigation and artificial neural network modeling of warm galvanization and hardened chromium coatings thickness effects on fatigue life of AISI 1045 carbon steel. J. Fail. Anal. Prevent. 2017, 17, 1276–1287. [Google Scholar] [CrossRef]
  40. Koza, J.R.; Deb, K.; Dorigo, M.; Fogel, D.; Garzon, M.; Iba, H.; Riolo, R. Genetic Programming 1997. In Proceedings of the Second Annual Conference, Morgan Kaufmann, Stanford University, Stanford, CA, USA, 13–16 July 1997; ISBN 1-55860-483-9. [Google Scholar]
  41. Coello, C.C.; Christiansen, A.D.; Hernandez, F.S. A simple genetic algorithm for the design of reinforced concrete beams. Eng. Comput. 1997, 13, 185–196. [Google Scholar] [CrossRef]
  42. Yao, X. Evolving artificial neural networks. Proc. IEEE 1999, 87, 1423–1447. [Google Scholar] [CrossRef] [Green Version]
  43. Harpham, C.; Dawson, C.W.; Brown, M.R. A review of genetic algorithms applied to training radial basis function networks. Neural Comput. Appl. 2004, 13, 193–201. [Google Scholar] [CrossRef]
  44. Li, R.; Xu, A.; Zhao, Y.; Chang, H.; Li, X.; Lin, G. Genetic algorithm (GA)-Artificial neural network (ANN) modeling for the emission rates of toxic volatile organic compounds (VOCs) emitted from landfill working surface. J. Environ. Manag. 2022, 305, 114433. [Google Scholar] [CrossRef] [PubMed]
  45. Su, K.; Zhang, J.; Zhang, J.; Yan, T.; Mei, G. Optimisation of current collection quality of high-speed pantograph-catenary system using the combination of artificial neural network and genetic algorithm. Veh. Syst. Dyn. 2022, 1–26. [Google Scholar] [CrossRef]
  46. Tong, D.L.; Mintram, R. Genetic Algorithm-Neural Network (GANN): A study of neural network activation functions and depth of genetic algorithm search applied to feature selection. Int. J. Mach. Learn. 2010, 1, 75–87. [Google Scholar] [CrossRef]
  47. Min, D.; Song, Z.; Chen, H.; Wang, T.; Zhang, T. Genetic algorithm optimized neural network based fuel cell hybrid electric vehicle energy management strategy under start-stop condition. Appl. Energy 2022, 306, 118036. [Google Scholar] [CrossRef]
  48. Chen, G.; Fu, K.; Liang, Z.; Sema, T.; Li, C.; Tontiwachwuthikul, P.; Idem, R. The genetic algorithm based back propagation neural network for MMP prediction in CO2-EOR process. Fuel 2014, 126, 202–212. [Google Scholar] [CrossRef]
Figure 1. Different geometries of aggregates: (a) general classification [25]; (b) rounded aggregates used in the present research; (c) angular aggregates used in the present research.
Buildings 12 00438 g001
Figure 2. Various sizes of aggregates used in the present research based on the BS EN 13043 standard.
Buildings 12 00438 g002
Figure 3. Codding details used to name laboratory specimens.
Buildings 12 00438 g003
Figure 4. The employed static test facilities.
Buildings 12 00438 g004
Figure 5. Bar chart of concrete compressive strength in terms of different curing conditions considering various geometries of aggregate, including (a) rounded aggregates and (b) angular aggregates.
Buildings 12 00438 g005aBuildings 12 00438 g005b
Figure 6. Mechanical test results for all batches of concrete specimens.
Buildings 12 00438 g006
Figure 7. The general framework of neural network and weight correction by genetic algorithm.
Buildings 12 00438 g007
Figure 8. Contour plot of compression load vs. simulations effects of aggregate size and curing temperature as a result of response surface analysis for different specimen batches, including (a) concrete specimen made of rounded aggregates and (b) concrete specimen made of angular aggregates.
Buildings 12 00438 g008aBuildings 12 00438 g008b
Figure 9. Comparison of experimental data and predicted data for BPNN.
Buildings 12 00438 g009
Figure 10. Comparison of experimental data and predicted data for BPNN-GA.
Buildings 12 00438 g010
Table 1. Initial neural network settings.
ParametersTitle 2
Number of hidden layers1
Number of neurons in hidden layer6
Transition function of hidden layerTansig
Transition function output layerTansig
Input Data form[−1,1]
Goal errorMSE
Training algorithmLM
Testing performanceR, MSE, RMSE, MAE
Table 2. Genetic algorithm settings for BPNN-GN.
ParametersValue
Population100
Crossover factor0.7
Mutation factor0.2
Table 3. Performance criteria for neural network evaluation.
CriteriaBPNNBPNN-GA
Training DataTest DataAll DataTraining DataTest DataAll Data
MSE0.0060.0590.01620.00140.00210.0017
R0.9760.9720.9770.9980.9960.997
RMSE0.0760.2430.1270.0370.0460.041
MAE0.0540.1890.0860.0260.0360.028
Publisher’s Note: MDPI stays neutral with regard to jurisdictional claims in published maps and institutional affiliations.

