
Determination of Optimum Building Envelope Parameters of a Room concerning Window-to-Wall Ratio, Orientation, Insulation Thickness and Window Type


Abstract
:1. Introduction
2. Materials and Methods
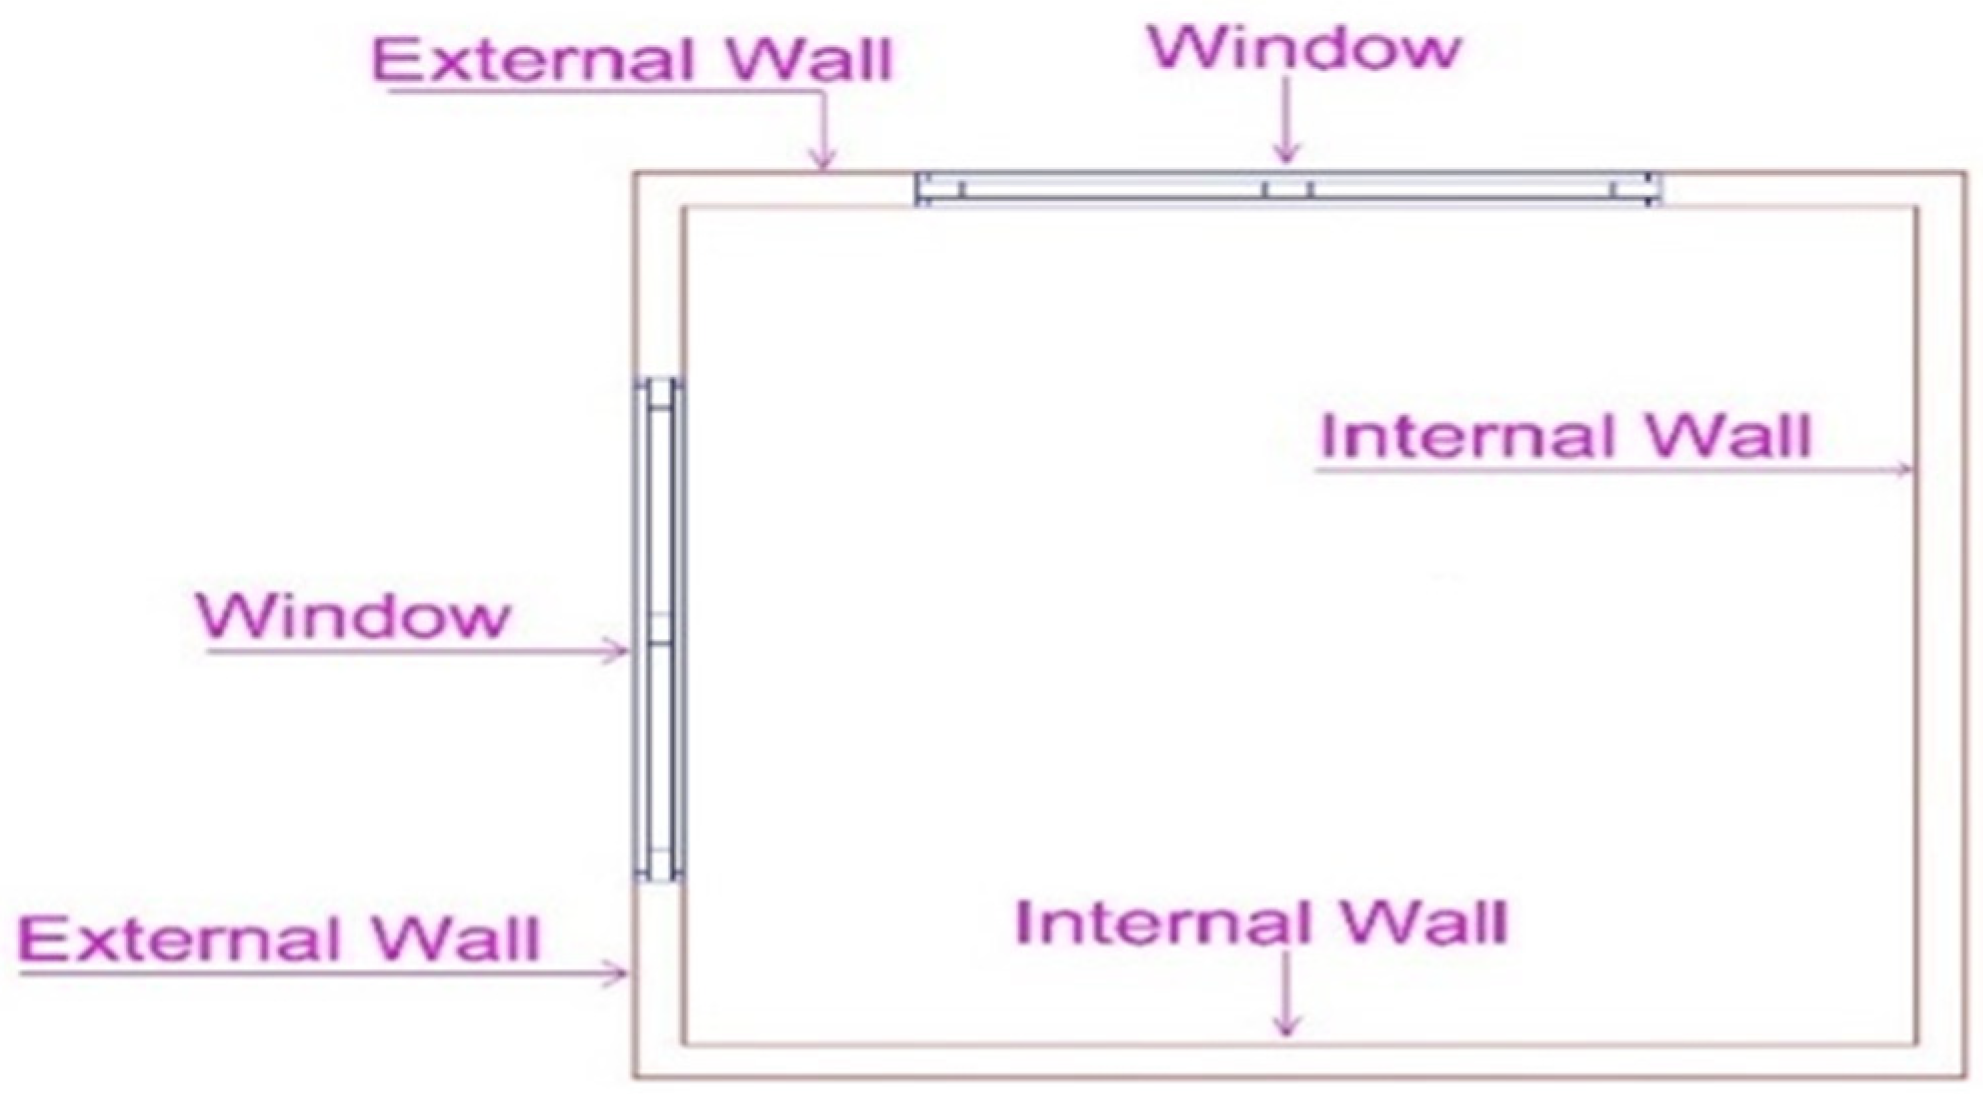
2.1. Description of the Reference Zone
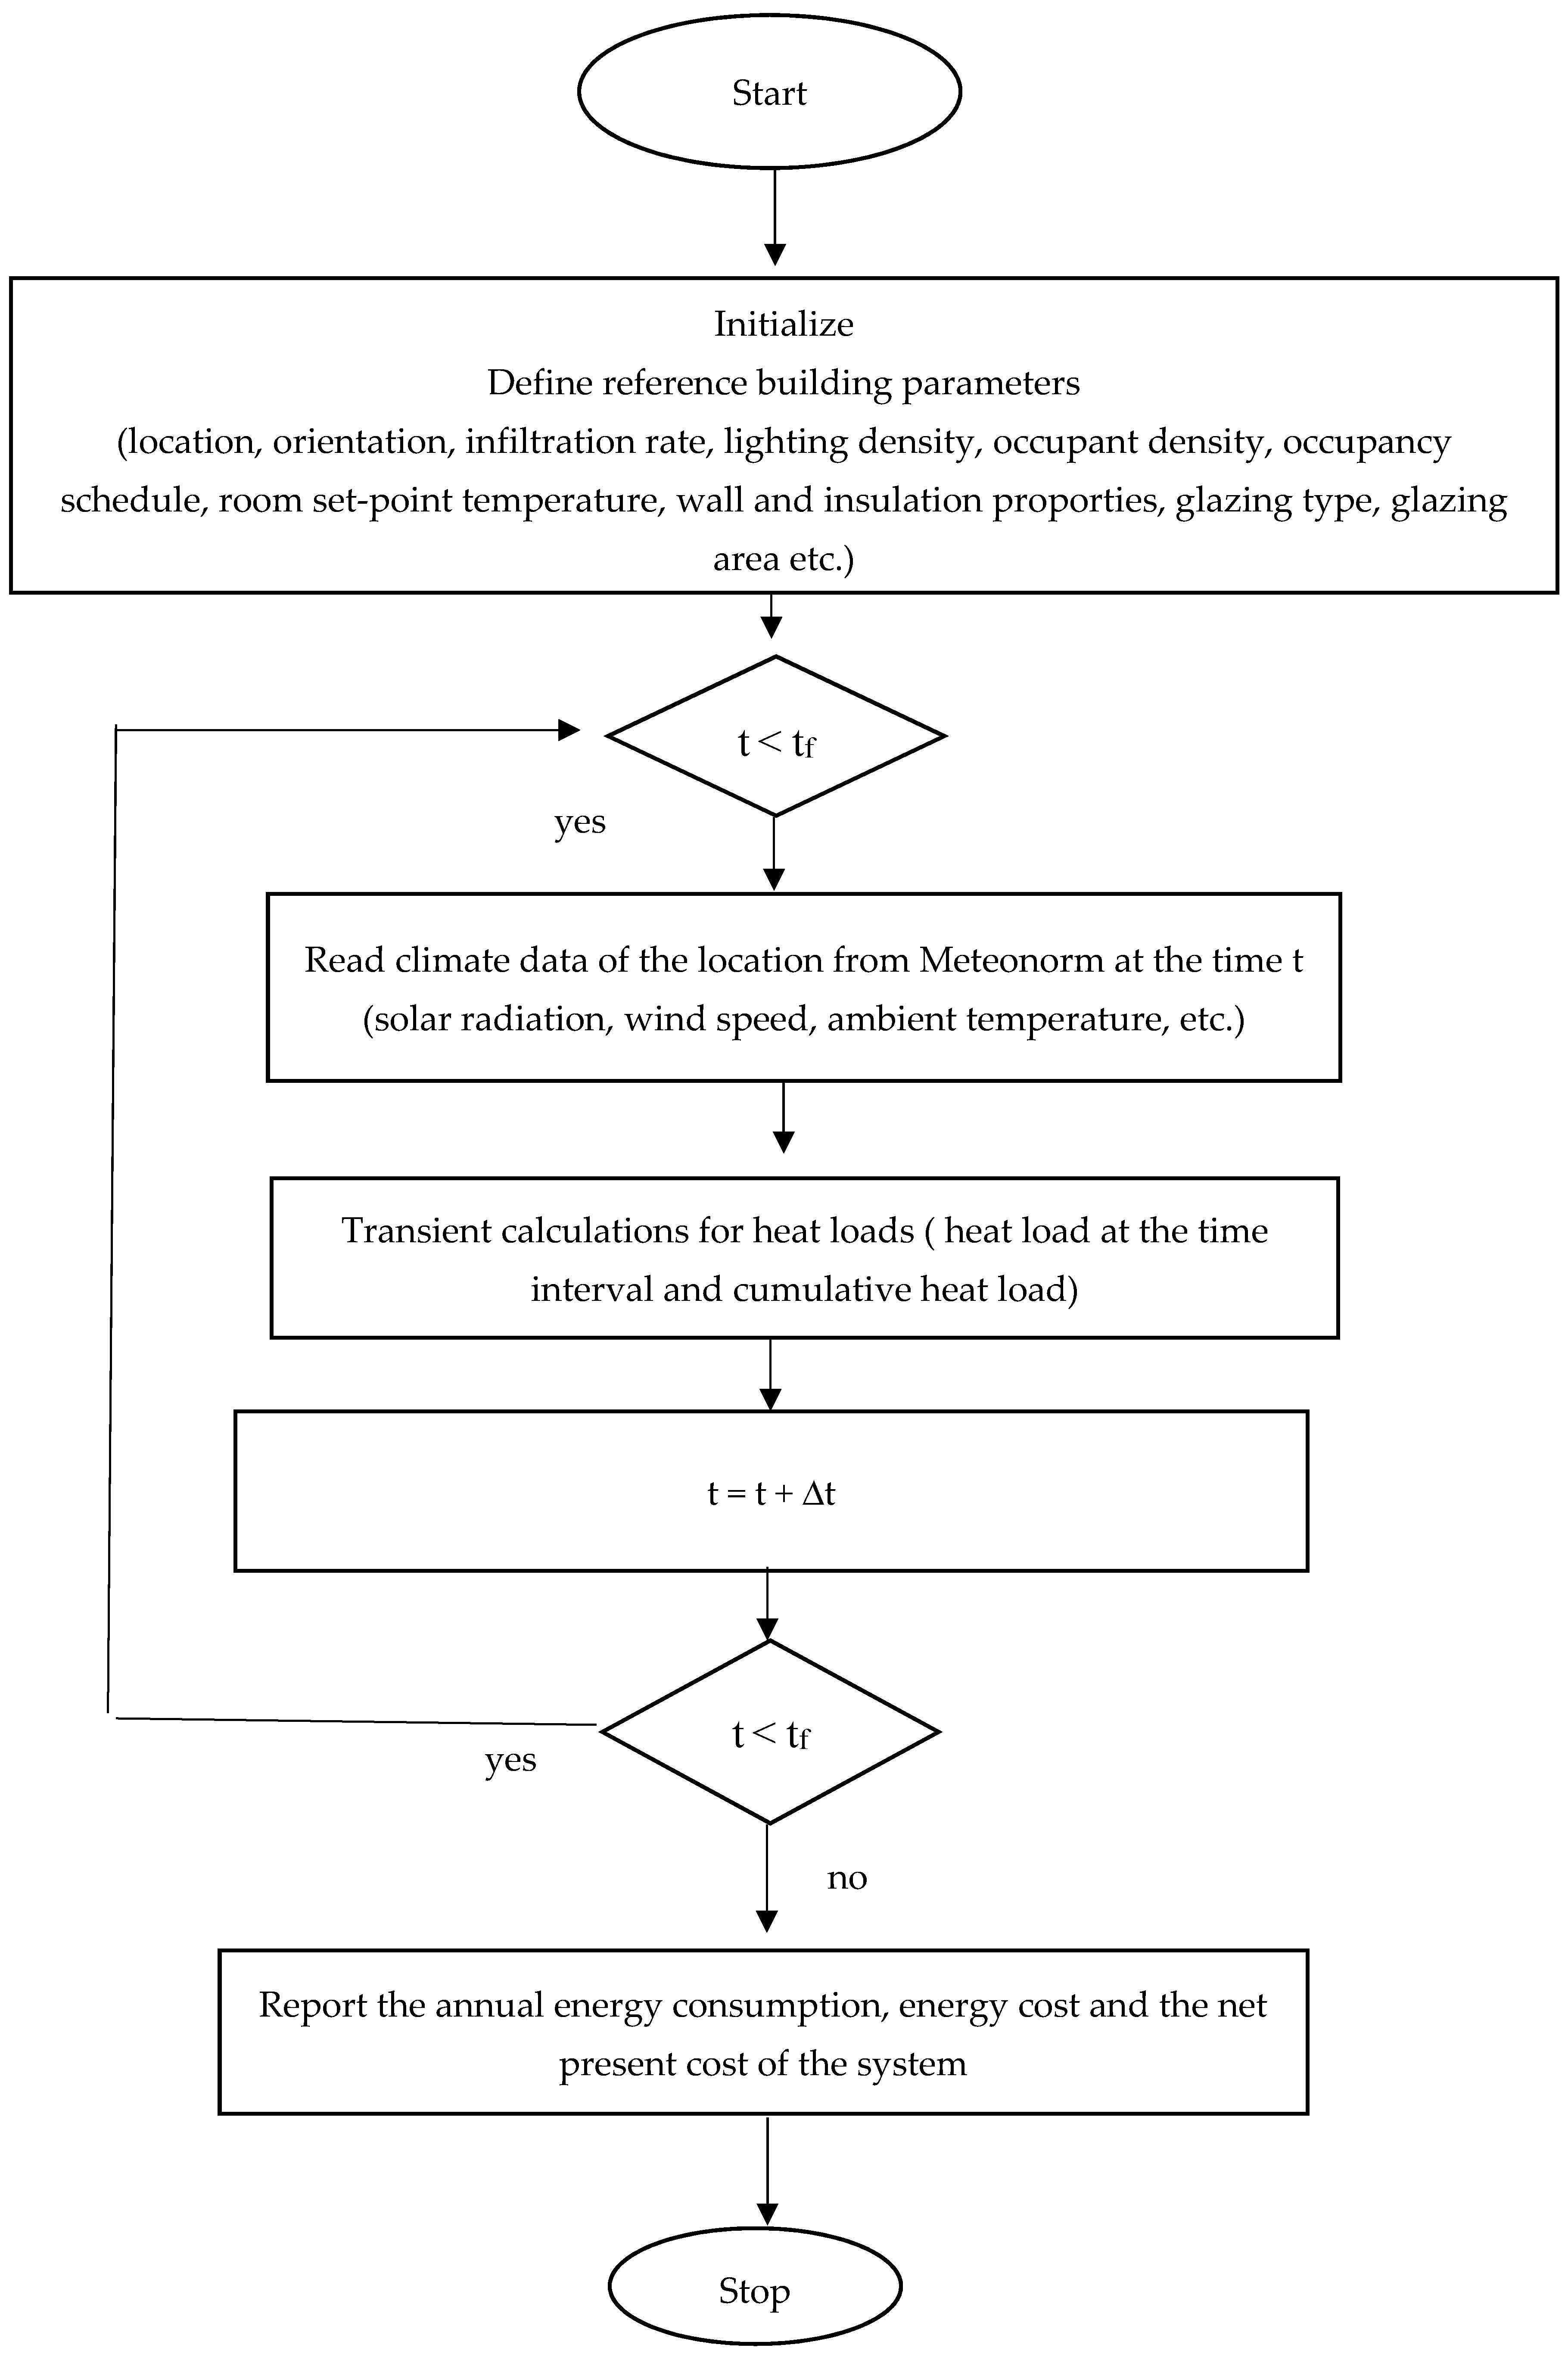
2.2. Model Design and Calculation Methods
2.3. System Performance Evaluation Parameters
3. Analysis
4. Results and Discussion
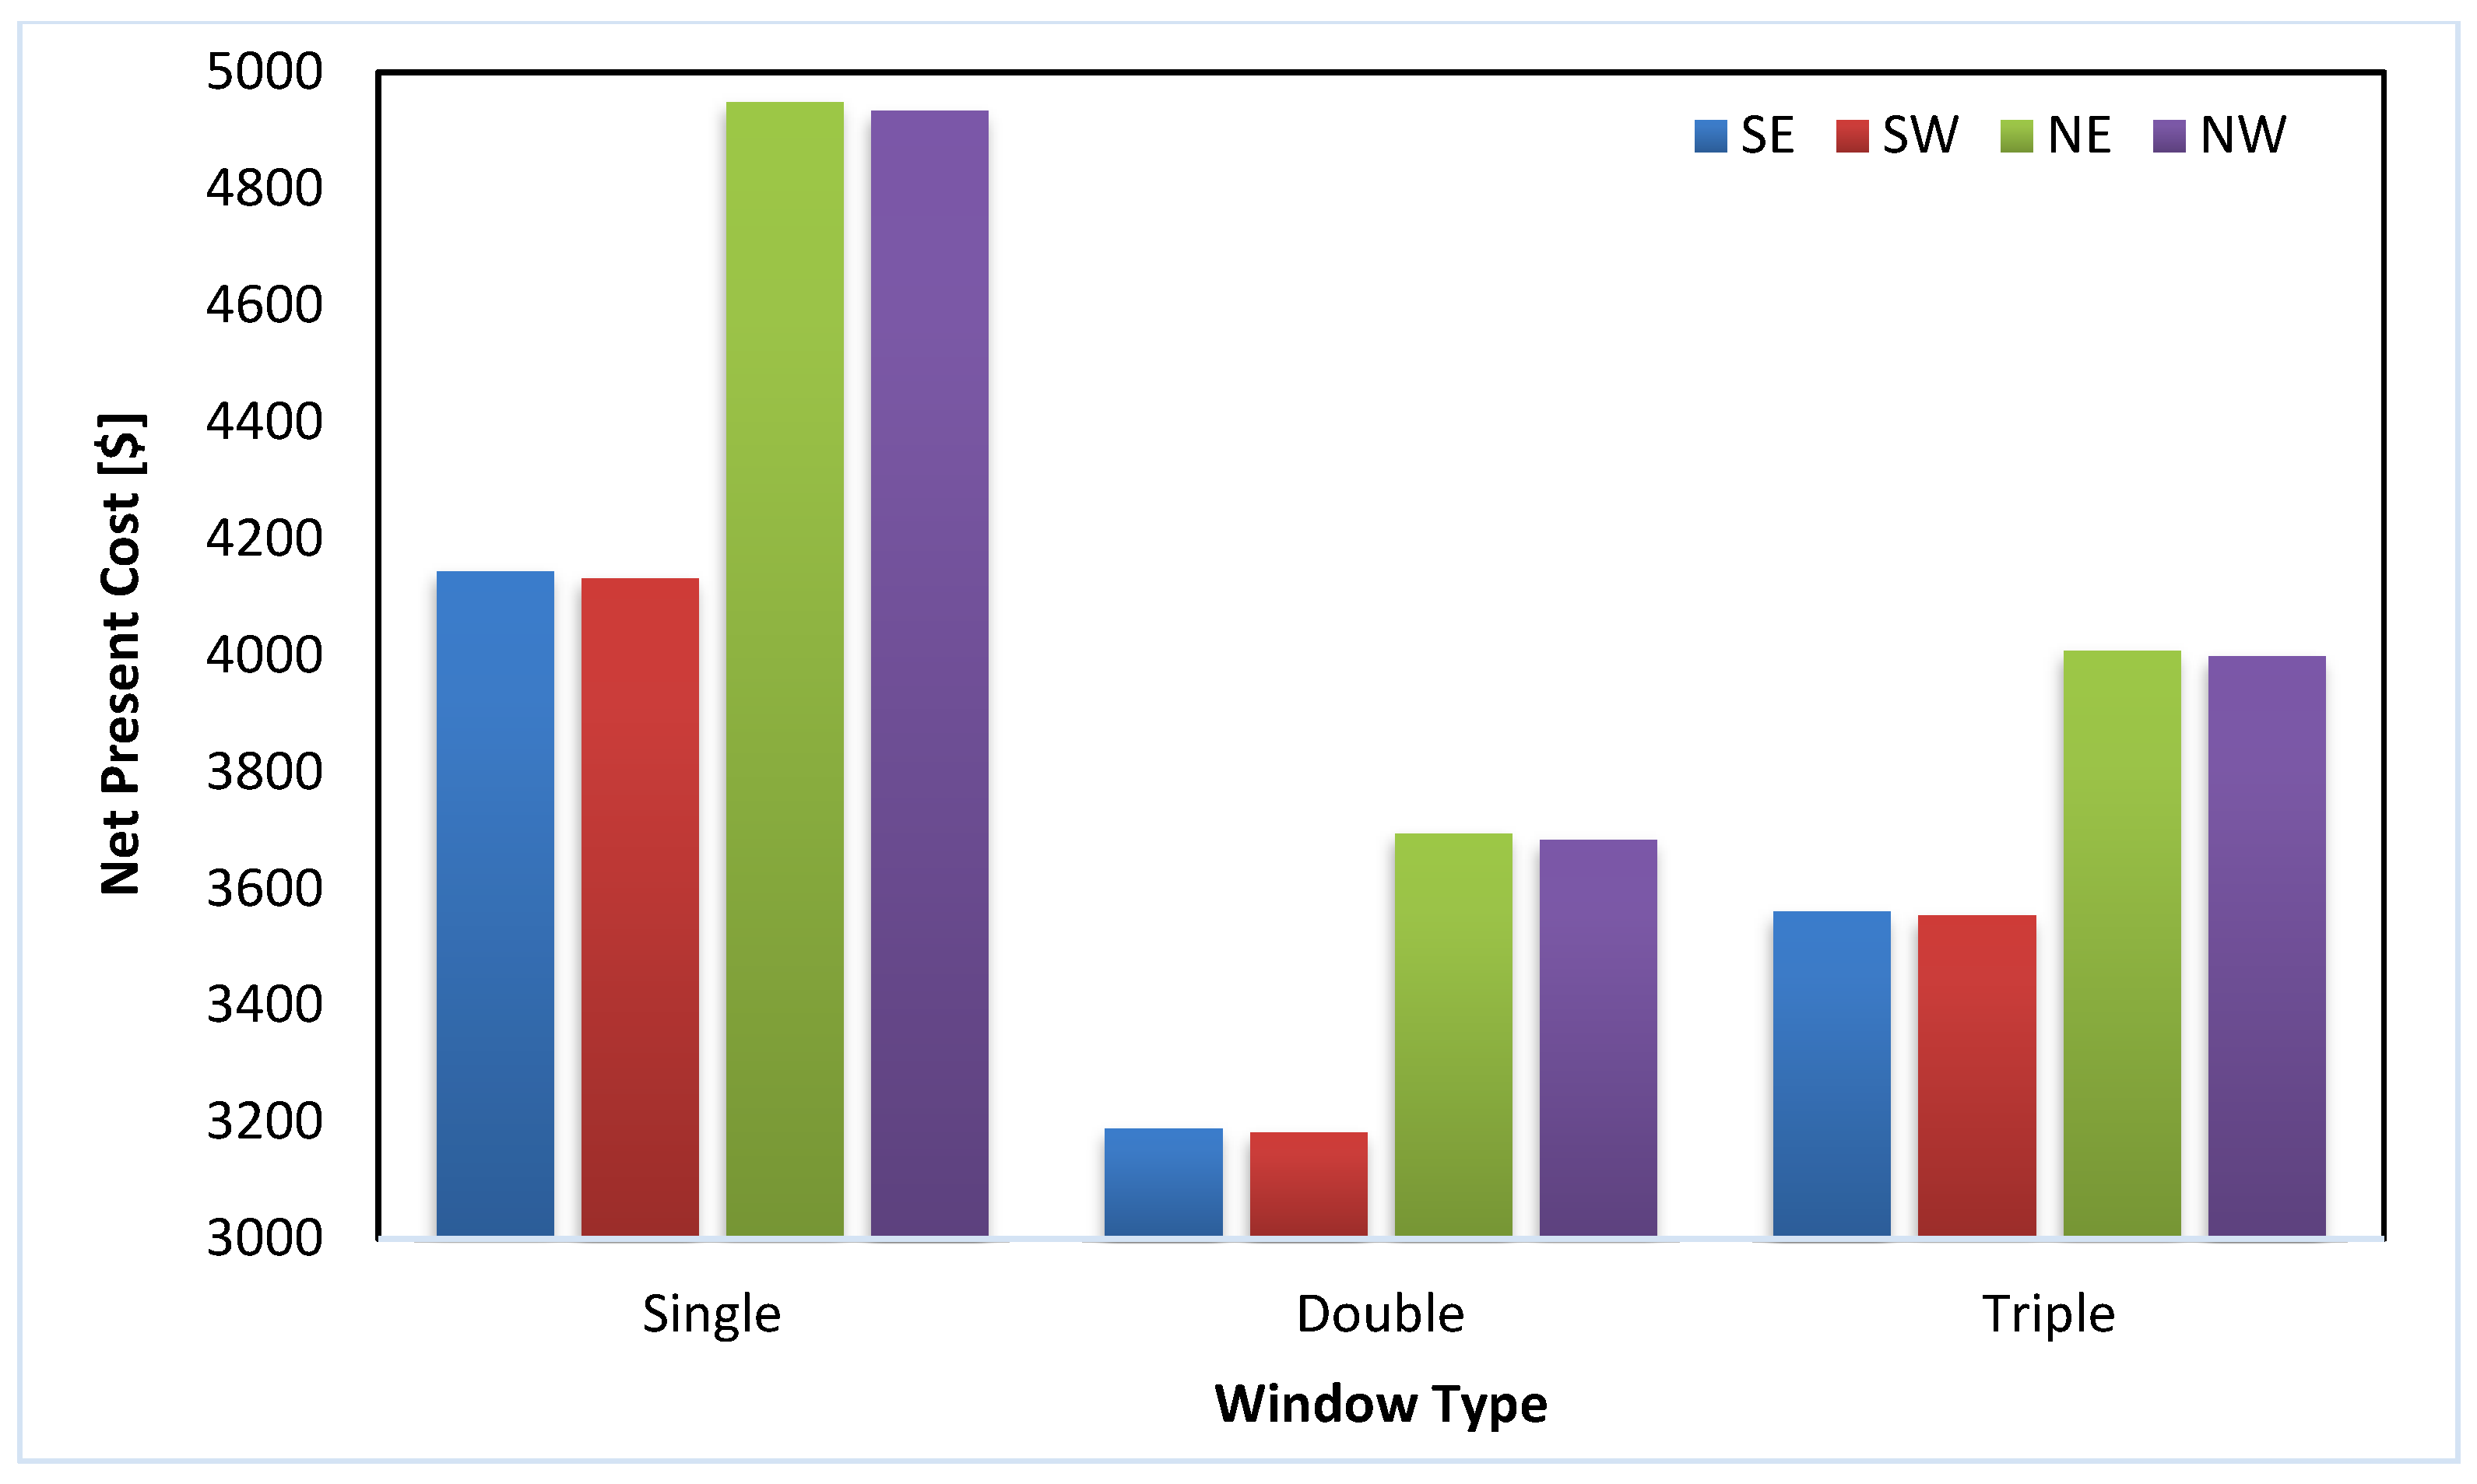
4.1. Orientation
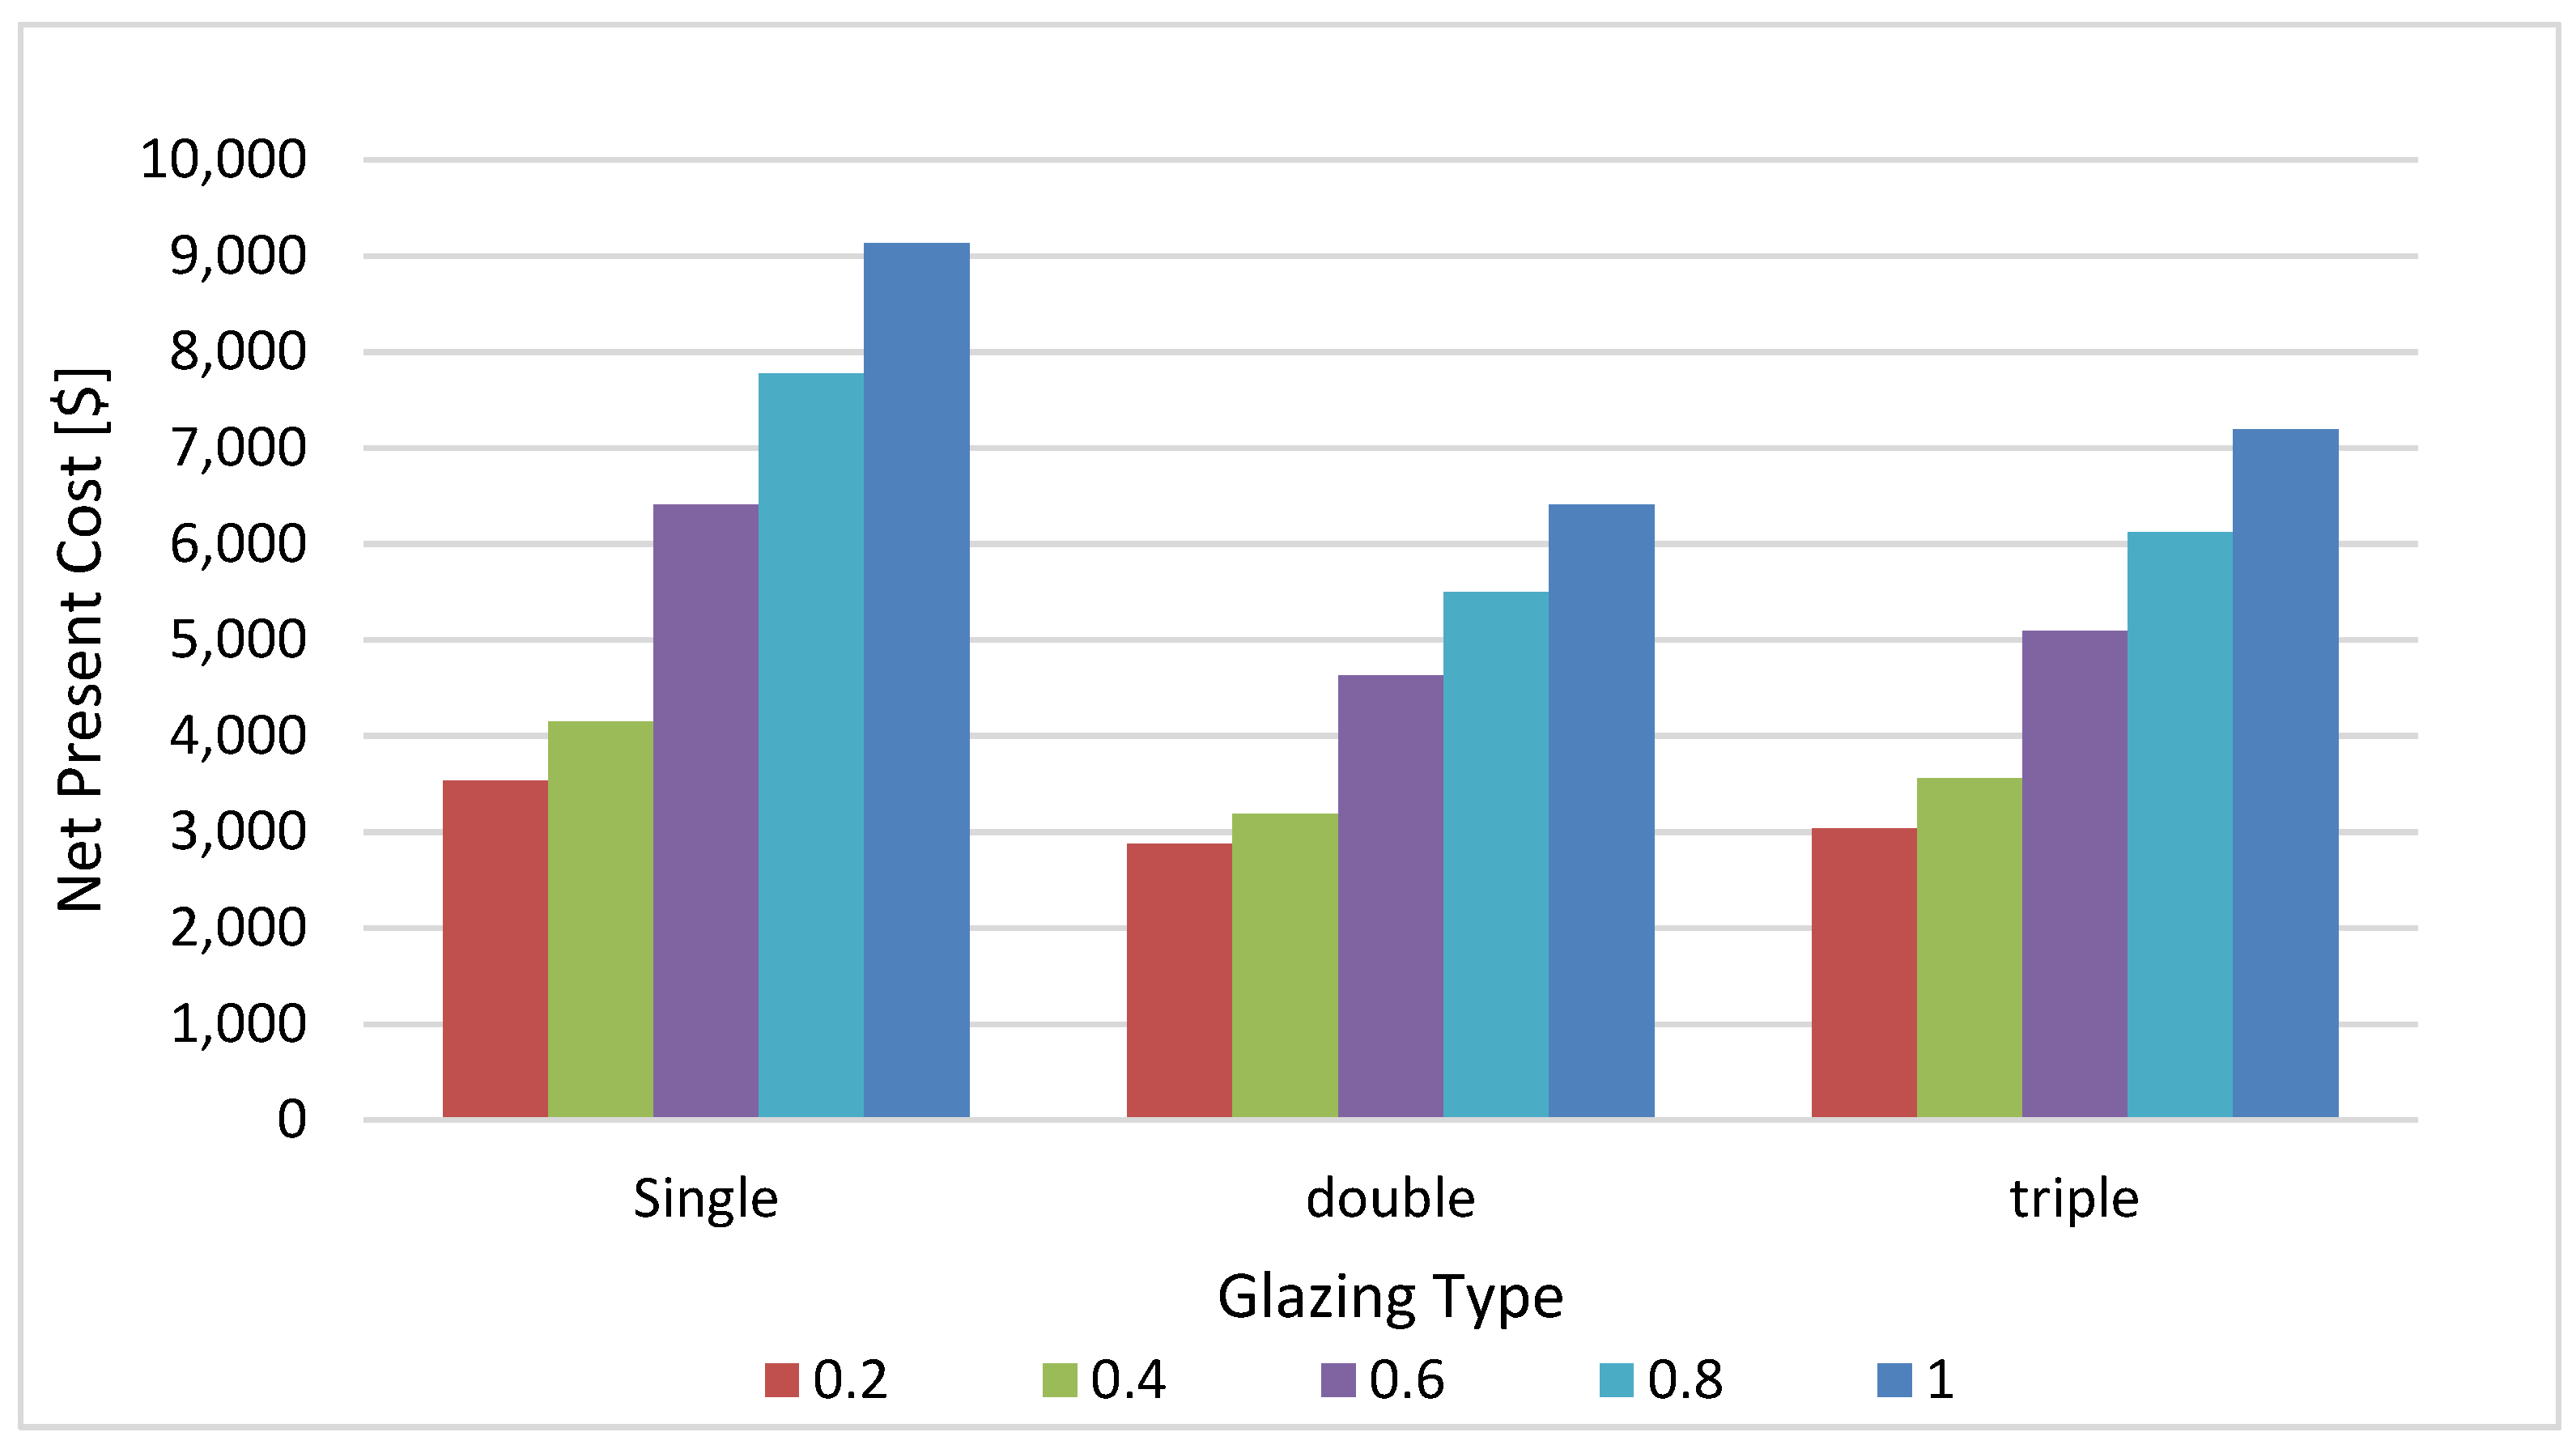
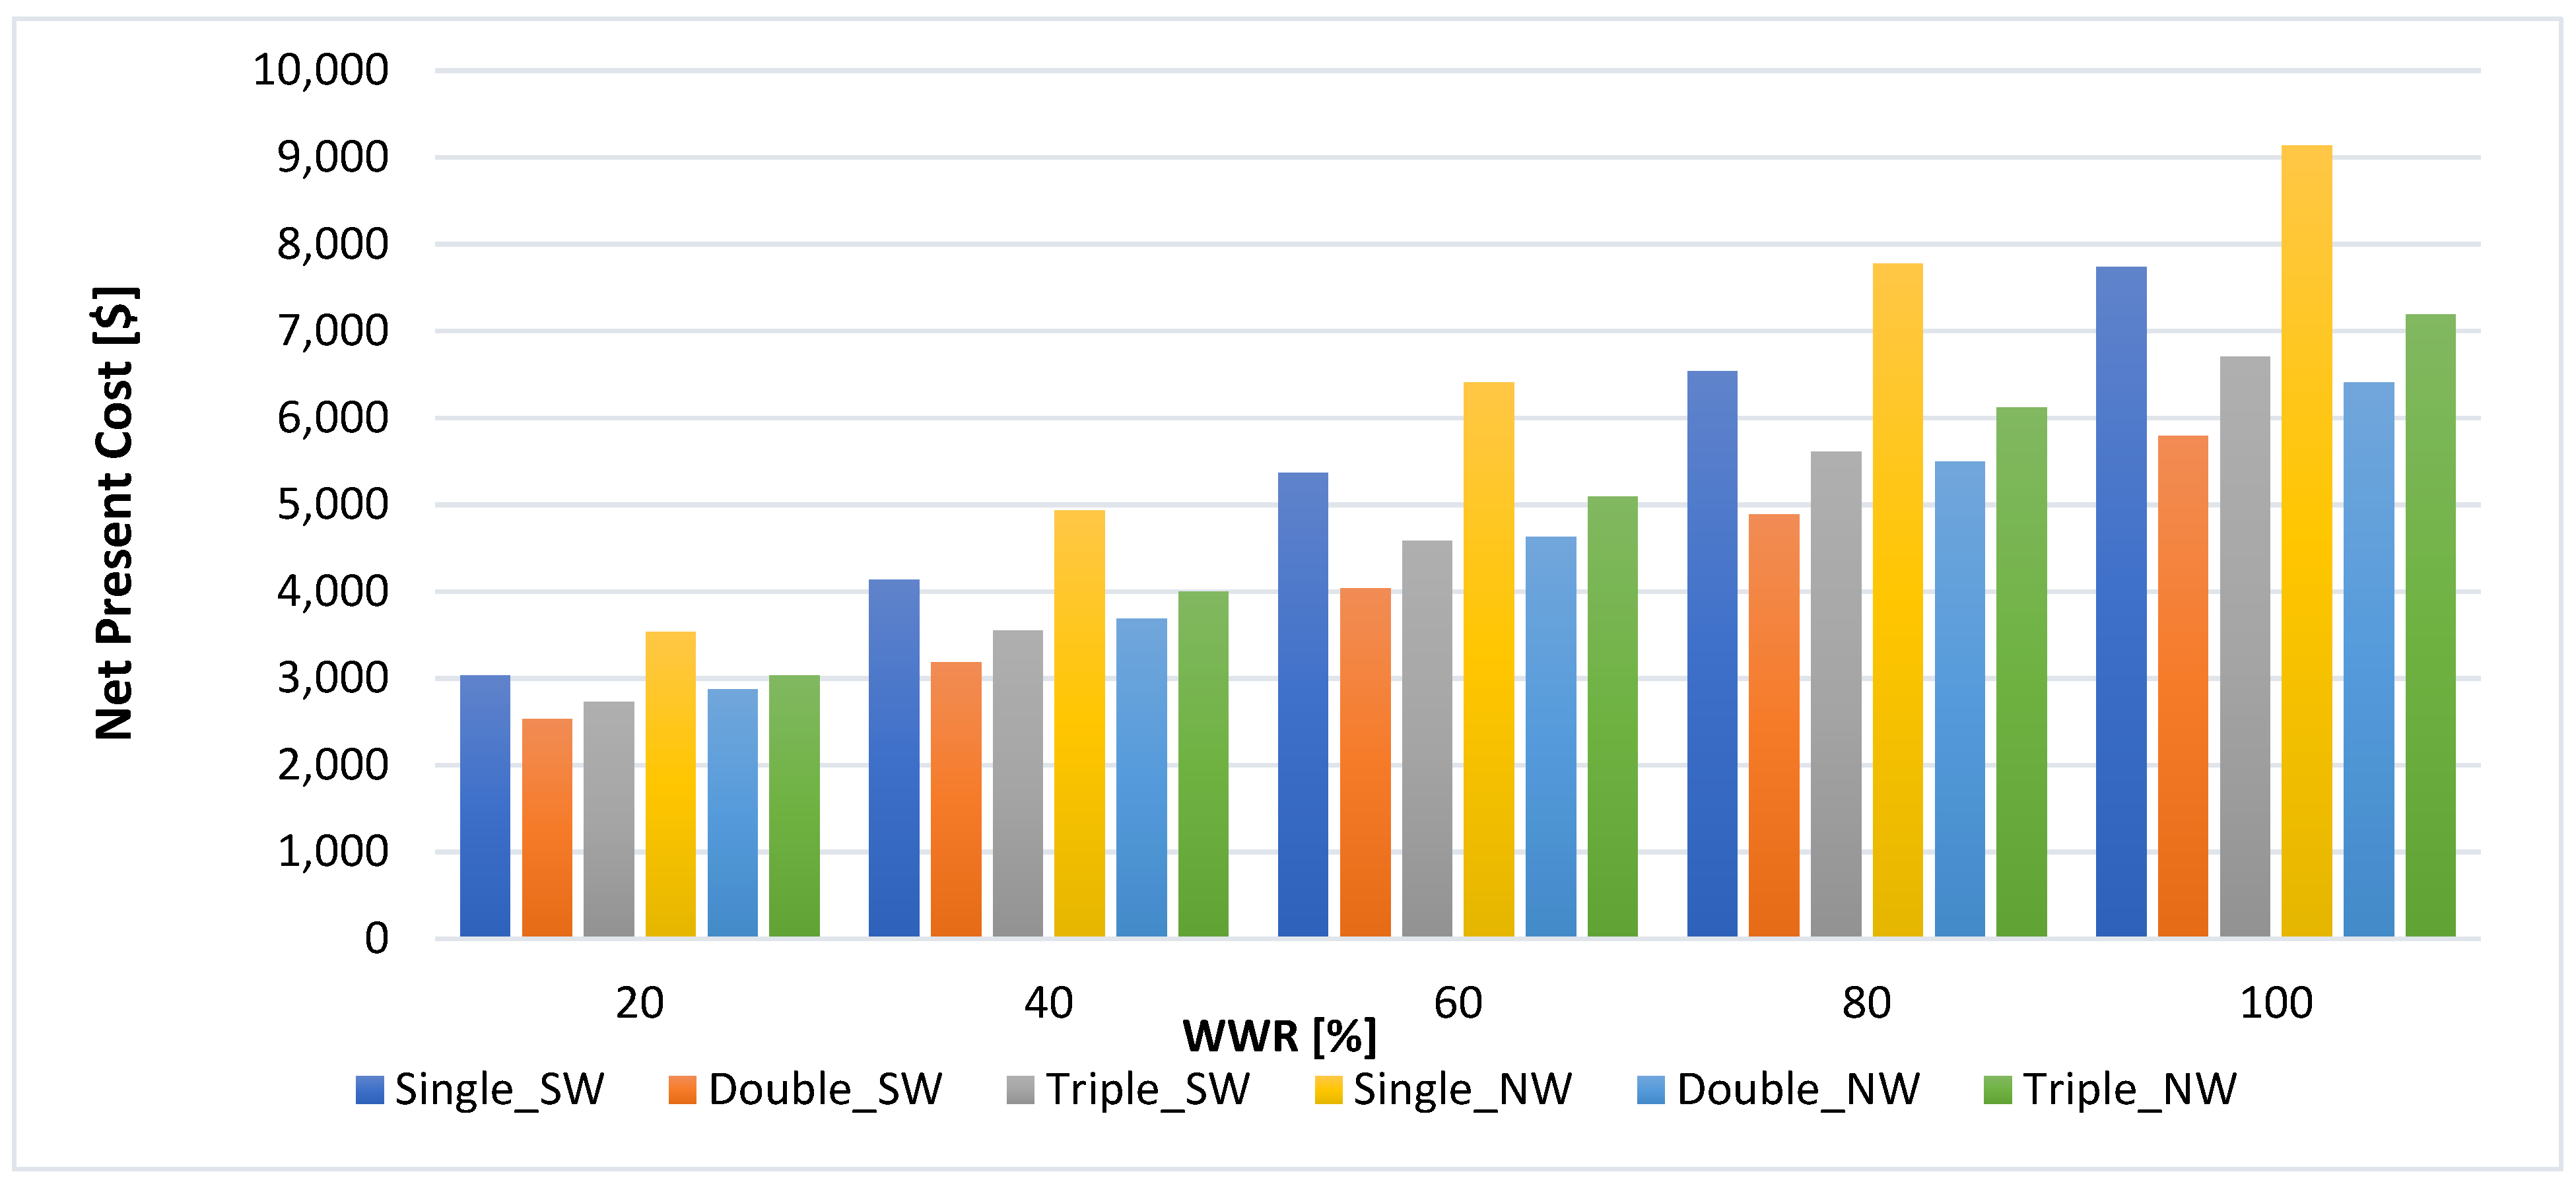
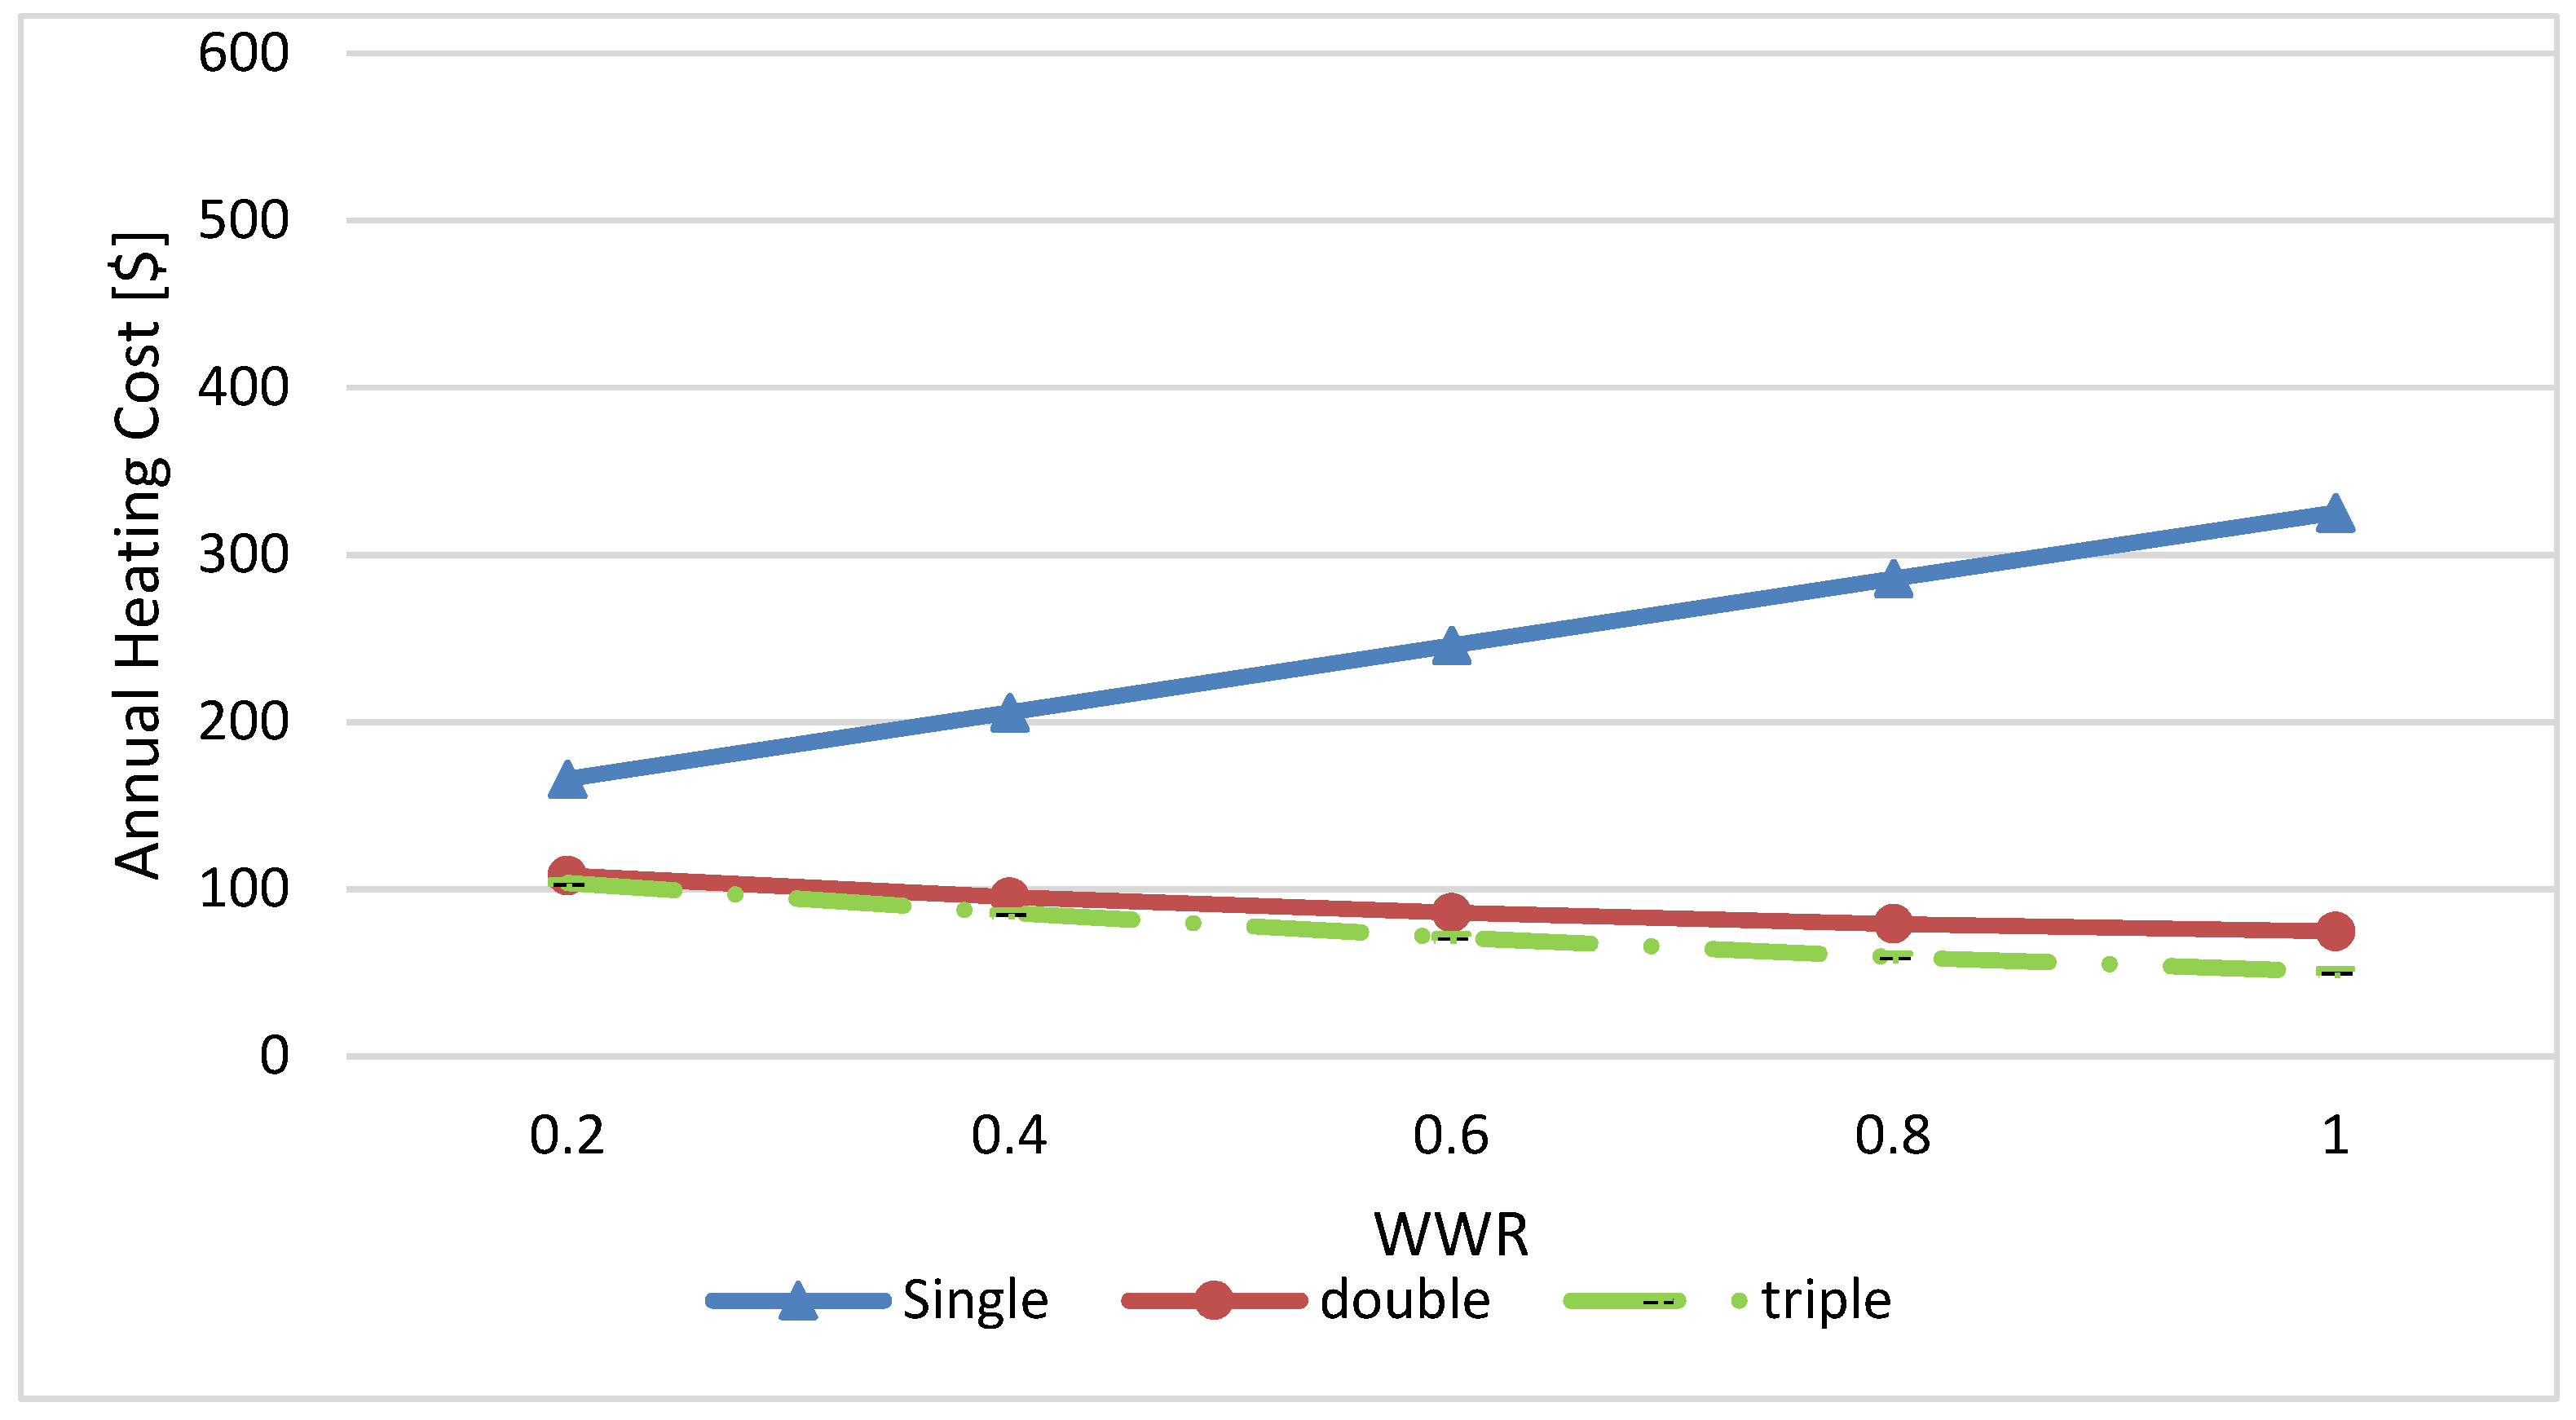
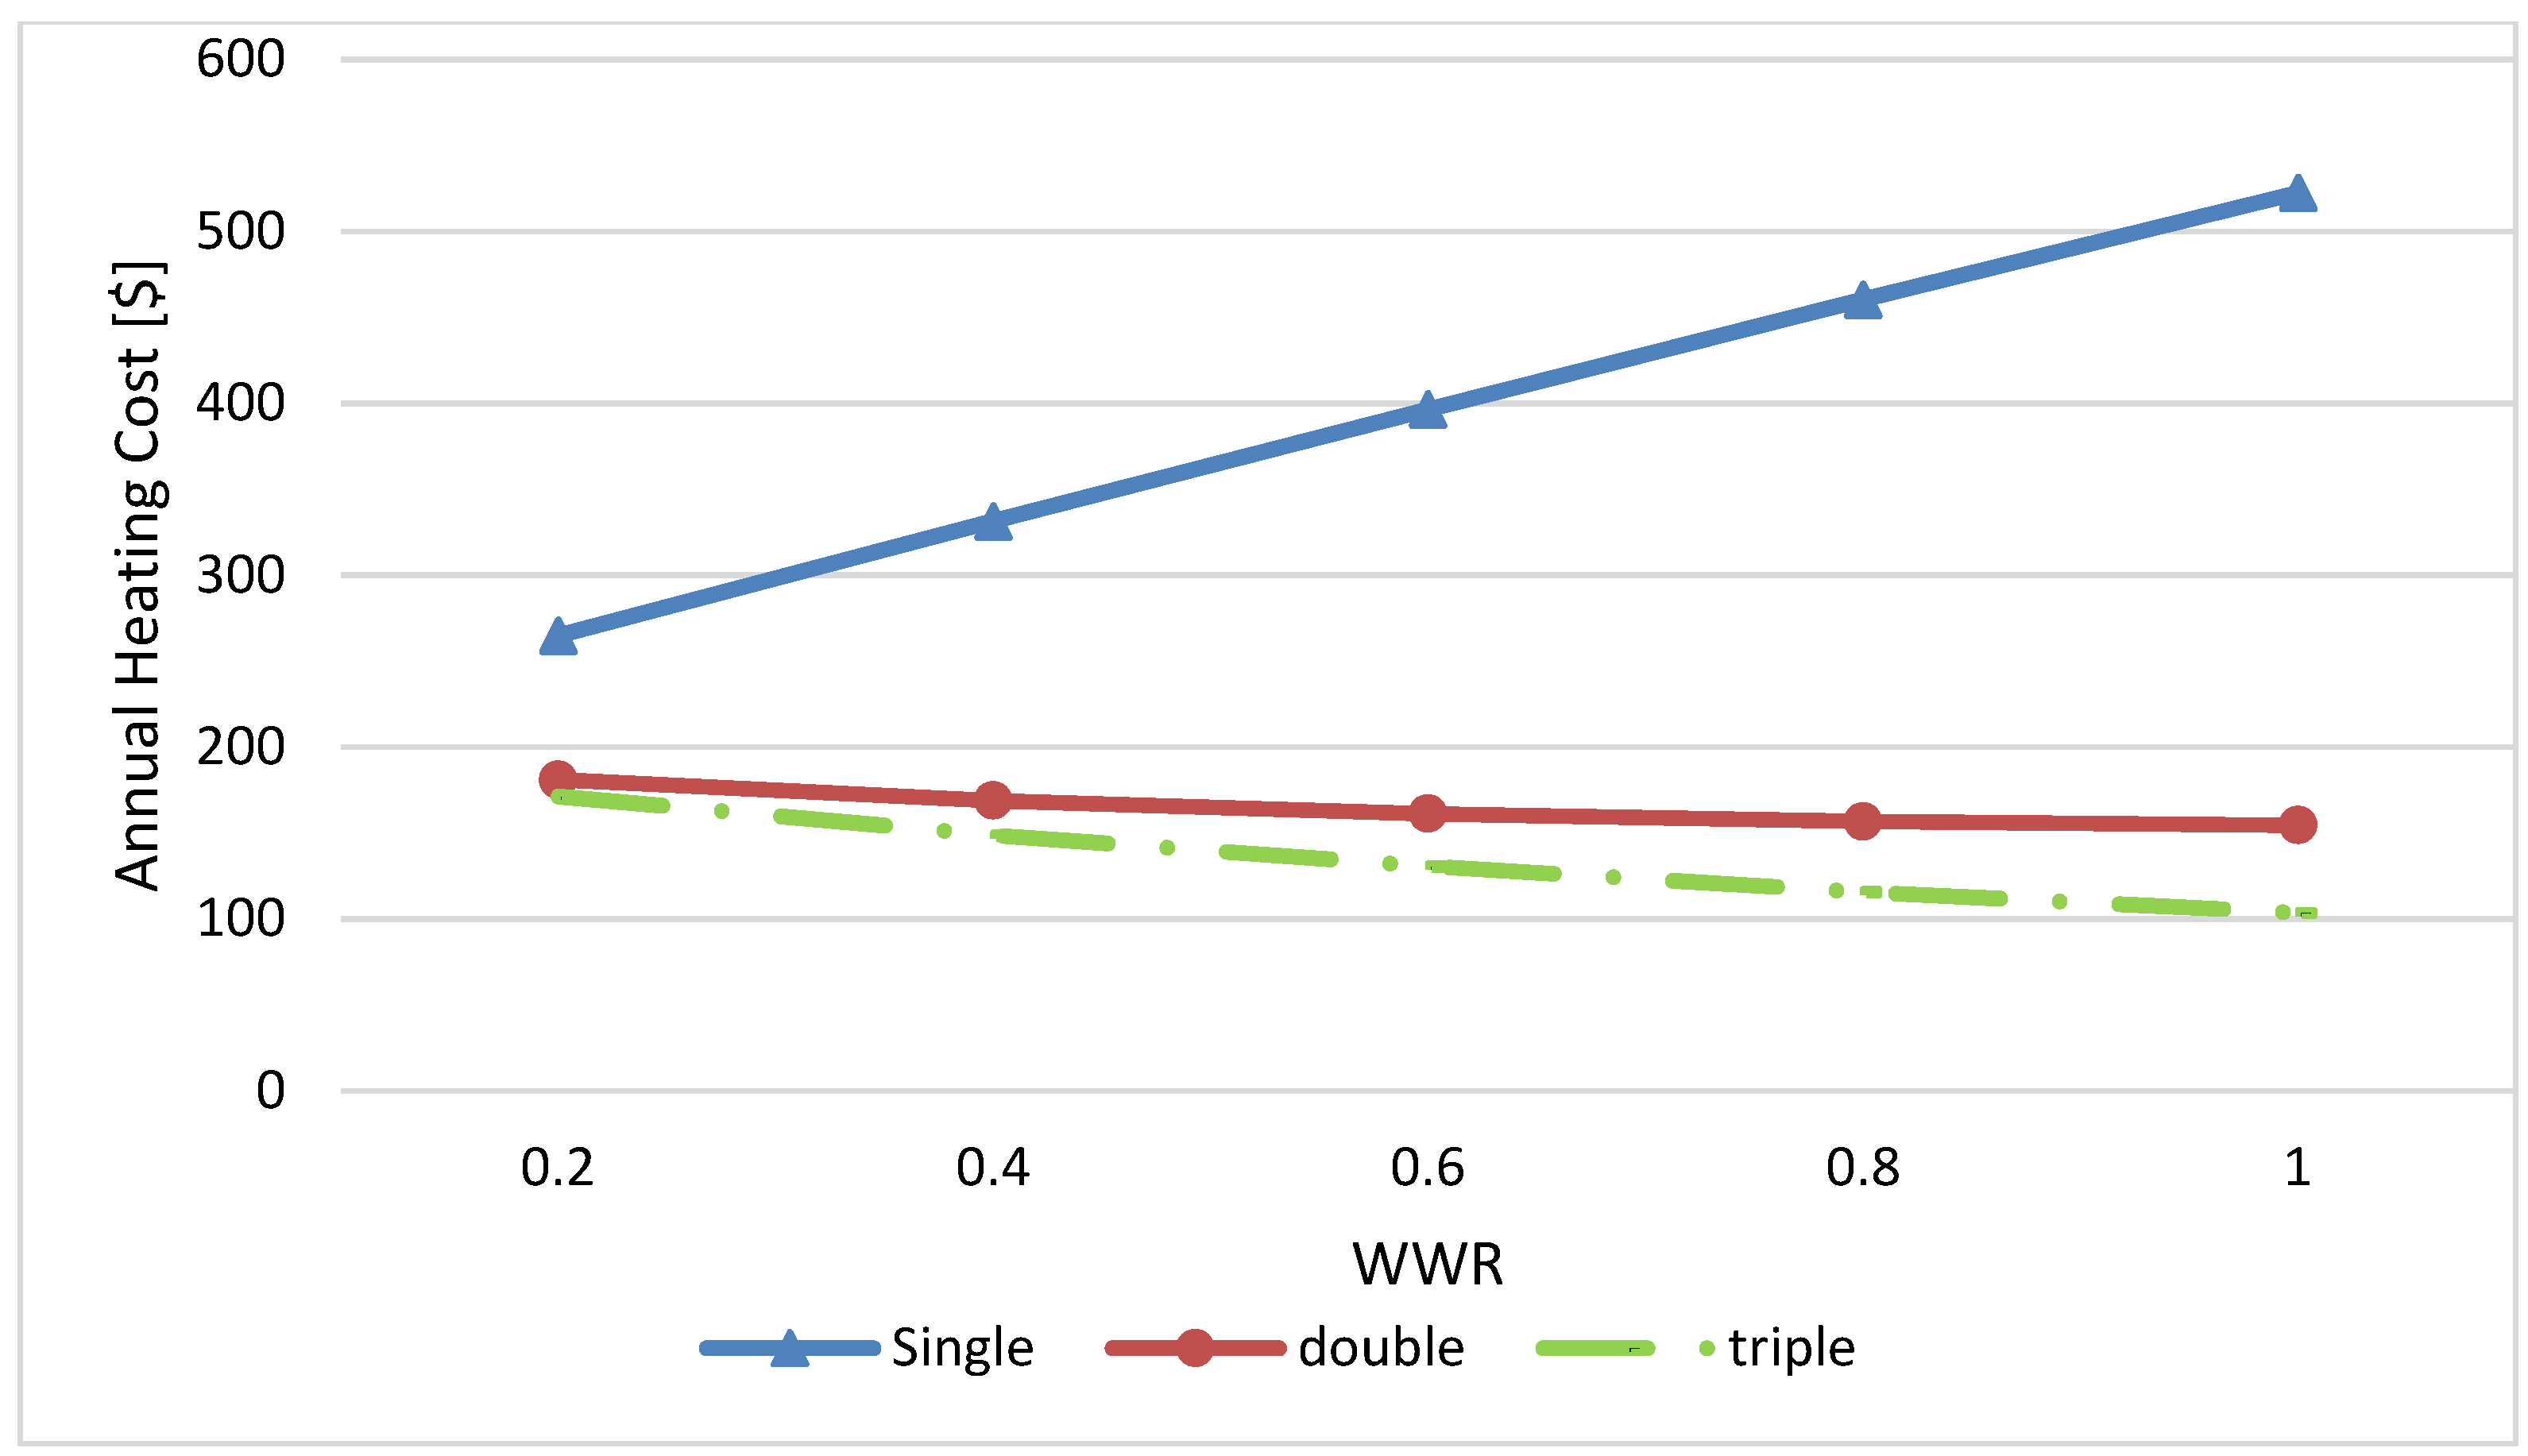
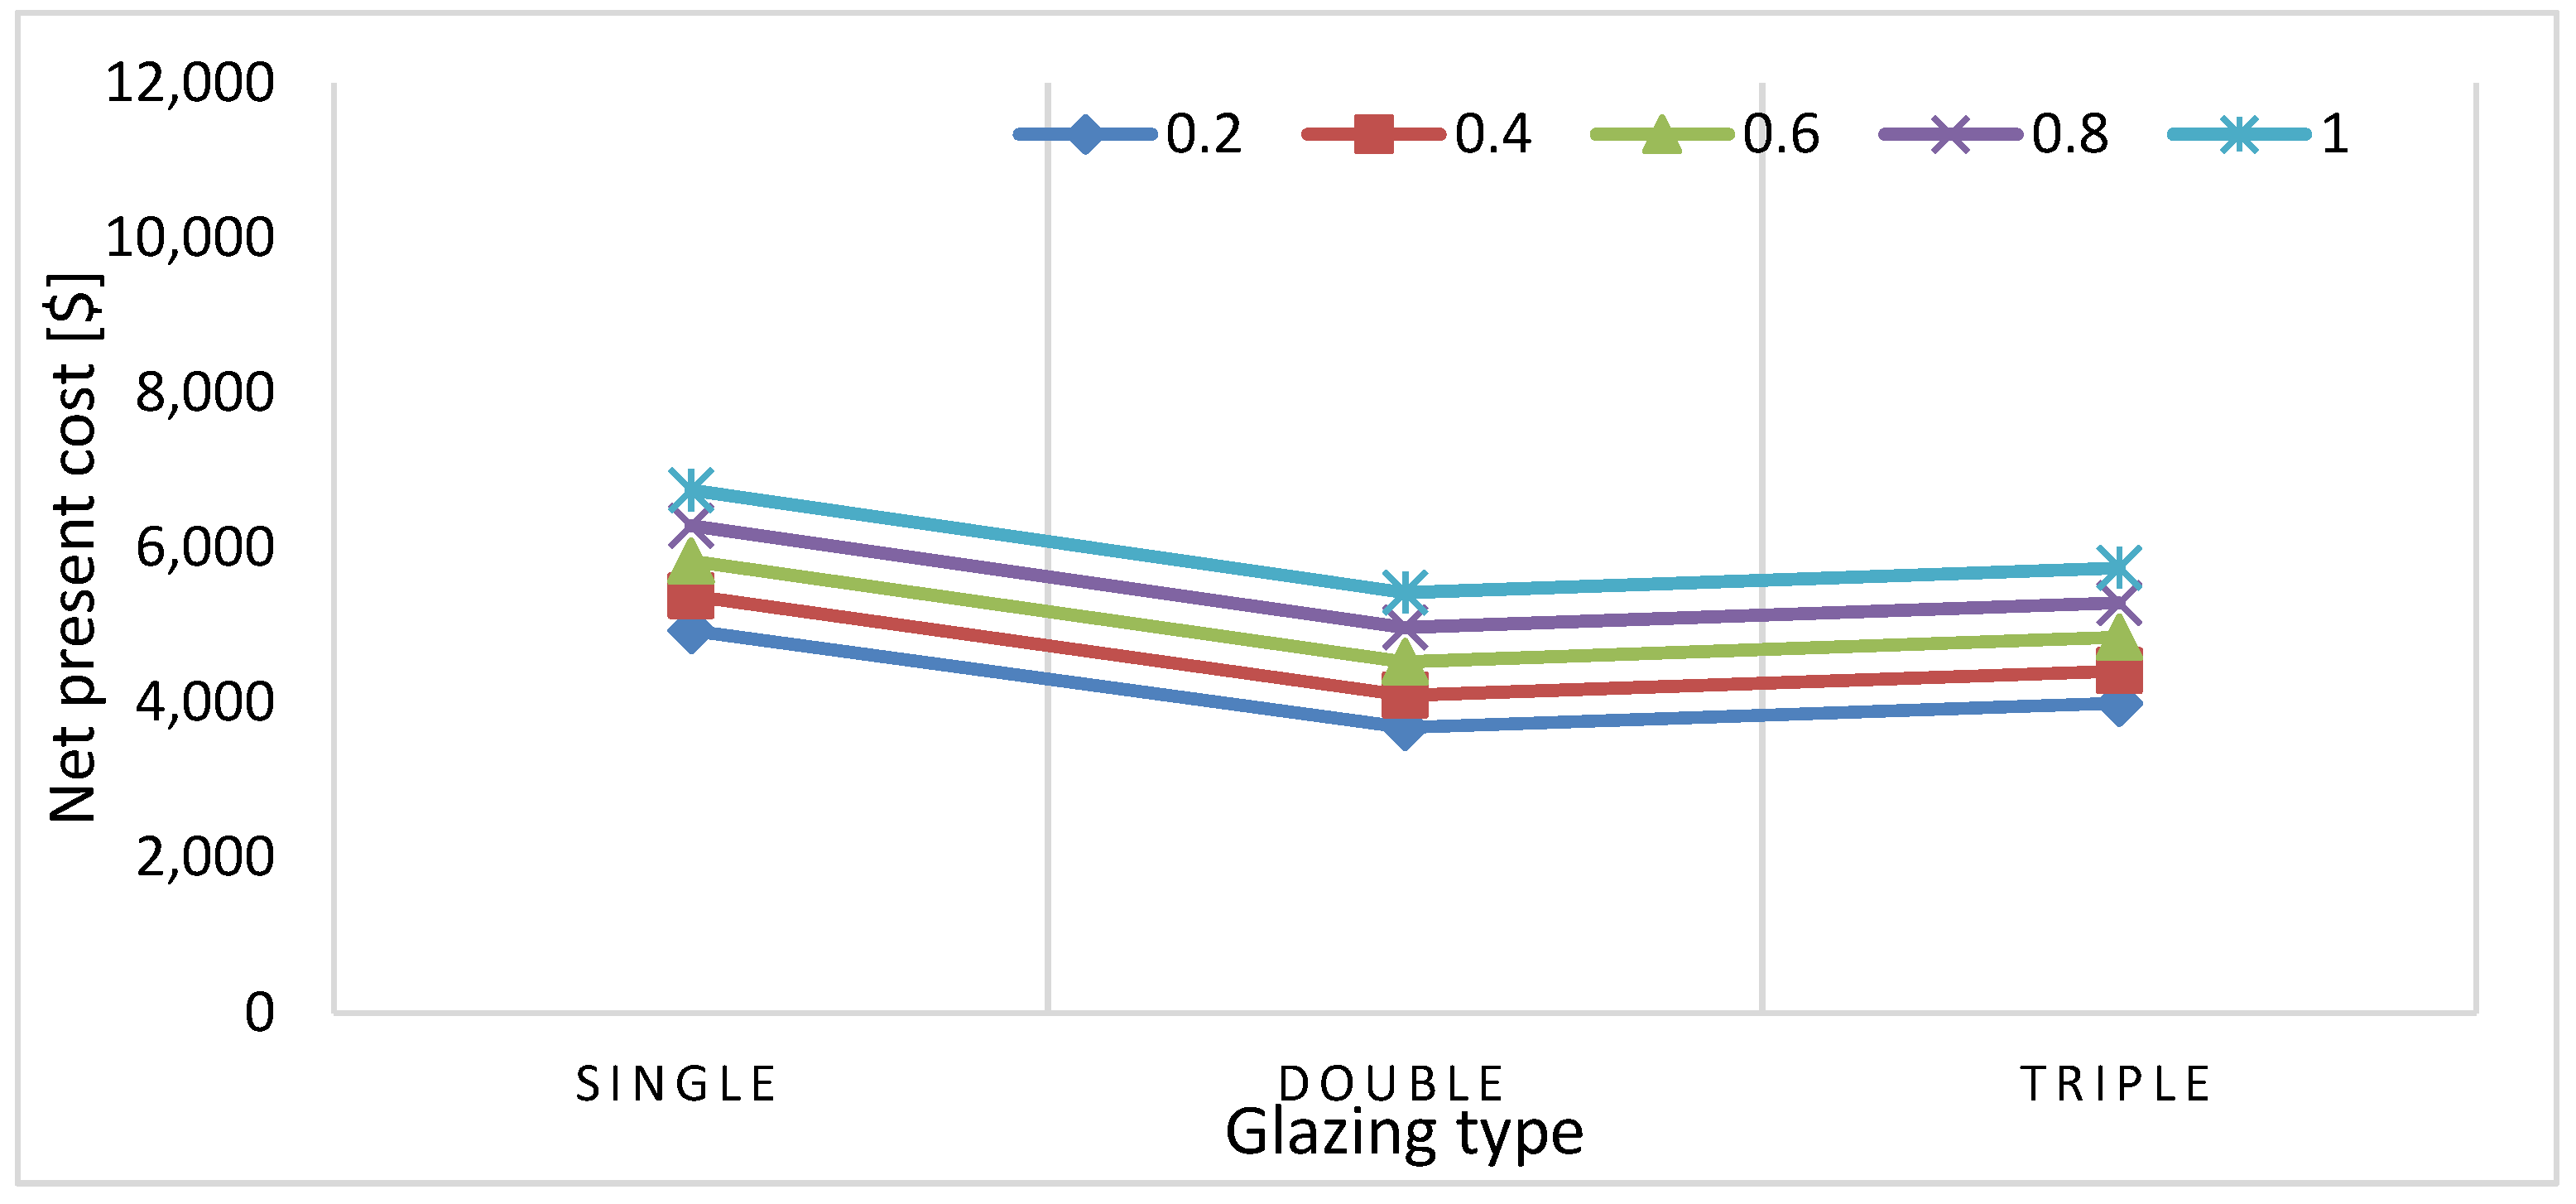
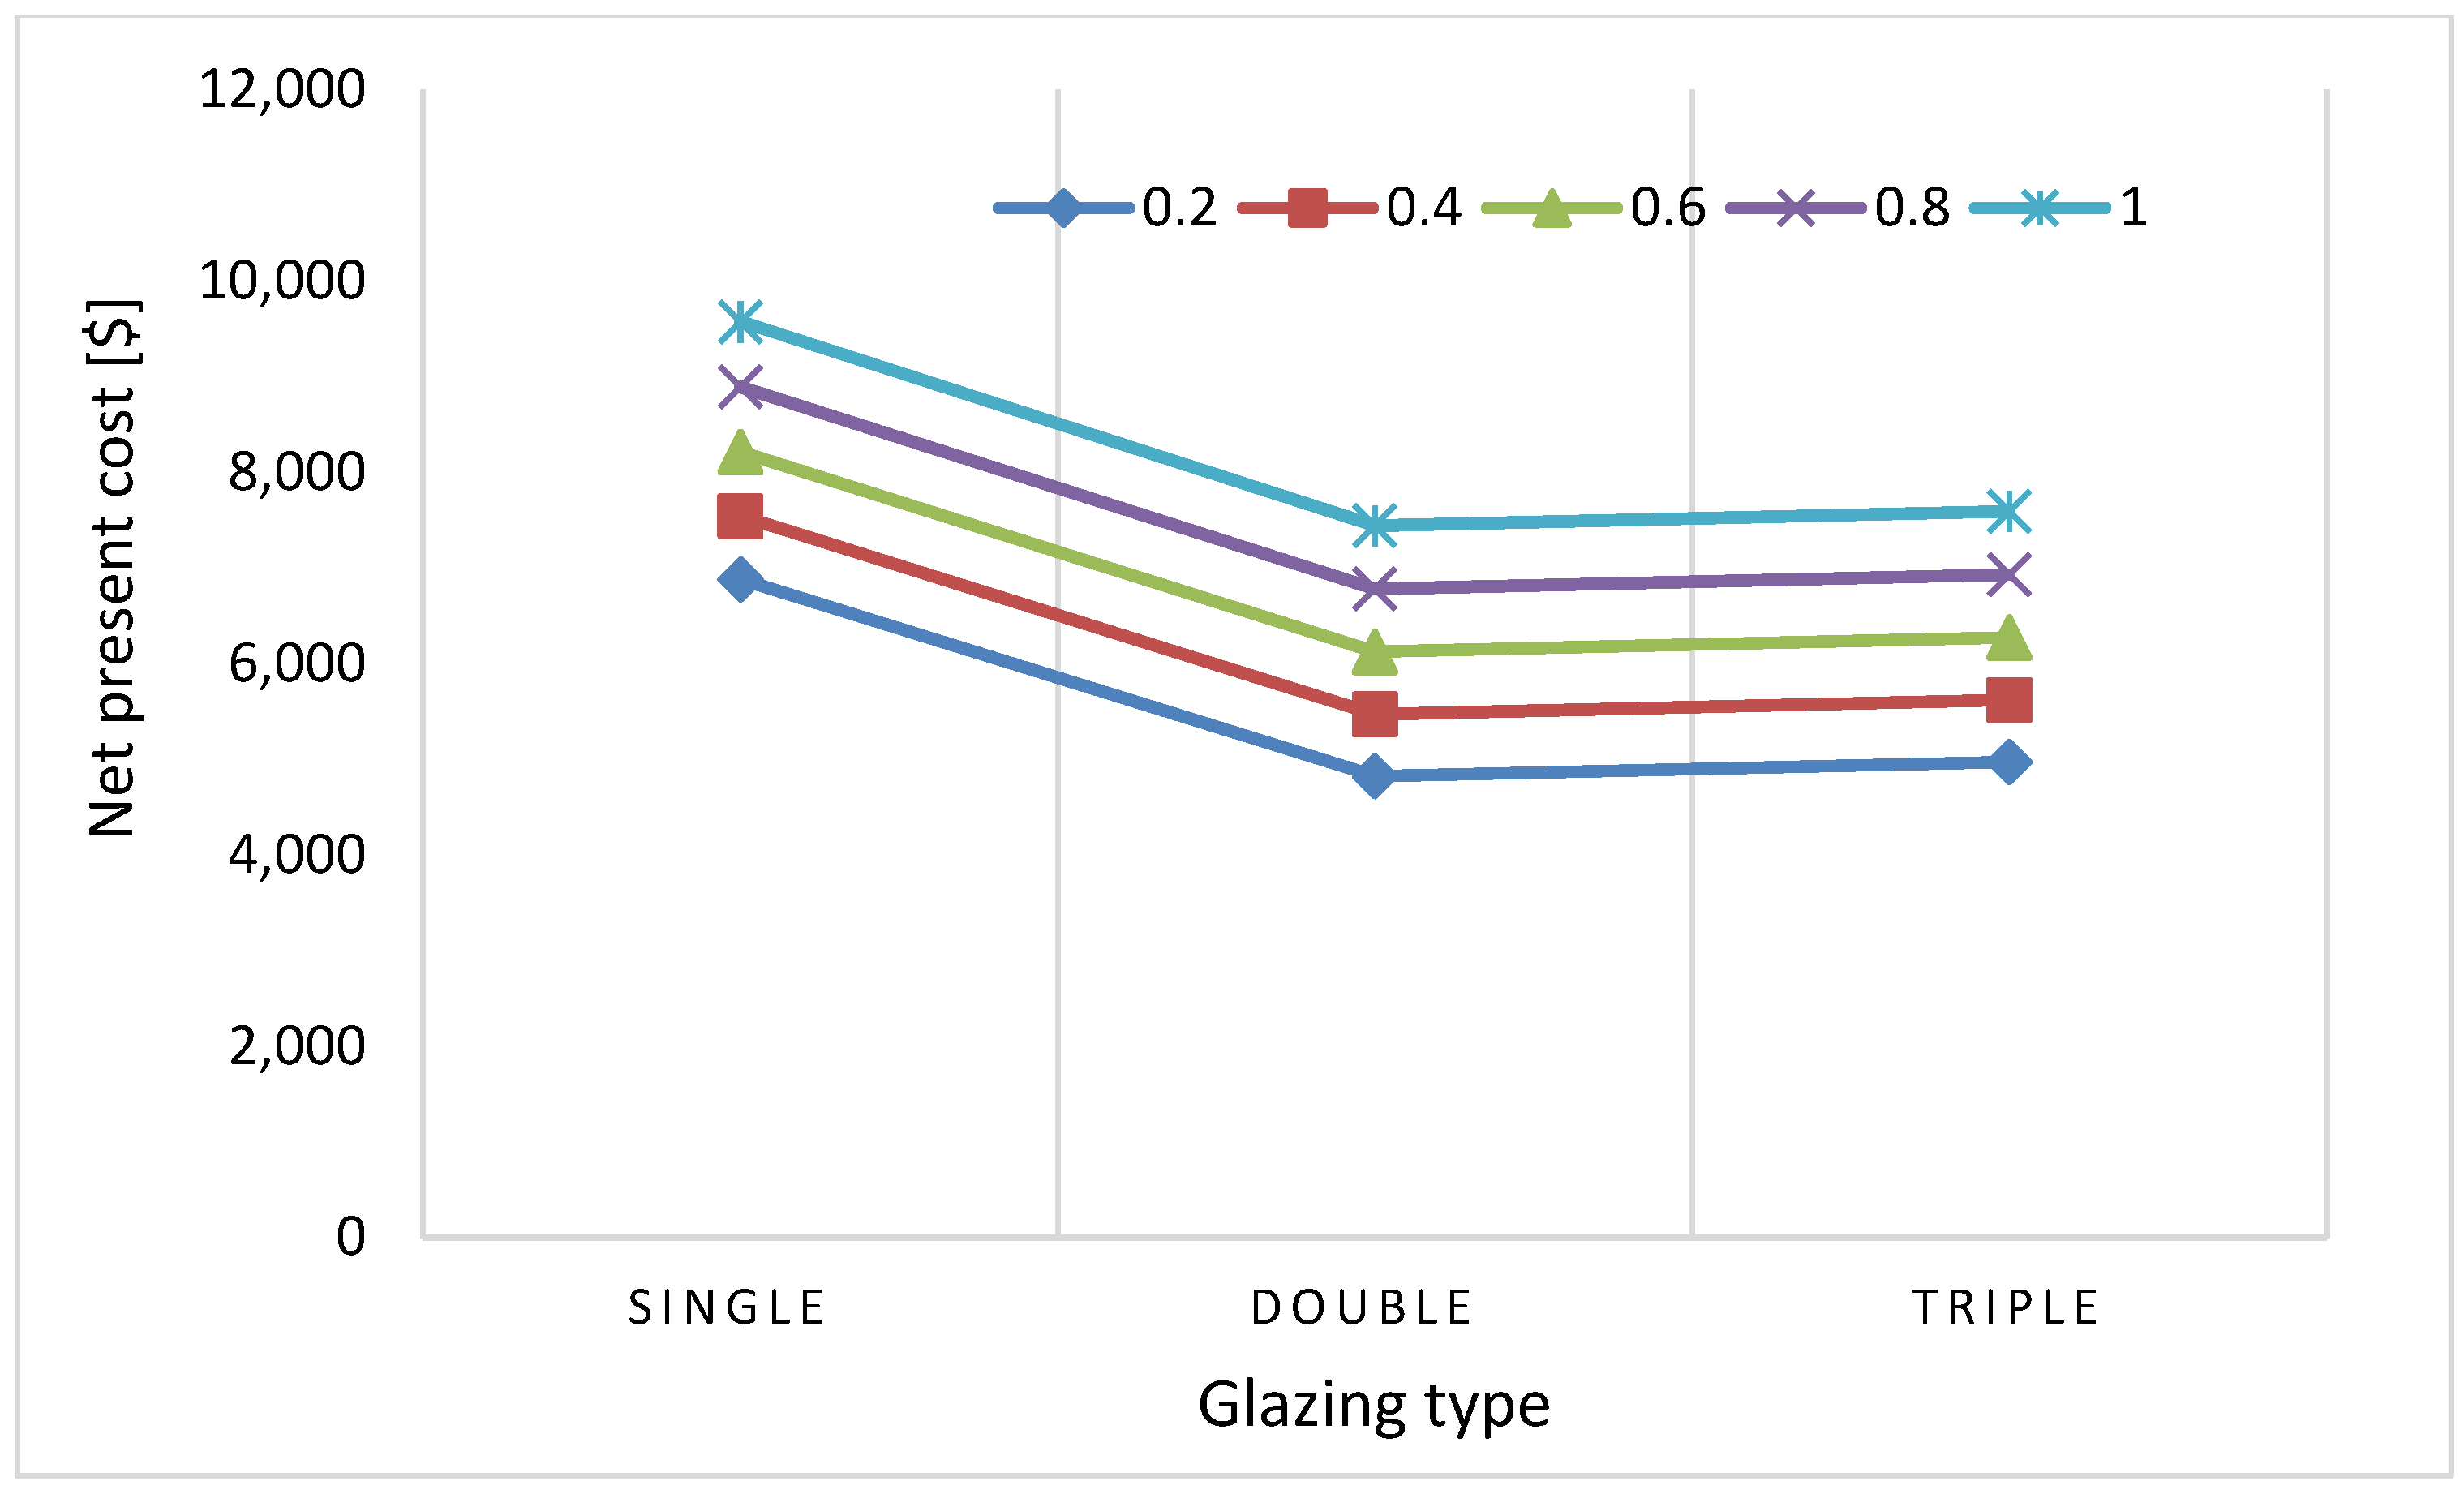
4.2. Window-to-Wall Ratio (WWR)
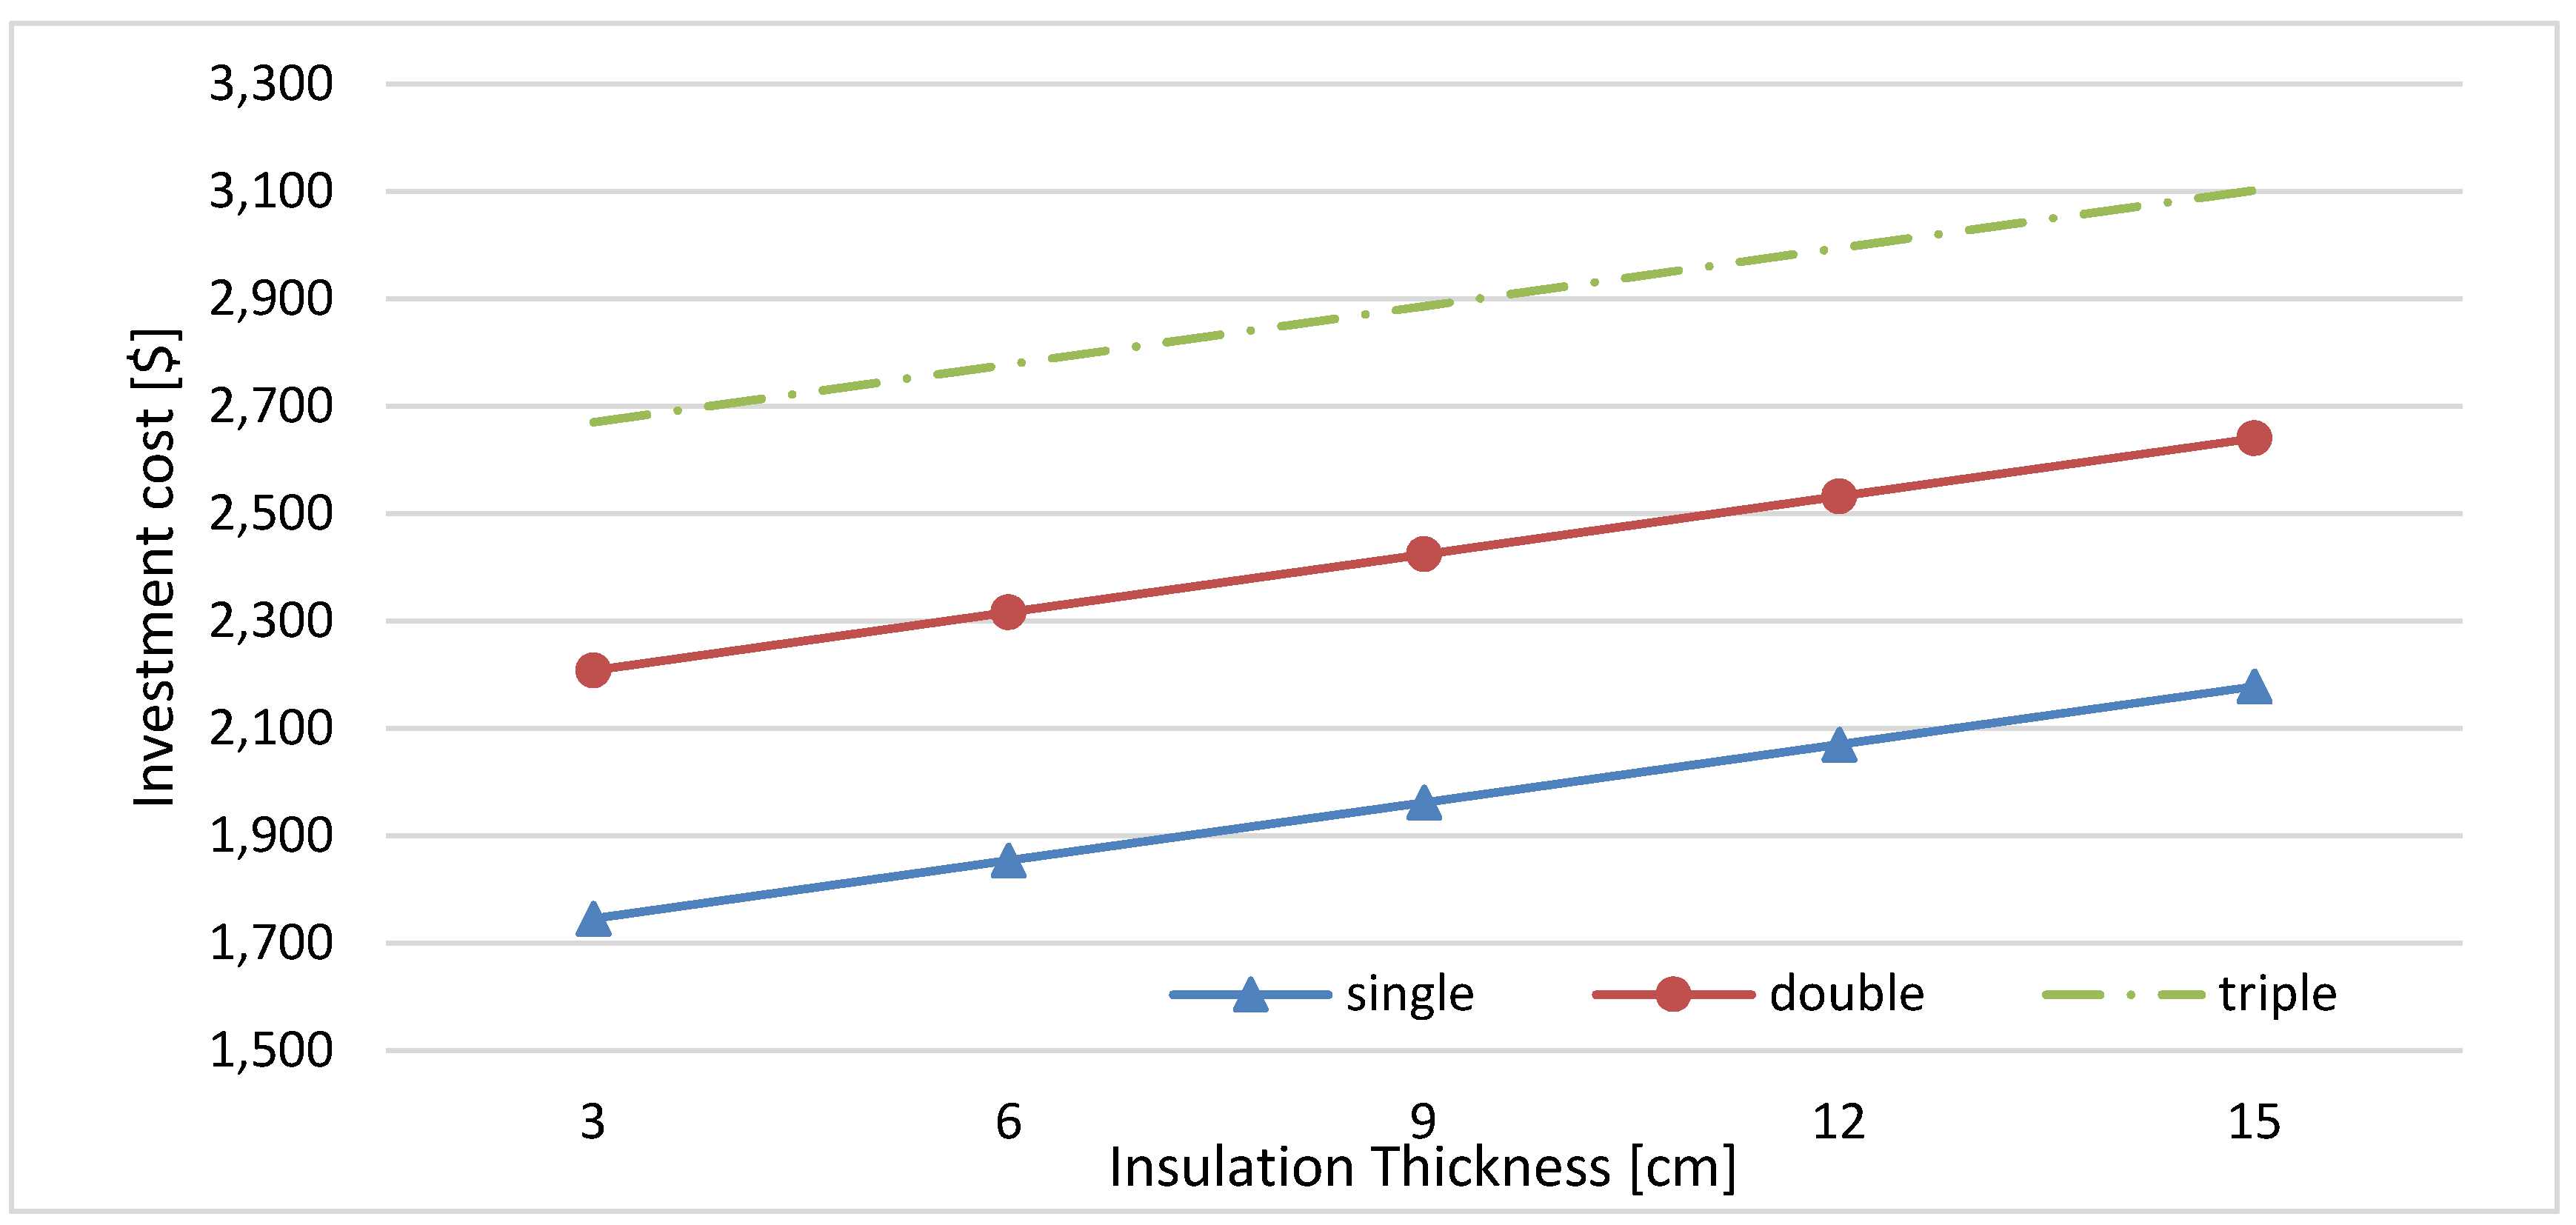
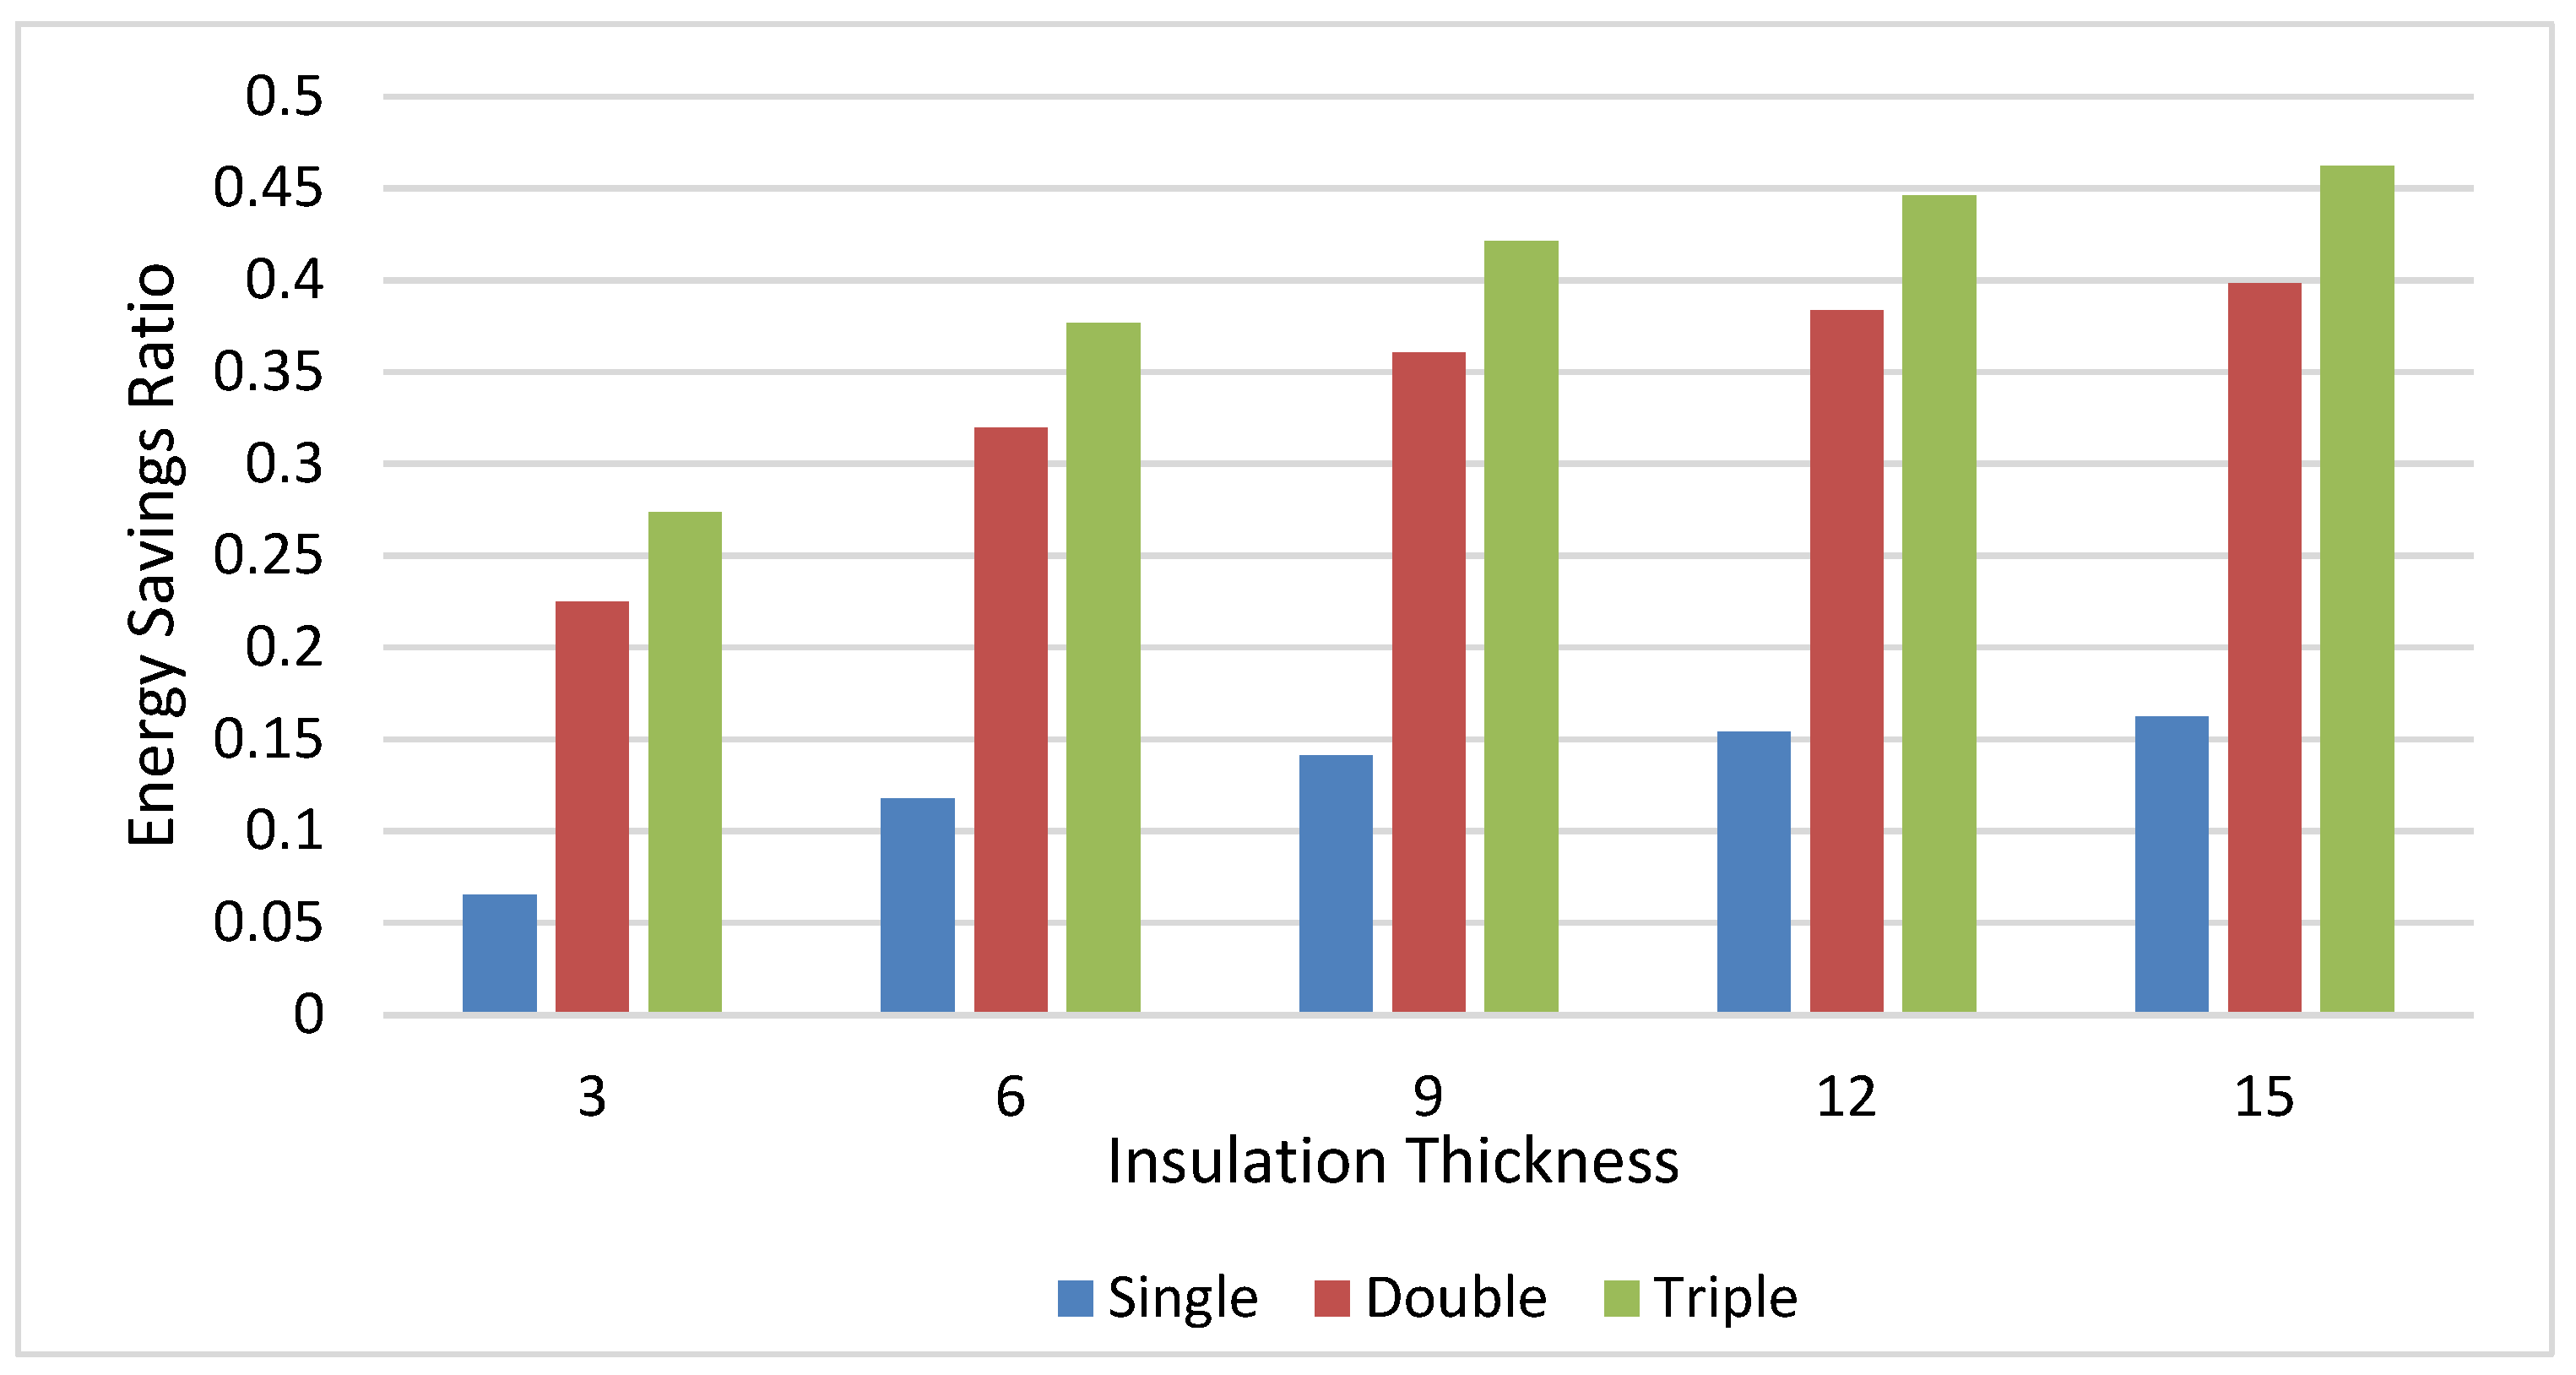
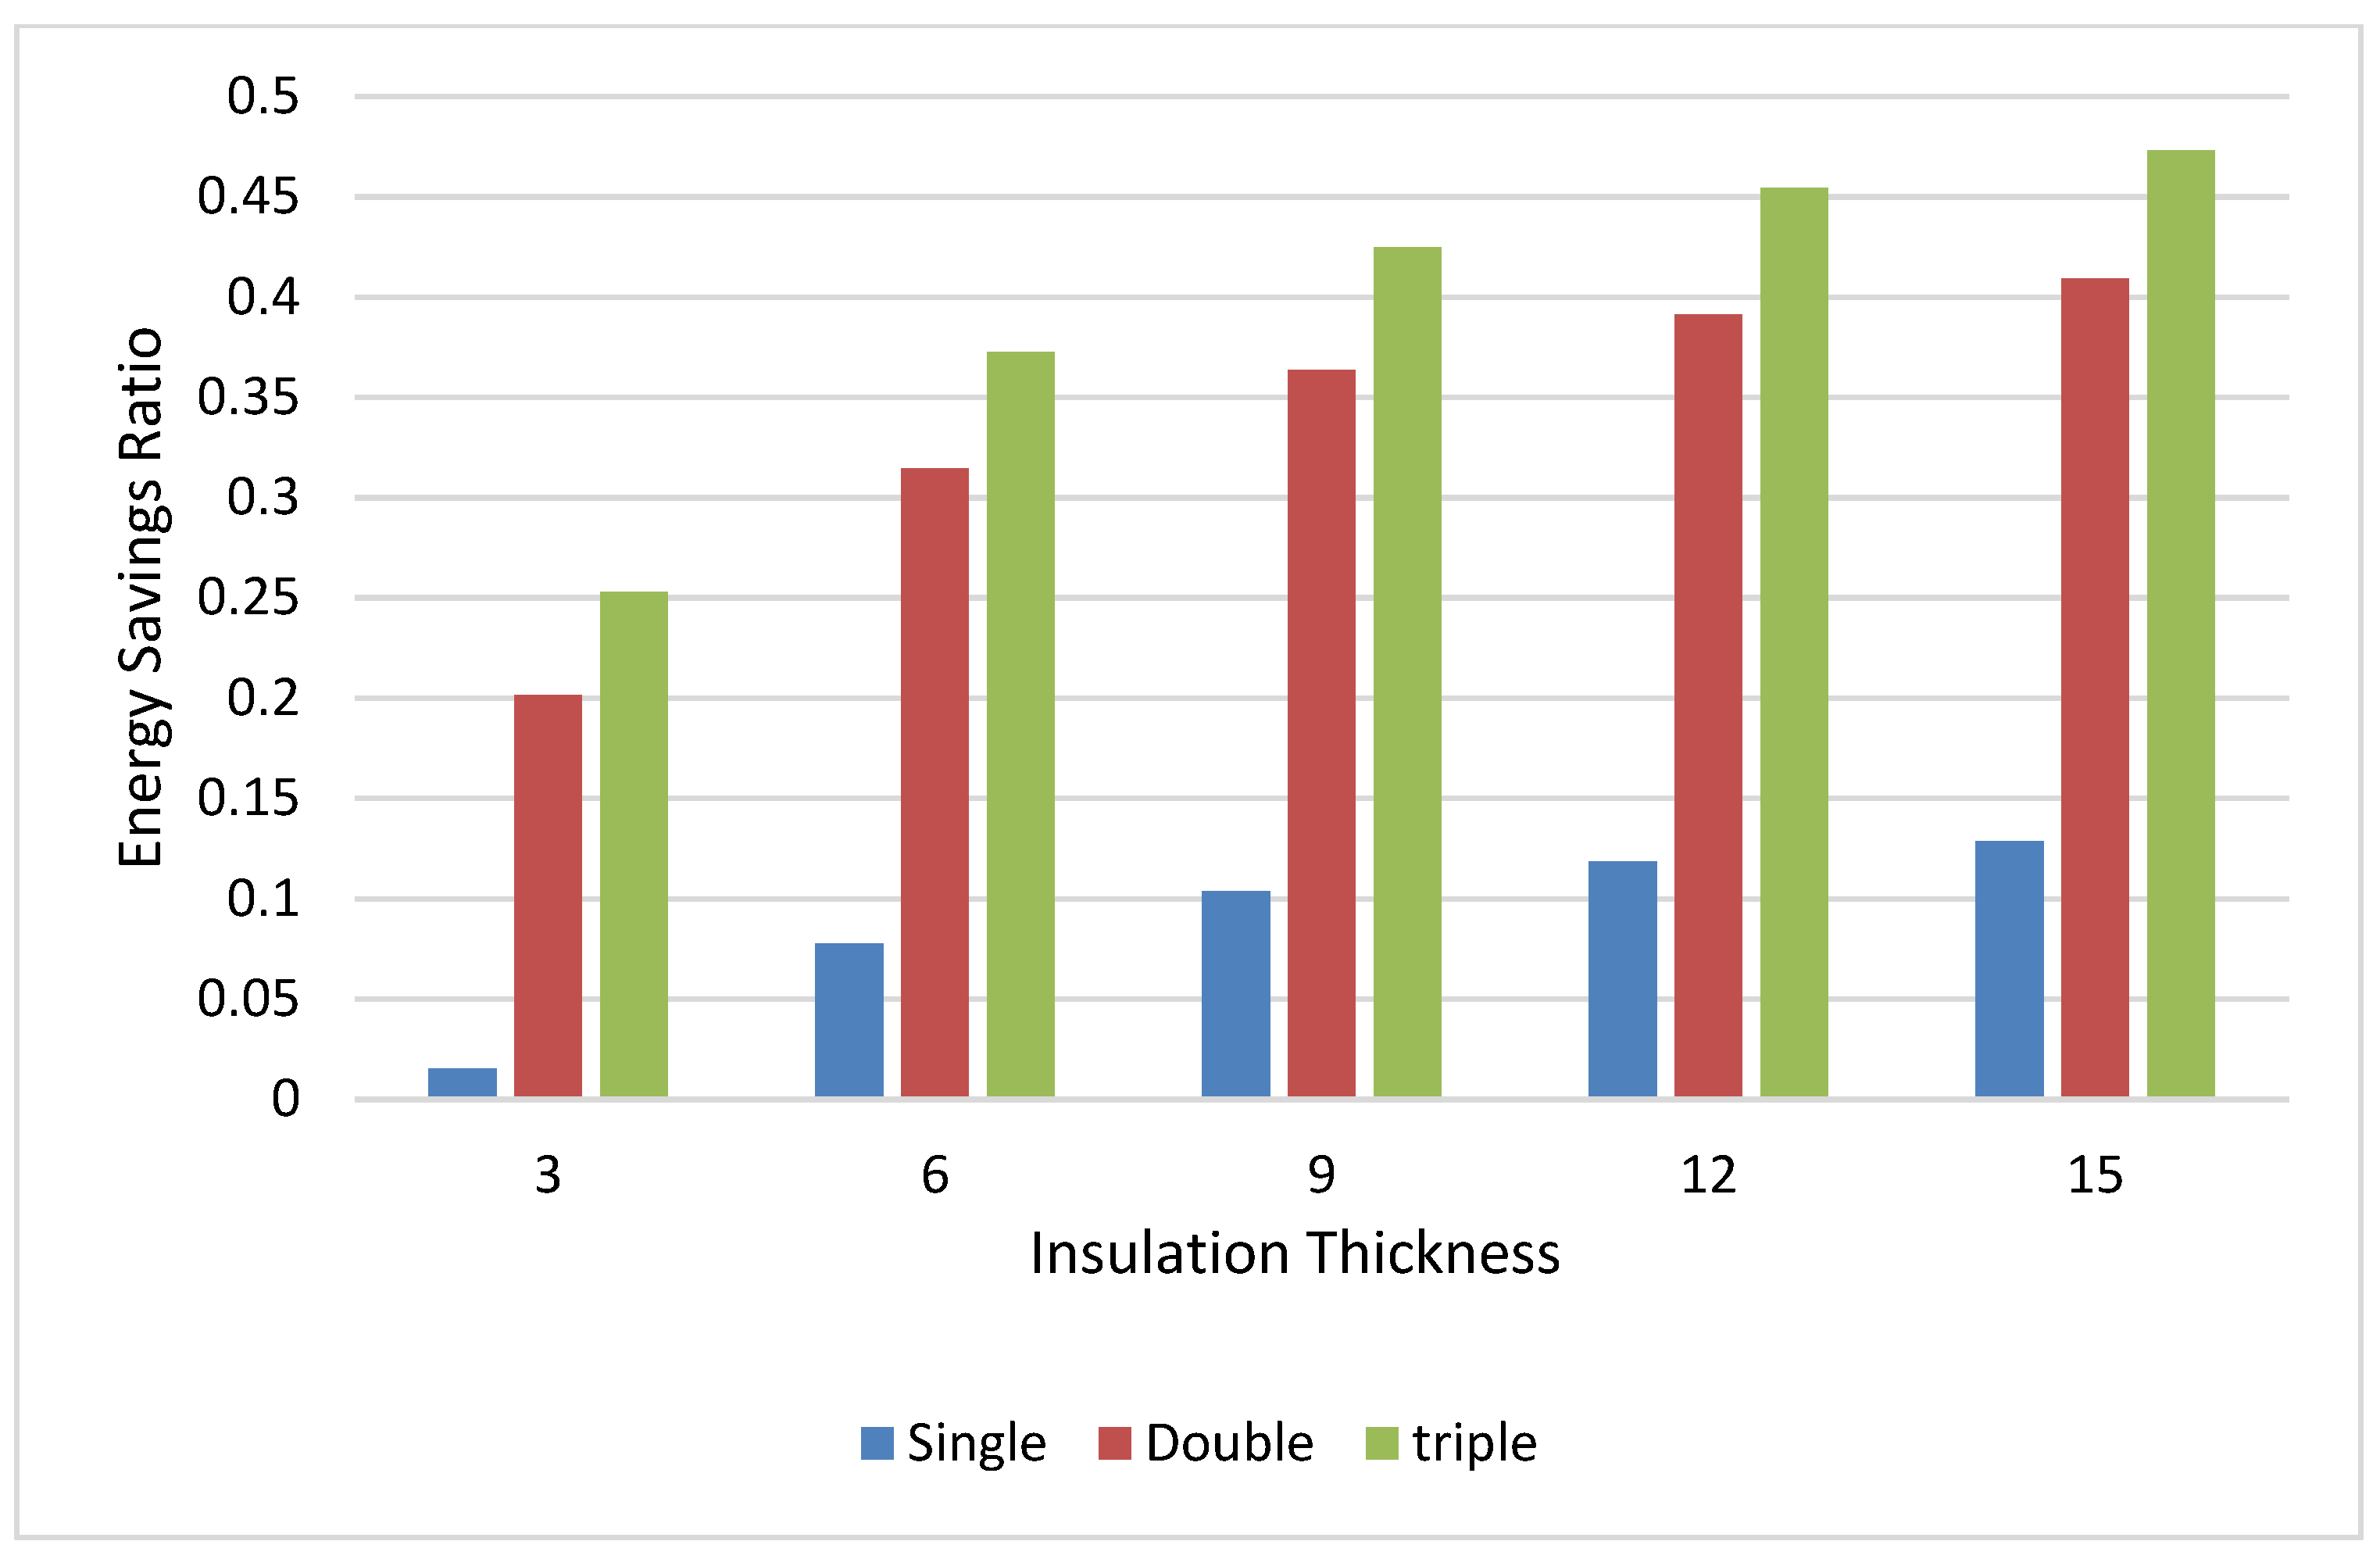
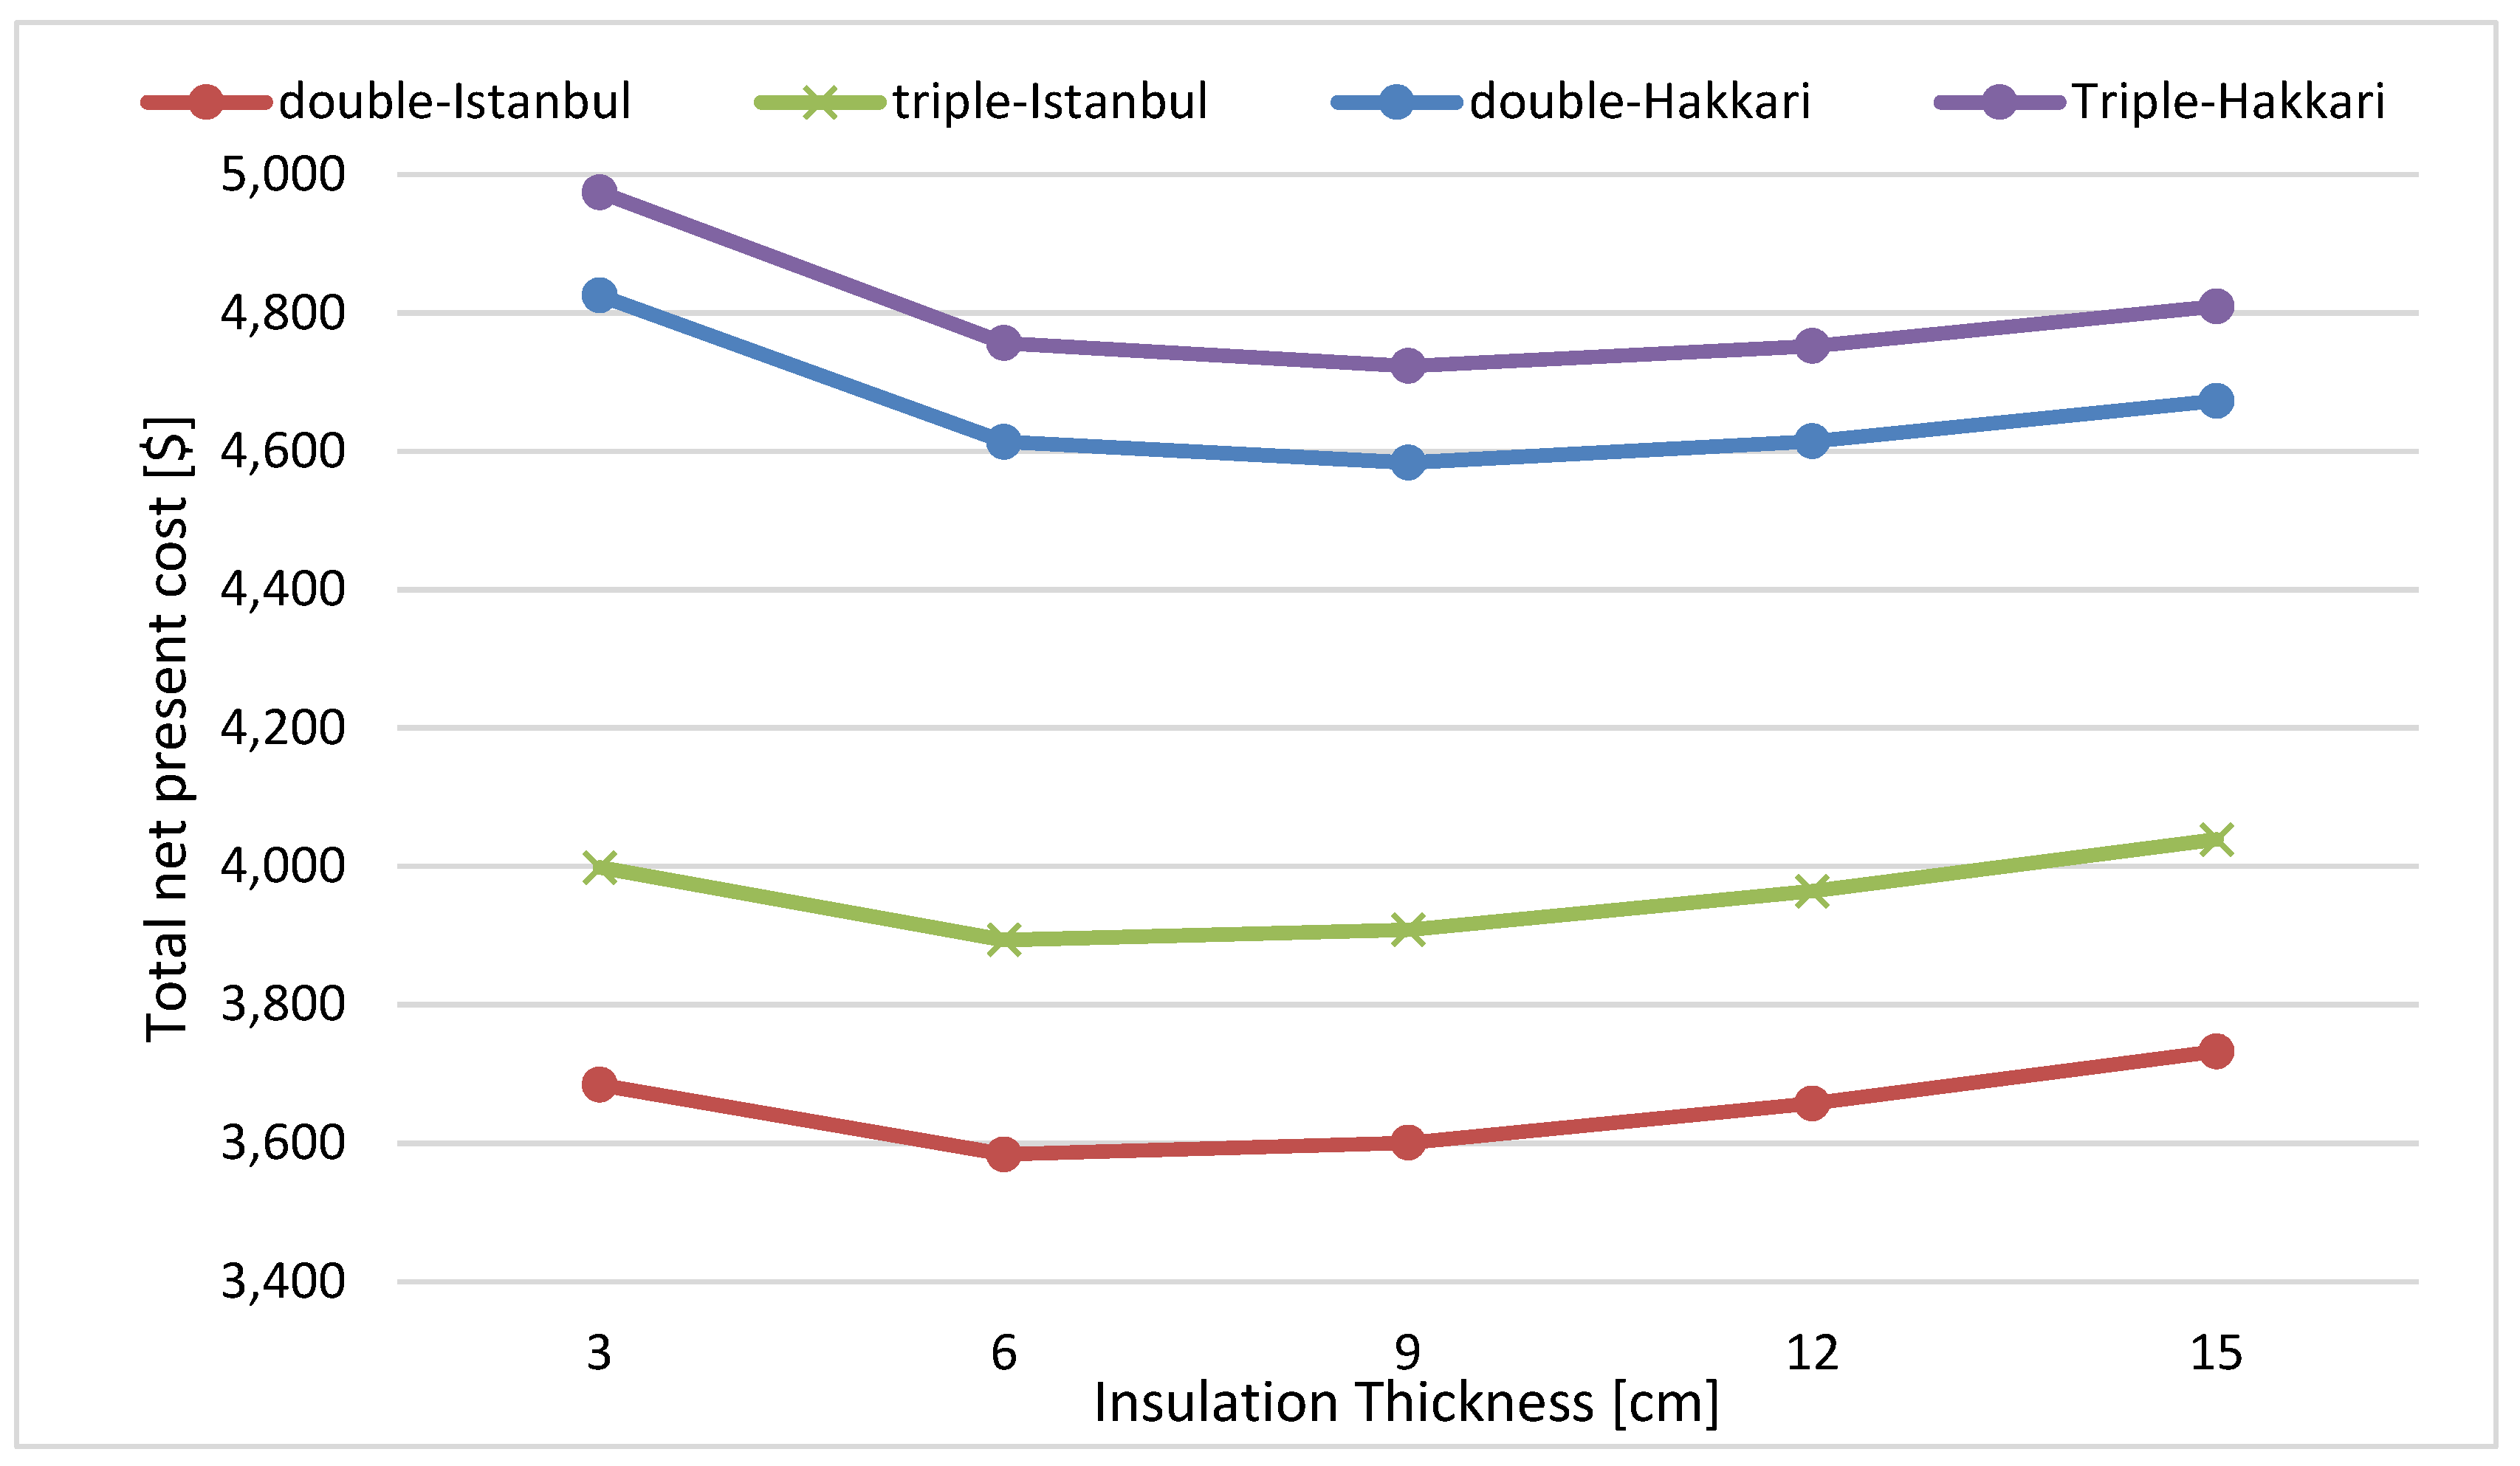
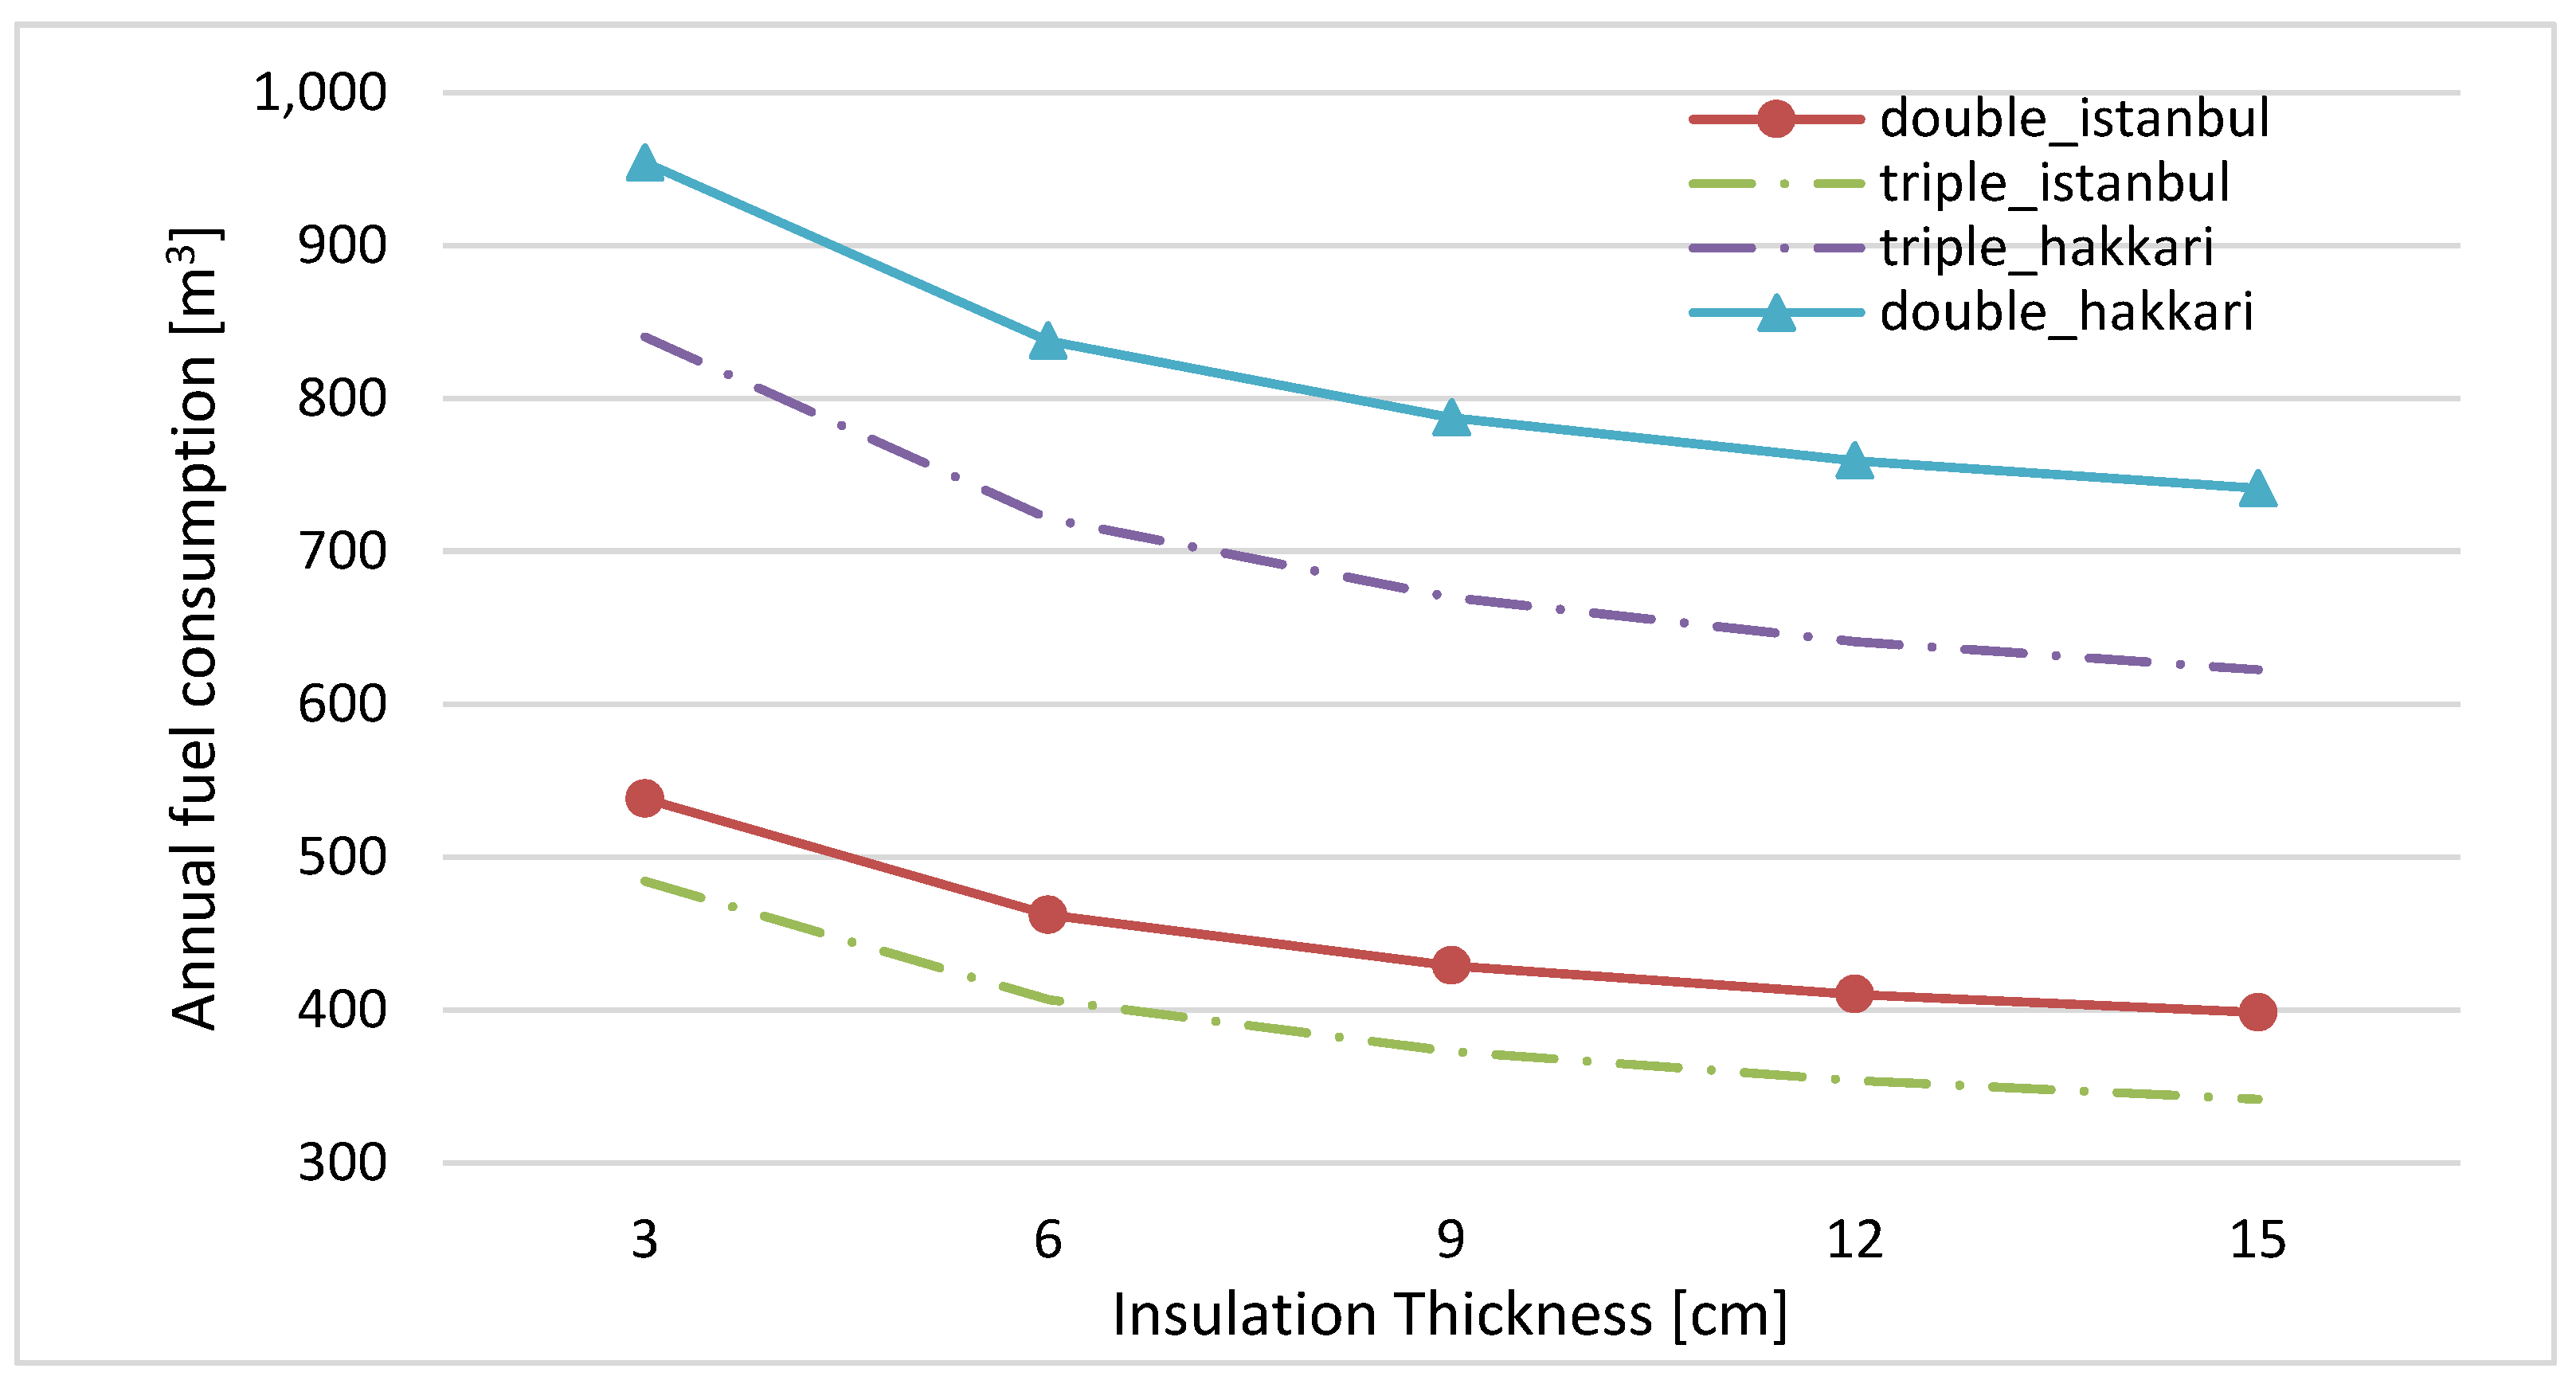
4.3. Insulation Thickness
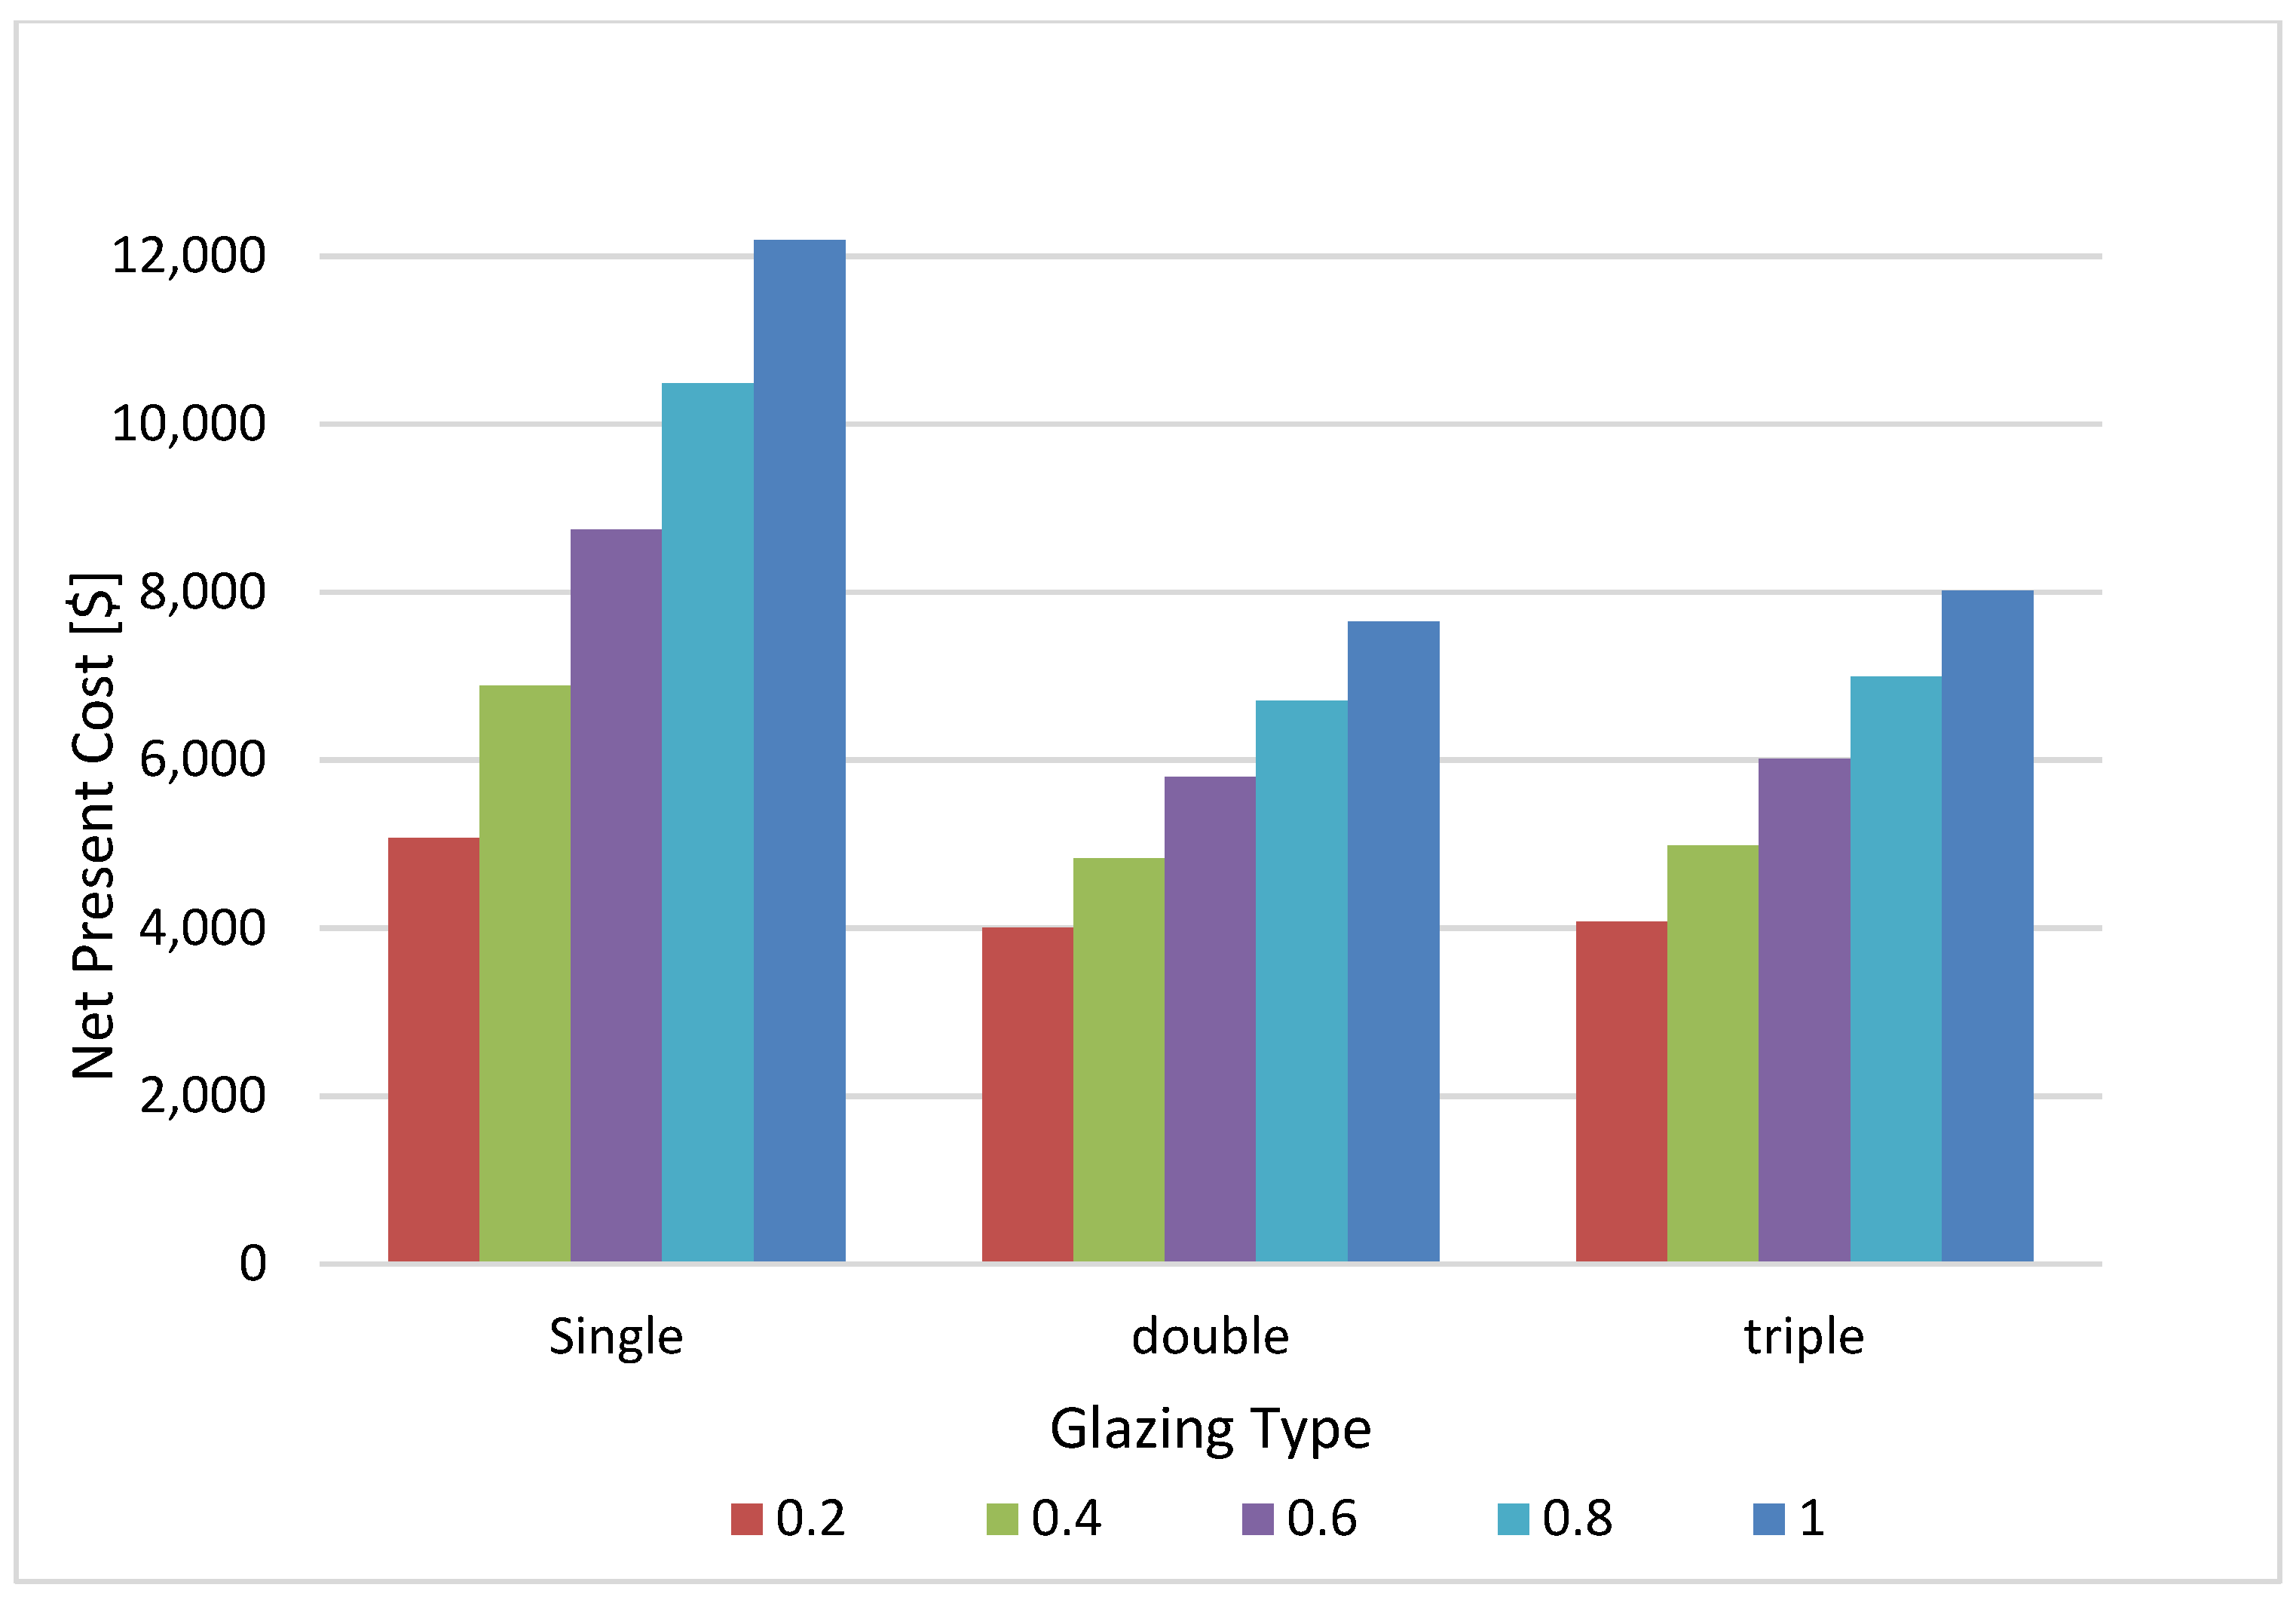
4.4. Infiltration Rate
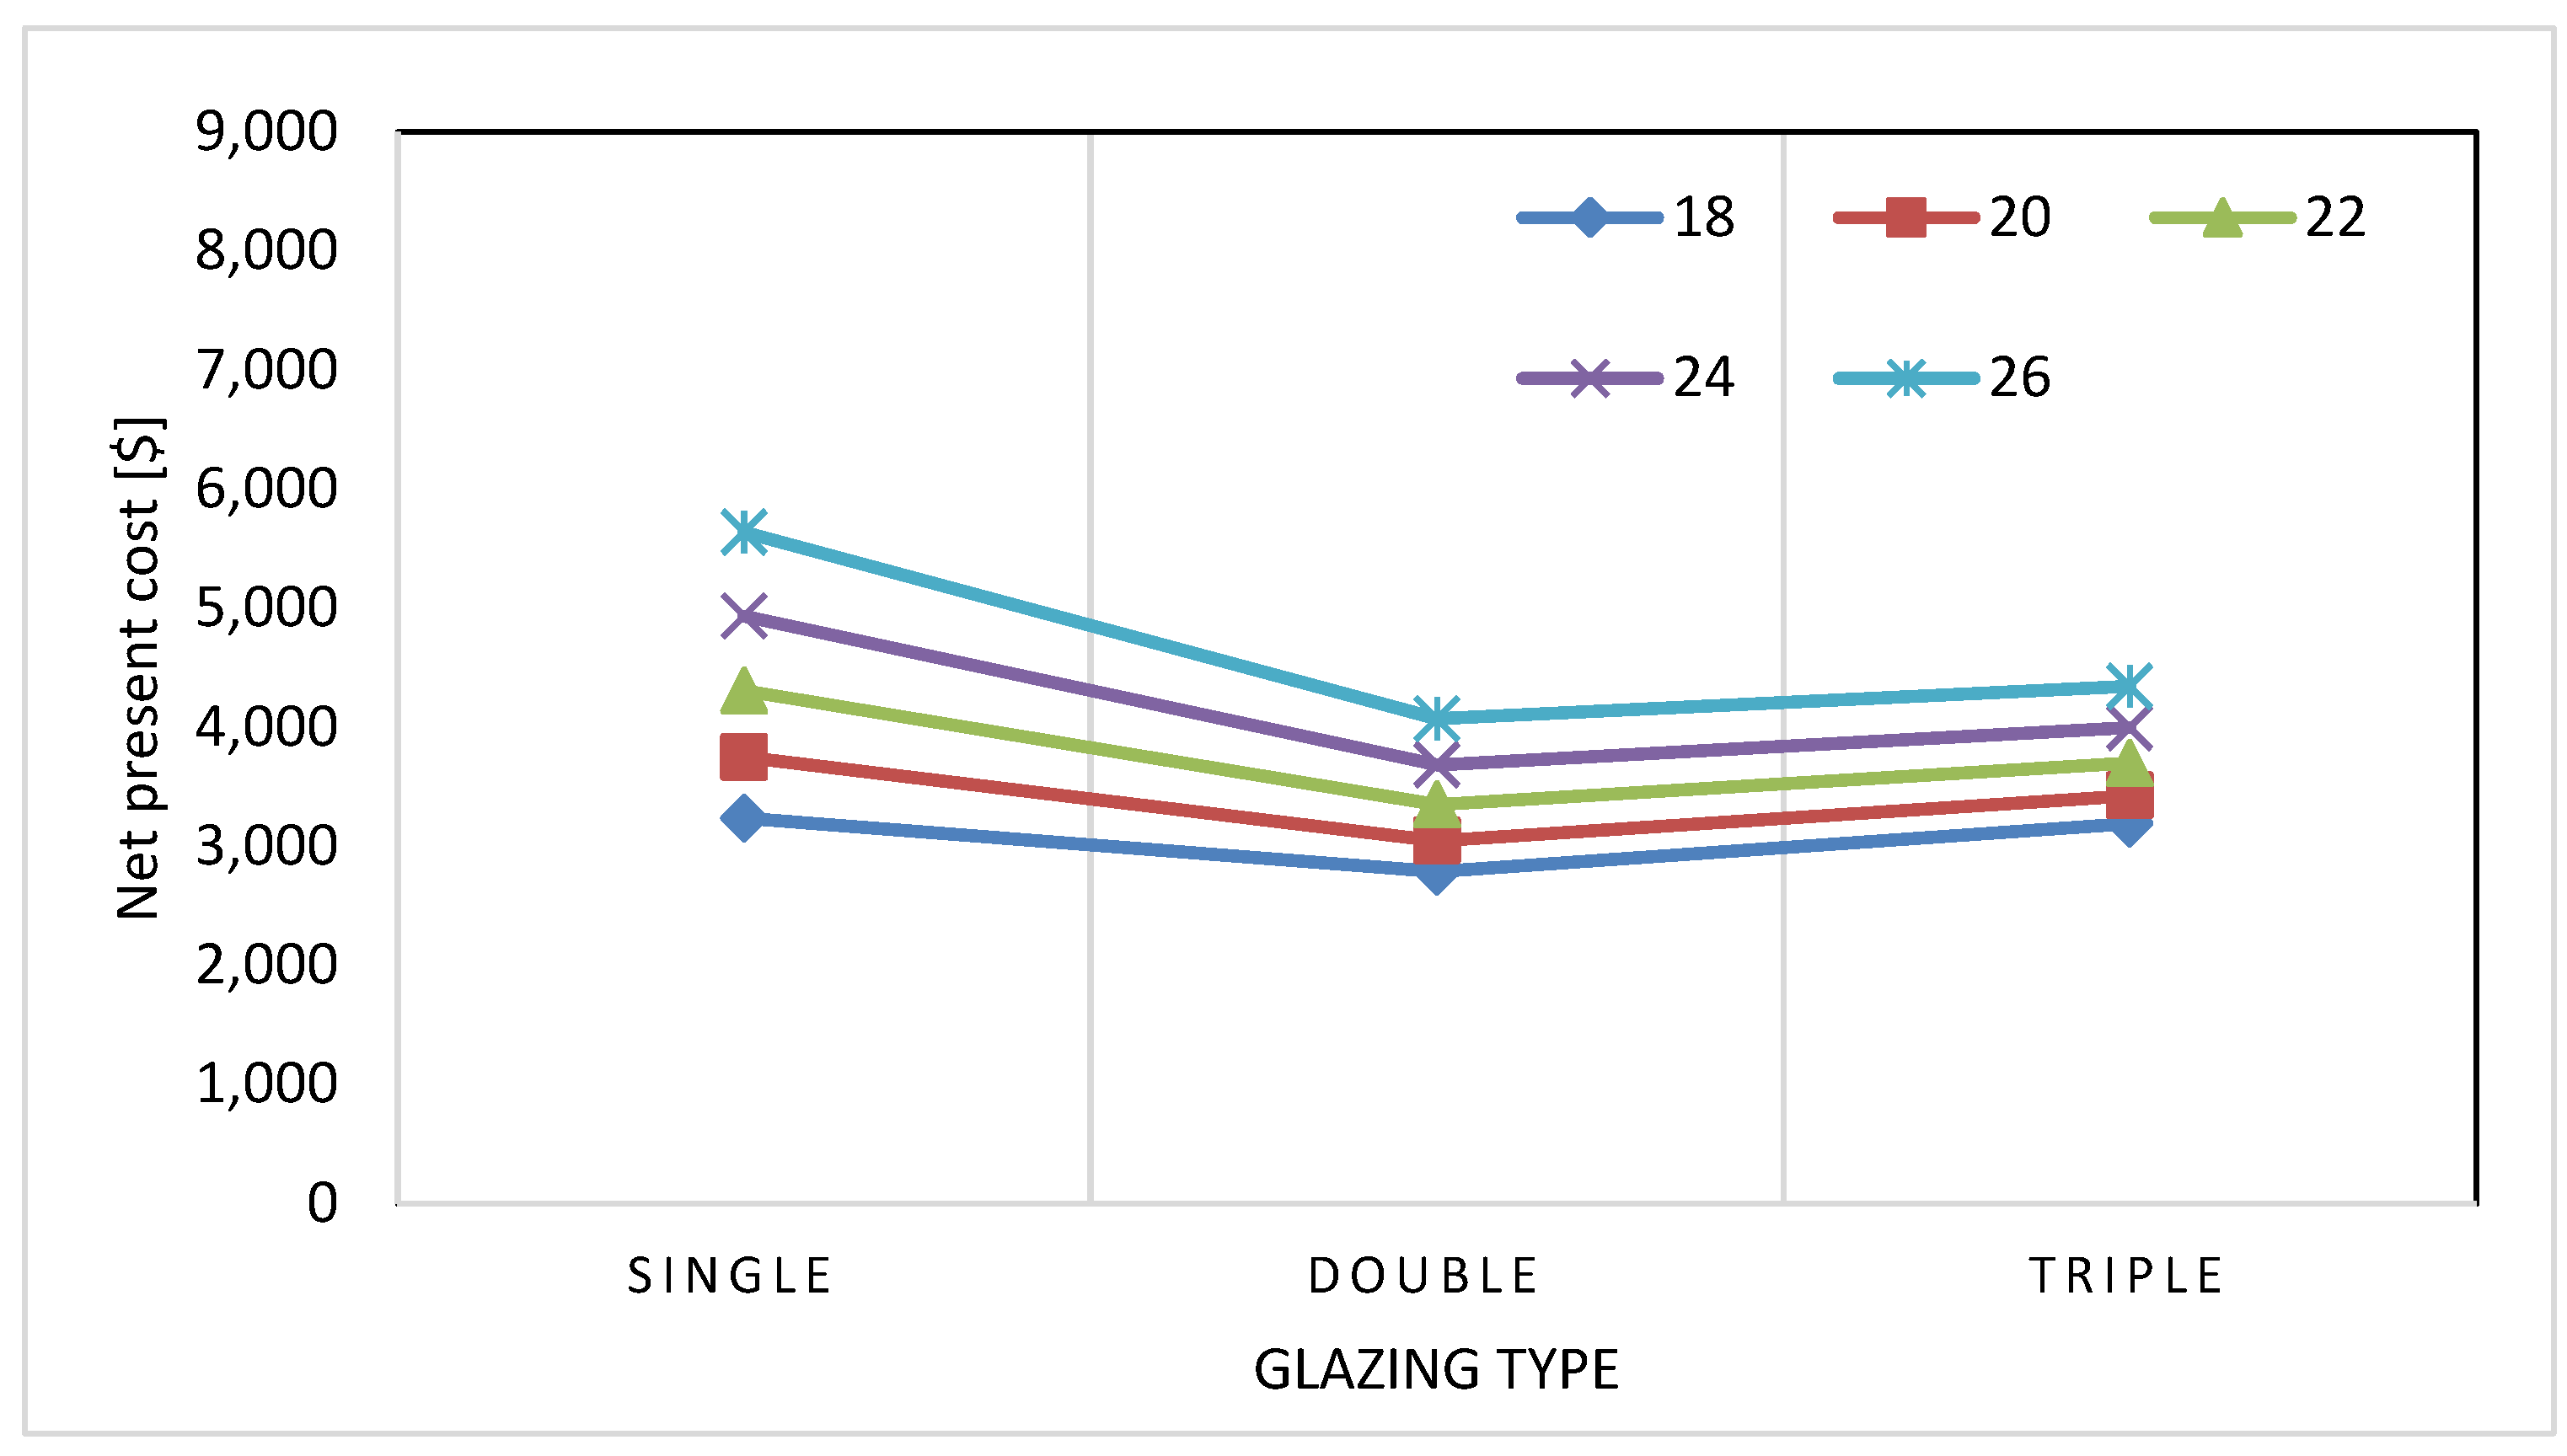
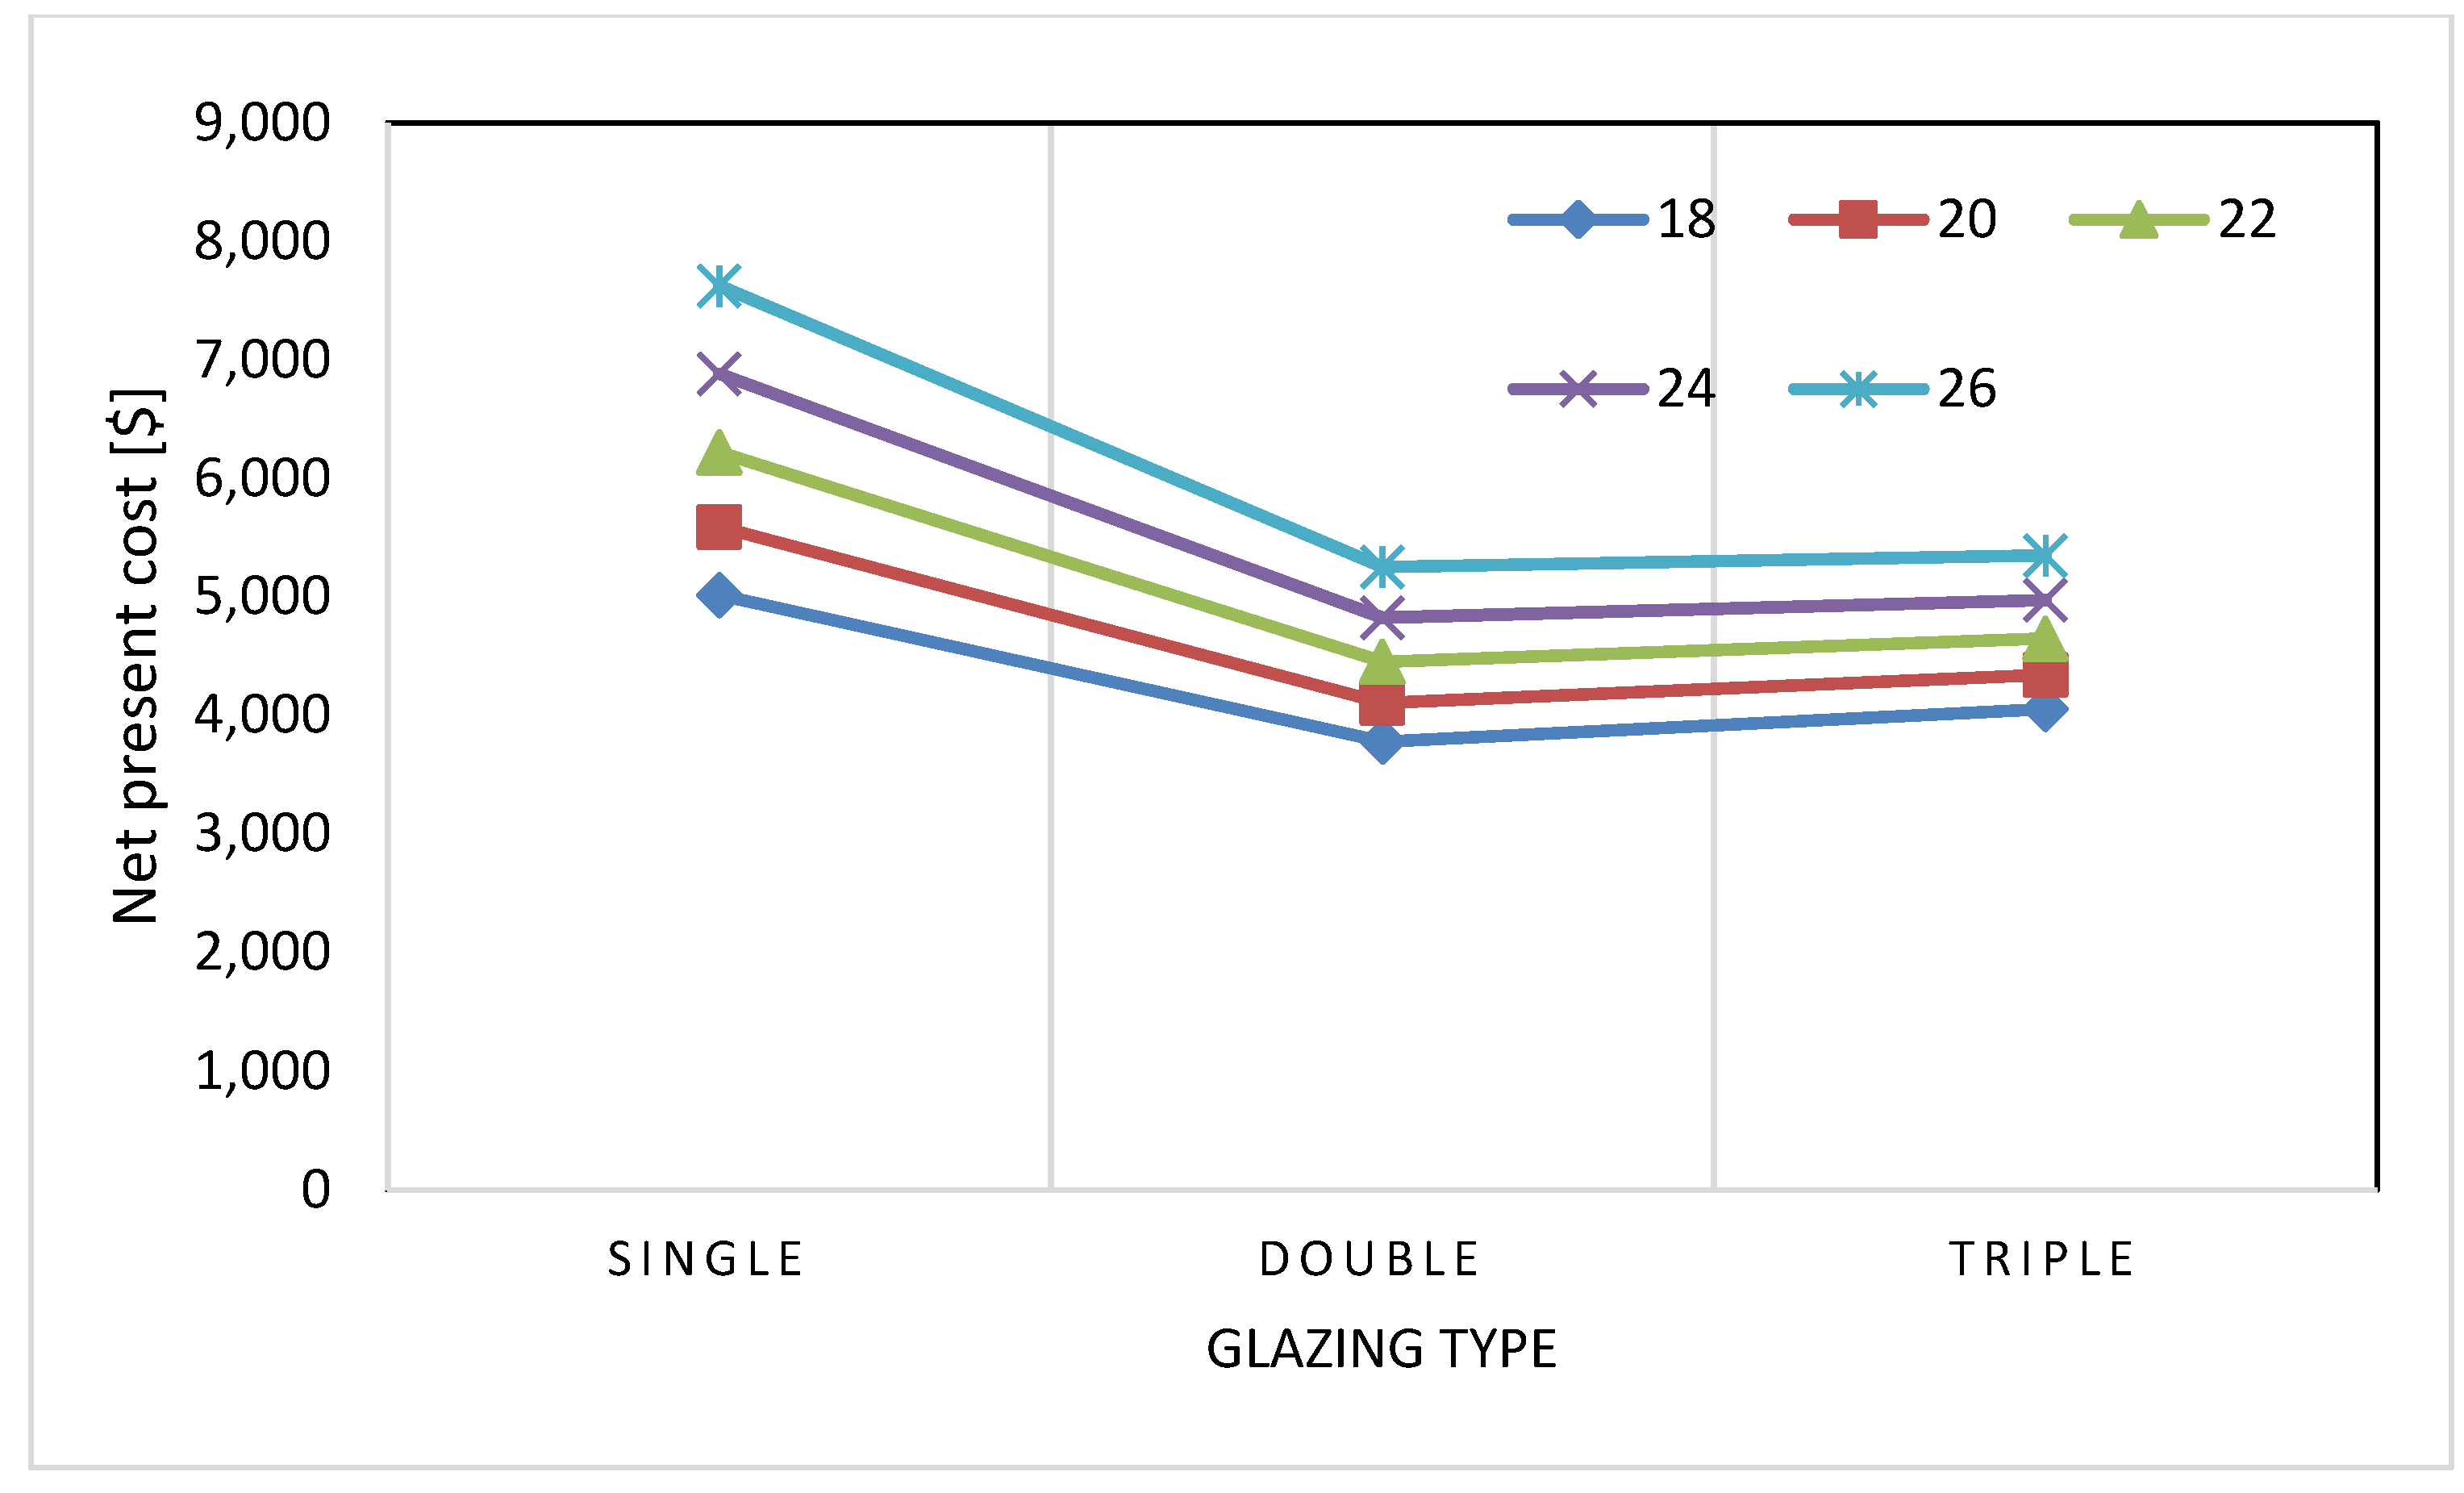
4.5. Room Set-Point Temperature
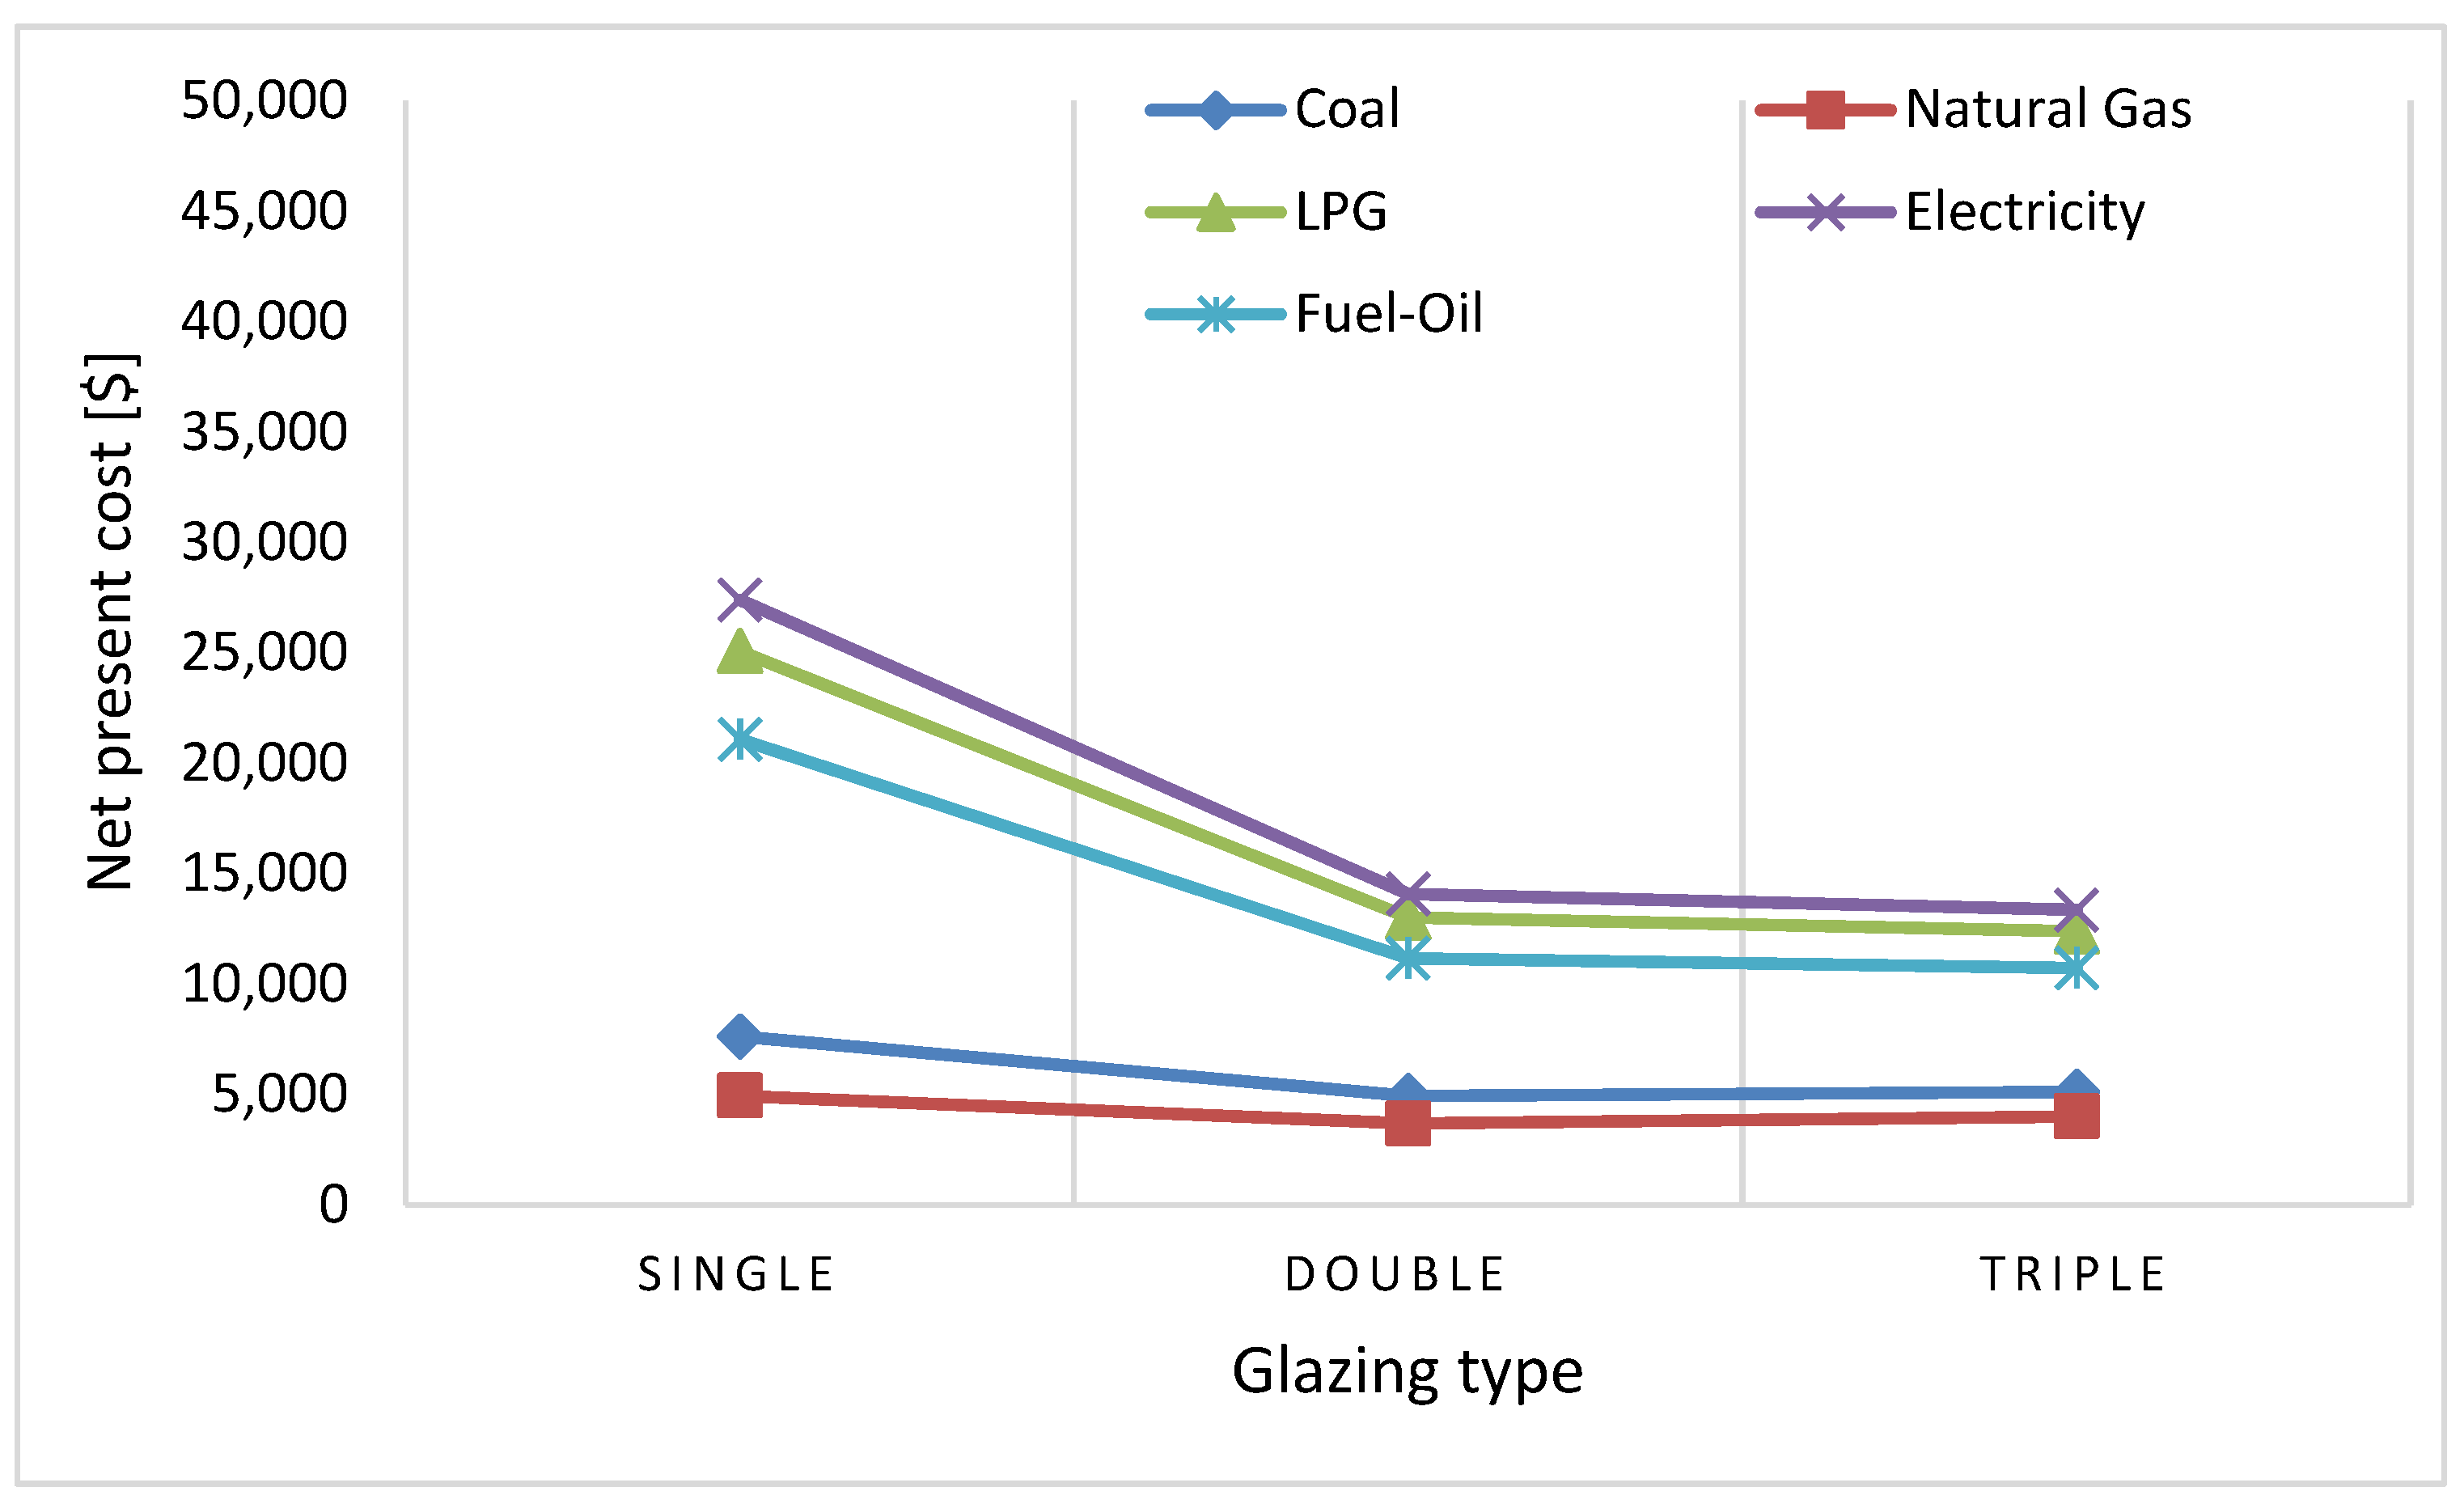
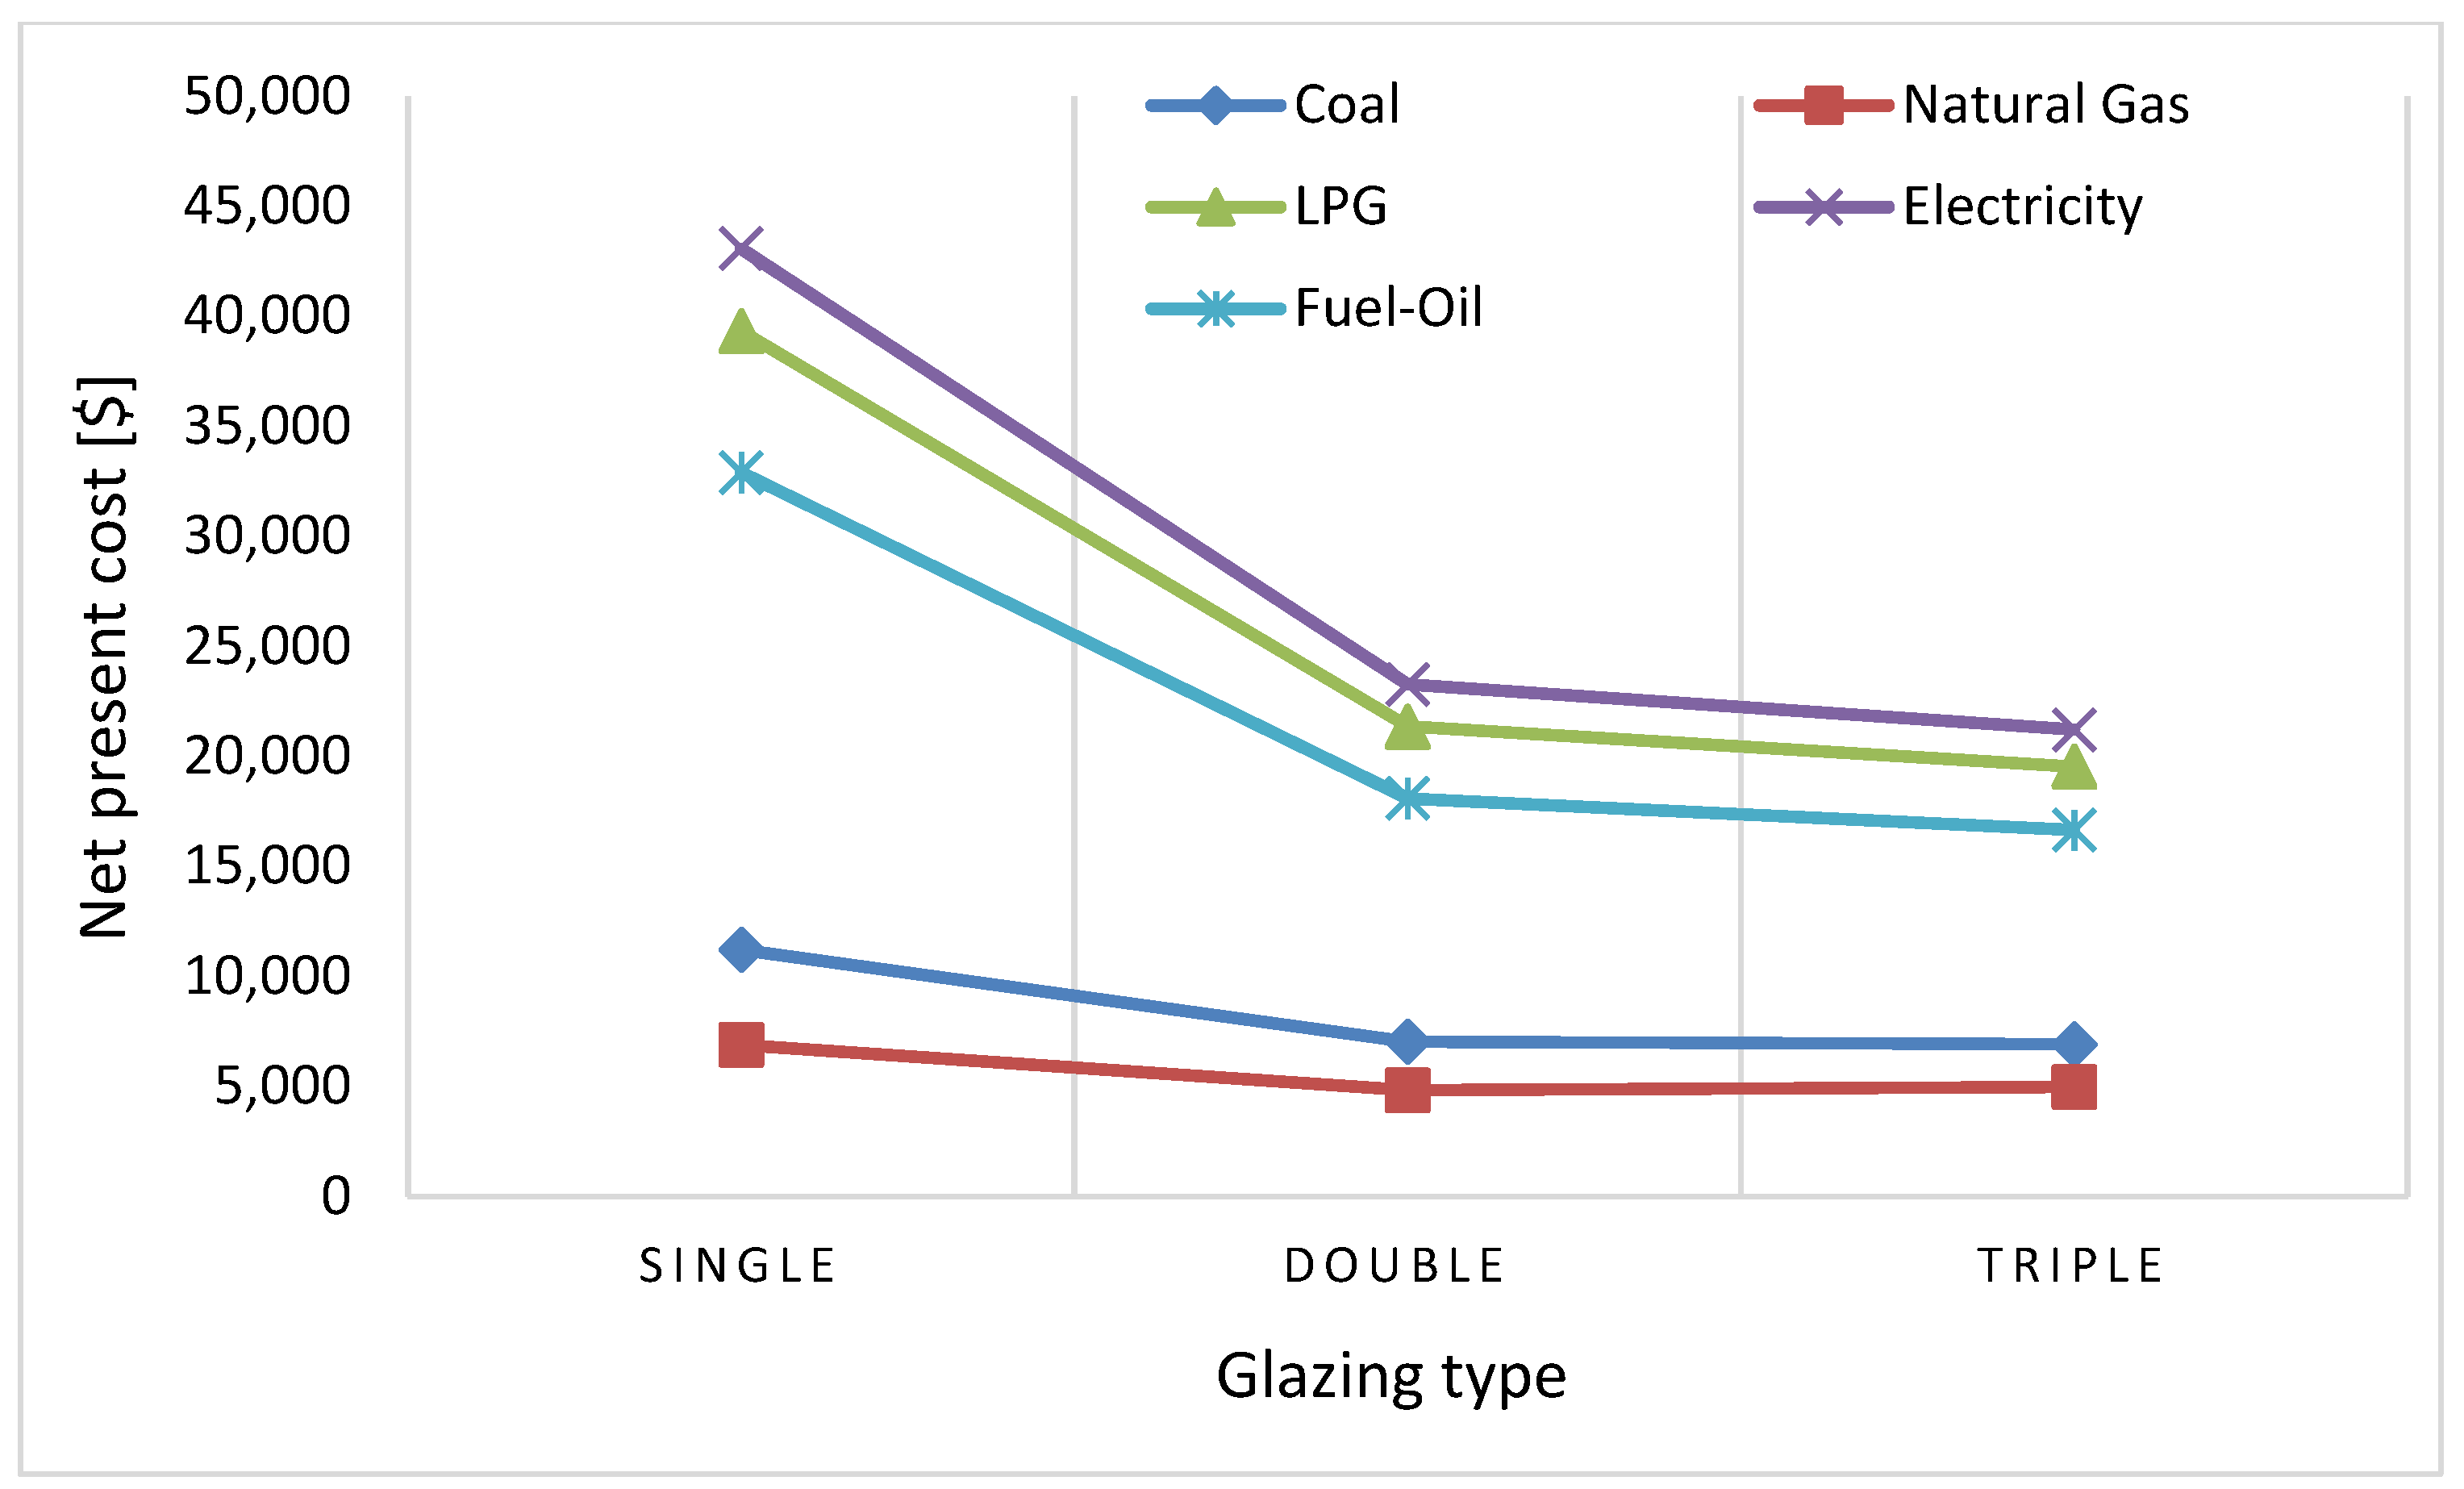
4.6. Fuel Type
5. Conclusions
Funding
Institutional Review Board Statement
Informed Consent Statement
Data Availability Statement
Conflicts of Interest
References
- Akan, A.E. Determination and Modeling of Optimum Insulation Thickness for Thermal Insulation of Buildings in All City Centers of Turkey. Int. J. Thermophys. 2021, 42, 49. [Google Scholar] [CrossRef]
- Mirabella, N.; Röck, M.; Saade, M.R.M.; Spirinckx, C.; Bosmans, M.; Allacker, K.; Passer, A. Strategies to improve the energy performance of buildings: A review of their life cycle impact. Buildings 2018, 8, 105. [Google Scholar] [CrossRef] [Green Version]
- Shehadi, M. Energy consumption optimization measures for buildings in the midwest regions of USA. Buildings 2018, 8, 170. [Google Scholar] [CrossRef] [Green Version]
- Kaynakli, O. Optimum thermal insulation thicknesses and payback periods for building walls in Turkey. J. Therm. Sci. Technol. 2013, 33, 45–55. [Google Scholar]
- Kaynakli, O. Parametric Investigation of Optimum Thermal Insulation Thickness for External Walls. Energies 2011, 4, 913–927. [Google Scholar] [CrossRef]
- Kurekci, N.A. Determination of optimum insulation thickness for building walls by using heating and cooling degree-day values of all Turkey ’ s provincial centers. Energy Build. 2016, 118, 197–213. [Google Scholar] [CrossRef]
- Bektas Ekici, B.; Aytac Gulten, A.; Aksoy, U.T. A study on the optimum insulation thicknesses of various types of external walls with respect to different materials, fuels and climate zones in Turkey. Appl. Energy 2012, 92, 211–217. [Google Scholar] [CrossRef]
- Yuan, J.; Farnham, C.; Emura, K. Optimum Insulation Thickness for Building Exterior Walls in 32 Regions of China to Save Energy and Reduce CO2 Emissions. Sustainability 2017, 9, 1711. [Google Scholar] [CrossRef] [Green Version]
- Canbolat, A.S.; Bademlioglu, A.H.; Saka, K.; Kaynakli, O. Investigation of parameters affecting the optimum thermal insulation thickness for buildings in hot and cold climates. Therm. Sci. 2020, 24, 2891–2903. [Google Scholar] [CrossRef] [Green Version]
- Alsayed, M.F.; Tayeh, R.A. Life cycle cost analysis for determining optimal insulation thickness in Palestinian buildings. J. Build. Eng. 2019, 22, 101–112. [Google Scholar] [CrossRef]
- Özel, G.; Açikkalp, E.; Görgün, B.; Yamik, H.; Caner, N. Optimum insulation thickness determination using the environmental and life cycle cost analyses based entransy approach. Sustain. Energy Technol. Assessments 2015, 11, 87–91. [Google Scholar] [CrossRef]
- Açıkkalp, E.; Yerel, S. A method for determining optimum insulation thickness: Combined economic and environmental method. Therm. Sci. Eng. Prog. 2019, 11, 249–253. [Google Scholar] [CrossRef]
- Barrau, J.; Ibañez, M.; Badia, F. Impact of the optimization criteria on the determination of the insulation thickness. Energy Build. 2014, 76, 459–469. [Google Scholar] [CrossRef]
- Ashouri, M.; Astaraei, F.R.; Ghasempour, R.; Ahmadi, M.H.; Feidt, M. Optimum insulation thickness determination of a building wall using exergetic life cycle assessment. Appl. Therm. Eng. 2016, 106, 307–315. [Google Scholar] [CrossRef]
- Dombayci, O.A.; Ulu, E.Y.; Guven, S.; Atalay, O.; Ozturk, H.K. Determination Of Optimum Insulation Thickness For Building External Walls With Different Insulation Materials Using Environmental Impact Assessment. Therm. Sci. 2020, 24, 303–311. [Google Scholar] [CrossRef] [Green Version]
- Keçebaş, A. Determination of optimum insulation thickness in pipe for exergetic life cycle assessment. Energy Convers. Manag. 2015, 105, 826–835. [Google Scholar] [CrossRef]
- Albatayneh, A. Optimising the parameters of a building envelope in the east mediterranean Saharan, cool climate Zone. Buildings 2021, 11, 43. [Google Scholar] [CrossRef]
- Hachem-Vermette, C.; MacGregor, A. Energy optimized envelope for cold climate indoor agricultural growing center. Buildings 2017, 7, 59. [Google Scholar] [CrossRef] [Green Version]
- Kalua, A. Envelope thermal design optimization for urban residential buildings in Malawi. Buildings 2016, 6, 13. [Google Scholar] [CrossRef] [Green Version]
- Atmaca, A.; Gedik, G.; Wagner, A. Determination of Optimum Envelope of Religious Buildings in Terms of Thermal Comfort and Energy Consumption. Energies 2021, 14, 6597. [Google Scholar] [CrossRef]
- Xu, X.; Feng, G.; Chi, D.; Liu, M.; Dou, B. Optimization of Performance Parameter Design. Energies 2020, 11, 3252. [Google Scholar] [CrossRef] [Green Version]
- Chiesa, G.; Acquaviva, A.; Grosso, M.; Bottaccioli, L.; Floridia, M.; Pristeri, E.; Sanna, E.M. Parametric Optimization of Window-to-Wall Ratio for Passive Buildings Adopting A Scripting Methodology to Dynamic-Energy Simulation. Sustainability 2019, 11, 3078. [Google Scholar] [CrossRef] [Green Version]
- Wang, Z.; Zhao, J. Optimization of Passive Envelop Energy Efficient Measures for Office Buildings in Different Climate Regions of China Based on Modified Sensitivity Analysis. Sustainability 2018, 10, 907. [Google Scholar] [CrossRef] [Green Version]
- Axaopoulos, I.; Axaopoulos, P.; Gelegenis, J.; Fylladitakis, E.D. Optimum external wall insulation thickness considering the annual CO2 emissions. J. Build. Phys. 2019, 42, 527–544. [Google Scholar] [CrossRef]
- Usman, M.; Frey, G. Multi-Objective Techno-Economic Optimization of Design Parameters for Residential Buildings in Different Climate Zones. Sustainability 2022, 14, 65. [Google Scholar] [CrossRef]
- Altun, A.F.; Kiliç, M. Influence of window parameters on the thermal performance of office rooms in different climate zones of Turkey. Int. J. Renew. Energy Res. 2019, 9, 226–243. [Google Scholar]
- Djokovic, J.M.; Bujnak, J.; Hadzima, B.; Pastorek, F.; Dwornicka, R.; Ulewicz, R. Selection of the Optimal Window Type and Orientation for the Two Cities in Serbia and One in Slovakia. Energies 2022, 15, 323. [Google Scholar] [CrossRef]
- Gasparella, A.; Pernigotto, G.; Cappelletti, F.; Romagnoni, P.; Baggio, P. Analysis and modelling of window and glazing systems energy performance for a well insulated residential building. Energy Build. 2011, 43, 1030–1037. [Google Scholar] [CrossRef]
- Tsikaloudaki, K.; Laskos, K.; Theodosiou, T.; Bikas, D. Assessing cooling energy performance of windows for office buildings in the Mediterranean zone. Energy Build. 2012, 49, 192–199. [Google Scholar] [CrossRef]
- Tsikaloudaki, K.; Theodosiou, T.; Laskos, K.; Bikas, D. Assessing cooling energy performance of windows for residential buildings in the Mediterranean zone. Energy Convers. Manag. 2012, 64, 335–343. [Google Scholar] [CrossRef]
- Kon, O. Calculation of fuel consumption and emissions in buildings based on external walls and windows using economic optimization. J. Fac. Eng. Archit. Gazi Univ. 2018, 33, 101–113. [Google Scholar] [CrossRef]
- Ozel, M. Influence of glazing area on optimum thickness of insulation for different wall orientations. Appl. Therm. Eng. 2019, 147, 770–780. [Google Scholar] [CrossRef]
- Karabay, H.; Arici, M. Multiple pane window applications in various climatic regions of Turkey. Energy Build. 2012, 45, 67–71. [Google Scholar] [CrossRef]
- Derradji, L.; Imessad, K.; Amara, M.; Boudali Errebai, F. A study on residential energy requirement and the effect of the glazing on the optimum insulation thickness. Appl. Therm. Eng. 2017, 112, 975–985. [Google Scholar] [CrossRef]
- Gelegenis, J.; Axaopoulos, P. A multi-parametric mathematical approach on the selection of optimum insulation thicknesses in buildings. Buildings 2017, 7, 15. [Google Scholar] [CrossRef] [Green Version]
- Akan, A.P.; Akan, A.E. Modeling of CO2 emissions via optimum insulation thickness of residential buildings. Clean Technol. Environ. Policy 2021. [Google Scholar] [CrossRef]
- Dylewski, R.; Adamczyk, J. Optimum thickness of thermal insulation with both economic and ecological costs of heating and cooling. Energies 2021, 14, 3835. [Google Scholar] [CrossRef]
- Şencan Şahin, A.; Kovacı, T.; Dikmen, E. Determination and economic analysis of the optimum insulation thickness of building walls, considering annual CO2 emission. Pamukkale Univ. J. Eng. Sci. 2021, 27, 60–69. [Google Scholar] [CrossRef]
- Hamelin, M.C.; Zmeureanu, R. Optimum envelope of a single-family house based on life cycle analysis. Buildings 2014, 4, 95–112. [Google Scholar] [CrossRef]
- Jaber, S.; Ajib, S. Optimum, technical and energy efficiency design of residential building in Mediterranean region. Energy Build. 2011, 43, 1829–1834. [Google Scholar] [CrossRef]
- Central Bank of Turkey Central Bank of Turkey. Available online: https://www.tcmb.gov.tr/ (accessed on 14 March 2022).
- Turkish Statistical Institute (TURKSTAT). Available online: https://www.tuik.gov.tr/ (accessed on 14 March 2022).
- Comparison of the unit energy prices in Turkey. Available online: https://www.enerji-dunyasi.com/belge-indir/4/730/yakit-fiyatlari-karsilastirma-tablosu-02-03-2022.xlsx/ (accessed on 14 March 2022).
- Ertürk, M. Optimum insulation thicknesses of pipes with respect to different insulation materials, fuels and climate zones in Turkey. Energy 2016, 113, 991–1003. [Google Scholar] [CrossRef]
- Ozel, M. Determination of optimum insulation thickness based on cooling transmission load for building walls in a hot climate. Energy Convers. Manag. 2013, 66, 106–114. [Google Scholar] [CrossRef]
- Çağlayan, S.; Özorhon, B.; Özcan-deniz, G.; Yiğit, S. A life cycle costing approach to determine the optimum insulation thickness of existing buildings. J. Therm. Sci. Technol. 2020, 40, 1–14. [Google Scholar]
- Altun, A.F.; Kilic, M. Design and performance evaluation based on economics and environmental impact of a PV-wind-diesel and battery standalone power system for various climates in Turkey. Renew. Energy 2020, 157, 424–443. [Google Scholar] [CrossRef]
- Ozel, M.; Ozel, C. Effect of window-to-wall-area ratio on thermal performance of building wall materials in Elazığ, Turkey. PLoS ONE 2020, 15, e0237797. [Google Scholar] [CrossRef]


| Material | Thickness (m) | Conductivity (kJ·h−1m−1K−1) | Density (kg·m−3) |
|---|---|---|---|
| Plaster | 0.020 | 5 | 2000 |
| Brick | 0.210 | 3.2 | 1800 |
| Plaster | 0.030 | 5 | 2000 |
| Insulation | 0.03–0.15 | 0.144 | 40 |
| Parameter | Value |
|---|---|
| Area | 100 m2 |
| Height | 3 m |
| Window Type | Single glazed (5.69 W/m2·K) |
| Double glazed (1.1 W/m2·K) | |
| Triple glazed (0.61 W/m2·K) | |
| Infiltration rate | 0.2–0.4–0.6–0.8–1 ACH |
| Orientation | North-east, north-west |
| South-east, south-west | |
| Heating set-point temperature | 18–20–22–24–26 °C |
| Parameter | Value 1 |
|---|---|
| Natural Gas | Unit price: 0.18 $/m3 [43] |
| LHV: 9.59 kWh/m3 | |
| Coal | Unit price: 0.13 $/m3 [43] |
| LHV: 5.76 kWh/kg | |
| [7] | |
| Liquid Petrol Gas (LPG) | Unit price: 1.60 $/kg [43] |
| LHV: 12.9 kWh/kg | |
| [7] | |
| Electricity | Unit price: 0.15$/kWh [43] |
| LHV: 1 kWh/kWh | |
| Fuel-Oil | Unit price: 1.03 $/kg [43] |
| LHV: 11.28 kWh/kg | |
| [44] | |
| Interest rate (i) | 15% |
| Inflation rate (g) | 14.6% |
| Project lifetime | 20 years [45,46] |
| The unit price of the selected insulation material | 100 $/m3 [12] |
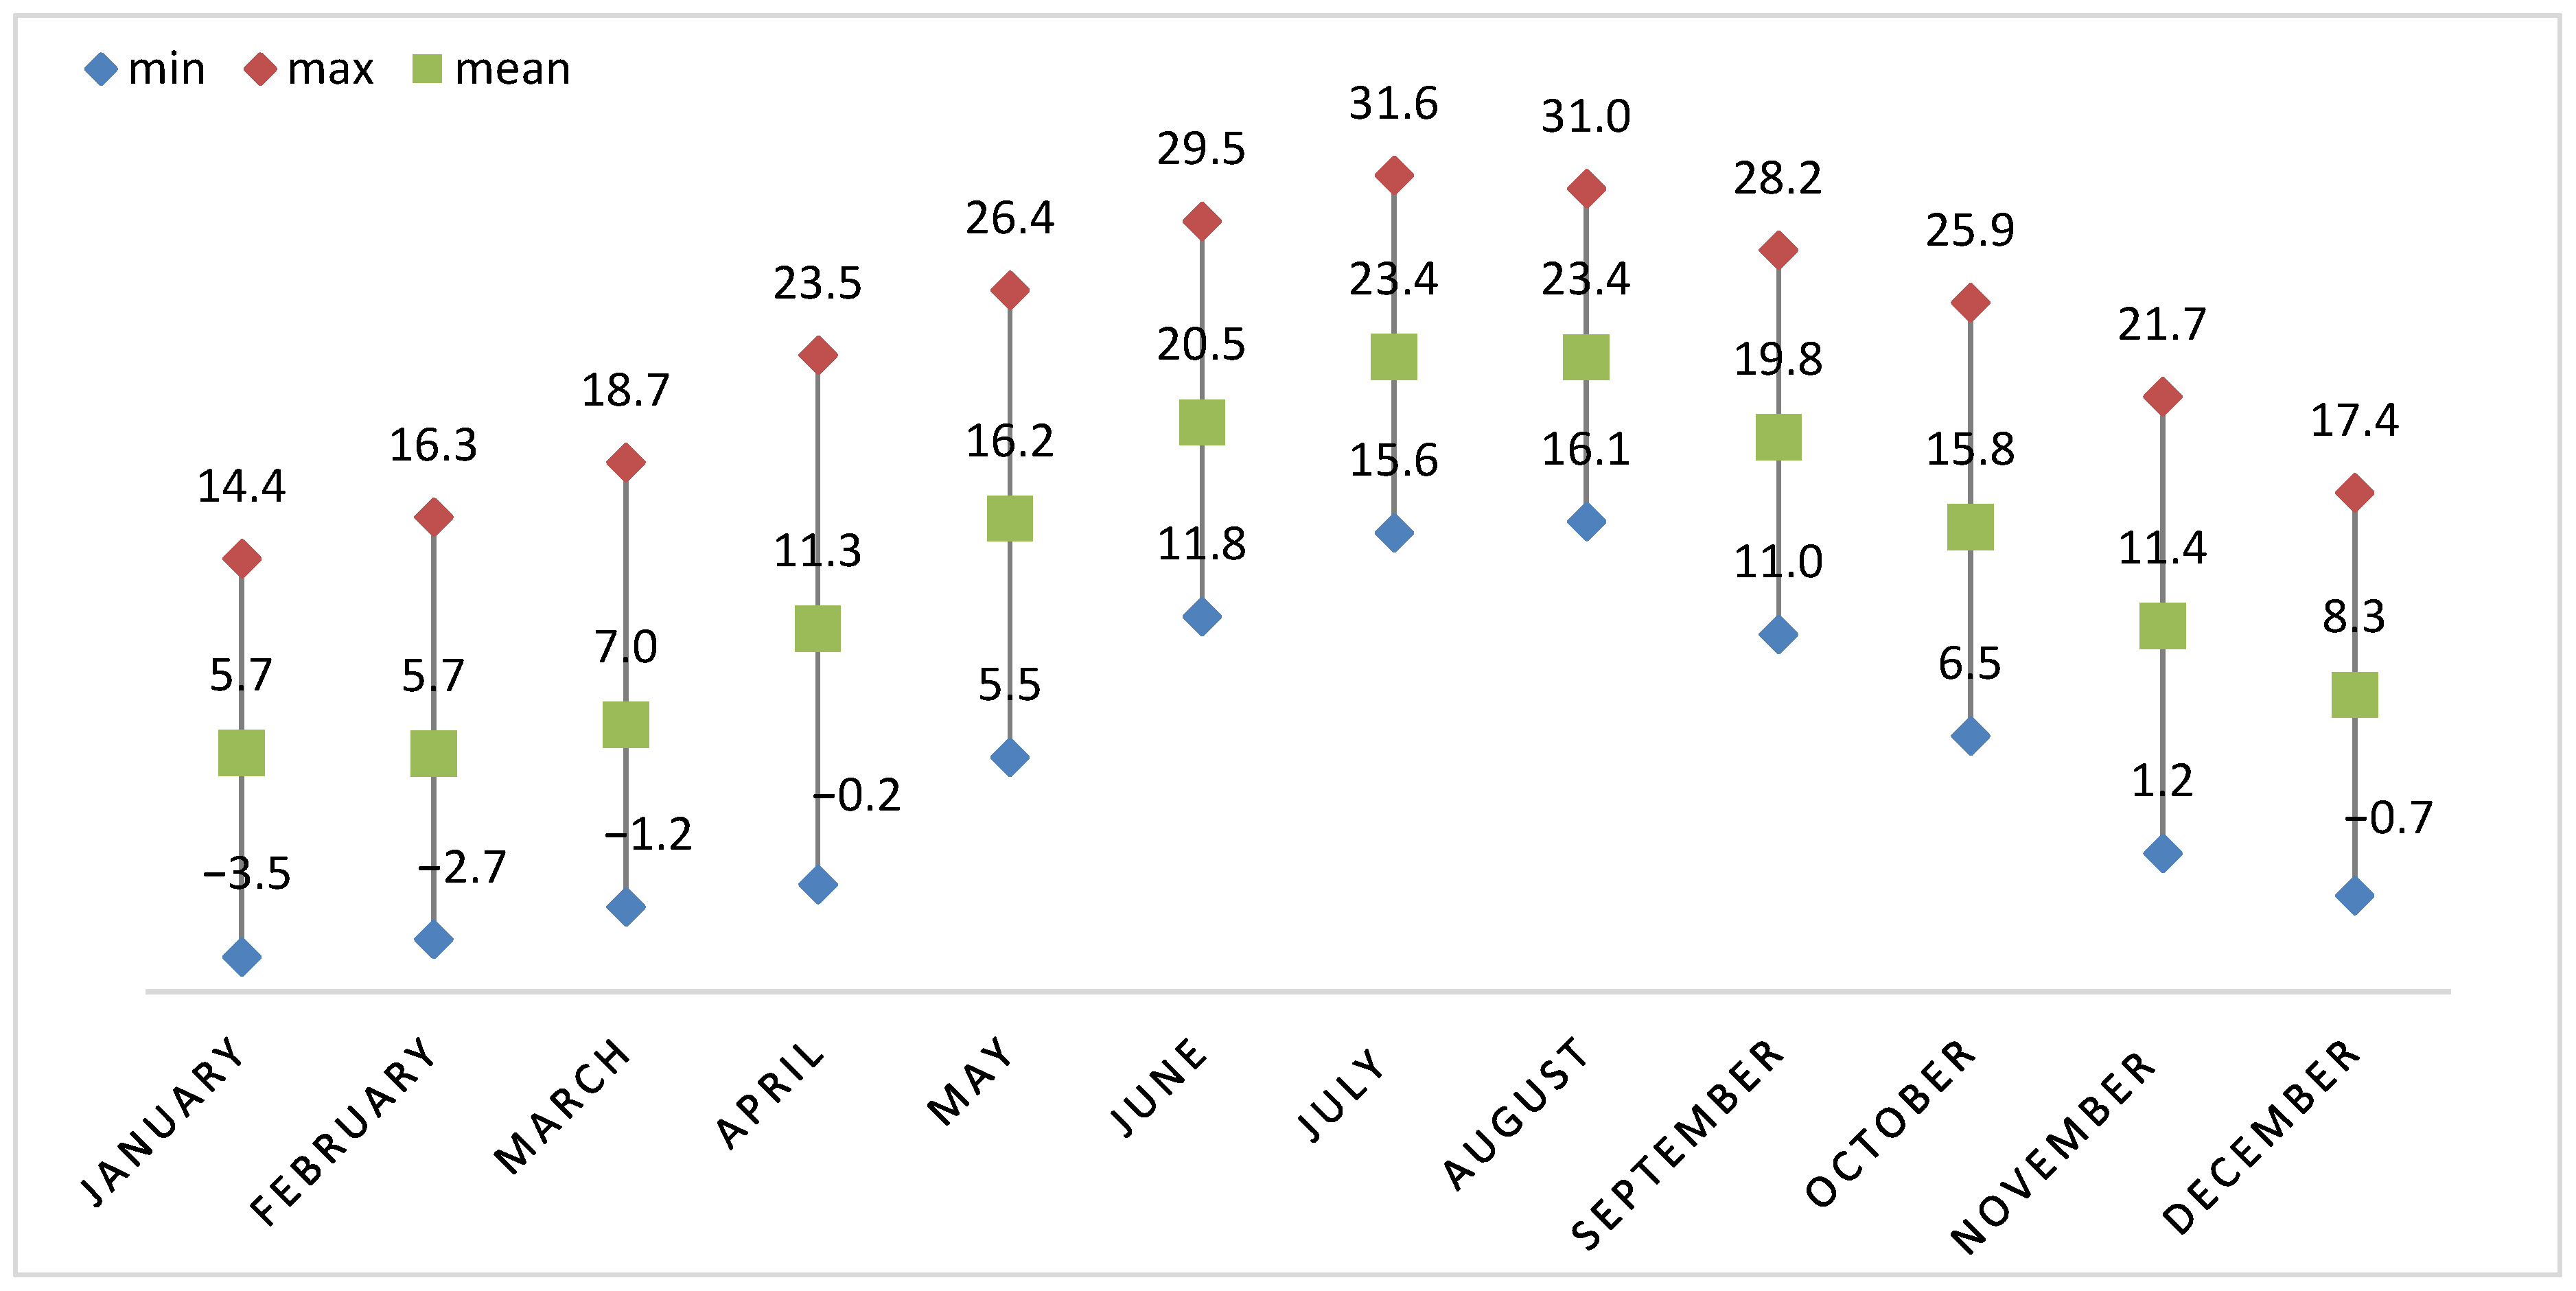
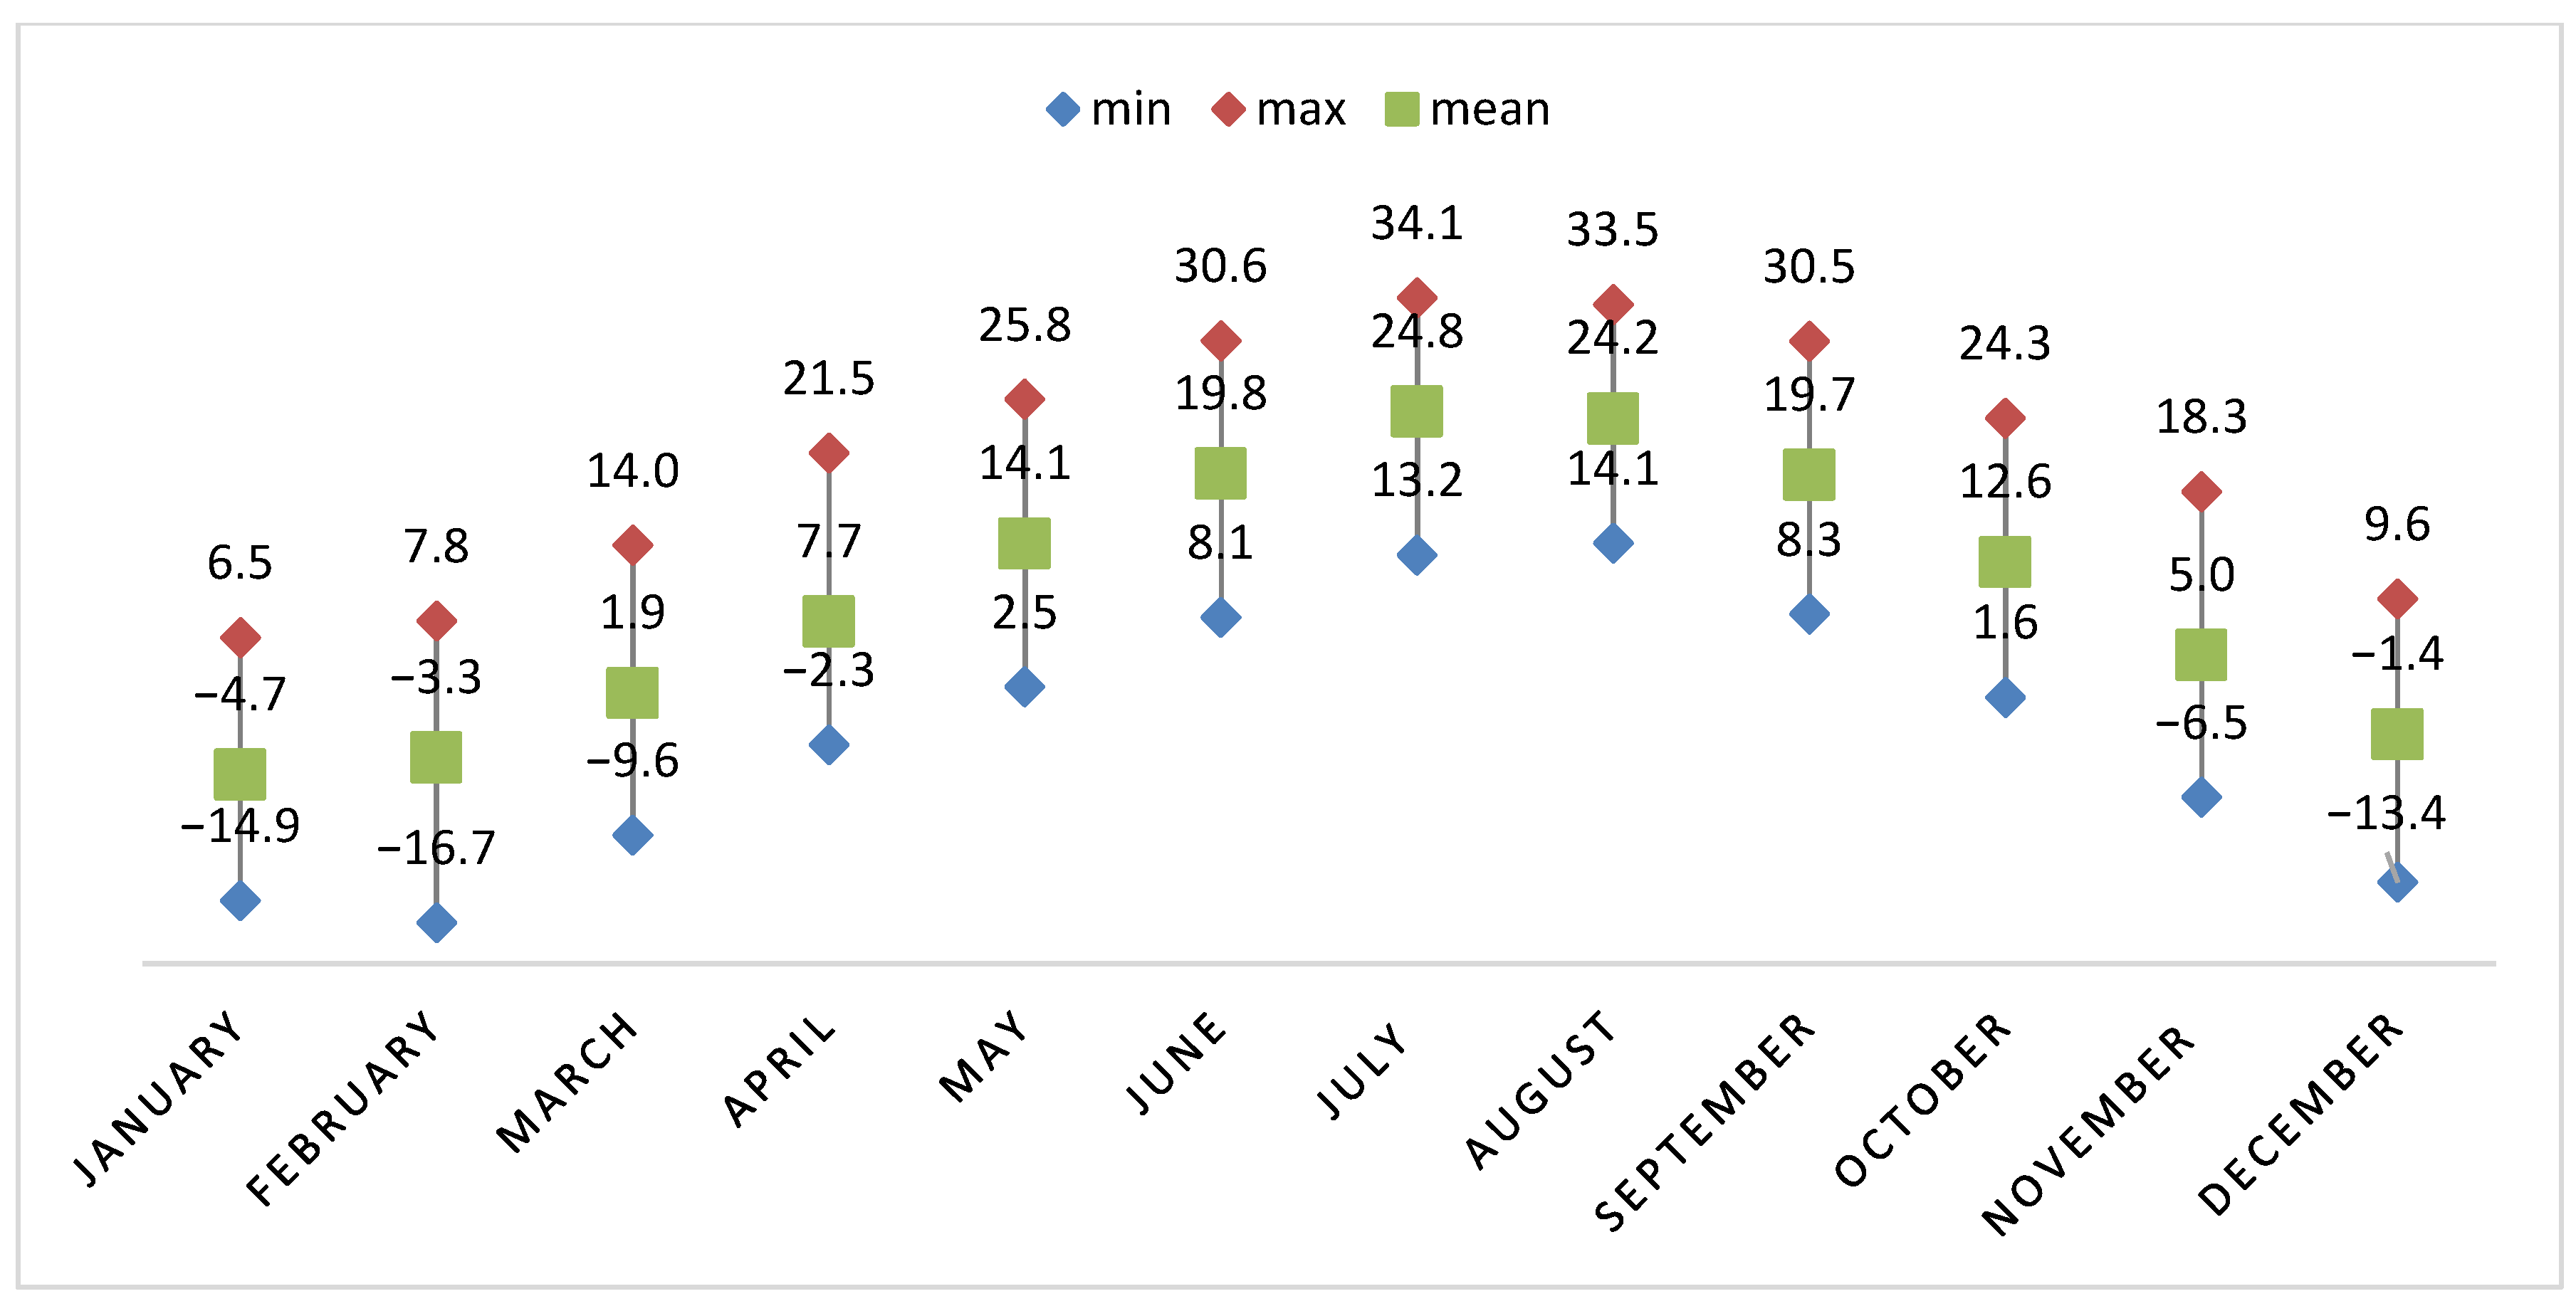
| Selected City | Istanbul | Hakkari |
|---|---|---|
| TS 825 Climate Zone | 2 | 4 |
| Latitude | 41°00′ N | 37°44′ N |
| Longitude | 28°97′ E | 43°74′ E |
| Altitude (Elevation) | 40 m | 1728 m |
| HDD (Heating Degree Days) | 1865 | 3470 |
| CDD (Cooling Degree Days) | 6 | 18 |
| Köppen Classification Major group | C (Mild) | D (Continental) |
| Köppen Classification Sub group | Csa | Dsa |
| Case | Insulation Thickness (cm) | Glazing Type | Window to Wall Ratio | Orientation | Infiltration Rate | Heating Set-Point | Fuel Type |
|---|---|---|---|---|---|---|---|
| 1 | 3 | Single/Double/Triple | 40% | NW | 0.2 ACH | 24 °C | Natural Gas |
| 2 | 6 | Single/Double/Triple | 40% | NW | 0.2 ACH | 24 °C | Natural Gas |
| 3 | 9 | Single/Double/Triple | 40% | NW | 0.2 ACH | 24 °C | Natural Gas |
| 4 | 12 | Single/Double/Triple | 40% | NW | 0.2 ACH | 24 °C | Natural Gas |
| 5 | 15 | Single/Double/Triple | 40% | NW | 0.2 ACH | 24 °C | Natural Gas |
| 6 | 3 | Single/Double/Triple | 40% | NE | 0.2 ACH | 24 °C | Natural Gas |
| 7 | 3 | Single/Double/Triple | 40% | NW | 0.2 ACH | 24 °C | Natural Gas |
| 8 | 3 | Single/Double/Triple | 40% | SE | 0.2 ACH | 24 °C | Natural Gas |
| 9 | 3 | Single/Double/Triple | 40% | SW | 0.2 ACH | 24 °C | Natural Gas |
| 10 | 3 | Single/Double/Triple | 20% | NW | 0.2 ACH | 24 °C | Natural Gas |
| 11 | 3 | Single/Double/Triple | 40% | NW | 0.2 ACH | 24 °C | Natural Gas |
| 12 | 3 | Single/Double/Triple | 60% | NW | 0.2 ACH | 24 °C | Natural Gas |
| 13 | 3 | Single/Double/Triple | 80% | NW | 0.2 ACH | 24 °C | Natural Gas |
| 14 | 3 | Single/Double/Triple | 100% | NW | 0.2 ACH | 24 °C | Natural Gas |
| 15 | 3 | Single/Double/Triple | 40% | NW | 0.2 ACH | 24 °C | Natural Gas |
| 16 | 3 | Single/Double/Triple | 40% | NW | 0.4 ACH | 24 °C | Natural Gas |
| 17 | 3 | Single/Double/Triple | 40% | NW | 0.6 ACH | 24 °C | Natural Gas |
| 18 | 3 | Single/Double/Triple | 40% | NW | 0.8 ACH | 24 °C | Natural Gas |
| 19 | 3 | Single/Double/Triple | 40% | NW | 1.0 ACH | 24 °C | Natural Gas |
| 20 | 3 | Single/Double/Triple | 40% | NW | 0.2 ACH | 18 °C | Natural Gas |
| 21 | 3 | Single/Double/Triple | 40% | NW | 0.2 ACH | 20 °C | Natural Gas |
| 22 | 3 | Single/Double/Triple | 40% | NW | 0.2 ACH | 22 °C | Natural Gas |
| 23 | 3 | Single/Double/Triple | 40% | NW | 0.2 ACH | 24 °C | Natural Gas |
| 24 | 3 | Single/Double/Triple | 40% | NW | 0.2 ACH | 26 °C | Natural Gas |
| 25 | 3 | Single/Double/Triple | 40% | NW | 0.2 ACH | 24 °C | Natural Gas |
| 26 | 3 | Single/Double/Triple | 40% | NW | 0.2 ACH | 24 °C | Fuel-Oil |
| 27 | 3 | Single/Double/Triple | 40% | NW | 0.2 ACH | 24 °C | Coal |
| 28 | 3 | Single/Double/Triple | 40% | NW | 0.2 ACH | 24 °C | LPG |
| 29 | 3 | Single/Double/Triple | 40% | NW | 0.2 ACH | 24 °C | Electricity |
Publisher’s Note: MDPI stays neutral with regard to jurisdictional claims in published maps and institutional affiliations. |
© 2022 by the author. Licensee MDPI, Basel, Switzerland. This article is an open access article distributed under the terms and conditions of the Creative Commons Attribution (CC BY) license (https://creativecommons.org/licenses/by/4.0/).
Share and Cite
Altun, A.F. Determination of Optimum Building Envelope Parameters of a Room concerning Window-to-Wall Ratio, Orientation, Insulation Thickness and Window Type. Buildings 2022, 12, 383. https://doi.org/10.3390/buildings12030383
Altun AF. Determination of Optimum Building Envelope Parameters of a Room concerning Window-to-Wall Ratio, Orientation, Insulation Thickness and Window Type. Buildings. 2022; 12(3):383. https://doi.org/10.3390/buildings12030383
Chicago/Turabian StyleAltun, Ayşe Fidan. 2022. "Determination of Optimum Building Envelope Parameters of a Room concerning Window-to-Wall Ratio, Orientation, Insulation Thickness and Window Type" Buildings 12, no. 3: 383. https://doi.org/10.3390/buildings12030383
APA StyleAltun, A. F. (2022). Determination of Optimum Building Envelope Parameters of a Room concerning Window-to-Wall Ratio, Orientation, Insulation Thickness and Window Type. Buildings, 12(3), 383. https://doi.org/10.3390/buildings12030383