
Towards an Interoperable Approach for Modelling and Managing Smart Building Data: The Case of the CESI Smart Building Demonstrator


Abstract
:1. Introduction
2. Related Works
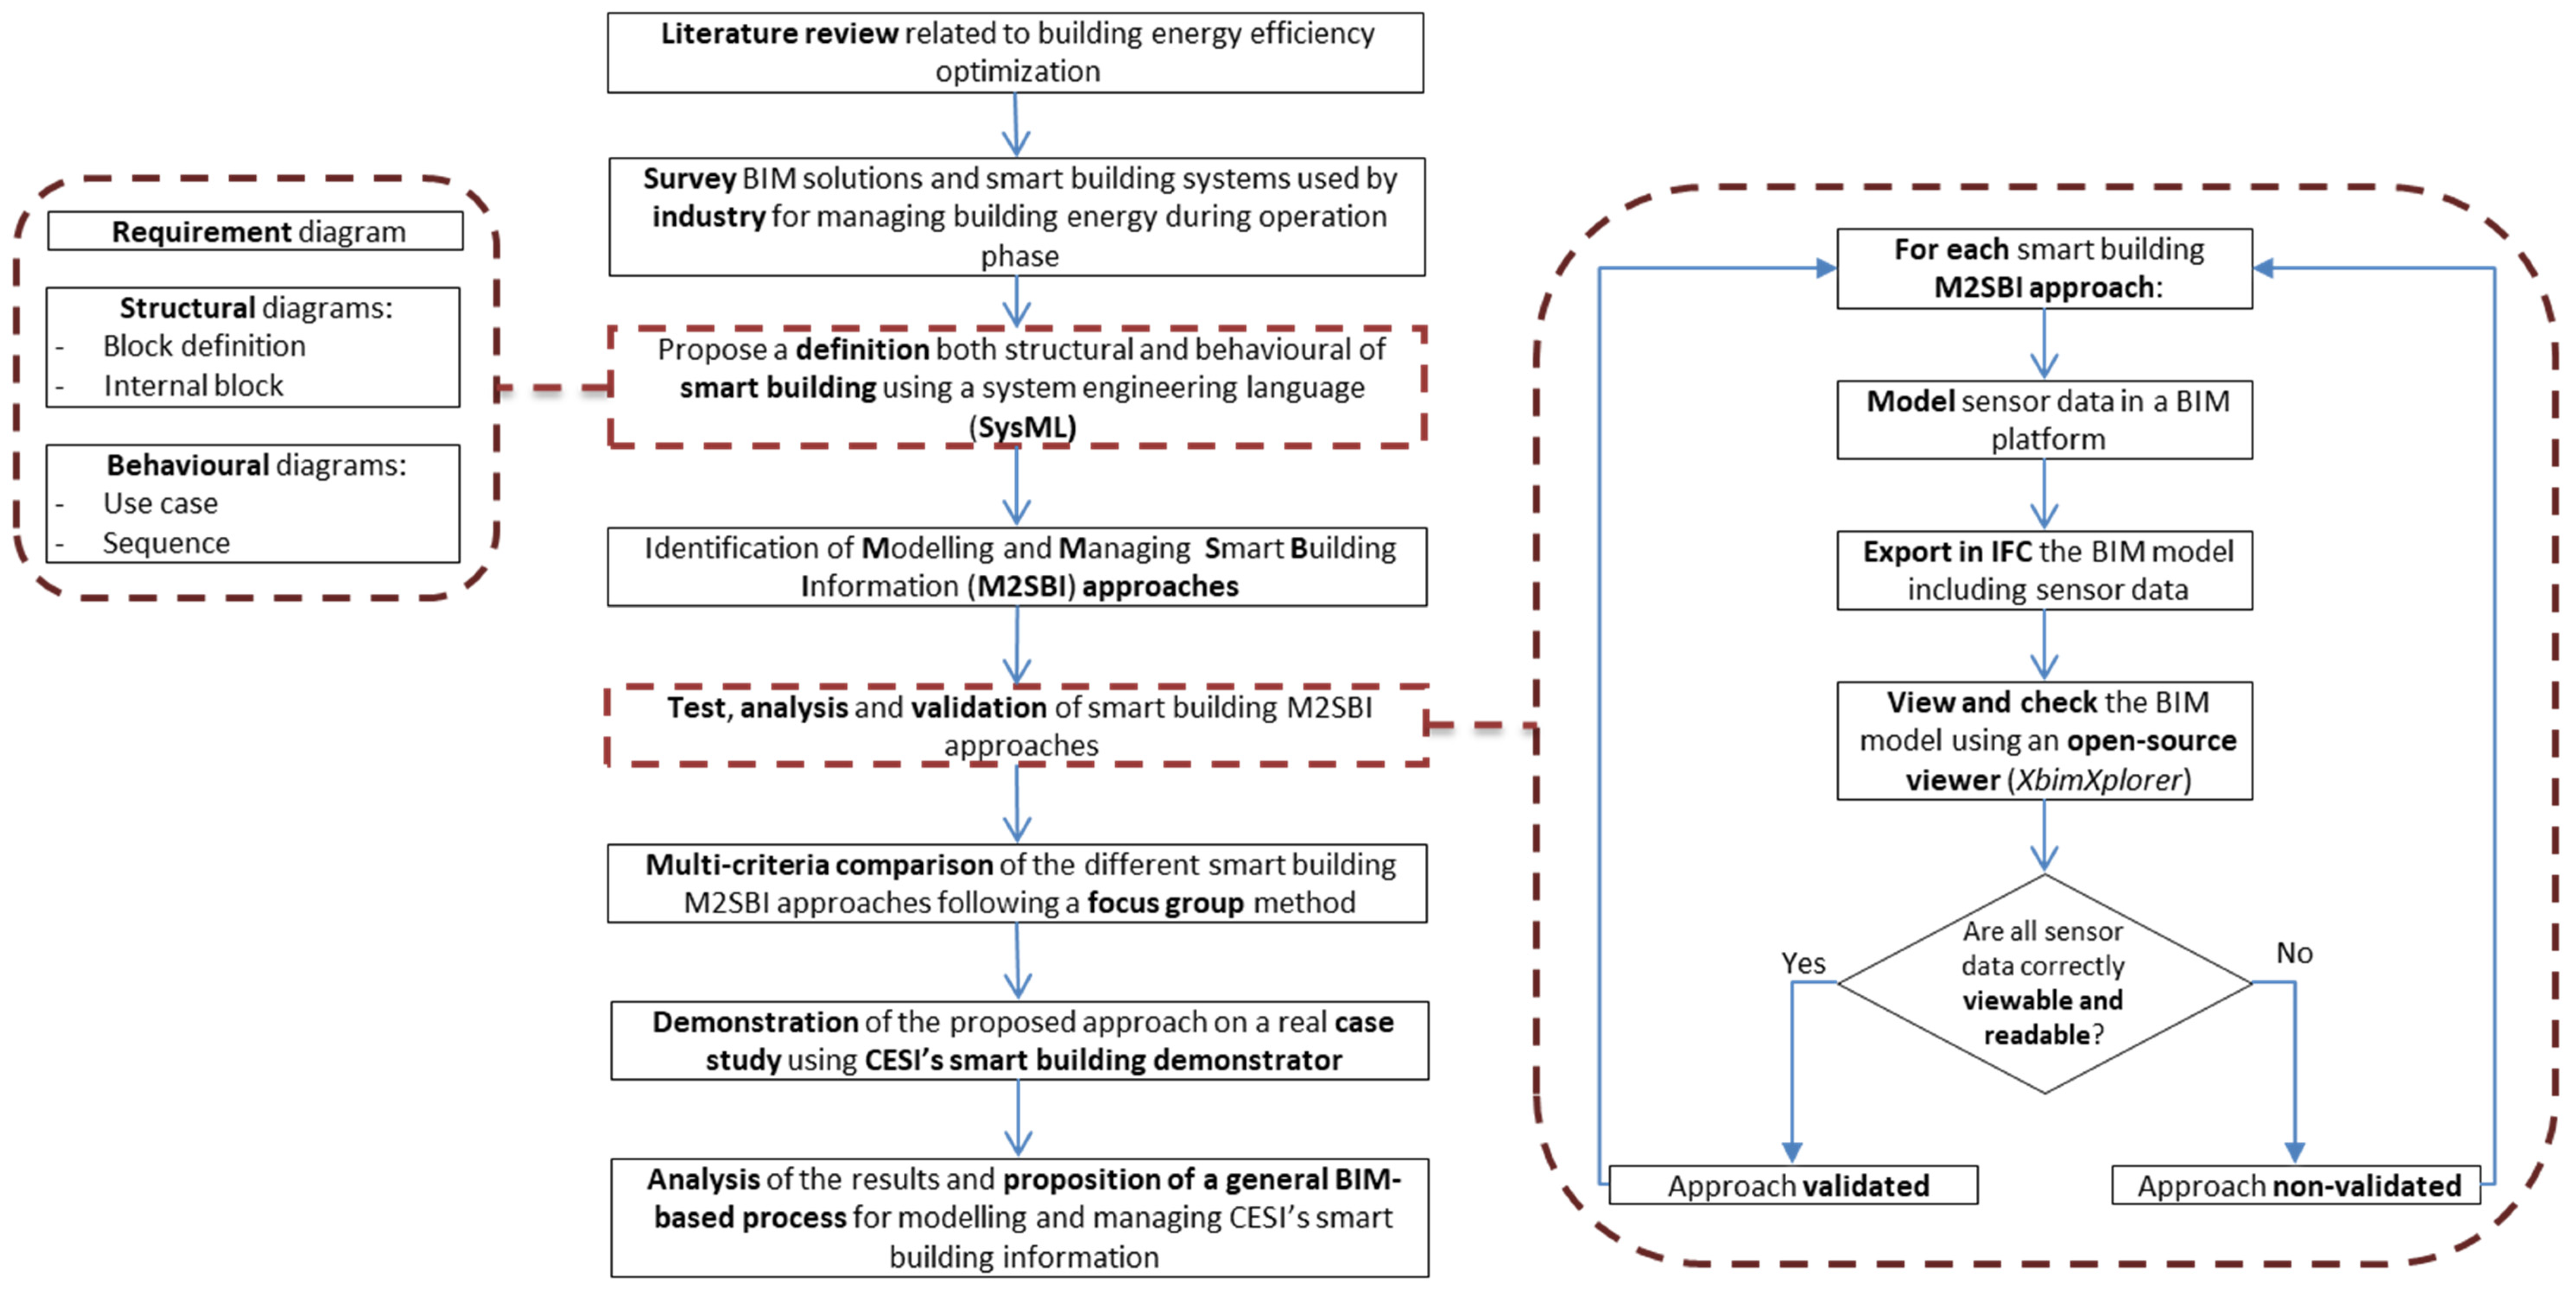
3. Research Methods
4. Industry Perspective on BIM Solutions and Their Utilization for Building Energy Management
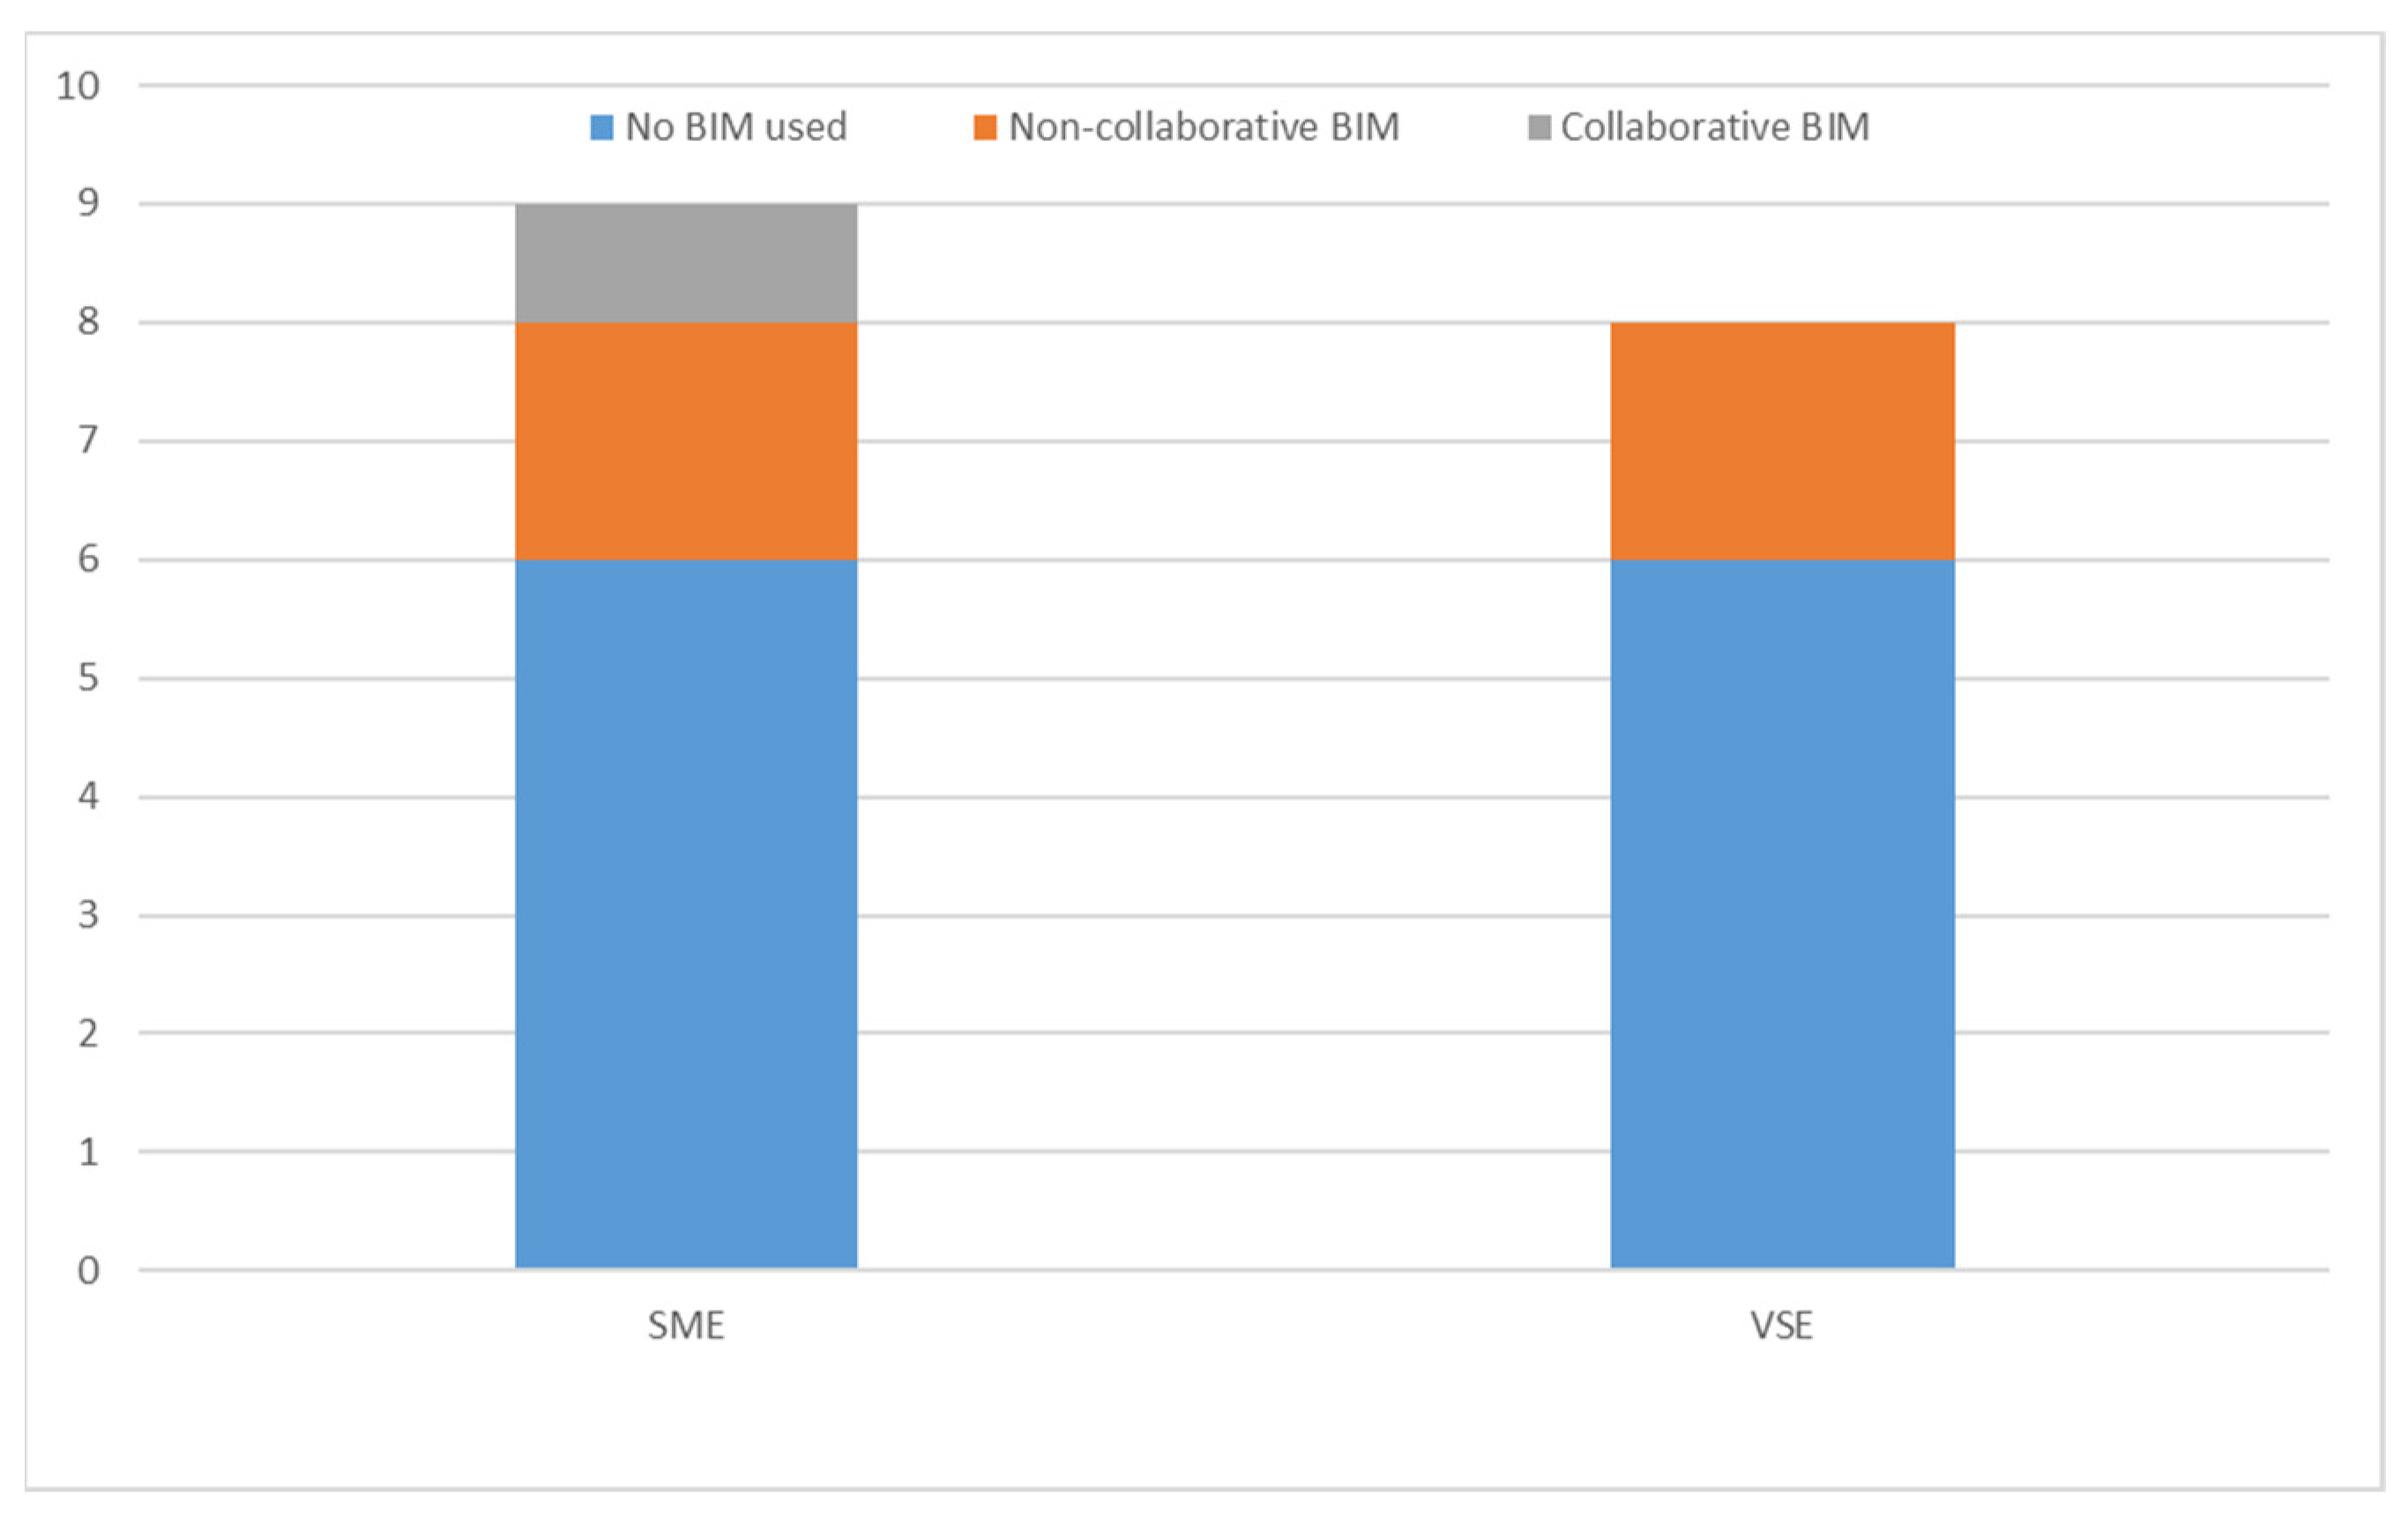
4.1. BIM Practices Used by French Building Energy Engineering Companies
- Their involvement in and contribution to construction projects;
- Whether they adopted BIM;
- The stage at which they performed their BIM uses;
- Whether they received an architectural BIM model as a point of departure or they created the model themselves;
- Whether they shared the model between the project participants;
- The added value of BIM for them;
- The barriers of using BIM for their organisation and as a collaborative process on the project;
- The BIM-based technologies used by the company and the reasons for this.
4.2. BIM Solutions for Managing the Building Energy in the Operation Phase in France
- No effective solution currently exists that enables building energy monitoring and management using BIM and smart systems.
- Building data use is restricted by regulations, such as the General Data Protection Regulation (GDPR). This is a challenge for most approaches requiring retrofitting existing buildings with sensors. However, this challenge can be resolved if the building occupants and/or building management systems’ operators consent to data access.
- Sensor manufacturers want to protect the protocols of their technologies, but when using these systems (such as sensors, IoT and actuators) in open BIM models, they need to be represented and modelled. A potential solution would be to standardise the output data from these systems to display them without revealing the way they work.
- The concept of a smart building is not clearly defined and is challenged by unpredictable user behaviour. A conceptual definition of a smart building, based on the interviews and expressed in SysML language, is given in Section 5.1. A smart building would allow for empirically-based prediction of user behaviour patterns but the said behaviour varied too much. Thus, the participants believed that sensor-driven data could help by enabling users to control building energy systems and adjust their behaviour accordingly.
- Open BIM, particularly the IFC format, had some deficiencies regarding the representation and visualisation of smart system data and their management, including those related to sensors and IoT actuators. This was shown in several research projects that propose and present extended IFC schemas [37]. An approach to address this challenge which is at the core aim of this paper is proposed and tested in the following sections.
5. Proposed Smart Building Conceptualisation
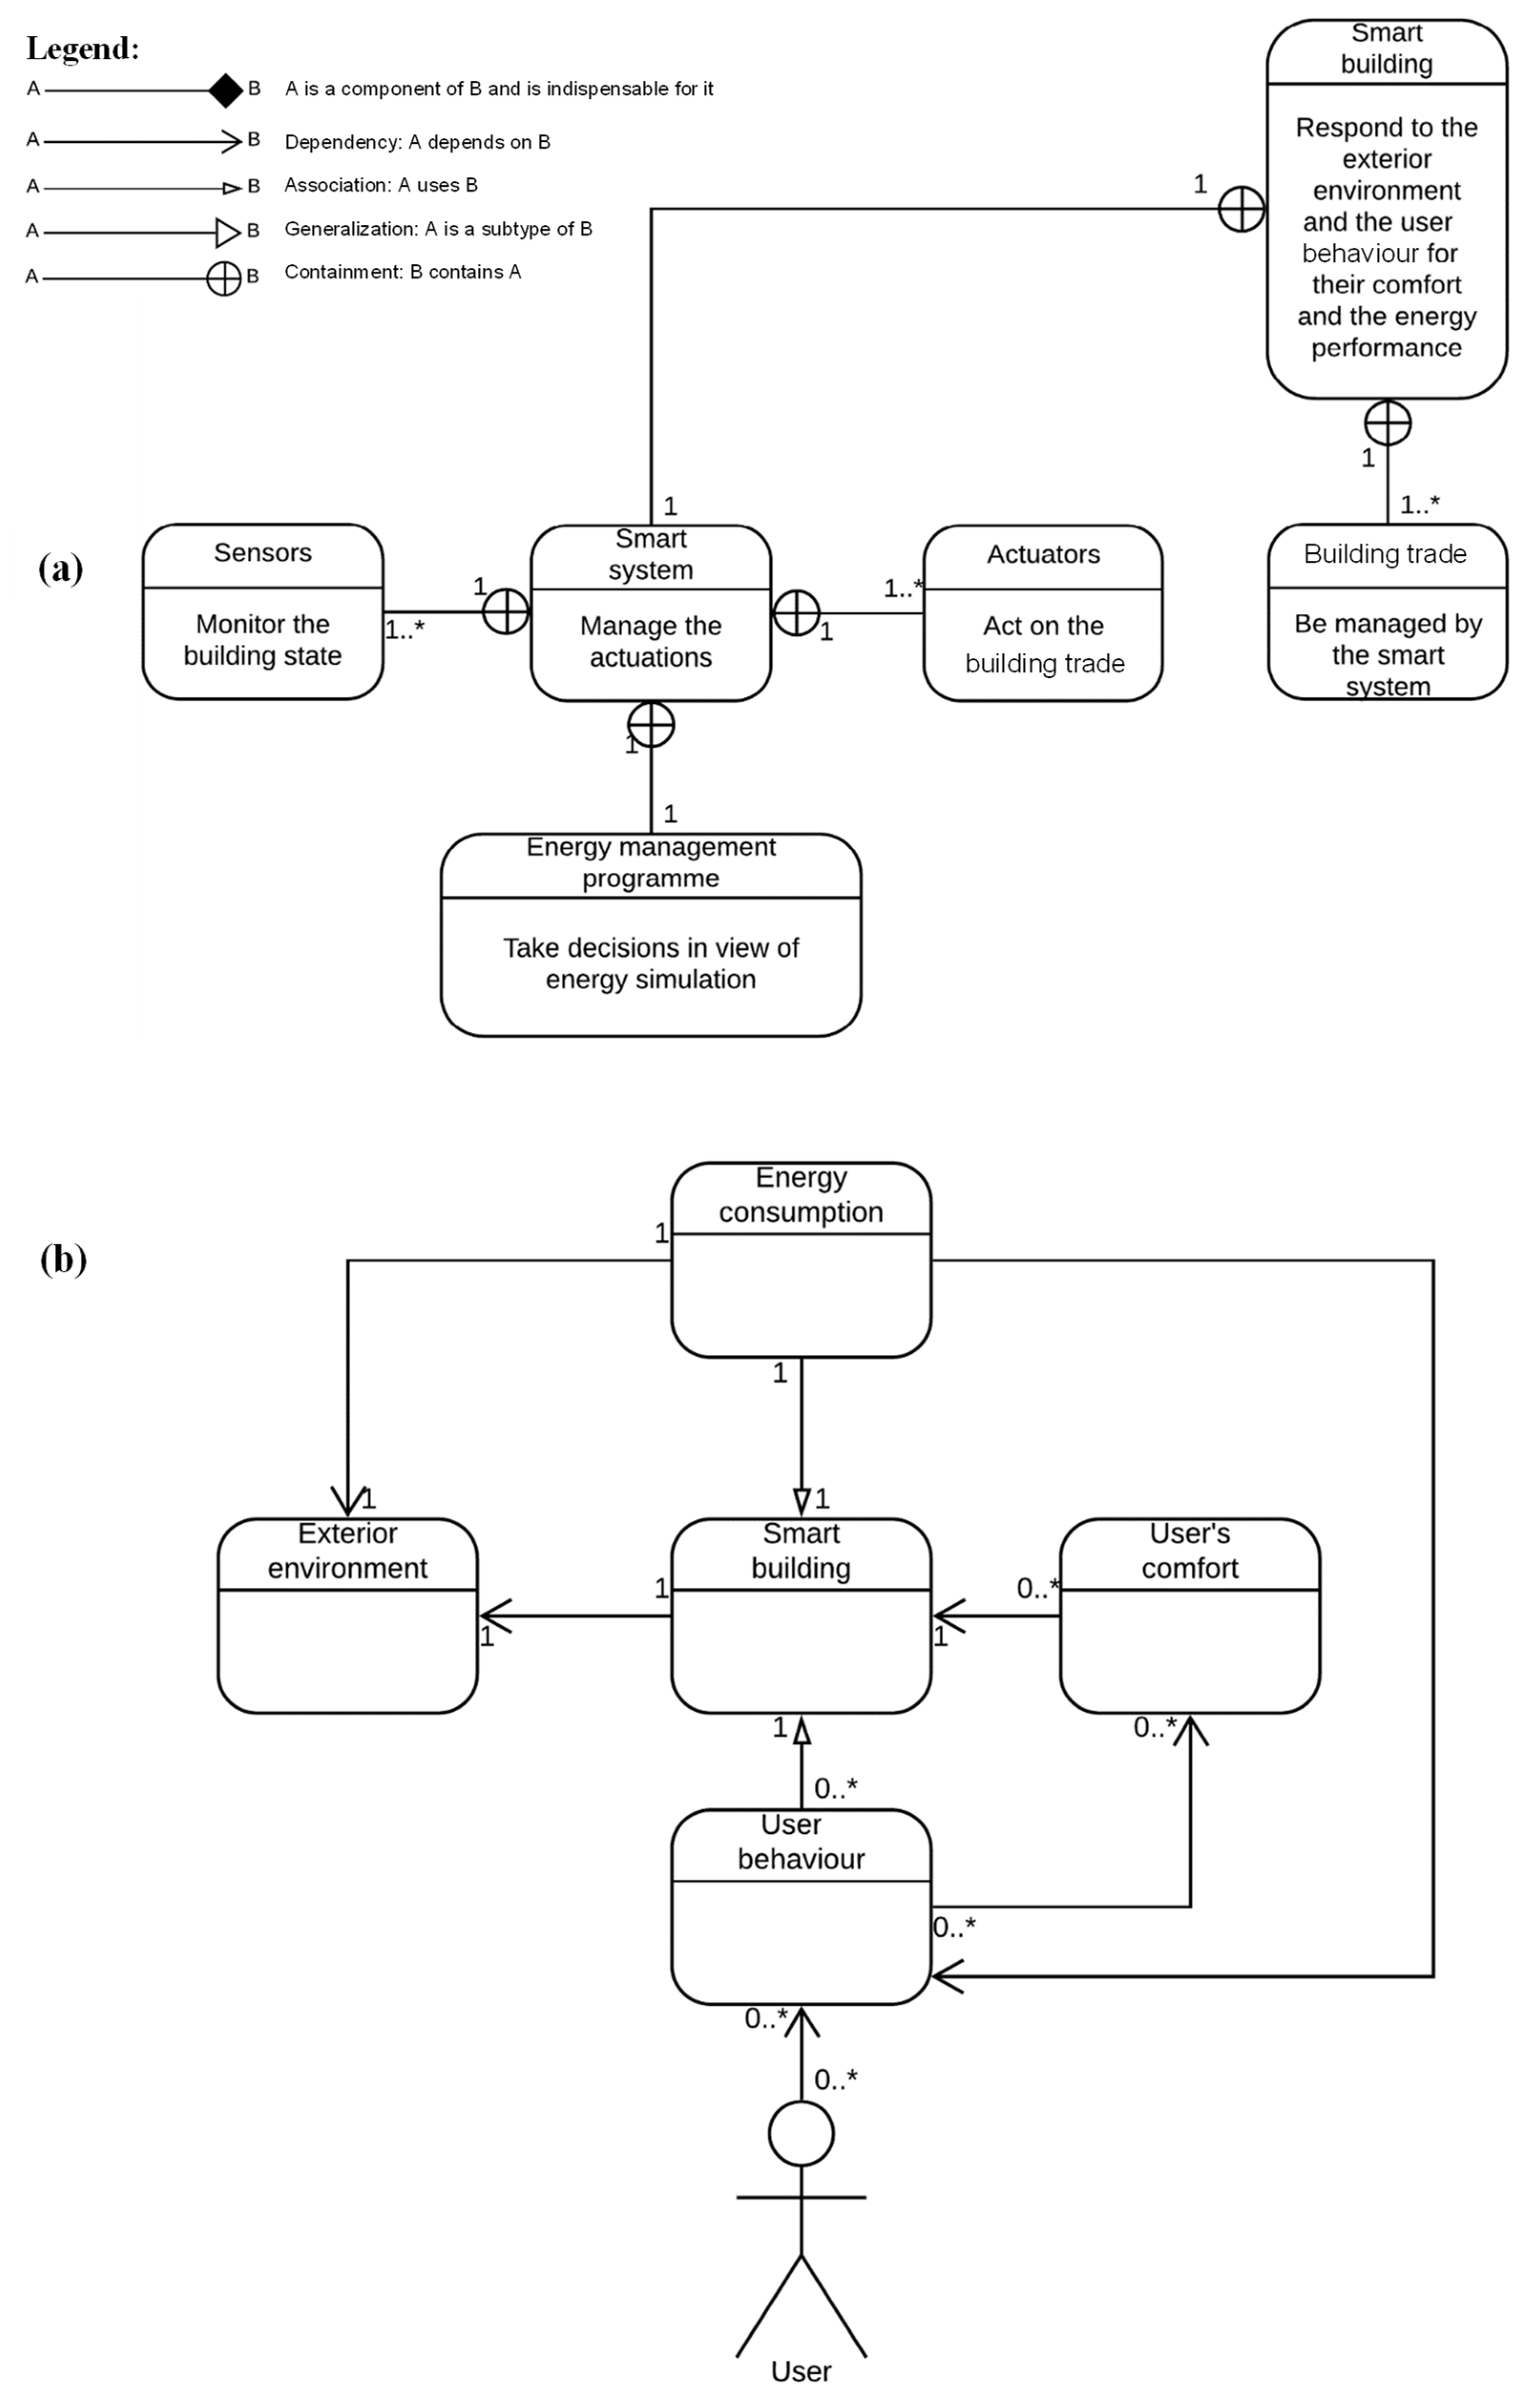
5.1. Smart Building System Architecture
- Requirement diagram: enables visualising system requirements, both functional and non-functional. It also describes the inter-relationships between requirements. As shown in Figure 3a, a smart building contains (i) a smart system that will manage the actuations and information exchanges from the physical asset to its digital replica and vice versa, and (ii) manages many trade components such as facades, stairs, ceiling, insulation, partitions, HVAC and electrical and fire safety components. Furthermore, the smart system of a smart building requires a set of sensor and actuator components, as well as a decision-making engine to manage the building energy consumption in view of the data taken from sensors and energy simulation.
- Block definition diagram: Aims to specify system static structures that will be used for objects. It represents system components and their contents, interfaces and relationships. Figure 3b shows a smart building as being dependent on the exterior environment (meteorological data, etc.) and using energy consumption and user behavior data for managing building energy. User behavior is impacted by comfort, which, in turn, depends on energy settings that are tuned and monitored by the smart building.
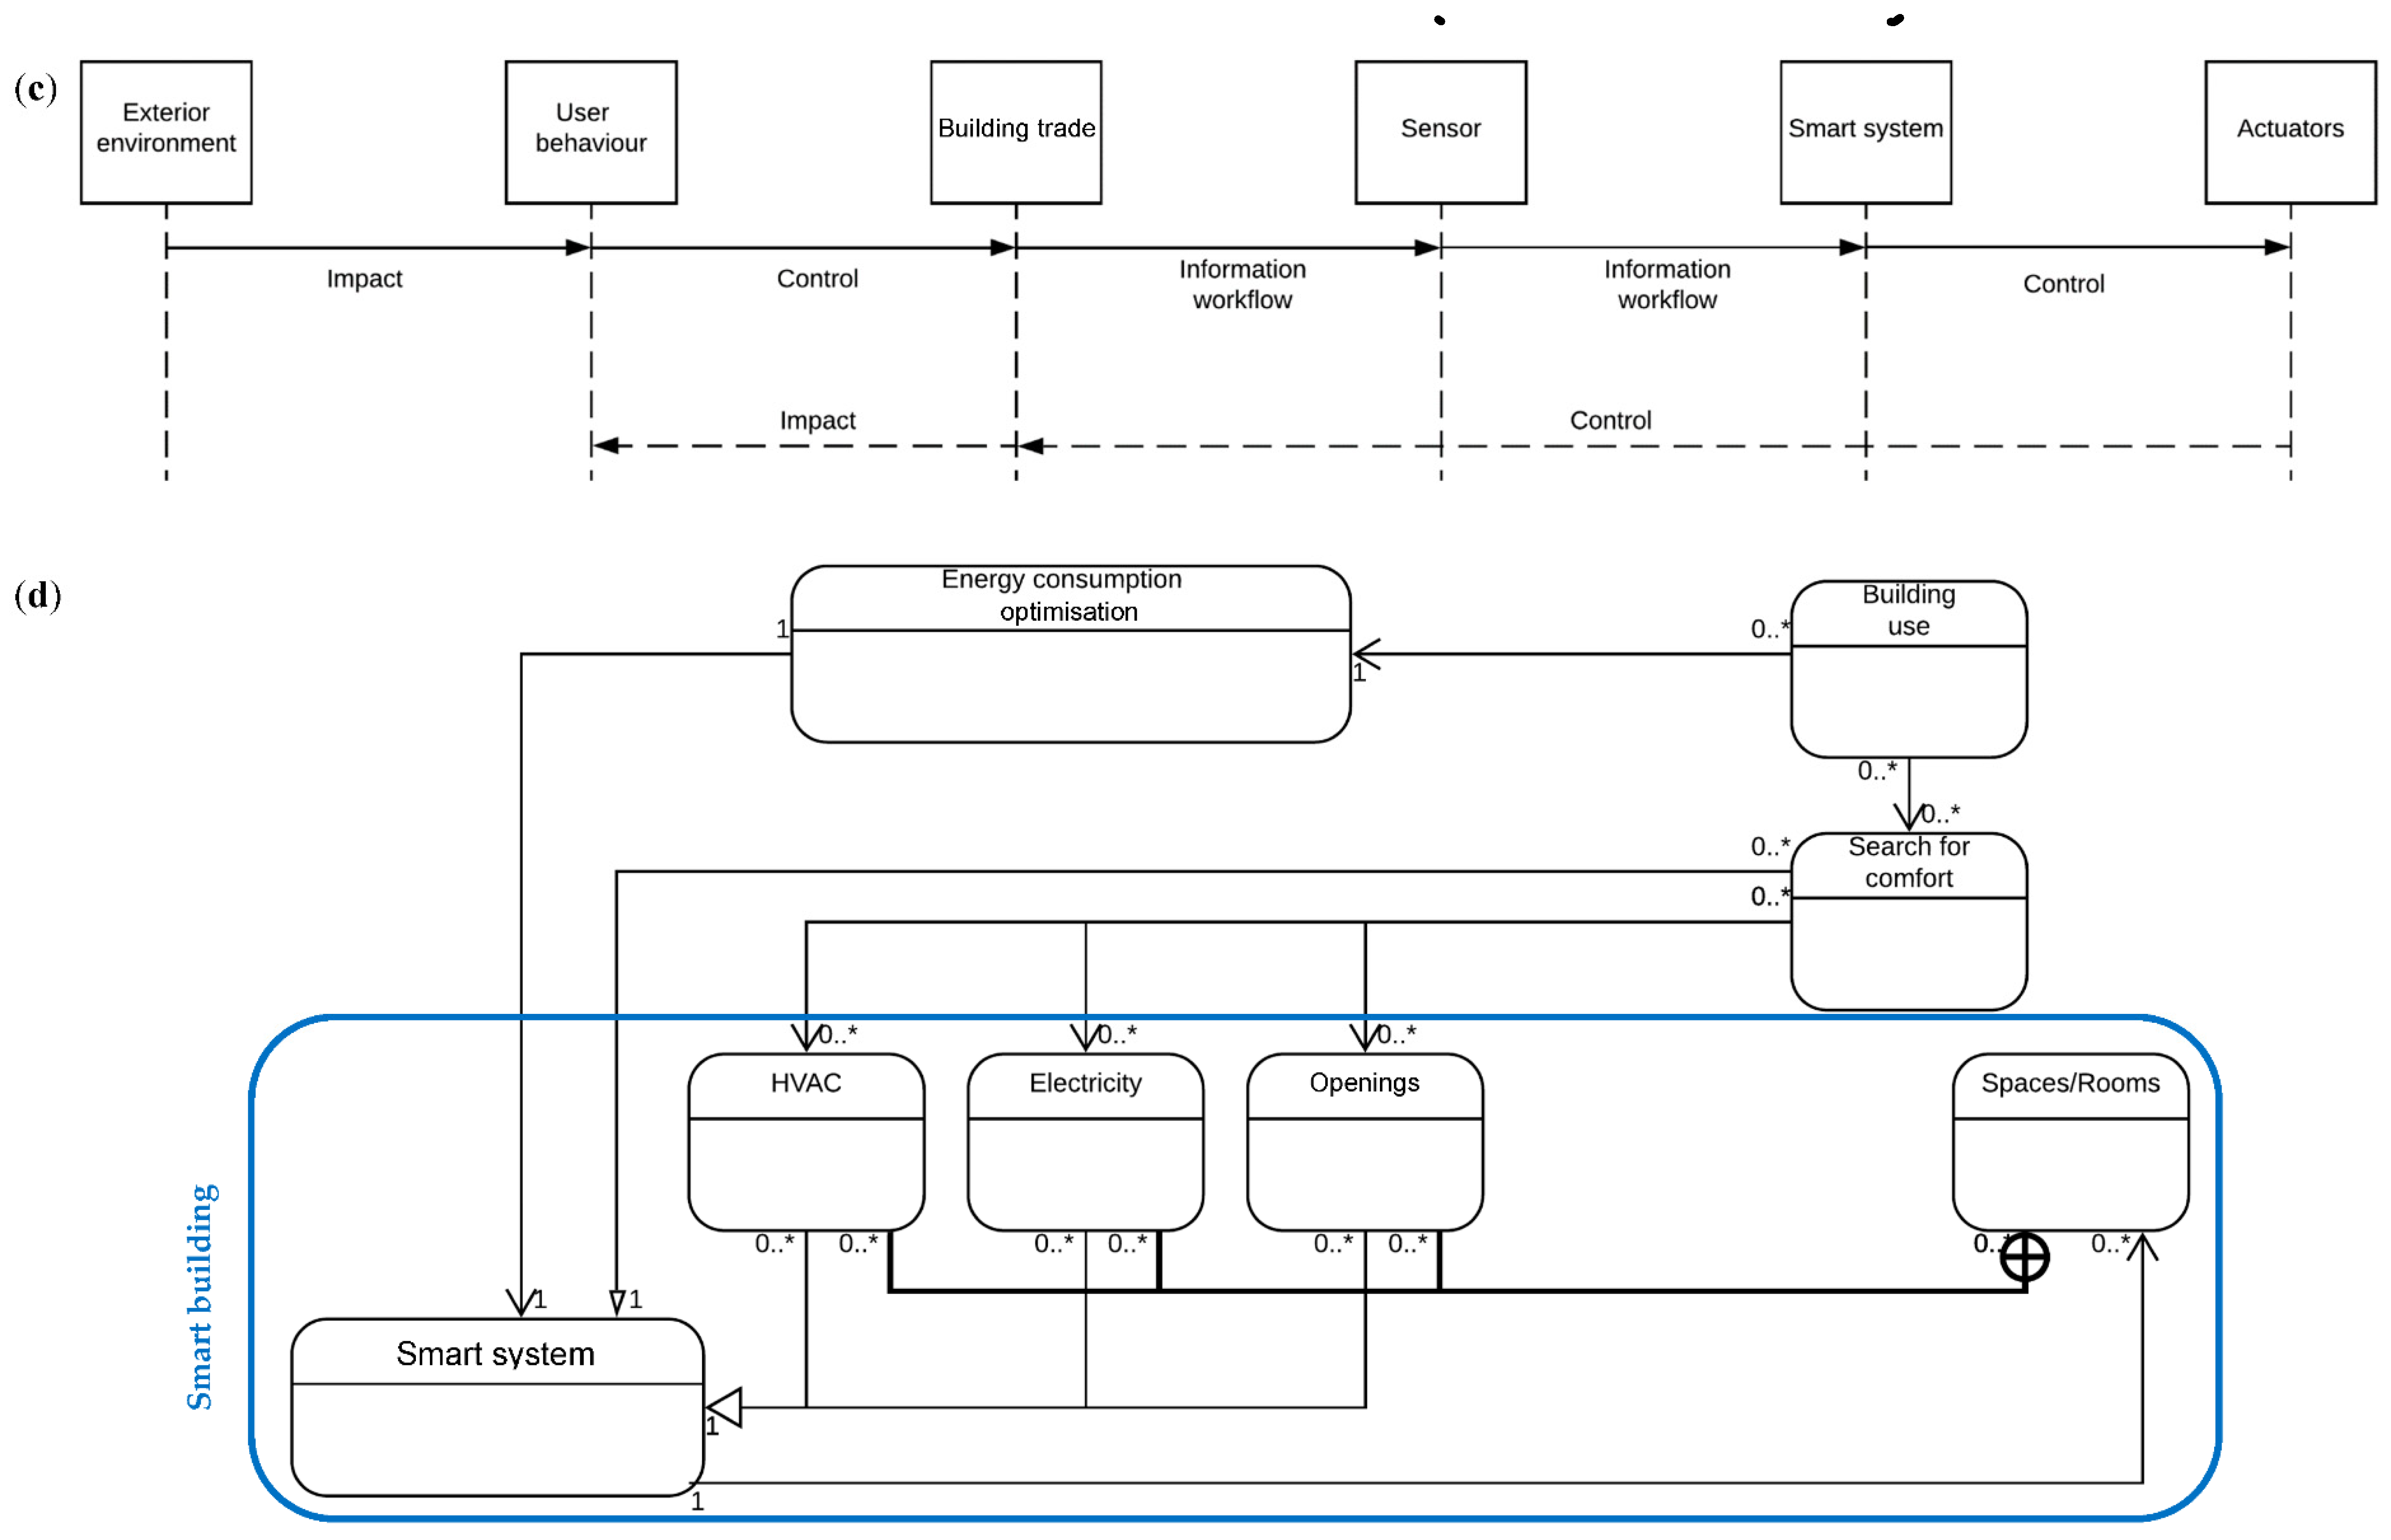
- Sequence diagram: A dynamic behavioral diagram that represents interactions between system objects and blocks via sequences of exchanged information. In Figure 3c, the exterior environment affects user behavior, which will, in turn, act upon trade components, such as light, heating, air conditioning and windows. Data is captured by sensors and processed by the smart system, which informs monitoring actions that can be triggered and performed (if necessary) by actuators on trade components to control the building energy consumption and provide comfortable indoor conditions for users. This may affect users’ behavior again and recursively restart the same process until the desired state is reached.
- Use case diagram: Shows the system functions at a macro level by providing a high-level representation of the system and its top-level requirements from a non-technical perspective. It represents interactions between the system’s main functions and its external users. Figure 3d shows two building uses considered in this study, which were (i) controlling and optimising energy consumption through the smart system and its components, and (ii) providing indoor comfort for users by acting on trade components.
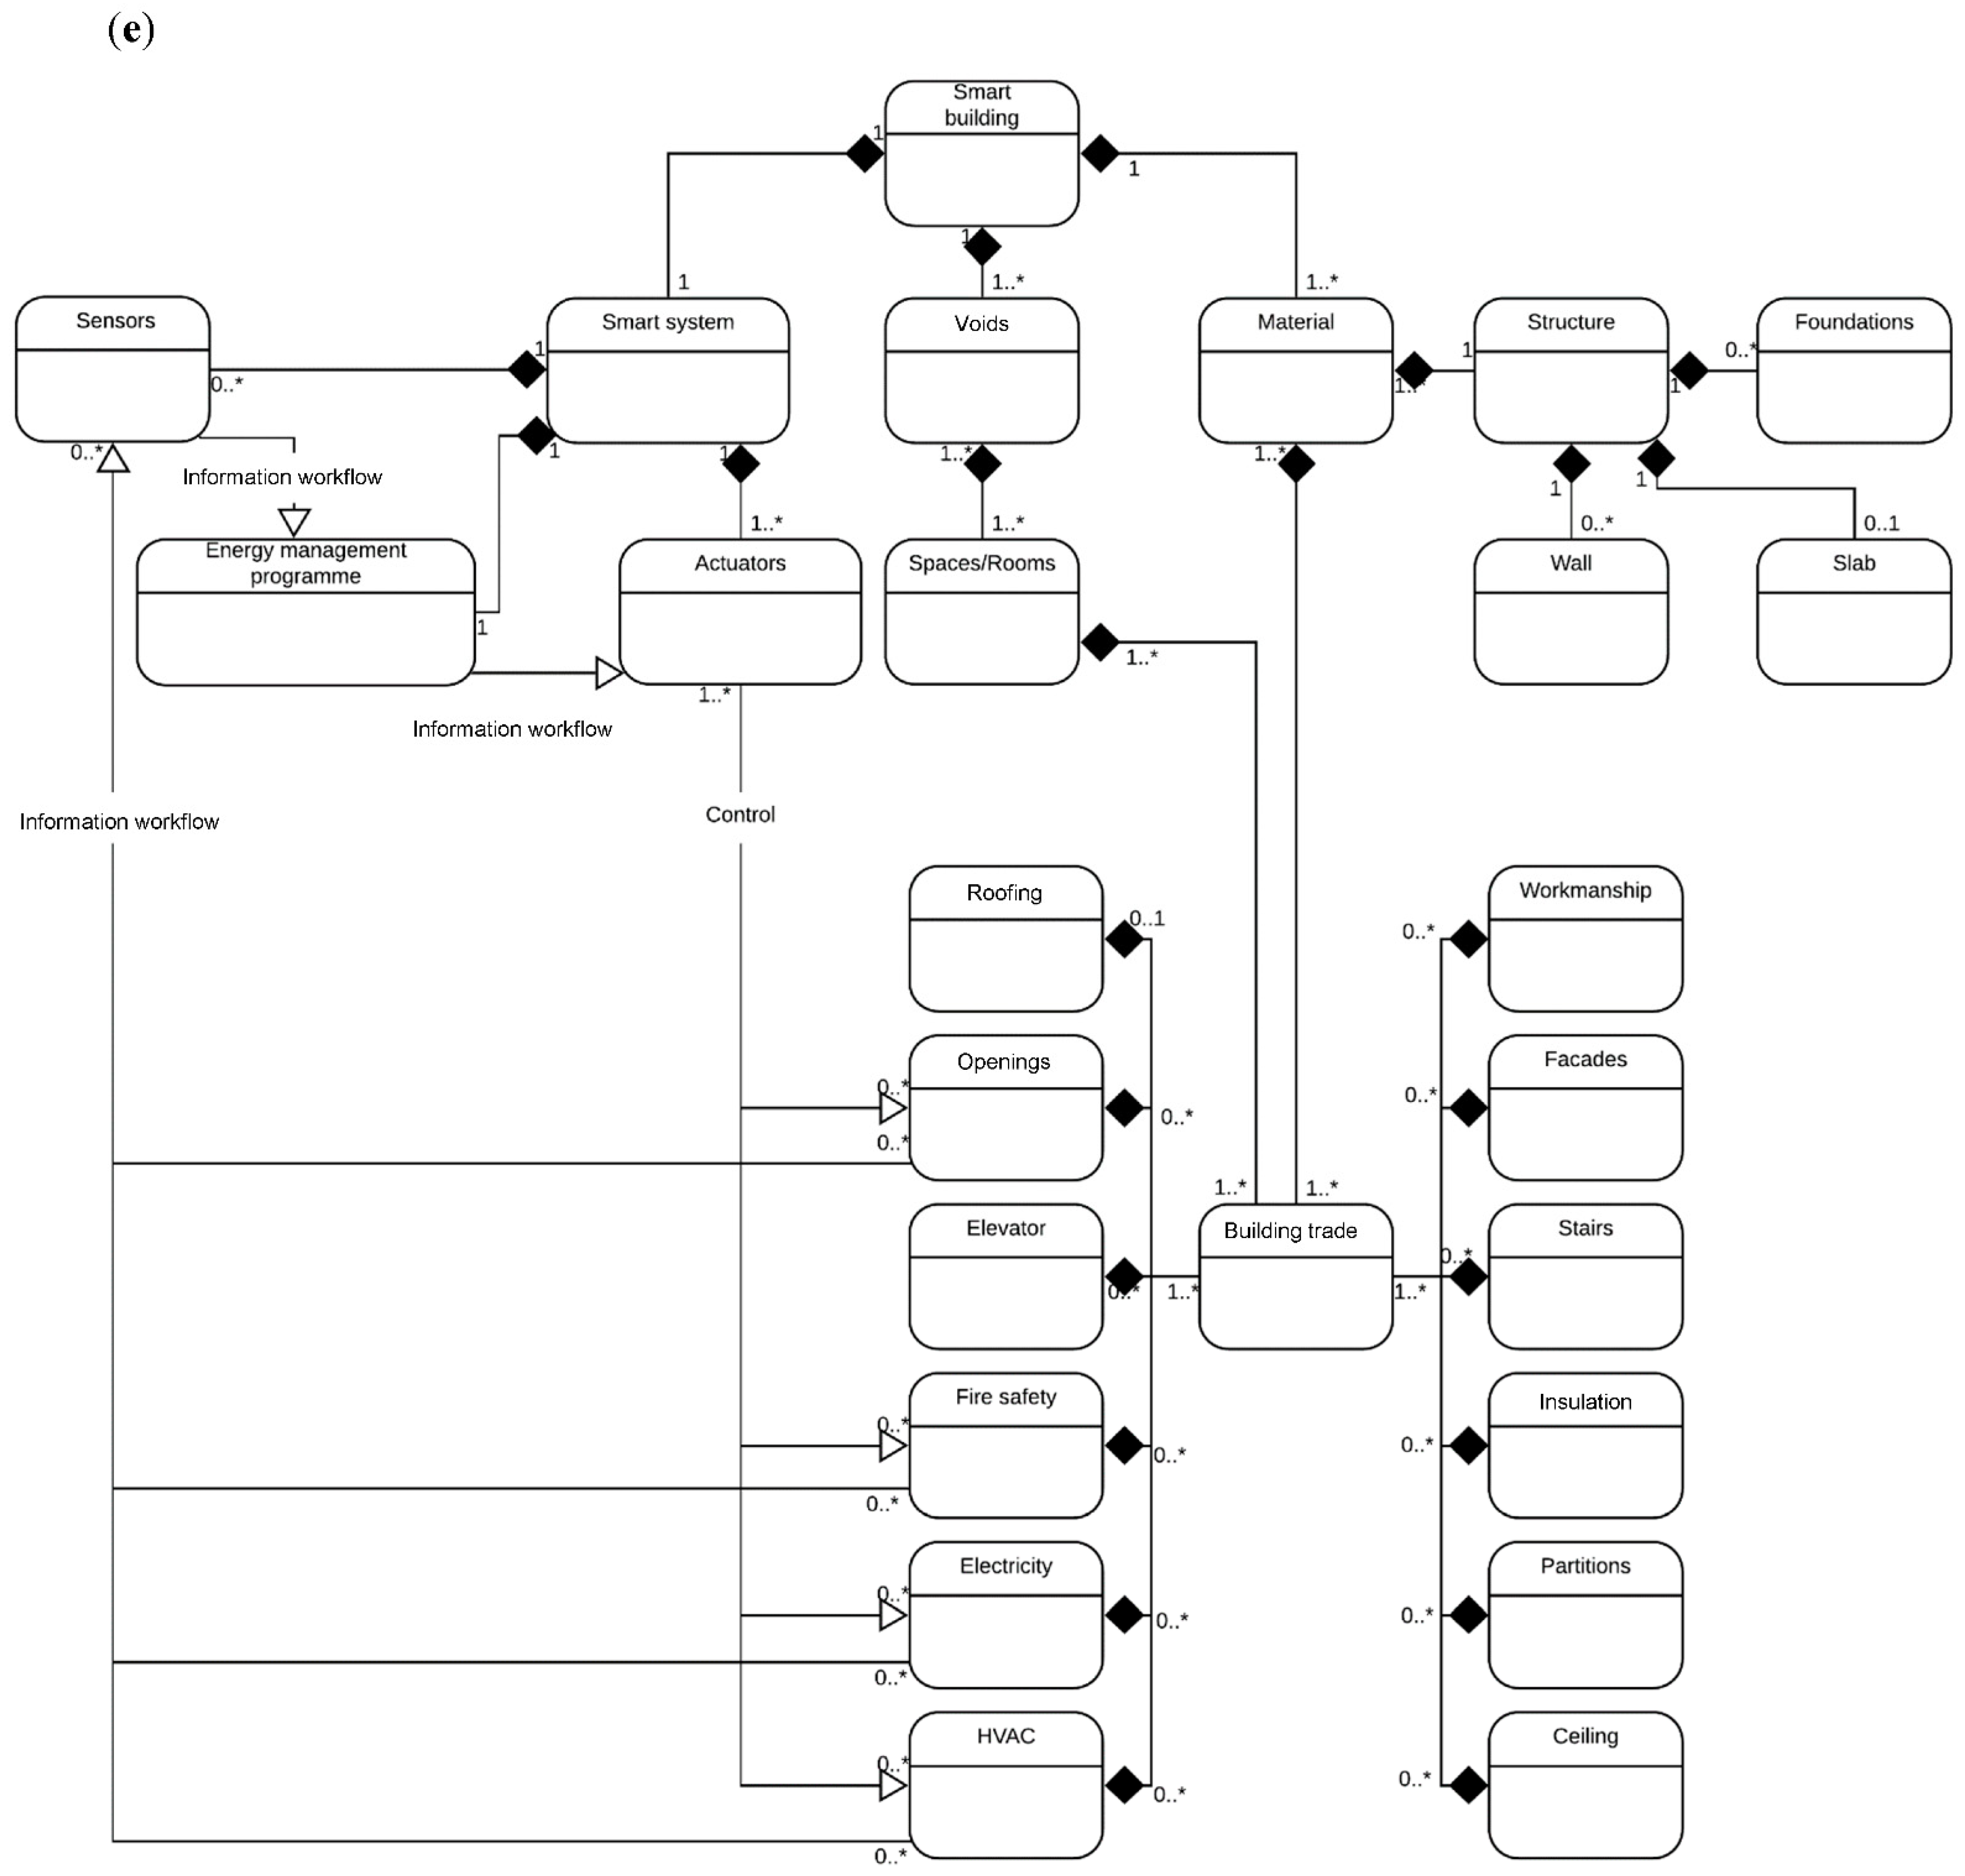
- Internal block diagram: Shows the internal structure of one of the blocks that make up the system. Figure 3e is a zoom-in showing the encapsulated structural contents of the smart building block.
5.2. Modelling Interoperable Information in Smart Buildings
5.2.1. Evaluation of the Approaches for Modelling and Managing Smart Building Information
5.2.2. First Prototype—Using ‘Proxy Elements’
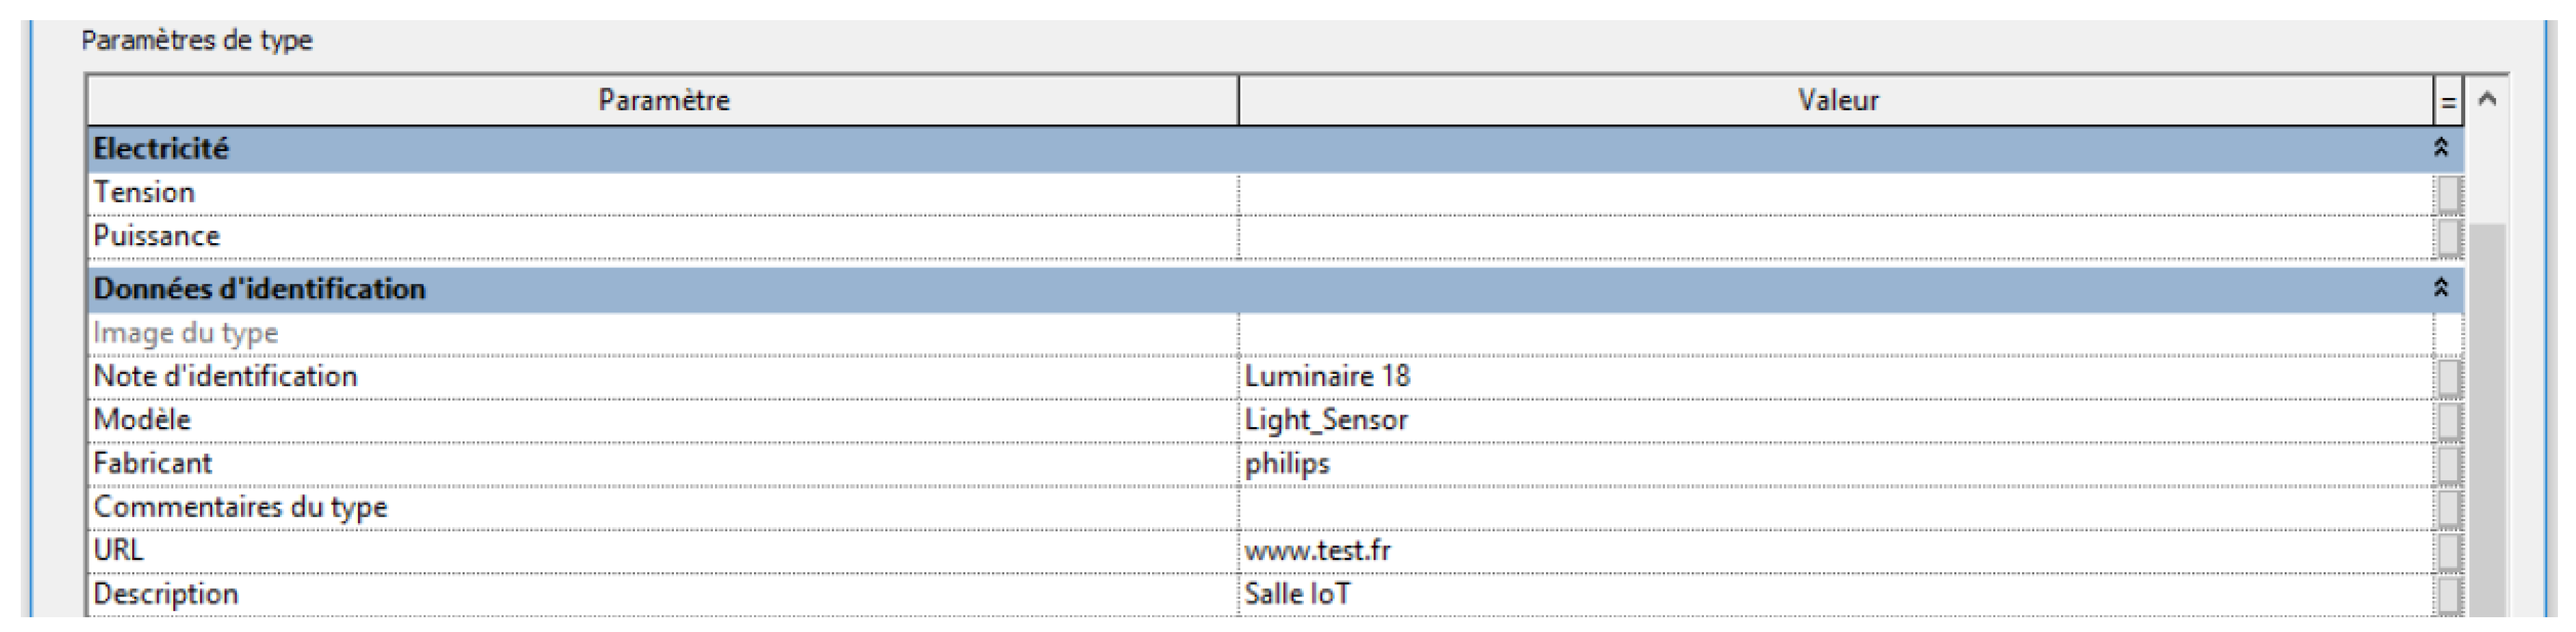
5.2.3. Second Prototype—Using ‘Object Types’
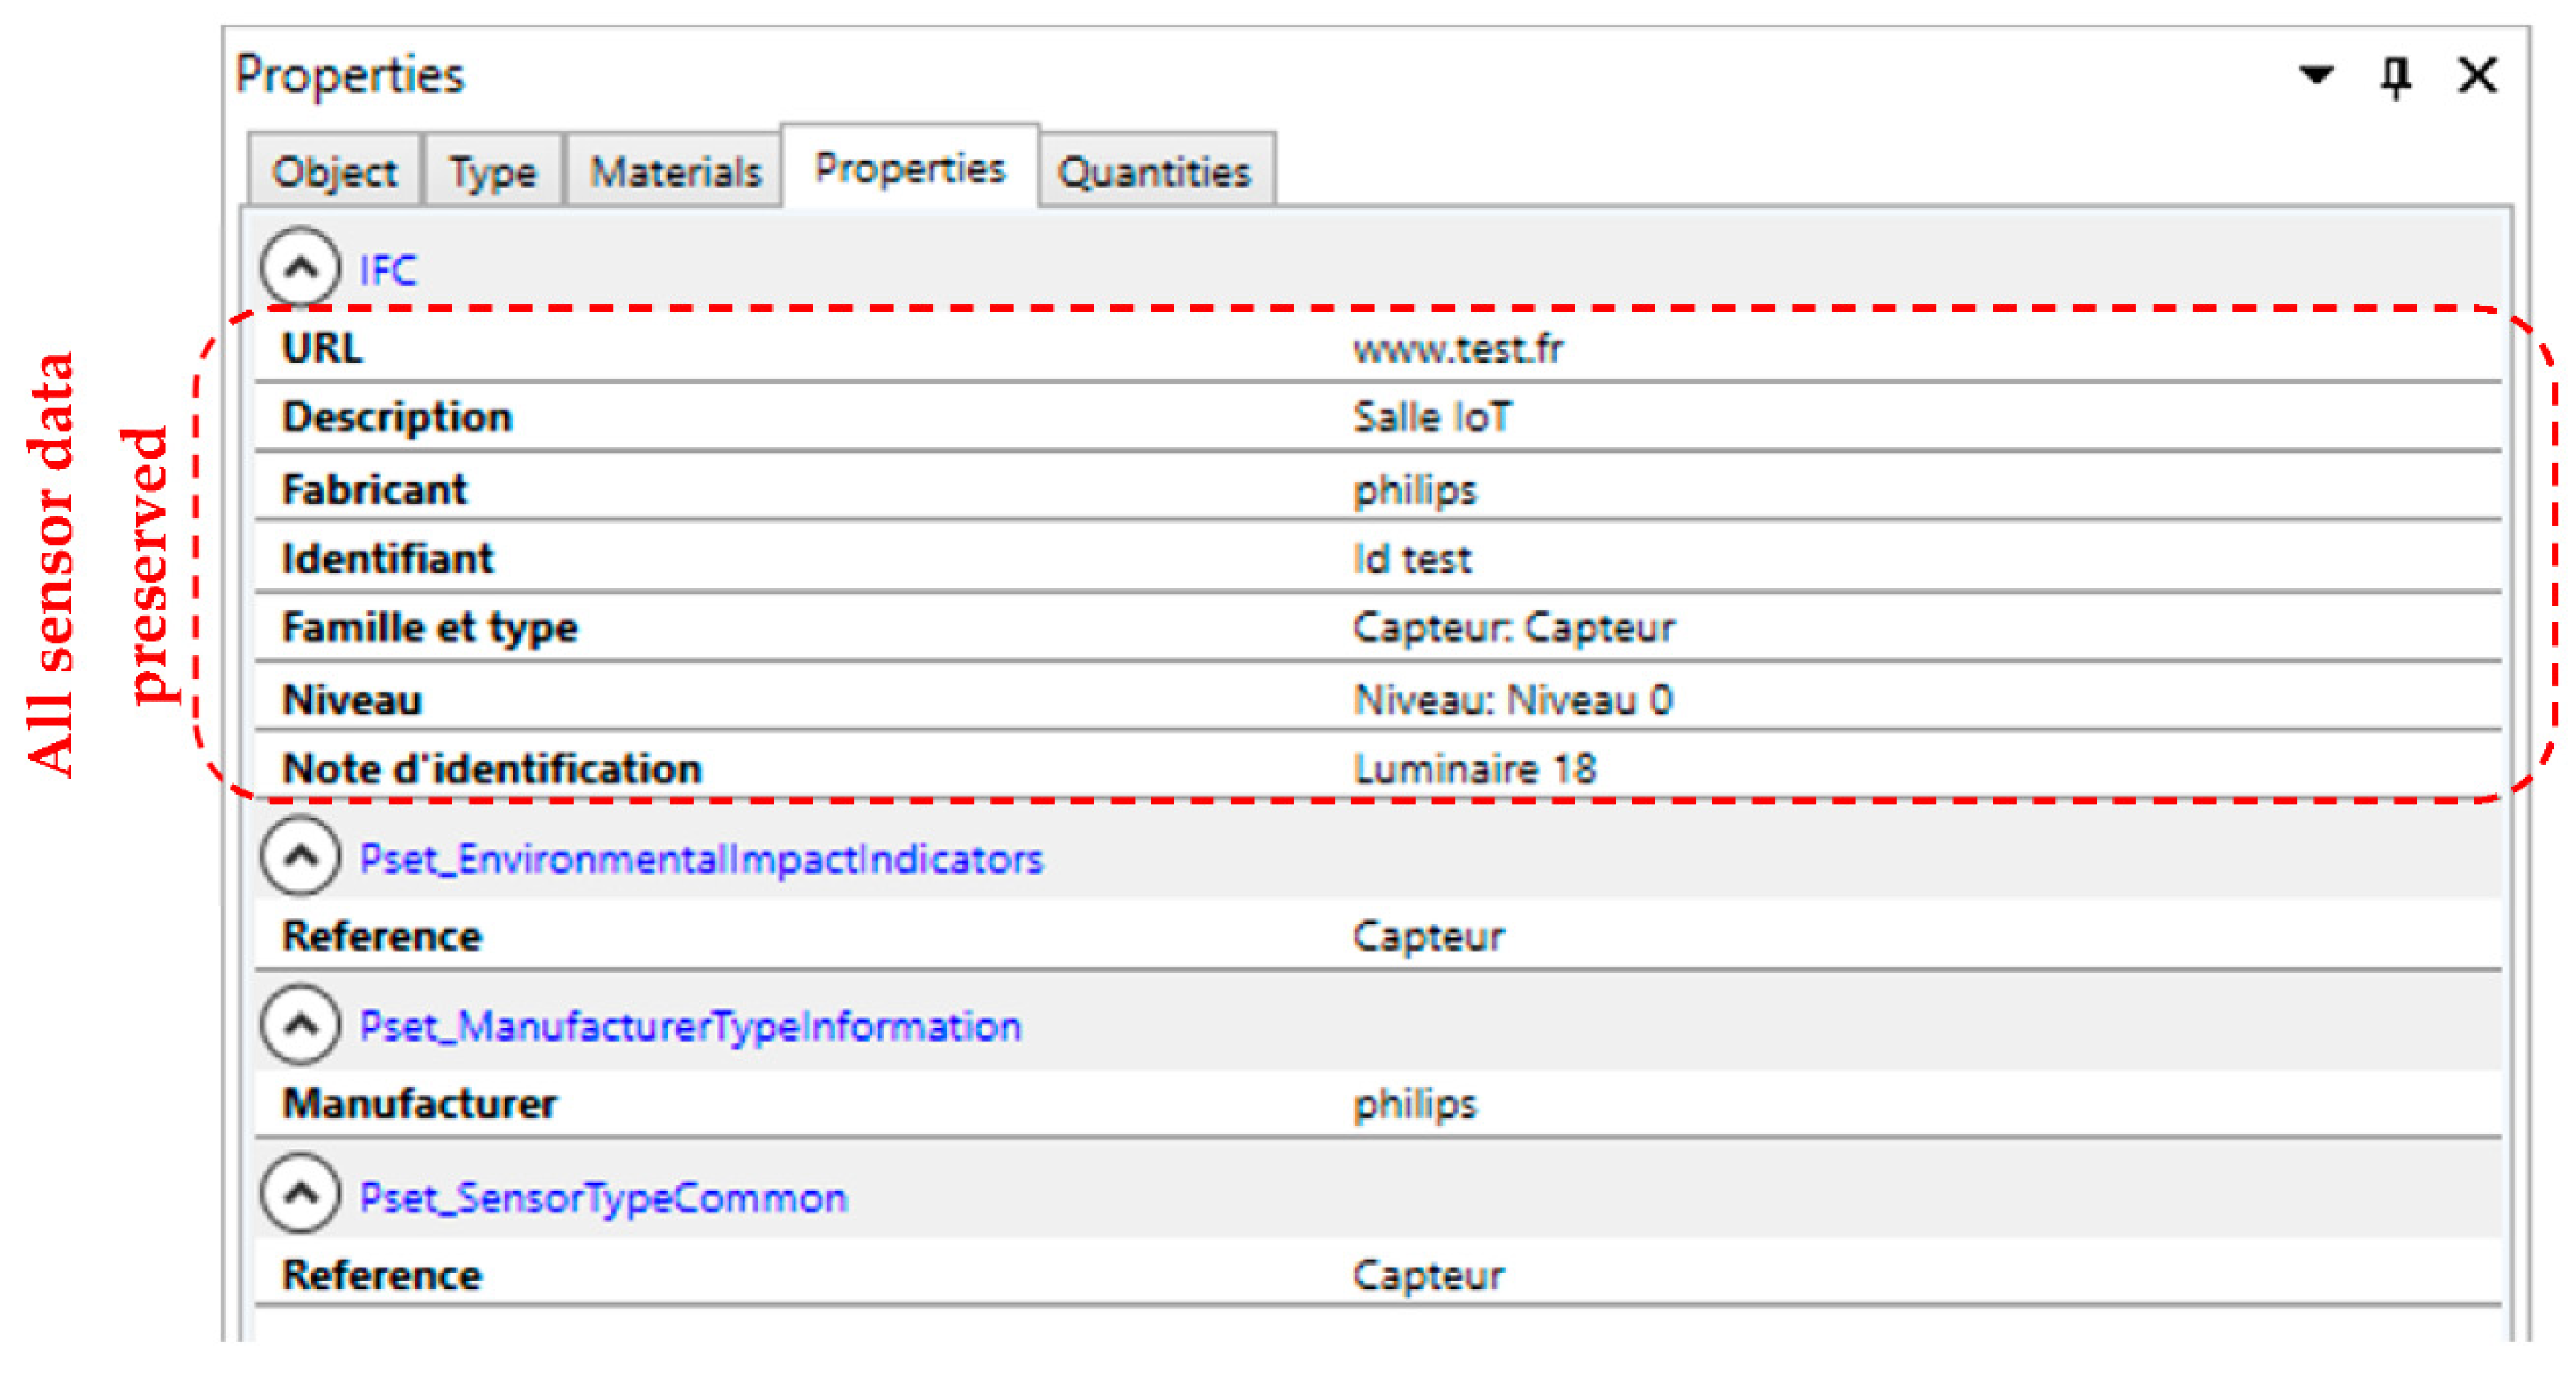
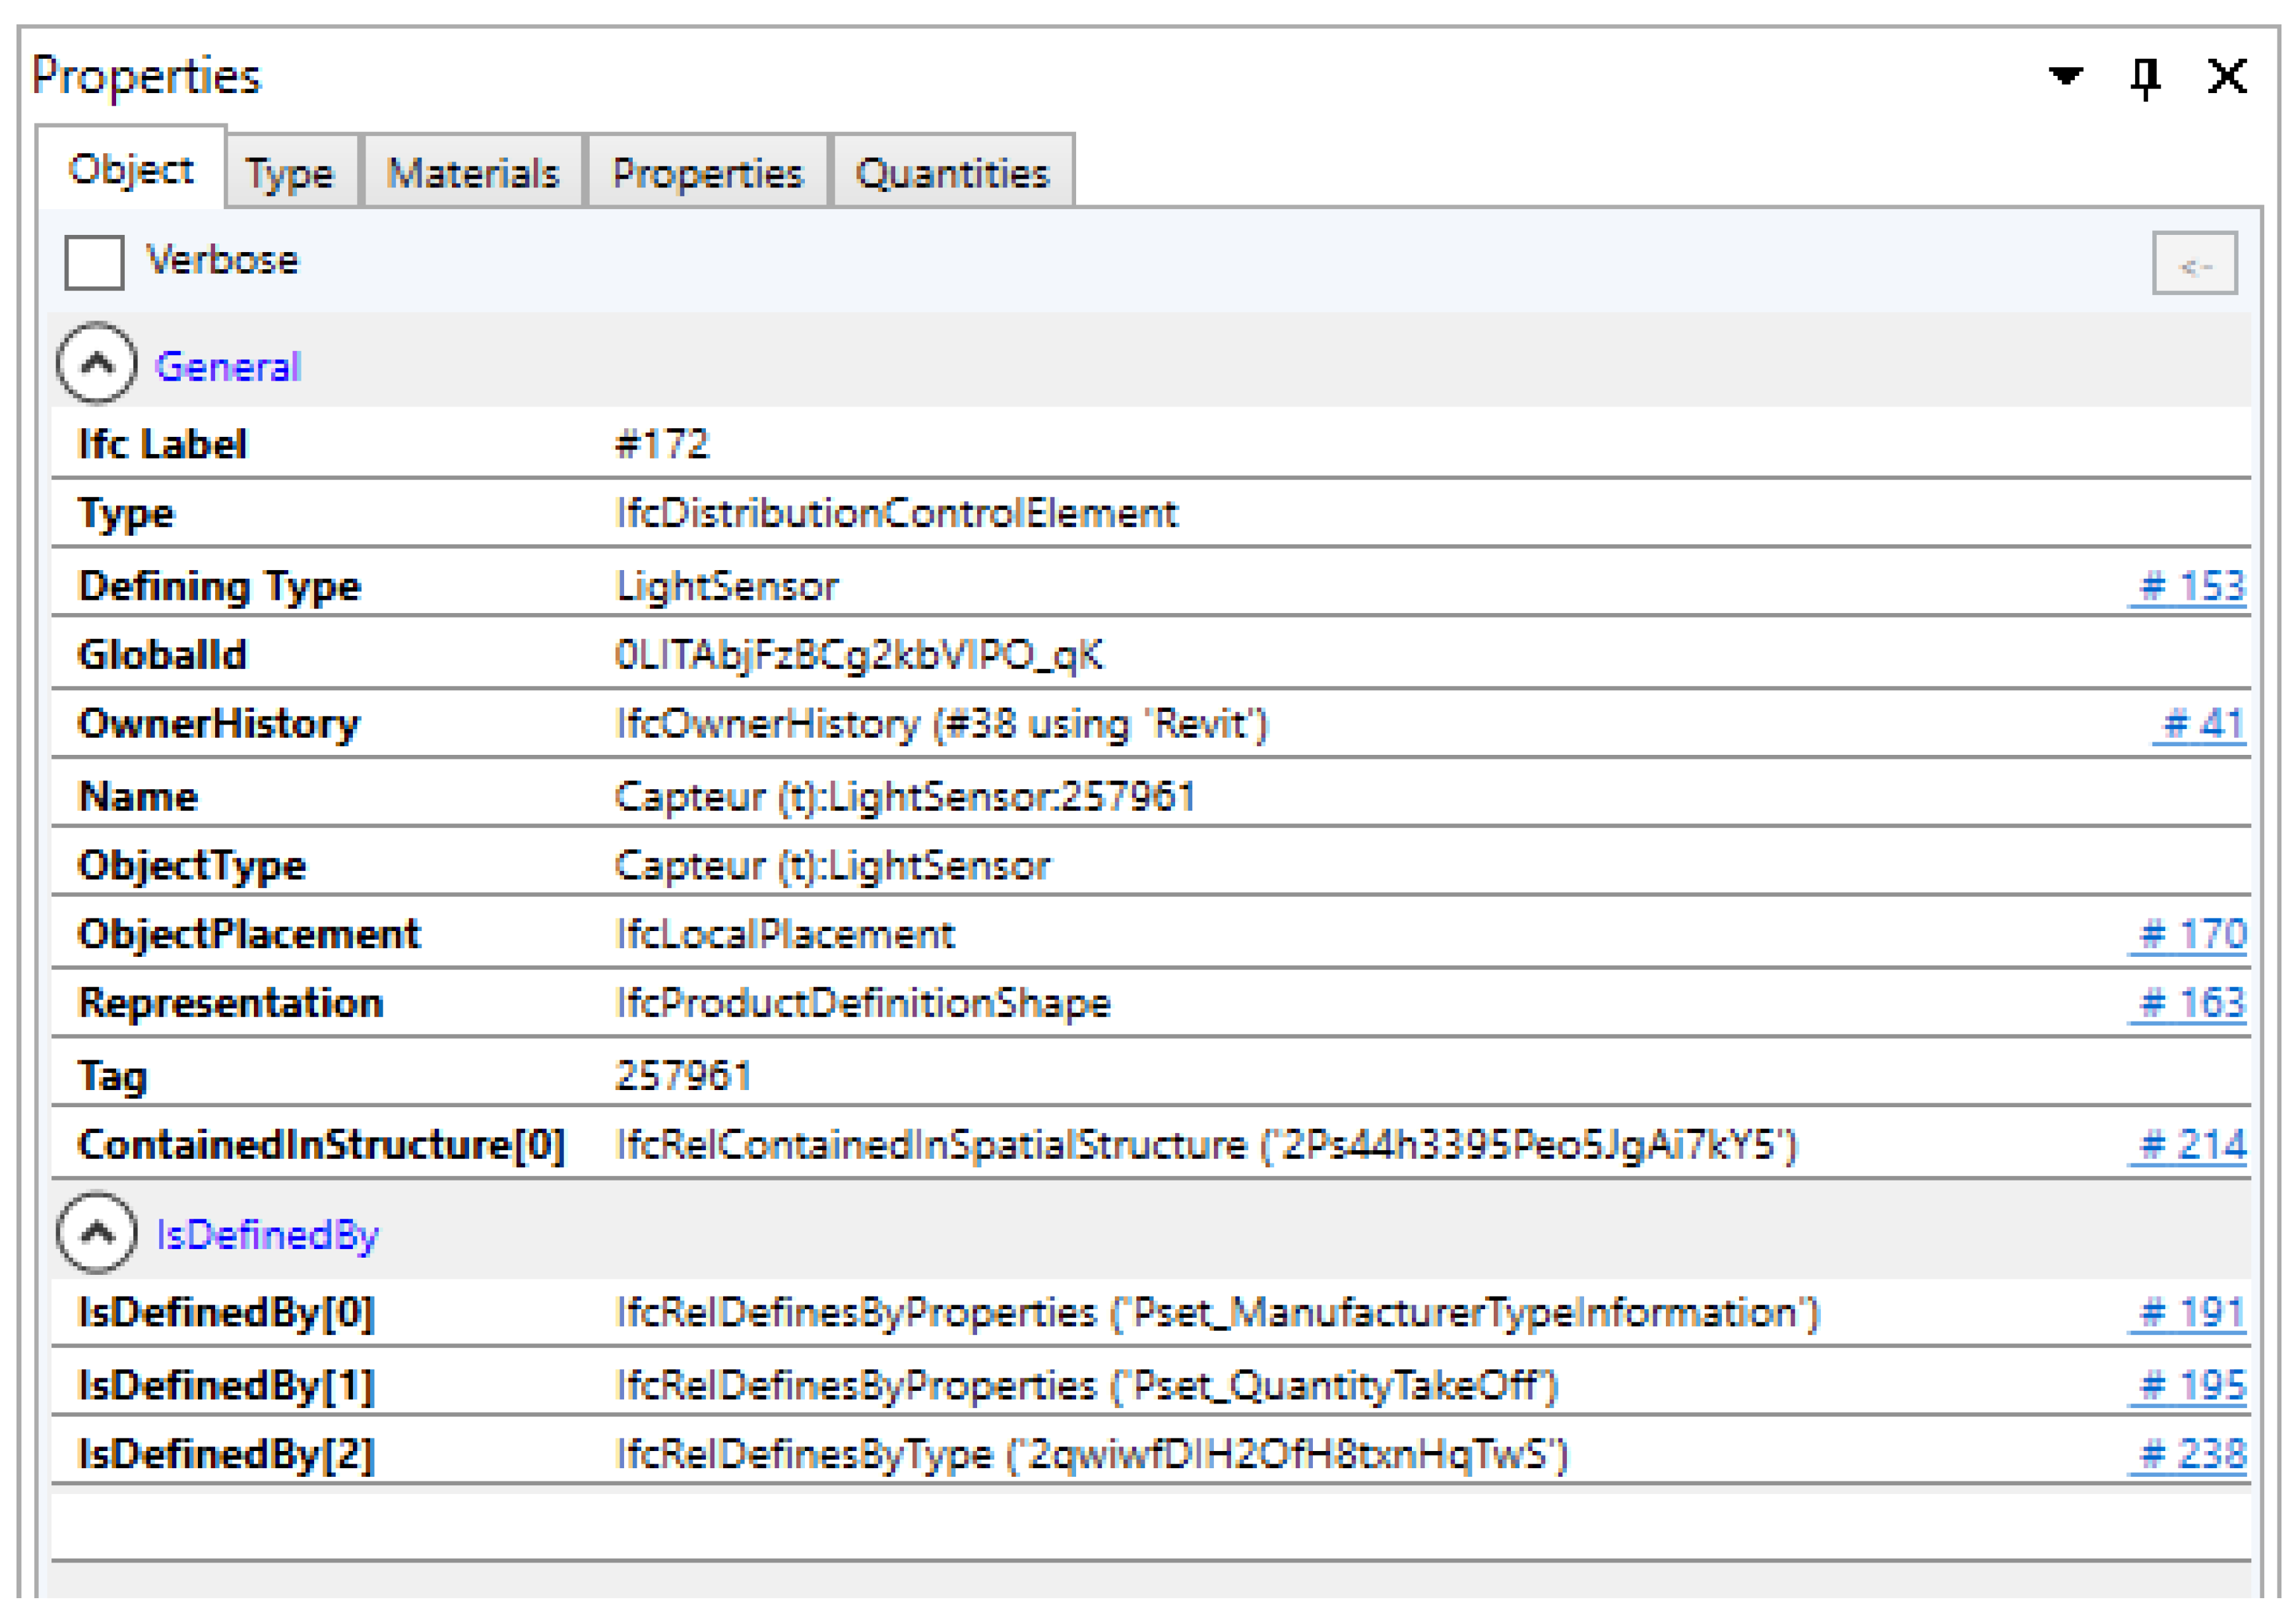
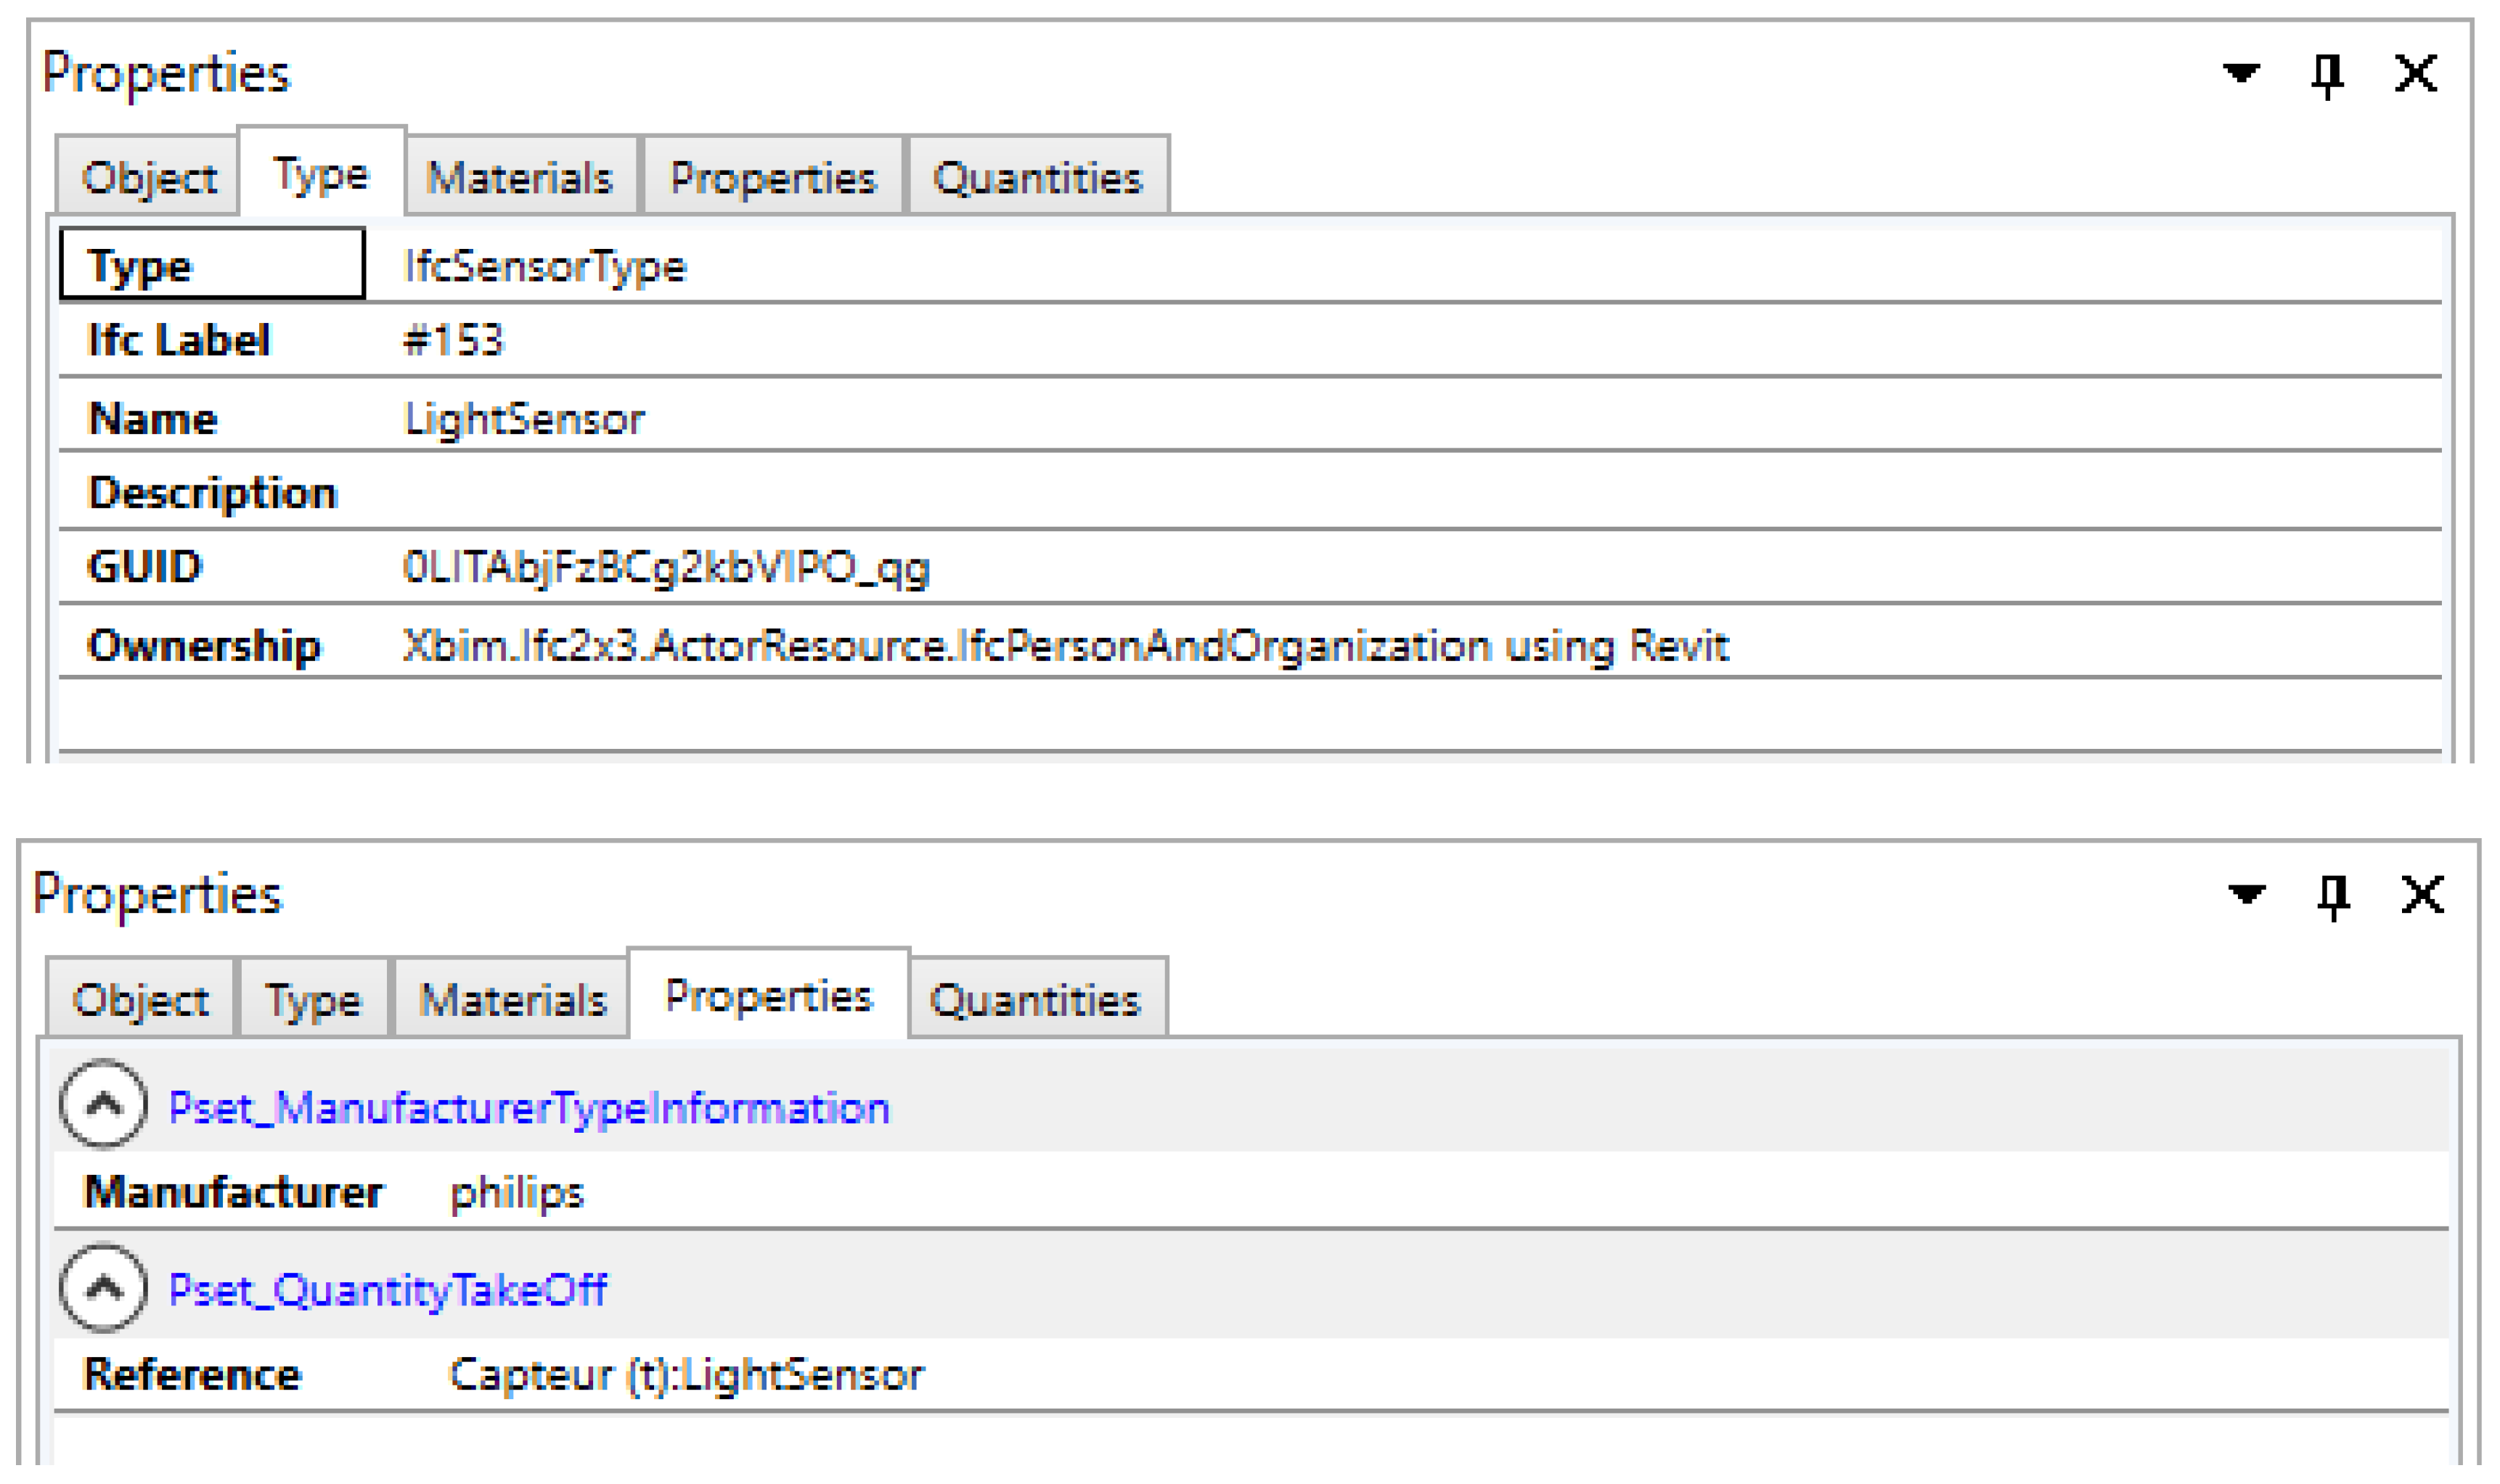
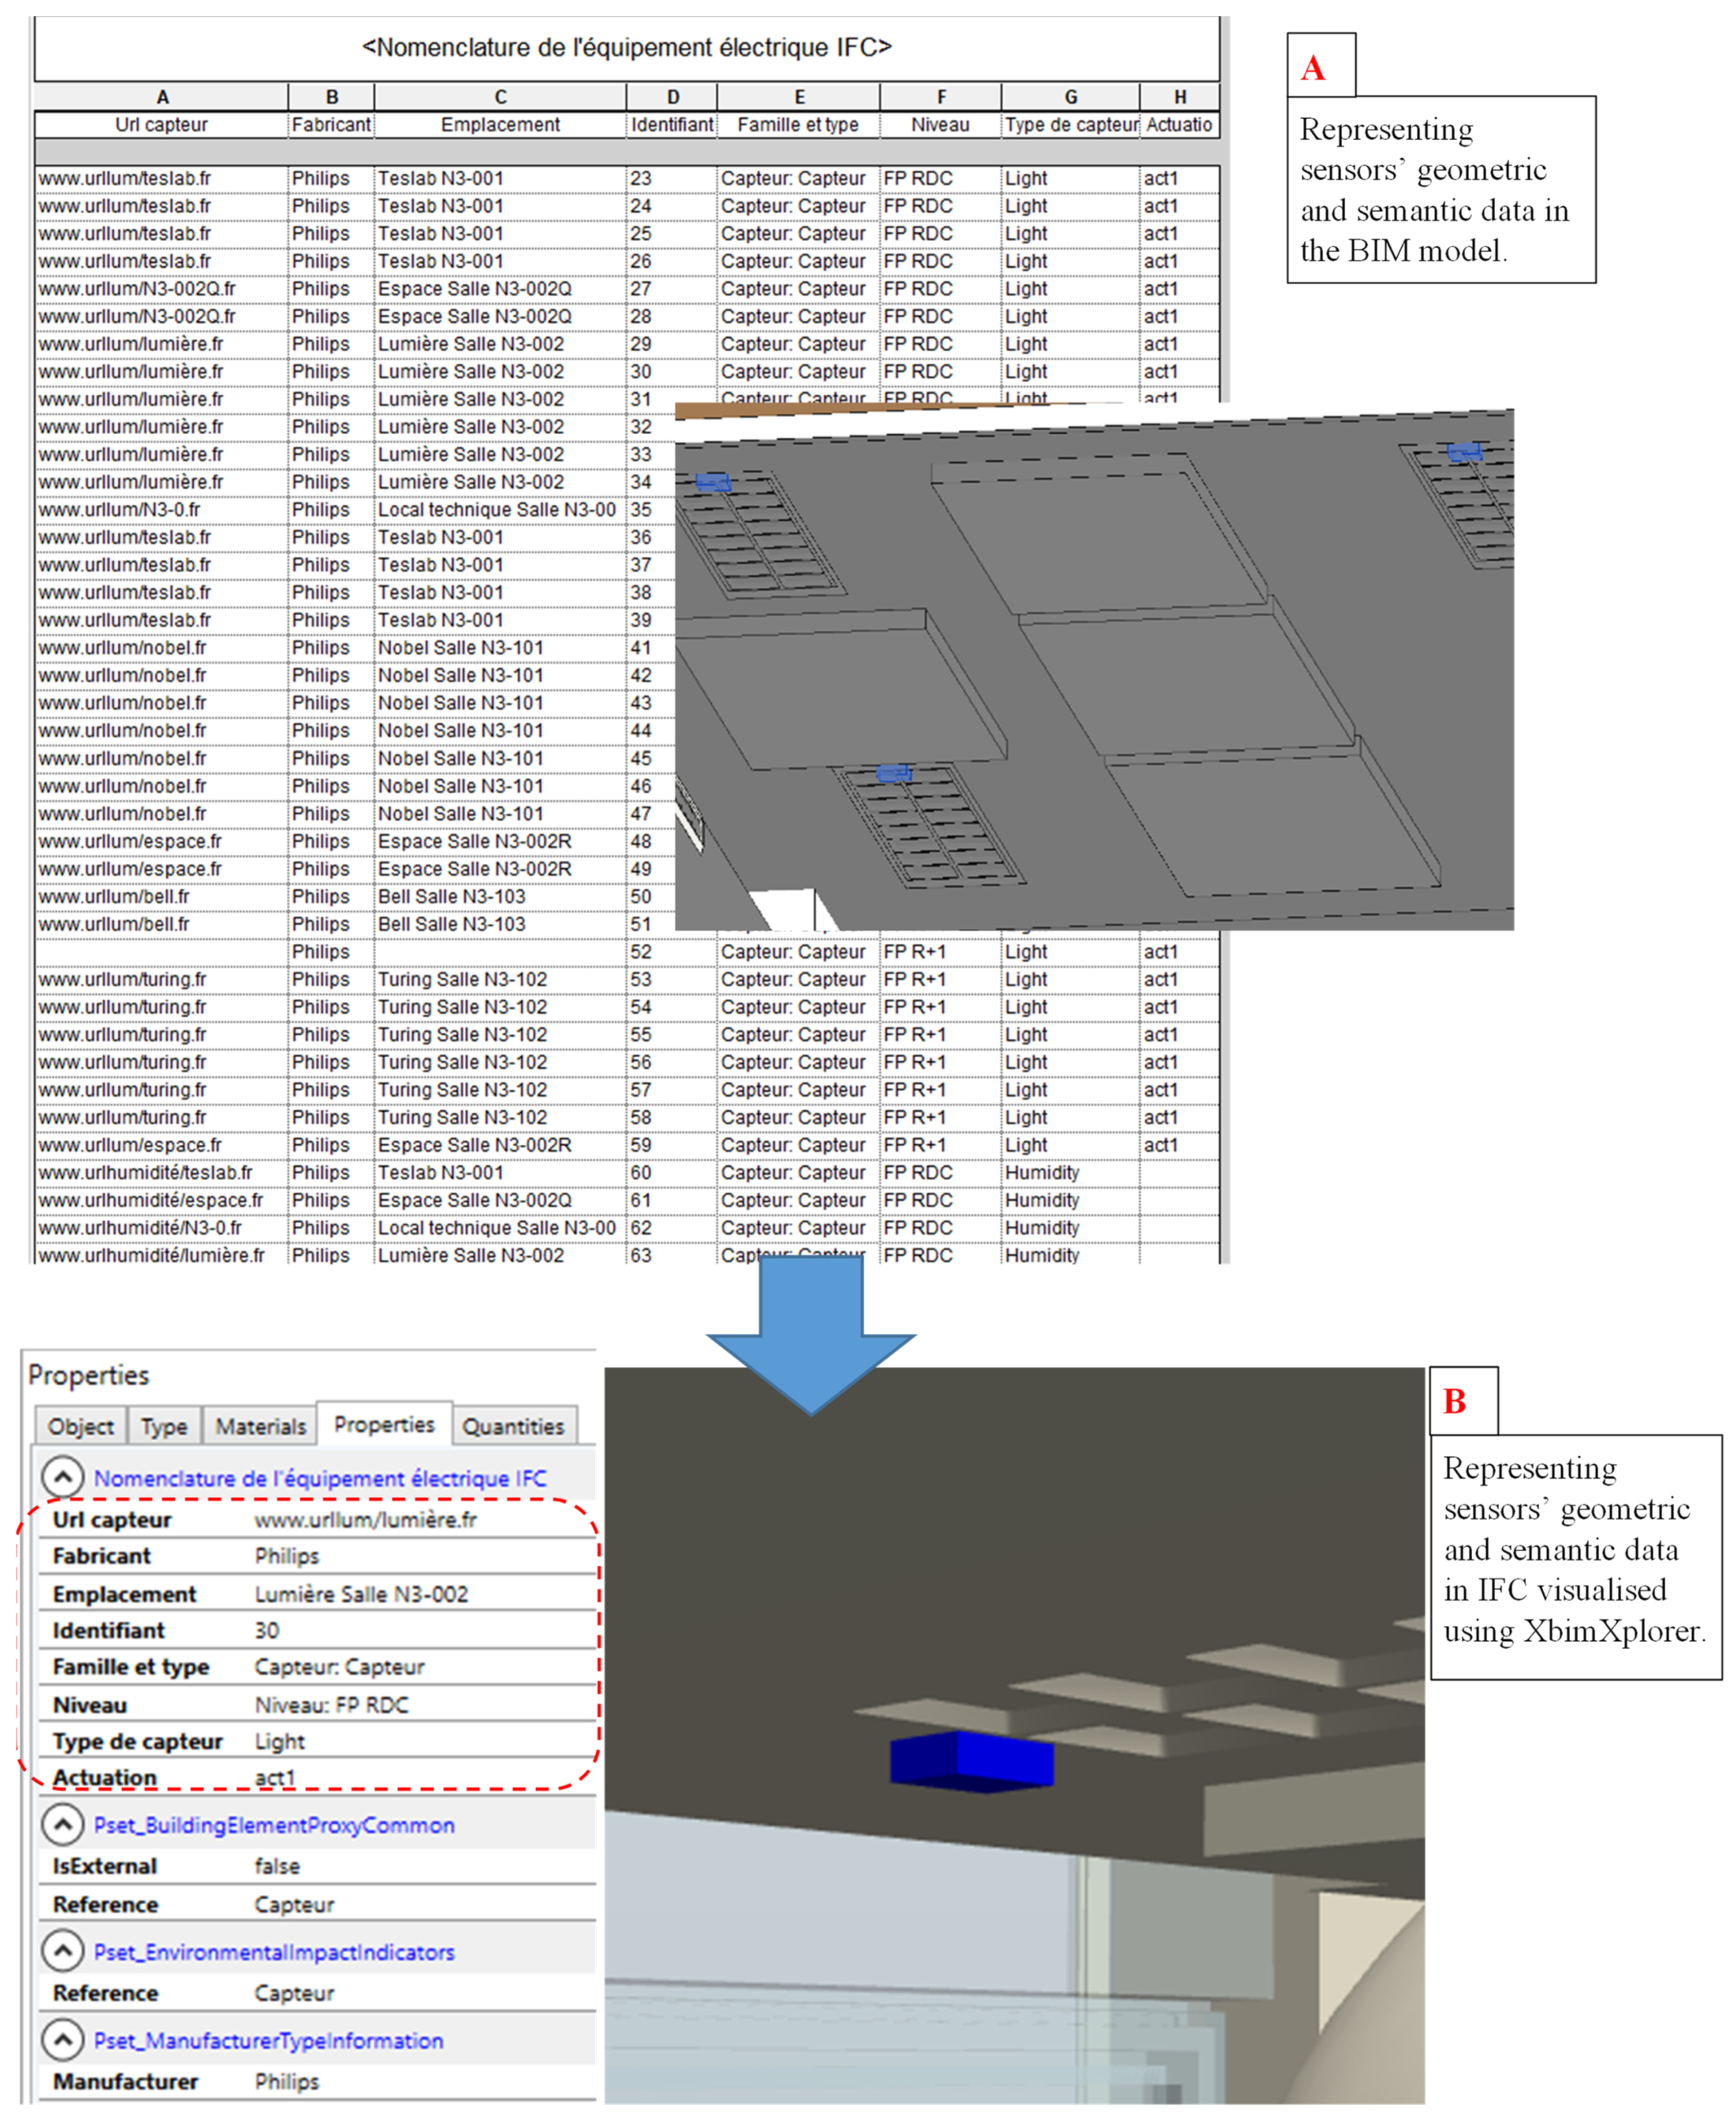
5.2.4. Third Prototype—Using ‘Property Sets’
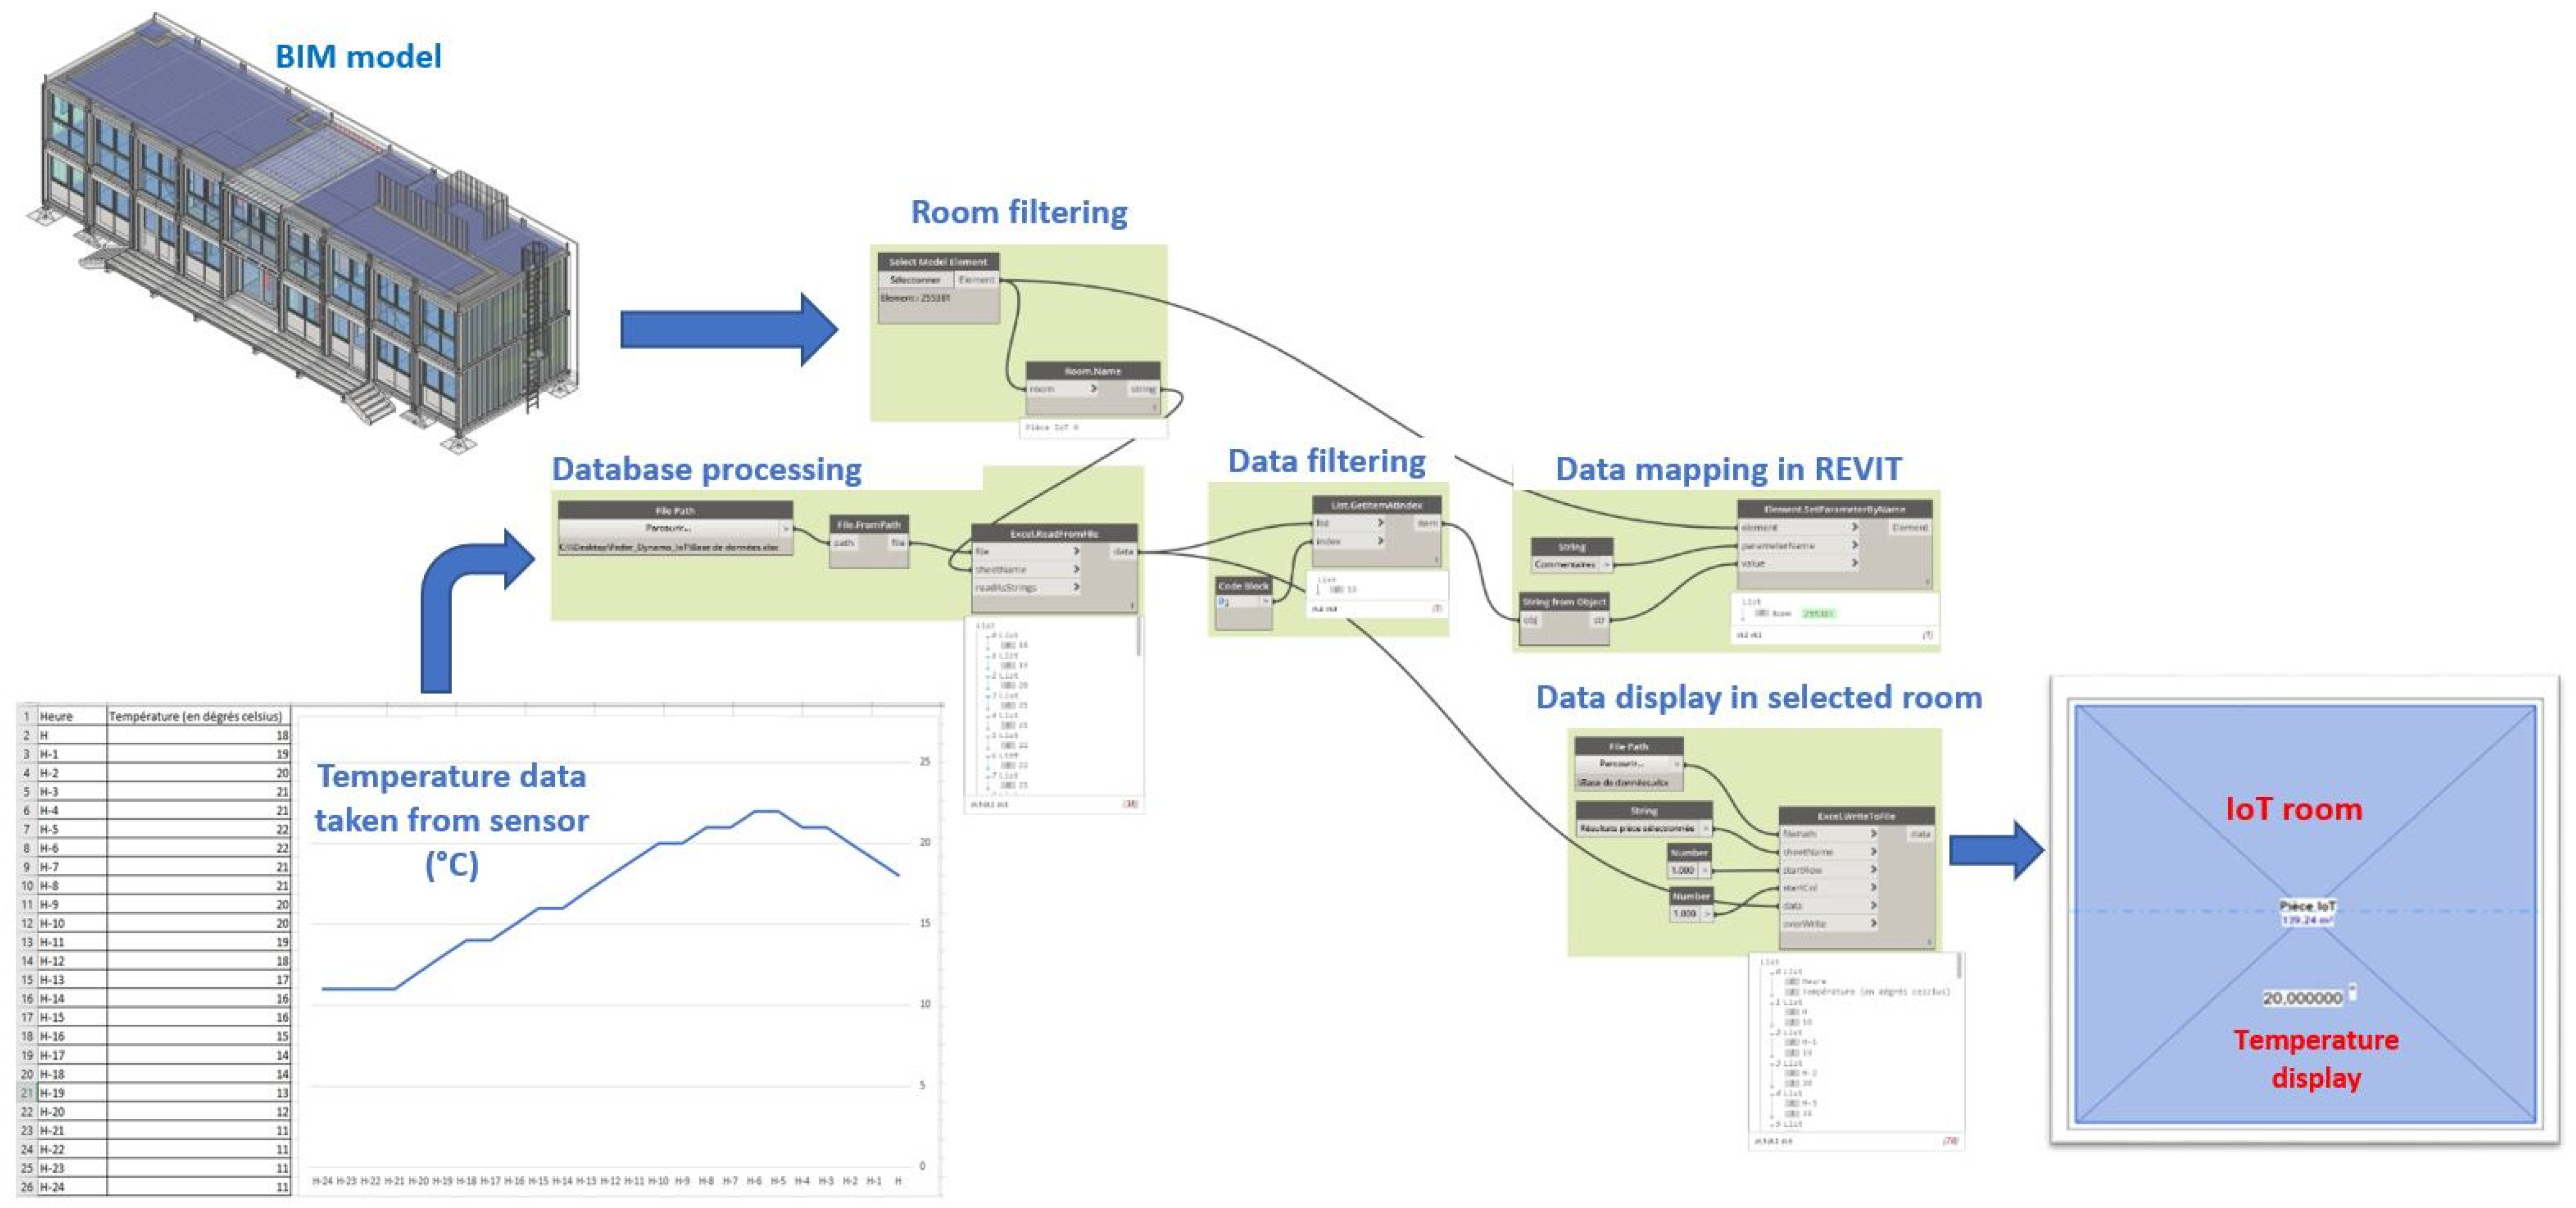
5.2.5. Fourth Prototype—Visual Programming
5.2.6. Fifth Prototype—Extension of IFC Schema
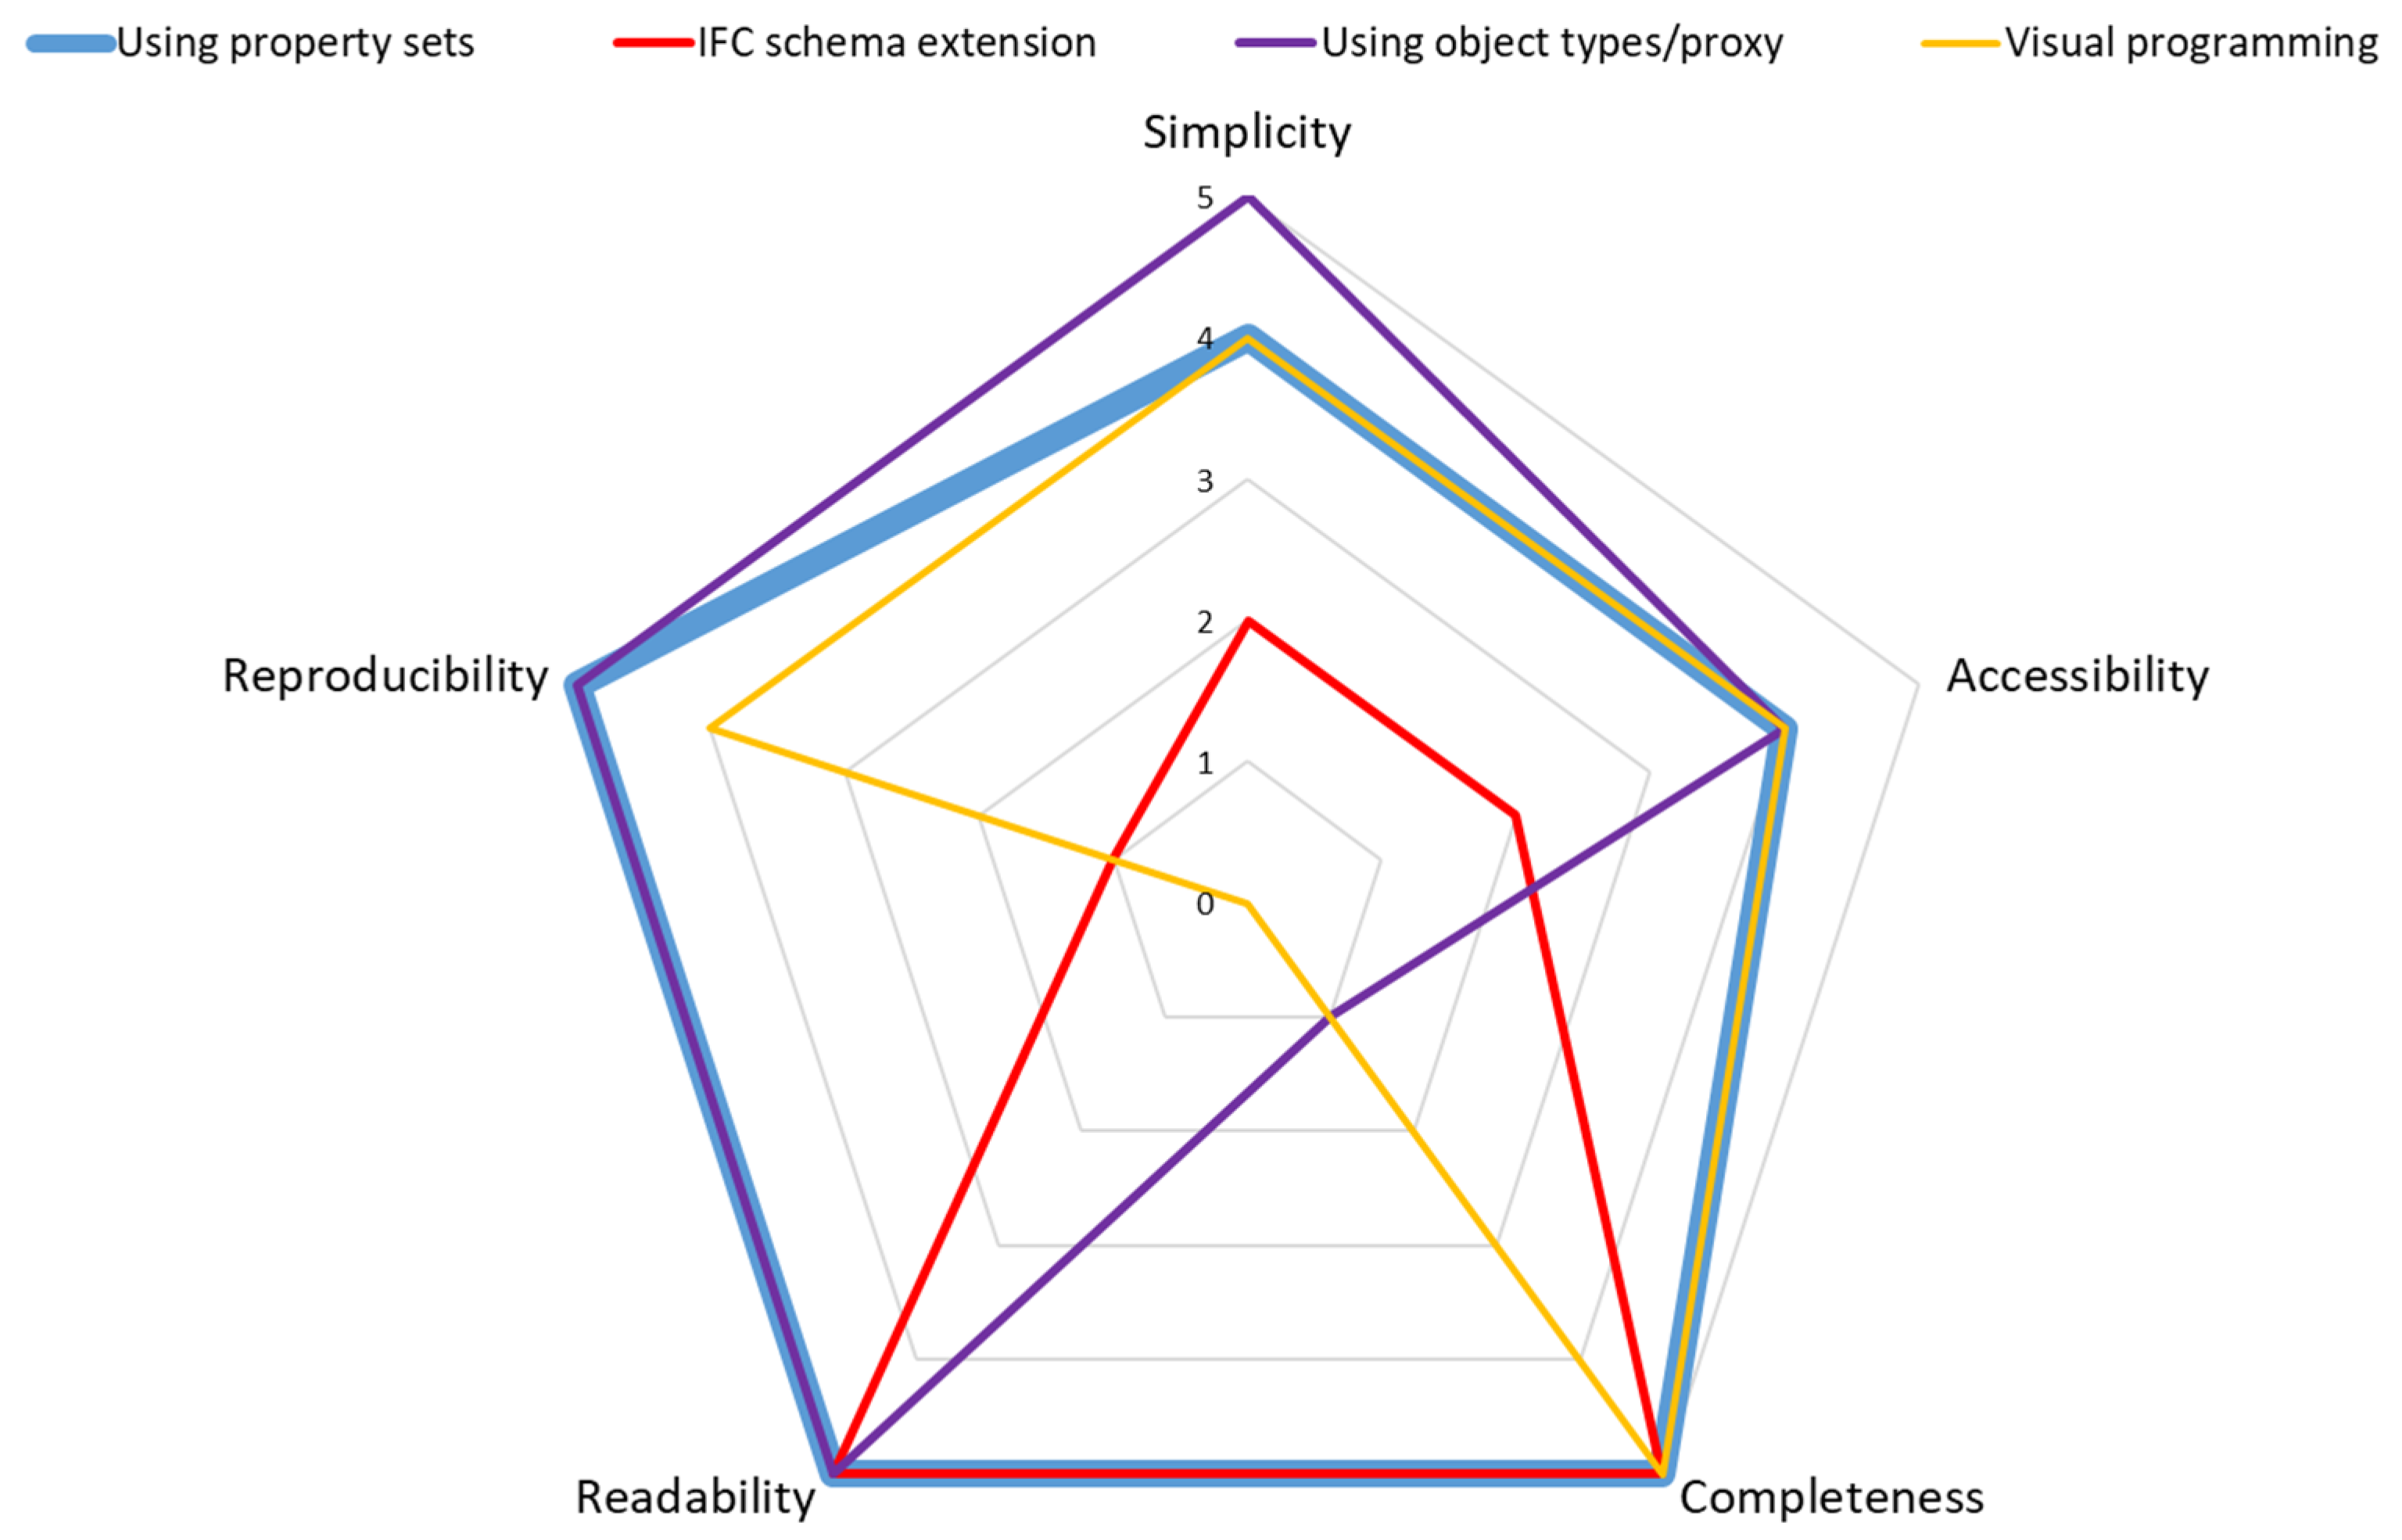
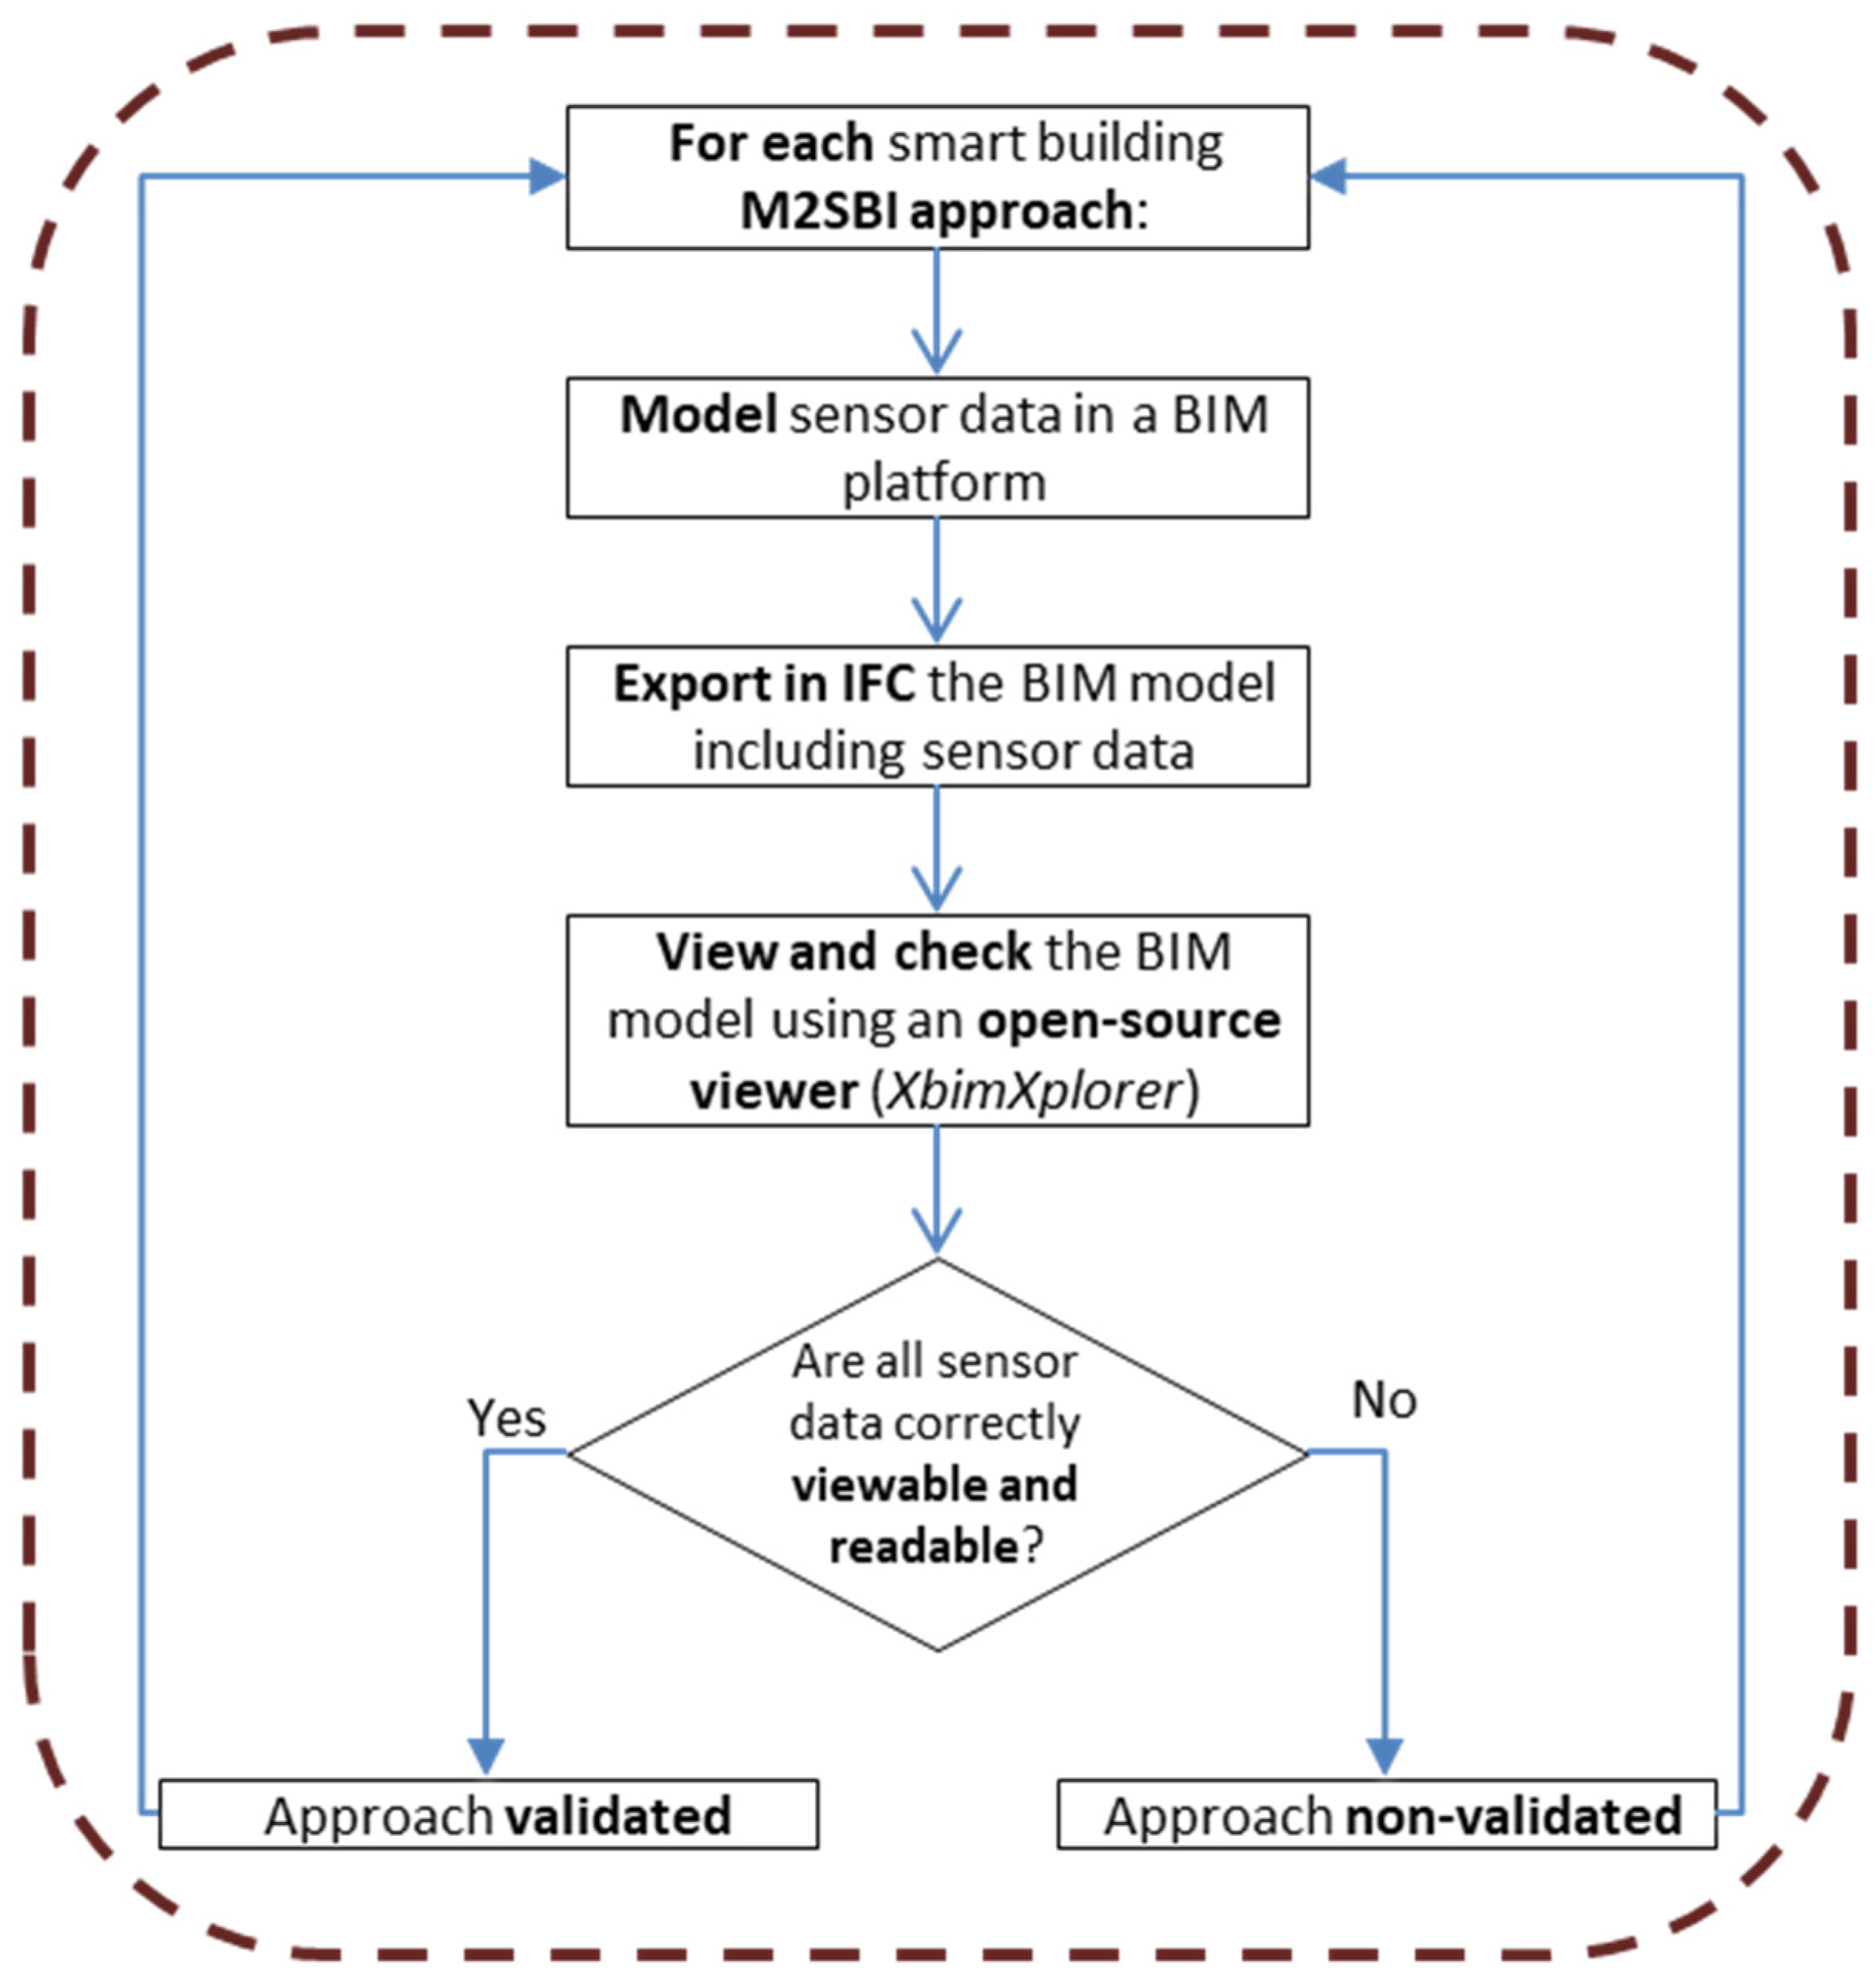
5.3. Comparing M2SBI Approaches
- Simplicity: The effort involved in developing and using the solution including time and skills.
- Accessibility: Access to the development and solution application tools.
- Completeness: The amount of required data that is exportable using IFCs.
- Readability: Viewer readability of IFC model generated.
- Reproducibility: Ability to reproduce this solution on different buildings properties and in different applications than sensor viewing.
5.4. Visualisation of Building Energy Consumption in BIM
6. Case Study—CESI’s Smart Building
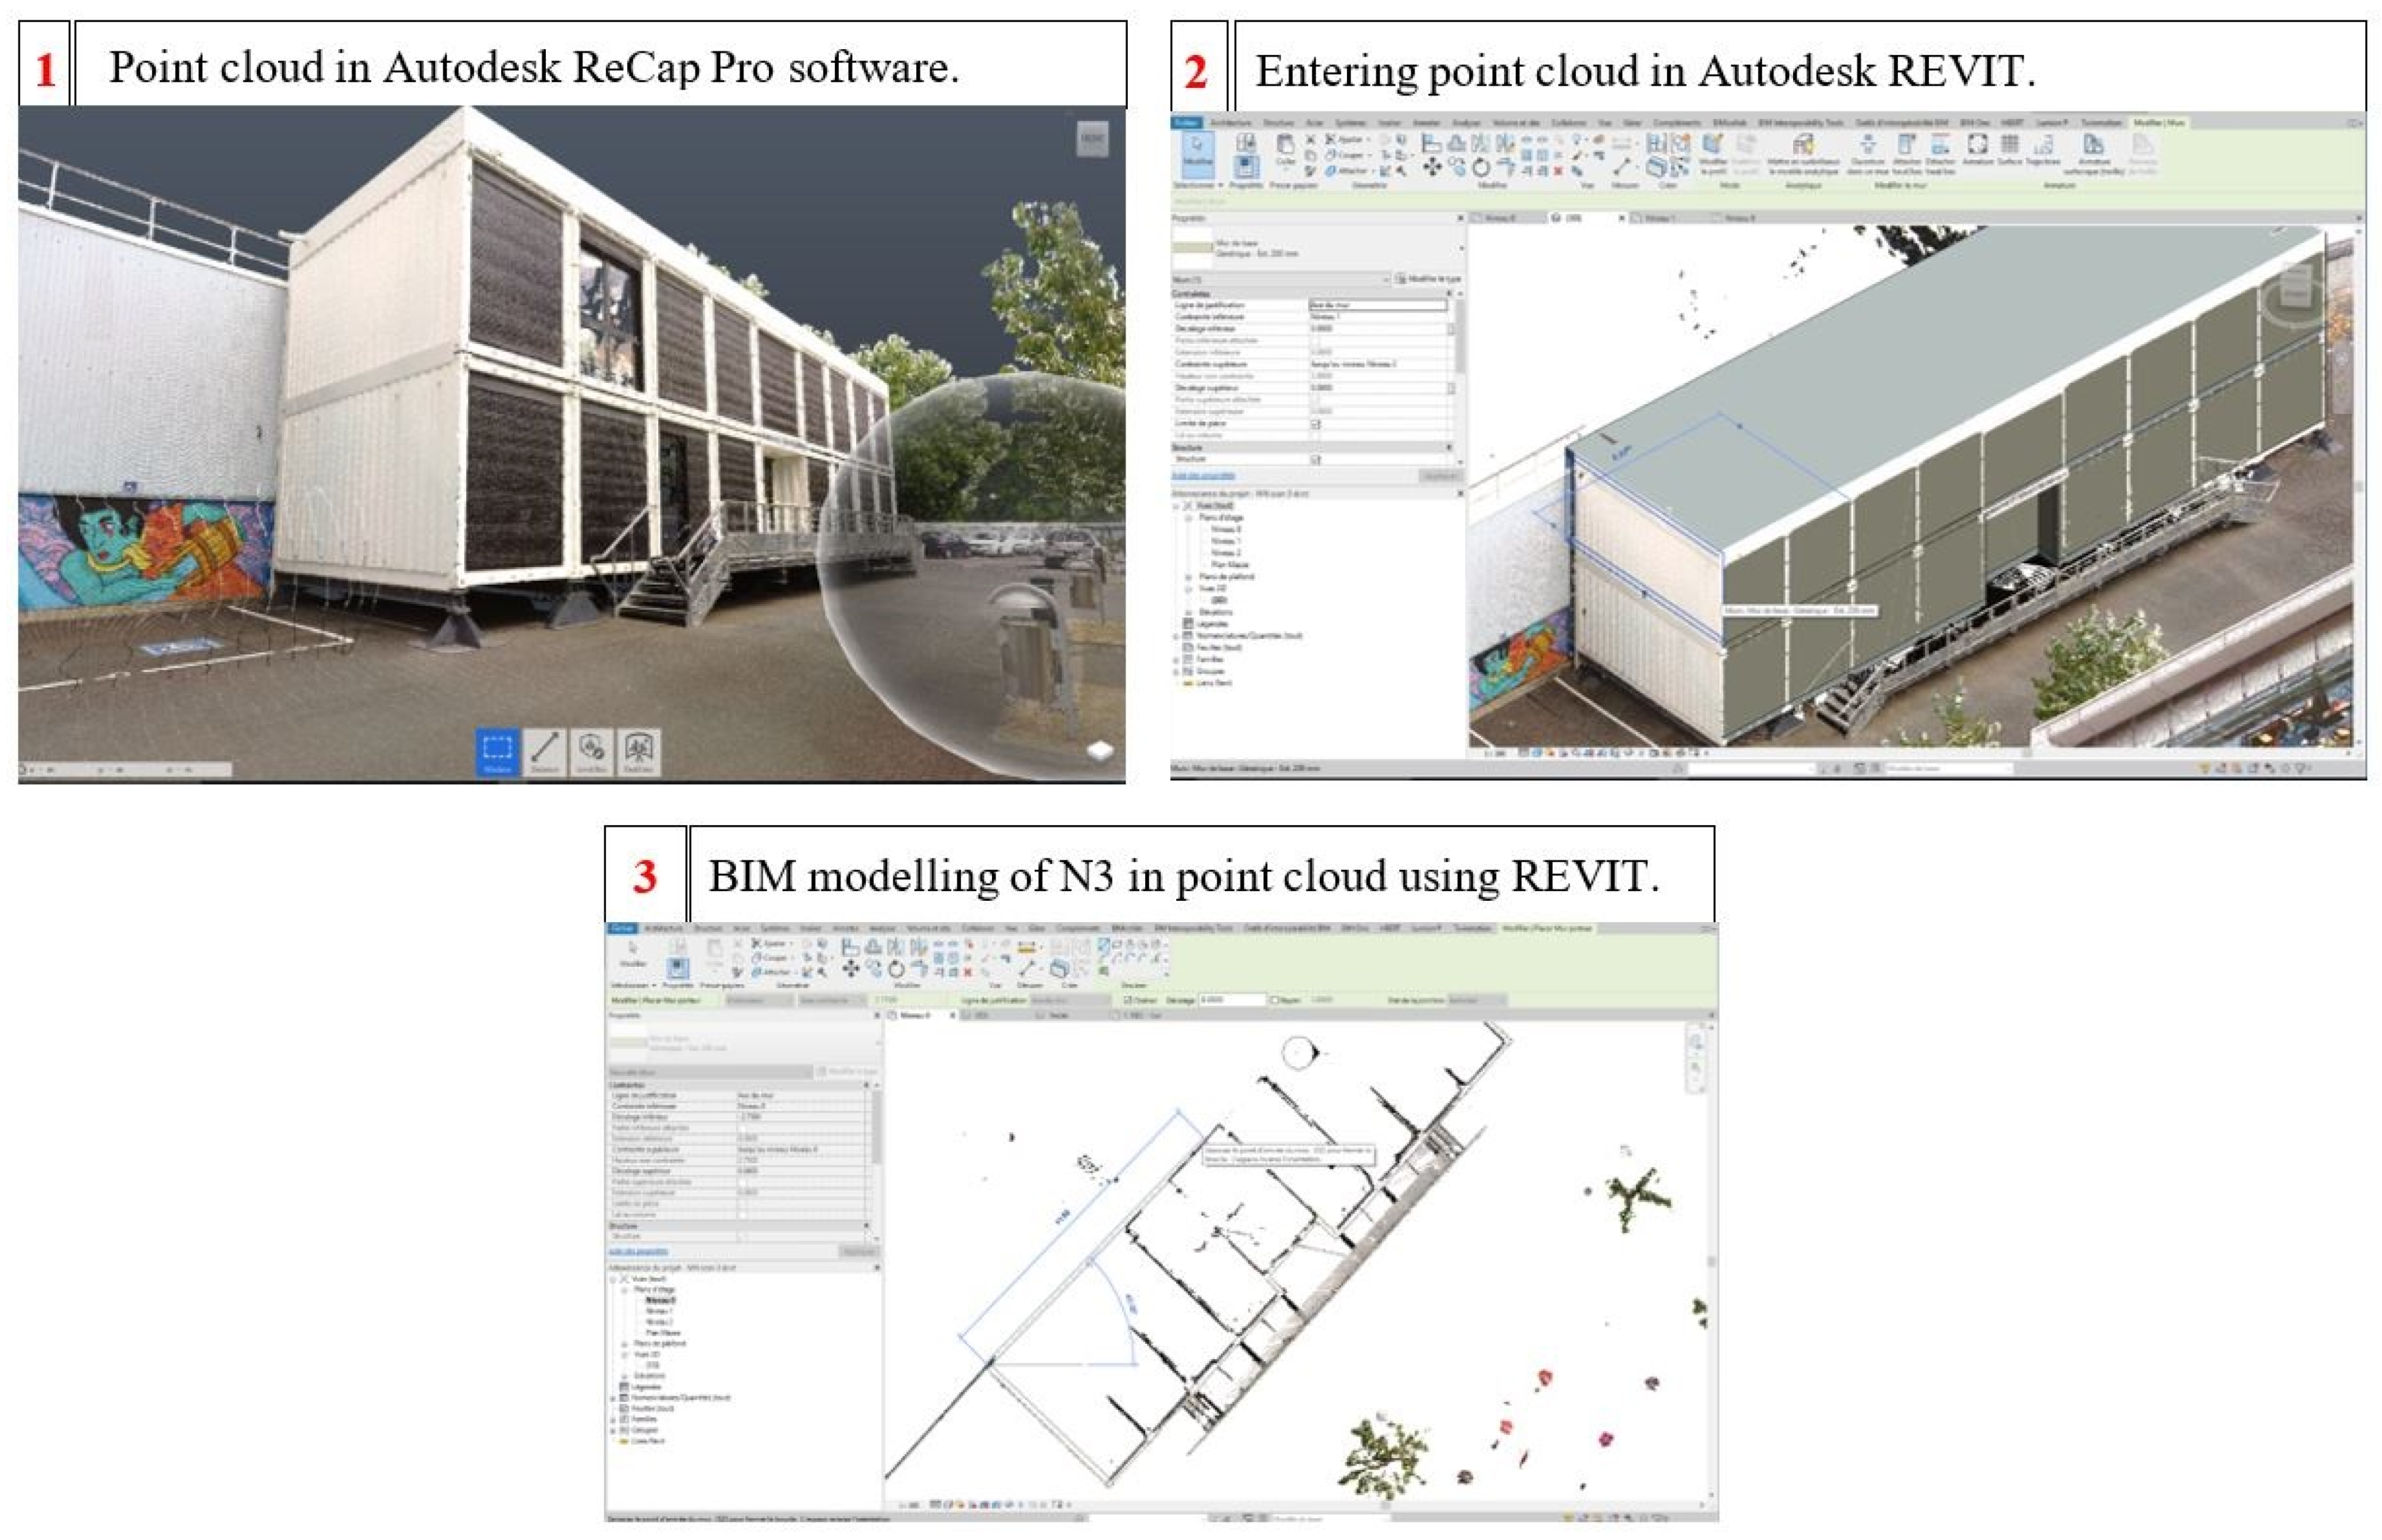
6.1. Smart Building Modelling
6.2. BIM Modelling of Smart Buildings for Building Operations
7. Discussion
8. Conclusions
Author Contributions
Funding
Institutional Review Board Statement
Informed Consent Statement
Data Availability Statement
Acknowledgments
Conflicts of Interest
References
- World Economic Forum. Why Buildings Are the Foundation of an Energy-Efficient Future. Available online: https://www.weforum.org/agenda/2021/02/why-the-buildings-of-the-future-are-key-to-an-efficient-energy-ecosystem/ (accessed on 29 November 2021).
- Ritchie, H.; Roser, M. Urbanization. OurWorldInData.org. 2018. Available online: https://ourworldindata.org/urbanization (accessed on 12 January 2022).
- European Commission. EU Building Stock Observatory. Available online: https://ec.europa.eu/energy/en/eu-buildings-database (accessed on 20 October 2020).
- University of Cambridge Institute for Sustainability Leadership (CISL). Renovation Roadmap: Making Europe’s Homes Fit for the 21st Century; The Prince of Wales’s Corporate Leaders Group: Cambridge, UK, 2018. [Google Scholar]
- European Commission. Energy Efficient Buildings. Available online: https://ec.europa.eu/energy/en/topics/energy-efficiency/buildings (accessed on 20 October 2020).
- European Commission. Commission Staff Working Document, Impact Assessment. 2016. Available online: https://eur-lex.europa.eu/legal-content/EN/TXT/?uri=SWD:2016:414:FIN (accessed on 20 October 2020).
- Wong, J.; Li, H.; Wang, S. Intelligent building research: A review. Autom. Constr. 2005, 14, 143–159. [Google Scholar] [CrossRef]
- Kamel, E.; Memari, A.M. Review of BIM’s application in energy simulation: Tools, issues, and solutions. Autom. Constr. 2018, 97, 164–180. [Google Scholar] [CrossRef]
- ISO 16739:2013. Available online: https://www.iso.org/standard/51622.html (accessed on 29 June 2020).
- Mofidi, F.; Akbari, H. Intelligent buildings: An overview. Energy Build. 2020, 223, 110192. [Google Scholar] [CrossRef]
- Kamel, E.; Memari, A.M. Automated Building Energy Modeling and Assessment Tool (ABEMAT). Energy 2018, 147, 15–24. [Google Scholar] [CrossRef]
- Stegnar, G.; Cerovšek, T. Information needs for progressive BIM methodology supporting the holistic energy renovation of office buildings. Energy 2019, 173, 317–331. [Google Scholar] [CrossRef]
- Shah, A.S.; Haidawati, N.; Fayaz, M.; Lajis, A. A Review on Energy Consumption Optimization Techniques in IoT Based Smart Building Environment. Information 2019, 10, 108. [Google Scholar] [CrossRef] [Green Version]
- Zhang, C.; Nizam, R.S.; Tian, L. BIM-based investigation of total energy consumption in delivering building products. Adv. Eng. Inform. 2018, 38, 370–380. [Google Scholar] [CrossRef]
- Coulby, G.; Clear, A.; Jones, O.; Godfrey, A. A Scoping Review of Technological Approaches to Environmental Monitoring. Int. J. Environ. Res. Public Health 2020, 17, 3995. [Google Scholar] [CrossRef] [PubMed]
- Pärn, E.A.; Edwards, D.J. Conceptualising the FinDD API Plug-in: A Study of BIM-FM Integration. Autom. Constr. 2017, 80, 11–21. [Google Scholar] [CrossRef]
- Chan, H.-Y.; Leung, S.-F.; Yuen, P.-H.; Yim, C.-M. Towards Smart Operation & Maintenance (O&M) by Building Information Modelling (BIM) and Asset Management (AM) Technologies. In Proceedings of the 7th Greater Pearl River Delta Conference on Building Operation and Maintenance, Hung Hom, Hong Kong, 6 December 2016; pp. 106–118. [Google Scholar]
- Altohami, A.B.A.; Haron, N.A.; Ales@Alias, A.H.; Law, T.H. Investigating Approaches of Integrating BIM, IoT, and Facility Management for Renovating Existing Buildings: A Review. Sustainability 2021, 13, 3930. [Google Scholar] [CrossRef]
- Fialho, B.C.; Codinhoto, R.; Fabricio, M.M.; Estrella, J.C.; Ribeiro, C.M.N.; Bueno, J.M.d.S.; Torrezan, J.P.D. Development of a BIM and IoT-Based Smart Lighting Maintenance System Prototype for Universities’ FM Sector. Buildings 2022, 12, 99. [Google Scholar] [CrossRef]
- Främling, K.; Kubler, S.; Buda, A. Universal Messaging Standards for the IoT From a Lifecycle Management Perspective. IEEE Internet Things J. 2014, 1, 319–327. [Google Scholar] [CrossRef]
- Chung, S.; Soonwook, K.; Daeyoon, M.; Taekyu, K. Smart Facility Management Systems Utilizing Open BIM and Augmented/Virtual Reality. In Proceedings of the 35th International Symposium on Automation and Robotics in Construction (ISARC), Berlin, Germany, 20–25 July 2018. [Google Scholar]
- Ibrahim, K.; Mohamaden, F.; Fonbeyin, H.A.; Vidalakis, C.; Woods, G. BIM for FM: Input versus Output data. In Proceedings of the 33rd CIB W78 Conference, Brisbane, Australia, 31 October–2 November 2016. [Google Scholar]
- Khandakar, M.R.; Louis, J.; Fiawoyife, K.K. Wireless electric appliance control for smart buildings using indoor location tracking and BIM-based virtual environments. Autom. Constr. 2019, 101, 48–58. [Google Scholar] [CrossRef]
- Cheng, M.; Chiu, K.; Hsieh, Y.; Yang, I.; Chou, J.; Wu, Y. BIM integrated smart monitoring technique for building fire prevention and disaster relief. Autom. Constr. 2017, 84, 14–30. [Google Scholar] [CrossRef]
- Dave, B.; Buda, A.; Nurminen, A.; Främling, K. A framework for integrating BIM and IoT through open standards. Autom. Constr. 2018, 95, 35–45. [Google Scholar] [CrossRef]
- Patacas, J.; Dawood, N.; Kassem, M. BIM for facilities management: A framework and a common data environment using open standards. Autom. Constr. 2020, 120, 103366. [Google Scholar] [CrossRef]
- Coleman, S.; Robinson, J.B. Introducing the qualitative performance gap: Stories about a sustainable building. Build. Res. Inf. 2018, 46, 485–500. [Google Scholar] [CrossRef]
- Francisco, A.; Truong, H.; Khosrowpour, A.; Taylor, J.E.; Mohammadi, N. Occupant perceptions of building information model-based energy visualizations in eco-feedback systems. Appl. Energy 2018, 221, 220–228. [Google Scholar] [CrossRef]
- Hammad, A.W. Minimising the Deviation between Predicted and Actual Building Performance via Use of Neural Networks and BIM. Buildings 2019, 9, 131. [Google Scholar] [CrossRef] [Green Version]
- ANSI/ASHRAE. Standard 55-2017; Thermal Environmental Conditions for Human Occupancy. American Society of Heating, Refrigerating and Conditioning Engineers: Atlanta, GA, USA, 2017.
- Tang, S.; Shelden, D.R.; Eastman, C.M.; Pishdad-Bozorgi, P.; Gao, X. A review of building information modeling (BIM) and the internet of things (IoT) devices integration: Present status and future trends. Autom. Constr. 2019, 101, 127–139. [Google Scholar] [CrossRef]
- Ohueri, C.; Enegbuma, W.I.; Kenley, R. Energy efficiency practices for Malaysian green office building occupants. Built Environ. Proj. Asset Manag. 2018, 8, 134–146. [Google Scholar] [CrossRef]
- European Commission. Energy-Efficiency Buildings, Energy Union and Climate. Available online: https://ec.europa.eu/energy/en/eu-buildings-database (accessed on 20 October 2020).
- xBimTeam. xBIM Toolkit Documentation. Available online: http://docs.xbim.net/ (accessed on 1 December 2021).
- Objectif BIM. les Différents Niveaux du BIM. Available online: http://www.objectif-bim.com/index.php/bim-maquette-numerique/le-bim-en-bref/les-niveaux-du-bim (accessed on 29 June 2020).
- EnerJ Meeting—Paris 2020. Available online: https://www.enerj-meeting.com/ (accessed on 29 June 2020).
- Theiler, M.; Smarsly, K. IFC Monitor—An IFC schema extension for modeling structural health monitoring systems. Adv. Eng. Inform. 2018, 37, 54–65. [Google Scholar] [CrossRef]
- UML Channel. SysML: Langage de Modélisation Système. Available online: http://www.umlchannel.com/fr/sysml (accessed on 29 June 2020).
- SysML Tutorial. Available online: https://www.uml-sysml.org/documentation/sysml-tutorial-incose-2.2mo/view (accessed on 29 June 2020).
- Egwunatum, I.S.; Esther, J.-A.; Akaigwe, R. Assessment of energy utilization and leakages in buildings with building information model energy. Front. Archit. Res. 2017, 6, 29–41. [Google Scholar] [CrossRef]
- Pinheiro, S.; Wimmer, R.; O’Donnell, J.; Muhic, S.; Bazjanac, V.; Maile, T.; Frisch, J.; Treeck, C.V. MVD based information exchange between BIM and building energy performance simulation. Autom. Constr. 2018, 90, 91–103. [Google Scholar] [CrossRef] [Green Version]
- ISO 16739-1:2018. Available online: https://www.iso.org/standard/70303.html (accessed on 29 June 2020).
- IFC. QU’EST-Ce Que les IFC? BIM Standards. Available online: https://bimstandards.fr/travailler-avec-les-ifc/qu-est-ce-que-les-ifc/ (accessed on 29 June 2020).
- Department of Energy, U.S. Buildings Energy Data Book; Energy Efficiency & Renewable Energy Department: Washington, DC, USA, 2011; p. 286.
- Ait-Lamallam, S.; Yaagoubi, R.; Sebari, I.; Doukari, O. Extending the IFC Standard to Enable Road Operation and Maintenance Management through OpenBIM. ISPRS Int. J. Geo-Inf. 2021, 10, 496. [Google Scholar] [CrossRef]
- Kontio, J.; Lehtola, L.; Bragge, J. Using the Focus Group Method in Software Engineering: Obtaining Practitioner and User Experiences. In Proceedings of the International Symposium on Empirical Software Engineering (ISESE ’04), Redondo Beach, CA, USA, 19–20 August 2004; pp. 271–280. [Google Scholar] [CrossRef]
- Kensek, K. Integration of Environmental Sensors with BIM: Case studies using Arduino, Dynamo, and the Revit API. Inf. Constr. 2014, 66, 044. [Google Scholar] [CrossRef] [Green Version]
- Dynamo. Available online: https://dynamobim.org/ (accessed on 29 June 2020).
- Blervaque, H. Règles de Modélisation des Systèmes Énergétiques dans les Bâtiments Basse Consommation; Spécialité ‘Énergétique’. PhD Thesis, École Nationale Supérieure des Mines de Paris, Paris, France, 2014. [Google Scholar]
- Doukari, O.; Greenwood, D. Automatic generation of building information models from digitized plans. Autom. Constr. 2020, 113, 103129. [Google Scholar] [CrossRef]
- Wang, C.; Cho, Y.K.; Kim, C. Automatic BIM component extraction from point clouds of existing buildings for sustainability applications. Autom. Constr. 2015, 56, 1–13. [Google Scholar] [CrossRef]
- Wang, B.; Yin, C.; Luo, H.; Cheng, J.C.P.; Wang, Q. Fully automated generation of parametric BIM for MEP scenes based on terrestrial laser scanning data. Autom. Constr. 2021, 125, 103615. [Google Scholar] [CrossRef]
- Haddam, N.; Barth, D.; Cohen Boulakia, B. A model-free reinforcement learning approach for the energetic control of a building with non-stationary user behaviour. In Proceedings of the International Conference on Smart Grid and Smart Cities, Osaka, Japan, 18–21 August 2020. [Google Scholar]
- Park, J.Y.; Dougherty, T.; Fritz, H.; Nagy, Z. LightLearn: An adaptive and occupant centered controller for lighting based on reinforcement learning. Build. Environ. 2019, 147, 397–414. [Google Scholar] [CrossRef]
- Masson, V.; Marchadier, C.; Adolphe, L.; Aguejdad, R.; Avner, P.; Bonhomme, M.; Bretagne, G.; Briottet, X.; Bueno, B.; de Munck, C.; et al. Adapting cities to climate change: A systemic modelling approach. Urban Clim. 2014, 10 Pt 2, 407–429. [Google Scholar] [CrossRef]
- Kim, J.; Zhou, Y.; Schiavon, S.; Raftery, P.; Brager, G. Personal comfort models: Predicting individuals’ thermal preference using occupant heating and cooling behavior and machine learning. Build. Environ. 2018, 129, 96–106. [Google Scholar] [CrossRef] [Green Version]
- Alcamo, J. Environmental futures: The practice of environmental scenario analysis. In Developments in Integrated Environmental Assessment; Elsevier: Amsterdam, The Netherland, 2018; Volume 2. [Google Scholar]
- Houet, T.; Aguejdad, R.; Doukari, O.; Battaia, G.; Clarke, K. Description and validation of a “non path-dependent” model for projecting contrasting urban growth futures. Cybergeo Rev. Eur. Géographie Eur. J. Geogr. 2016, 759. [Google Scholar] [CrossRef]
- Reynolds, J.; Rezgui, Y.; Kwan, A.; Piriou, S. A Zone-Level, Building Energy Optimisation Combining an Artificial Neural Network, a Genetic Algorithm, and Model Predictive Control. Energy 2018, 151, 729–739. [Google Scholar] [CrossRef]
- RINNO Project. Available online: https://RINNO-h2020.eu/ (accessed on 13 March 2020).


| Company | Size | Type |
|---|---|---|
| A | SME | Engineering and maintenance company |
| B | SME | Software developer |
| C | SME | Engineering company |
| D | Large | Building product manufacturer |
| E | SME | Data engineering consultancy |
| F | SME | Software developer |
| G | VSE | Building product manufacturer |
| H | SME | Engineering company |
| I | VSE | Building product manufacturer |
Publisher’s Note: MDPI stays neutral with regard to jurisdictional claims in published maps and institutional affiliations. |
© 2022 by the authors. Licensee MDPI, Basel, Switzerland. This article is an open access article distributed under the terms and conditions of the Creative Commons Attribution (CC BY) license (https://creativecommons.org/licenses/by/4.0/).
Share and Cite
Doukari, O.; Seck, B.; Greenwood, D.; Feng, H.; Kassem, M. Towards an Interoperable Approach for Modelling and Managing Smart Building Data: The Case of the CESI Smart Building Demonstrator. Buildings 2022, 12, 362. https://doi.org/10.3390/buildings12030362
Doukari O, Seck B, Greenwood D, Feng H, Kassem M. Towards an Interoperable Approach for Modelling and Managing Smart Building Data: The Case of the CESI Smart Building Demonstrator. Buildings. 2022; 12(3):362. https://doi.org/10.3390/buildings12030362
Chicago/Turabian StyleDoukari, Omar, Boubacar Seck, David Greenwood, Haibo Feng, and Mohamad Kassem. 2022. "Towards an Interoperable Approach for Modelling and Managing Smart Building Data: The Case of the CESI Smart Building Demonstrator" Buildings 12, no. 3: 362. https://doi.org/10.3390/buildings12030362
APA StyleDoukari, O., Seck, B., Greenwood, D., Feng, H., & Kassem, M. (2022). Towards an Interoperable Approach for Modelling and Managing Smart Building Data: The Case of the CESI Smart Building Demonstrator. Buildings, 12(3), 362. https://doi.org/10.3390/buildings12030362