1. Introduction
Architectural acoustics is an important consideration in the overall comfort of open-plan offices. Researchers [
1,
2,
3,
4,
5,
6,
7] have made considerable effort to investigate the acoustics of open-office spaces and present potential solutions for improving their indoor environmental quality. Examples of these solutions are (1) configuring the floor plan to effectively balance and acoustically separate areas; (2) designing collaborative and transition spaces with sound-absorbing surfaces; (3) employing high-performance, noise-reducing interior partitions, and exterior facades; and (4) adding background noise control and enhancement measures for selective workstation. While these measures have proven to help achieve a comfortable indoor work environment, the lack of approaches to visualize their effectiveness have resulted in limitations of their applications in practice. This paper reports on the applicability of a novel visualization approach to aid in the interpretation and comparison of various open-office acoustic solutions from a human-centric acoustic environment perspective.
Poor acoustic indoor environments have been shown [
8,
9,
10,
11] to negatively impact the cognitive performance and well-being of occupants, thus negatively affecting their productivity. The presence of irrelevant speech from single and multi-talkers in an open-plan office, along with noise from printers, phones, and HVAC systems can lead to a reduction in the quality of the acoustic environment. However, in some cases, HVAC systems can improve the acoustic comfort in open-plan offices by providing sound masking. Yadav et al. [
12,
13] have studied the impact of both single and multi-talkers on sound pressure level and their effect on the cognitive and task performance of occupants in an open-office environment. Their studies [
13] investigated the potential benefit of the “babble effect”, acting as a sound-masking source, thus improving the acoustic comfort of the space, but its impact was found to be limited. Sound masking, which is the addition of background noise to reduce the impact of distracting sound sources, is one of the common solutions [
14,
15,
16] for improving the acoustic comfort within open-plan offices. In some instances, multiple voices in open-plan offices can be a potential source of sound masking [
17], thus improving the acoustic environment.
Acoustic comfort within an open-plan office can be characterized by the calculated distraction distance, which is based on sound transmission index (STI) measurements. This relates to speech intelligibility as a function of distance from the source. Haapakangas et al. [
18] conducted an analysis of 21 open-plan offices using surveys and room acoustic measurements of distraction distance, spatial decay of speech, speech level at 4 m from the speaker, and background noise level. Their findings showed that the perception of noise was mainly related to background speech and that an increase in distraction distance predicted an increase in disturbance by noise. The other measured quantities were not significant standalone indicators of noise disturbances. Distraction distance is an important metric in characterizing acoustic comfort. Despite the apparent benefits of visualizing distraction distance as a tool to understand and compare the acoustic environment, there is a current gap in the literature of examples suggesting visualization procedures and techniques for practical application. This limitation impacts the comparative analysis of acoustical treatment evaluations and presents barriers to employing innovative acoustic treatments to open-plan office environments.
This study investigates the utility of novel visualization and a building performance evaluation technique to document the interactional impact of acoustical comfort on the health and well-being of occupants in an open-office environment. In this study room acoustic measurements were conducted from which the distraction distance was calculated. The employee experience was captured using a comprehensive Pre-Post Occupancy Evaluation (PPOE) protocol. This paper illustrates a visualization strategy to aid in the interpretation and comparison of various open-office acoustic solutions, which is also correlated to survey responses by occupants from a human-centric acoustic environment perspective.
2. Materials and Methods
2.1. Building Design-Acoustic Comfort
2.1.1. Traditional Building
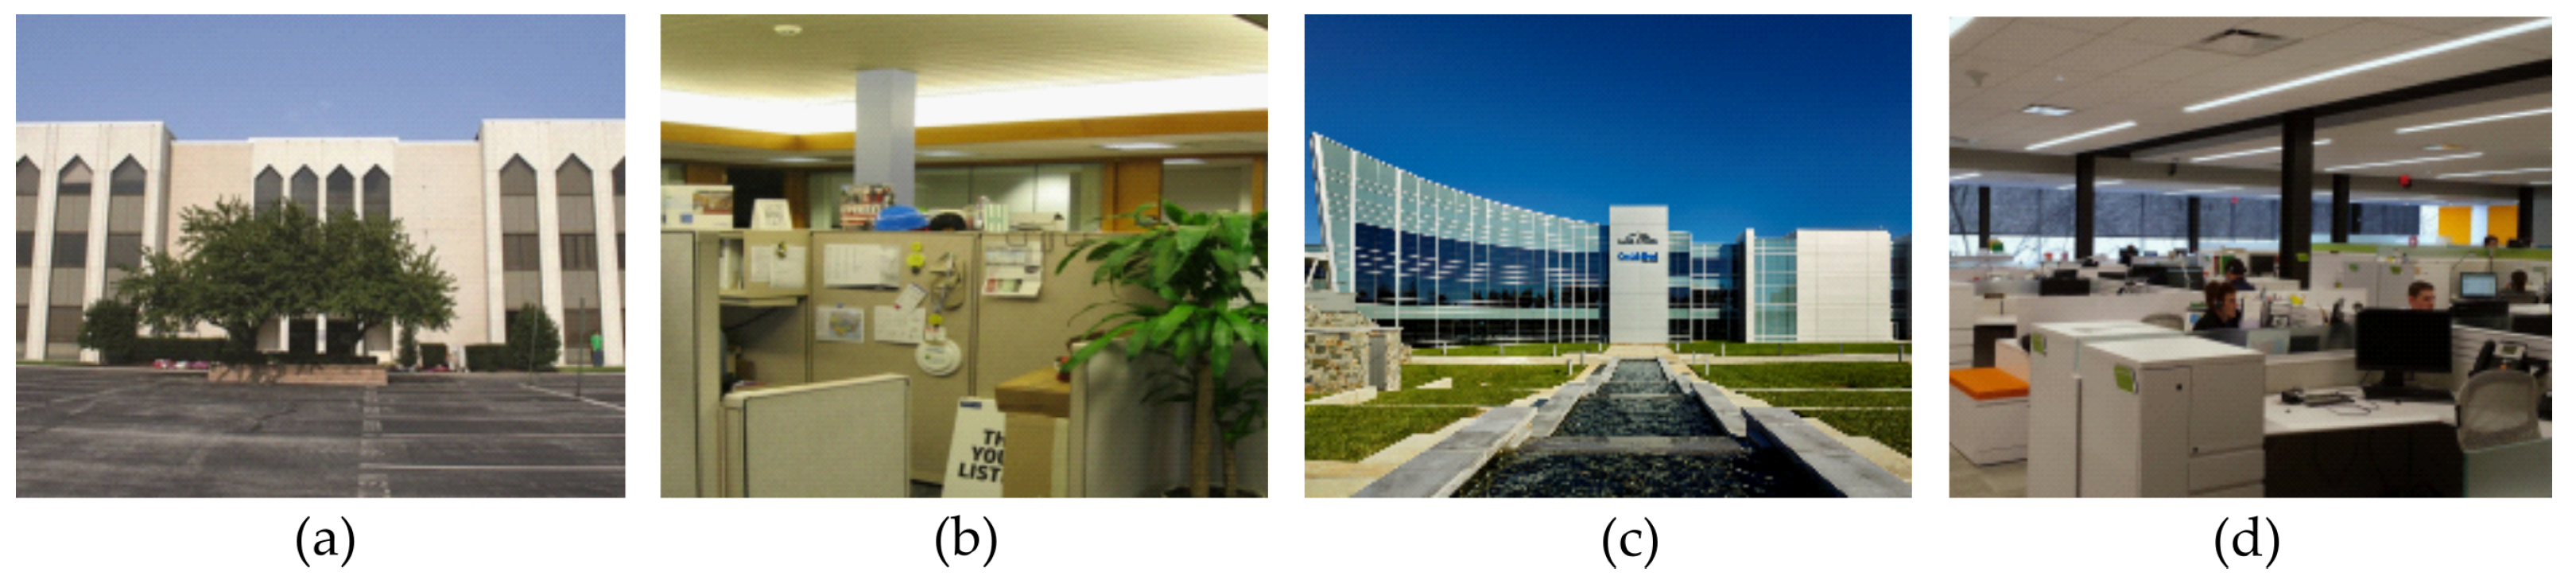
A corporate headquarters was relocated from a traditional cellular private office complex (pre-move) to a LEED platinum-certified open-concept plan office (post-move) in 2015. The traditional late 1960’s corporate campus consisted of four low-rise, multistory buildings having perimeter offices and centrally located cubicle workstations. Transparent glass and gypsum wall partitions separated the perimeter and central spaces. The building envelope consisted of a brick facade and large single-glazed fixed casement windows. Workstations were divided using 1524 mm tall fabric covered partitions. Space lighting was created using ballasted tube florescent lights integrated into the suspended acoustical ceiling. Numerous hard sound reflective surfaces were created in the open plan space by lighting fixtures, furniture, metal ceiling panels, gypsum and glass partitions. The traditional building exterior is presented in
Figure 1a along with a typical workstation in
Figure 1b.
2.1.2. LEED-Certified Platinum Building
The renovated four-story, all-glass-facade LEED platinum-certified building consisted of large, centrally located workstations with perimeter hallways and collaborative areas. Transparent glass and gypsum wall partitions separated the perimeter collaborative and central spaces. Individual workstations were separated by fabric-covered partitions with colored glazing extensions having varying heights of 1047 mm, 1448 mm, and 1625 mm. Slim profile LED luminaries with sharp cut-off angles were integrated into the suspended acoustical ceiling to provide additional space lighting. Hard reflective surfaces were limited to the perimeter of the large open-plan office space. An active sound masking system was implemented in all open-plan spaces to increase acoustic comfort at the 800 plus workstations. The LEED certified platinum building exterior is presented in
Figure 1c along with a typical workstation in
Figure 1d.
Table 1 provides a comparison of the traditional building complex and the new LEED-certified building, mainly from an acoustic surface characteristic perspective. The main differences highlighted are the office layouts, addition of collaborative areas, and perimeter hallways as opposed to perimeter offices. With this new open-office concept the addition of sound masking and ceiling tiles with higher absorption were critical to the acoustic comfort within the space.
2.2. Measurement Procedure
The acoustic comfort experienced in an open-plan office can be assessed through the measurement of acoustic parameters such as spatial decay rate of speech, speech transmission index (STI), distraction distance, privacy distance and background noise levels. STI and background noise levels were measured to evaluate the indoor environmental quality (IEQ) of the LEED platinum-certified building described in
Section 2.1.
The speech transmission index represents the transmission quality of speech with respect to intelligibility. Background noise levels represent the measured sound pressure level in absence of any occupants within the evaluated space. Both distraction and privacy distances are determined from the STI measurements and represent the distance from the speaker at which the STI falls below 0.50 and 0.20 respectively. ISO 3382-3 [
19] provides a detailed description of these acoustic parameters along with the standardized measurement procedure which was used to acquire the data presented.
Speech is essentially the modulation of a band of noise. Measurements of speech transmission index (STI) were conducted using the STIPA (STI for Public Address Systems) method [
20]. This method is an alternative to the full STI measurement, which uses a Gaussian noise signal as the carrier and is divided into seven-octave bands from 125–8000 kHz, where each band is modulated by fourteen modulation frequencies in one-third octave bands, from 0.63–12.5 Hz. This results in 98 combinations, which creates a time-consuming measurement. In the STIPA method a total of 12 modulation indices are measured from carrier frequencies in one-third octave bands ranging from 0.63 to 12.5 Hz. The modulation represents the combination of modulation and carrier frequencies used to mimic speech excitation. A Nor140 (Norsonic sound level meter) was used to measure the STI using the STIPA method at specific distances from the excitation source within the space. The sound level meter was also used to measure the background noise level at various workstations throughout the open office, in accordance with ISO 3382-3.
Workstations within the LEED-certified open office building were evaluated for the speech transmission index and background noise levels with and without sound masking. Ideally, the STI values will drop below 0.50 between 2 and 4 m. The background levels are expected to fall below a noise criteria (NC) level of 40 dB. Noise criteria are single numbers used to define goals for maximum allowable noise in a given space.
Measurements at various workstations allowed for a comprehensive acoustic comfort mapping of distraction distance from the STI. The maps can be used for quick visualization and spatial assessment of the expected acoustic comfort of the open-plan space with regard to distraction and privacy distances.
2.3. Post-Occupancy Evaluation Survey
The Space Performance Evaluation Questionnaire (SPEQTM) is an online occupant’s survey with developed categories and scales representative of the most important issues identified by occupants to impact their comfort, satisfaction, performance, and health, as perceived and experienced in their work environments. The survey semantics and linguistics have been designed based on proven language constructs that represent layperson descriptions of their physical environment. SPEQTM was cross-tested and calibrated in field and lab settings. The survey was peer-reviewed by an expert panel of 20 professional building scientists, psychologists, space planners, architects, and physicians.
The data collected by the questionnaire evaluates 30 pre- and post-occupancy issues in 76 questions classified into seven main categories. All questions contained a skip-logic approach to skip irrelevant information based on the occupant’s responses. This made the instrument more effective and reduced respondents’ fatigue. The average response time of the questionnaire is 12 min, with a minimum of 8 and a maximum of 20 min. All answers were recorded on a five-point Likert scale, semantic-differential scale, a numerical open scale, or a categorized aggregated scale. The scales allowed for continuous data that was easily analyzed using simple and more complex statistical modeling and regressions. In addition, open-ended responses were encouraged for all questionnaire categories to allow occupants to voice their opinions without restrictions. The questionnaire contained a forced response to a consent form and pre-set reminders for missed question responses. Respondents were allowed to skip questions on the second attempt for most questions, with the ability to skip demographic questions to maintain the respondent’s privacy. Neither compensation nor a fee was administered for a respondent to respond to the questionnaire. To facilitate statistical analysis, questionnaire responses were recorded into a numerical scale of one to five, such that five was “strongly agree”, three was “neutral”, and one was “strongly disagree”. Subjective responses from SPEQ
TM questions were paired with objective acoustical measurements identified in
Section 2.2 using timestamps for cross-tabulation analyses.
3. Results
The level of background noise in a space directly impacts speech intelligibility. Background noise level is governed by noise criteria (NC). For an open-office plan with forced-air distribution systems, the ASA S.12.2-2008 [
21] recommended noise criteria (NC) curve limit is NC-40 or less. At NC-40 the corresponding sound pressure level range is 46 dB
A to 48 dB
A.
Background noise levels were measured in the LEED building with and without the sound masking system turned on during occupied hours. The dots in
Figure 2 indicate locations on the third floor at which the background levels were measured. The average sound pressure levels in the north wing with and without the sound masking system turned on were 46.6 dB
A and 41.1 dB
A, respectively. The sound masking system generated white noise in the space through an evenly distributed loudspeaker system located in the ceiling plenum. This increased the average background noise to the desired level to achieve good speech privacy between workstations. In
Figure 2, the green dots indicate values that met the design criteria during occupied hours. Red dots indicate values that exceeded 48 dB
A due to conversations (red unfilled ovals highlight locations) occurring near the measurement location. However, this value was only exceeded with the noise contribution from the sound masking system.
Workstations were evaluated for spatial sound distribution of the STI to assess the distraction distance from the speaker at which the speech transmission index fell below 0.50. A comprehensive acoustic comfort mapping strategy was applied in order to fully characterize the space and provide visuals of spatial performance. STI measurements were conducted in the northeast wing of the building with and without the activation of the sound masking system. Additionally, the impact of speaker height (standing or seated) on distraction distance was assessed.
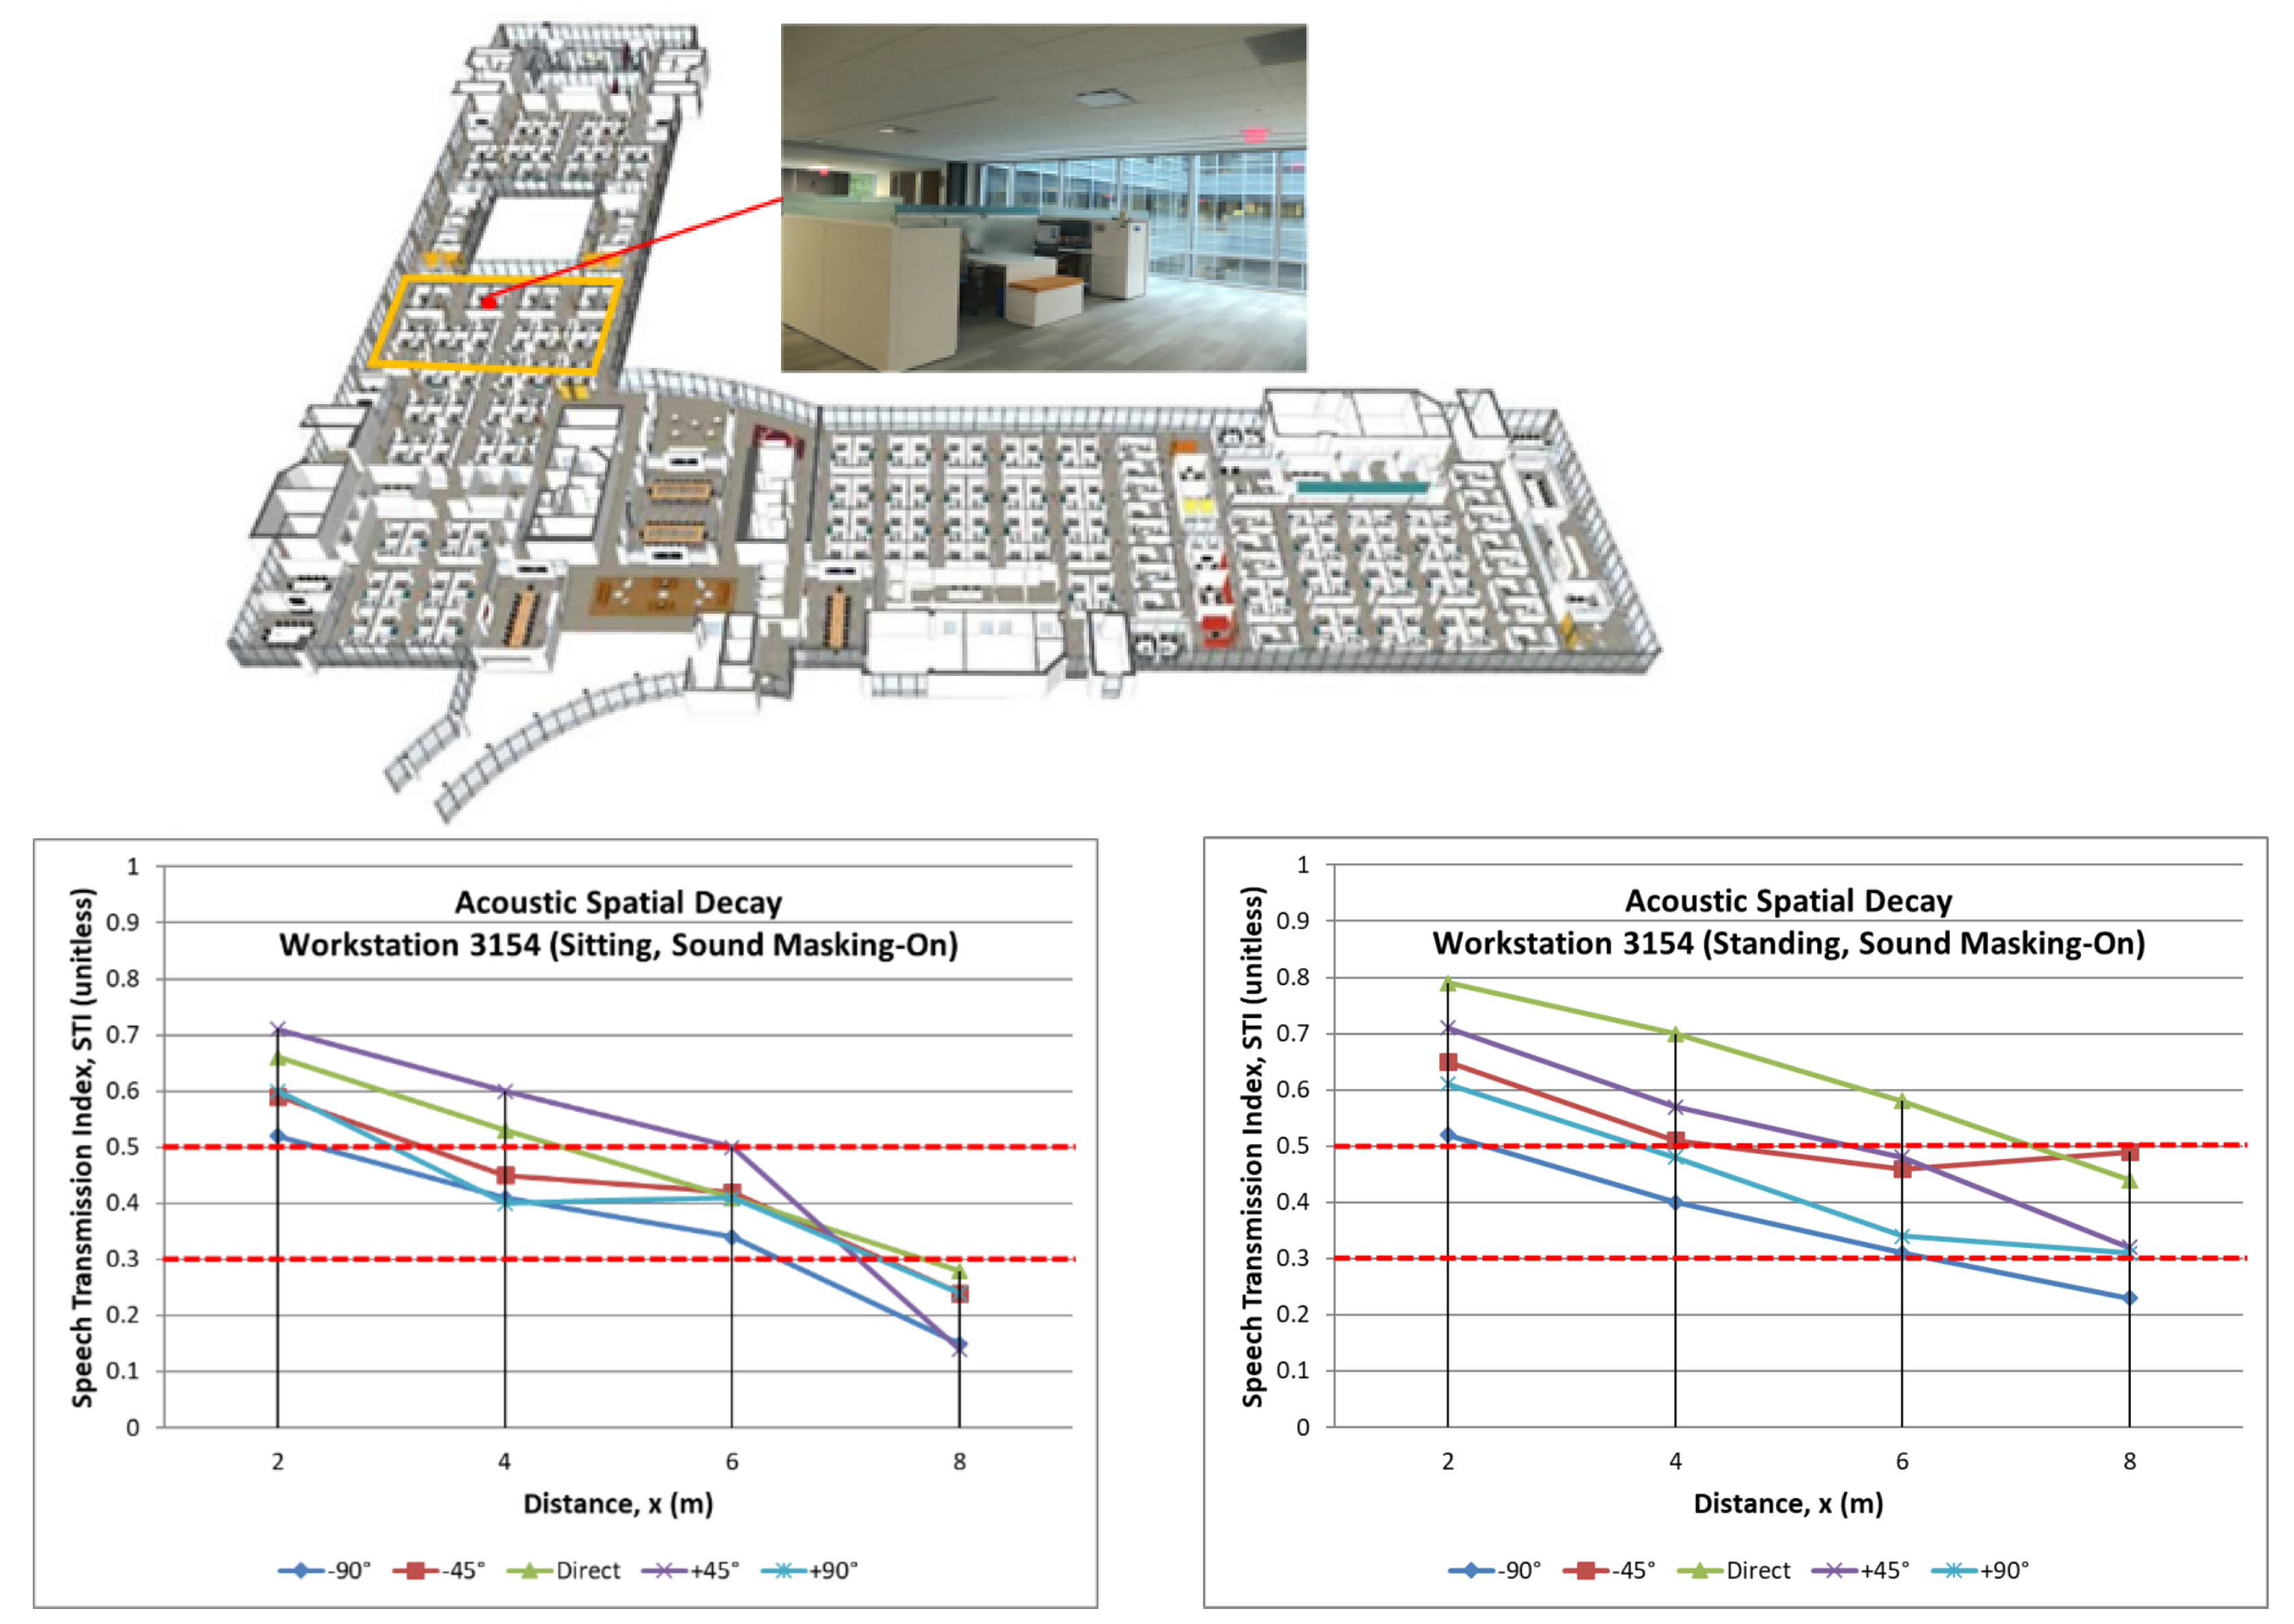
STI data is often presented in a table format or an X–Y graphical plot.
Figure 3 (WS3154) shows the location, and STI as a function of distance from the speaker at different angles. This dataset illustrates the scenario of a speaker standing versus sitting with sound masking and captures the impact on the STI. The distraction distance target (STI 0.50-0.30 at 2–4 m) was met for the 90-degree orientation with the standing speaker, and for all orientations except the direct (0-degree orientation) and a single 45-degree orientation when the speaker was seated. Given the layout of the workstations relative to the location of the speaker the differences observed with the orientation of the listener to the speaker were expected.
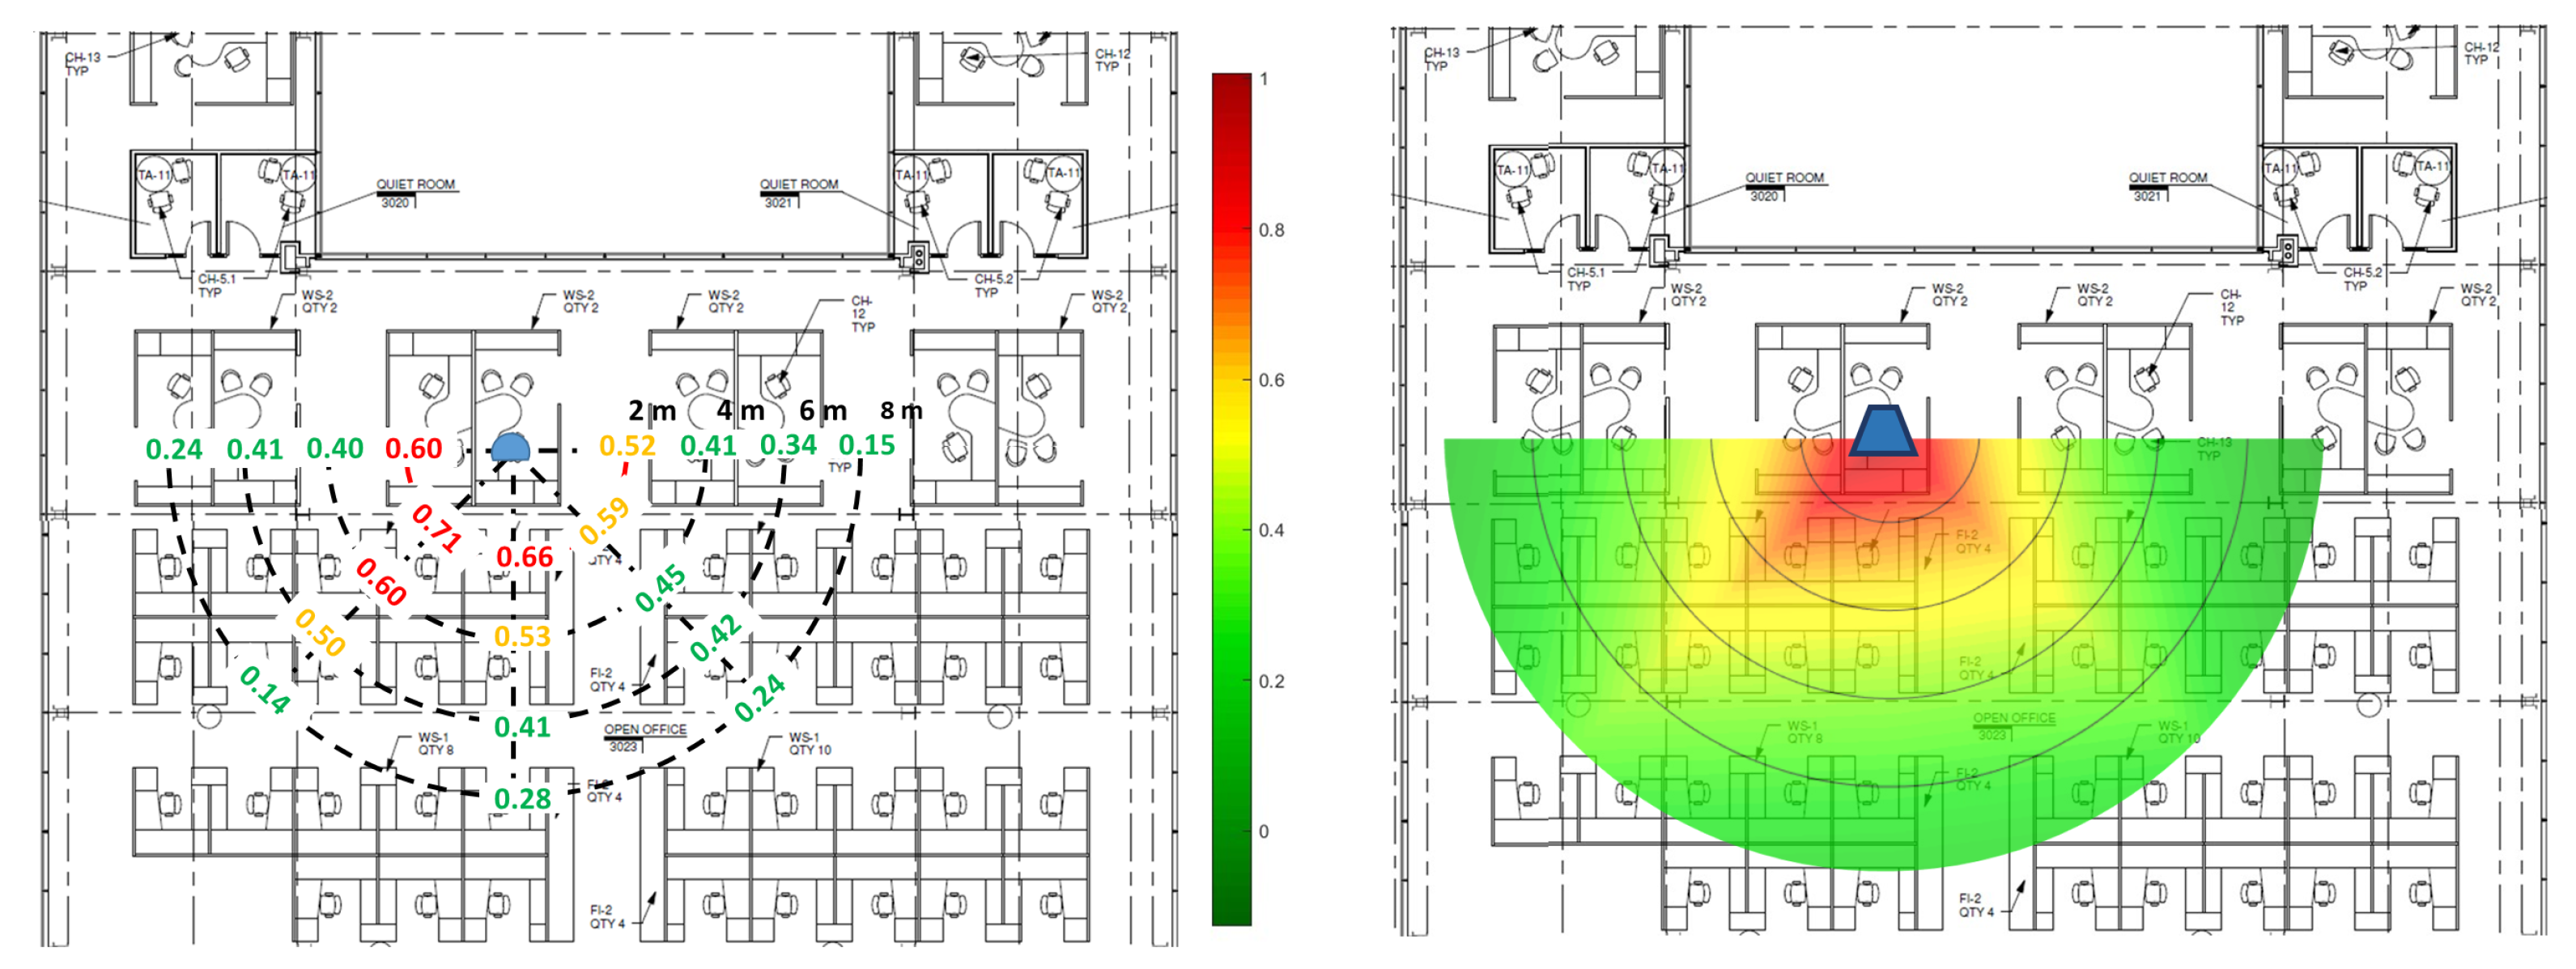
Tables and line plots have been used extensively in the presentation of STI data. The plots are easy to interpret and present the data. However, this can at times be a challenge for architects, designers, owners, and developers, who are the solution decision-makers and would prefer the most user-friendly presentation of such data. A color-coded visualization of the STI acoustic comfort mapping can provide a quick and intuitive interpretation of the overall acoustic performance of the space. Overlaying the surface plot on a scaled drawing of the space can provide additional insights under various conditions.
To convey the space performance using the approach to STI acoustic comfort mapping, concentric semicircles were placed at 2-m intervals from the simulated speaker in a sitting position (
Figure 4, left). The color map superimposed on the concentric circles convey the change in STI (
Figure 4, right), and, by extension, speech intelligibility, at distances away from the speaker. Detailed scenarios are presented in
Figure 5 which illustrate the STI measurements for standing and sitting with the sound masking system on and off. The plots, which can be interpreted relatively quickly, show the positive impact when the sound masking system is on and of the lower distraction distance (lower STI) in the seated versus standing positions.
5. Conclusions
Architectural acoustic designs for open-plan office spaces aim at reducing transmission between workstations while creating acoustical privacy within the individual workstation. This approach, however, doesn’t usually result in a pleasant or comfortable work environment due to average numerical values that do not reflect a human-centric acoustical experience for the occupants, according to their spatial locations. Through the use of sound-absorbing surfaces, high-performance, noise-reducing interior partitions, and sound-masking systems, a more spatial acoustical comfort approach is feasible. Predicting the success of this approach in the field can be challenging. The use of STI mapping and visualizations is a tool that can help predict and estimate occupants’ perceptions prior to occupancy. The procedure outlined in this paper offers a design and spatial visualization tool to help designers and building owners predict and estimate acoustical performance in spaces from the occupants’ perspective.
The results show strong correlations between improved acoustic qualities of the retrofitted, high-performance, LEED-certified building in spaces visualized within the STI standards, and overall acoustical satisfaction (
Table 2). A comparative analysis of the occupants’ attitudes and perceptions of the impact of the building on their comfort levels reveal a significant perceptual change to the impact of acoustical design on the employee overall satisfaction. A comprehensive design and employment of spatial visualization tools to predict and implement metrics of indoor environmental quality (IEQ) might result in improved comfort, satisfaction, and the perception of well-being for the occupants. It is the hope that further integration of building systems concerning IEQ measures and comfort visualizations can better predict acoustical performance in the early design stages and lead to better work environments that are more responsive to occupant’s needs and comfort expectations.


