Abstract
This study investigated the pollution caused by unregulated chemical substances in Korean residential environments. A TA tube was used for indoor air collection, and Gas Chromatography–Mass Spectrometry was used for the analysis of chemical substances. According to the results of this study, 13 substances out of the 16 analyzed chemicals were detected and, among them, the concentrations of phenol, α-pinene, and limonene within the indoor air were high. The average concentration of phenol was 32.7 µg/m3. α-pinene and limonene were detected, of which the highest concentrations were as 598.2 µg/m3 and 652.5 µg/m3, respectively. The maximum concentrations of these three substances exceeded the levels of the lowest concentration of interest. Notably, α-pinene and limonene were released from the wood itself. Wood has been widely used indoors as a natural building material and as furniture. Therefore, it was considered that this was the reason for the high the concentrations of the two substances in indoor air. However, we do not argue that the usage of wood should be reduced because of the results obtained in this study. Instead, we sµggest that it is important to reduce the emissions of α-pinene and limonene throµgh the processing of the wood, extending its drying period, and determining the most appropriate time of use.
1. Introduction
In Korea, sick house syndrome has been a significant issue since the 1990s owing to the chemical contamination of indoor air [1,2,3]. Modern-day people spend more than 90% of their time indoors, and indoor air quality can affect their health, comfort, and intellectual productivity [4,5,6]. Volatile organic compounds (VOCs) such as formaldehyde, benzene, and toluene are representative chemicals that contaminate indoor air [7,8,9,10]. Hazardous chemicals in the living environment are emitted from interior finishes, such as wallpaper, flooring, and paint, and household items, such as televisions, sofas, and closets [11,12,13]. In addition, indoor heating appliances and smoking by occupants can further deteriorate the indoor air quality [14,15,16]. As the social interest in indoor pollutants has increased, in 2003, the Ministry of Environment of Korea implemented the indoor air quality management act for new apartment complexes and, in 2005, the guidelines for indoor air quality for new apartment complexes were published [17,18]. Furthermore, the presence of a mechanical ventilation system was mandated to ensure indoor ventilation. In the case of formaldehyde, the Healthy Building Mark (HB Mark) is displayed according to the amount of emission to empower consumers or construction workers to select low-emission building materials [19]. In December 2010, the Ministry of Land, Infrastructure and Transport in Korea (2010) announced, and has since enforced, construction standards for clean and healthy houses [20]. The aim of this policy was to solve sick house syndrome. However, despite the establishment of guidelines for improving indoor air quality and new revisions of construction standards, residents have recently complained about indoor air quality. Residents are concerned about the contamination of indoor air by unregulated chemicals as the use of alternative chemicals and new building materials increases [21,22].
Therefore, this study measured the concentrations of unregulated pollutant chemicals in Korean houses to analyze new indoor pollutants that could cause sick house syndrome.
2. Method
2.1. Houses to Be Measured and Air Collection
Table 1 presents an overview of the houses to be measured. Table 2 lists the finishing materials and singularities in the houses. In this study, eleven houses were measured: seven apartment houses in Daegu, three houses for apartments in Busan, and one apartment in Andong City. The targeted houses were evaluated for indoor air quality at the request of the residents and construction companies. In Korea, for apartment houses with more than 100 households, it is required to make the results of the indoor air quality measurements known, and the construction method incorporating the HB Mark is applied only to apartment houses with more than 500 households. The A to G houses measured in Daegu are houses that are not regulated by the Korean government for the improvement of indoor air quality (non-regulated house: Non-RH). However, the four houses measured in both Busan and Andong were built using a construction method that included the indoor air quality improvement method proposed by the Korean government (regulated house: RH). In accordance with the official experimental method promulgated by the South Korean Ministry of Environment (2003), the indoor air quality for each house was measured [17]. Before collecting indoor air, all doors and windows contacted with the outside air were opened. In addition, all internal doors and furniture doors were opened, and the house was left to ventilate for 30 min. Thereafter, all the windows and doors connected to the outside were closed, while the furniture doors and the lower kitchen sink cupboards were left open. The house was left in this state for 5 h. During this 5 h period in which the house was sealed, indoor air was sampled for 30 min under this condition. The air-sampling pump used was a SIBATA (Japan) MP-Σ30H. The VOCs were sampled using a Tenax TA tube. The indoor air sampling was performed at the center of the room, 1.2 m from the floor. A travel blank (TB) was used to confirm the contamination of the sampler.

Table 1.
The overview of the houses.
Table 2.
Finishing materials and singularities in the house.
2.2. Measured Substances
Saito reported on the frequency and concentrations of unregulated chemicals in houses, and mentioned that some chemicals are associated with sick house syndrome [21,22]. Therefore, in this study, we decided to select and measure chemicals with high detection frequencies and high concentrations that were mentioned in previous studies. In this study, 16 chemicals were analyzed. A Tenax TA tube containing an adsorbent was used to collect the air in the room. The chemical analysis system consists of an Automatic Thermal Desorption (ATD) mechanism that heats the TA tube, and a Gas Chromatography–Mass Spectrometer (GC/MS) for the qualitative and quantitative analysis of chemicals. The ATD device desorbs the chemicals collected in the TA tube, and the desorbed chemicals are injected into the column. Depending on the temperature of the GC oven and the kinds of column, each chemical is separated, enabling the qualitative analysis of the chemical.
The temperature range of the GC oven is from 35 to 250 °C. The temperature change of the GC oven is increased by 15 °C per minute from 35 °C to 95 °C; by 2.5 °C per minute from 95 °C to 105 °C; and by 5 °C per minute from 105 °C to 250 °C. The column selectively delays each chemical and separates it according to the difference in arrival time to the detector. The column used in this study was HP-VOC 60 m × 0.32 mm, df = 1.8 μm. The change in the GC oven temperature served to separate the mixed chemicals inside the column. The detection limit was <5 ng. Table 3 shows the conditions of the GC/MS analysis.
Table 3.
The conditions of GC/MS.
3. Results
3.1. Concentration of Unregulated Chemicals
Figure 1 show the concentrations of chemical substances measured in the air. In this study, the concentration range of acetone in the air was 31.0–83.4 µg/m3 and the average value was 58.8 µg/m3. The average concentration of 2-butanone was 279.4 µg/m3 and the highest concentration was 402.5 µg/m3, which was found in House B in Daegu. The concentration of 2-ethyl-1-hexanol was in the range of 15.3–163.5 µg/m3 and the results demonstrated that the concentration of this material differed significantly depending on the housing. The average concentration of 2-ethyl-1-hexanol was 128.8 µg/m3. The concentrations of Texanol and TXIB within the indoor air were 1.1–1.8 µg/m3 and <1.0 µg/m3, respectively, which were low. The concentration of 2-(2-butoxyethoxy) ethanol was in the range of 2.0–6.1 µg/m3 and its average concentration was 3.9 µg/m3. The average concentration of phenol was 32.7 µg/m3 and it ranged from 7.9 to 50.2 µg/m3, showing differences in concentration depending on the housing. The concentration of α-pinene in terpenes was in the range of 16.4–598.2 µg/m3 and the D house in Daegu had the highest concentration. The average concentration of α-pinene was 317.2 µg/m3. The average concentration of limonene was 414.1 µg/m3 and the range was 120.4–652.5 µg/m3. The concentration of camphene among terpenes was in the range of 1.1–4.2 µg/m3 and its average concentration was 2.5 µg/m3. Notably, the concentration of 3-caren was found to be at a very low concentration of <1.0 µg/m3. The concentration of dichloromethane was detected in the range of 8.7–67.2 µg/m3 and its average concentration was 3.1 µg/m3. The results showed that the concentration of methylcyclohexane was in the range of 8.78–67.2 µg/m3 and its average concentration was 45.9 µg/m3. The concentration of tridecane was in the range of 1.2–6.1 µg/m3 and its average concentration was 4.2 µg/m3. Lastly, the concentration of 1,2,4-trimethylbenzene was in the range of 1.4–4.6 µg/m3 and its average concentration was 2.9 µg/m3. The concentration of p-cymene was <1.0 µg/m3.
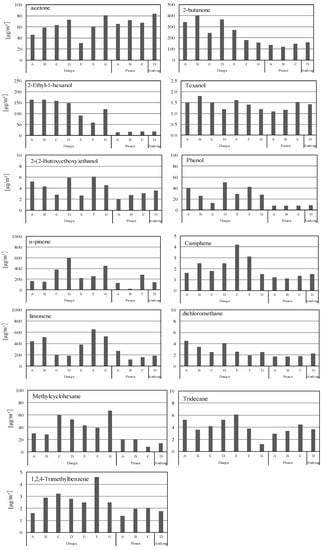
Figure 1.
The concentrations of chemical substances measured in the air.
3.2. Indoor Air Quality Evaluation
Table 4 presents a comparison between the measurement results and the lowest concentration of interest (LCI). The LCIs within indoor air were determined in a European theoretical R&D cooperation [23]. The LCI value is defined as the minimum concentration that irritates organs such as the skin and eyes in humans. Because the unregulated chemical substances measured in this study do not have guidelines for indoor air quality, the measurement results of this study were compared with the LCI values. Among the 16 chemicals measured in this study, the substances exceeding the LCI value were phenol, α-pinene, and limonene. The average concentration of phenol was 1.637 times its LCI, and the maximum concentration of phenol was measured to be 2.510 times higher than its LCI. The maximum concentration of α-pinene and limonene were 2.39 and 2.18 times higher than their LCIs, respectively. The average concentration of α-pinene and limonene were 1.269 and 1.380 times higher than their LCIs, respectively. In contrast, the maximum concentrations of other chemicals were assessed to be 0.01–0.4 times lower than their LCIs. The maximum concentration of Texanol, TXIB, 3-caren, di-chloromethane, methylcyclohexane, tridecane, and p-cymene were found to be 0.008 times their LCI concentrations.
Table 4.
Comparison between measurement results and LCI (lowest concentration of interest).
4. Discussion
According to the results of this study, 13 of the 16 chemicals analyzed were detected. The chemicals that exceeded their LCI levels were phenol, α-pinene, and limonene.
Phenol is widely used in many industries for various purposes. Phenol is a commonly used disinfectant and has been proven to be an effective antibacterial, antifungal, and antiviral substance. In addition, it is also used in the wood industry as a preservative to protect the wood from infestations of microorganisms such as bacteria and mold [27,28]. Phenol is produced during the thermal decomposition of organic substances. Thus, it is a constituent of motor vehicle exhaust gases, wood smoke, cigarette smoke, and smoked foods. In the general human, approximately two-thirds of phenol intake may be from air exposure [29].
According to the results of this study, phenol concentration in the air was high in the houses measured in the Daegu area. What is important to note is that within the houses in Daegu, the sinks, tables, and furniture were made of synthetic wood. Althoµgh formalin was widely used as an antimicrobial agent in wood building finishes and wooden furniture, its use declined after formaldehyde was included in air quality guidelines. Therefore, it is considered that phenol is likely to be used as a substitute for formalin. In the houses measured in the Daegu area, it was not considered that phenol was generated from the activities of daily life, such as cooking, because the residents have not yet moved in.
It is well known that α-pinene and limonene are substances that are emitted from wood [30]. In this study, α-pinene and limonene were detected at high concentrations. These two chemicals belong to the class of terpenes and have been reported to cause eye irritation and respiratory problems [31,32]. For α-pinene, 4 out of 11 houses exceeded the LCI values and for limonene, 5 out of 11 houses exceeded the LCI values. In particular, the concentrations of α-pinene and limonene were found to be high in houses using synthetic wood furniture. However, the concentrations from houses with wooden furniture and wooden flooring did not exceed the LCI levels. The most probable reason for this is that the houses in Busan and Andong that had wooden furniture have been around for more than two years from the date of construction, and the furniture was also purchased more than two years ago. However, about a year has passed since the construction of the houses in the Daegu area and the residents have not moved in.
Approximately 20 years have passed since the Korean government promulgated the indoor air quality guidelines to improve indoor air quality. Recently, the concentration of VOCs, such as formaldehyde, toluene, styrene, and benzene, within the air in the general residential environment was found to be remarkably low. However, as the use of alternative chemicals and vinyl chloride-based interior finishing materials has increased, indoor contamination of unregulated chemicals has become a concern.
In particular, phthalate is a representative contaminant of plastics, as they are the plasticizers used in plastic products [33,34]. The plasticizer emitted from the interior finishing material attaches to household dust and interior surfaces, and it is reportedly related to atopic dermatitis and asthma in children [35,36,37].
Therefore, in recent years, there has been a trend in the use of synthetic wood and wood as interior finishing materials to reduce the amount of plastic products used indoors. The same is also true for furniture. This study showed that the α-pinene and limonene emitted from wood were measured at high concentrations indoors. In spite of this, the amount of wood used indoors has been increased in the construction market.
This does not sµggest that we should reduce the amount of wood used indoors; instead, we propose using wood more safely indoors. As shown in this study, even if the floor finishing material is wood and the furniture is made of wood, the air concentrations of α-pinene and limonene are sometimes measured as low. This result is thoµght to be related to the construction period and the period of use of the furniture. If the processing and drying period of wood are adjusted, the amount of terpenes emitted from the wood can be reduced [38] and, even if the amount of wood used indoors increases, the air quality will not be greatly affected.
5. Conclusions
This study evaluated the contamination of unregulated chemicals in Korean houses. Of the 16 analyzed chemicals, 13 unregulated chemicals were detected. Among them, the average concentrations of phenol (32.7 µg/m3), α-pinene (317.2 µg/m3), and limonene (414.1 µg/m3) were higher than their LCI concentrations, and the maximum concentrations of chemicals were found to be more than twice their LCI levels. According to this study, these chemicals should be noted as new pollutants present in the air within a house. However, althoµgh α-pinene and limonene are emitted from wood, there is no need to limit the use of wood indoors. Instead, this study sµggests reducing the amount of chemical substances emitted from wood throµgh the processing method and drying period of the wood, which would be the ways to use wood more safely indoors.
Author Contributions
The three authors contributed equally to this research. Conceptualization, H.K. and T.K.; methodology, H.K., T.K. and S.L.; validation, T.K. and S.L.; Analysis, H.K.; investigation, T.K.; data curation, T.K. and S.L.; writing—original draft preparation, H.K.; writing—review and editing, T.K.; visualization, S.L.; project administration, H.K.; funding acquisition, H.K. All authors have read and agreed to the published version of the manuscript.
Funding
This research was funded by KAKENHI, Grant-in-Aid for Scientific Research(C)20K04809.
Institutional Review Board Statement
Not applicable.
Informed Consent Statement
Not applicable.
Data Availability Statement
The data presented in this study are available on request from the corresponding author.
Acknowledgments
Thanks to the people who participated in the measurement. Additionally, I would like to express my gratitude to H.Tanaka of MC Evolve Technologies Corporation, who analyzed the chemical substances.
Conflicts of Interest
The authors declare no conflict of interest.
References
- Molhave, L. Volatile organic compounds, indoor air quality and health. Indoor Air 1991, 1, 357–376. [Google Scholar] [CrossRef]
- Lee, Y.; Kim, C. A Field Survey on Indoor Air Quality of the Existing Apartment House. J. Archit. Inst. Korea Plan. Des. 2004, 20, 327–334. [Google Scholar]
- Yu, H.; Park, J.; Rhee, E. A Study on the Emission Characteristic of Formaldehyde and TVOC from Indoor Finishing Materials. J. Archit. Inst. Korea Plan. Des. 2005, 21, 141–149. [Google Scholar]
- Klepeis, N.E.; Nelson, W.C.; Ott, W.R.; Robinson, J.P.; Tsang, A.M.; Switzer, P.; Behar, J.V.; Hern, S.C.; Engelmann, W.H. The national human activity pattern survey (NHAPS): A resource for assessing exposure to environmental pollutants. J. Expo. Sci. Environ. Epidemiol. 2001, 11, 231–252. [Google Scholar] [CrossRef] [PubMed] [Green Version]
- Salthammer, T.; Mentese, S.; Marutzky, R. Formaldehyde in the indoor environment. Chem. Rev. 2010, 110, 2536–2572. [Google Scholar] [CrossRef] [PubMed]
- Wolkoff, P.; Nielsen, G.D. Organic compounds in indoor air e their relevance for perceived indoor air quality? Atmos. Environ. 2010, 35, 4407–4417. [Google Scholar] [CrossRef]
- Zhu, J.P.; Newhook, R.; Marro, L.; Chan, C.C. Selected volatile organic compounds in residential air in the city of Ottawa, Canada. Environ. Sci. Technol. 2005, 39, 3964–3971. [Google Scholar] [CrossRef]
- Park, J.S.; Ikeda, K. Exposure to mixtures of organic compounds in homes in Japan. Indoor Air 2004, 14, 413–420. [Google Scholar] [CrossRef]
- Lai, H.K.; Kendall, M.; Ferrier, H.; Lindup, I.; Alm, S.; Hanninen, O.; Jantunen, M.; Mathys, P.; Colvile, R.; Ashmore, M.R.; et al. Personal exposures and microenvironment concentration of PM2.5, VOC, NO2 and CO in Oxford UK. Atmos. Environ. 2004, 38, 6399–6410. [Google Scholar] [CrossRef]
- Kim, Y.M.; Harrad, S.; Harrison, R.M. Concentration and sources of VOCs in urban domestic and public microenvironments. Environ. Sci. Technol. 2001, 35, 997–1004. [Google Scholar] [CrossRef]
- Guo, H.; Murray, F.; Wilkinson, S. Evaluation of total volatile organic compounds emissions form adhesives based on chamber test. J. Air Waste Manag. Assoc. 2000, 50, 199–206. [Google Scholar] [CrossRef] [PubMed] [Green Version]
- Plaisance, H.; Blondel, A.; Desauziers, V.; Mcho, P. Hierarchical cluster analysis of carbonyl compounds emission profiles from building and furnitrur materials. Build. Environ. 2014, 75, 40–45. [Google Scholar] [CrossRef]
- Ye, W.; Little, J.C.; Won, D.Y.; Zhang, X. Screening-level estimates of indoor exposure to volatile organic compounds emitted form building materials. Build. Environ. 2014, 75, 58–66. [Google Scholar] [CrossRef]
- Gou, H.; Kwok, N.H.; Cheng, H.R.; Lee, S.C.; Hung, W.T.; Li, Y.S. Formaldehyde and volatile organic compounds in Hong Kong homes: Concentration and impact factors. Indoor Air 2009, 19, 206–217. [Google Scholar]
- Garrett, M.H.; Hooper, M.A.; Hooper, B.M. Formaldehyde in Australian homes: Levels and sources. Clean Air Environ. Qual. 1997, 31, 28–32. [Google Scholar]
- Edwards, R.D.; Jurvelin, J.; Saarela, K.; Jantunen, M. VOC concentrations measured in personal samples and residential indoor, outdoor and work place microenvironments in EXPLIS-Helsinki, Finland. Atmos. Environ. 2001, 35, 4531–4543. [Google Scholar] [CrossRef]
- Ministry Environment, Korea: Indoor Air Quality Management Act. 2003. Available online: http://me.go.kr/home/web/main.do (accessed on 5 May 2018).
- Ministry Environment, Korea: Indoor Air Quality Management Act (Revised Version). 2005. Available online: http://www.Kaca.or.kr/ (accessed on 5 May 2018).
- Healthy Building Material, Korea Air Cleaning Association, Korea. 2005. Available online: http://www.Kaca.or.kr/ (accessed on 5 May 2018).
- Ministry of Land, Infrastructure and Transport, Korea. 2010. Available online: http://www.molit.go.kr/ (accessed on 10 July 2018).
- Saito, I.; Onuki, A.; Todaka, E.; Nakaoka, H.; Hosaka, M.; Ogata, A. Recent trends in indoor air pollution: Health risks from unregulated chemicals. Jpn. J. Risk Anal. 2011, 21, 91–100. [Google Scholar]
- Onuki, A.; Saito, I.; Tada, T.; Fukuda, M.; Kurita, M.; Ogata, A. Trends in Indoor Air Chemicals Detected at High Concentrations in Newly Built Houses. Ann. Rep. Tokyo Metr. Inst. Public Health 2009, 60, 245–251. [Google Scholar]
- Europen Collaborative Action (ECA). Urban Air, Indoor Environment and Human Exposure, Harmonisation Framework for Health Based Evaluation of Indoor Emissions from Construction Products in the European Union Using the EU-LCI Concept; Report No. 29; Publications Office of the European Union: Luxembourg City, Luxembourg, 2013.
- Danish Environmental Protection Agency. Survey of Chemical Compounds in Consumer Products, Survey no. 36, Survey, Emission and Evaluation of Volatile Organic Chemicals in Printed Matter. 2003. Available online: https://eng.mst.dk/media/mst/69119/36.pdf#search=%27Danish+Environmental+Protection+Agency+%282003%29+Svey+of+chemical+compounds+in+consumer+products%2C+Survey+no.+36%2C+Survey%2C+emission+and+evaluation+of+volatile+organic+chemicals+in+printed+matter.%27 (accessed on 9 May 2019).
- Hensen, L.; Larsen, A.; Molhave, L.; Hansen, M.K.; Kundsen, B. Health evaluation of volatile organic compound (VOC) emissions from wood and wood-based materials. Arch. Environ. Health 2001, 56, 419–432. [Google Scholar]
- AgBB. Ausschuss zur Gesundheitlichen Bewertung voc Bauproduckten (Committee for Health-Related Evaluation of Building Products), Updated List of LCI Values 2015 in Part 3. 2015. Available online: https://www.umweltbundesamt.de/sites/default/files/medien/355/dokumente/agbb_evaluation_scheme_2015.pdf (accessed on 9 May 2019).
- Uses of Phenol. Available online: https://www.vedantu.com/chemistry/uses-of-phenol (accessed on 9 December 2021).
- Nielsen, G.D.; Hansen, L.F.; Nexø, B.A.; Poulsen, O.M. Indoor Air Guideline Levels for Phenol and Butylated Hydroxytoluene (BHT). Indoor Air 1998, 5, 25–36. [Google Scholar] [CrossRef]
- WHO. Phenol. In International Programme on Chemical Safety (Environmental Health Criteria 161); World Health Organization: Geneva, Switzerland, 1994. [Google Scholar]
- Tohmura, S.; Miyamoto, K.; Inoue, A.; Chiba, Y. Measurement of volatile organic compounds emissions from laminas for the glue-laminated timber and domestic solid wood stored long term. Bull. FFPRI 2005, 4, 145–155. (In Japanese) [Google Scholar]
- Molhave, L.; Kjaergaard, S.K.; Hempel-jorgensen, A.; Juto, J.E.; Andersson, K.; Stridh, G.; Falk, J. The Eye Irritation and Odor Potencies of Four Terpenes which are Major Constituents of the Emissions of VOCs from Nordic SoftWoods. Indoor Air 2000, 10, 315–318. [Google Scholar] [CrossRef]
- Filipsson, A.F. Short term inhalation exposure to turpentine: Toxicokinetics and acute effects in men. Occup. Environ. Med. 1996, 53, 100–105. [Google Scholar] [CrossRef] [PubMed] [Green Version]
- Abb, M.; Heinrich, T.; Sorkau, E.; Lorenz, W. Phthalates in house dust. Environ. Int. 2009, 35, 965–970. [Google Scholar] [CrossRef]
- Becker, K.; Seiwert, M.; Angerer, J.; Heger, W.; Koch, H.M.; Nagorka, R.; Rosskamp, E.; Schluter, C.; Seifert, B.; Ullrich, D. DEHP metabolites in urine of children and DEHP in house dust. Int. J. Hyg. Environ. Health 2004, 207, 409–417. [Google Scholar] [CrossRef] [PubMed]
- Bergh, C.; Torgrip, R.; Emenius, G.; Östman, C. Organophosphate and phthalate esters in air and settled dust—A multi-location indoor study. Indoor Air 2010, 21, 67–76. [Google Scholar] [CrossRef] [PubMed]
- Bonvallot, N.; Mandin, C.; Mercier, F.; Le Bot, B.; Glorennec, P. Health ranking of ingested semi-volatile organic compounds in house dust. Indoor Air 2010, 20, 458–472. [Google Scholar] [CrossRef]
- Mínguez, R.; Montero, J.M.; Fernández-Avilés, G. Measuring the impact of pollution on property prices in Madrid: Objective versus subjective pollution indicators in spatial models. J. Geogr. Syst. 2013, 15, 169–191. [Google Scholar] [CrossRef]
- Eri, M. Temporal changes in volatile compounds in the indoor air of a laboratory finished with Cryptomeria japonica interior materials. Bull. FFPRI 2019, 18, 15–25. [Google Scholar]

Publisher’s Note: MDPI stays neutral with regard to jurisdictional claims in published maps and institutional affiliations. |
© 2022 by the authors. Licensee MDPI, Basel, Switzerland. This article is an open access article distributed under the terms and conditions of the Creative Commons Attribution (CC BY) license (https://creativecommons.org/licenses/by/4.0/).