Article

Ventilation Strategies for Mitigation of Infection Disease Transmission in an Indoor Environment: A Case Study in Office

1
School of Architecture, Southeast University, 2 Sipailou, Nanjing 210096, China
2
Global Centre for Clean Air Research, Department of Civil and Environmental Engineering, Faculty of Engineering and Physical Sciences, University of Surrey, Guildford GU2 7XH, UK
*
Author to whom correspondence should be addressed.
Buildings 2022, 12(2), 180; https://doi.org/10.3390/buildings12020180
Submission received: 31 December 2021 / Revised: 1 February 2022 / Accepted: 2 February 2022 / Published: 4 February 2022

Abstract

:
During the normalization phase of the COVID-19 epidemic, society has gradually reverted to using building space, especially for public buildings, e.g., offices. Prevention of airborne pollutants has emerged as a major challenge. Ventilation strategies can contribute to mitigating the spread of airborne disease in an indoor environment, including increasing supply air rate, modifying ventilation mode, etc. The larger ventilation rate can inevitably lead to high energy consumption, which may be also ineffective in reducing infection risk. As a critical factor affecting the spread of viral contaminant, the potential of ventilation modes for control of COVID-19 should be explored. This study compared several ventilation strategies in the office, including mixing ventilation (MV), zone ventilation (ZV), stratum ventilation (SV) and displacement ventilation (DV), through analyzing ventilation performance and infection risk for the optimal one. By using ANSYS Fluent, the distributions of airflow and pollutant were simulated under various ventilation modes and infected occupants. The SV showed greater performance in mitigating infection disease spread than MV, ZV and DV, with an air distribution performance index (ADPI) of 90.5% and minimum infection risk of 13%. This work can provide a reference for development of ventilation strategies in public space oriented the prevention of COVID-19.

1. Introduction

Coronavirus disease 2019 (COVID-19) manifested as a worldwide pandemic, leading to a global issue of the transmission mitigation of severe acute respiratory syndrome coronavirus 2 (SARS-CoV-2) [1]. The World Health Organization (WHO) has reported that the main interpersonal transmission modes of SARS-CoV-2 include direct contact transmission and droplet transmission [2]. Studies have also shown that the aerosol transmission route cannot be ignored, i.e., small-sized droplet nuclei (carrying the virus) from breathing, coughing or sneezing become suspended aerosols, further traveling along with the air and resulting in human infection [3,4,5]. There is growing evidence that SARS-CoV-2 has the potential for airborne transmission [6,7]. Interventions such as using physical barrier [8] and air filtration system [9,10] can be favorable to the removal of airborne contaminants, which is dependent on the efficient ventilation. In this context, an indoor ventilation system will play an important role in airborne transmission control of COVID-19 during the normalization phase of the epidemic [11].
Ventilation is a significant strategy to remove indoor contaminant (e.g., virus) and decrease the exposure risk, especially in public spaces such as offices [12]. A study by Li et al. demonstrated that the ventilation rate and airflow pattern are strongly associated with the spread of airborne infectious diseases [13]. Insufficient ventilation in an indoor room can increase the risk of infection, such as the outbreak occurring on the Diamond Princess Cruise ship in Japan, which is a highly enclosed venue [14]. The Centers for Disease Control and Prevention (CDC) [15] and the American Society of Heating, Refrigerating and Air conditioning Engineer (ASHRAE) [16] have published the strategies for air conditioning systems to increase the ventilation rate during the COVID-19 epidemic. The Federation of European Heating, Ventilation and Air Conditioning Associations (REHVA) provided suggestions for an increased ventilation rate in specific scenarios, especially in the occupant active zone [17]. All these strategies provide important guidance for ventilation systems to mitigate the airborne transmission. However, increasing the ventilation rate will also lead to an increase in energy consumption for ventilation [18]. Dai et al. showed that to ensure a probability of infection less than 1% within 0.25 h, the ventilation rate should meet 100–350 m3 per hour for each person in a confined space, resulting in at least two times the rate of energy consumption compared to using the minimum ventilation rate [19]. It is important to note that the air conditioning systems in most cases have been designed or are in operation. Reusing the building cannot require all the existing ventilation systems to provide sufficient ventilation volume to ensure a safe indoor environment [20]. Therefore, improving ventilation efficiency is critical in the face of large ventilation demand [21]. From the perspective of airflow pattern, the development of efficient ventilation systems and ventilation modes can contribute to mitigating the transmission of infectious disease and improving the energy saving efficiency [22].
The reasonable usage of natural ventilation and mechanical ventilation is suggested during the normalization phase of COVID-19, such as in offices and classrooms [23,24,25]. Natural ventilation possesses the advantage of energy efficiency, through bringing outdoor air to an indoor room based on thermal pressure or wind pressure [26]. Previous studies pointed out that the uncertainties of outdoor weather conditions (e.g., wind speed, temperature, etc.) potentially lead to the unpredictability of infection probability under the effect of natural ventilation [27,28,29]. The modification of window opening modes may also fail to meet the minimum ventilation requirement, 30 m3/h per person [30]. As a commonly used mechanical ventilation mode, mixing ventilation (MV) can achieve the dilution of virus by fully mixing with the air, as shown in Figure 1. However, at a low supply airflow rate, the mixing effect may diffuse the virus pollutants produced by the infected occupant, further yielding severe problems such as local accumulation of contamination and cross-infection of personnel [31]. For example, a serious COVID-19 cluster infection incident occurred in a restaurant with a MV system in the Guangdong Province of China in 2020 [32].
To address the issue of increased infection risk induced by traditional ventilation modes, the development of novel ventilation modes appears to be a potential, mainly including displacement ventilation (DV), stratum ventilation (SV), zone ventilation (ZV), etc. (as shown in Figure 1) [33]. Based on the principle of displacing contaminated indoor air with fresh air from outside, DV can provide an advantage in reducing pollutant concentration and energy saving [34]. Luo et al. carried out a full-scale experiment to investigate the influence of the inlet/outlet arrangement of DV system on the performance of energy savings, which has been achieved by 47.7–65.9%. Kang et al. [35] used a RNG k-ɛ turbulent model to compare the dispersion of droplets from human coughing between MV and DV. The results showed that the DV strategy was more effective in removing droplets from an indoor room and lowering the infection risk. SV is able to deliver air directly to the breathing zone at a larger supply air rate through the inlets installed on the side wall [36]. The experiment conducted by Tian et al. [37] showed that SV removed the contaminants effectively to maintain good inhaled air quality, which was superior to the MV system. The simulation work by Li et al. [38] and Lu et al. [39] both illustrated that SV can significantly reduce the concentration of contaminants in the breathing region, and effectively decrease the risk of airborne transmission. The principle of ZV is to divide the indoor zone into subzones using vertical jets, which can be favorable to separate contaminated regions from susceptible ones and diminish the exposure risk to viral pollutants [40]. Through the experimental study, Cao et al. reported that the utilization of ZV could decrease the infection risk by about 40% when compared to MV [41].
By using an optimization design of airflow patterns while providing the sufficient ventilation rate, the abovementioned ventilation strategies aim to enhance the ventilation efficiency in the room, especially in the breathing regions of occupants. However, these ventilation modes have remained in the development stage with some challenges that still need to be discussed. (i) One ventilation mode may not be suitable for all scenarios. It is important to analyze the effect of various ventilation modes on the diffusion of pollutant in a real case. (ii) Although these advanced ventilation modes can improve local ventilation efficiency, a risk of accelerating the spatial spread of contaminants (e.g., viruses) may also exist in the room. An in-depth study of the overall performance of different ventilation modes is needed. (iii) The current design rules for indoor ventilation strategy do not take into account the airflow patterns of various ventilation modes in detail. It is urgent to quantify the performance of airflow distribution in addition to ventilation rate. Based on the effective prevention of COVID-19 using physical barrier in our previous work [8], this study aimed to further compare the ventilation efficiency between conventional and advanced ventilation strategies in a full-scale office room. On the basis of spatial distribution of pollutants, the infection risk under different ventilation modes and various scenarios of infected occupants was analyzed for the optimal ventilation mode. This work will provide a practical reference for the optimal design and evaluation of ventilation strategies towards the effective mitigation of infectious disease transmission.

2. Materials and Methods

This study mainly used the numerical simulation method based on the software of ANSYS Fluent 16.0 to analyze the infection risk in a large office room, under different scenarios of ventilation modes and infected occupants. The airflow field and spatial distribution of pollutant (e.g., virus) were predicted by the Navier–Stokes equation and scalar transport equation, respectively. On the basis of simulation results of pollutant concentration, the infection probability of occupants in the office was evaluated with a modified Wells–Riley equation to further investigate the impact of ventilation modes on decreasing the infection risk.

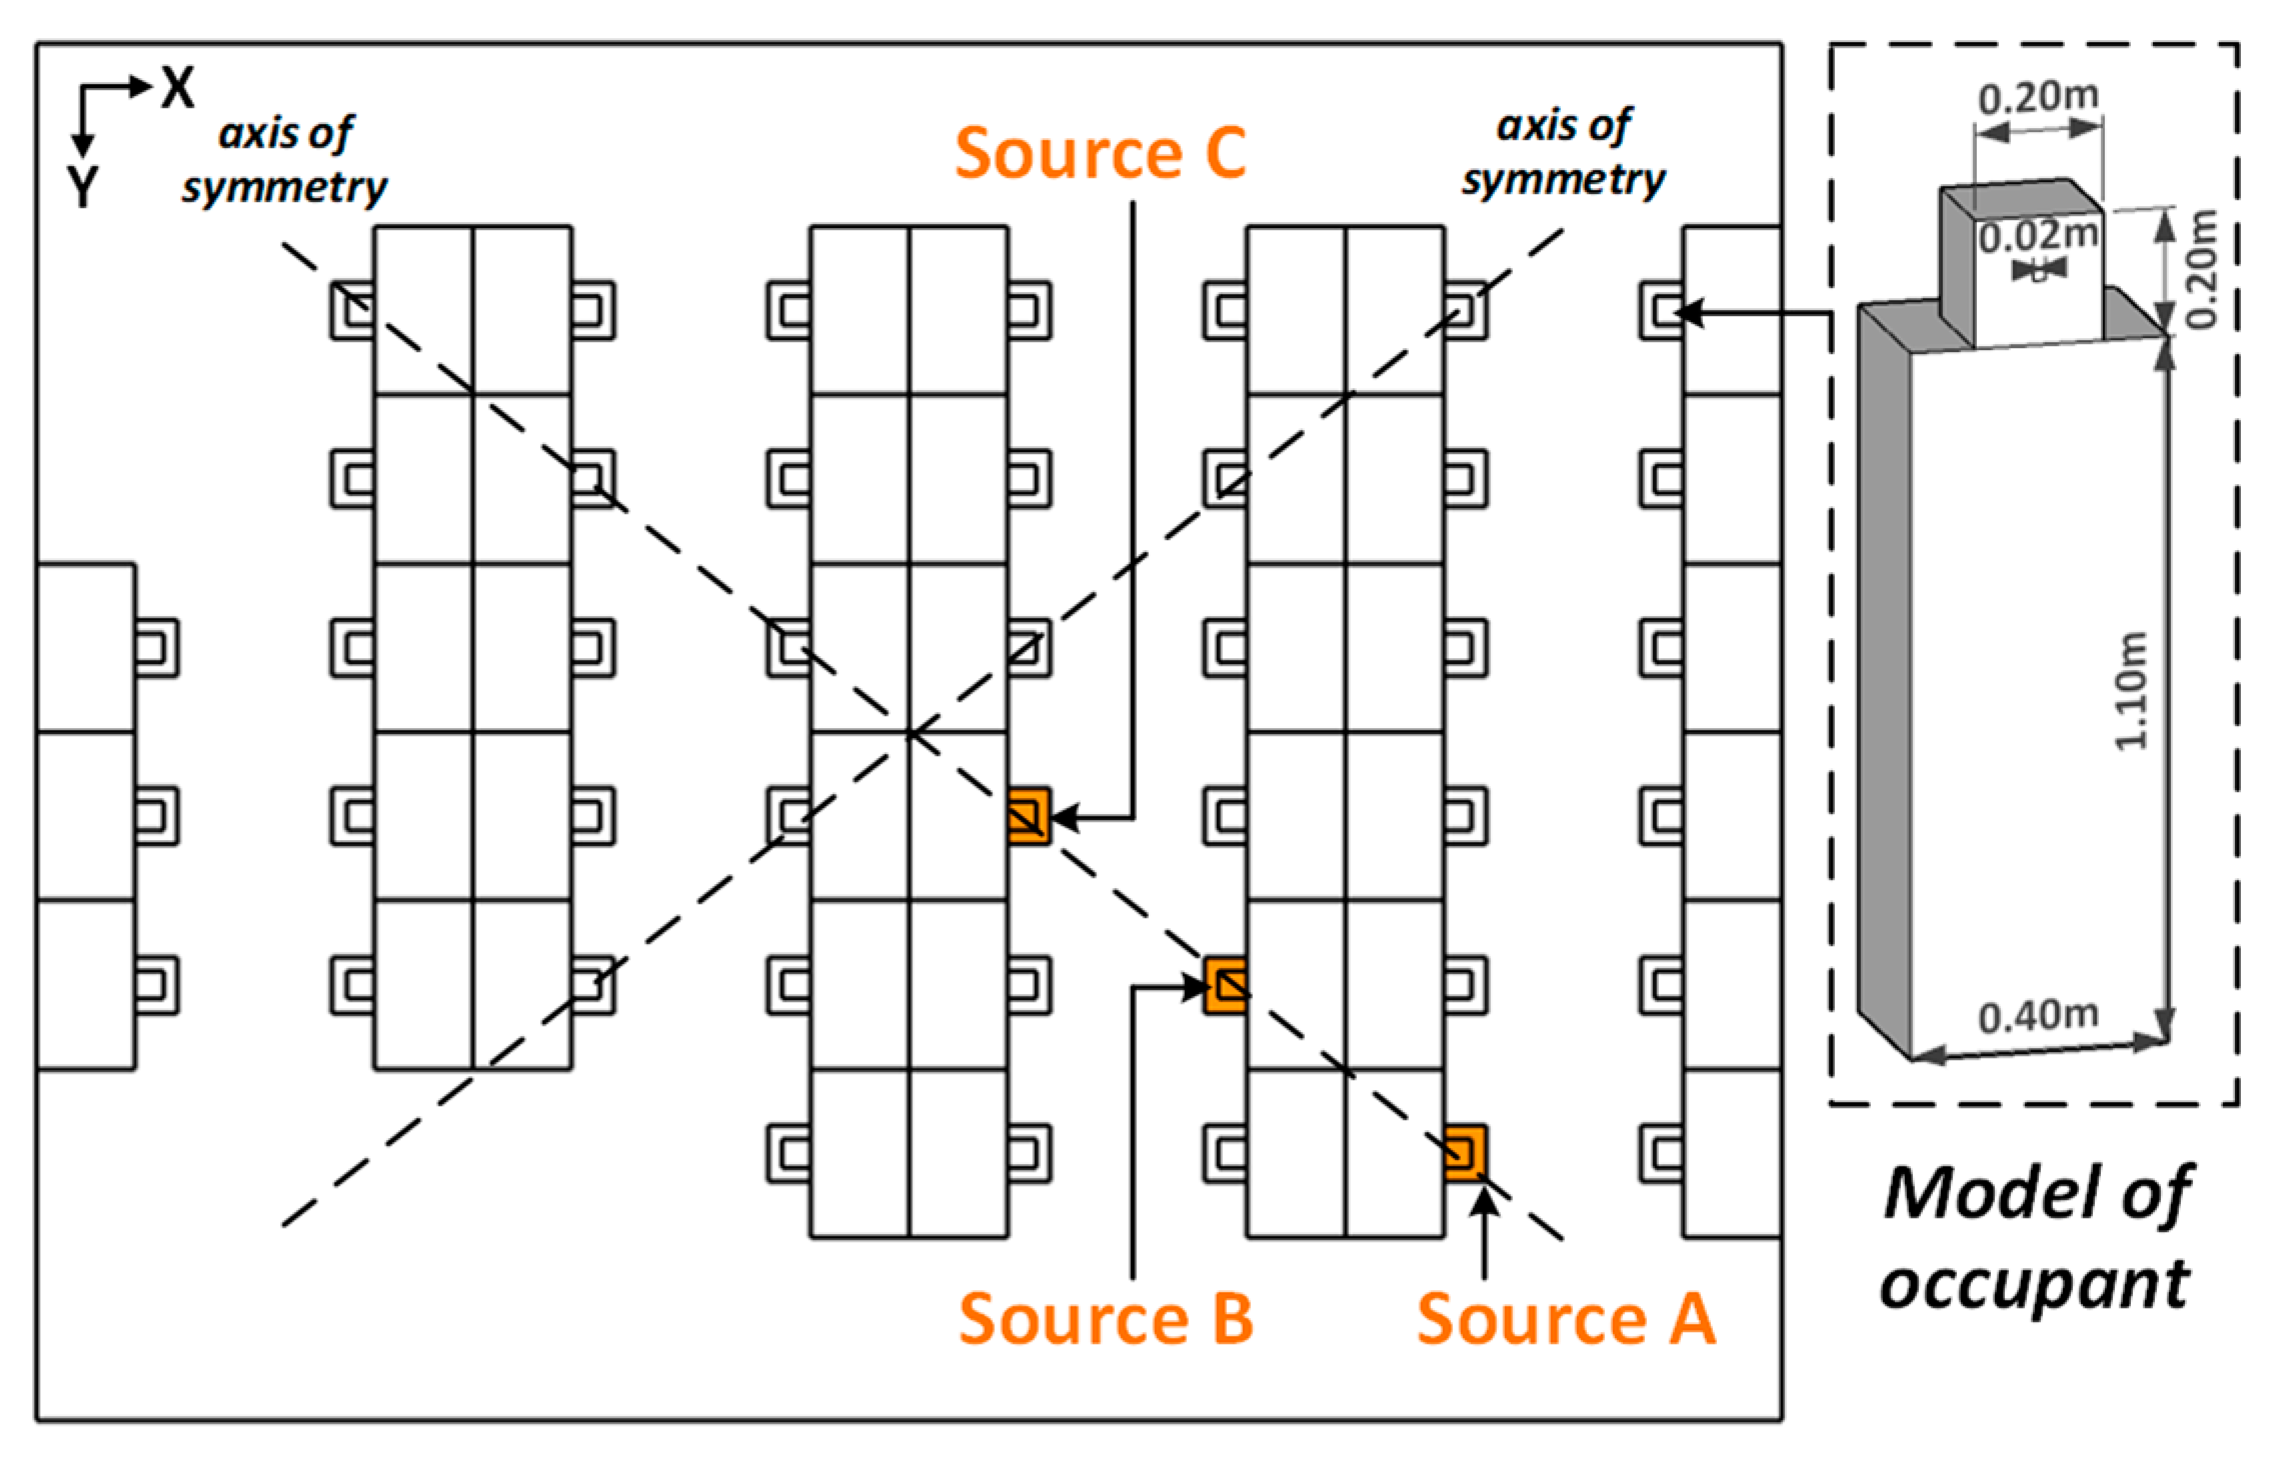
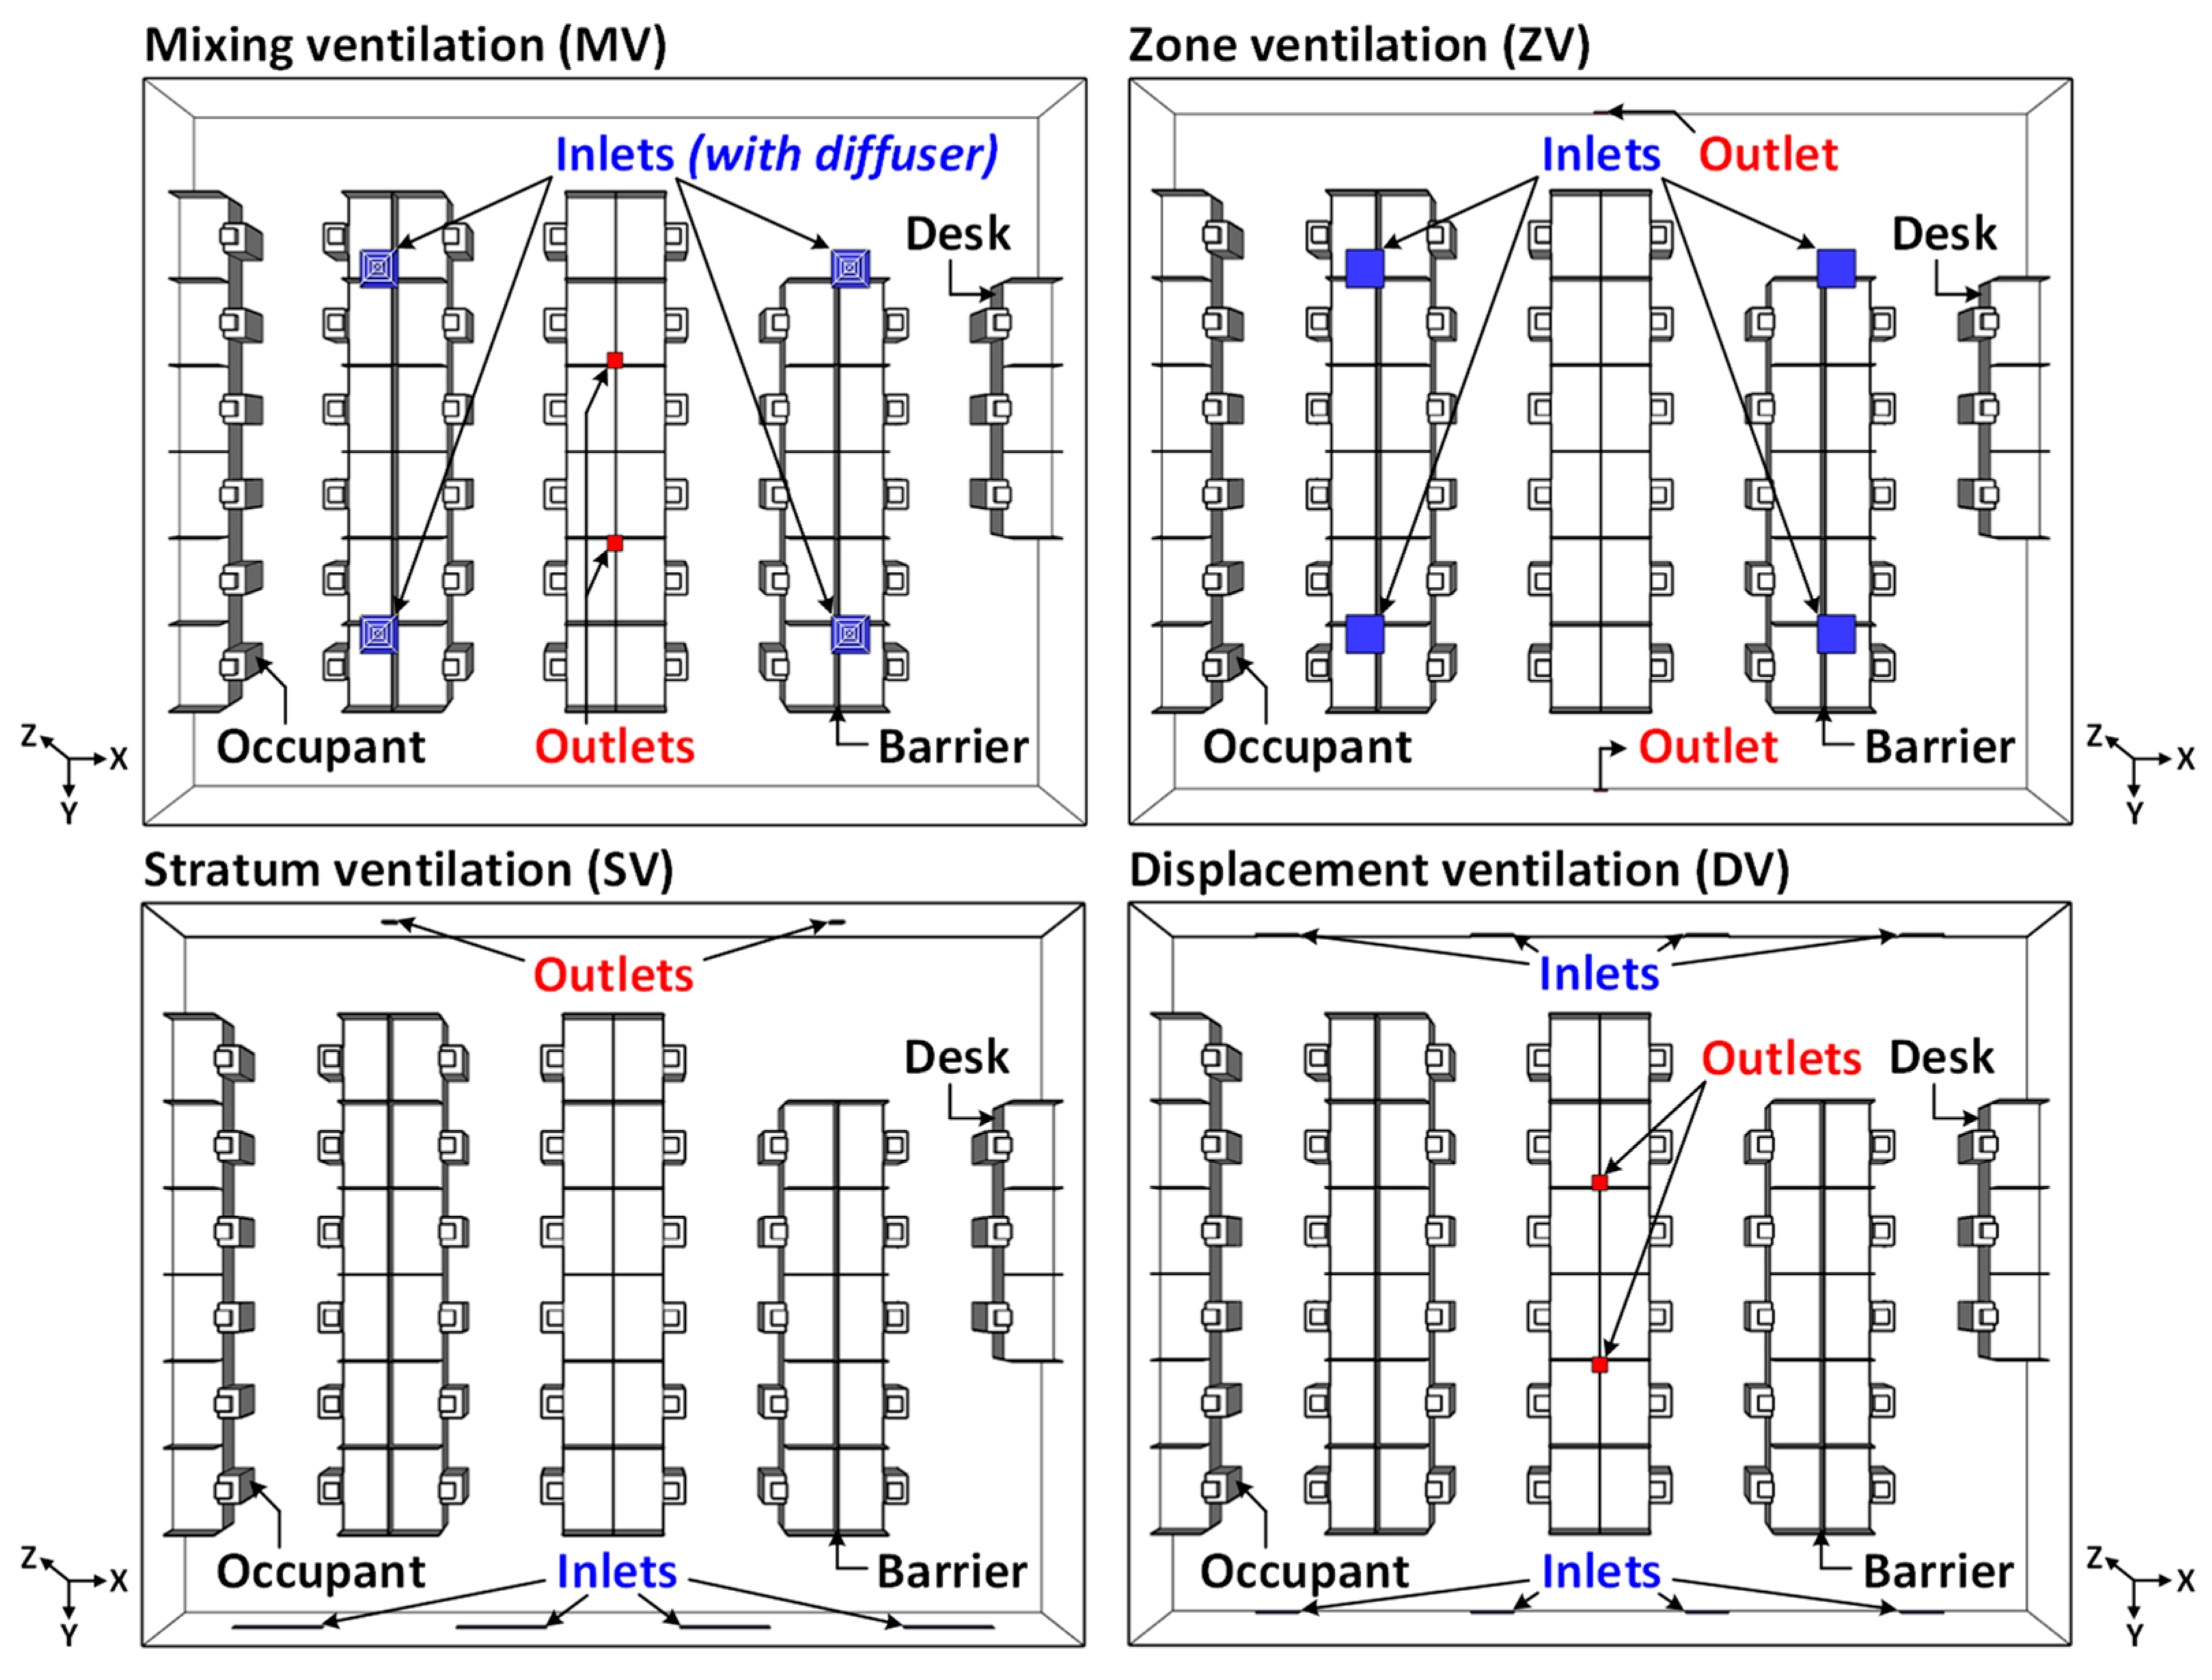
2.1. Model Information

To investigate the ventilation performance and infection possibility in large public room under different ventilation modes and locations of infected sources, a full-scale office model was adopted, with the dimensions of 12.4 m (X) × 9.8 m (Y) × 2.6 m (Z). Figure 2 displays the schematic diagram of various ventilation modes, consisting of mixing ventilation (MV), zone ventilation (ZV), stratum ventilation (SV) and displacement ventilation (DV). Table 1 illustrates the detailed information of supply air inlets and return air outlets for these ventilation modes. In the ventilation mode of MV, a square diffuser was used at the inlet. The total area of inlets and outlets remained the same as 1 and 0.08 m2, respectively. Previous work has reported that the minimum required supply air rate for an air-conditioning system in this office room should be adjusted to 1.73 m3/s with the percentage of outdoor air of 0.31 and minimum fresh air of 0.35 m3/s, in order to deliver sufficient ventilation air to each occupant [8]. In this study, the average supply air velocity at the inlets was set as 1.73 m/s for all the ventilation modes. In total, there were 43 occupants and 8 rows of desks in the office room. The size of a desk was set as 0.7 m (X) × 1.2 m (Y) × 0.8 m (Z). The spacing between each row of desks was defined as 1.7 m. The height of the physical barriers was optimized as 0.6 m above the desk surface to show effective performance in obstructing pollutant dispersion and reducing infection risk, which has been verified in the previous study [8].
In this work, three locations of infected occupant (source) of A, B and C were designed, as shown in Figure 3. These infected sources were located at the axis of symmetry in the office, with a distance from the center of the room of 5, 3 and 1 m, respectively. This work employed a simplified rectangular model to represent the occupants in an office to significantly reduce the computational cost, which has been validated by [42]. The model of occupant was utilized with a body size of 0.4 m (length) × 0.3 m (width) × 1.1 m (height), a head size (including a neck) of 0.2 m (length) × 0.2 m (width) × 0.2 m (height) and a mouth size of 0.02 m (length) × 0.02 m (height). Regarding an infected source, continuous coughing was assumed with an average airflow velocity of 13 m/s downwards at 27.5° [43]. For other occupants, the average breathing rate was set at 0.7 m/s. The temperature of the occupant’s body, head and mouth was set as 24, 34 and 36 °C. The airflow temperature for coughing and breathing of occupants was assumed as 36 °C.

2.2. Numerical Simulation

This study utilized computational fluid dynamics (CFD) to simulate the spatial distributions of airflow, air temperature and pollutant concentration in the office room, as an essential to evaluate ventilation efficiency and infection risk. The Reynolds-averaged Navier–Stokes (RANS) equations closed with the renormalization group (RNG) k-ε model were used to predict indoor velocity and temperature fields. The governing equations are shown below.
· ( ρ u ¯ φ ) = · ( Γ φ φ ) + S φ
where φ is solved variables (i.e., velocity and temperature); · ( ρ u ¯ φ ) is convection term; ρ is air density; u ¯ is average airflow velocity; · ( Γ φ φ ) is diffusion term; and S φ is source term. Next, user-defined scalar (UDS) was adopted to solve the spatial distribution of pollutant (e.g., virus) by solving the scalar transport equation. It can be assumed to model aerosols (produced by occupant) carrying virus particles (e.g., SARS-CoV-2) as gaseous pollutants with the influence of pollutant diffusion on indoor airflow neglected [8]. The main reason is that small-sized particles (e.g., aerosols) can follow the airflow to a longer distance before settling on surfaces, while large-sized particles (e.g., droplets) will deposit with a distance less than about 1 m. It can be noted that the X-axis and Y-axis distances between the occupants were larger than 1 m in this study. The releasing intensity of virus for infected occupant (A, B and C) was assumed as 1 × 10⁻⁴ (#/m3), which is further used as the reference value of pollutant concentration ( C ref ).
ANSYS Fluent 16.0 was utilized to predict indoor air distribution and pollutant concentration. The finite volume method (FVM) was adopted to discretize the Equation (1), which was then solved by the SIMPLE algorithm. The Boussinesq approximation was considered for the simulation of the buoyancy effect. All the numerical simulations were conducted as incompressible and steady-state conditions in this work. The solving can be considered to be converged as the normalized residuals were below 10−4 for airflow and air temperature and less than 10−12 for UDS. The grid independence analysis between coarse grids (3,417,313), medium grids (8,982,713) and fine grids (13,011,777) was carried out in the previous work [8], with a deviation of less than 5% for indoor velocity. In this investigation, the mesh grid setup of medium grids was further employed. Besides, the simulation results of airflow velocity and air temperature in the office were well validated by the experiment method with average deviations of 18.5% and 6.1%, respectively, which can refer to the previous work [8].
Table 2 displays the boundary conditions of a numerical simulation model for the office room. The inlets (blue color in Figure 2) were set as the velocity inlet, and the supply air temperature of air-conditioning was set to be a constant of 25 °C in winter. The outlets (red color in Figure 2) were set as the outflow. The wall, physical barrier and desk surface were modeled as non-slip walls. The heat transfer coefficient of external wall was set as 2.4 W/(m2·K) and the temperature of interior wall was set to be 15 °C. The temperature of the occupant’s body, head and mouth was set at 24, 34 and 36 °C, respectively. The airflow temperature for coughing and breathing of occupant was assumed as 36 °C. Table 3 shows an overview of simulation cases in this study. Cases 1–4 were set up to compare the ventilation performance of different ventilation modes of MV, ZV, SV and DV. The characteristics of these ventilation systems can be obtained in Table 1. In Cases 5–16, the pollutant concentrations under different locations of infected source (A, B and C) were simulated to further evaluate the infection risk in the office. The evaluation methods for ventilation performance and infection risk are discussed in Section 2.3.

2.3. Evaluation Models

The performance of a ventilation system can usually be evaluated by the level of draught in the occupied region of a room. To assess the air diffusion performance for the heating mode, Liu et al. carried out the experiments in a test chamber with a sophisticated air conditioning system [44]. More information about the chamber and air conditioning system can be found in the literature [44]. This chamber was modeled with a typical window and exterior wall in winter causing a specific heating load in the range of 35–40 W/m2. The indoor temperature in the experiment was maintained at nearly 23 °C. On the basis of the measured values of velocity and air temperature at uniformly spaced points in the breathing zone, an analytical model of effective draught temperature (EDT) applicable to winter condition was established as follows [44].
θ = ( t x t a ) 9.1 ( v x 0.15 )  
where θ represents the value of EDT; t x is local air temperature (°C) at measurement points; t a is average air temperature (°C); v x is local airflow velocity (m/s) at measurement points. The percentage of points where the EDT, as defined by Equation (2), satisfies a specific comfort range to the total points is defined as the Air Diffusion Performance Index (ADPI) [33]. In winter, the comfort range can be defined as an EDT value between −2.2 and 2 °C and indoor air velocity larger than 0.2 m/s in the breathing region [44].
In order to analyze the infection risk under various ventilation modes and scenarios of infected occupants, the spatial distribution of pollutant (e.g., virus) predicted by the CFD method was used in the Wells–Riley equation. Buonanno et al. adopted a modified Wells–Riley equation for assessment of infection probability by estimating the quanta emission rate of virus (e.g., SARS-CoV-2) generated from infected subject [45]. Under the precondition of fully mixed ventilation, the infection risk can be regarded as a function of exposure time of susceptible occupant and pollutant concentration.
R i n f = ( 1 e I R 0 T C ( t ) d t ) 100 %  
where, R i n f is infection possibility (%); I R represents the inhalation rate of the exposed occupant (m3/h); T is total exposure time (h); C ( t ) is pollutant concentration (#/m3) over time t (h). In this work, the inhalation rate of the exposed subjects was considered as the average value of 0.96 (m3/h) between standing and activity states. The total exposure time was defined as 1 h to fully evaluate the infection possibility in the large open office.

3. Results

This section mainly described the numerical simulation results of indoor airflow distribution and pollutant concentration used to study the influence of different ventilation modes on ventilation performance as well as infection risk in a full-scale office. Different scenarios of infected occupants were considered in the simulation of pollutant diffusion, based on the installation of a physical barrier with a height of 0.6 m above the desk surface. The ventilation performance and infection risk were evaluated using the evaluation models of ADPI and modified Wells–Riley equation, to acquire the optimal ventilation mode applied to the office.

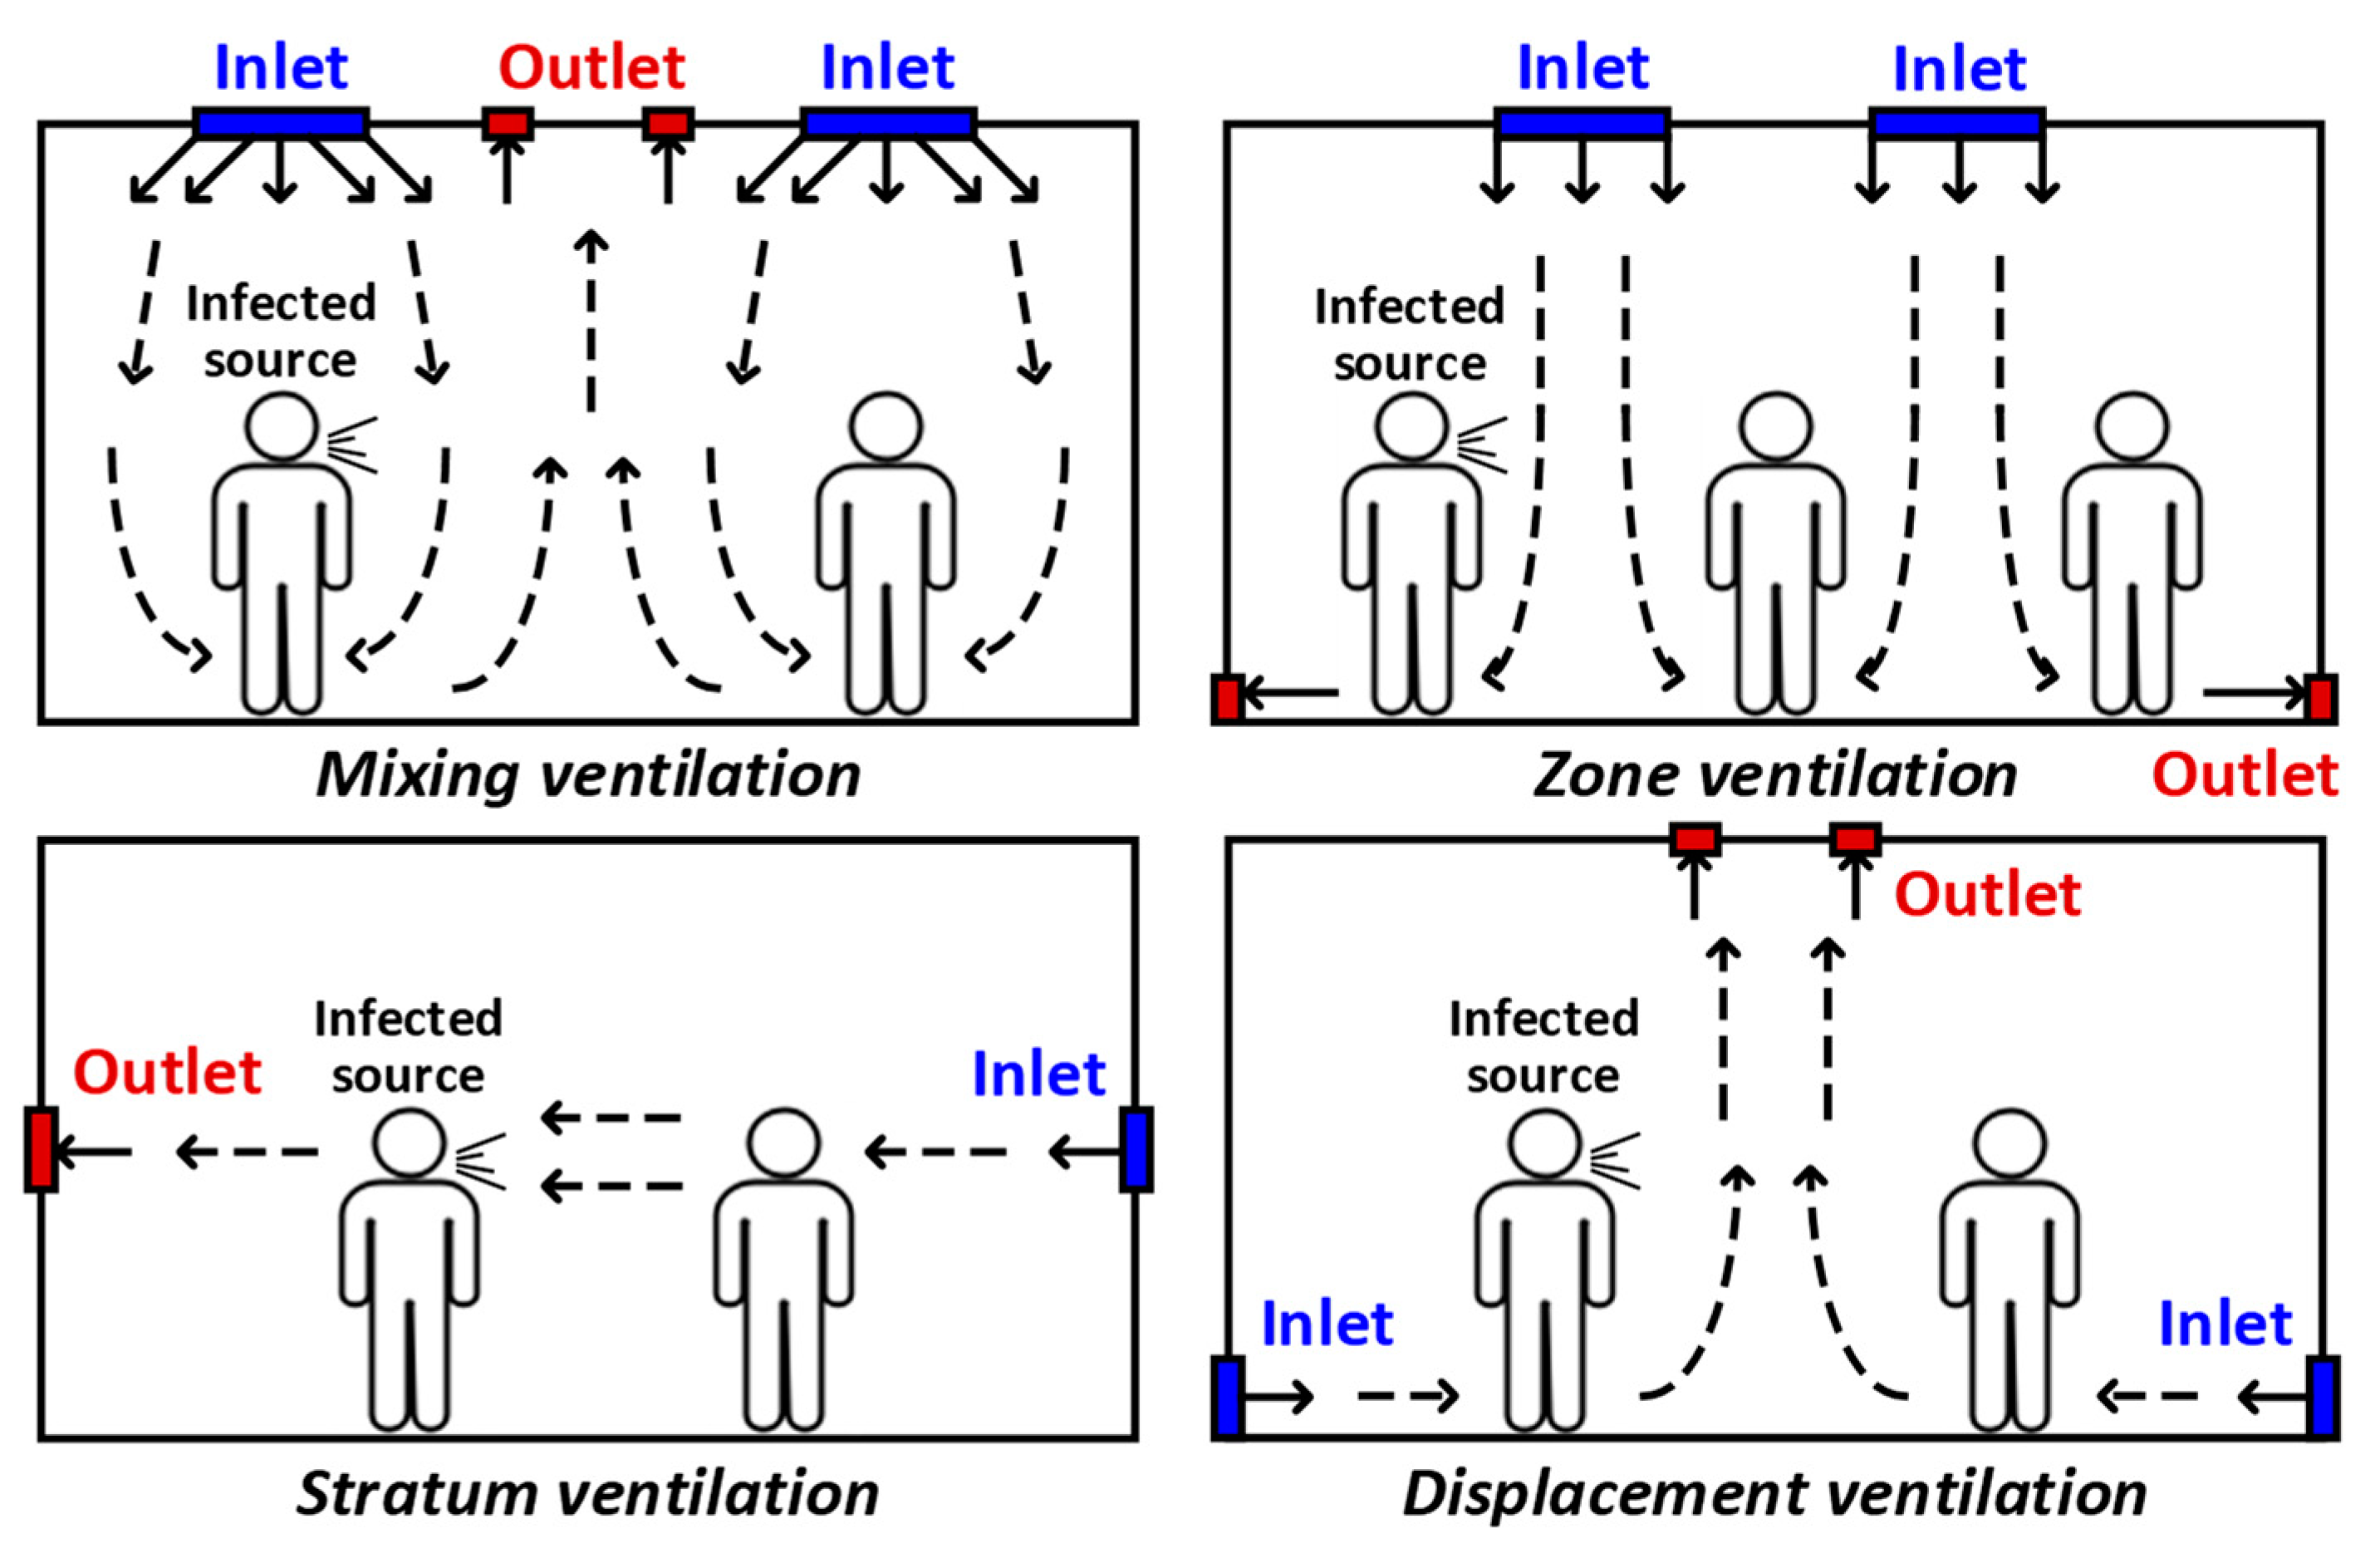
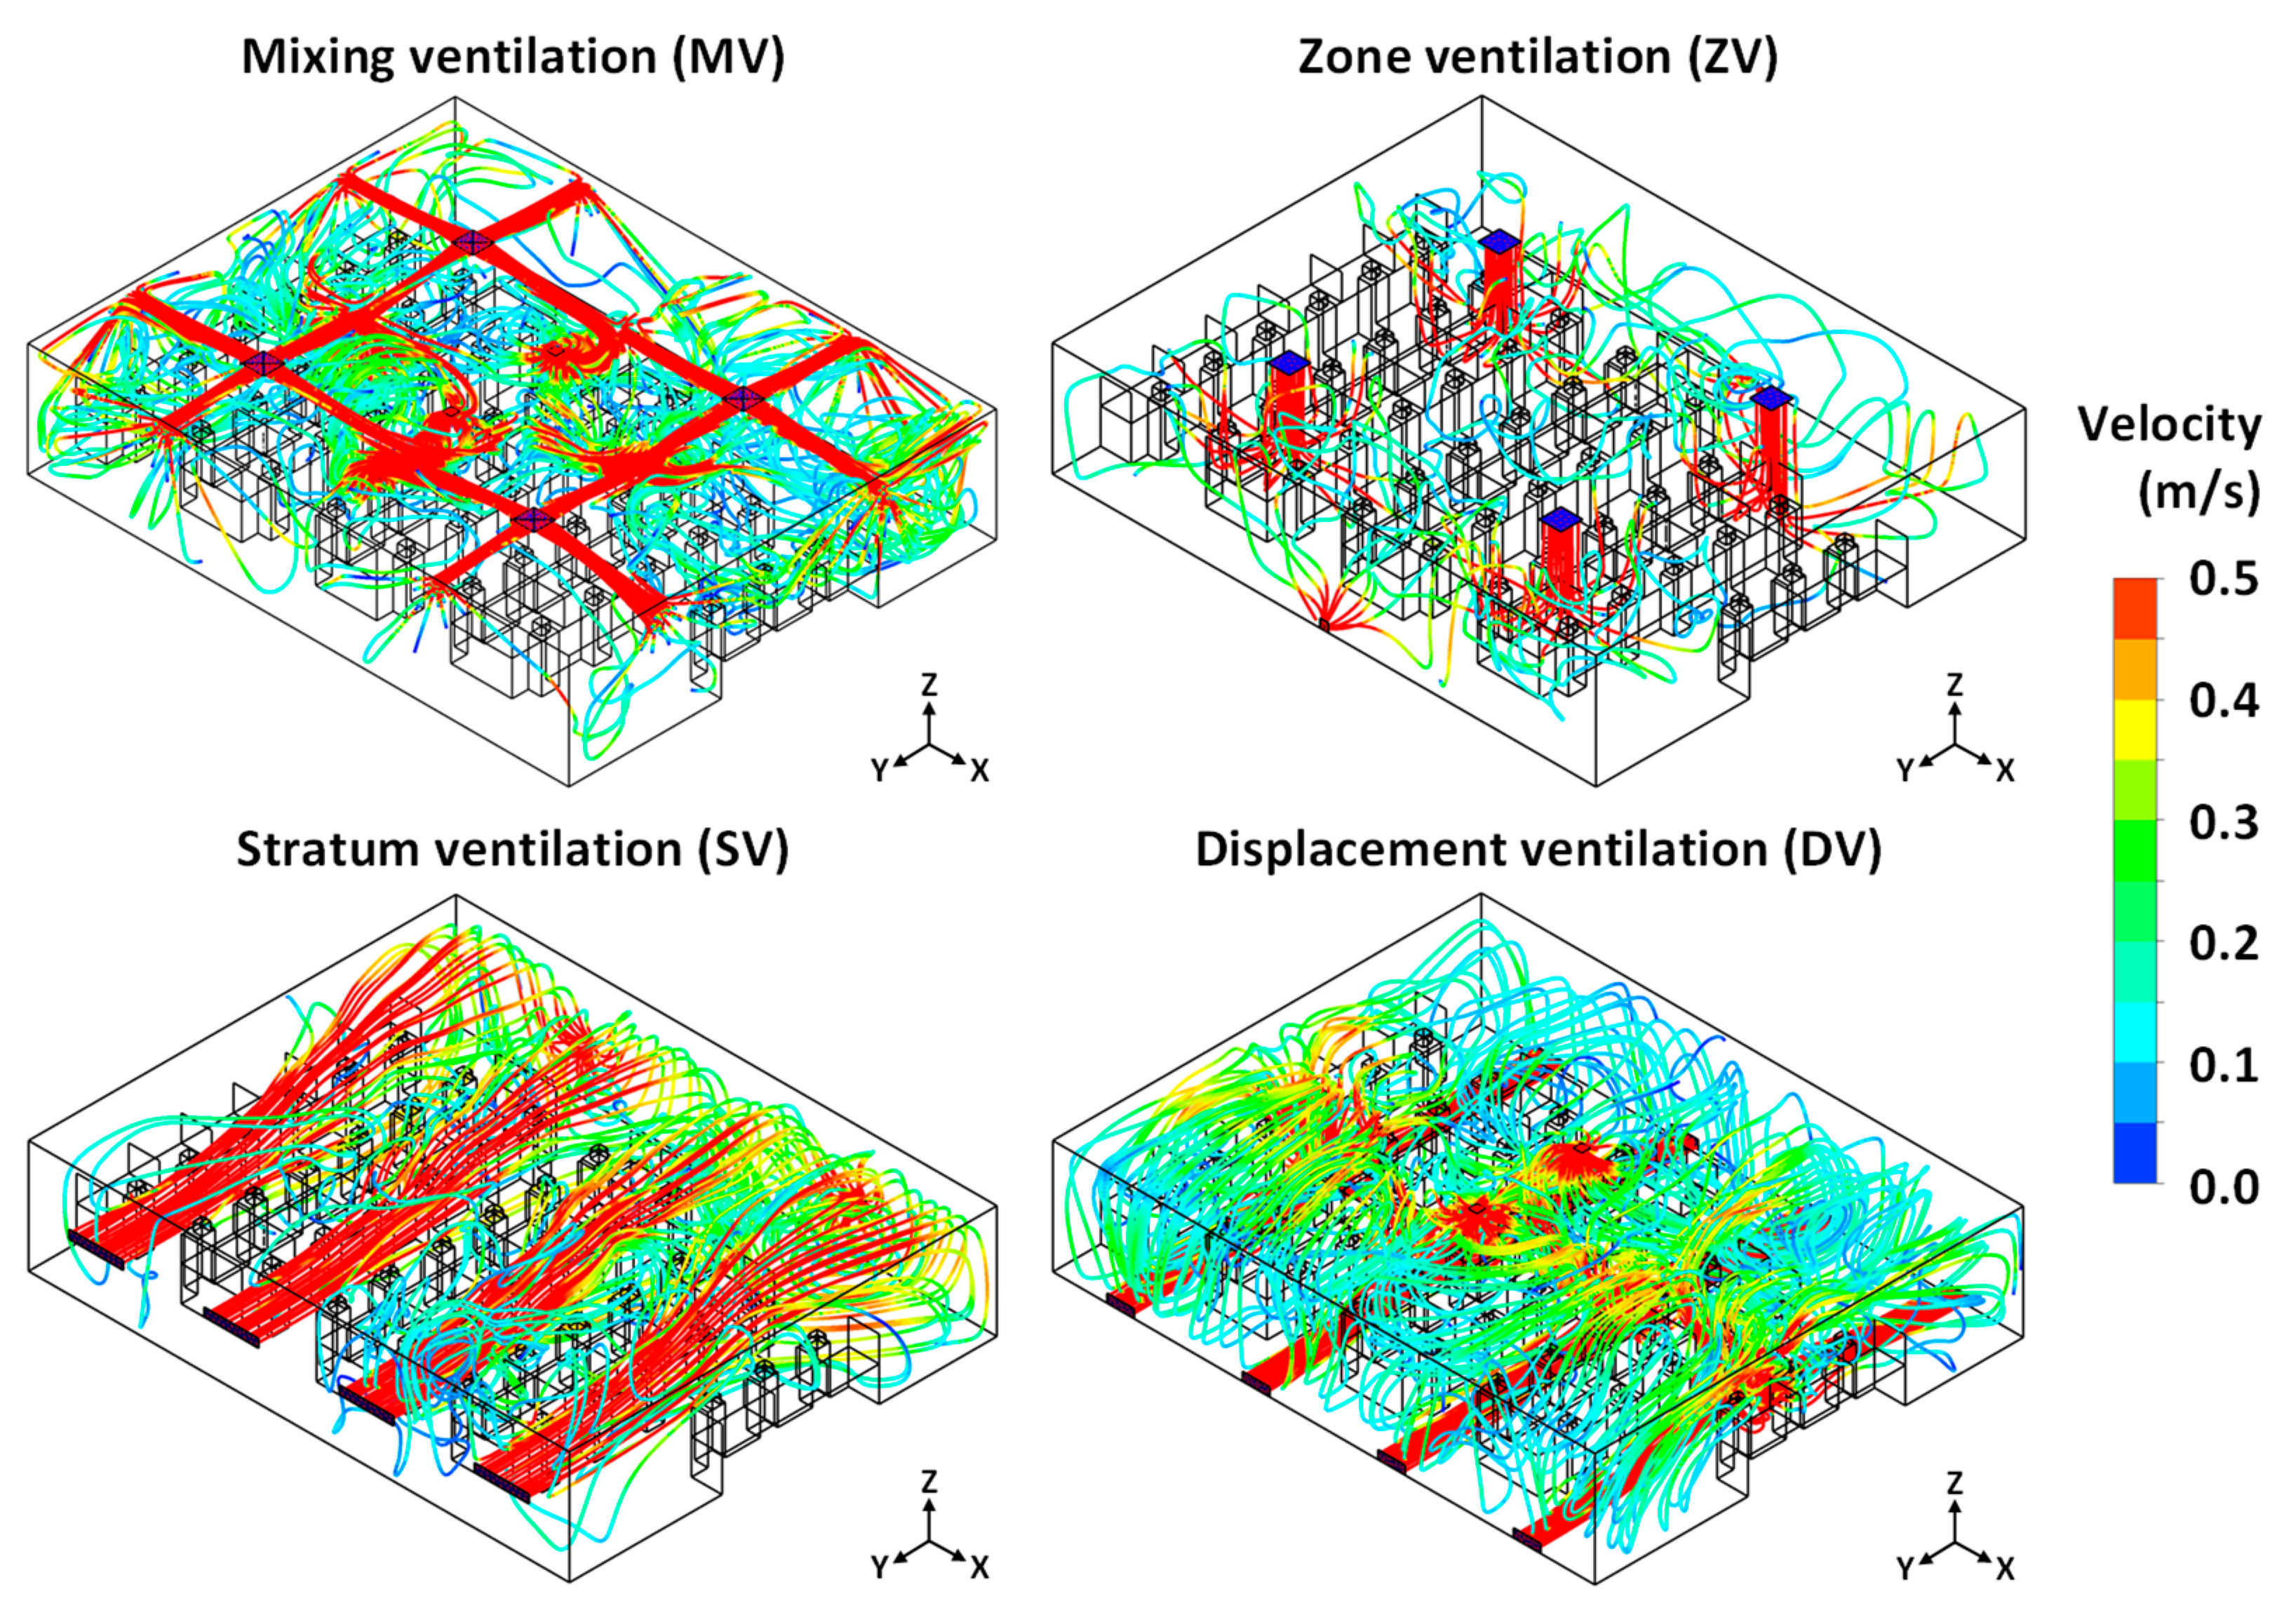
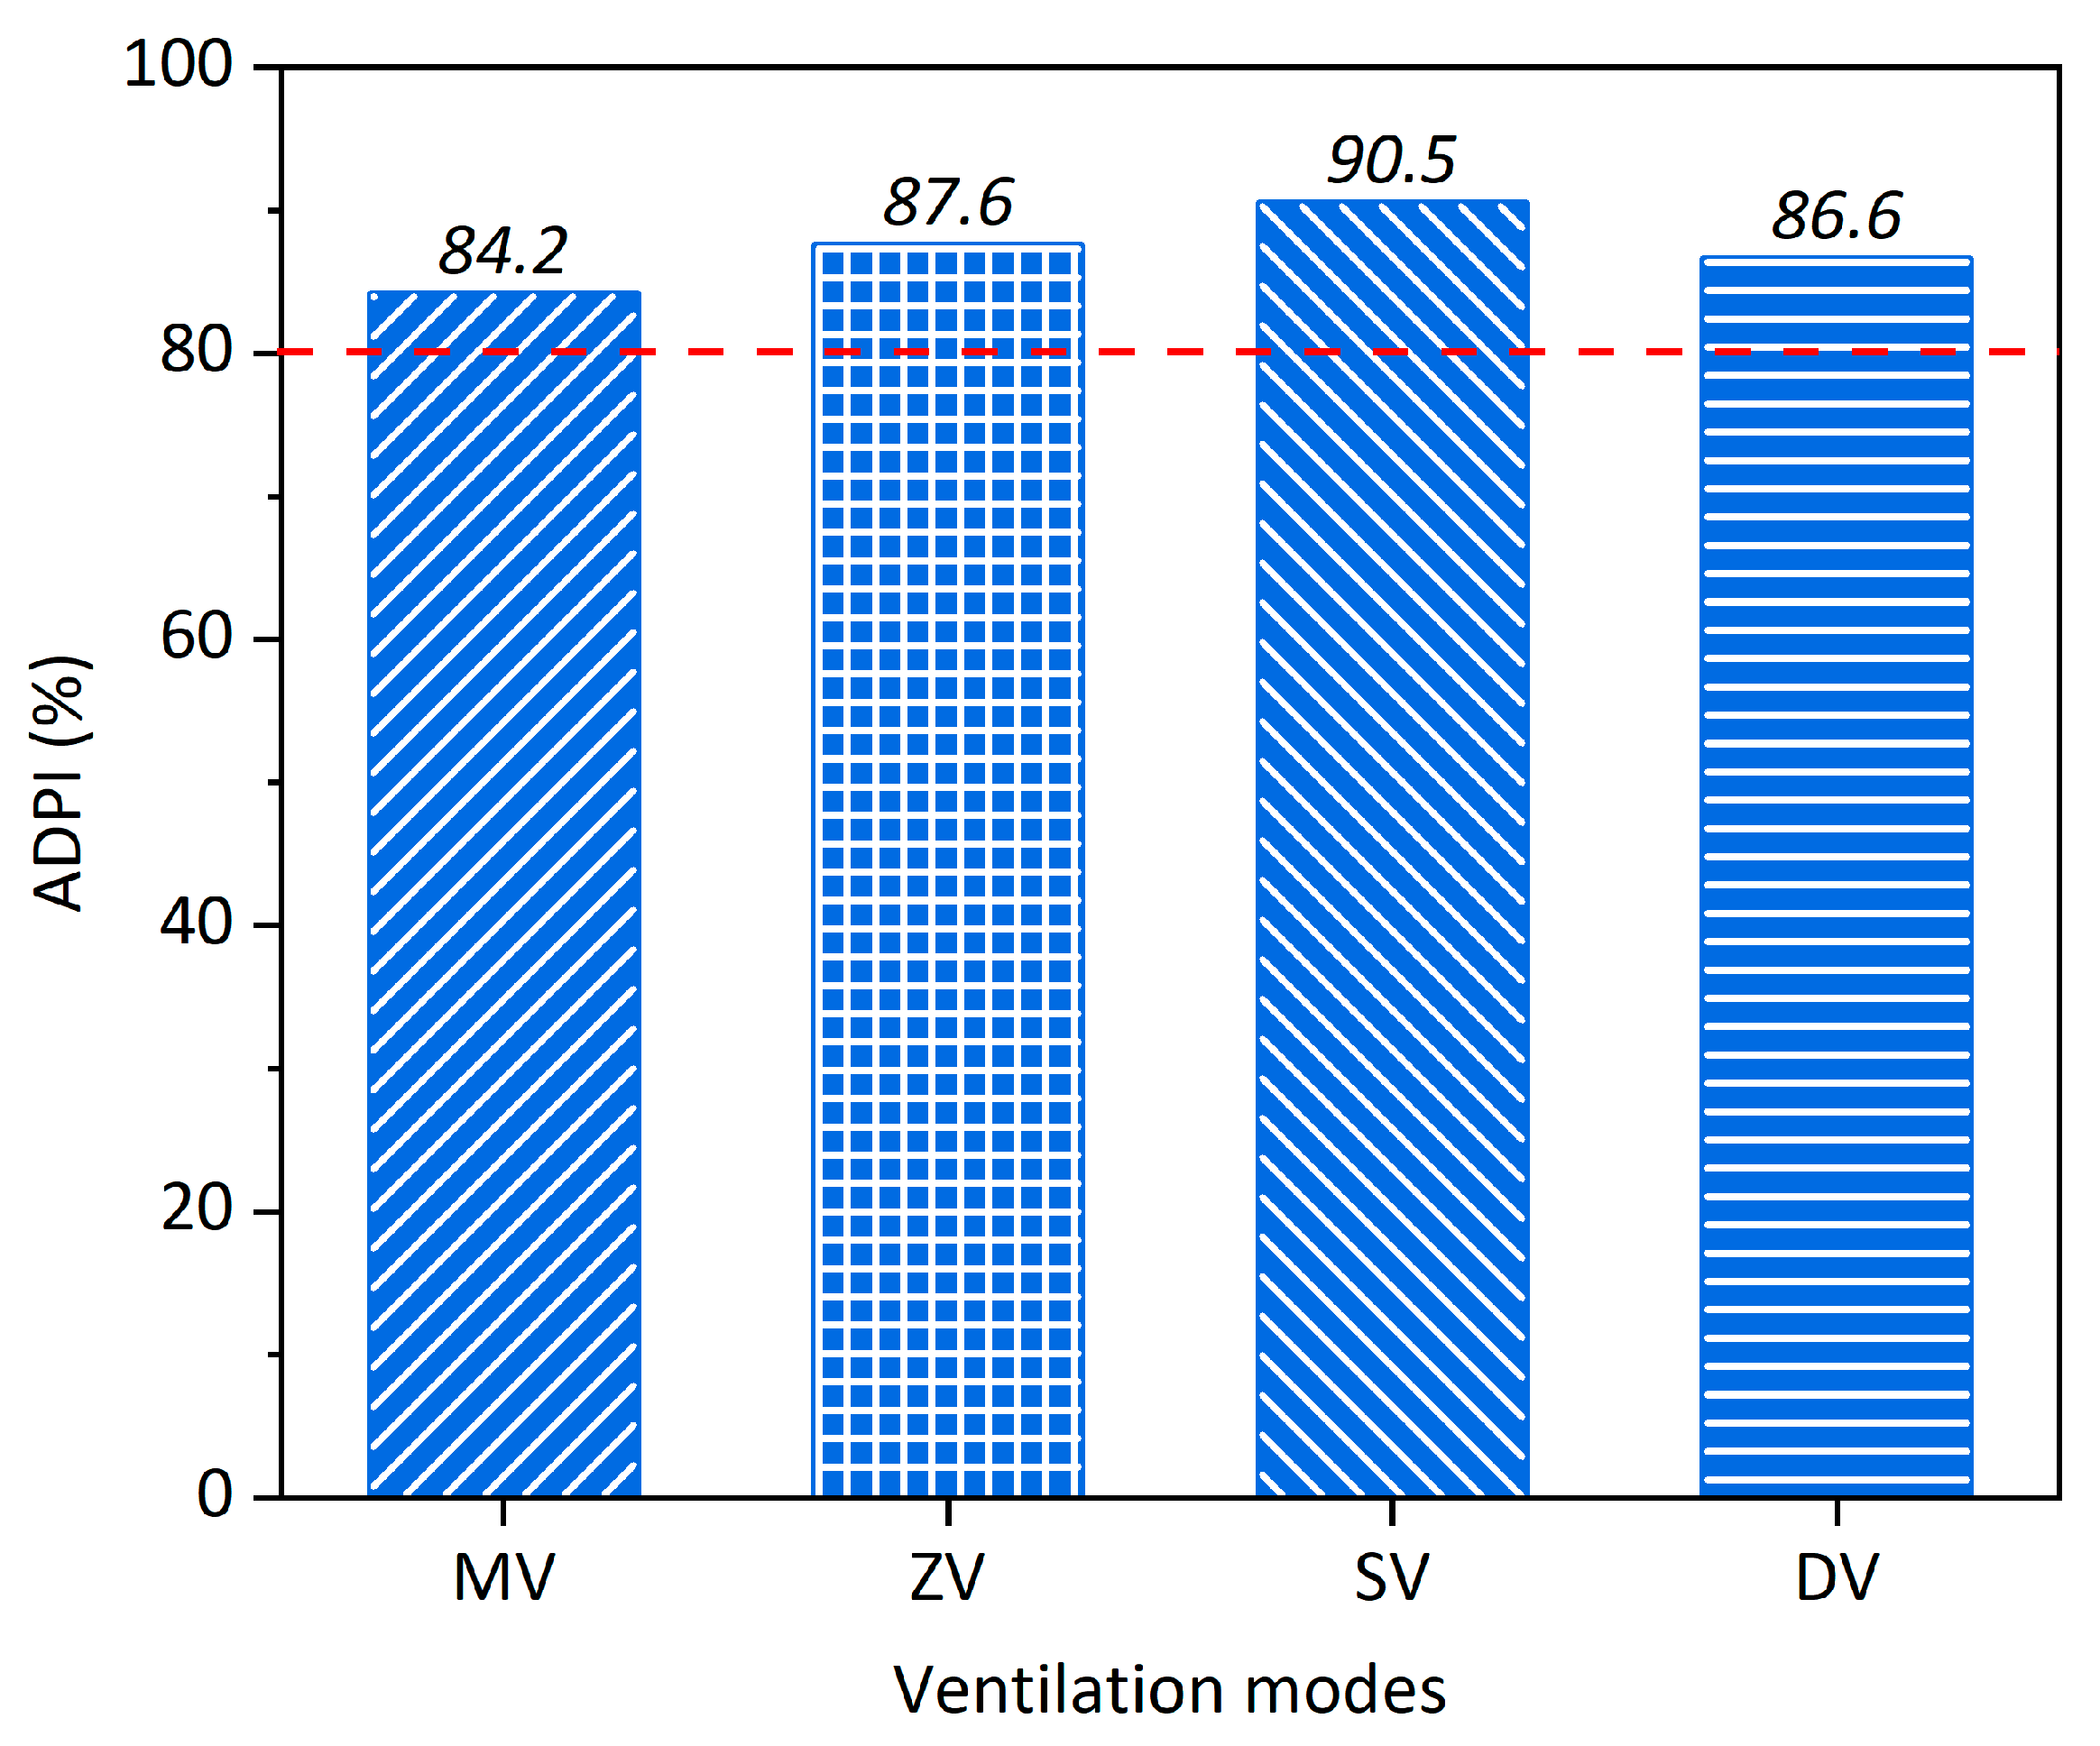
3.1. Influence of Ventilation Modes on Ventilation Performance

The ventilation performance of different ventilation modes was analyzed based on the spatial distribution of indoor airflow. Figure 4 shows the streamline distribution for various ventilation modes (including MV, ZV, SV and DV) in the office with a physical barrier height of 0.6 m. The results indicate that the air was more sufficiently mixed for MV and DV. The recirculation effect of DV could be more obvious than that of MV. This may be due to the reason that the number of inlets was larger than that of MV and that of outlets for DV. To be specific, the inlets of DV were arranged symmetrically at the bottom of the opposing walls, with a number of four on one wall. The supply air would collide in the middle area of the office and move towards the upper space. Due to the reduced number of outlets with the location in the center, the airflow near the outlet area may be removed directly. The supply air that is away from the area of outlets can be recirculated in the room. The effect of the outlet arrangement on the performance of DV is discussed in a later section. SV can supply the air from inlets to the breathing area of occupants well, owing to the supply air inlets at the height of 1.1 m. The supply air flow of ZV traveled vertically to the occupant activity region with a large inlet velocity. It can be seen that the potentials of recirculation and stagnation of air were diminished in the room. In particular, the air in the breathing zone was almost removed by the return air outlets located on the side walls. With the same supply air volume and total area of inlets and outlets, the average indoor air velocity for ventilation modes of MV, ZV, SV and DV were calculated as 0.16, 0.18, 0.23 and 0.21 m/s, respectively. The ZV, SV, and DV could separately increase the average velocity magnitude by 12.5%, 43.8% and 31.3% when compared to MV. It should be noted that SV and ZV were able to provide more air to the breathing zone, which may contribute to improving air distribution performance in the office. The installation of physical barriers also had a certain impact on the airflow distributions, which has been verified in Ref. [8].
Then, the ADPI was further used to quantify the ventilation performance of various ventilation modes in this study. Figure 5 presents the calculated ADPI values for ventilation modes of MV, ZV, SV and DV. It can be found that the airflow distribution performance under these ventilation modes reached above 80%, which is a critical value for acceptable ADPI. Of these modes, SV possessed the maximum ADPI value of 90.5%, which was increased by 6.3% compared to 84.2% of MV. ZV and DV appeared to have the ability to improve ventilation efficacy at a certain level, by increasing 3.4% and 2.4% of ADPI values, respectively, in comparison to MV. With the foundation of ensuring sufficient supply air rate, SV and ZV are preferred to increase the supply air volume delivered to the breathing area with well-modified airflow patterns.

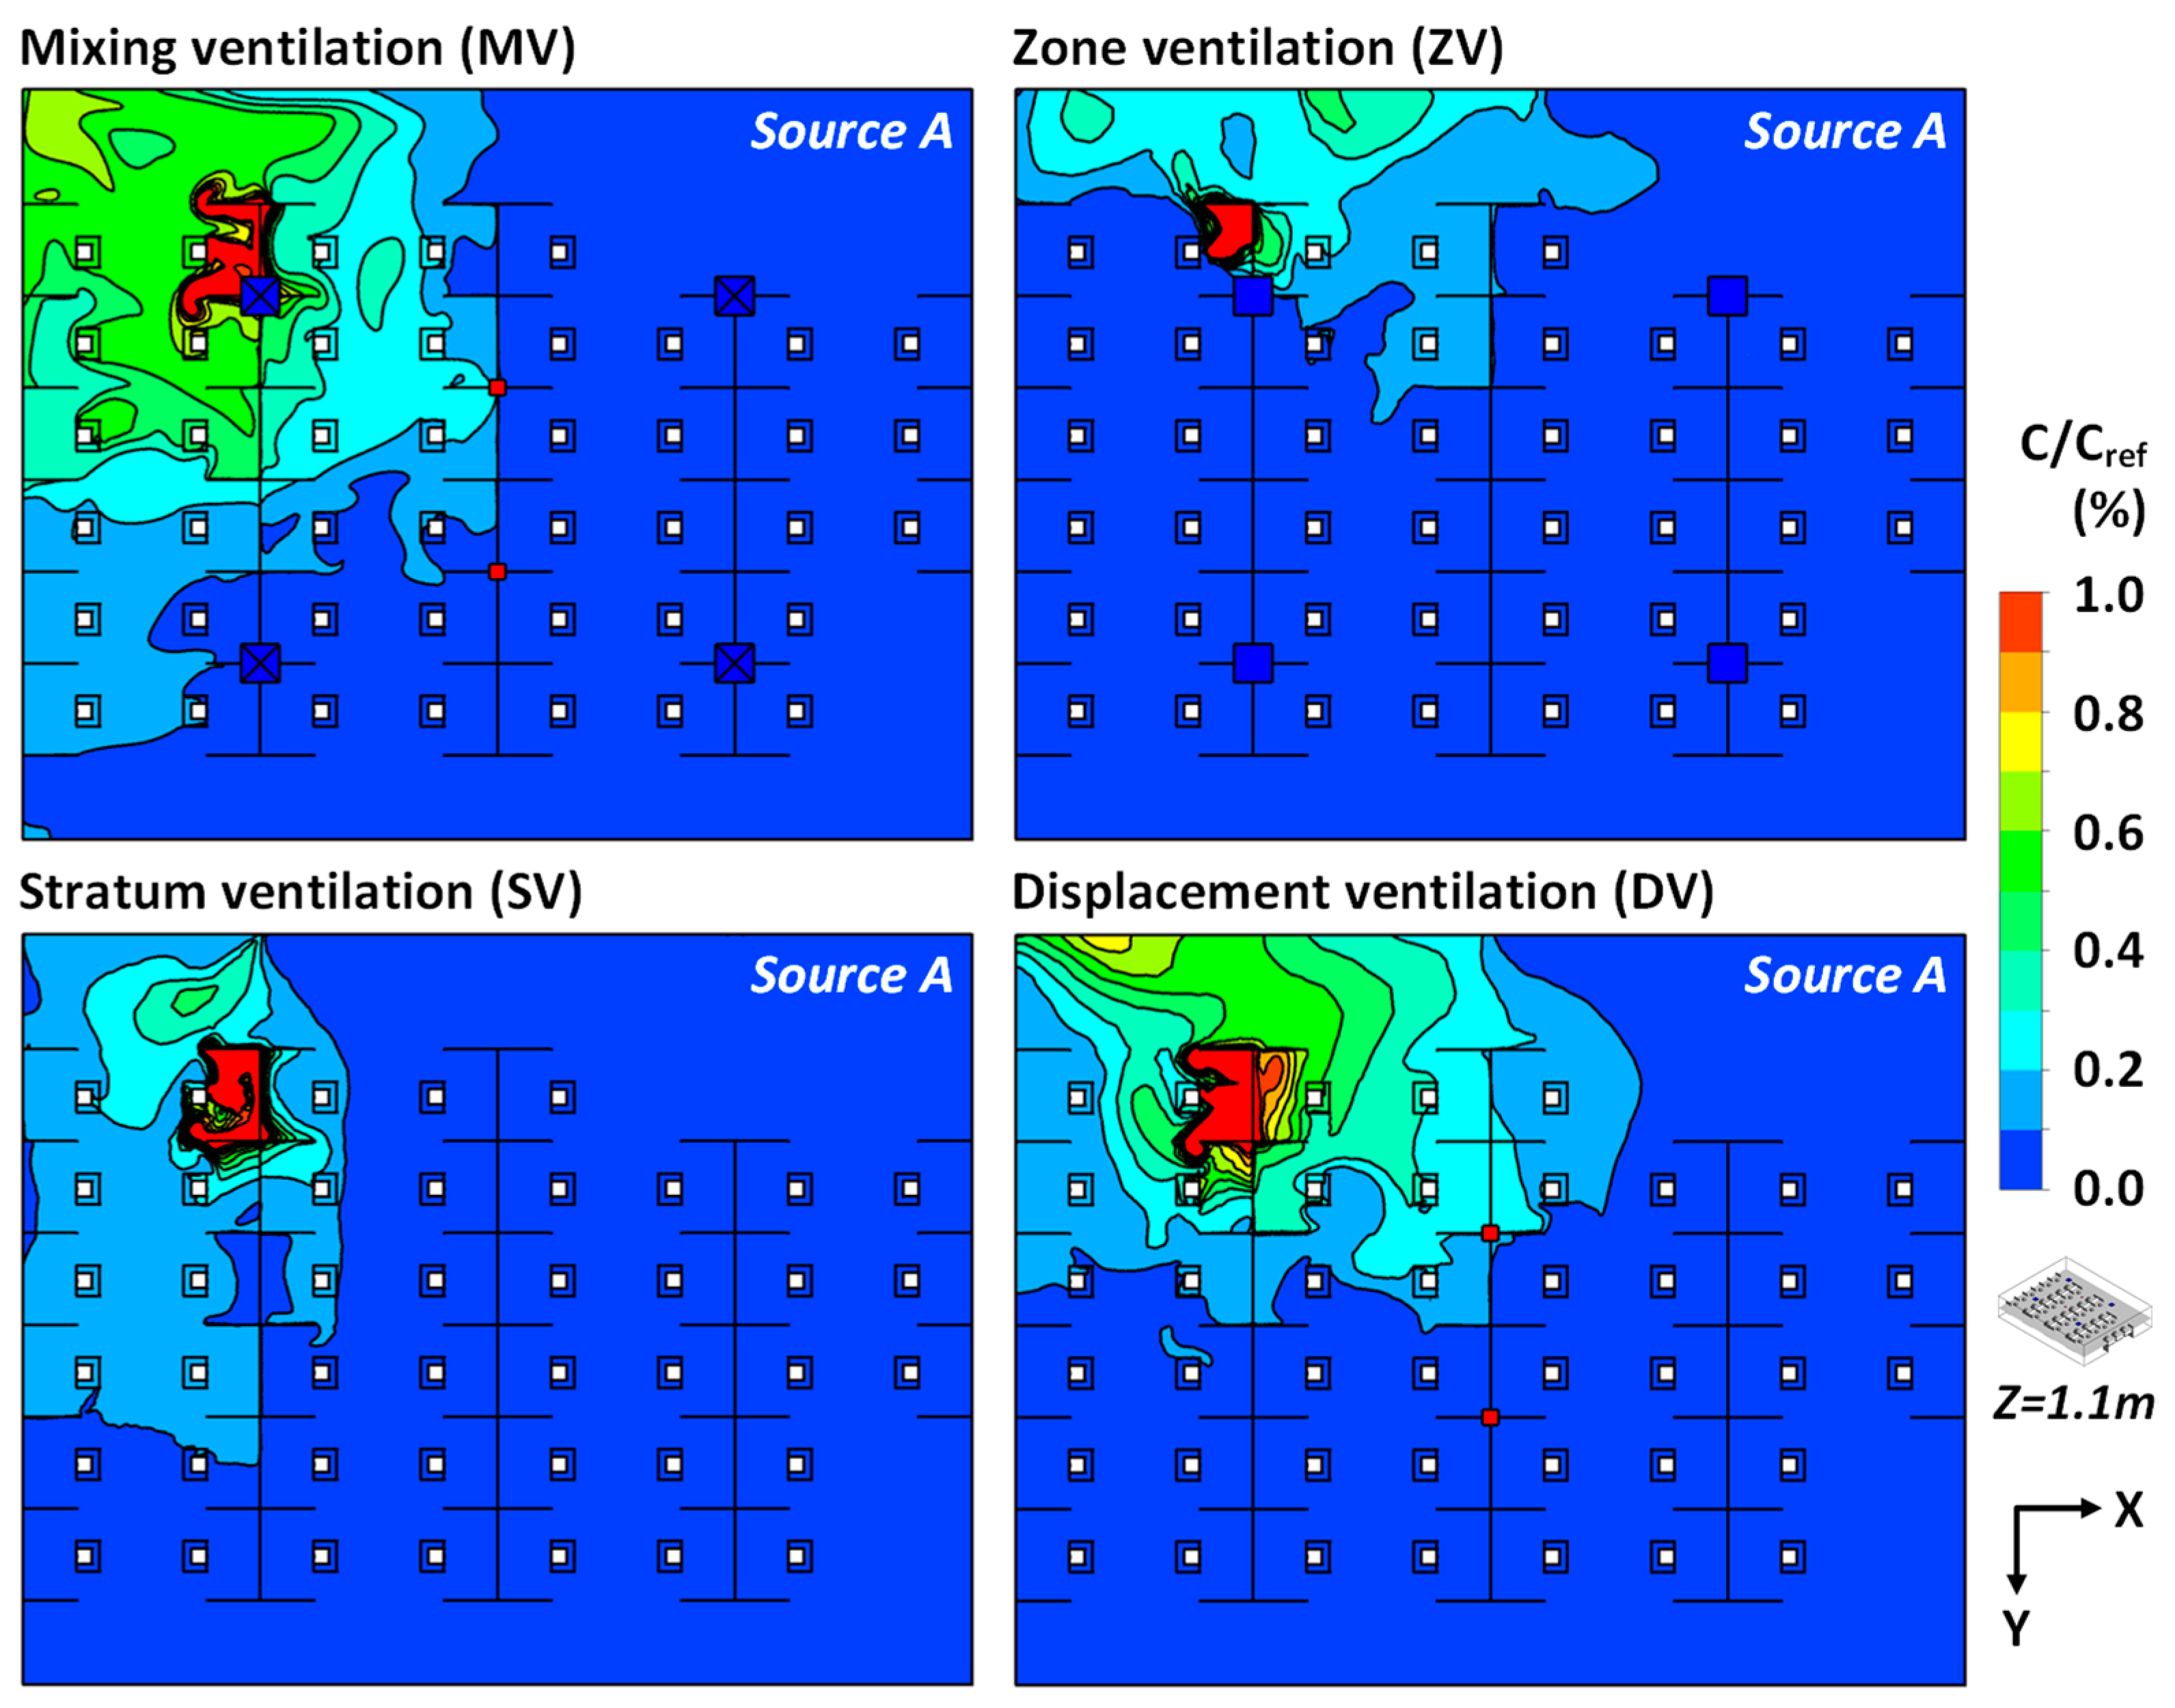
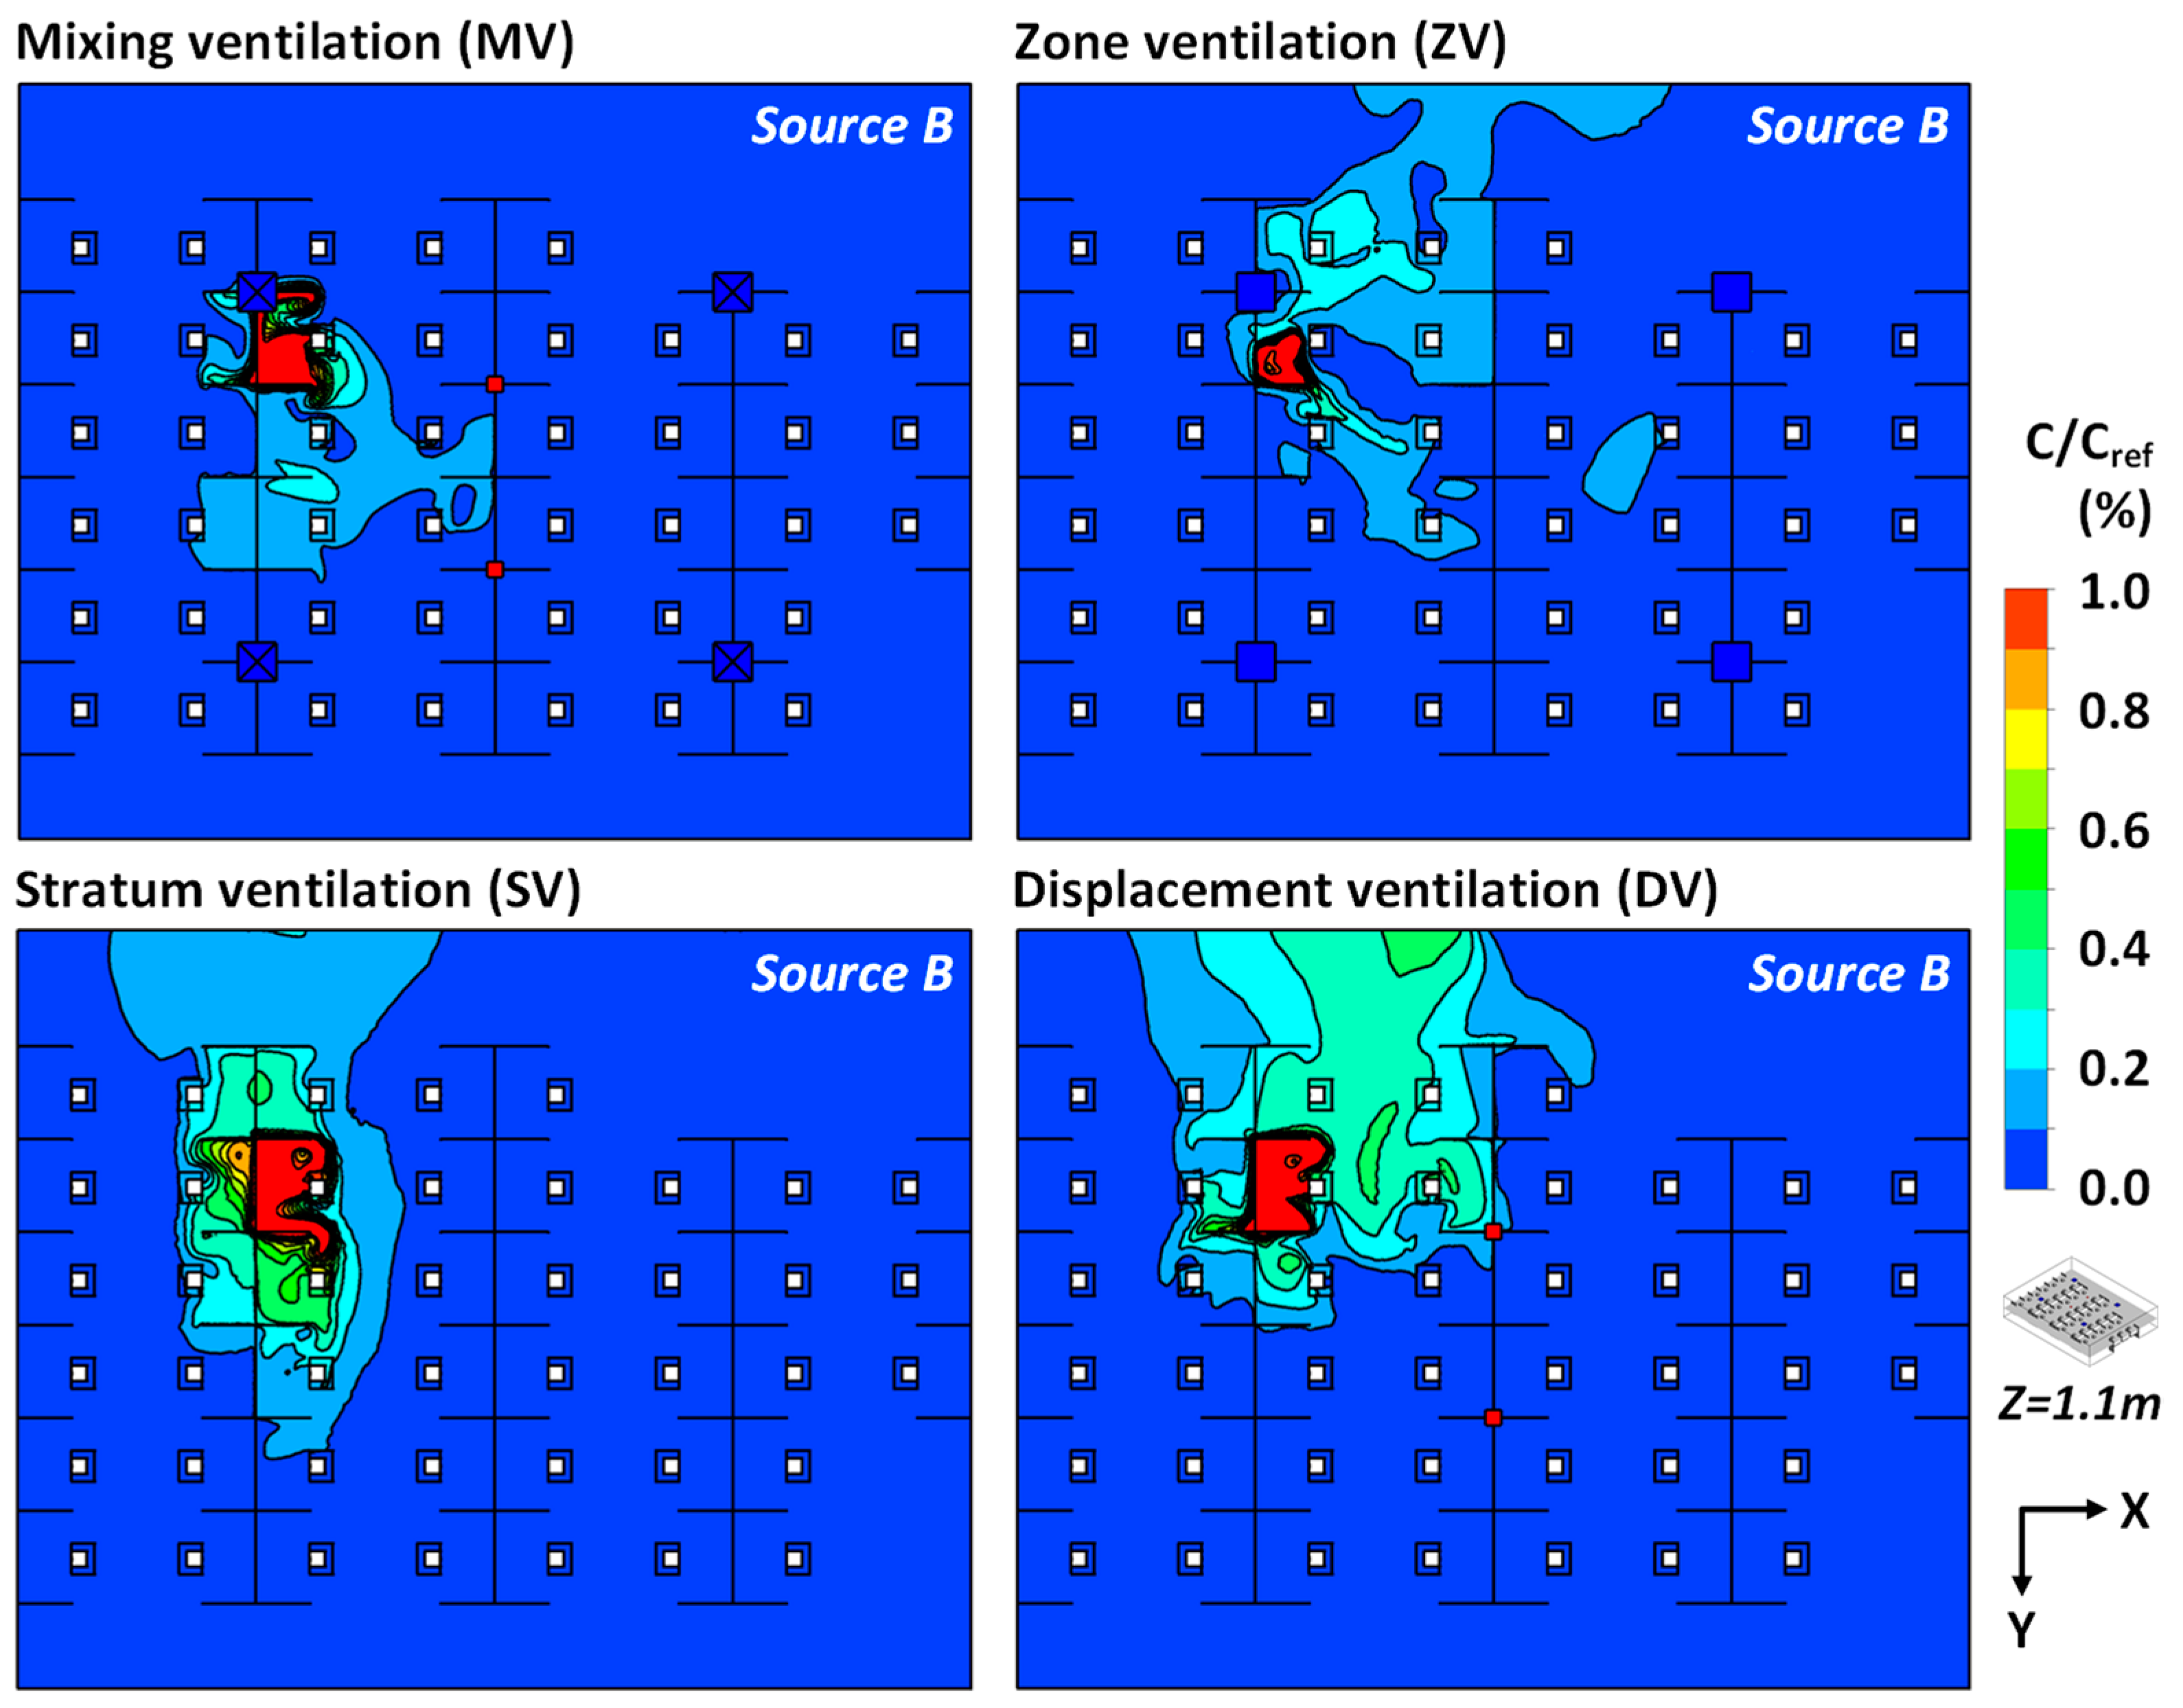
3.2. Influence of Ventilation Modes on Pollutant Diffusion and Infection Risk

On the basis of the simulation results of airflow distribution, the impact of different ventilation modes on pollutant diffusion was further analyzed in order to investigate the potential of removing indoor airborne pollutants. Figure 6 displays the distribution of relative pollutant concentration (C/Cref) at the plane of Z = 1.1 m under ventilation modes of MV, ZV, SV and DV and infected source of A (with a physical barrier height of 0.6 m). As the infected occupant was located at A, the physical barriers with a height of 0.6 m were able to obstruct the spread of pollutants. ZV and SV showed better performance to mitigate the transmission of contaminants and reduce the relative concentration value compared to MV and DV. The main reason could be that ZV divided the indoor zone into subzones using vertical jets, to effectively separate contaminated regions around infected occupant from susceptible ones. SV can deliver the supply air to the breathing zone and directly remove the pollutant to the outlets. This finding is directly related to the results of ventilation performance as discussed above. Regarding the ventilation modes of MV, ZV, SV and DV, the percentage of occupants covered by pollutant (with relative concentration less than 1%) in the breathing zone amounted to 44.2%, 11.6%, 25.6% and 32.6%, respectively (with 43 occupants in total). Under the scenario of the infected source A, ZV, SV and DV can diminish the average pollutant concentration in the breathing region of occupants by around 59.3%, 56.1% and 10.3% compared to that of MV. ZV and SV showed great behavior in removing the contaminants effectively to maintain good inhaled air quality, which was superior to MV and DV.
Figure 7 shows the distribution of relative contaminant concentration (C/Cref) at a height of Z = 1.1 m under different ventilation modes of MV, ZV, SV and DV with infected source of B and physical barrier height of 0.6 m. Since the distance between infected occupant of B and return air outlet was reduced, the removal performance of MV for airborne pollutant was effectively improved compared to the scenario with the infected occupant located at A. The ZV remained to show great performance in decreasing the concentration of pollutant. The main reason is that the pollutants generated by infected source B could be effectively blocked by the jet from the inlets and physical barrier. With the condition of SV and DV, there was a slight growth in pollutant concentration at the breathing plane under the infected source B when compared to MV and ZV. Regarding the occupant percentage covered by indoor pollutant (with the relative concentration below 1%), MV, ZV, SV and DV could correspond to 16.3%, 16.3%, 18.6% and 32.6%, respectively. Compared to the infected source located at A, SV could contribute to mitigating the spread of contaminant when the infected source was located at position B. The average relative pollutant concentrations in the breathing zone were separately calculated as 0.12%, 0.15%, 0.20% and 0.27% for MV, ZV, SV and DV. ZV and MV can remove the pollutants effectively with the infected source location of B.
Next, the distribution of relative pollutant concentration (C/Cref) at the plane of Z = 1.1 m under the scenario of infected source of C is compared between the ventilation modes of MV, ZV, SV and DV (with the physical barrier height of 0.6 m), as shown in Figure 8. MV and DV could mitigate the dispersion of airborne contaminant well as the infected source was located at C. This phenomenon is due to the fact that the outlet was located directly above the infected occupant, resulting in the pollutant traveling straightly through the physical barrier to the outlet area. In comparison to the condition with infected source of A or B, the removal capability of pollutant was degraded for ZV under the infected source of C, owing to the fact that the jet cannot provide sufficient prevention against the dispersion of pollutant. The removal efficiency for SV almost remained the same under the infected source of B and C. To be specific, the number of occupants covered by indoor pollutant for MV and DV were equal to 1 and 2, respectively (in addition to infected occupant located at C). The coverage percentage of occupants by indoor contaminants for ZV and SV was calculated to be 21.0% and 16.3%, respectively (with the relative concentration less than 1%). The average relative pollutant concentrations in the breathing plane were separately obtained as 0.04%, 0.25%, 0.19% and 0.06% for MV, ZV, SV and DV. From the perspective of pollutant diffusion, ZV and SV could perform a stable and efficient mitigation efficacy of airborne pollutant transmission. It is important to note that the performance of MV and DV on decreasing the pollutant concentration may greatly depend on the relative spacing between the return air outlet and the infected source.
By simulating the spatial distributions of pollutant concentration in the office, the infection risk under different ventilation modes, as well as locations of the infected source, was evaluated by using the Equation (3). Figure 9 depicts the infection risk (with the exposure time of 1 h) corresponding to various ventilation modes of MV, ZV, SV and DV and locations of the infected source of A, B, C and A and B and C. With the variation of the infected source location, these ventilation modes could provide different levels in reducing the infection risk. For a single infected occupant, the infection risk of occupants under MV and DV significantly decreased from 37.2% and 33.0% to 9.3% and 8.3%, along with the reduced distance between the infected source and the outlet. This further illustrated that the uncertainty of infection risk for MV and DV was resulted in by the layout of the outlet. When using the ventilation modes of MV and DV, it is strongly suggested for occupants to be closer to the return air outlets. The ZV and SV possessed relatively stable performance in diminishing the infection risk, with a fluctuation of 4.3% and 9.7% under a single infected source. When the infected source was located at A, the probability of infection for ZV and SV decreased by 16.9% and 14.5%, respectively when compared to that of MV. When the infected source was at location B (C), the infection risk under ZV and SV could be slightly increased by 9.2% (6.7%) and 9.7% (3.7%) in comparison to that of MV. Considering the average infection probability under the scenarios of three single infected sources (A or B or C), ZV and SV both contributed to a minimum risk of about 19.4% and DV resulted in a maximum value of about 22.5%.
When there were multiple infected sources existing in the office room, a linear ventilation model (LVM) can be adopted to rapidly predict the corresponding distribution of pollutant concentration [46], to further calculate the infection risk. It can be obtained that SV provided the lowest infection risk of 17.7% when the infected sources were A and B and C. The infection risk of MV, SV and DV increased by 3.4%, 1.7% and 2.2% when compared to that of SV. In general, if the locations and number of infected sources are unknown in the office, SV had a great capacity to present the most comprehensive performance in mitigating the transmission of airborne infectious disease. From the perspective of ventilation performance, pollutant diffusion and infection risk, SV was favored to be utilized in the real-life office environment in this study.

4. Discussion

As mentioned above, the ventilation efficiency and infection risk of different ventilation modes consisting of mixing ventilation (MV), zone ventilation (ZV), stratum ventilation (SV) as well as displacement ventilation (DV) were evaluated in a real-life office to obtain the optimal ventilation strategy based on the spatial distributions of airflow and pollutant concentration under different scenarios of infected occupants. In general, SV was preferred due to the excellent performance of air distribution and mitigation of airborne infection disease transmission, on the premise of providing sufficient supply air volume. The following points need to be discussed.
In reality, it may be difficult for designers to determine the most effective ventilation mode due to inadequate parameters such as different usage or size of room and the unpredictability of occupant location, further leading to an unsatisfactory performance of an indoor ventilation system. One ventilation mode cannot be well applicable to any indoor environment. It is of great necessity to quantitatively assess the feasibility of various ventilation modes in different scenarios and form detailed guidelines for application, aiming to provide a clear reference for the optimal design of air conditioning and ventilation system.
It is also important to comprehensively evaluate the energy saving potential of using different ventilation modes. In this study, the same supply air volume was defined to meet the minimum ventilation requirement for an indoor safe environment, such as MV. The advanced ventilation modes, such as SV and ZV, can deliver the supply air directly to the occupied zone. It should be considered whether all ventilation modes need to meet the same minimum requirement of a supply air rate (i.e., calculated by the number of occupant and the share of outdoor air), especially during the epidemic normalization phase. The continuous operation mode of air conditioning and ventilation systems at a constant supply air velocity will inevitably result in rapid growth in the building’s energy consumption. The utilization of an optimized airflow pattern is intended to address the challenge of the reduction in energy efficiency due to oversupply of air. Thus, further investigation is required to determine the optimal supply air rate and energy saving solution for different ventilation modes in a specific case.
The most important goal in the design of a ventilation system is to reduce the threat of pollutants, (especially viral particles) to the occupants [47]. Ventilation modes such as ZV, SV and DV have provided different levels in lowering the exposure risk to indoor contaminants as compared to MV. The combination of different types of ventilation modes may potentially show better behavior in terms of efficiency for ventilation and pollutant removal rather than using a single ventilation mode. Besides, more kinds of ventilation modes need to be discussed, including personalized ventilation (PV) [48], demand-controlled ventilation [49] and intelligent ventilation [50], to establish a solid basis for actual application. For traditional ventilation modes such as MV, the location of outlets can play a critical role in the removal of pollutants. Hence, it is recommended that occupants should be seated closer to the area of return air, especially when the location of the pollutant source is unknown in an indoor room.
The limitations in this study should also be discussed. Firstly, this work used a simplified rectangular model to represent the occupants in an office to significantly reduce the computational cost. The model with realistic human geometry for occupants should be further considered. Secondly, steady-state numerical simulation was carried out in this study. However, the transmission of virus such as SARS-CoV-2 was usually associated to unsteady boundary conditions and indoor airflow fields, which should be explored in future investigations. Thirdly, in addition to airborne transmission, the droplet transmission mode of COVID-19 can play a significant role in infection of occupants. Future studies should take into account the evaporation process from liquid droplet to droplet nucleus during coughing or sneezing, the deposition of virus particles in indoor environments as well as the transmission risk of droplets in order to improve the reliability of evaluation of overall infection probability under different ventilation systems.

5. Conclusions

This study utilized the CFD model to simulate the distributions of airflow field and pollutant concentration in an office, based on which the impact of different ventilation strategies (i.e., airflow patterns) on ventilation efficiency and infection risk were further analyzed under different locations of infected source. By adopting effective interventions, such as installing the physical barrier above the desk, the optimal ventilation mode between MV, ZV, SV and DV was determined to improve the mitigation of airborne infectious disease transmission. The main conclusions are shown as follows.
  • Compared to MV, the ZV, SV and DV increased indoor average velocity by 12.5%, 43.8% and 31.3%, respectively. The SV and ZV could deliver the air from inlets directly to the breathing zone, which is more favorable for improving air distribution performance in an office. The ADPI values for MV, ZV, SV and DV reached above 80%. The SV could provide the ADPI value of 90.5%, which was largely increased by 6.3% as compared to that of MV.
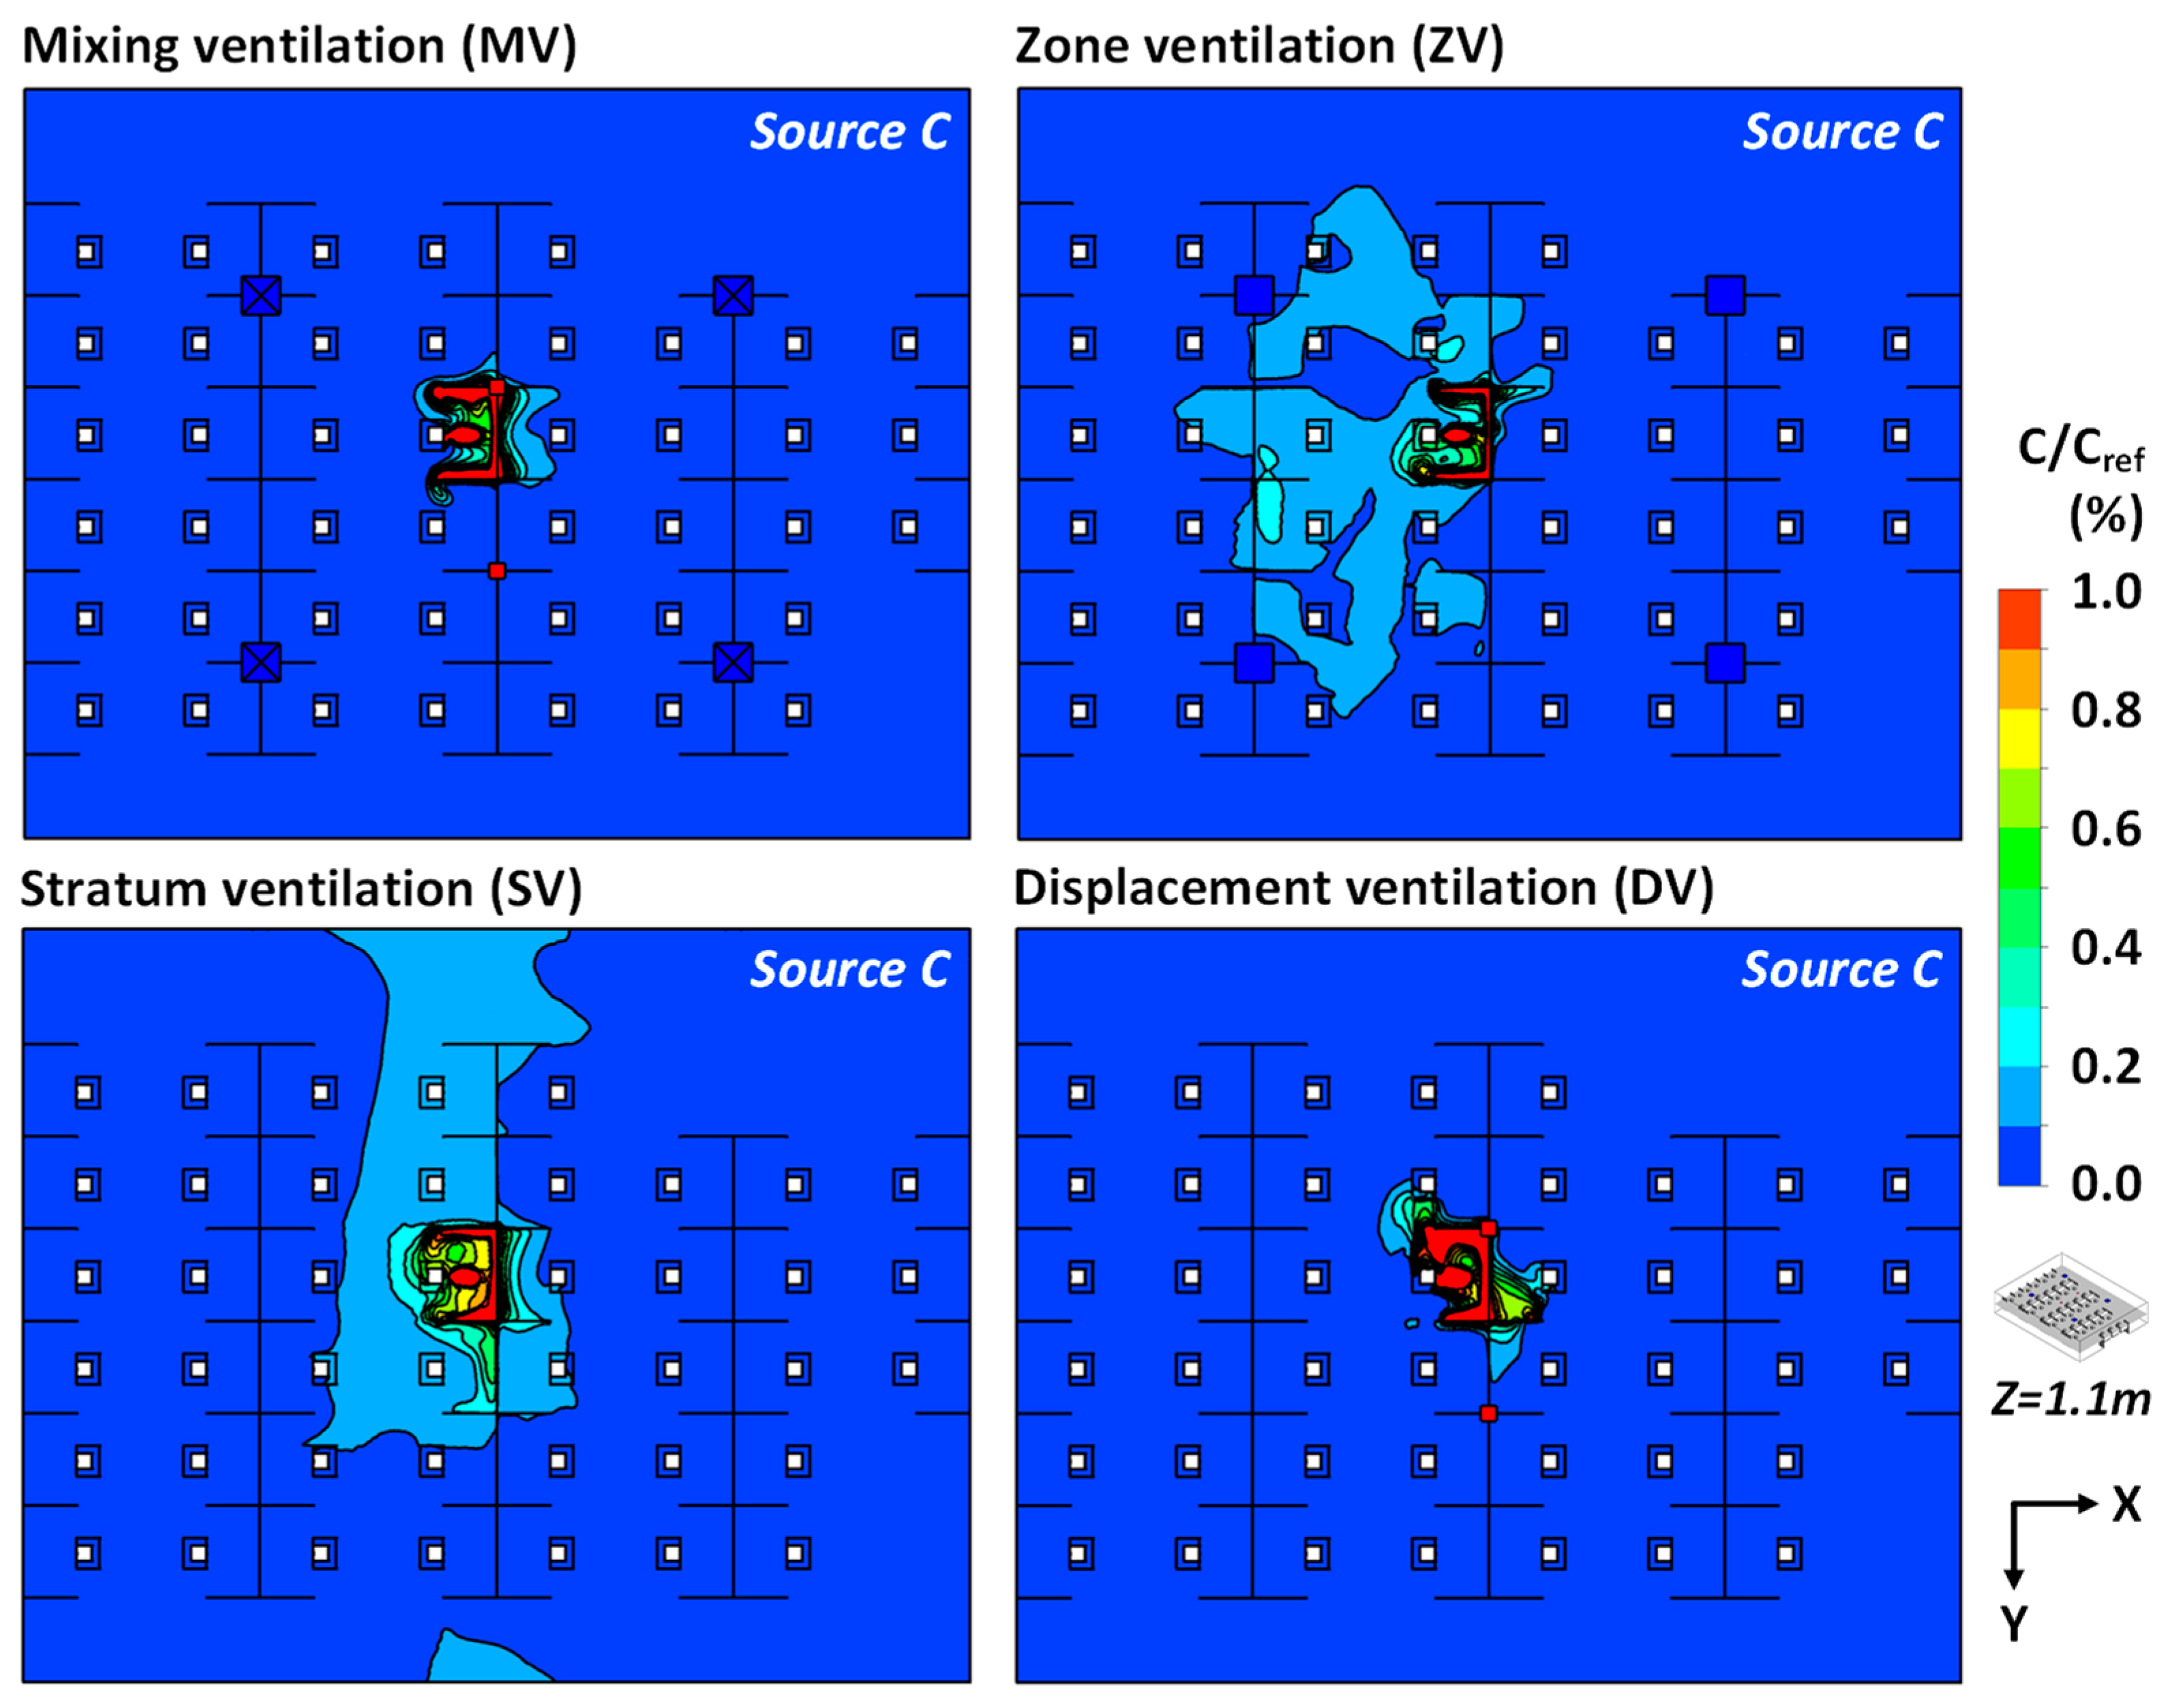
  • The ZV, SV and DV could improve the removal efficiency of airborne contaminant at different levels compared to MV, with the average pollutant concentration in the breathing region largely diminished by around 59.3%, 56.1% and 10.3%. The ZV and SV showed a stable and efficient mitigation performance of airborne pollutant transmission in the office.
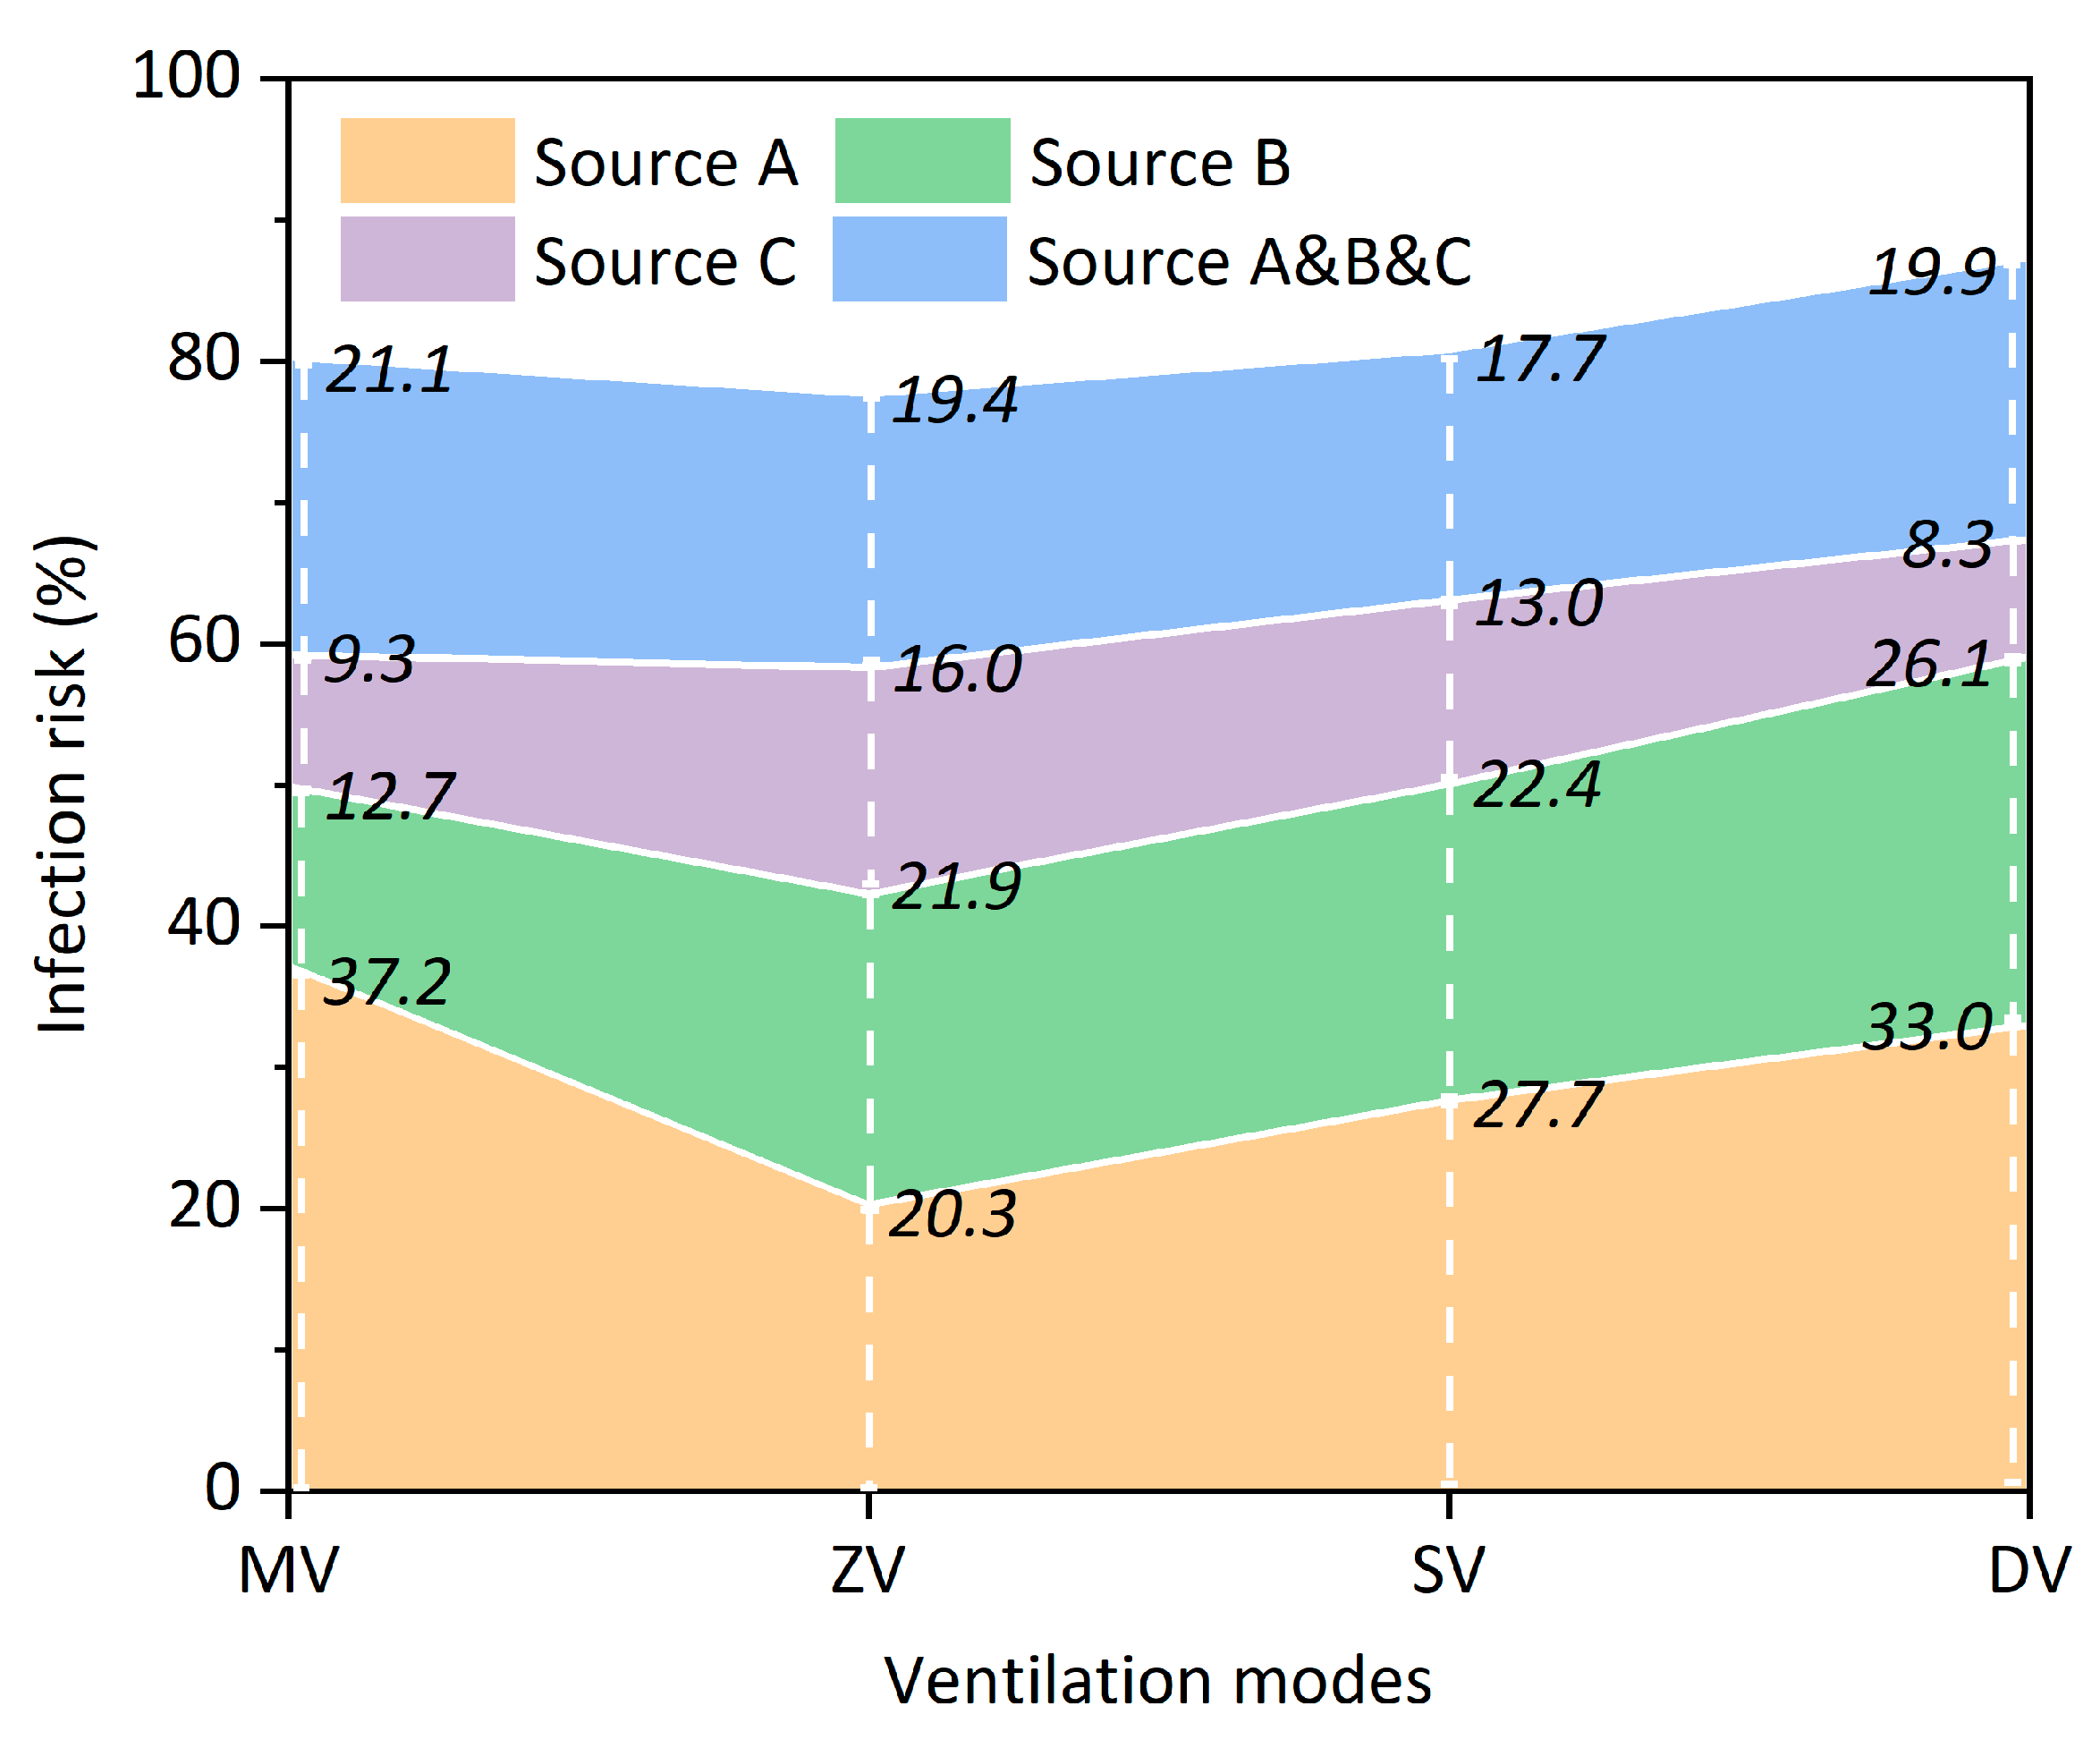
  • Regarding the average infection probability under different scenarios of a single infected source, a minimum infection risk of about 19.4% could be calculated for ZV and SV. The DV would result in a maximum infection risk of about 22.5%, increased by 2.8% compared to MV. Under the scenarios of multiple infected sources, the SV provided the lowest infection risk of 17.7%.
  • From the perspective of ventilation performance and infection risk, the SV showed an excellent performance in mitigating the transmission of airborne infectious disease in a real office room. The infection probability in an indoor environment using MV and DV was greatly dependent on the relative distance between the infected occupant and the outlet.

Author Contributions

Conceptualization, S.-J.C.; methodology, C.R.; software, C.R.; validation, C.R. and H.-C.Z.; formal analysis, H.-C.Z.; investigation, C.R.; resources, H.-C.Z.; data curation, C.R.; writing—original draft preparation, C.R.; writing—review and editing, S.-J.C.; visualization, C.R.; supervision, S.-J.C.; project administration, S.-J.C.; funding acquisition, S.-J.C. All authors have read and agreed to the published version of the manuscript.

Funding

This research was funded by National Natural Science Foundation of China (grant number 52178069 and 51778385), and Postgraduate Research & Practice Innovation Program of Jiangsu Province (grant number KYCX21_0112).

Institutional Review Board Statement

Not applicable.

Informed Consent Statement

Not applicable.

Data Availability Statement

All data that support the findings of this study are available from the corresponding author upon reasonable request.

Conflicts of Interest

The authors declare no conflict of interest.

Nomenclature

COVID-2019Coronavirus disease 2019
CDCCenters for Disease Control and Prevention
ASHRAEAmerican Society of Heating, Refrigerating and Air conditioning Engineer
MVMixing ventilation
ZVZone ventilation
SVStratum ventilation
DVDisplacement ventilation
CFDComputational fluid dynamics
RANSReynolds-averaged Navier–Stokes
φ Solved variables (i.e., velocity and temperature)
· ( ρ u ¯ φ ) Convection term
ρ Air density
u ¯ Average airflow velocity
· ( Γ φ φ ) Diffusion term
UDSUser-defined scalar
C ref The reference value of pollutant concentration
FVMFinite volume method
EDTEffective draught temperature
θ Value of EDT
t x Local air temperature
t a Average air temperature
v x Local airflow velocity
ADPIAir Diffusion Performance Index
R i n f Infection possibility
I R Inhalation rate of the exposed occupant
TTotal exposure time
C ( t ) Pollutant concentration (#/m3) over time t

References

  1. Salamone, F.; Barozzi, B.; Bellazzi, A.; Belussi, L.; Danza, L.; Devitofrancesco, A.; Ghellere, M.; Meroni, I.; Scamoni, F.; Scrosati, C. Working from home in italy during covid-19 lockdown: A survey to assess the indoor environmental quality and productivity. Buildings 2021, 11, 660. [Google Scholar] [CrossRef]
  2. WHO. Coronavirus Disease (COVID-19): How Is It Transmitted? Available online: www.who.int/news-room/questions-and-answers/item/coronavirus-disease-covid-19-how-is-it-transmitted (accessed on 23 December 2021).
  3. Morawska, L.; Tang, J.L.W.; Bahnfleth, W.; Bluyssen, P.M.; Boerstra, A.; Buonanno, G.; Cao, J.J.; Dancer, S.; Floto, A.; Franchimon, F.; et al. How can airborne transmission of COVID-19 indoors be minimised? Environ. Int. 2020, 142, 105832. [Google Scholar] [CrossRef] [PubMed]
  4. Bak, A.; Mugglestone, M.A.; Ratnaraja, N.V.; Wilson, J.A.; Rivett, L.; Stoneham, S.M.; Bostock, J.; Moses, S.E.; Price, J.R.; Weinbren, M.; et al. SARS-CoV-2 routes of transmission and recommendations for preventing acquisition: Joint british infection association (bia), healthcare infection society (his), infection prevention society (ips) and royal college of pathologists (rcpath) guidance. J. Hosp. Infect. 2021, 114, 79–103. [Google Scholar] [CrossRef] [PubMed]
  5. Xu, C.N.; Liu, W.B.; Luo, X.L.; Huang, X.Y.; Nielsen, P.V. Prediction and control of aerosol transmission of SARS-CoV-2 in ventilated context: From source to receptor. Sustain. Cities Soc. 2022, 76, 103416. [Google Scholar] [CrossRef]
  6. Wan, J.Y.; Wei, J.J.; Lin, Y.T.; Zhang, T.F. Numerical investigation of bioaerosol transport in a compact lavatory. Buildings 2021, 11, 526. [Google Scholar] [CrossRef]
  7. Law, R.C.K.; Lai, J.H.K.; Edwards, D.J.; Hou, H.Y. COVID-19: Research directions for non-clinical aerosol-generating facilities in the built environment. Buildings 2021, 11, 282. [Google Scholar] [CrossRef]
  8. Ren, C.; Xi, C.; Wang, J.Q.; Feng, Z.B.; Nasiri, F.; Cao, S.J.; Haghighat, F. Mitigating COVID-19 infection disease transmission in indoor environment using physical barriers. Sustain. Cities Soc. 2021, 74, 103175. [Google Scholar] [CrossRef]
  9. Feng, Z.B.; Cao, S.J.; Haghighat, F. Removal of SARS-CoV-2 using uv+filter in built environment. Sustain. Cities Soc. 2021, 74, 103226. [Google Scholar] [CrossRef]
  10. Feng, Z.B.; Cao, S.J. A newly developed electrostatic enhanced pleated air filters towards the improvement of energy and filtration efficiency. Sustain. Cities Soc. 2019, 49, 101569. [Google Scholar] [CrossRef]
  11. Ding, J.W.; Yu, C.W.; Cao, S.J. Hvac systems for environmental control to minimize the COVID-19 infection. Indoor Built Environ. 2020, 29, 1195–1201. [Google Scholar] [CrossRef]
  12. Xu, C.W.; Luo, X.L.; Yu, C.; Cao, S.J. The 2019-ncov epidemic control strategies and future challenges of building healthy smart cities. Indoor Built Environ. 2020, 29, 639–644. [Google Scholar] [CrossRef] [Green Version]
  13. Li, Y.; Leung, G.M.; Tang, J.W.; Yang, X.; Chao, C.Y.H.; Lin, J.Z.; Lu, J.W.; Nielsen, P.V.; Niu, J.; Qian, H.; et al. Role of ventilation in airborne transmission of infectious agents in the built environment—A multidisciplinary systematic review. Indoor Air 2007, 17, 2–18. [Google Scholar] [CrossRef] [PubMed]
  14. Mizumoto, K.; Chowell, G. Transmission potential of the novel coronavirus (COVID-19) onboard the diamond princess cruises ship, 2020. Infect. Dis. Model. 2020, 5, 264–270. [Google Scholar] [CrossRef]
  15. CDC. Ventilation in Buildings. Available online: www.cdc.gov/coronavirus/2019-ncov/community/ventilation.html (accessed on 4 May 2021).
  16. ASHRAE. Ashrae Position Document on Infectious Aerosols. Available online: www.ashrae.org/file%20library/about/position%20documents/pd_infectiousaerosols_2020.pdf (accessed on 14 April 2020).
  17. REHVA. Rehva COVID-19 Guidance. Available online: http://www.rehva.eu/fileadmin/user_upload/REHVA_COVID-19_guidance_document_ver2_20200403_1.pdf (accessed on 3 April 2020).
  18. Cao, S.J.; Ren, C. Ventilation control strategy using low-dimensional linear ventilation models and artificial neural network. Build. Environ. 2018, 144, 316–333. [Google Scholar] [CrossRef]
  19. Dai, H.; Zhao, B. Association of the infection probability of COVID-19 with ventilation rates in confined spaces. Build. Simul-China 2020, 13, 1321–1327. [Google Scholar] [CrossRef] [PubMed]
  20. Sun, C.J.; Zhai, Z.Q. The efficacy of social distance and ventilation effectiveness in preventing COVID-19 transmission. Sustain. Cities Soc. 2020, 62, 102390. [Google Scholar] [CrossRef]
  21. Cao, S.J.; Yu, C.W.; Luo, X.L. New and emerging building ventilation technologies. Indoor Built Environ. 2020, 29, 483–484. [Google Scholar] [CrossRef] [Green Version]
  22. Motamedi, H.; Shirzadi, M.; Tominaga, Y.; Mirzaei, P.A. Cfd modeling of airborne pathogen transmission of COVID-19 in confined spaces under different ventilation strategies. Sustain. Cities Soc. 2022, 76, 103397. [Google Scholar] [CrossRef]
  23. Ren, C.; Cao, S.J.; Haghighat, F. A practical approach for preventing dispersion of infection disease in naturally ventilated room. J. Build. Eng. 2022, 48, 103921. [Google Scholar] [CrossRef]
  24. Dincer, D.; Gocer, O. Quarantine hotels: The adaptation of hotels for quarantine use in australia. Buildings 2021, 11, 617. [Google Scholar] [CrossRef]
  25. Wang, J.Q.; Huang, J.J.; Feng, Z.B.; Cao, S.J.; Haghighat, F. Occupant-density-detection based energy efficient ventilation system: Prevention of infection transmission. Energy Build. 2021, 240, 110883. [Google Scholar] [CrossRef]
  26. Jia, L.R.; Han, J.; Chen, X.; Li, Q.Y.; Lee, C.C.; Fung, Y.H. Interaction between thermal comfort, indoor air quality and ventilation energy consumption of educational buildings: A comprehensive review. Buildings 2021, 11, 591. [Google Scholar] [CrossRef]
  27. Hawendi, S.; Gao, S. Impact of windward inlet-opening positions on fluctuation characteristics of wind-driven natural cross ventilation in an isolated house using les. Int. J. Vent. 2018, 17, 93–119. [Google Scholar] [CrossRef]
  28. Park, S.; Choi, Y.; Song, D.; Kim, E.K. Natural ventilation strategy and related issues to prevent coronavirus disease 2019 (covid-19) airborne transmission in a school building. Sci. Total Environ. 2021, 789, 147764. [Google Scholar] [CrossRef]
  29. Qi, J.; Wei, C.Y. Performance evaluation of climate-adaptive natural ventilation design: A case study of semi-open public cultural building. Indoor Built Environ. 2021, 30, 1714–1724. [Google Scholar] [CrossRef]
  30. Li, C.Y.; Tang, H.D. Study on ventilation rates and assessment of infection risks of covid-19 in an outpatient building. J. Build. Eng. 2021, 42, 103090. [Google Scholar] [CrossRef]
  31. Cao, S.J.; Feng, Z.B.; Wang, J.Q.; Ren, C.; Zhu, H.C.; Chen, G.; Mei, J.T. Ergonomics-oriented operation, maintenance and control of indoor air environment for public buildings. Chin. Sci. Bull. 2020, 67, 1–13. [Google Scholar] [CrossRef]
  32. Li, Y.G.; Qian, H.; Hang, J.; Chen, X.G.; Cheng, P.; Ling, H.; Wang, S.Q.; Liang, P.; Li, J.S.; Xiao, S.L.; et al. Probable airborne transmission of SARS-CoV-2 in a poorly ventilated restaurant. Build. Environ. 2021, 196, 107788. [Google Scholar] [CrossRef]
  33. Cao, G.Y.; Awbi, H.; Yao, R.M.; Fan, Y.Q.; Siren, K.; Kosonen, R.; Zhang, J.S. A review of the performance of different ventilation and airflow distribution systems in buildings. Build. Environ. 2014, 73, 171–186. [Google Scholar] [CrossRef]
  34. Tomasi, R.; Krajcik, M.; Simone, A.; Olesen, B.W. Experimental evaluation of air distribution in mechanically ventilated residential rooms: Thermal comfort and ventilation effectiveness. Energy Build. 2013, 60, 28–37. [Google Scholar] [CrossRef]
  35. Kang, Z.Q.; Zhang, Y.X.; Fan, H.B.; Feng, G.H. Numerical simulation of coughed droplets in the air-conditioning room. Procedia Eng. 2015, 121, 114–121. [Google Scholar] [CrossRef] [Green Version]
  36. Tian, X.; Lin, Z. Dynamic modelling of air temperature in breathing zone with stratum ventilation using a pulsating air supply. Build. Environ. 2021, 210, 108697. [Google Scholar] [CrossRef]
  37. Tian, X.; Li, B.Z.; Ma, Y.X.; Liu, D.; Li, Y.C.; Cheng, Y. Experimental study of local thermal comfort and ventilation performance for mixing, displacement and stratum ventilation in an office. Sustain. Cities Soc. 2019, 50, 101630. [Google Scholar] [CrossRef]
  38. Li, H.; Xi, C.; Kong, X.F.; Lin, Z.; Wang, L. A comparative experimental investigation on radiant floor heating system and stratum ventilation. Sustain. Cities Soc. 2020, 52, 101823. [Google Scholar] [CrossRef]
  39. Lu, Y.L.; Oladokun, M.; Lin, Z. Reducing the exposure risk in hospital wards by applying stratum ventilation system. Build. Environ. 2020, 183, 107204. [Google Scholar] [CrossRef]
  40. Cao, G.; Nielsen, P.V.; Jensen, R.L.; Heiselberg, P.; Liu, L.; Heikkinen, J. Protected zone ventilation and reduced personal exposure to airborne cross-infection. Indoor Air 2015, 25, 307–319. [Google Scholar] [CrossRef]
  41. Cao, G.Y.; Siren, K.; Kilpelainen, S. Modelling and experimental study of performance of the protected occupied zone ventilation. Energ Build. 2014, 68, 515–531. [Google Scholar] [CrossRef]
  42. Cheng, Y.; Lin, Z. Experimental investigation into the interaction between the human body and room airflow and its effect on thermal comfort under stratum ventilation. Indoor Air 2016, 26, 274–285. [Google Scholar] [CrossRef]
  43. Li, H.Y.; Leong, F.Y.; Xu, G.; Kang, C.W.; Lim, K.H.; Tan, B.H.; Loo, C.M. Airborne dispersion of droplets during coughing: A physical model of viral transmission. Sci. Rep. 2021, 11, 4617. [Google Scholar] [CrossRef]
  44. Liu, S.C.; Novoselac, A. Air diffusion performance index (adpi) of diffusers for heating mode. Build. Environ. 2015, 87, 215–223. [Google Scholar] [CrossRef]
  45. Buonanno, G.; Stabile, L.; Morawska, L. Estimation of airborne viral emission: Quanta emission rate of SARS-CoV-2 for infection risk assessment. Environ. Int. 2020, 141, 105794. [Google Scholar] [CrossRef]
  46. Ren, C.; Cao, S.J. Development and application of linear ventilation and temperature models for indoor environmental prediction and hvac systems control. Sustain. Cities Soc. 2019, 51, 101673. [Google Scholar] [CrossRef]
  47. Sha, H.H.; Qi, D.H. A review of high-rise ventilation for energy efficiency and safety. Sustain. Cities Soc. 2020, 54, 101971. [Google Scholar] [CrossRef]
  48. Georgescu, M.R.; Meslem, A.; Nastase, I.; Bode, F. Personalized ventilation solutions for reducing co2 levels in the crew quarters of the international space station. Build. Environ. 2021, 204, 108150. [Google Scholar] [CrossRef]
  49. Afroz, Z.; Higgins, G.; Shafiullah, G.M.; Urmee, T. Evaluation of real-life demand-controlled ventilation from the perception of indoor air quality with probable implications. Energy Build. 2020, 219, 110018. [Google Scholar] [CrossRef]
  50. Ren, C.; Cao, S.J. Implementation and visualization of artificial intelligent ventilation control system using fast prediction models and limited monitoring data. Sustain. Cities Soc. 2020, 52, 101860. [Google Scholar] [CrossRef]
Figure 1. Sketch map of different ventilation modes.
Buildings 12 00180 g001
Figure 2. Schematic diagram of various ventilation modes in the office, including mixing ventilation (MV), zone ventilation (ZV), stratum ventilation (SV) and displacement ventilation (DV).
Buildings 12 00180 g002
Figure 3. Layout of three infected occupants (source) of A, B and C in the office.
Buildings 12 00180 g003
Figure 4. Streamline distribution of different ventilation modes in the office, including mixing ventilation (MV), zone ventilation (ZV), stratum ventilation (SV) and displacement ventilation (DV).
Buildings 12 00180 g004
Figure 5. Calculation of ADPI values for different ventilation modes of mixing ventilation (MV), zone ventilation (ZV), stratum ventilation (SV) and displacement ventilation (DV).
Buildings 12 00180 g005
Figure 6. Distribution of relative pollutant concentration (C/Cref) at the plane of Z = 1.1 m under different ventilation modes of MV, ZV, SV and DV and infected source of A (with a height of physical barrier of 0.6 m).
Buildings 12 00180 g006
Figure 7. Distribution of relative pollutant concentration (C/Cref) at the plane of Z = 1.1 m under different ventilation modes of MV, ZV, SV and DV and infected source of B (with a height of physical barrier of 0.6 m).
Buildings 12 00180 g007
Figure 8. Distribution of relative pollutant concentration (C/Cref) at the plane of Z = 1.1 m under different ventilation modes of MV, ZV, SV and DV and infected source of C (with a height of physical barrier of 0.6 m).
Buildings 12 00180 g008
Figure 9. Infection risk (with exposure time of 1 h) under different ventilation modes of MV, ZV, SV and DV and locations of infected source of A, B, C and A and B and C.
Buildings 12 00180 g009
Table 1. Information of inlets and outlets for different ventilation modes.
Ventilation ModesMixing Ventilation (MV)Zone Ventilation (ZV)Stratum Ventilation (SV)Displacement Ventilation (DV)
inlet size (m)0.5 × 0.5
(with diffuser)
0.5 × 0.51.25 × 0.20.625 × 0.2
number of inlets4448
supply air velocity (m/s)1.731.731.731.73
outlet size (m)0.2 × 0.20.2 × 0.20.2 × 0.20.2 × 0.2
number of outlets2222
Table 2. Boundary conditions of numerical simulation model.
BoundaryTypeConditions
InletVelocity-inletSupply air velocity: 1.73 m/s
Supply air temperature: 25 °C
OutletOutflow
WallNon-slip wallWall temperature: 15 °C
OccupantNon-slip wallBody temperature: 24 °C
Head temperature: 34 °C
Mouth temperature: 36 °C
Average airflow velocity of coughing: 13 m/s downwards at 27.5°
Average breathing rate: 0.7 m/s
Airflow temperature for coughing and breathing: 36 °C
Physical barrier and deskNon-slip wall
Table 3. Overview of simulation cases.
Case No.Ventilation ModeInfected SourceNote
1MVNoneEvaluation of ventilation performance
2ZVNone
3SVNone
4DVNone
5–7MVA, B and CEvaluation of infection risk
8–10ZVA, B and C
11–13SVA, B and C
14–16DVA, B and C
Publisher’s Note: MDPI stays neutral with regard to jurisdictional claims in published maps and institutional affiliations.

