Article

Life Cycle Assessment Meeting Energy Standard Performance: An Office Building Case Study

by
Svetlana Pushkar
1,2,* and
Abraham Yezioro
2
1
Department of Civil Engineering, Ariel University, Ariel 40700, Israel
2
Faculty of Architecture and Town Planning, Technion Israel Institute of Technology, Haifa 3200003, Israel
*
Author to whom correspondence should be addressed.
Buildings 2022, 12(2), 157; https://doi.org/10.3390/buildings12020157
Submission received: 19 December 2021 / Revised: 28 January 2022 / Accepted: 30 January 2022 / Published: 2 February 2022
(This article belongs to the Section Building Energy, Physics, Environment, and Systems)

Abstract

:
Transitioning from fossil to renewable energies, particularly photovoltaic (PV) energy, could influence building design in terms of environmental evaluation. The aim of this study was to rate a typical office building that complies with the Israeli Standard SI5282, Energy Rating of Buildings, and to evaluate it by life cycle assessment (LCA). An office building in Tel Aviv with four exterior wall construction technologies was modeled as follows: (1) a concrete-block-based wall with minimal windows; (2) a concrete-block-based wall with maximal windows; (3) an autoclaved aerated-block-based wall with minimal windows; and (4) an autoclaved aerated-block-based wall with maximal windows. The electricity sources used to support the building’s operational energy were: (i) 31% coal, 56% natural gas, and 13% PV (adopted in 2020); (ii) 8% coal, 57% natural gas, and 35% PV (planned for 2025); and (iii) 100% PV (planned for the future). A two-stage nested mixed analysis of variance was used to simultaneously evaluate the results of six ReCiPe2016 methodologies. The results show that as fossil fuels are replaced by PV energy production, there is a greater need to use LCA methodology in building design in conjunction with energy standards. The energy rating is recommended to be carried out with an environmental assessment of the production stage of construction. Ignoring the LCA results could lead to the misinterpretation of a building’s sustainability.

1. Introduction

The European Union Directive on the Energy Performance of Buildings stated that, by 2020, all new buildings should be near zero-energy buildings (nZEBs) [1]. Currently, in Israel, there are two voluntary standards that regulate the design of green buildings: Green Building standard SI5281 for sustainable building, and Standard SI5282 for the energy rating of buildings.
SI5281 sustainable buildings (Green Building Standard) have the following requirements for core and shell buildings. Office buildings, presented by the Standards Institution of Israel (SII) in 2016, should include eight differently weighted sustainable categories: energy (36%); land (15%); water (13%); materials (10%); health and well-being (11%); waste (4%); transport (5%); and construction site management (6%). SI5281 refers to SI5282 as a tool for assessing energy consumption to obtain credits for the energy category.
The SI5282 energy rating of buildings are defined as follows. Office buildings, developed by SII in 2011, should regulate the building energy for heating, cooling, and lighting (operational energy) with the following design variables: lighting control, exterior and interior shading, window size, glazing, thermal mass of exterior walls and roof, and ventilation. To achieve an energy rating, standard SI5282 suggests using the prescriptive–descriptive approach [2], or the performance approach. The prescriptive–descriptive approach presents different presets for the design variables, thereby allowing energy saving to be achieved according to the target energy ranking. The performance approach evaluates a proposed building design according to its energy efficiency ratio in relation to a reference building (simulated with the parameters specified in SI5282) from level F (worst) through levels D, C, B, and A to level A+ (best).
Such high priority for energy in standards SI5281 and SI5282 was based on fossil fuels being used in Israel as a basic electricity source. In particular, in 2015, electricity production was approximately 50% coal and 50% gas [3]. However, the dynamics of the dependence on fossil fuel-based energy have changed significantly due to an increase in the share of natural gas (about 56%), a decrease in the share of coal (about 31%), and the development of renewable energy sources (about 13%) [4]. Following the Electricity Status Report published by the Electricity Authority of Israel, it is projected that by 2025, the production of electricity will be 8% from coal, 57% from natural gas, and 35% from renewables (81% PV, 5% wind, 2% solar thermal, and 12% other sources) [4]. In the context of Israel, solar energy has the greatest potential due to the high solar radiation [5]. In addition, the National Energy Efficiency Program 2020–2030 aims to make SI5281 a mandatory standard and introduce nZEBs in Israel [6].
Due to the future development of solar energy in Israel, the environmental damage from energy production could be decreased. The environmental damage of material production based on the design variables of SI5282 might thus become predominant. This idea has previously been used in several other studies regarding energy rating standards and green building standards in different countries. For example, to estimate nZEB, Giordano et al. [7] suggested that the building energy rating standard should evaluate production energy in addition to the currently considered operating energy. The authors analyzed two residential buildings—masonry-based and steel framed—located in the Province of Turin (Italy) and reported that the production energy could reach 53–61% of the total production and operational energy.
Lessard et al. [8] criticized the Leadership in Energy and Environmental Design (LEED) for the Building Design and Construction (v4) developed by the US Green Building Council (USGBC). The authors noticed that the energy (energy and atmosphere, EA category) had higher priority than the materials (materials and resources, MR category), i.e., 30% and 12% of the total LEED points, respectively. Lessard et al. [8] claimed that such high priority for EA was based on fossil fuels for energy production for building heating, cooling, and lighting in the past. In this respect, the authors evaluated the production and operational energy of a steel-framed curtain wall-type office building located in Quebec (Canada) with more than 95% renewable electricity sources, and confirmed that the material production contributes to more than 50% of the impacts related to the total production and operational energy.
Amiri et al. [9] also criticized LEED for Building Design and Construction (v4) for low points, with three (out of a total of 110 available points) that can be awarded for decreasing emissions related to the production of building materials. The authors conducted an environmental evaluation of the production of three building material scenarios, optimized concrete, hybrid concrete–wood, and wooden, applied to a modern educational facility at the University of Iceland in Reykjavik (Iceland), and concluded that in the LEED framework, hybrid and wooden buildings should obtain 8 and 14 points, respectively. Thus, Amiri et al. [9] recommended increasing the weight of sustainable building materials to certify green buildings.
The appropriate methodologies to measure the environmental consequences of building production and operational stages are the Life Cycle Energy Assessment (LCEA) and the Life Cycle Assessment (LCA) [10]. Although the LCEA and LCA of a building include a broad scope of life cycle stages—such as production and construction, operational energy, maintenance, replacement, demolition and disposal—operational energy (OE) and production and replacement (P&R) are the stages with the most influence on LCEA and LCA [11].
Moreover, P&R and OE stages are highly influenced by: (i) local climate, (ii) the building technologies, and (iii) the primary fuel source for the OE production [11]. Currently, there are a limited number of studies analyzing the LCEA or LCA of buildings that are built with current building materials available on the market in Israel. These are mostly concrete-based [12].
Huberman and Pearlmutter [13] studied the LCEA of suggested alternatives, fly-ash blocks (soil), fly-ash blocks (mixed), and stabilized soil blocks, instead of standard concrete for exterior walls. The analyzed building was located at the Sede Boqer campus of Ben-Gurion University, in the arid Negev region. They reported that production energy decreased significantly (by approximately 30%) by using the alternative blocks, thereby decreasing the LCEA value by 16%, and they used CO2 climate change emissions and energy depletion as the environmental indicators. However, Dong et al. [14], in their comprehensive review, noted that “climate change and energy depletion are not always the most significant impact categories”. They recommended using additional environmental indicators, such as eutrophication, acidification, and ozone depletion. It should be noted that the environmental impacts from the OE stage on the building sector strongly depend on the primary fuel source used in energy production [14].
In this respect, Pushkar and Verbitsky [15] conducted a LCA of four exterior wall construction approaches in which OE was produced, using two alternative energy sources, natural gas and PV. The simulated residential building was placed in four climatic zones in Israel: a hot Mediterranean climate (represented by Tel Aviv), an arid climate (represented by Beer Sheva), a mild Mediterranean climate (represented by Jerusalem), and a desert climate (represented by Eilat). The building was designed with thermal conductivity (U-value) according to the mandatory Israeli standard SI1045-1—Thermal insulation of buildings: Residential buildings—presented by SII in 2019, and included four alternatives for exterior wall construction: concrete, lightweight concrete blocks, autoclaved aerated blocks, and concrete blocks. The authors concluded that in the case of energy fuels such as natural gas, OE dominated, with about 85% of the total LCA value, and in the case of solar energy, P&R dominated, with about 70% of the total LCA value. However, the OE stage in office buildings in accordance with SI5282 has not yet been analyzed.
Pushkar and Verbitsky [16] investigated the OE stage according to SI5282 in an office building module (6.1 × 8.2 × 3.7 m) located in the mild Mediterranean climate, represented by Jerusalem. The module had one external wall built with concrete and included a single south-facing window. The authors studied improvements to the model from a lower SI5282 OE rating (E), through intermediate ratings (D, C, B), to a higher rating (A), by adding wall insulation, glazing, and an external horizontal overhang. OE was evaluated with two alternatives: 100% natural gas and 100% PV. For 100% PV, the authors found that levels A and B were associated with more significant environmental damage than level C. This can be explained by the fact that the thermal improvements to the module resulted in increased environmental damage from the P&R stage. However, that study took into account very limited model parameters, only a simple building module, and concrete-based exterior wall technology. Thus, according to the relevant literature, the LCA of the P&R and OE stages of a full typical office building located in Israel rated according to energy standard SI5282 has not yet been performed.
Taking into account the need to mitigate the environmental impact caused by the construction sector in order to reduce the current global climate crisis, this study proposes to modify SI5282, evaluating the P&R stage, in addition to reducing energy consumption. Therefore, the aim of this study was to conduct a LCA (P&R and OE stages) of an office building based on SI5282 with current and future energy sources to support the OE stage in Israel.
To achieve this goal, an office building in Tel Aviv with four exterior wall construction technologies built with the current materials available in the Israeli market was modeled: (1) a concrete-block-based wall with minimal windows (CBMinWin); (2) a concrete-block-based wall with maximal windows (CBMaxWin); (3) an autoclaved aerated-block-based wall with minimal windows (AABMinWin); and (4) an autoclaved aerated-block-based wall with maximal windows (AABMaxWin).
The findings that cover concrete-based building technologies in the hot Mediterranean climate of Israel can be useful for other locations with similar building materials in the construction market and similar climate conditions.

2. Materials and Methods

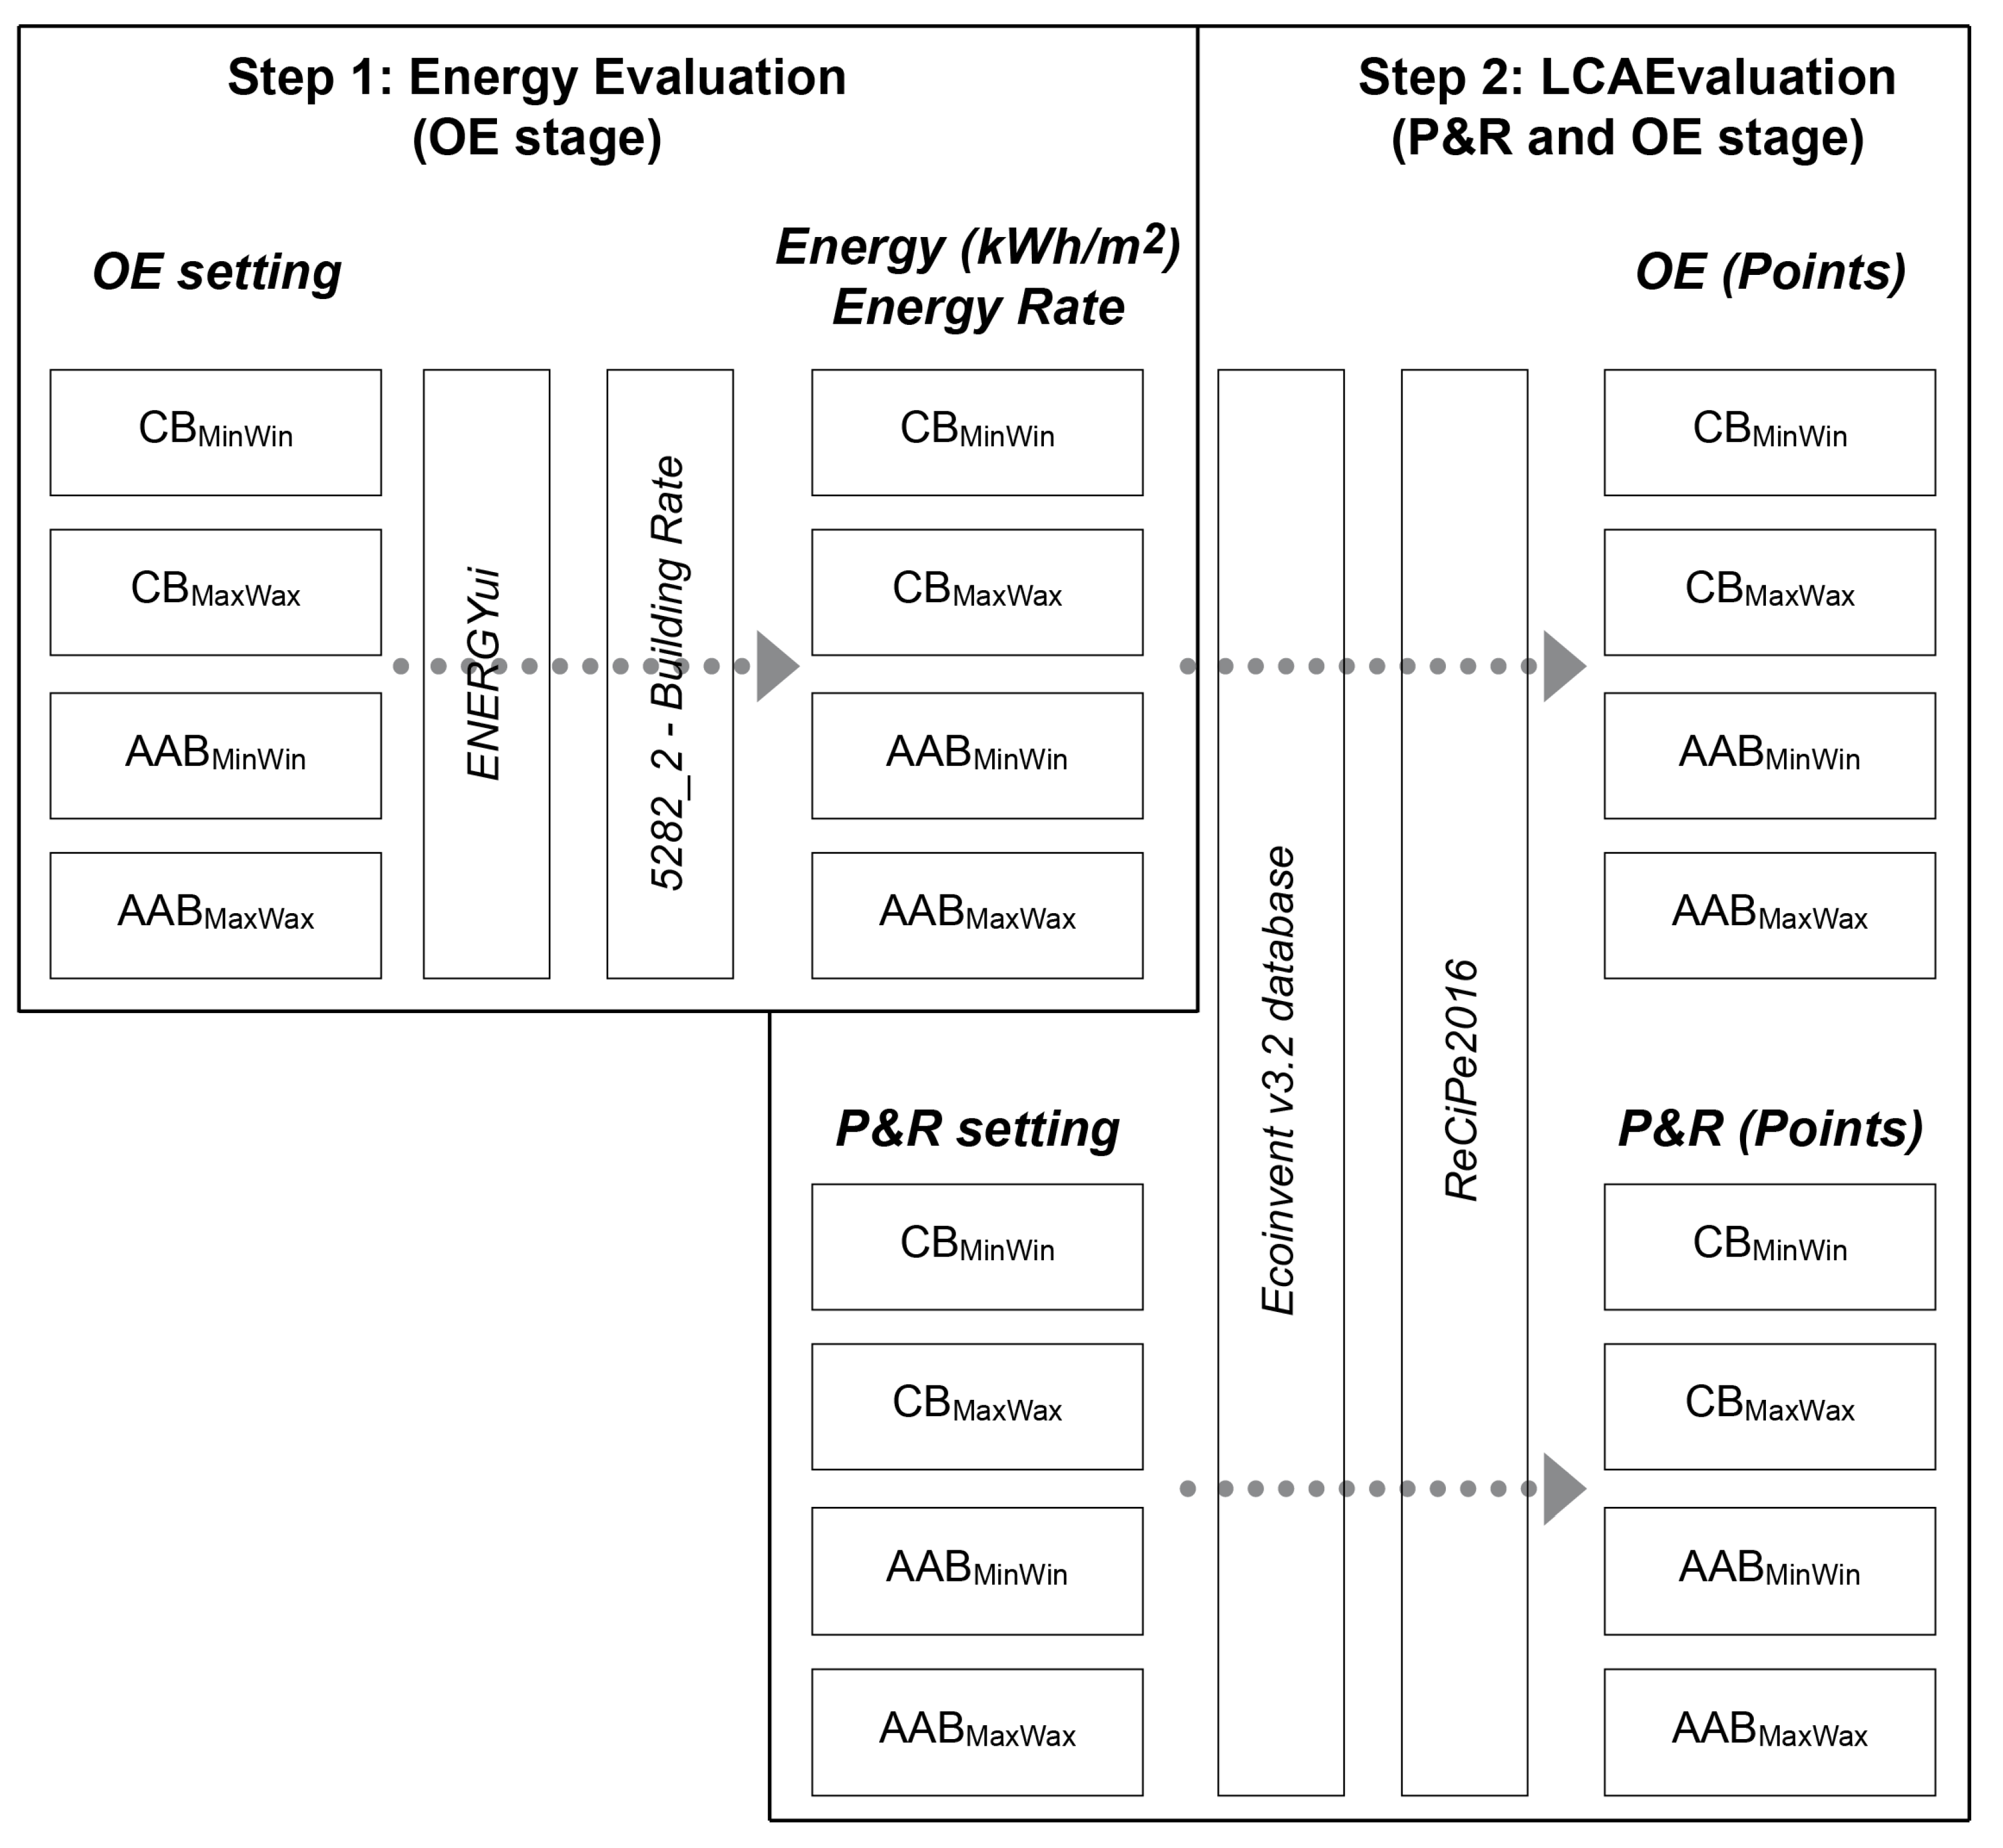
2.1. Research Framework

This study examined two LCA stages, P&R and OE, of a simulated typical 5-story office building located in Tel Aviv, Israel. Figure 1 shows the analyzed office building, the proportions of which (51.5 × 16.4 × 3.7 m) were based on an office depth of 5 m.
The exterior walls of the building were modeled from concrete and autoclaved aerated blocks (both with minimum and maximum windows), which resulted in 4 opposite options: a concrete-block-based side with minimal windows (CBMinWin); a concrete-block-based side with maximal windows (CBMaxWin); an autoclaved aerated-block-based side with minimal windows (AABMinWin); and an autoclaved aerated-block-based side with maximal windows (AABMaxWin). These alternatives were based on the supposition that: (i) there is a significant difference in OE ranks between a building with minimal windows and one with maximal windows, and (ii) there is a significant difference in P&C damage between exterior concrete-block-based and autoclaved aerated-block-based walls. This is because, in the hot Mediterranean climate in Tel Aviv, maximal windows can result in higher OE damage than minimal windows [17], and autoclaved aerated blocks can cause less P&R damage than concrete blocks [15].
The LCA of the P&R and OE stages of the studied alternatives was performed in a 2-step procedure. In the first step, using the ENERGYui model [18], we evaluated heating, cooling, and lighting energy (OE stage) for each of the 5 building floors and the whole building, and determined the building energy rates. In the second step, using the Ecoinvent database and ReCiPe [19], we performed the LCA of the P&R and OE stages of the 4 alternatives applied to a typical interior floor. Figure 2 shows a flow chart diagram of the methodology used in the present work. Detailed explanations of these evaluation steps are presented in Section 2.2 and Section 2.3.

2.2. Energy Assessment of the OE Stage

Table 1 shows the main settings of the office building, and Table 2 shows the building components with the composite materials of the 4 studied alternatives. The building was designed according to SI5282-2. Its main façade orientation was north–south, because it was recently reported to be optimal for this type of office building located in Tel Aviv [17]. Building components were constructed according to the local building technologies.
In the first step of the OE assessment, the ENERGYui model was used, which was specifically developed for energy design and building ratings in Israel [17]. The model contains a materials library certified by the Standards Institution of Israel. It is connected to the robust hourly dynamic EnergyPlus simulation model developed by the US Department of Energy [18].
Initially, the OE (kWh/m2∙year) was evaluated for each of the 5 floors and the whole building. Then, the whole building’s energy results were rated according to standard SI5282-2. The standard rates proposed building designs according to the ratio of energy savings in relation to a reference building (modeled with parameters stated in SI5282) between level F (worst) and level A+ (best).

2.3. LCA of P&R and OE Stages

In the second step, we used LCA methodology. According to International Organization for Standardization (ISO), 14,040 environmental management Life Cycle Assessment principles and frameworks were issued by the International Organization for Standardization in Geneva, Switzerland, in 2006. LCAs contain the following: (i) goal and scope setting (selection of a functional unit (FU) and system boundaries); (ii) life cycle inventory (LCI) completion; (iii) life cycle impact assessment (LCIA); and (iv) interpretation.

2.3.1. Goal and Scope

FU is a reference to which inputs (materials and energy) and outputs (emissions and wastes) are related. Considering the typical 5-story office building, the proper FU is a typical intermediate floor which is served with OE for 50 years. The FU allows us to evaluate both P&R and OE stages.
Despite operation energy during the construction and demolition being different for all the 4 alternatives, we decided to exclude these stages from the scope of this research. This is due to a lack of data regarding on-site equipment operations, and also based on the literature suggestions that construction and demolition have a small contribution to the total LCA: approximately 3% [20] and 0.2% [21], respectively.
In addition, ISO 14040 states that according to LCA methodology, only alternatives with different materials can be compared. Thus, only exterior walls, windows, and shading components of the 4 alternatives (Table 2) were evaluated.
As a result, the system boundary included both P&R and OE stages for a typical intermediate floor of the office building, which was served with OE produced from: (i) the current electricity sources in 2020 (31% coal, 56% natural gas, and 13% PV) [4]; (ii) the planned electricity sources in 2025 (8% coal, 57% natural gas, and 35% PV) [4]; and (iii) the hypothetical future electricity source (100% PV) [5] for 50 years. The lifetime of windows with aluminum frames and PV modules is considered to be 30 [22] and 25 [23] years, respectively. Therefore, both windows and PV modules were replaced twice during the 50 years of the building’s lifetime. Transporting building components to the building site was excluded from the system boundary of this study, due to the similar short distances between the suppliers of exterior walls, windows, and shading components to building sites in Israel [24].

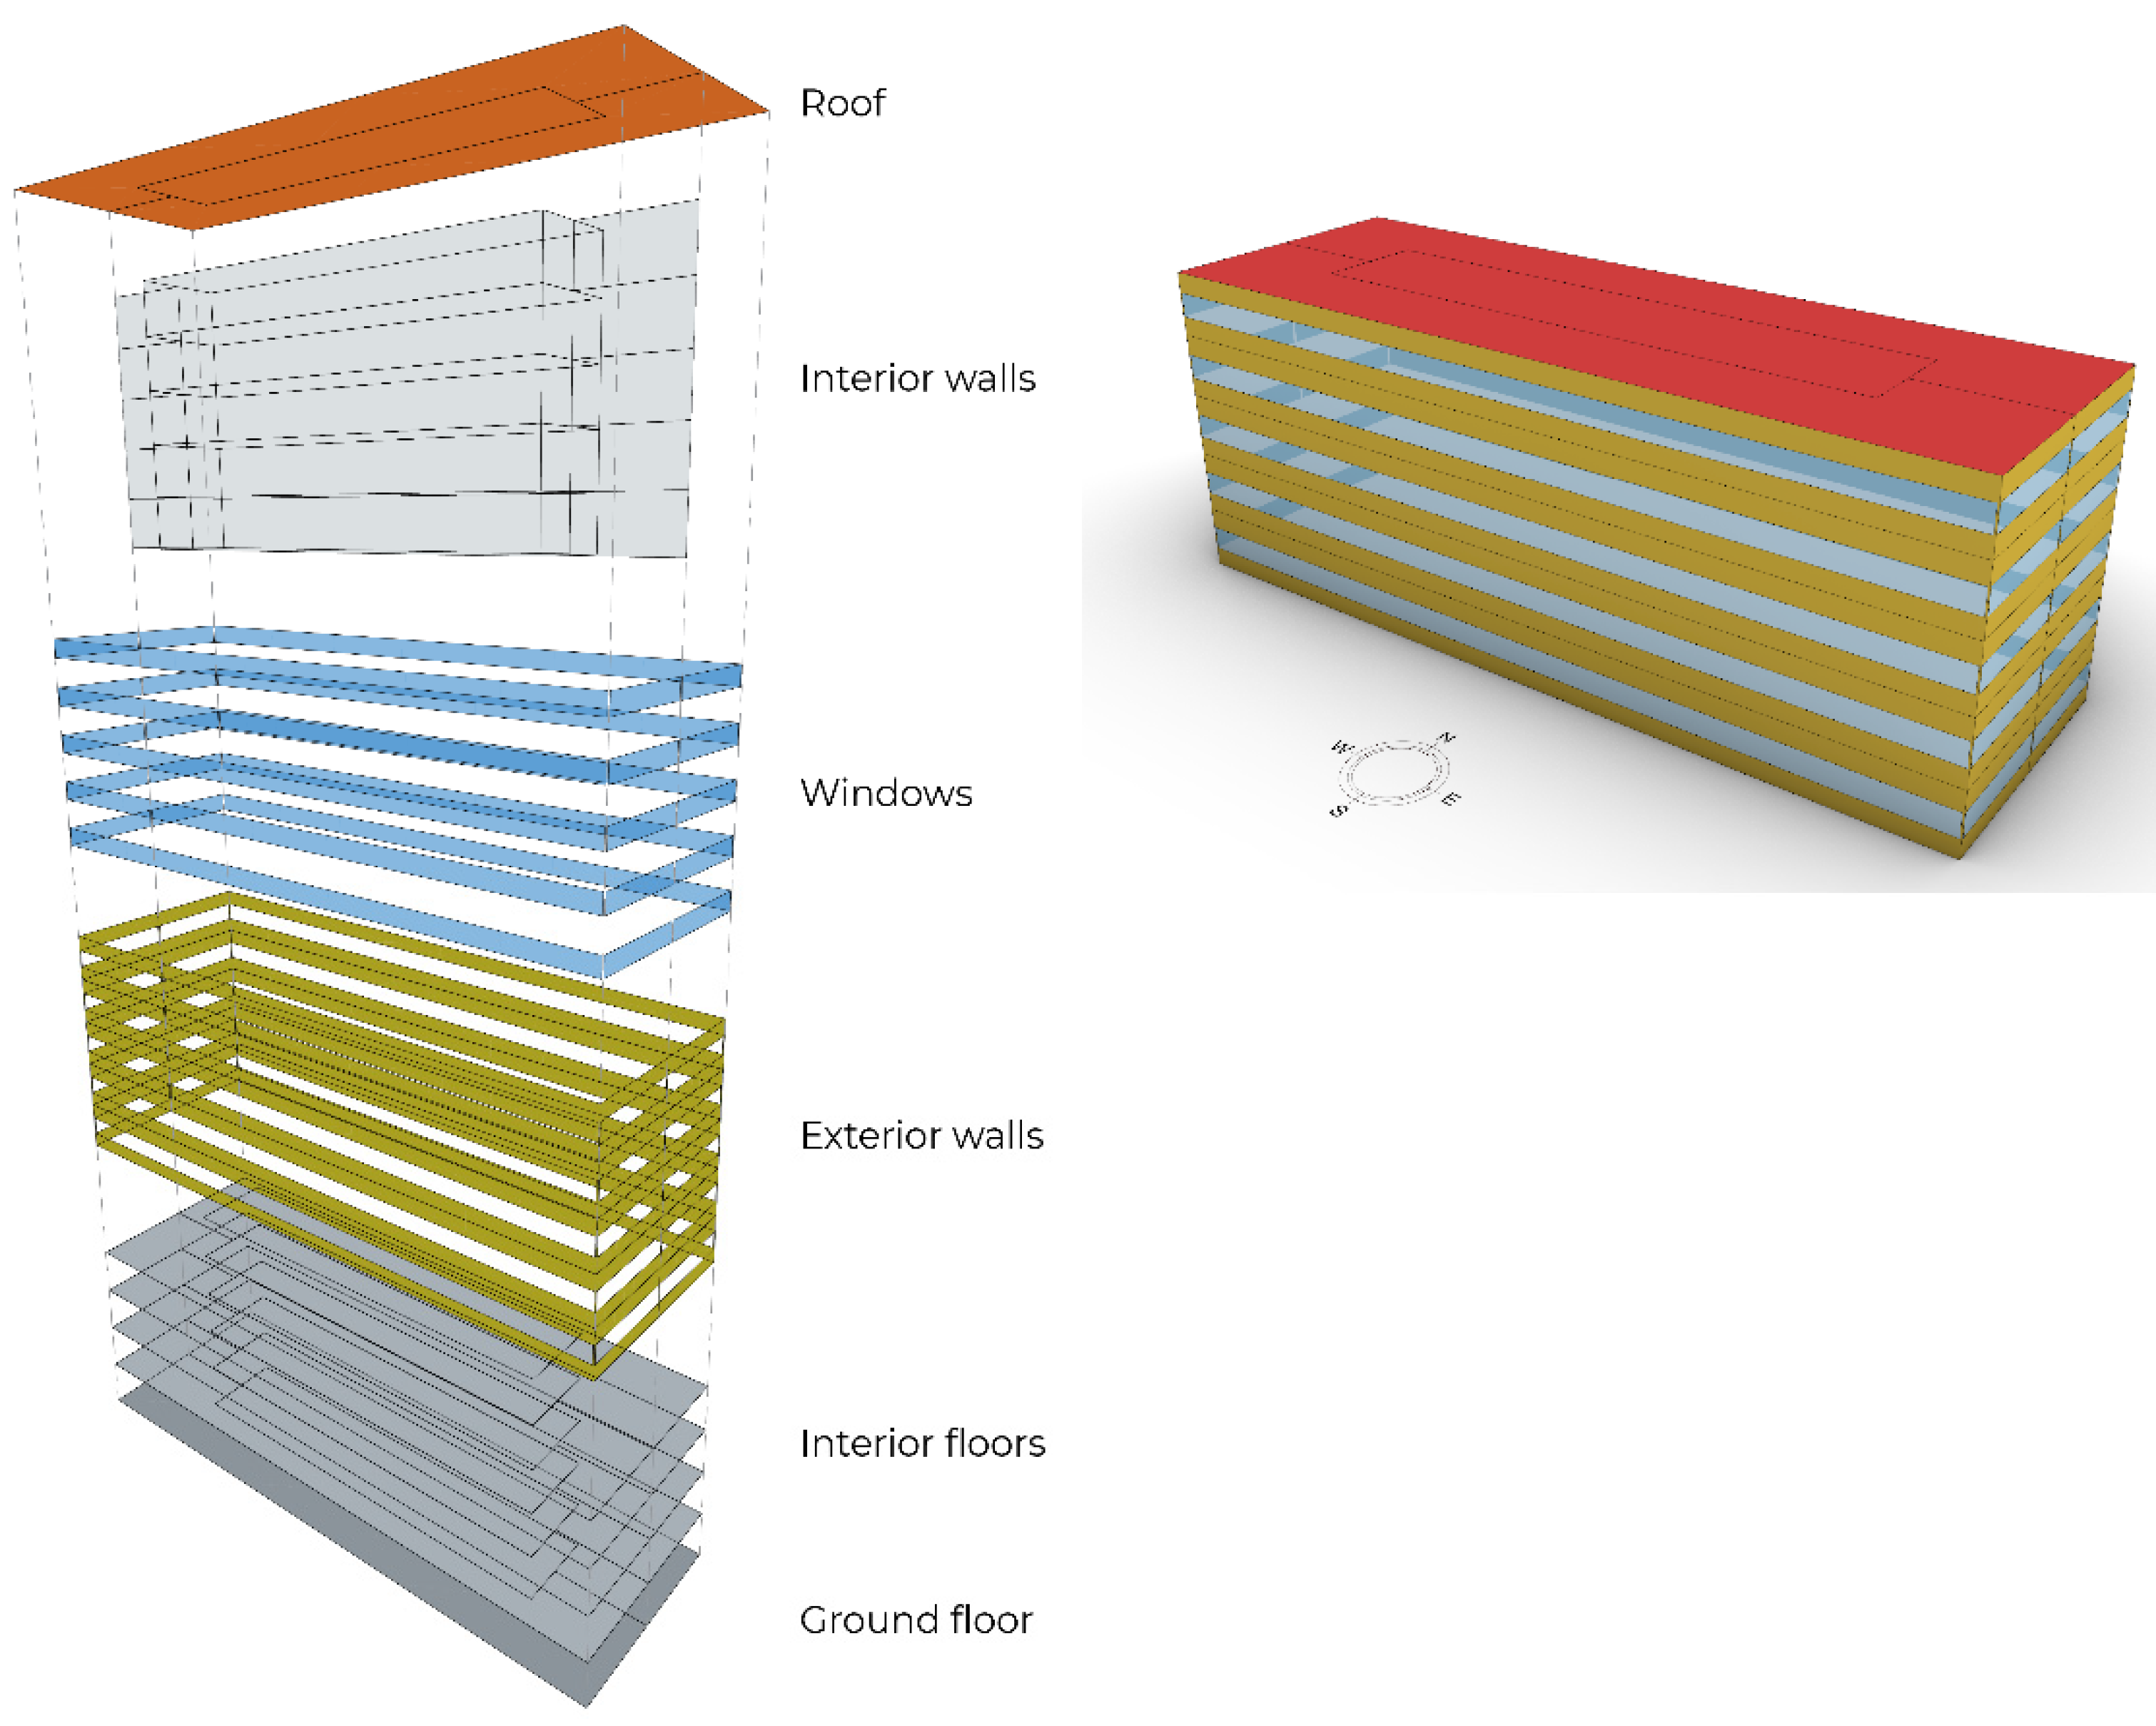
2.3.2. Life Cycle Inventory (LCI)

In the LCI, for the exterior wall, windows, and shading components, the total quantities of relevant composite materials—concrete blocks, cellular blocks, polystyrene, cement mortar, glass, aluminum, and plastic—were calculated.
Then, based on the Ecoinvent v3.2 database, the LCI of these materials was modeled on the SimaPro platform [19]. The Ecoinvent database has a comprehensive building-material-related LCI database that is successfully used in the building sector [23]. Table 3 shows the Ecoinvent v3.2 database sources adopted for material production (P&R stage) and coal, natural gas, and PV energy source (OE stage). These secondary data were adopted due to the absence of local Israeli data. The data were considered sufficiently appropriate based on the nature of the comparative assessment of the present study. This is because the 4 compared alternatives were produced with mostly the same composite materials and included concrete/autoclaved aerated blocks, polystyrene, cement mortar, glass, aluminum, and plastic, and used the same sources of operational energy, gas/coal/PV-based electricity (Table 3).
According to the Ecoinvent v3.2 database [19], the production of concrete and autoclaved aerated blocks includes raw materials, their transport to the finishing plant, and the energy for block production; polystyrene includes its production; cement mortar includes the provisioning of raw materials and mixing of mortar; glass includes the provisioning of raw materials and the melting, cooling, coating, and cutting processes; aluminum includes the recycling of aluminum scraps and the production of aluminum sheets; plastic includes aggregated data for all processes; coal-based and natural gas electricity includes fuel input, infrastructure, and substances needed for operation; and the production of PV-based electricity includes the infrastructure for a 3 kWp PV plant and water for cleaning.

2.3.3. Life Cycle Impact Assessment

The LCIA methods commonly used in the construction sector are Eco-Indicator 99 [25], CML [23], and ReCiPe2016 [25]. ReCiPe2016 was developed based on the other two methods mentioned, and has comparatively new and inclusive evaluation indices [23]. Thus, the ReCiPe2016 LCIA method was used in this research.
ReCiPe2016 makes it possible to evaluate LCIA results considering individualist (I), egalitarian (E), and hierarchist (H) points of view of environmental problems. Applying the individualist option allows the evaluation of only short-term damage, the egalitarian option evaluates all possible long-term damage, and the hierarchist option provides a balance between short- and long-term damage [26]. For these methodological options, ReCiPe2016 can evaluate midpoint and endpoint single-score results.
Midpoint results are presented by 17 environmental impacts, such as global warming potential, terrestrial acidification, terrestrial ecotoxicity, and ozone formation. Endpoint results are presented by damage to human health, ecosystem quality, and resources. Applying different weighting sets to these 3 types of damage allows us to obtain individualist/average (I/A), hierarchist/average (H/A), egalitarian/average (E/A), individualist/individualist (I/I), hierarchist/hierarchist (H/H), and egalitarian/egalitarian (E/E) endpoint single-score evaluations.
Midpoint results have lower uncertainty, whereas single-score evaluation results can be interpreted much more easily [26]. As a result, the 4 studied alternatives (CBMinWin, CBMaxWin, AABMinWin, and AABMaxWin) were evaluated using both midpoint and single-score evaluation methods. The midpoint H evaluation was performed for global warming potential, terrestrial acidification, terrestrial ecotoxicity, and ozone formation (the most significant environmental impacts for the 4 alternatives and OE gas/coal/PV-based electricity sources). The endpoint single-score evaluation was evaluated by 6 methodological options: I/A, H/A, E/A, I/I, H/H and E/E.

2.4. Statistical Evaluation

2.4.1. The Design Structure of the ReCiPe2016 Endpoint Single-Score Results and Two-Stage Nested Analysis of Variance (ANOVA) Test

Figure 3 shows the design structure of ReCiPe2016 endpoint single-score evaluations using 6 methodological options, I/A, H/A, E/A, I/I, H/H, and E/E. The design structure allows a pairwise comparison of the ReCiPe2016 endpoint single-score evaluations of the studied alternatives, applying a two-stage nested mixed analysis of variance (ANOVA) [27].
The primary sampling unit contains 2 subunits, the average, and particular weighting sets. The subunit of the average weighting set uses I/A, H/A, and E/A individual subunit evaluations, and the subunit of the particular weighting set uses I/I, H/H, and E/E individual subunit evaluations. The ReCiPe2016 endpoint single-score results were log10 transformed. This design structure was recently applied to an LCA of 4 types of extensive green roofs that contained coal bottom ash and fly-ash-based aggregates in the substrate and drainage layers [28].

2.4.2. p-Value Interpretation

According to the recommendation by Hurlbert and Lombardi [29], the hybrid of the Paleo–Fisherian and Neyman–Pearsonian paradigms (i.e., null hypothesis significance tests (NHSTs)) were replaced by neo-Fisherian significance assessments (NFSAs). According to Hurlbert and Lombardi [29], the NFSA (i) does not fix α, (ii) does not describe p-values as significant or nonsignificant, (iii) does not accept the null hypotheses based on high p-values but only suspends judgment, (iv) interprets significance tests according to 3-valued logic, and (v) presents effect-size information if necessary.
Hurlbert and Lombardi [29] cited the recommendation of Gotelli and Ellison [30], noting that “in many cases, it may be more important to report the exact p-value and let the readers decide for themselves how important the results are”. According to Beninger et al. [31], the logic of Occam’s mechanical razor should not be used for the universal interpretation of the p-value.
Hurlbert and Lombardi [29] clearly showed that fixing α, i.e., the level of significance (e.g., α = 0.05), and dichotomizing the scale of the p-values, i.e., p < α or p > α, are superfluous. Hurlbert and Lombardi ([29], p. 316) cited Fischer’s philosophical proposal that “no scientific worker has a fixed level of significance at which from year to year, and in all circumstances, he rejects (null) hypotheses; he rather gives his mind to each particular case in light of his evidence and ideas.” [32]. In addition, Hurlbert and Lombardi ([29], p. 317) cited Altman [33], who noted “It is ridiculous to interpret the results of a study differently according to whether the p value obtained was, say, 0.055 or 0.045. These p values should lead to very similar conclusions, not diametrically opposed ones”. Therefore, NFSAs include in calculations the extracted p-value, but there is no need to specify α. Thus, the p-values were evaluated according to 3-value logic: either it seems to be positive (i.e., there appears to be an environmental difference between alternatives 1 and 2), it seems to be negative (i.e., there does not appear to be an environmental difference between alternatives 1 and 2), or judgment is suspended regarding the environmental difference between the two alternatives.

3. Results and Discussion

3.1. Energy Assessment of the OE Stage

Table 4 shows the energy consumption of the OE stage related to the four alternatives applied to each of the five floors and the whole building, as well as the whole building energy rate. According to standard SI5282-2, the concrete block with minimal windows and autoclaved aerated block alternatives with minimal windows had a C rating, whereas the concrete block with maximal windows and autoclaved aerated block alternatives with maximal windows had a D rating. Thus, as expected, compared to buildings with maximal windows, the energy rate for buildings with minimal windows was higher. The energy consumption of intermediate floors (2–4) and the entire building turned out to be quite similar. Therefore, in the further LCA, floor 3 (a typical intermediate floor) was used.

3.2. LCAs of the P&R and OE Stages

3.2.1. Preparatory Results: Materials and Energy

Table 5 shows the total quantities of building materials required for the P&R stage and the energy required for the 50-year OE stage of the four alternatives used for a typical intermediate floor of the studied building. As can be noticed, different alternatives resulted in different quantities of the main building materials. Thus, as expected, the applied combinations of materials and areas of exterior walls, windows, and shading resulted in different quantities of building materials used for the construction of the four alternatives.

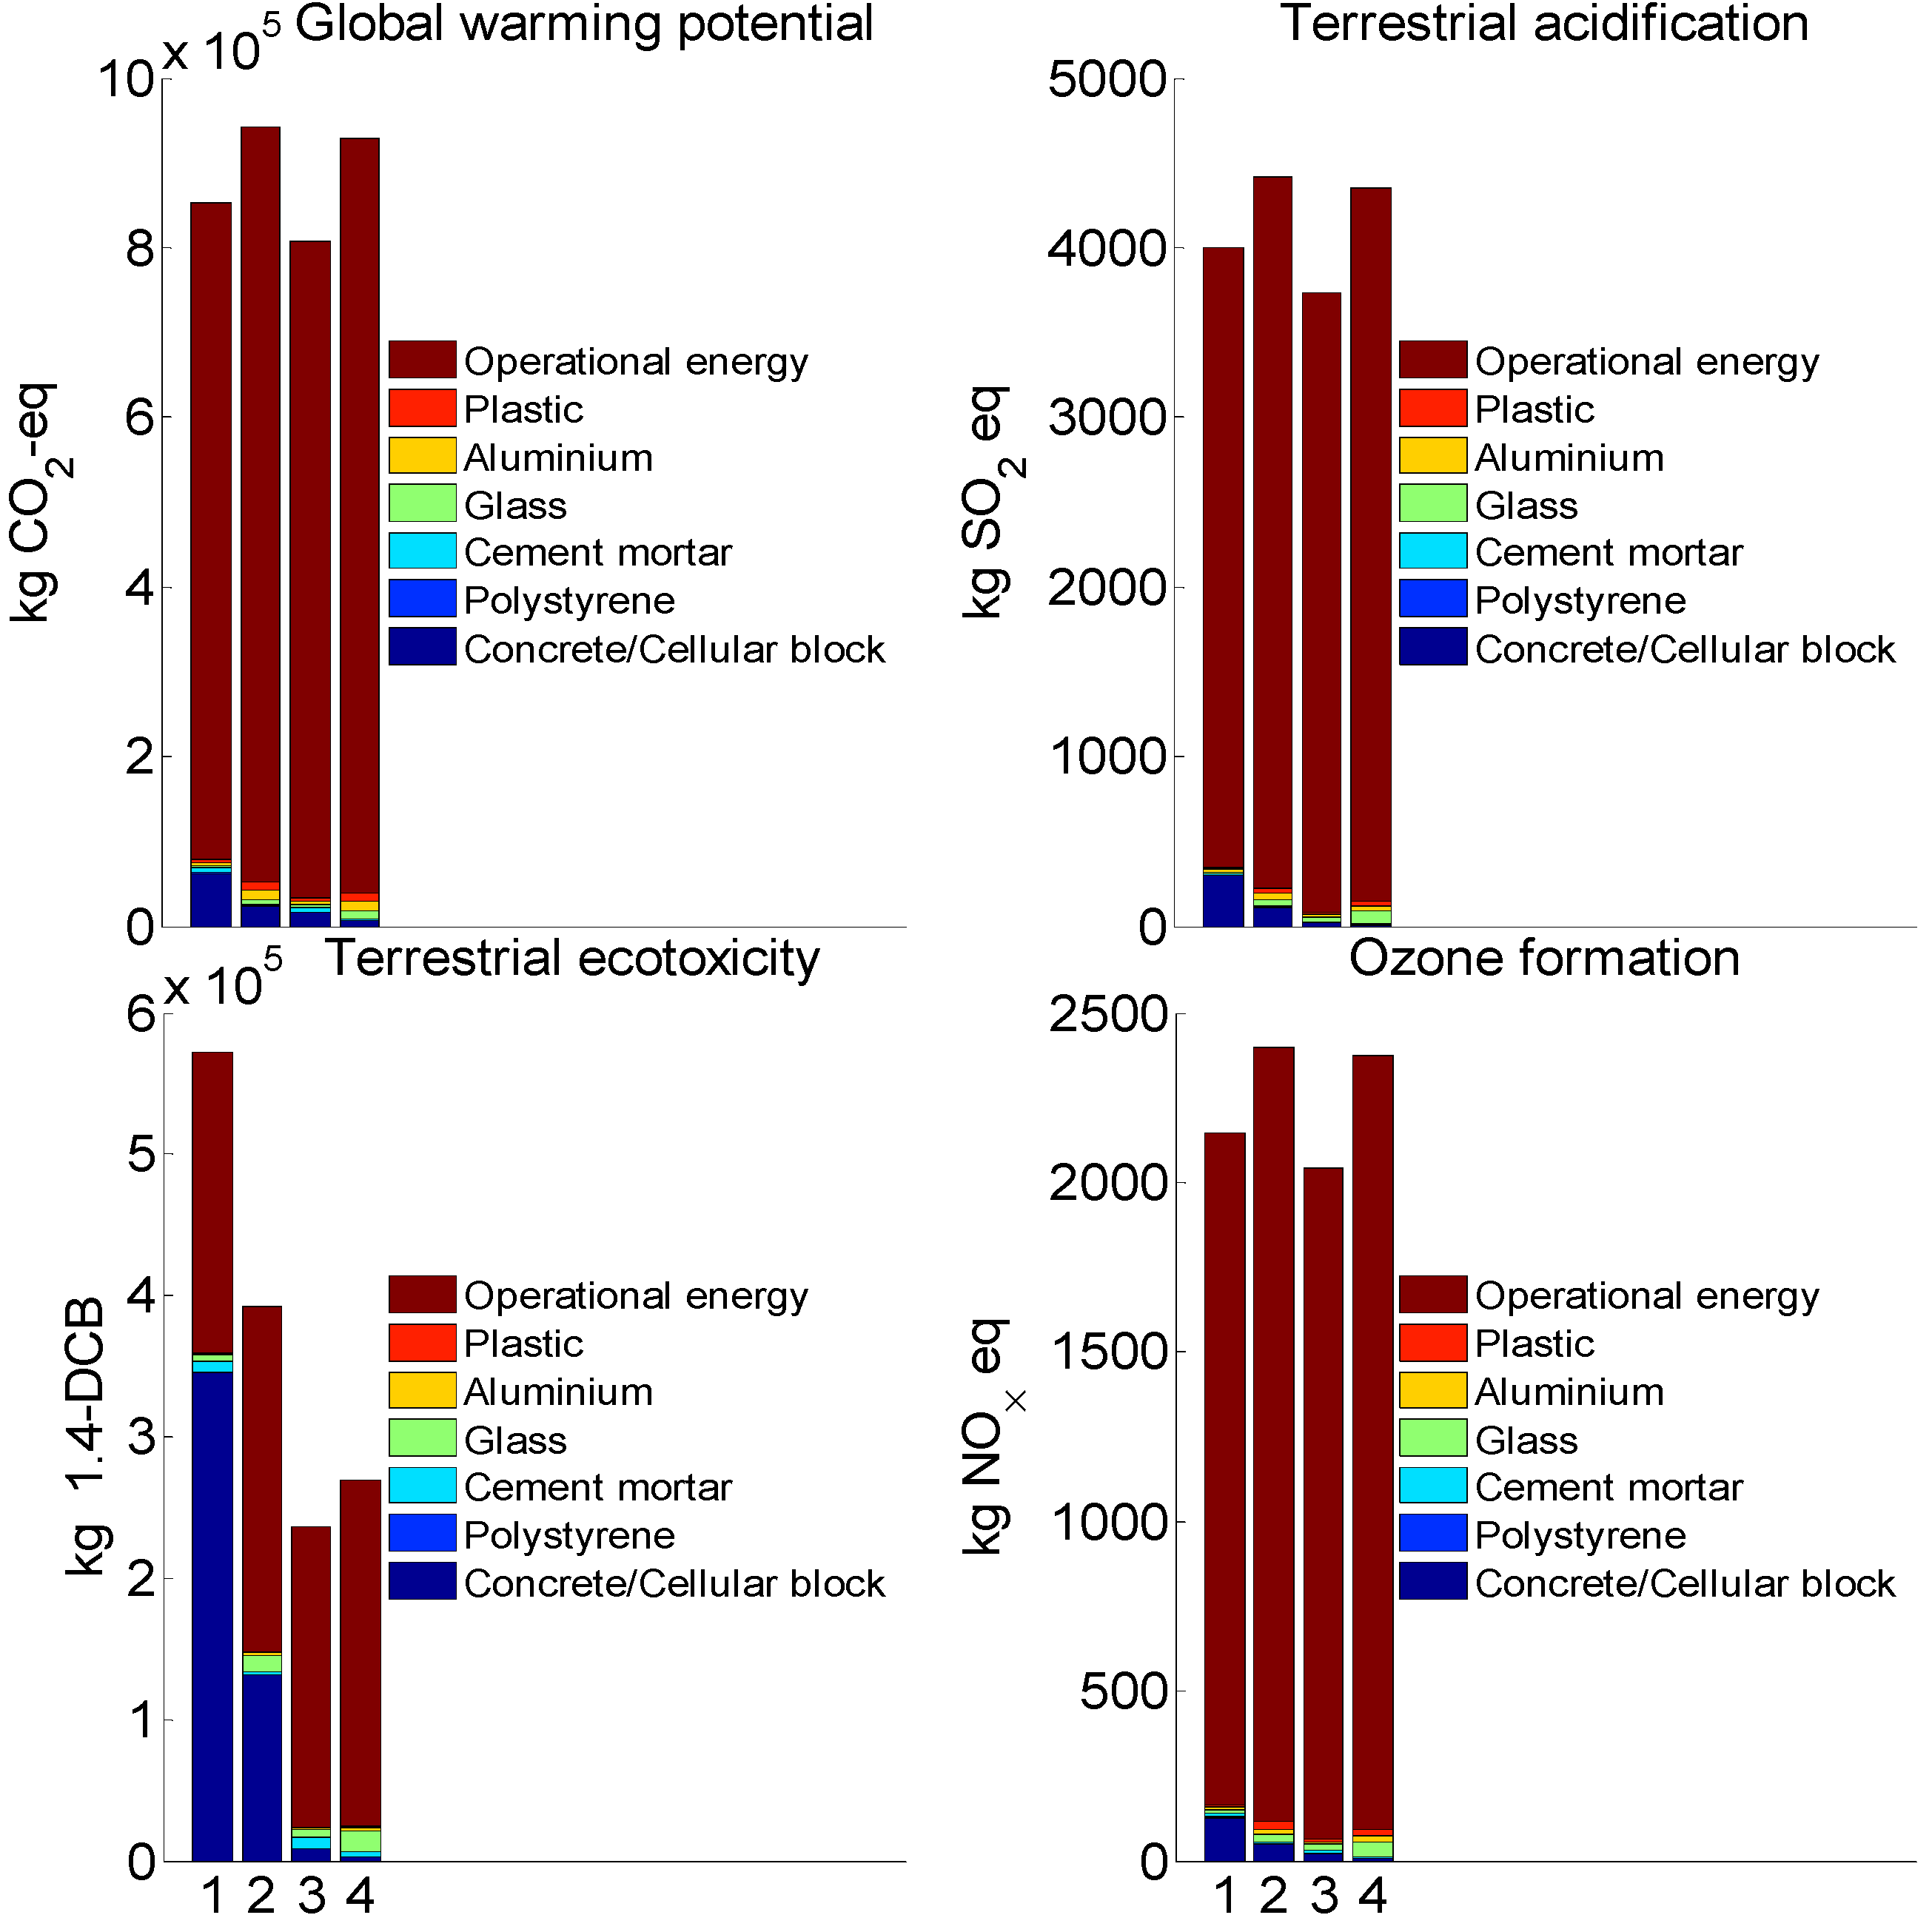
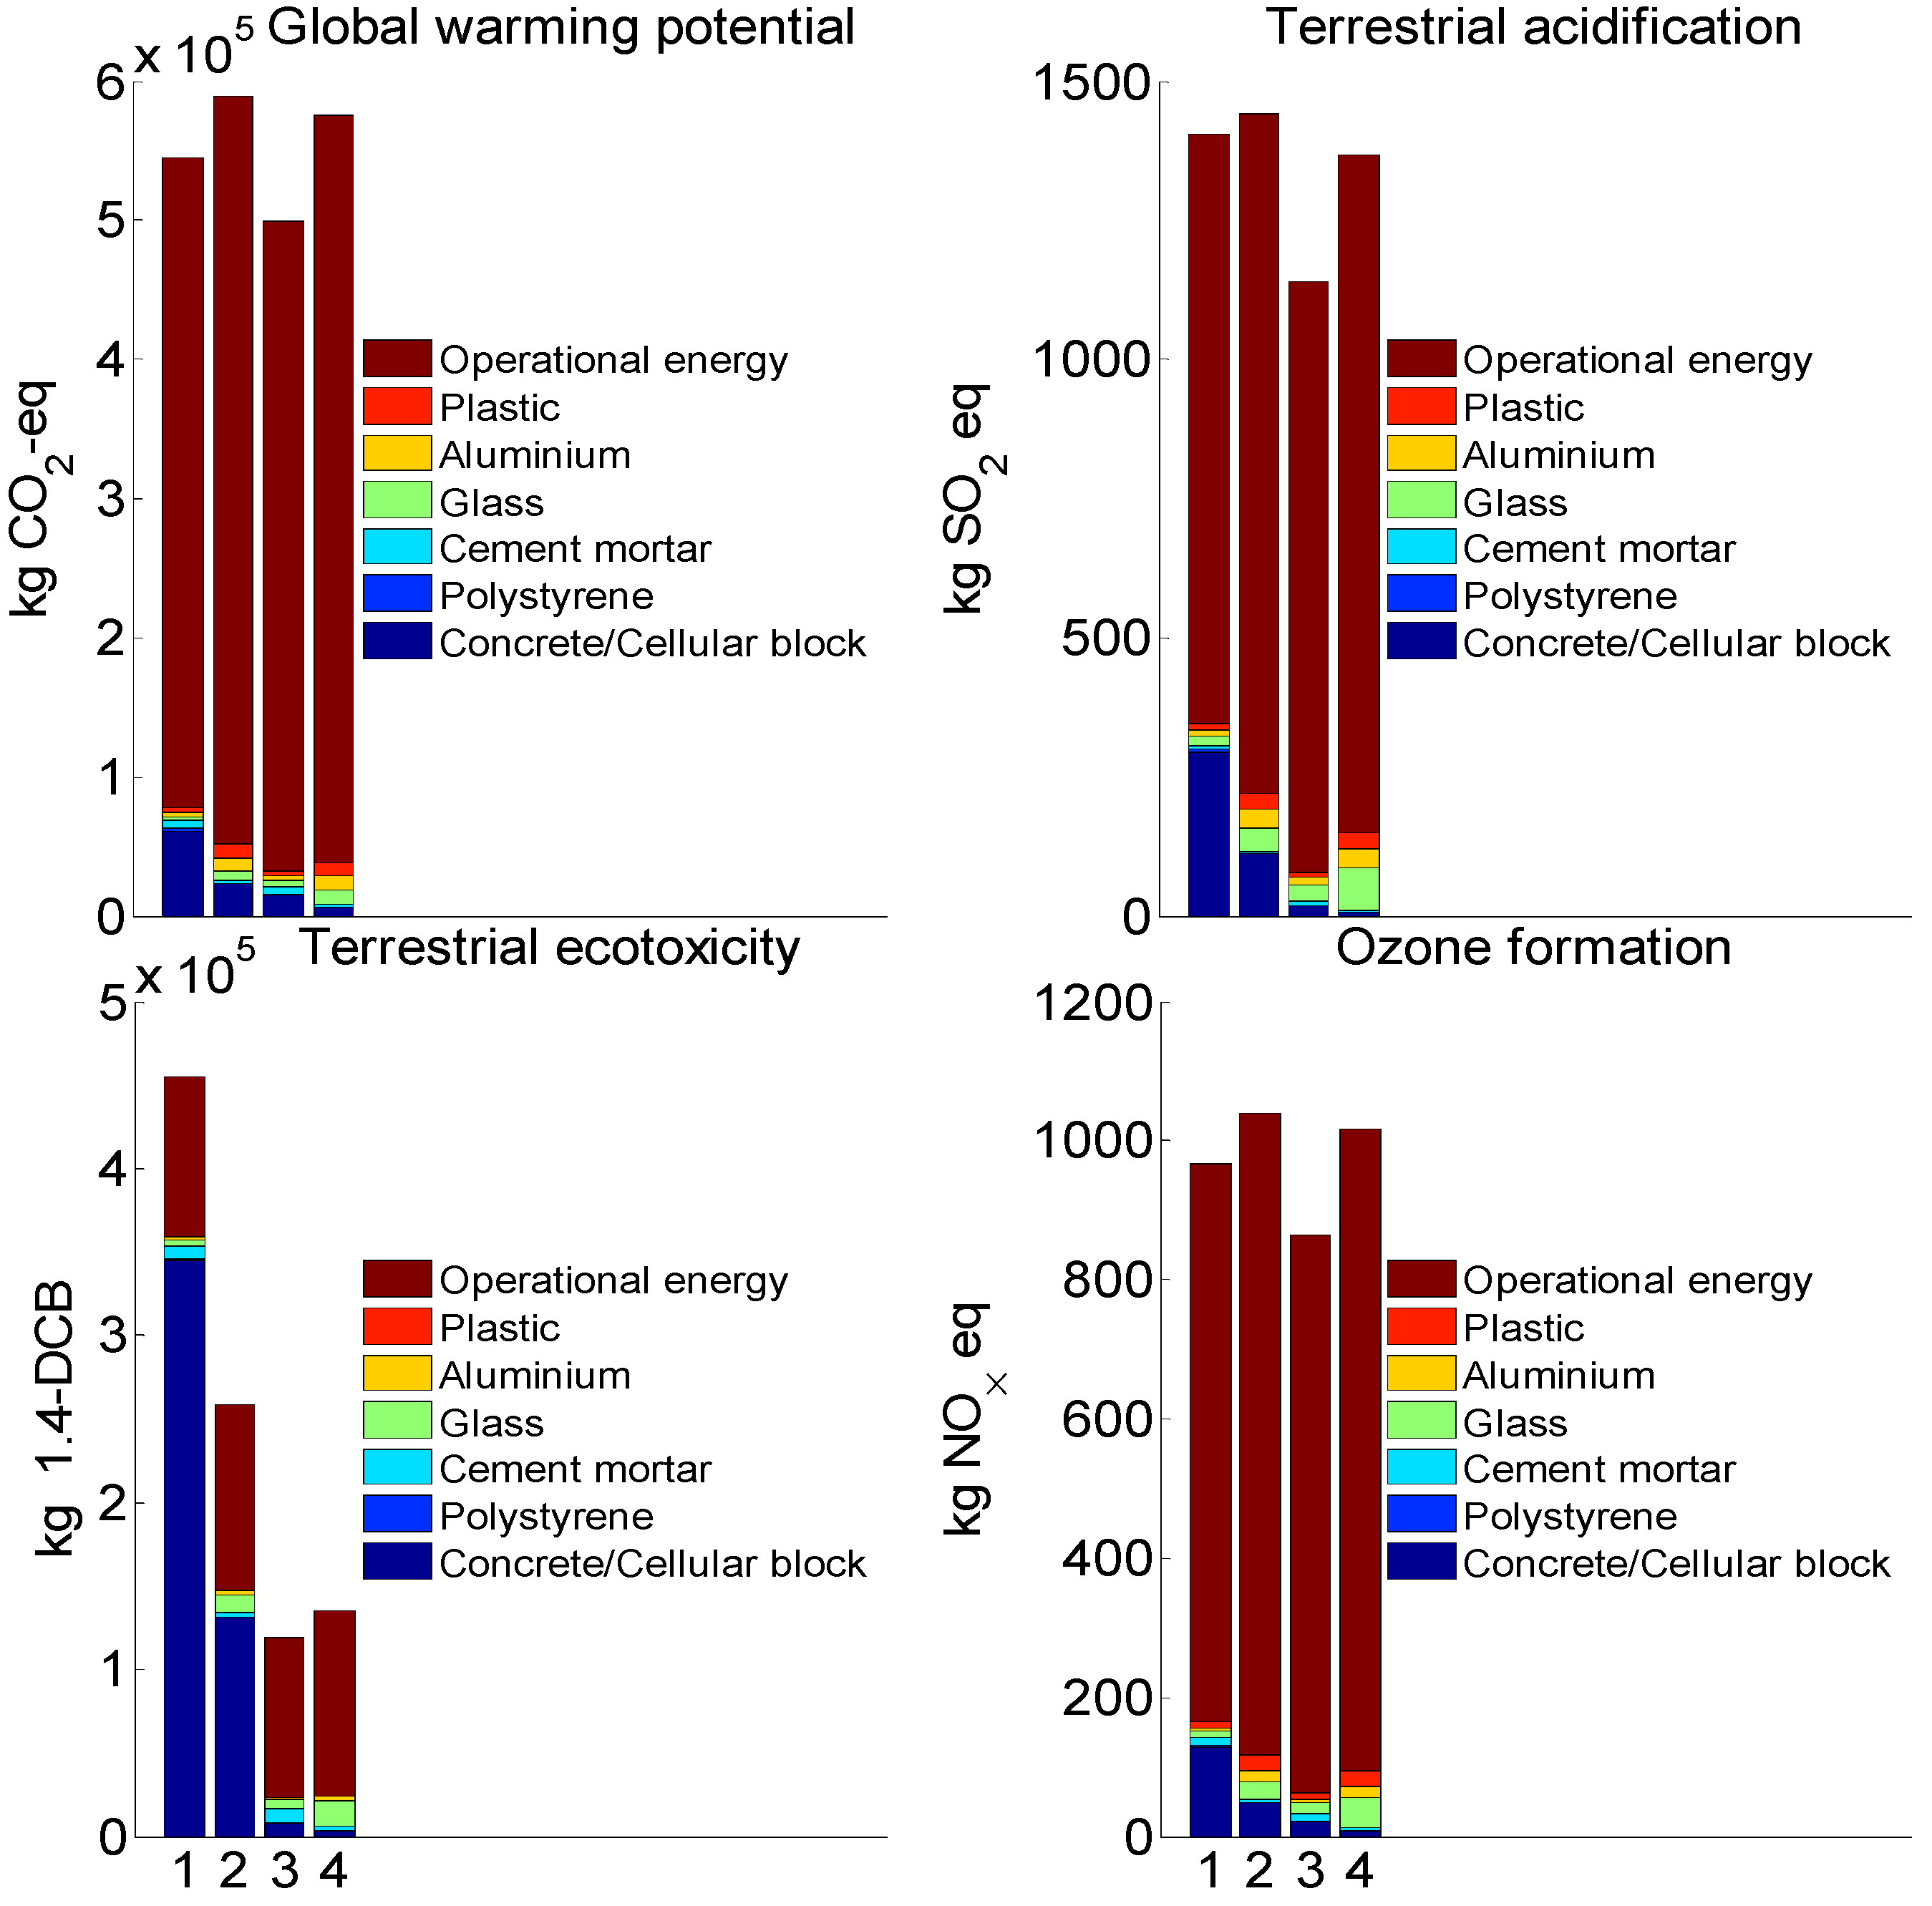
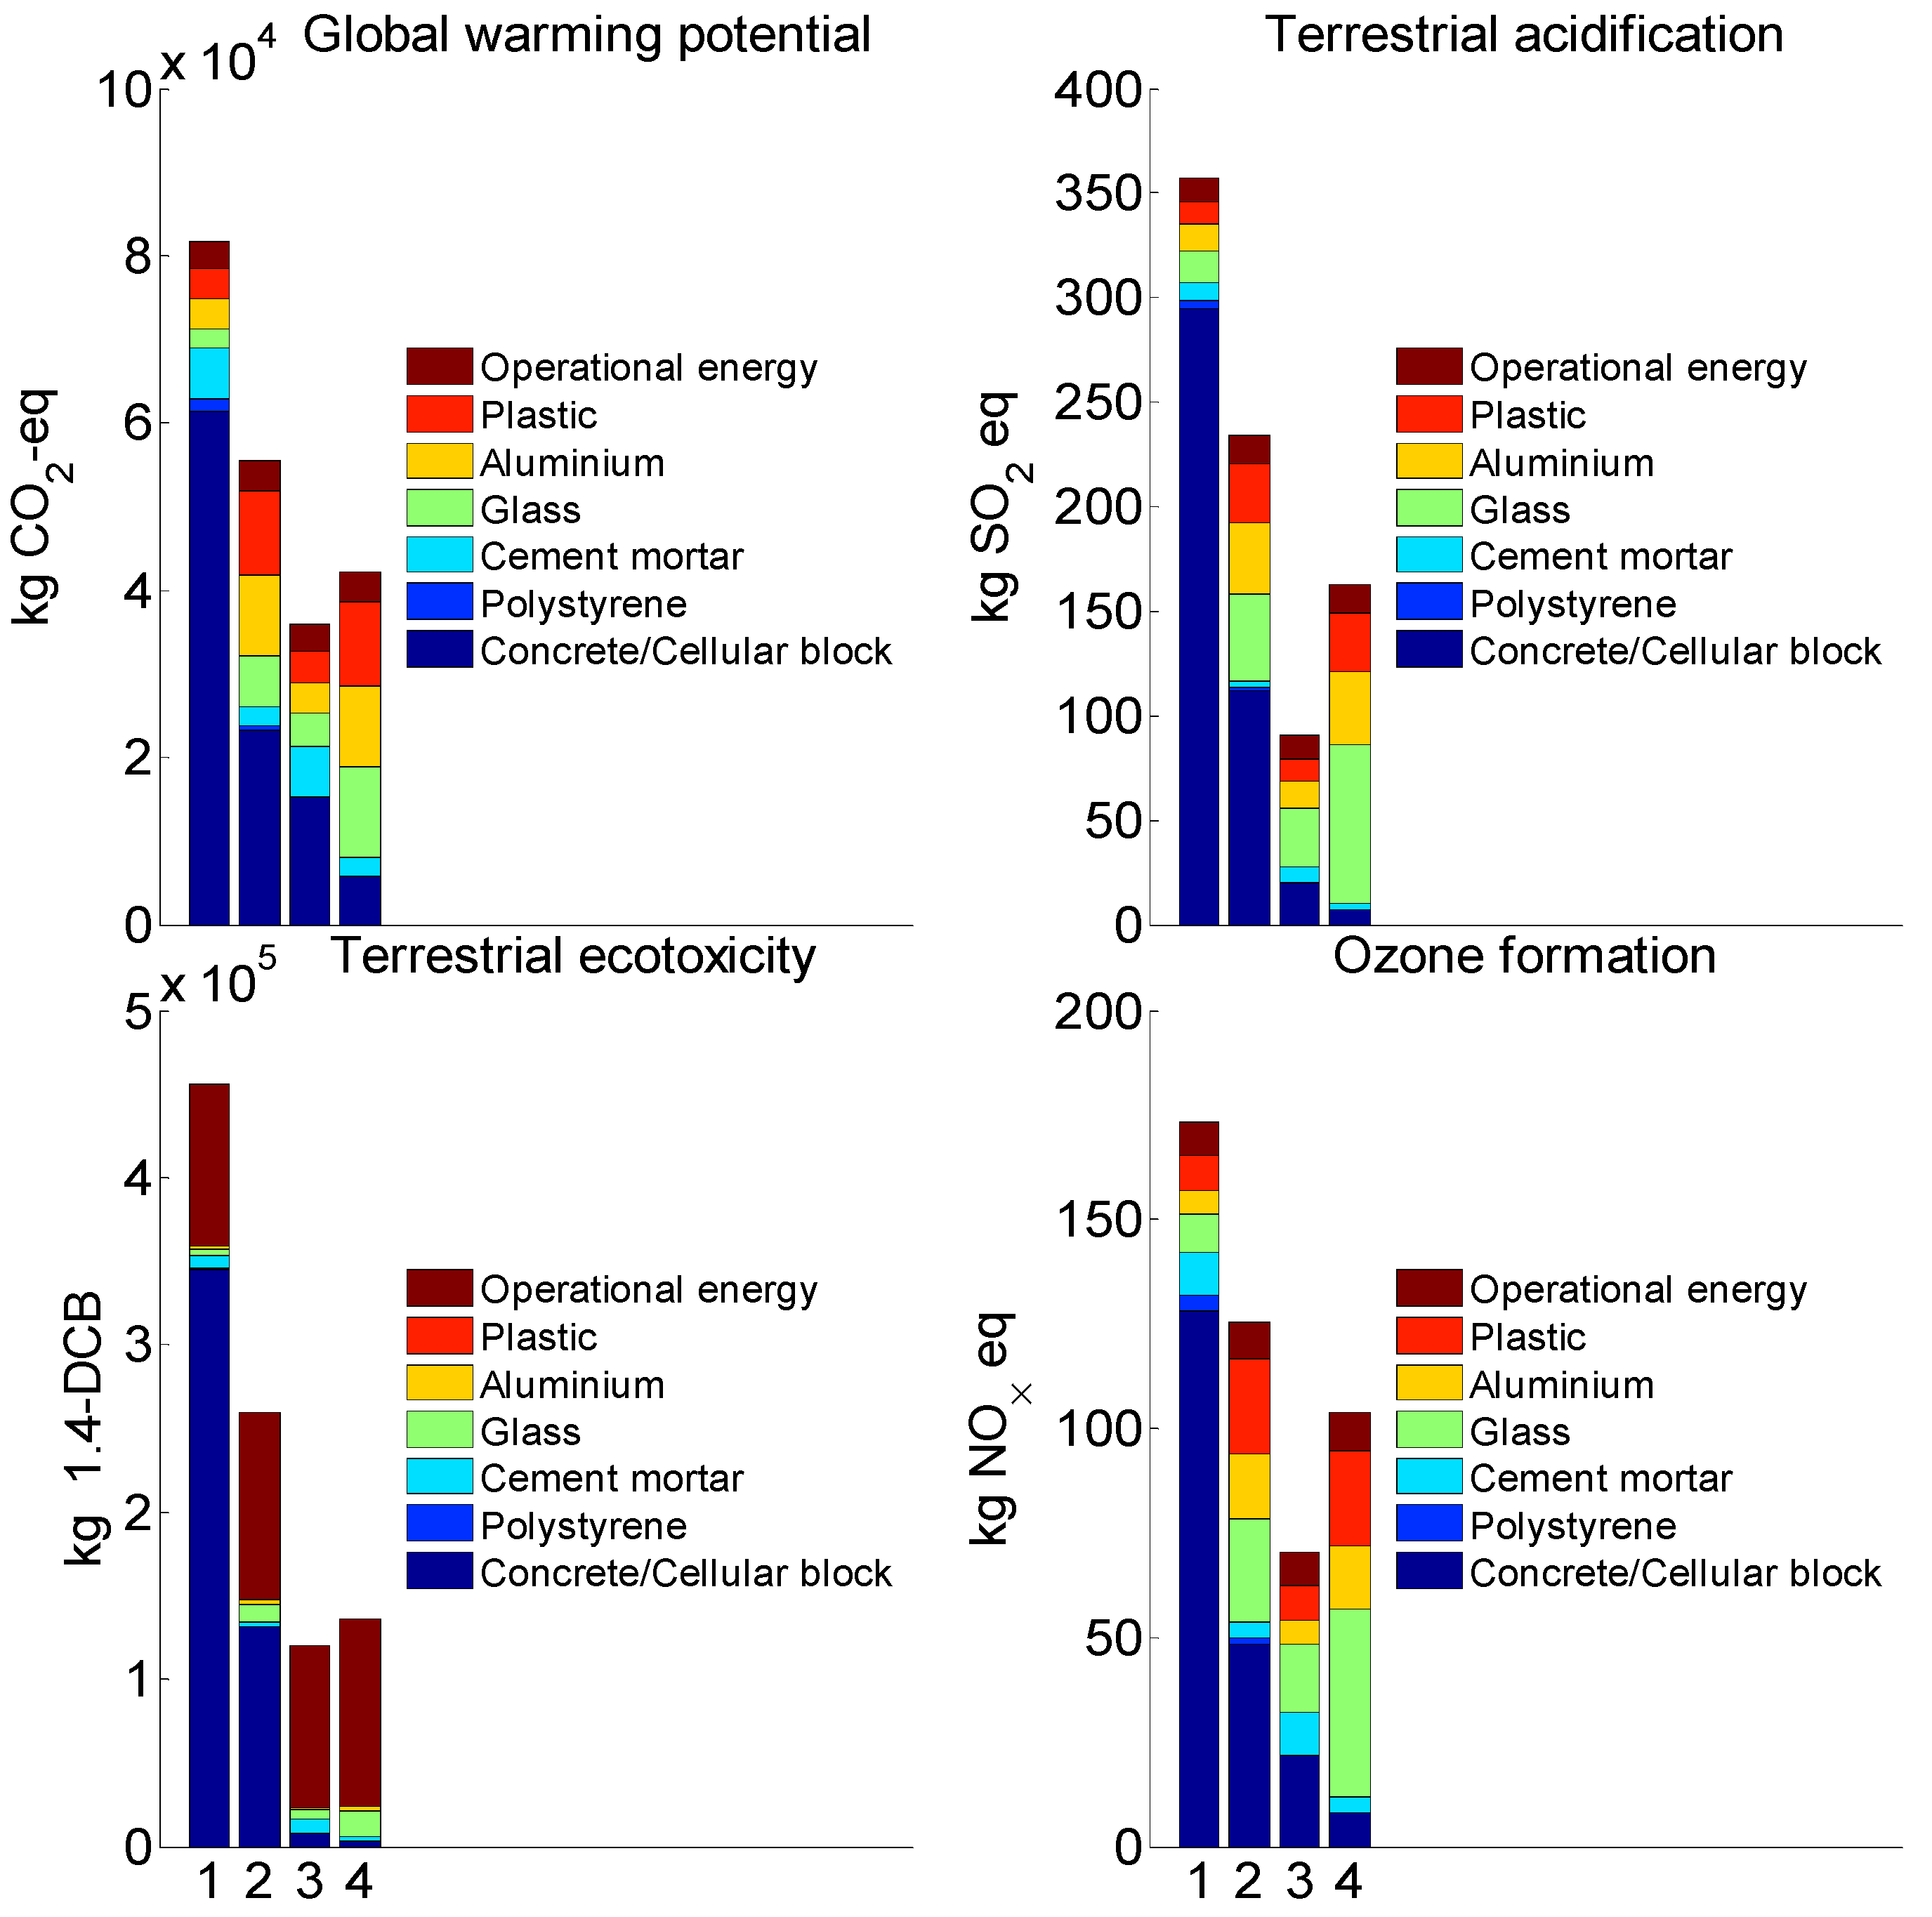
3.2.2. ReCiPe2016 Midpoint Results

For the OE stage with 31% coal, 56% natural gas, and 13% PV-based electricity, Figure 4 shows that for the four alternatives, in terms of global warming potential, terrestrial acidification, and ozone formation impact, the OE stage was much larger than the P&R stage (91–98% of total P&R and OE impact). For terrestrial ecotoxicity impact, the P&R stage of concrete-based alternatives started to be more notable at 63 and 38% for the concrete block with minimal and maximal windows, respectively. Such results were expected due to the predominant share of fossil fuels used for the production of OE for heating, cooling, and lighting.
Due to such a high predominance of the OE stage, the concrete block and autoclaved aerated block alternatives with minimal windows resulted in lower global warming potential, terrestrial acidification, and ozone formation impact than those with maximal windows. These results are in line with SI5282 energy rates, in which concrete block and autoclaved aerated block alternatives with minimal windows were rated C, whereas those with maximal windows were rated D (Table 4). High OE demand involves the use of fossil fuels such as coal, oil, and gas and releases large amounts of carbon dioxide (CO2) and other emissions, including sulfur dioxide (SO2), nitrogen oxide (NOx), and particulate matter (PM) into the environment, leading to increased impacts such as global warming potential, terrestrial acidification, terrestrial ecotoxicity, and ozone formation [22,34].
However, in terrestrial ecotoxicity, the alternatives based on autoclaved aerated blocks with minimal and maximal windows resulted in a lower impact than those based on concrete blocks. These results contradict the SI5282 energy rates (Table 4), positioning the alternatives according to wall-composed material and not window size. This is due to the higher quantity of Portland cement included in concrete blocks [13], the production of which leads to increased terrestrial ecotoxicity. Thus, in the case of concrete block alternatives, both P&R and OE stages significantly contributed to the impact.
For the OE stage with 8% coal, 57% natural gas, and 35% PV-based electricity, Figure 5 shows the results, which are very similar to the results presented in Figure 4. However, a shift from the most influenced OE stage to the P&R stage becomes more prominent. This was especially noticed for the terrestrial ecotoxicity impact, where the P&R stage of the concrete-based alternatives with minimal and maximal windows corresponded to 79 and 57%, respectively, of their total R&R and OE impact.
For the OE stage with 100% PV–based electricity, Figure 6 shows that for the four alternatives, in terms of global warming potential, terrestrial acidification, and ozone formation impact, the P&R stage was much larger than the OE stage (77–94% of the total P&R and OE impact), whereas, in terms of terrestrial ecotoxicity impact, the OE stage was significant (21–82% of the total P&R and OE impact). The main decisive factor in the prevailing of the P&R stage was the high energy demand of the production of Portland cement, glass, and aluminum. As mentioned, meeting a high energy demand using fossil fuels releases large amounts of CO2, SO2, NOx, and PM, increasing the four studied impacts [22,34].
The OE stage has a major impact on the terrestrial ecotoxicity (especially in the case of autoclaved aerated blocks). The impact of this stage is mostly due to the production of PV solar modules (panels, solar cells, and wafers) and insignificant waste heat emission related to losses of electricity in the system [19]. These results confirm the earlier PV production results presented by Santoyo-Castelazo et al. [35], who studied a PV 3 kWp multi-Si module over its entire lifetime.

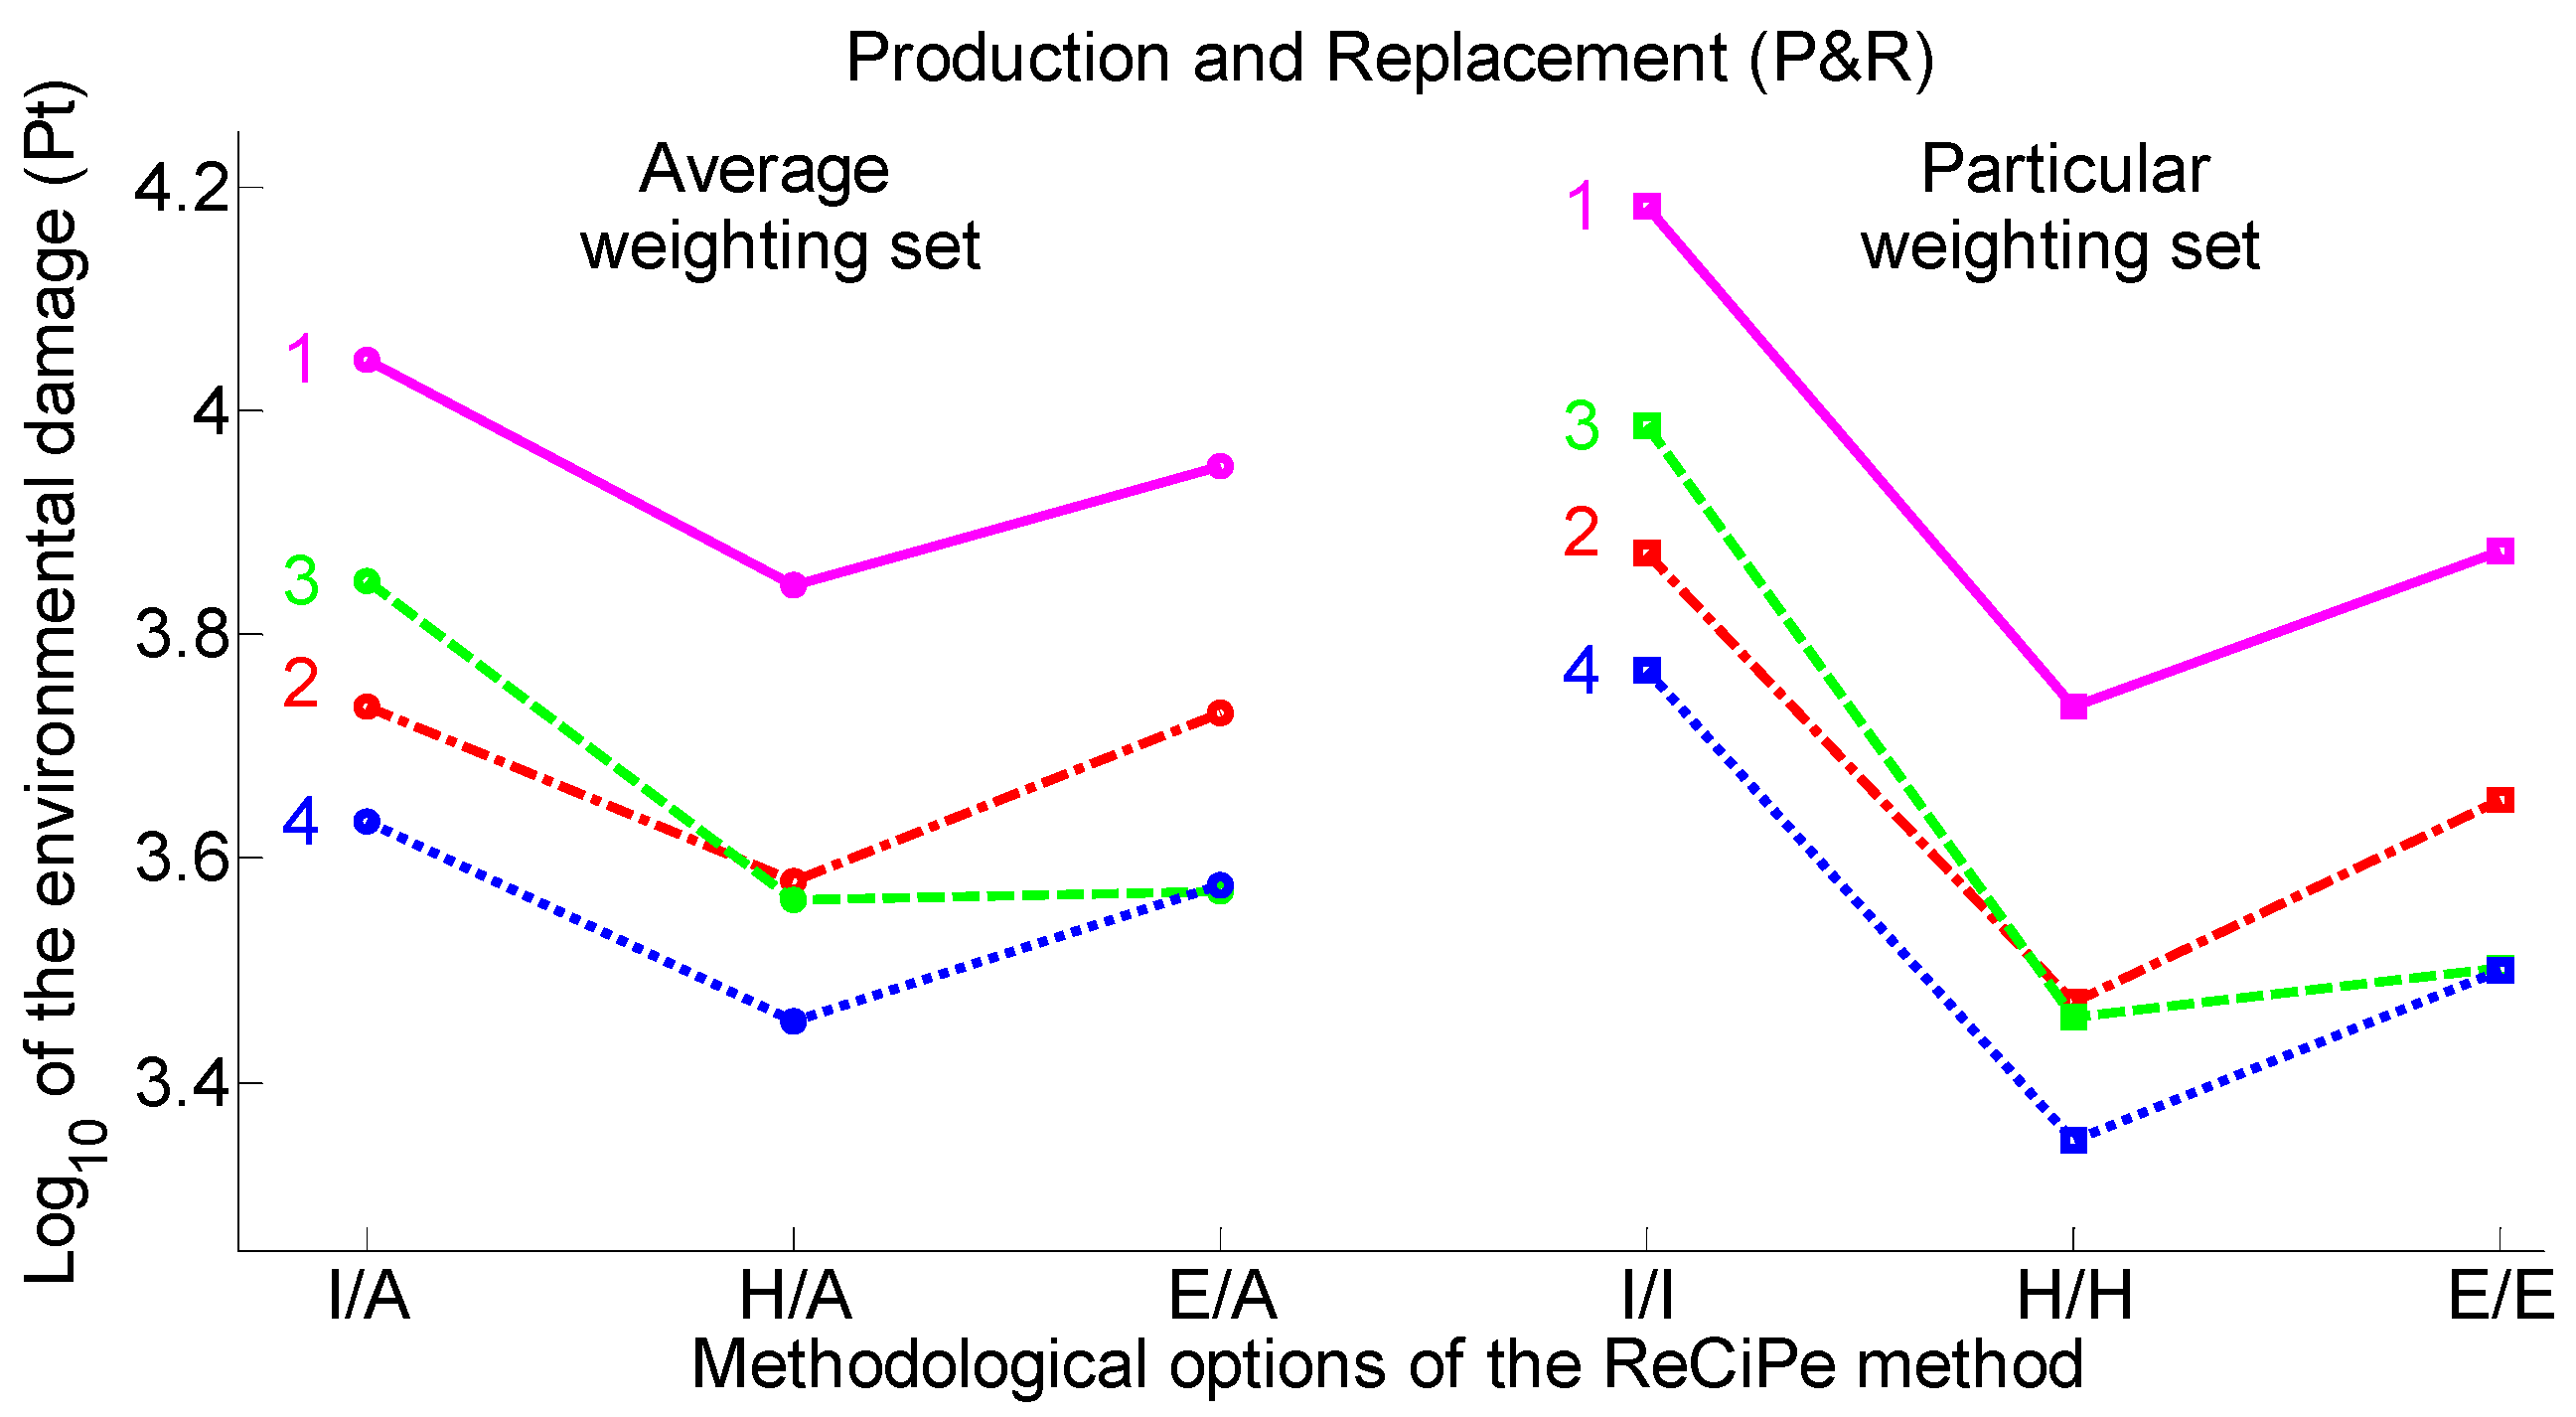
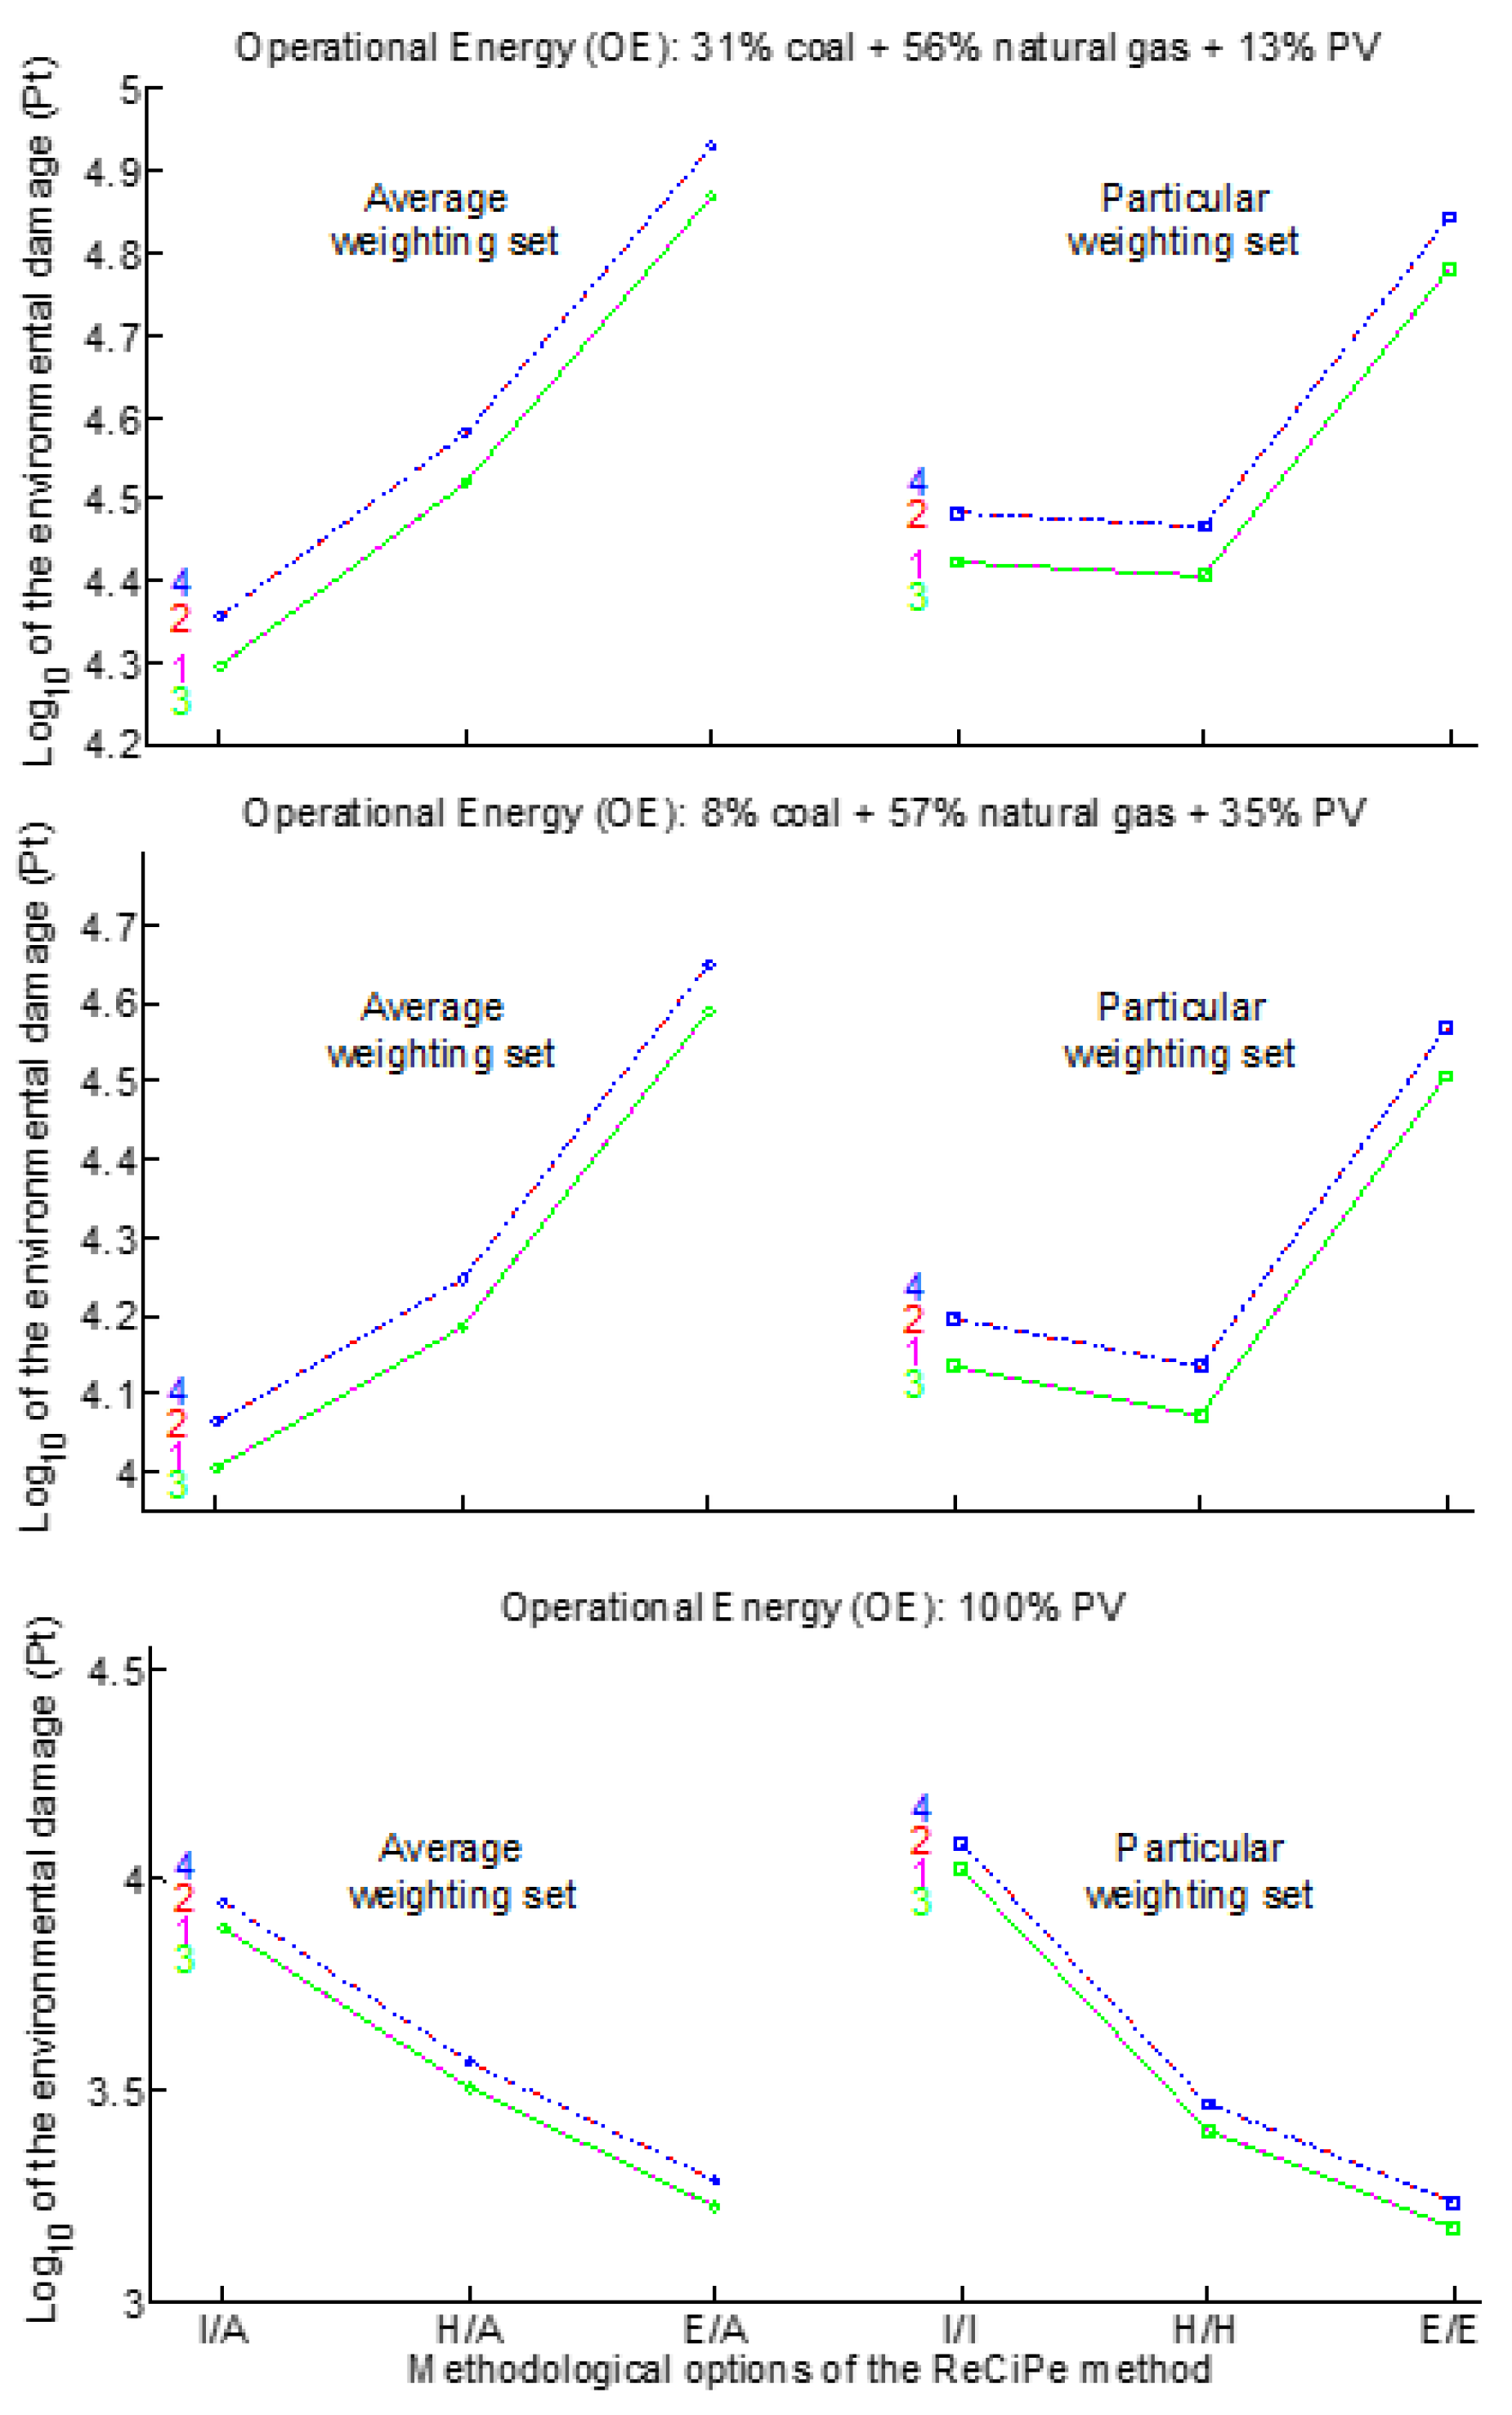
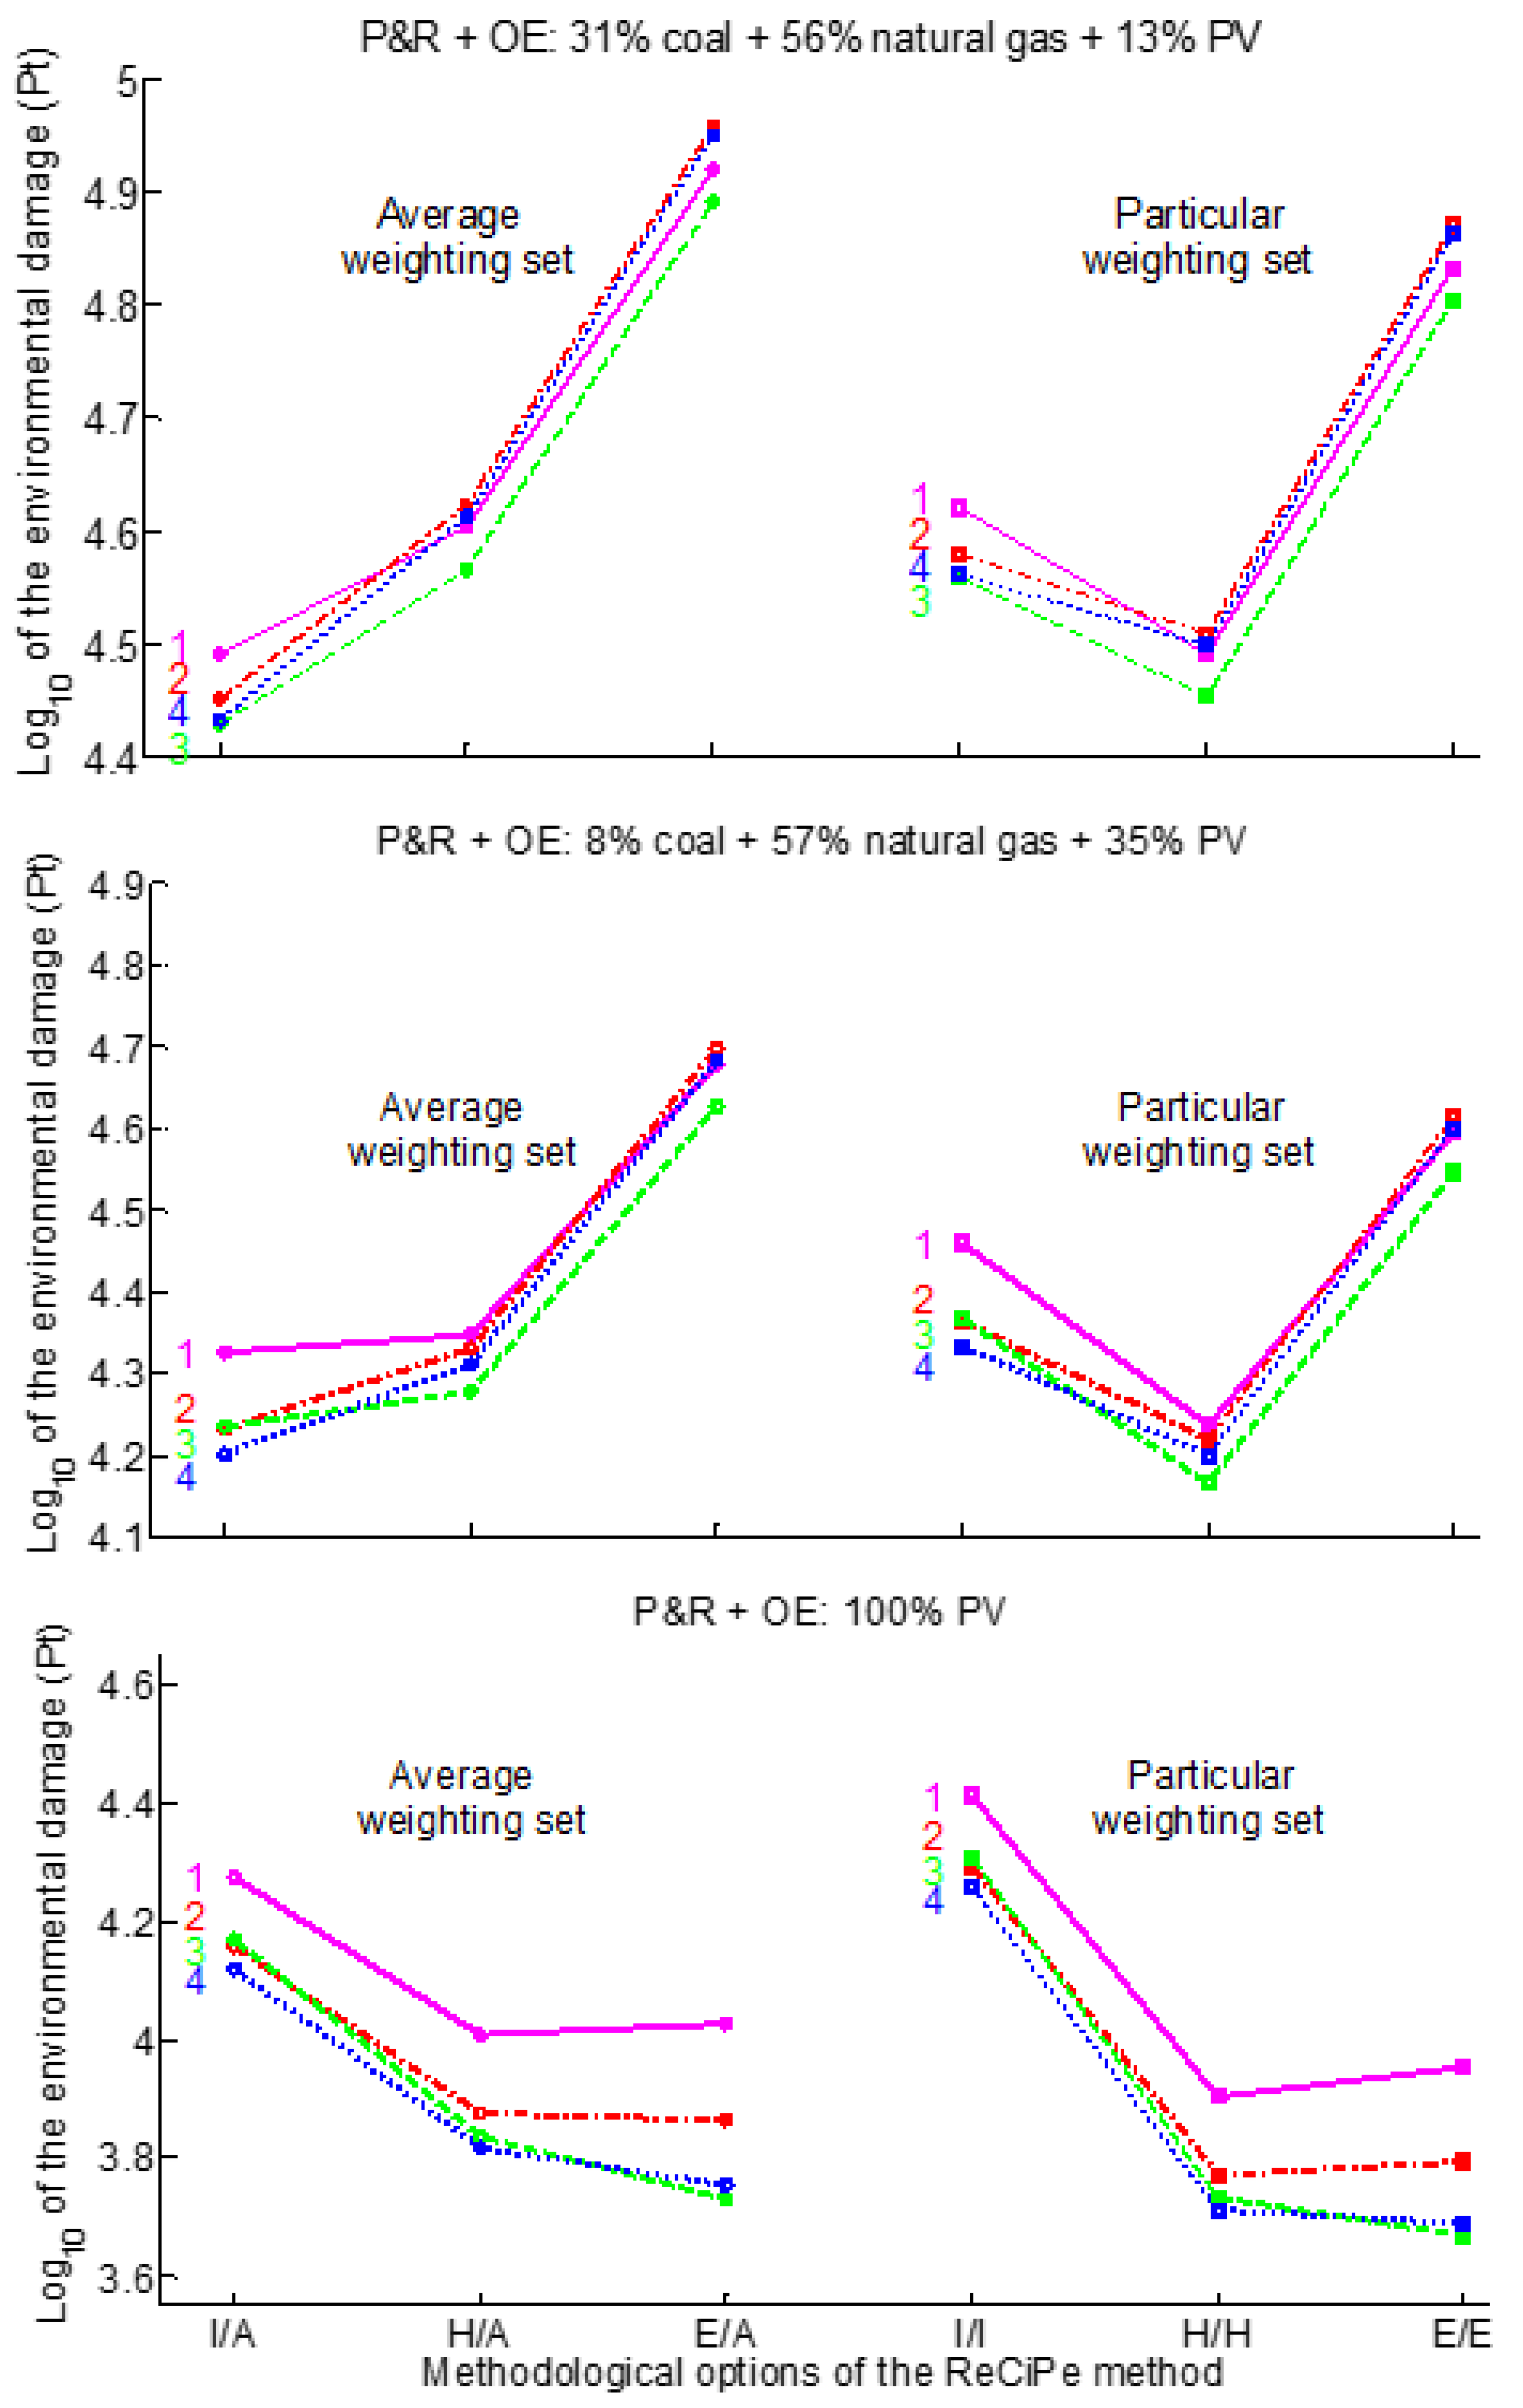
3.2.3. ReCiPe2016 2016 Endpoint Single-Score Results

Figure 7 shows that in the P&R stage, considering the four alternatives in ascending order of environmental damage, the autoclaved aerated block with maximal windows was the most preferable (with the lowest environmental damage), followed by the concrete block with maximal windows and the autoclaved aerated block with minimal windows, and the concrete block with minimal windows was the least preferable alternative (with the highest environmental damage). It should be noted that the preferability of the concrete block with maximal windows and autoclaved aerated block with minimal windows changed under different methodological options: The concrete block with maximal windows was more preferable under I/A and I/I, whereas the autoclaved aerated block with minimal windows was more preferable under E/A and E/E. The statistical analysis confirmed the significant difference between both the autoclaved aerated block with maximal windows and the concrete block with minimal windows, and each of the other alternatives, whereas no difference was found between the concrete block with maximal windows and the autoclaved aerated block with minimal windows (Table 6).
Figure 8 shows that, in the OE stage with all three electricity sources (31% coal, 56% natural gas, and 13% PV-based electricity; 8% coal, 57% natural gas, and 35% PV-based electricity; and 100% PV-based electricity), the concrete block and autoclaved aerated block alternatives with minimal windows had lower environmental damage, whereas those alternatives with maximal windows had higher environmental damage.
However, according to p-value (Table 7), the judgment of the difference between the two alternatives with minimal windows and the two with maximal windows was suspended with 31% coal, 56% natural gas and 13% PV-based electricity, and 8% coal, 57% natural gas and 35% PV-based electricity, whereas there was a significant difference with 100% PV-based electricity.
Figure 9 shows the total damage results for the P&R and OE stages. When visually analyzing two OE cases, with 31% coal, 56% natural gas and 13% PV-based electricity, and with 8% coal, 57% natural gas and 35% PV-based electricity, the autoclaved aerated block with minimal windows was associated with the lowest environmental damage, the concrete block with maximal windows and autoclaved aerated block with maximal windows had intermediate damage, and the concrete block with minimal windows had the highest environmental damage.
However, when visually analyzing the case with 100% PV, both autoclaved aerated-block-based alternatives with minimal and maximal windows were associated with the lowest environmental damage, the concrete block with maximal windows with intermediate environmental damage, and the concrete block with minimal windows with the highest environmental damage. Concerning the renewable electricity sources used, the P&R stage was more influential than the OE stage.
According to the p-value results, there were no significant differences in all pairs of the compared alternatives in OE cases with 31% coal, 56% natural gas and 13% PV-based electricity, and with 8% coal, 57% natural gas and 35% PV-based electricity (Table 8). Thus, according to the ranking results of the six ReCiPe2016 methodological options (Figure 8) and the statistical results (Table 8), concrete-based and autoclaved aerated blocks with minimal and maximal windows were shown to be alternatives with similar environmental damage results. These results contradict the energy rate results, which showed that the alternatives with minimal windows were rated C and those with maximal windows were rated D (Table 4).
The case with 100% PV showed a difference in each pair of compared alternatives, except autoclaved aerated-block-based alternatives with minimal and maximal windows (Table 8). According to the ReCiPe2016 ranking results (Figure 8) and the statistical results (Table 8), autoclaved aerated-block-based alternatives with minimal and maximal windows were the most preferable alternatives, with the lowest environmental damage, followed by the concrete block with maximal windows, with intermediate environmental damage, and the concrete block with minimal windows, the least preferable alternative, with the highest environmental damage. These results also contradict the energy rate results showing that alternatives with minimal windows were rated C, and those with maximal windows were rated D (Table 4).

4. Conclusions

This study analyzed four building technology alternatives for a typical office building, including concrete-block-based and autoclaved aerated-block-based technologies, with minimal and maximal windows, to evaluate: (i) the energy rates according to standard SI5282, and (ii) the LCA (P&Rs and OE). The OE stage of the LCA was conducted with the following electricity sources: (i) 31% coal, 56% natural gas, and 13% PV; (ii) 8% coal, 57% natural gas, and 35% PV; and (iii) 100% PV. Both P&R and OE stages were evaluated by ReCiPe2016 impact and damage assessment. The following was revealed.
Analyzing the energy rating according to standard SI5282, concrete-block-based and autoclaved aerated-block-based alternatives with maximal windows were rated lower (D rating) and concrete-block-based and cellular block-based alternatives with minimal windows were rated higher (C rating).
However, the ranking results were not confirmed by the LCA (P&R and OE). The LCA results for both OE electricity sources (31% coal, 56% natural gas, and 13% PV; current in 2020) and (8% coal, 57% natural gas, and 35% PV; predicted in 2025) confirmed that concrete-based and autoclaved aerated blocks with minimal and maximal windows had similar environmental damage. This is because most impacts, such as global warming potential, land acidification, and ozone formation, are predominantly influenced by the OE stage, while others, such as terrestrial ecotoxicity, are influenced by both the P&R and OE stages.
In the hypothetical future scenario, the concrete-block-based alternatives with minimal and maximal windows resulted in high and intermediate damage, respectively, whereas autoclaved aerated-block-based alternatives with minimal and maximal windows resulted in similar low damage. This is because most of the impacts, such as global warming potential, land acidification, and ozone formation, are influenced by both the P&R and OE stages, while others, such as terrestrial ecotoxicity, are predominantly influenced by the P&R stage.
Based on the LCA results, it is recommended that the energy rating according to standard SI5282 be completed with an environmental evaluation of the P&R stage of building technology alternatives toward the further improvement of building-related sustainability. This issue highly depends on the electricity source for the OE stage: it is more relevant to renewable fuels than to fossil-based fuels. The environmental evaluations of the P&R stage need to be performed using the ReCiPe2016 method with two-stage nested mixed ANOVA, in which the six methodological options of ReCiPe2016 are simultaneously evaluated to consider all environmental views on the seriousness of the environmental damage.

5. Limitations

To determine whether the proposed modification of SI5282, evaluating the P&R stage in addition to reducing energy consumption, is a feasible solution, cost analysis should be considered in further research. Moreover, in future research, a sensitivity analysis of this solution to the construction and demolition stages should be conducted.

Author Contributions

Conceptualization, S.P. and A.Y.; formal analysis, S.P. and A.Y.; investigation, S.P. and A.Y.; methodology, S.P. and A.Y.; project administration, S.P. and A.Y.; resources, S.P. and A.Y.; software, S.P. and A.Y.; validation, S.P. and A.Y.; visualization, S.P. and A.Y.; writing—original draft, S.P.; writing—review and editing, S.P. and A.Y. All authors have read and agreed to the published version of the manuscript.

Funding

This research received no external funding.

Data Availability Statement

The data presented in this study are available on request from the corresponding author. The data are not publicly available due to privacy issues.

Conflicts of Interest

The authors declare no conflict of interest.

References

  1. Directive 2010/31/EU of the European Parliament and of the Council (Recast). Official Journal of the European Union 19 May. 2010. Available online: https://eur-lex.europa.eu/LexUriServ/LexUriServ.do?uri=OJ:L:2010:153:0013:0035:EN:PDF (accessed on 15 December 2020).
  2. Shaviv, E.; Yezioro, A.; Capeluto, I.G. Energy Code for Office Buildings in Israel. Renew. Energy 2008, 33, 99–104. [Google Scholar] [CrossRef]
  3. Hamed, T.A.; Bressler, L. Energy security in Israel and Jordan: The role of renewable energy sources. Renew. Energy 2019, 135, 378–389. [Google Scholar] [CrossRef]
  4. Israel Electricity Authority. Electricity Status Report. 2020. Available online: https://www.gov.il/BlobFolder/generalpage/dochmeshek/he/Files_Netunei_hashmal_doch_reshut_hasmal_2020_malle_n.xlsx.pdf (accessed on 15 December 2020). (In Hebrew)
  5. Halasah, S.A.; Pearlmutter, D.; Feuermann, D. Field installation versus local integration of photovoltaic systems and their effect on energy evaluation metrics. Energy Pol. 2013, 52, 462–471. [Google Scholar] [CrossRef]
  6. Ministry of Energy. Sustainable Energy. Available online: https://www.gov.il/BlobFolder/news/energy_2030/en/National_Energy_Efficiacy_Program.pdf (accessed on 15 December 2020).
  7. Giordano, R.; Serra, V.; Tortalla, E.; Valentini, V.; Aghemo, C. Embodied Energy and Operational Energy Assessment in the Framework of Nearly Zero Energy Building and Building Energy Rating. Energy Procedia 2015, 78, 3204–3209. [Google Scholar] [CrossRef] [Green Version]
  8. Lessard, Y.; Anand, C.; Blanchet, P.; Frenette, C.; Amor, B. LEED v4: Where Are We Now? Critical Assessment through the LCA of an Office Building Using a Low Impact Energy Consumption Mix. J. Ind. Ecol. 2017, 22, 1105–1116. [Google Scholar] [CrossRef]
  9. Amiri, A.; Emami, N.; Ottelin, J.; Sorvari, J.; Marteinsson, B.; Heinonen, J.; Junnila, S. Embodied emissions of buildings—A forgotten factor in green building certificates. Energy Build. 2021, 241, 110962. [Google Scholar] [CrossRef]
  10. Cabeza, L.F.; Rincón, L.; Vilariño, V.; Pèreza, G.; Castella, A. Life cycle assessment (LCA) and life cycle energy analysis (LCEA) of buildings and the building sector: A review. Renew. Sustain. Energy Rev. 2014, 29, 394–416. [Google Scholar] [CrossRef]
  11. Karimpour, M.; Belusko, M.; Xing, K.; Bruno, F. Minimising the life cycle energy of buildings: Review and analysis. Build. Environ. 2014, 73, 106–114. [Google Scholar] [CrossRef]
  12. Capeluto, I.G.; Yezioro, A.; Shaviv, E. What are the required conditions for heavy structure buildings to be thermally effective in a hot humid climate? J. Sol. Energy Eng. 2004, 126, 886–892. [Google Scholar] [CrossRef]
  13. Huberman, N.; Pearlmutter, D. A life-cycle energy analysis of building materials in the Negev desert. Energy Build. 2008, 40, 837–848. [Google Scholar] [CrossRef]
  14. Dong, Y.; Ng, S.T.; Liu, P. A comprehensive analysis towards benchmarking of life cycle assessment of buildings based on systematic review. Build. Environ. 2021, 204, 108162. [Google Scholar] [CrossRef]
  15. Pushkar, S.; Verbitsky, O. Environmental damage from wall technologies for residential buildings in Israel. J. Green Build. 2016, 11, 98–106. [Google Scholar] [CrossRef]
  16. Pushkar, S.; Verbitsky, O. Life-Cycle Assessment of the Energy Code for Office Buildings Using the Prescriptive Approach in Israel. In Proceedings of the International Conference on Sustainable Infrastructure 2017 (ASCE) Methodology, 26–28 October 2017; Soibelman, L., Peña-Mora, F., Eds.; American Society of Civil Engineers: New York, NY, USA, 2017; pp. 207–217. ISBN 978-1-5108-5274-7. [Google Scholar]
  17. Yezioro, A.; Capeluto, I.G. Energy Rating of Buildings to Promote Energy-Conscious Design in Israel. Buildings 2021, 11, 59. [Google Scholar] [CrossRef]
  18. US Department of Energy. EnergyPlus. Available online: https://energyplus.net/downloads (accessed on 10 November 2021).
  19. PRé Consultants. SimaPro; Version 9.1. 0.35; PRé Consultants: Amersfoort, The Netherlands, 2019. [Google Scholar]
  20. Hart, J.; D’Amico, B.; Pomponi, F. Whole-life embodied carbon in multistory buildings: Steel, concrete and timber structures. J. Ind. Ecol. 2001, 25, 403–418. [Google Scholar] [CrossRef]
  21. Scheuer, C.; Keoleian, G.A.; Reppe, P. Life cycle energy and environmental performance of a new university building: Modeling challenges and design implications. Energy Build. 2003, 35, 1049–1064. [Google Scholar] [CrossRef]
  22. Asif, M. An empirical study on life cycle assessment of double-glazed aluminium-clad timber windows. Int. J. Build. Pathol. Adapt. 2019, 37, 547–564. [Google Scholar] [CrossRef]
  23. Jia, X.; Lv, F.; Li, P.; Wang, W. Life-cycle assessment of p-type multi-Si back surface field (BSF) solar module in China of 2019. Sol. Energy 2020, 196, 207–216. [Google Scholar] [CrossRef]
  24. Pushkar, S. Using Eco-Indicator 99 to evaluate building technologies under Life cycle assessment uncertainties. J. Architect. Eng. 2014, 20, 04013010. [Google Scholar] [CrossRef]
  25. Verbitsky, O.; Pushkar, S. Eco-Indicator 99, ReCiPe, and ANOVA for evaluating building technologies under LCA uncertainties. Environ. Eng. Manag. J. 2018, 17, 2549–2559. [Google Scholar] [CrossRef]
  26. Huijbregts, M.A.J.; Steinmann, Z.J.N.; Elshout, P.M.F.; Stam, G.; Verones, F.; Vieira, M.; Zijp, M.; Hollander, A.; van Zelm, R. ReCiPe2016: A harmonised life cycle impact assessment method at midpoint and endpoint level. Int. J. Life Cycle Assess. 2017, 22, 138–147. [Google Scholar] [CrossRef]
  27. Picquelle, S.J.; Mier, K.L. A practical guide to statistical methods for comparing means from two-stage sampling. Fish. Res. 2011, 107, 1–13. [Google Scholar] [CrossRef]
  28. Pushkar, S. Modeling the substitution of natural materials with industrial byproducts in green roofs using life cycle assessments. J. Clean. Prod. 2019, 227, 652–661. [Google Scholar] [CrossRef]
  29. Hurlbert, S.H.; Lombardi, C.M. Final collapse of the Neyman-Pearson decision theoretic framework and rise of the neoFisherian. Ann. Zool. Fenn. 2009, 46, 311–349. [Google Scholar] [CrossRef]
  30. Gotelli, N.J.; Ellison, A.M. A Primer of Ecological Statistics, 2nd ed.; Sinauer Associates: Sunderland, MA, USA, 2004; p. 638. ISBN 1605350648. [Google Scholar]
  31. Beninger, P.G.; Boldina, I.; Katsanevakis, S. Strengthening statistical usage in marine ecology. J. Exp. Mar. Biol. Ecol. 2012, 426, 97–108. [Google Scholar] [CrossRef]
  32. Fisher, R.A. Statistical Methods and Scientific Inference; Oliver and Boyd: Edinburgh, UK, 1956; p. 175. [Google Scholar]
  33. Altman, D.G. Practical Statistics for Medical Research; Chapman and Hall: London, UK, 1991; p. 623. [Google Scholar]
  34. Van den Heede, P.; De Belie, N. Environmental impact and life cycle assessment (LCA) of traditional and ‘green’ concretes: Literature review and theoretical calculations. Cem. Concr. Compos. 2012, 34, 431–442. [Google Scholar] [CrossRef]
  35. Santoyo-Castelazo, E.; Solano-Olivares, K.; Martínez, E.; García, E.O.; Santoyo, E. Life cycle assessment for a grid-connected multi-crystalline silicon photovoltaic system of 3 kWp: A case study for Mexico. J. Clean. Prod. 2021, 316, 128314. [Google Scholar] [CrossRef]
Figure 1. Typical office building. (Left): Main building components. (Right): Whole building.
Buildings 12 00157 g001
Figure 2. A flow chart diagram of the methodology for two-step evaluation procedure of CBMinWin, CBMaxWin, AABMinWin, and AABMaxWin.
Buildings 12 00157 g002
Figure 3. Two-stage ANOVA hierarchical design structure applied to environmental evaluation of CBMinWin, CBMaxWin, AABMinWin, and AABMaxWin (ReCiPe2016 methodological options: egalitarian/egalitarian (E/E), egalitarian/average (E/A), hierarchist/hierarchist (H/H), hierarchist/average (H/A), individualist/individualist (I/I), and individualist/average (I/A)).
Buildings 12 00157 g003
Figure 4. P&R and OE stages (OE stage with 31% coal + 56% gas + 13% PV-based electricity): environmental impact of CBMinWin (1), CBMaxWin (2), AABMinWin (3), and AABMaxWin (4), evaluated with ReCiPe2016 midpoint method, hierarchist (H) methodological option.
Buildings 12 00157 g004
Figure 5. P&R and OE stages (OE stage with 8% coal + 57% natural gas + 35% PV-based electricity): environmental impact of CBMinWin (1), CBMaxWin (2), AABMinWin (3), and AABMaxWin (4), evaluated with ReCiPe2016 midpoint method, hierarchist (H) methodological option.
Buildings 12 00157 g005
Figure 6. P&R and OE stages (OE stage with 100% PV-based electricity): environmental impact of CBMinWin (1), CBMaxWin (2), AABMinWin (3), and AABMaxWin (4), evaluated with ReCiPe2016 midpoint method, hierarchist (H) methodological option.
Buildings 12 00157 g006
Figure 7. P&R stage: environmental damage of CBMinWin (1), CBMaxWin (2), AABMinWin (3), and AABMaxWin (4), evaluated with ReCiPe2016 endpoint single-score method using individualist/average (I/A), hierarchist/average (H/A), egalitarian/average (E/A), individualist/individualist (I/I), hierarchist/hierarchist (H/H), and egalitarian/egalitarian (E/E).
Buildings 12 00157 g007
Figure 8. OE stage: environmental damage of CBMinWin (1), CBMaxWin (2), AABMinWin (3), and AABMaxWin (4), evaluated with ReCiPe2016 endpoint single-score method using individualist/average (I/A), hierarchist/average (H/A), egalitarian/average (E/A), individualist/individualist (I/I), hierarchist/hierarchist (H/H), and egalitarian/egalitarian (E/E).
Buildings 12 00157 g008
Figure 9. P&R + OE stages: environmental damage of CBMinWin (1), CBMaxWin (2), AABMinWin (3), and AABMaxWin (4), evaluated with ReCiPe2016 endpoint single-score method using individualist/average (I/A), hierarchist/average (H/A), egalitarian/average (E/A), individualist/individualist (I/I), hierarchist/hierarchist (H/H), and egalitarian/egalitarian (E/E).
Buildings 12 00157 g009
Table 1. Main settings of the studied typical office building.
ParametersSettings
Location Tel Aviv
Structure (5 stories)Typical floor844.6 m2
Main façade orientation North–south
LoadsPeople12 people/m2
Constant0.4 W/m2
Non-constant8 W/m2
Lighting 12 W/m2
Mechanical systemIdeal system heating/cooling load calculation
SetpointHeating20 °C
Cooling24 °C
Infiltration 1 ach
Seasons All
Table 2. Building components with composite materials of studied alternatives.
Components
(U-Value (W/m2K))
Alternatives
CBMinWinCBMaxWinAABMinWinAABMaxWin
Composite Materials (Thickness (m))
Roof (U = 0.7)Bitumen (0.05 m), light concrete (0.05 m), polystyrene (0.045 m), concrete (0.14 m), lime–cement mortar (0.02 m)
Ground floor
(U = 0.72)
Cement mortar (0.025 m), concrete (0.14 m), polystyrene (0.04 m), light concrete (0.05 m), sand (0.03 m), cement mortar (0.02), marble (0.04 m)
Internal floor
(U = 3.53)
Cement mortar (0.025 m), concrete (0.15 m), cement mortar (0.02 m),
ceramic tile (0.02 m)
Interior walls
(U = 2.66)
Lime–cement mortar (0.015 m), concrete block (0.10 m), lime–cement mortar (0.015 m)
Exterior walls
(U = 053 a;
U = 0.54 b)
a Cement mortar (0.025 m), polystyrene (0.03 m), concrete block (0.23 m), lime–cement mortar (0.02 m)b Cement mortar (0.025 m), autoclaved aerated block (0.2 m)
lime–cement mortar (0.02 m)
Window area673.8 m21817.1 m2673.8 m21817.1 m2
Window type
(U = 3.14 c;
U = 3.95 d)
c Single LowE glass (aluminum frame: 10% of window area)d Double clear glass (aluminum frame: 10% of window area)
ShadingInternal dynamic (plastic blinds)External dynamic
(plastic blinds)
Internal dynamic (plastic blinds)External dynamic
(plastic blinds)
Note: a – U-value of exterior walls of CBMinWin and CBMaxWin; b – U-value of exterior walls of AABMinWin and AABMaxWin; c – U-value of windows of CBMinWin and CBMaxWin; d – U-value of windows of AABMinWin and AABMaxWin.
Table 3. Production and replacement (P&R) and operational energy (OE) stages: data input from the Ecoinvent v3.2 database (SimaPro v9.1, European data [19]).
Materials/EnergyData Source
P&R Stage
Concrete blocksLightweight concrete block, at plant/CH
Cellular blocksAutoclaved aerated concrete block, at plant/CH
PolystyrenePolystyrene foam slab, at plant/RER
Cement mortarCement mortar, at plant/CH
GlassFlat glass, coated/uncoated, at plant/RER
AluminumAluminum extrusion profile/RER
PlasticPolyethylene, LDPE, at plant/RER
OE Stage
Operational energyElectricity, hard coal, at power plant/ES
Electricity, natural gas, at power plant/ES
Electricity, PV, at 3 kWp flat roof installation, multi-Si/CH
Note: ES, Spain; CH, Switzerland; RER, France.
Table 4. Office-type building: energy assessment and building rates.
AlternativeEnergy (kWh/m2∙year)Building Rate
Floor 1Floor 2Floor 3Floor 4Floor 5Building
CBMinWin27.127.928.528.431.228.6C
CBMaxWin30.632.832.832.835.432.9D
AABMinWin27.127.928.528.431.228.6C
AABMaxWin30.632.832.832.835.432.9D
Note: Italic font indicates energy assessment of typical intermediate floor (floor 3) which was included in further LCA of operational energy stage.
Table 5. Quantities of building materials required for P&R stage and energy required for OE stage of four alternatives (typical intermediate floor).
Materials/EnergyAlternatives
CBMinWinCBMaxWinAABMinWinAABMaxWin
Production Stage
Concrete/cellular blocks (kg)152,22857,56336,77013,904
Polystyrene (kg)331125
Cement mortar (kg)31,62211,95731,62211,957
Glass (kg)20215451404310,903
Aluminum (kg)1455392514553925
Plastic (kg)1617436116174361
Operational Energy Stage
Energy (kWh/floor∙50 year)1,203,5551,385,1441,203,5551,385,144
Table 6. P&R stage: p-values of paired differences of CBMinWin (1), CBMaxWin (2), AABMinWin (3), and AABMaxWin (4).
Alternative1234
Production Stage
1X0.00190.00120.0008
2 X0.20570.0081
3 X0.0082
4 X
Note: Bold font: seems to be positive; regular font: seems to be negative.
Table 7. OE stage: p-values of paired differences of CBMinWin (1), CBMaxWin (2), AABMinWin (3), and AABMaxWin (4).
Alternative1234
OE stage with 31% coal, 56% natural gas, and 13% PV-based electricity
1X0.07461.00000.0746
2 X0.07461.0000
3 X0.0746
4 X
OE stage with 8% coal, 57% natural gas, and 35% PV-based electricity
1X0.05701.00000.0570
2 X0.05701.0000
3 X0.0570
4 X
OE stage with 100% PV-based electricity
1X0.00201.00000.0020
2 X0.00201.0000
3 X0.0020
4 X
Note: Bold font: seems to be positive; regular font: seems to be negative; italic: judgment is suspended.
Table 8. P&R + OE stages: p-values of paired differences of CBMinWin (1), CBMaxWin (2), AABMinWin (3), and AABMaxWin (4).
Alternative1234
OE stage with 31% coal, 56% natural gas, and 13% PV-based electricity
1X0.76930.12190.7361
2 X0.10360.5548
3 X0.1660
4 X
OE stage with 8% coal, 57% natural gas, and 35% PV-based electricity
1X0.16010.03710.0656
2 X0.10630.2709
3 X0.3224
4 X
OE stage with 100% PV-based electricity
1X0.00430.00180.0017
2 X0.02230.0148
3 X0.1481
4 X
Note: Bold font: seems to be positive; regular font: seems to be negative.
Publisher’s Note: MDPI stays neutral with regard to jurisdictional claims in published maps and institutional affiliations.

