Article

Performance-Based Compositive Passive Control Analysis of Multi-Tower Building with Chassis: Optimization of Kelvin-Voigt Dampers

1
School of Civil and Hydraulic Engineering, Ningxia University, Yinchuan 750021, China
2
School of Civil Engineering, Guangzhou University, Guangzhou 510405, China
*
Authors to whom correspondence should be addressed.
Buildings 2022, 12(2), 137; https://doi.org/10.3390/buildings12020137
Submission received: 13 December 2021 / Revised: 21 January 2022 / Accepted: 26 January 2022 / Published: 27 January 2022

Abstract

:
The compositive passive control (CPC) method of “interlayer seismic isolation “plus “shock absorption between adjacent towers” was applied to a multi-tower building (MTB) with a large podium. The interaction between adjacent towers was used to reduce the structural response under seismic action. Based on the Clough–Penzien spectral seismic model, the extended state equation of random response of MTB was derived with the minimum total energy of structural vibration as the optimization control objective. By comparing the seismic scheme and interlayer seismic isolation scheme, the relationship between the control parameters of the connecting control device and the random response of the structure was discussed and analyzed, and the control effect of the composite passive control system under different control schemes was also studied from the perspective of seismic response time history and vibration cumulative energy time history. Through numerical analysis, it was proved that the damping coefficient of the Kelvin-Voigt model has a great influence on the mean square error of total vibration energy while the stiffness coefficient has a poor sensitivity to it. Under the optimization control objective, the connection control device was better arranged at the top of the structure. The control effect can reach 84.64% under the condition of random ground motion as input. The CPC method maintains the advantages of the interlayer seismic isolation scheme and reduces the defect of the response amplification caused by the interlayer isolation, which provides a reference for the follow-up study of the CPC method of MTB.

1. Introduction

With the rapid development of the current urban construction process, it is imperative to build urban earthquake resilient structures, and the emphasis of design for seismic resistance has been changed from “strength” to “performance” [1,2,3]. Besides, due to the rational planning and use of urban construction land and the need for innovative, practical and functional building systems, a large number of large-chassis twin-tower structures have emerged. A series of research works have been carried out on these structures [4,5,6,7,8]. Some scholars found that as the upper tower’s shape shrinks causing the layer rigidity to experience abrupt change, and as the towers are independent, vertical irregular structures are created, which is disadvantageous for the structure’s earthquake resistance, due to large chassis torsion [9,10]. In order to reduce the horizontal-torsional coupling effect and improve the seismic performance of the twin-tower structure, researchers have conducted a lot of research on the interlayer seismic isolation technology, indicating it is an effective damping system [11,12,13]. However, some scholars also found that interlayer seismic isolation cannot suppress the acceleration response of the lower part of the structure (i.e., the large chassis podium) [14,15,16,17]. Because the lateral stiffness of the isolation layer is small, the rigid lateral displacement of the upper tower is large during an earthquake, and it is necessary to limit the lateral displacement of the isolation layer. At present, the seismic mitigation effect of the lower podium is poor, and even causes the problem of response amplification. For the seismic safety of the lower podium structure, there are still widespread doubts and concerns in the engineering field. Therefore, how to combine the advantages of the structure itself, using a reasonable control method to better ensure the safety of such structures, has become one of the problems to be solved. At the same time, some scholars have concluded that the control scheme of installing control devices between adjacent structures can effectively improve the seismic performance of the whole structure [18,19,20,21,22,23,24,25]. Klein and Healey [26] first proposed the idea of adding energy dissipation components and semi-active control devices between adjacent structures to improve the seismic capacity of structures. In recent years, Zhu et al. [27,28,29,30] and Patel et al. [31,32] studied the optimization of dampers between adjacent structures through theoretical derivation and numerical parameter research. Therefore, we propose to apply the composite passive control method (CPC method) of “interlayer seismic isolation” and “shock absorption between adjacent towers” to a multi-tower building (MTB) with a large podium, to make use of the respective advantages of the two control methods in order to achieve a better control effect. On the basis of using the advantages of interlayer seismic isolation, the advantages of shock absorption between adjacent towers are further used to dissipate and transfer the energy input from the earthquake through the mutual movement between adjacent towers, so as to resist the external load with the structure, reduce the seismic response of the structure, and improve the seismic performance of the whole structure.
A large number of seismic observation data show that the ground motion has obvious randomness [33,34]. The random characteristics of ground motion have become a consensus in the engineering community [35,36,37]. In 1947, Housner proposed random white noise ground motion excitation [38]. Since then, various improved models of ground motion randomness have been proposed, such as the Kanai-Tajimi spectrum (filtered white noise) [39,40] and double filtered white noise spectrum (Clough, et al. [41] spectrum), Ou Jinping et al. [42] spectrum, Li Hongjing et al. [43] spectrum. The Kanai-Tajimi spectrum is the first to use the filter equation to express the complex ground motion as a white noise excitation based on the characteristic value of the site vibration, while other random ground motion models have improved on Kanai-Tajimi, making the expression of ground motion more accurate. The Clough–Penzien spectrum uses filtering equations to improve the effect of Kanai-Tajimi over-exaggerating the low-frequency ground motion energy, which has been widely used.
This paper investigates the effectiveness of the suggested compositive passive control (CPC) method for an interlayer isolated multi-tower building with large chassis using the created passive control model. Based on the Clough–Penzien spectral ground motion model, the extended state equation of random response of MTB is derived with the minimum total energy of structural vibration as the optimization control objective. From the perspective of random vibration analysis, the control effect of seismic response before and after the control, as well as the performance parameters, layout position and layout number of passive control devices, are optimized. This paper conducts a preliminary exploration of how to apply this combined isolation system on an MTB in order to ensure the seismic resilience of such structures and reduce their damage during a seismic event.

2. Analytical Model and Motion Equation

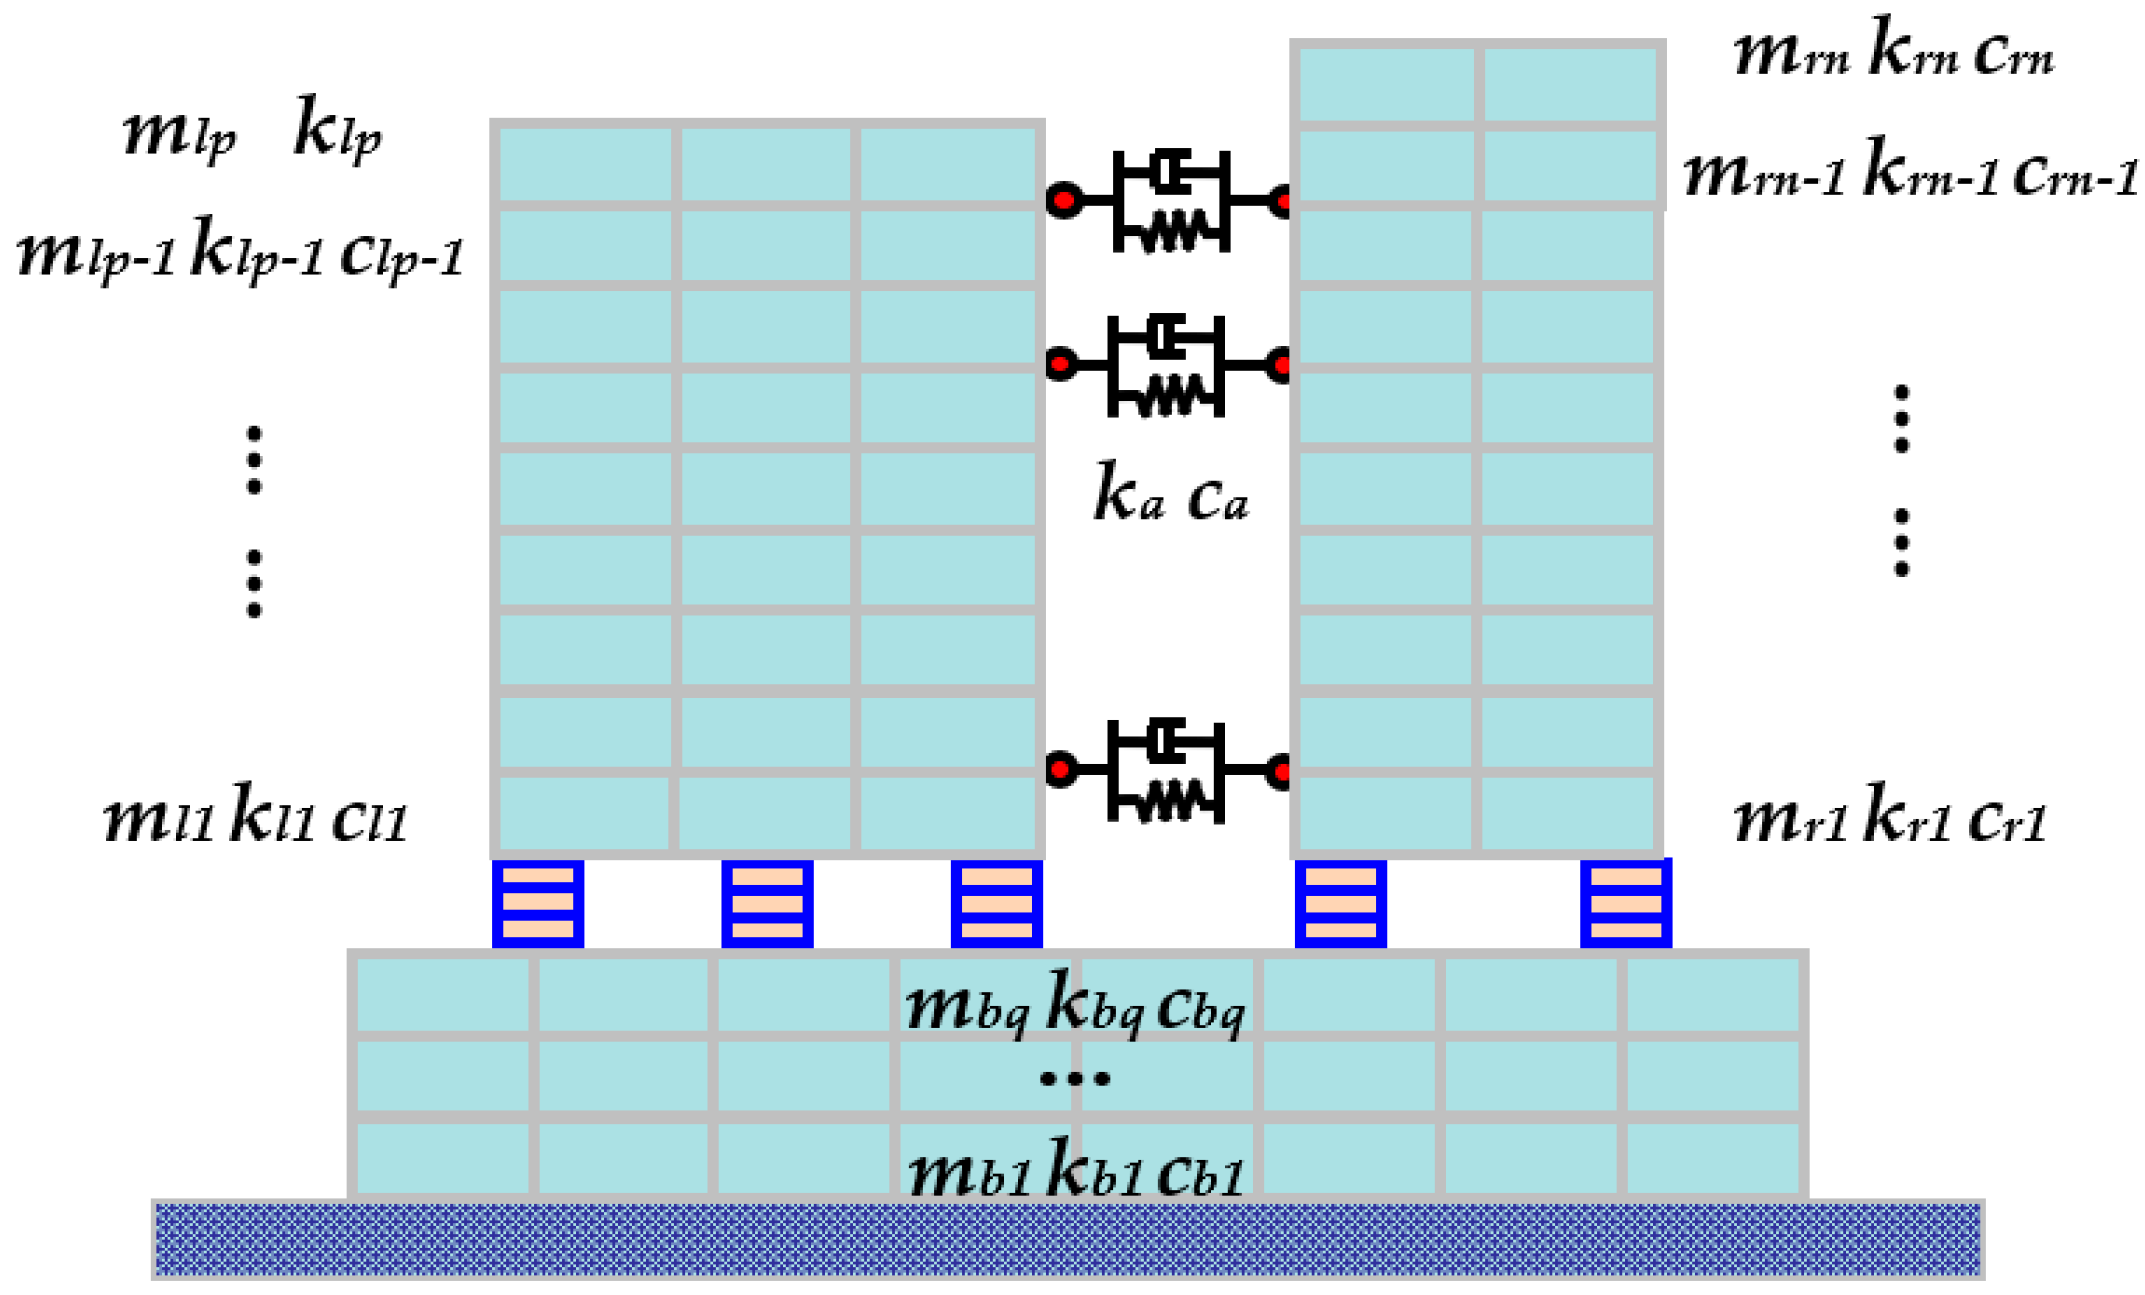
2.1. Analytical Model of Multi-Tower Building (MTB) Adopted Compositive Passive Control (CPC) Method

Assuming that the mass of the structure is concentrated on each layer and the stiffness of the layer is infinite, MTB, which adopts interlayer seismic isolation and is connected by passive control units (the Kelvin-Voigt control model), is simulated with a multi-DOF layer shear model. The calculation diagram of this model is shown in Figure 1.
In order to simplify the iterative solution of a large number of equations for multi-DOF systems, an equivalent simplified model is proposed, as shown in Figure 2. It represents the single-DOF layer shear model of MTB, while the single-DOF simplified models of the left and right towers are connected by the Kelvin-Voigt control model.
The mass mi, stiffness ki and damping ci, (i = b, l, r) of the substructure i of the equivalent single-DOF model can be obtained from the lateral deformation vector {ψi}(i = b, l, r) along the height direction of the substructure of MTB multi-degree system. The {ψi} represents the first-order vibration mode of structure i. In the model equivalent process, the isolation layer and the upper tower are treated as a base isolation structure, and the large chassis podium is treated as a seismic structure.
m i = { ψ i } T [ M i ] { I i }
k i = { ψ i } T [ K i ] { ψ i } { ψ i } T [ M i ] { I i } { ψ i } T [ M i ] { ψ i }
c i = { ψ i } T [ C i ] { ψ i } { ψ i } T [ M i ] { I i } { ψ i } T [ M i ] { ψ i }
where [Mi], [Ki], [Ci] are the mass, stiffness and damping matrices of each substructure i of the multi-DOF system, and {Ii} is the unit column vector.

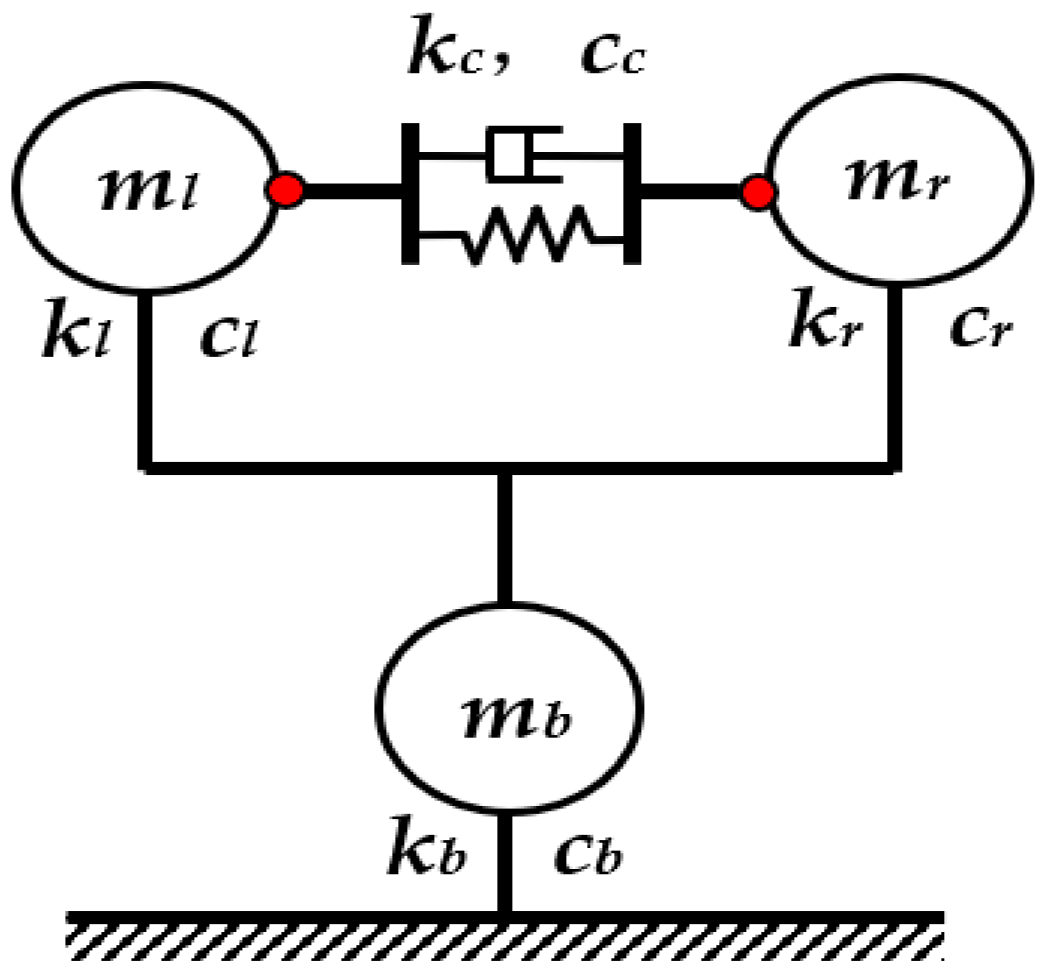
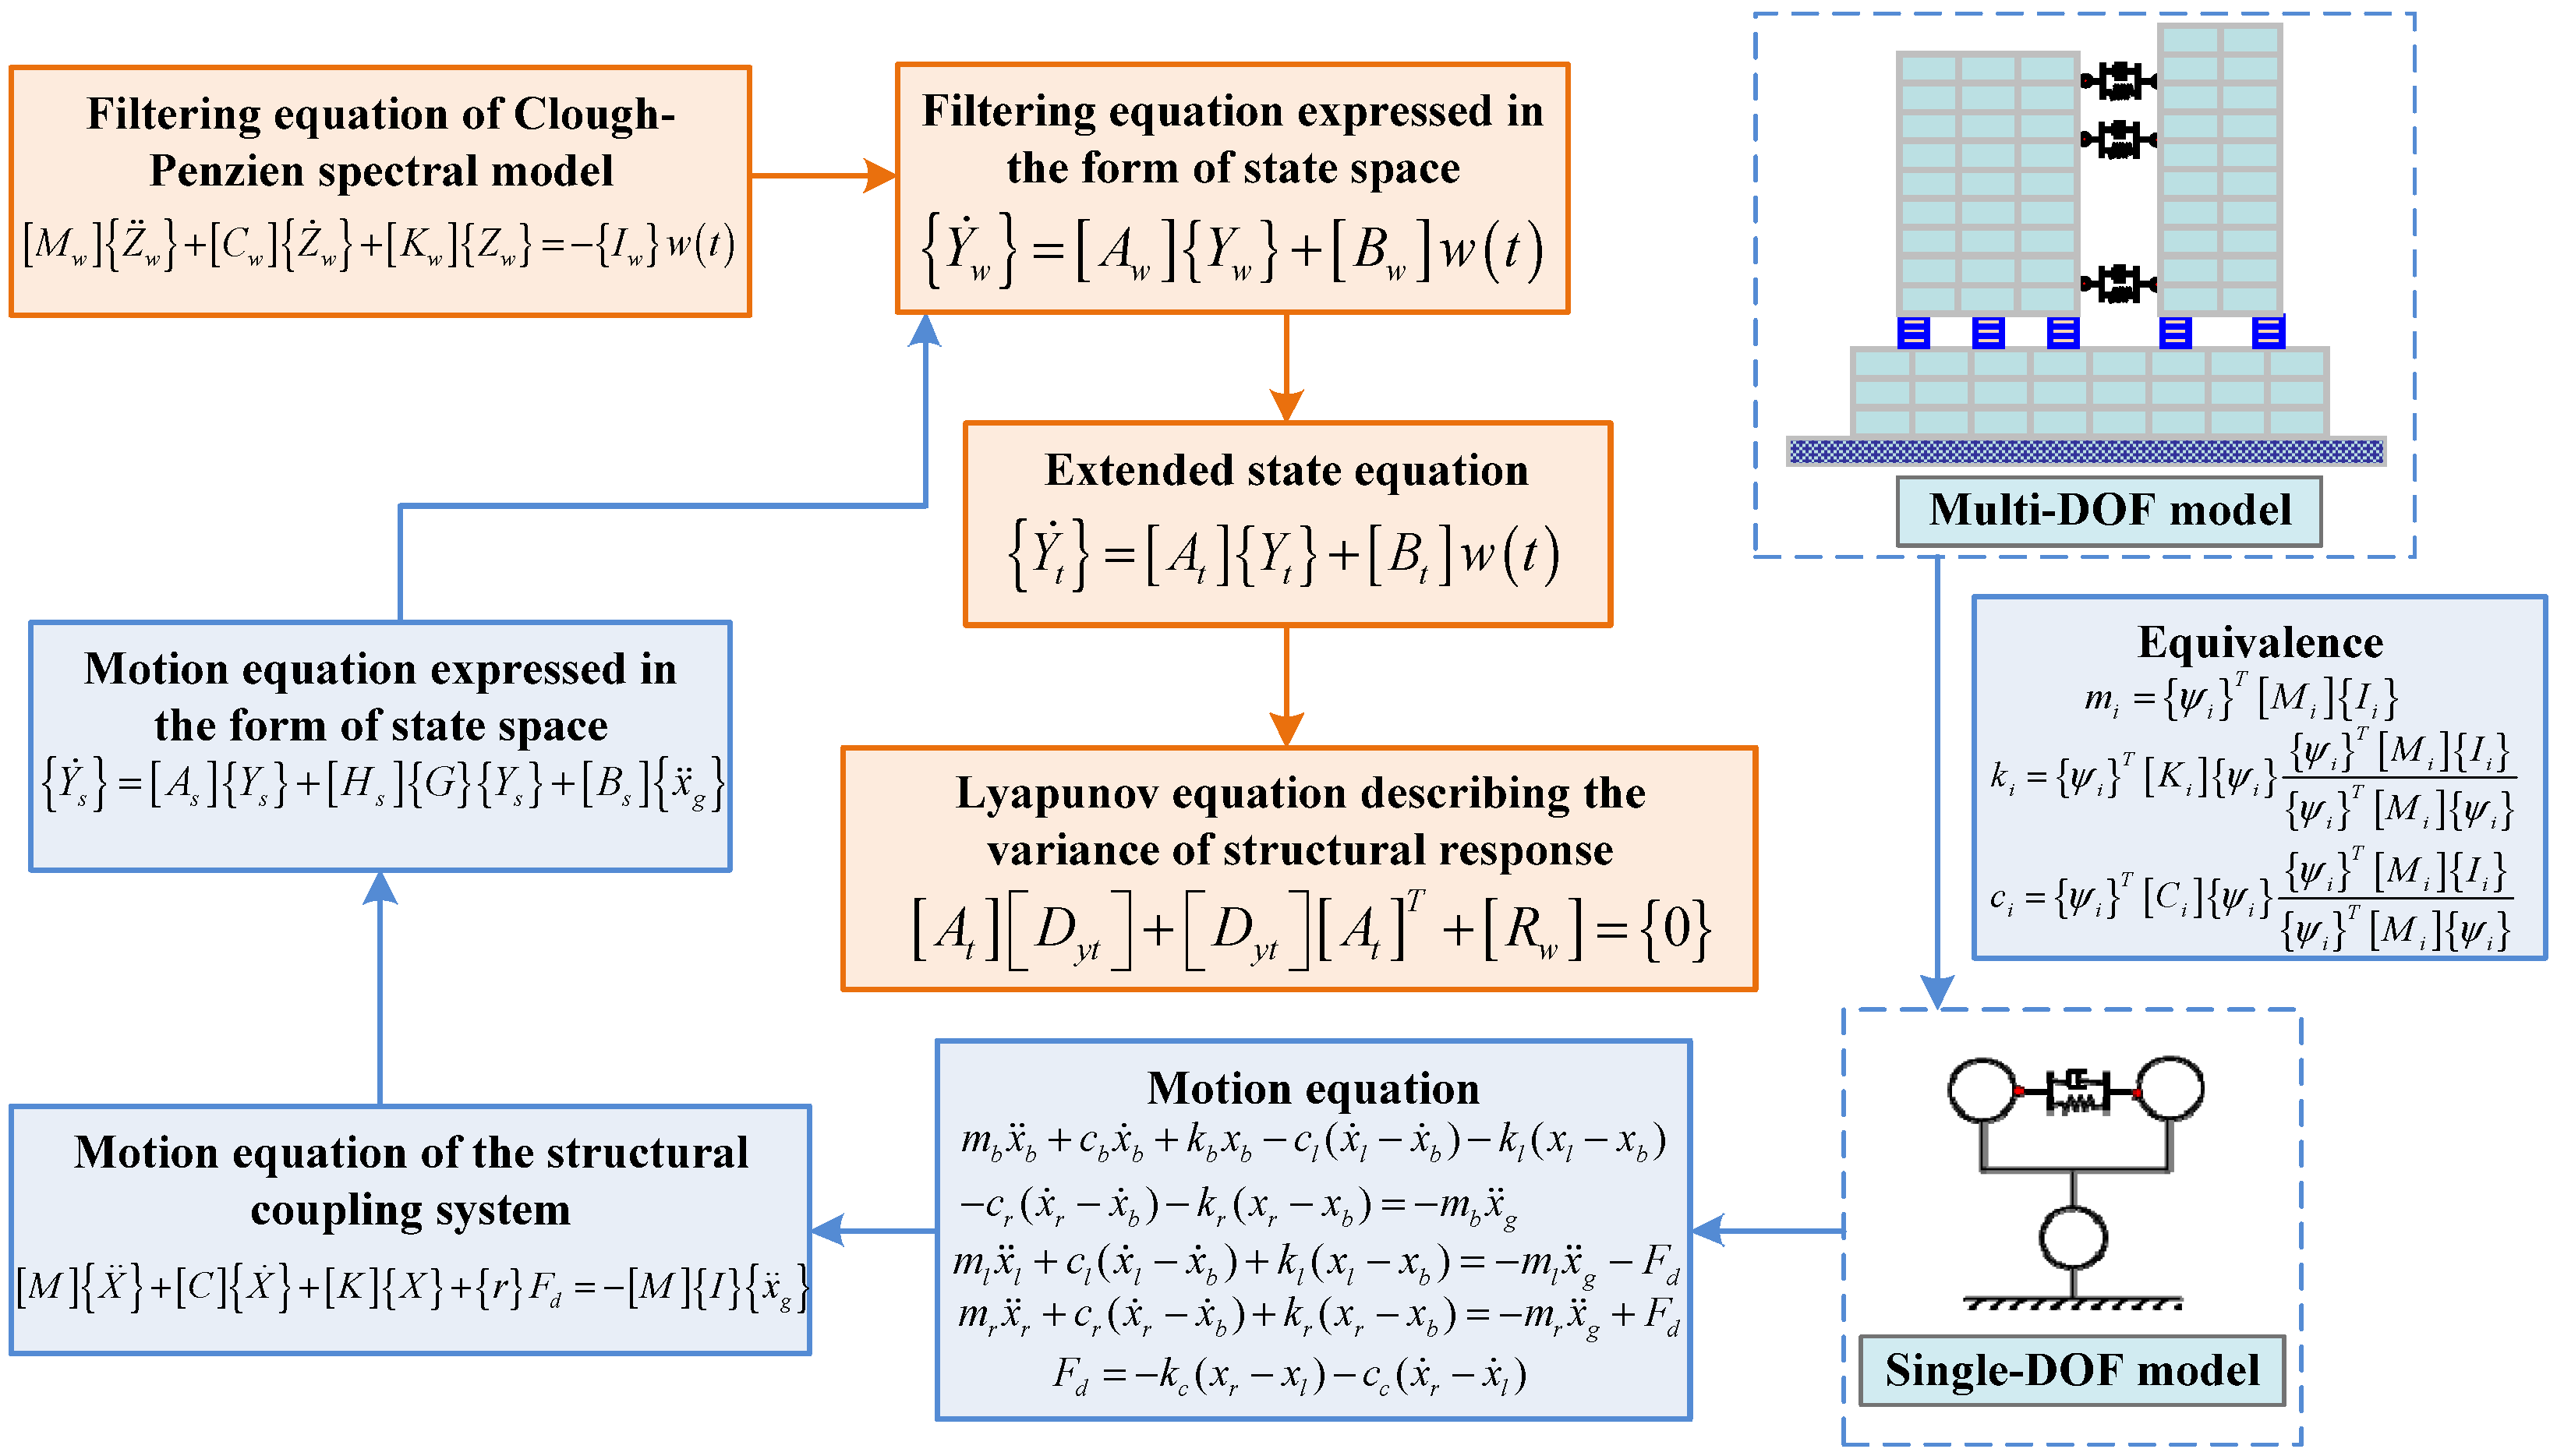
2.2. State Equation of Single Degree of Freedom (DOF) System of MTB

Assuming that the structure is a layer shear model, as shown in Figure 2, the simplified single-DOF model of MTB is represented, and the simplified single-DOF model of left and right towers is connected by a Kelvin-Voigt control model. The deducing process is shown in Figure 3.
Under the seismic action, the motion equation of each substructure are as follows:
m b x ¨ b + c b x ˙ b + k b x b c l ( x ˙ l x ˙ b ) k l ( x l x b ) c r ( x ˙ r x ˙ b ) k r ( x r x b ) = m b x ¨ g
m l x ¨ l + c l ( x ˙ l x ˙ b ) + k l ( x l x b ) = m l x ¨ g F d
m r x ¨ r + c r ( x ˙ r x ˙ b ) + k r ( x r x b ) = m r x ¨ g + F d
F d = k c ( x r x l ) c c ( x ˙ r x ˙ l )
where, mi, ki, ci (i = b, l, r) are the mass, stiffness and damping of each substructure i of the single-DOF model, Fd is the control force connecting the devices between adjacent towers, kc and cc are the performance parameters of the Kelvin-Voigt control model, x ¨ g is seismic excitation, and xi is the displacement response of the single degree of freedom system.
Combining Equations (4)–(6), the independent motion equation is re-expressed as the motion equation of the structural coupling system:
[ M ] { X ¨ } + [ C ] { X ˙ } + [ K ] { X } + { r } F d = [ M ] { I } { x ¨ g }
in which: { X } = { x b , x l , x r } T is the displacement column vector of the system. [ M ] = [ m b m l m r ] , [ C ] = [ c b + c l + c r c l c r c l c l c r c r ] , [ K ] = [ k b + k l + k r k l k r k l k l k r k r ] are mass, damping and stiffness matrices of the system, respectively. { r } = { 0 , 1 , 1 } T is the displacement column vector of the system. { I } = { 1 , 1 , 1 } T is the unit column vector.
Defining state vectors { Y s } = { { X } T , { X ˙ } T } T , the motion equation of the system can be expressed in the form of state space:
{ Y ˙ s } = [ A s ] { Y s } + [ H s ] { G } { Y s } + [ B s ] { x ¨ g }
in which:
[ A s ] = [ { 0 } 3 × 3 { I } 3 × 3 [ M ] 1 [ K ] [ M ] 1 [ C ] ] ,   { G } = { 0 , k c , k c , 0 , c c , c c } ,   [ H s ] = { { 0 } 1 × 3 [ [ M ] 1 { r } ] T } T ,   [ B s ] = { { 0 } 1 × 3 { I } T } T .

2.3. Extended State Equation of Clough–Penzien Spectral Model

The filtering equation of Clough-Penzien spectral model is expressed as:
[ M w ] { Z ¨ w } + [ C w ] { Z ˙ w } + [ K w ] { Z w } = { I w } w ( t )
in which:
[ M w ] = [ 1 1 0 0 1 1 0 0 1 ] , [ C w ] = [ 2 ξ f ω f 0 0 0 0 0 0 0 2 ξ g ω g ] , [ K w ] = [ ω f 2 0 0 0 0 0 0 0 ω g 2 ] , { I w } = { 0 , 1 , 1 } T , { Z w } = { x g , x f , u g } T ; ω g , ξ g are the first filter parameters of foundation soil, ω f , ξ f are the second filter parameters of foundation soil, w ( t ) is white noise excitation of bedrock, x ¨ g is ground acceleration of the Clough–Penzien spectral model, x ¨ f is absolute acceleration.
By formula (10), the state vector { Y w } = { { Z w } T , { Z ˙ w } T } T is defined and the filtering equation is expressed as a state space:
{ Y ˙ w } = [ A w ] { Y w } + [ B w ] w ( t )
in which:
[ A w ] = [ { 0 } 3 × 3 { 1 } 3 × 3 [ M w ] 1 [ K w ] [ M w ] 1 [ C w ] ] ,   [ B w ] = [ { 0 } 3 × 1 [ M w ] { I w } ] T
Let x ¨ g = { T w } { Y ˙ w } , and bring into Equation (9), whereupon:
{ Y ˙ s } = [ A s ] { Y s } + [ H s ] { G } { Y s } + [ B s ] { T w } { Y ˙ w }
where: { T w } = { 0 , 0 , 1 , 0 } .
Combining Equations (11) and (12) forms the extended state equation:
{ Y ˙ t } = [ A t ] { Y t } + [ B t ] w ( t )
in which:
[ A t ] = [ [ A s ] + [ H s ] [ G ] [ B s ] { T w } [ A w ] { 0 } 6 × 6 [ A w ] ] , [ B t ] = [ [ B s ] { T w } [ B w ] [ B w ] ] T , { Y t } = { { Y s } , { Y ˙ w } } T ,   [ T t ] = [ T s { 0 } 3 × 4 ] .

2.4. Structure Random Response Solution

Assuming that the structure is in a static state at t (0), the random process of structural input ground motion is a Gaussian random process with zero mean value. The bilateral spectrum and the unilateral spectrum of the stationary random process are S ω and G ω , respectively, so that the structural response covariance matrix is:
[ D y t ] = E [ { { y t } { μ y t } } { { y t } { μ y t } } T ] = E [ { y t } { y t } ] ,   [ R w ] = [ B t ] 2 π S 0 [ B t ] T
is the input covariance matrix. Then the Lyapunov equation describing the variance of structural response is:
[ A t ] [ D y t ] + [ D y t ] [ A t ] T + [ R w ] = { 0 }
The covariance matrix of the system expressed by (10) can be expressed as:
[ D y s ] = [ σ x b 2 σ x b σ x l σ x b σ x r σ x b σ x ˙ b σ x b σ x ˙ l σ x b σ x ˙ r σ x l σ x b σ x l 2 σ x l σ x r σ x l σ x ˙ b σ x l σ x ˙ l σ x l σ x ˙ r σ x r σ x b σ x r σ x l σ x r 2 σ x r σ x ˙ b σ x r σ x ˙ l σ x r σ x ˙ r σ x ˙ b σ x b σ x ˙ b σ x l σ x ˙ b σ x r σ x ˙ b 2 σ x ˙ b σ x ˙ l σ x ˙ b σ x ˙ r σ x ˙ l σ x b σ x ˙ l σ x l σ x ˙ l σ x r σ x ˙ l σ x ˙ b σ x ˙ l 2 σ x ˙ l σ x ˙ r σ x ˙ r σ x b σ x ˙ r σ x l σ x ˙ r σ x r σ x ˙ r σ x ˙ b σ x ˙ r σ x ˙ l σ x ˙ r 2 ]
According to the definition of spectral moment,
λ n = + | ω | 2 S ω d ω = 0 ω 2 G ω d ω n = 0 , 1 , 2
According to random vibration theory, under stationary excitation [31], the 0th order spectral moment of the structural response is equal to its variance, and the 2nd order spectral moment is equal to the 0th order spectral moment of the change rate of the stationary response.

3. Optimization of CPC Method

3.1. Performance Parameter Optimization of Passive Control Unit

Taking the stiffness coefficient K and damping coefficient C of the Kelvin-Voigt model as control parameters, the minimum total vibration energy of MTB is the control objective, and the total vibration energy of MTB is:
σ E 2 = 1 2 m b ( σ x ˙ b 2 + u 1 σ x ˙ l 2 + u 2 σ x ˙ r 2 ) + 1 2 k b ( σ x b 2 + u 1 β 1 2 σ x l 2 + u 2 β 2 2 σ x r 2 )
in which: u 1 = m l m b , u 2 = m r m b , are mass ratio of left and right tower to podium respectively; β 1 = ω l ω b , β 2 = ω r ω b , are the frequency ratios of left and right tower to podium, respectively.

3.2. Optimization Process

As shown in Figure 4, the first step of the optimization process is to establish the single-DOF model equivalently on the basis of the multi-DOF model, and then solve the motion equation of the single-DOF model. The optimization goal is to minimize the total energy of structural vibration. According to this goal, the performance parameters of the Kelvin-Voigt model, namely stiffness coefficient and damping coefficient, are optimized. Then, the performance parameters obtained in the single-DOF model are applied to the multi-DOF model. On this basis, the optimal layout of the Kelvin-Voigt model is determined and the optimal control scheme is obtained.

4. Example Analysis of CPC Method Application

A typical engineering example is adopted. A double-tower building with a large chassis is a comprehensive multi-functional high-rise building composed of a podium building and double-tower building with story isolation. The podium has three layers. The concentrated mass of each layer is 3.2 × 10⁶ kg, and the shear stiffness is 5.0 × 10⁹ N/m. The left tower and the right tower have 16 layers. The concentrated mass of each layer of the left tower is 1.0 × 10⁶ kg, and the shear stiffness is 2.0 × 10⁹ N/m. The concentrated mass of each layer of the right tower is 1.0 × 10⁶ kg, and the shear stiffness is 9.2 × 10⁸ N/m. The mass of the isolation layer of the left and right towers is 1.15 × 10⁶ kg and the shear stiffness is 2.15 × 10⁸ N/m. The Rayleigh damping model is adopted, and the first-order modal damping ratio of podium, left tower and right tower is 0.05, and the first-order modal damping of the isolation layer of the left and right towers is 0.15.

4.1. Optimization of Performance Parameters Single-DOF System

Through the equivalent of the above example, the random seismic response analysis of the equivalent single-DOF layer shear model is carried out. In the random response analysis of the structure, the Clough–Penzien spectrum is used for the random excitation spectrum model, and the relevant parameters in the literature [18] are used for the spectral model parameters. The spectral intensity factor S0 = 4.65 cm2/rad·s3, the excellent frequency and damping ratio of the foundation soil are ωg = 15.0 rad/s, ξg = 0.6, and the other parameter is ωf = 1.5 rad/s, and damping ratio ξf = 0.60. The MATLAB software was used for simulation calculation and the variation of total vibration energy with Kelvin-Voigt model performance parameters is obtained.
As shown in Figure 5, the damping coefficient C of the Kelvin-Voigt model has a great influence on the mean square error of total vibration energy. In comparison, the stiffness coefficient K has a poor sensitivity to it. Taking the minimum total vibration energy as the control target, there is a minimum control point to minimize the total vibration energy of the single-DOF layer shear model of the MTB.
Corresponding to the multi-DOF layer shear model of MTB, the total vibration energy of the structure is minimum when the optimized damping of the passive control elements is Cc = 6.7223 × 10⁶ N·s/m and the optimized stiffness is Kc = 0 N/m.

4.2. Analysis of Vibration Control of Multi-DOF System

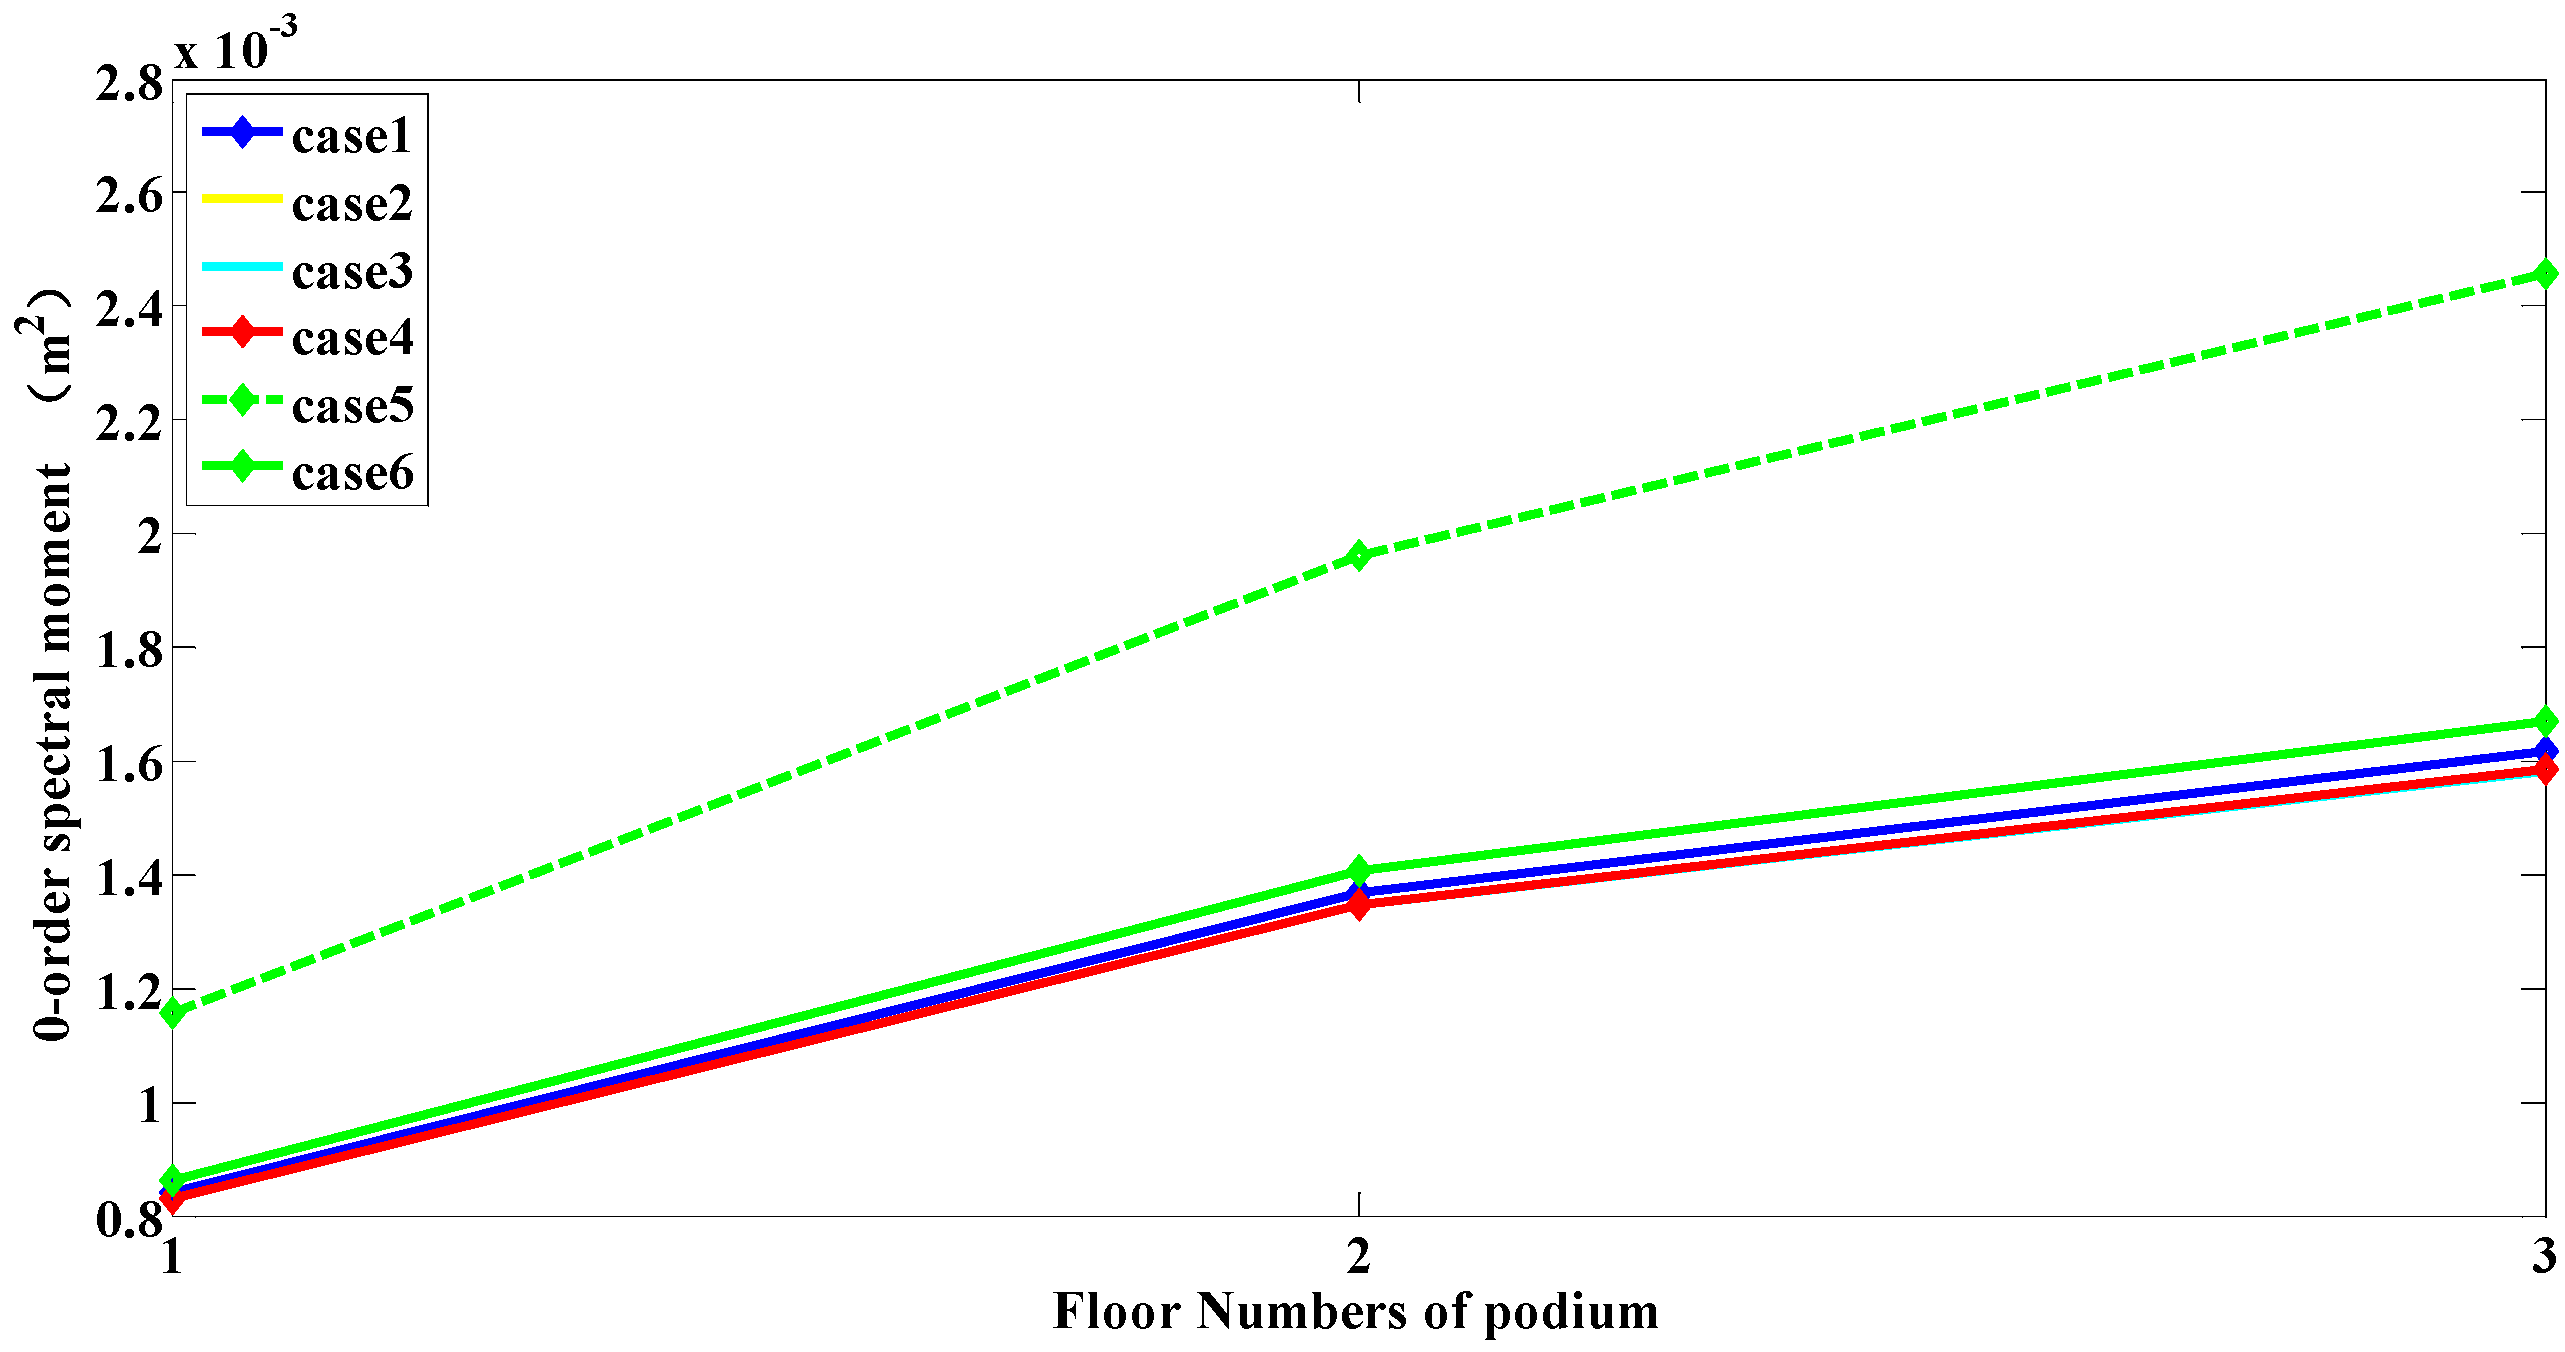
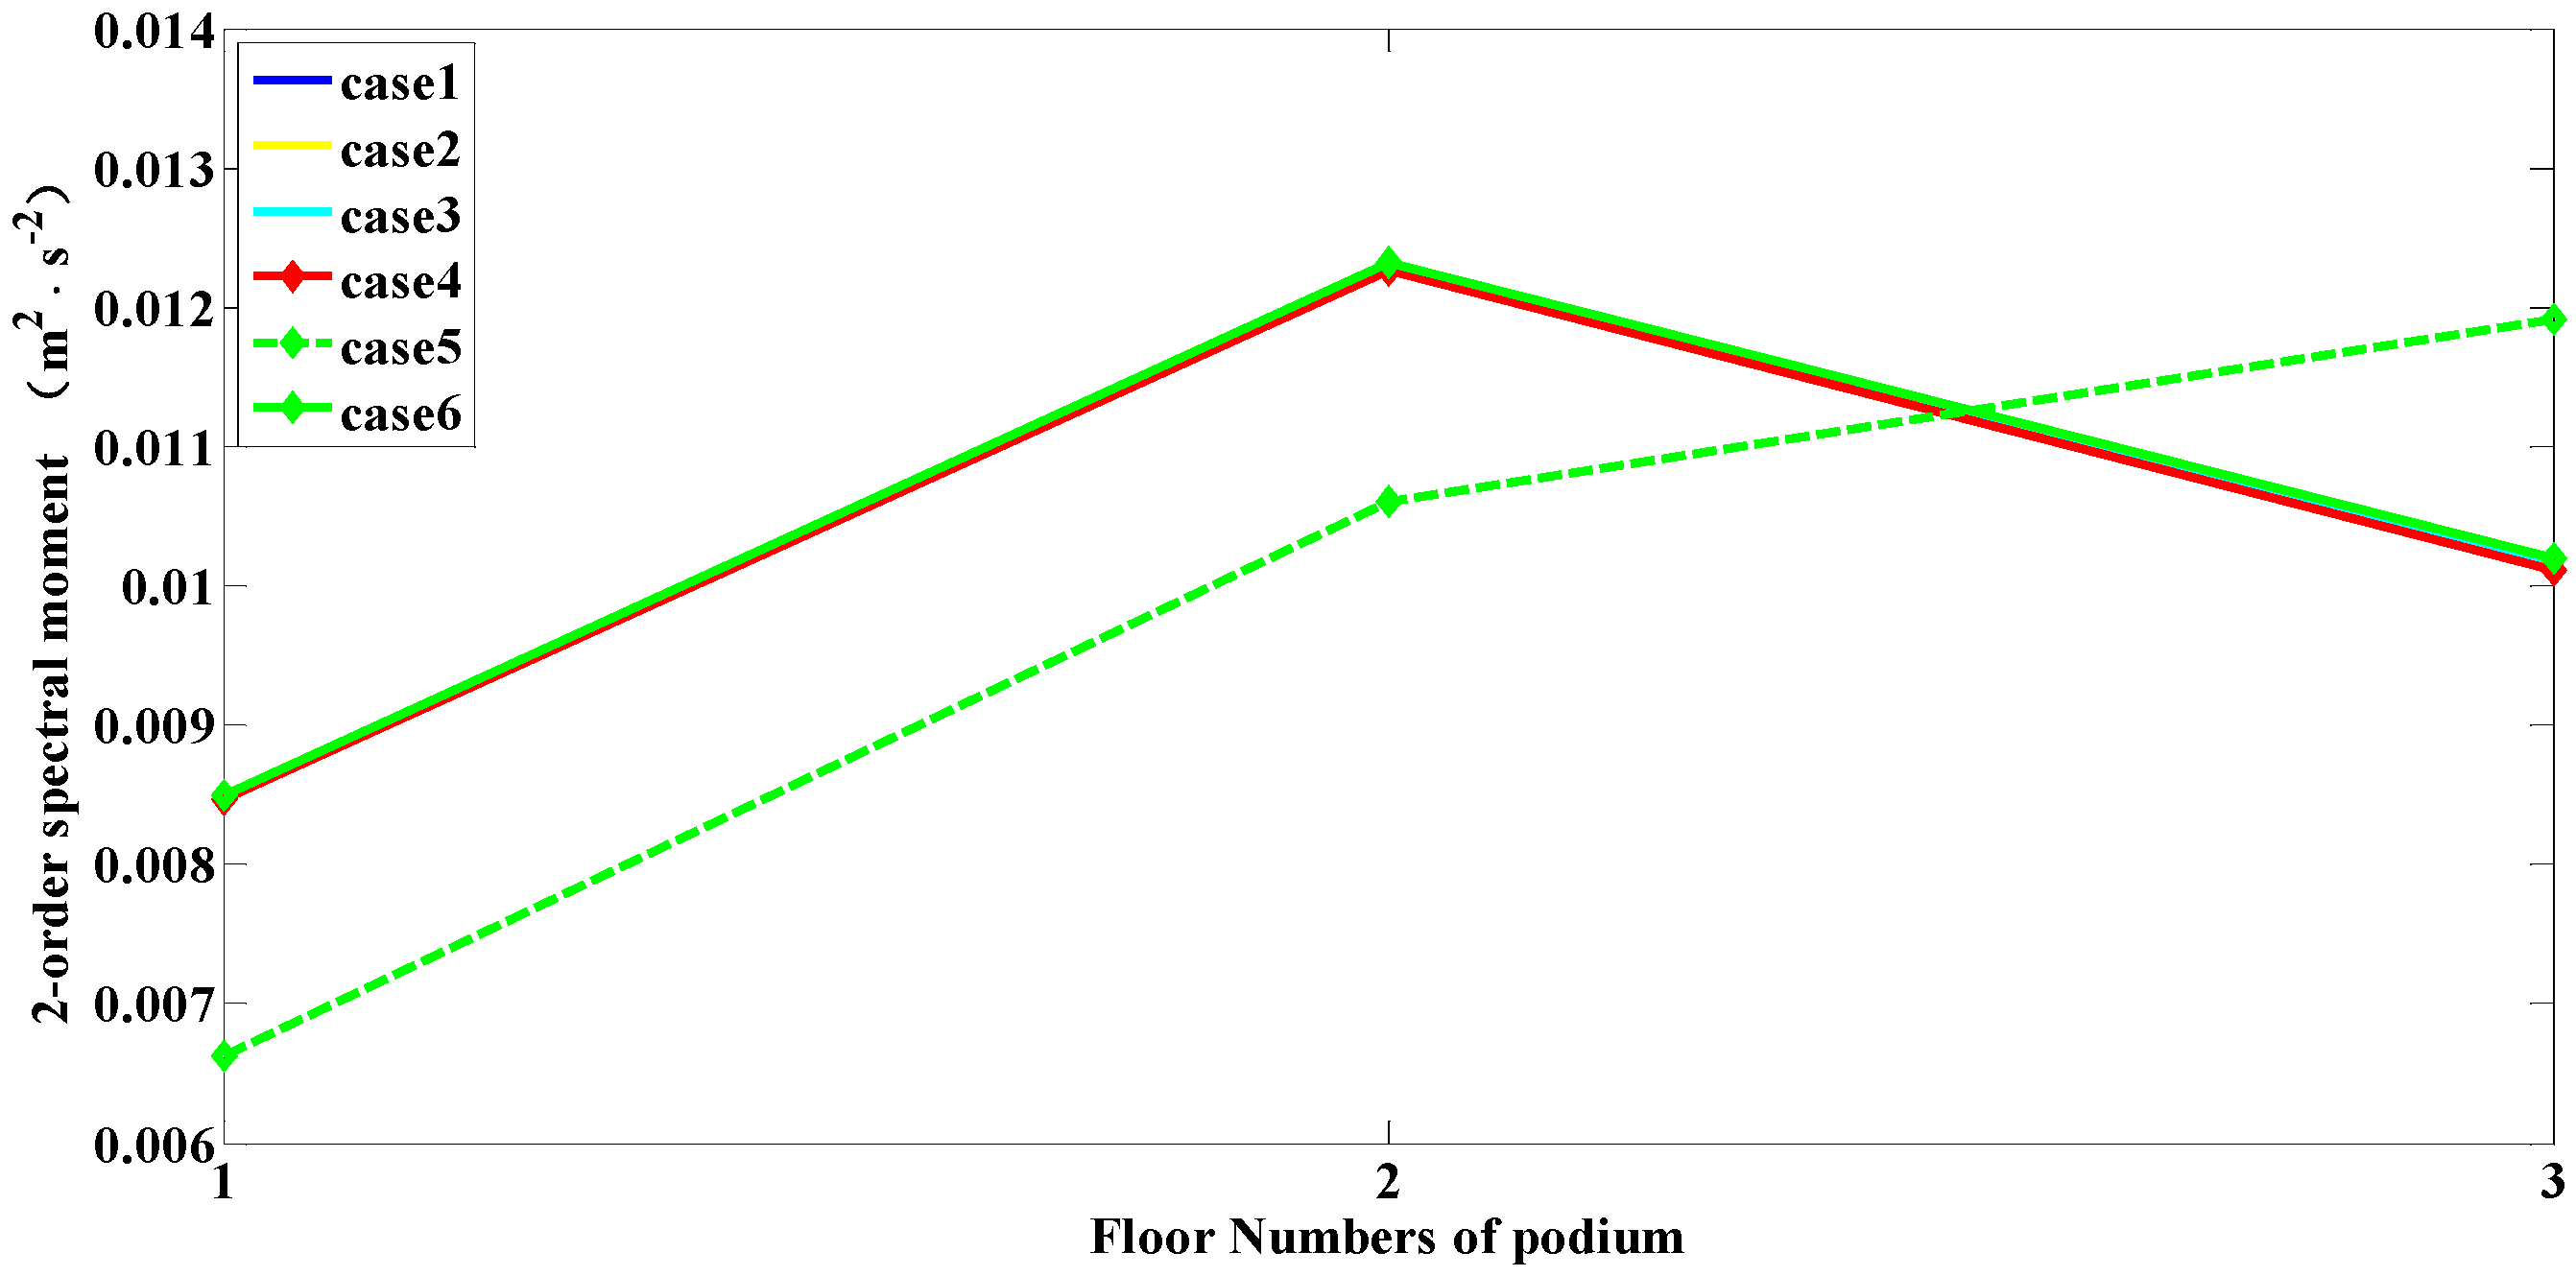
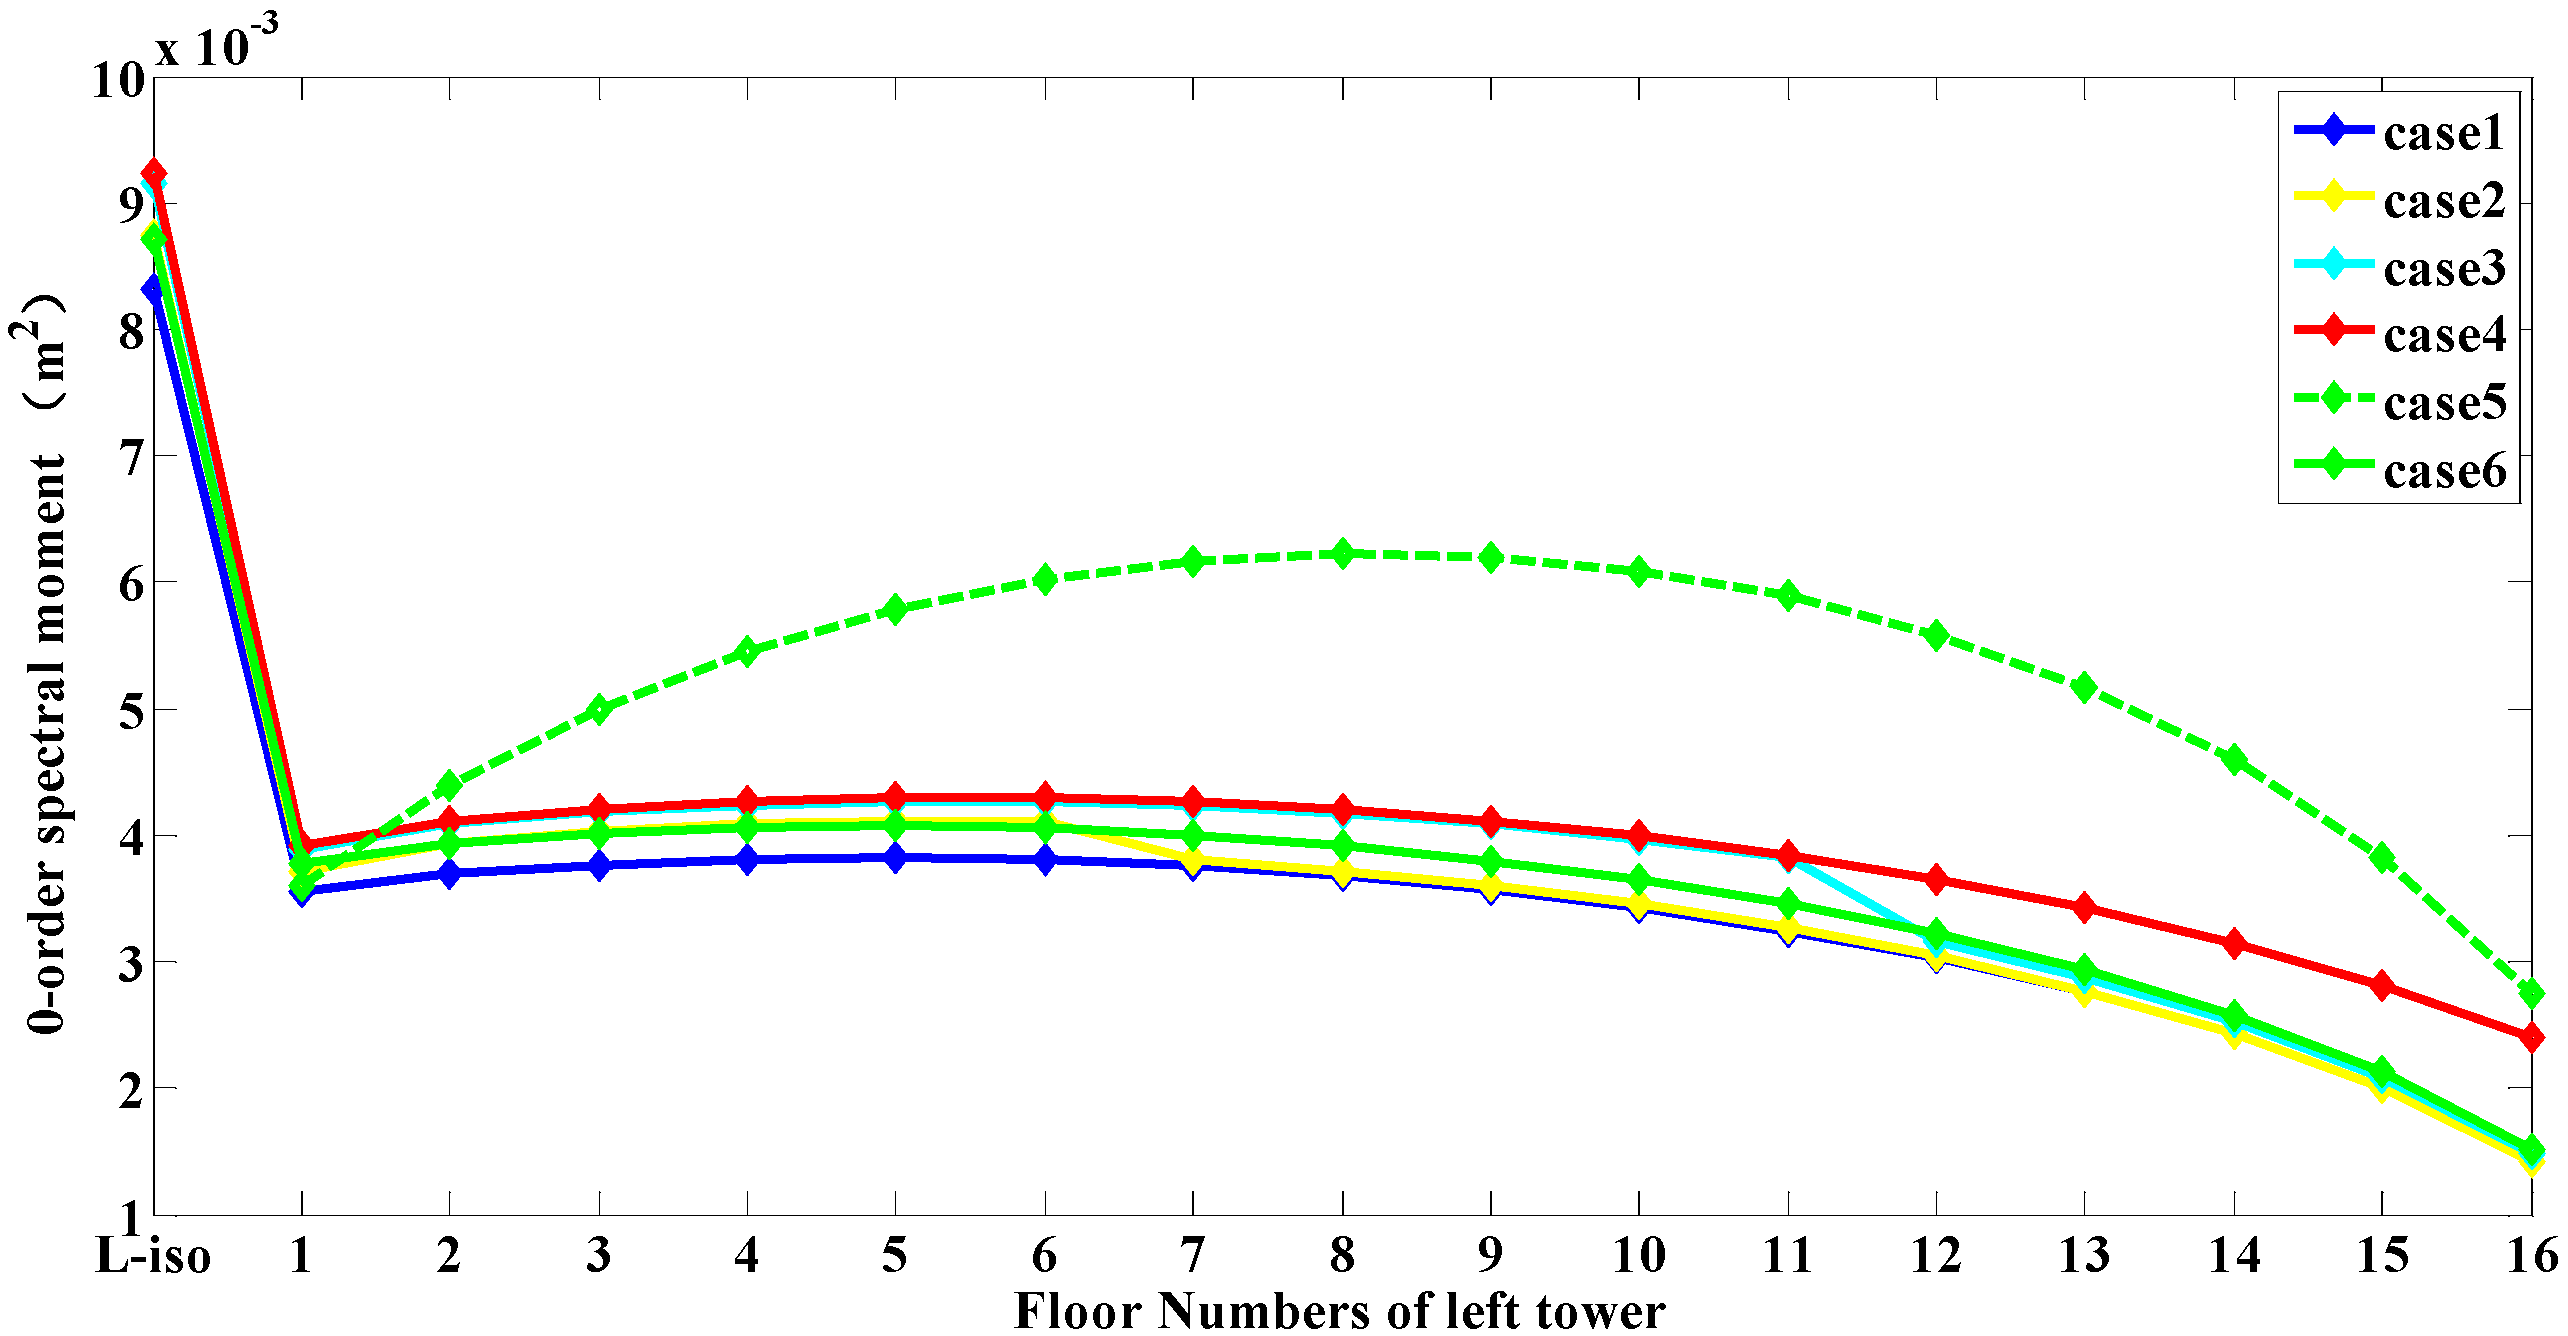
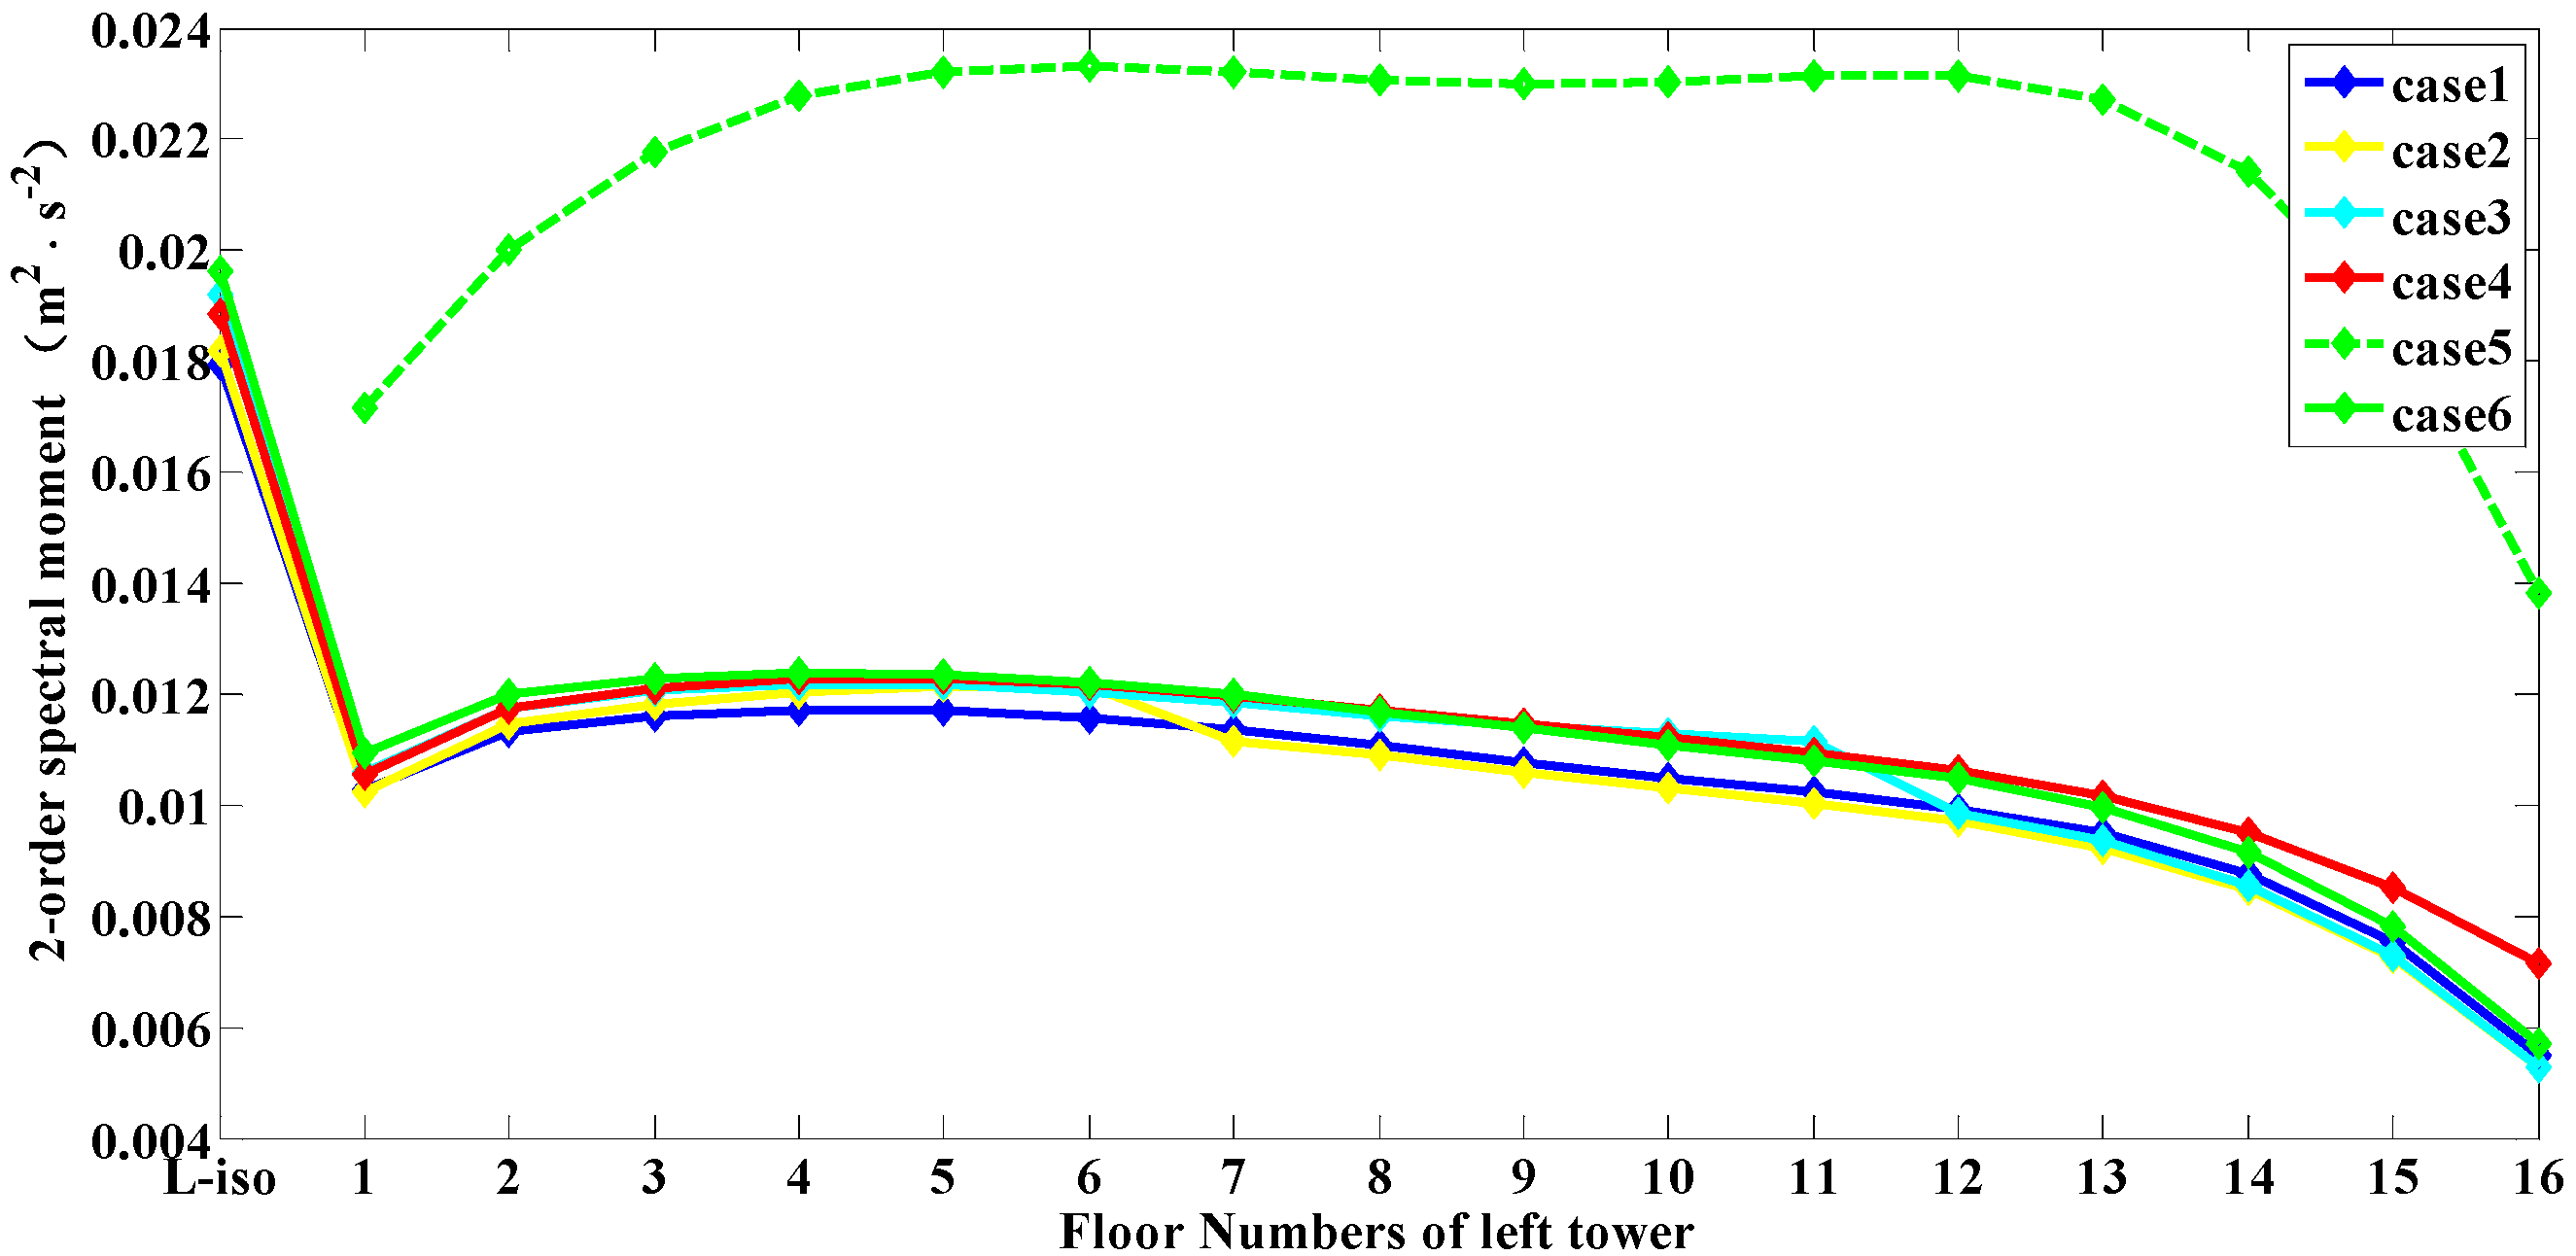
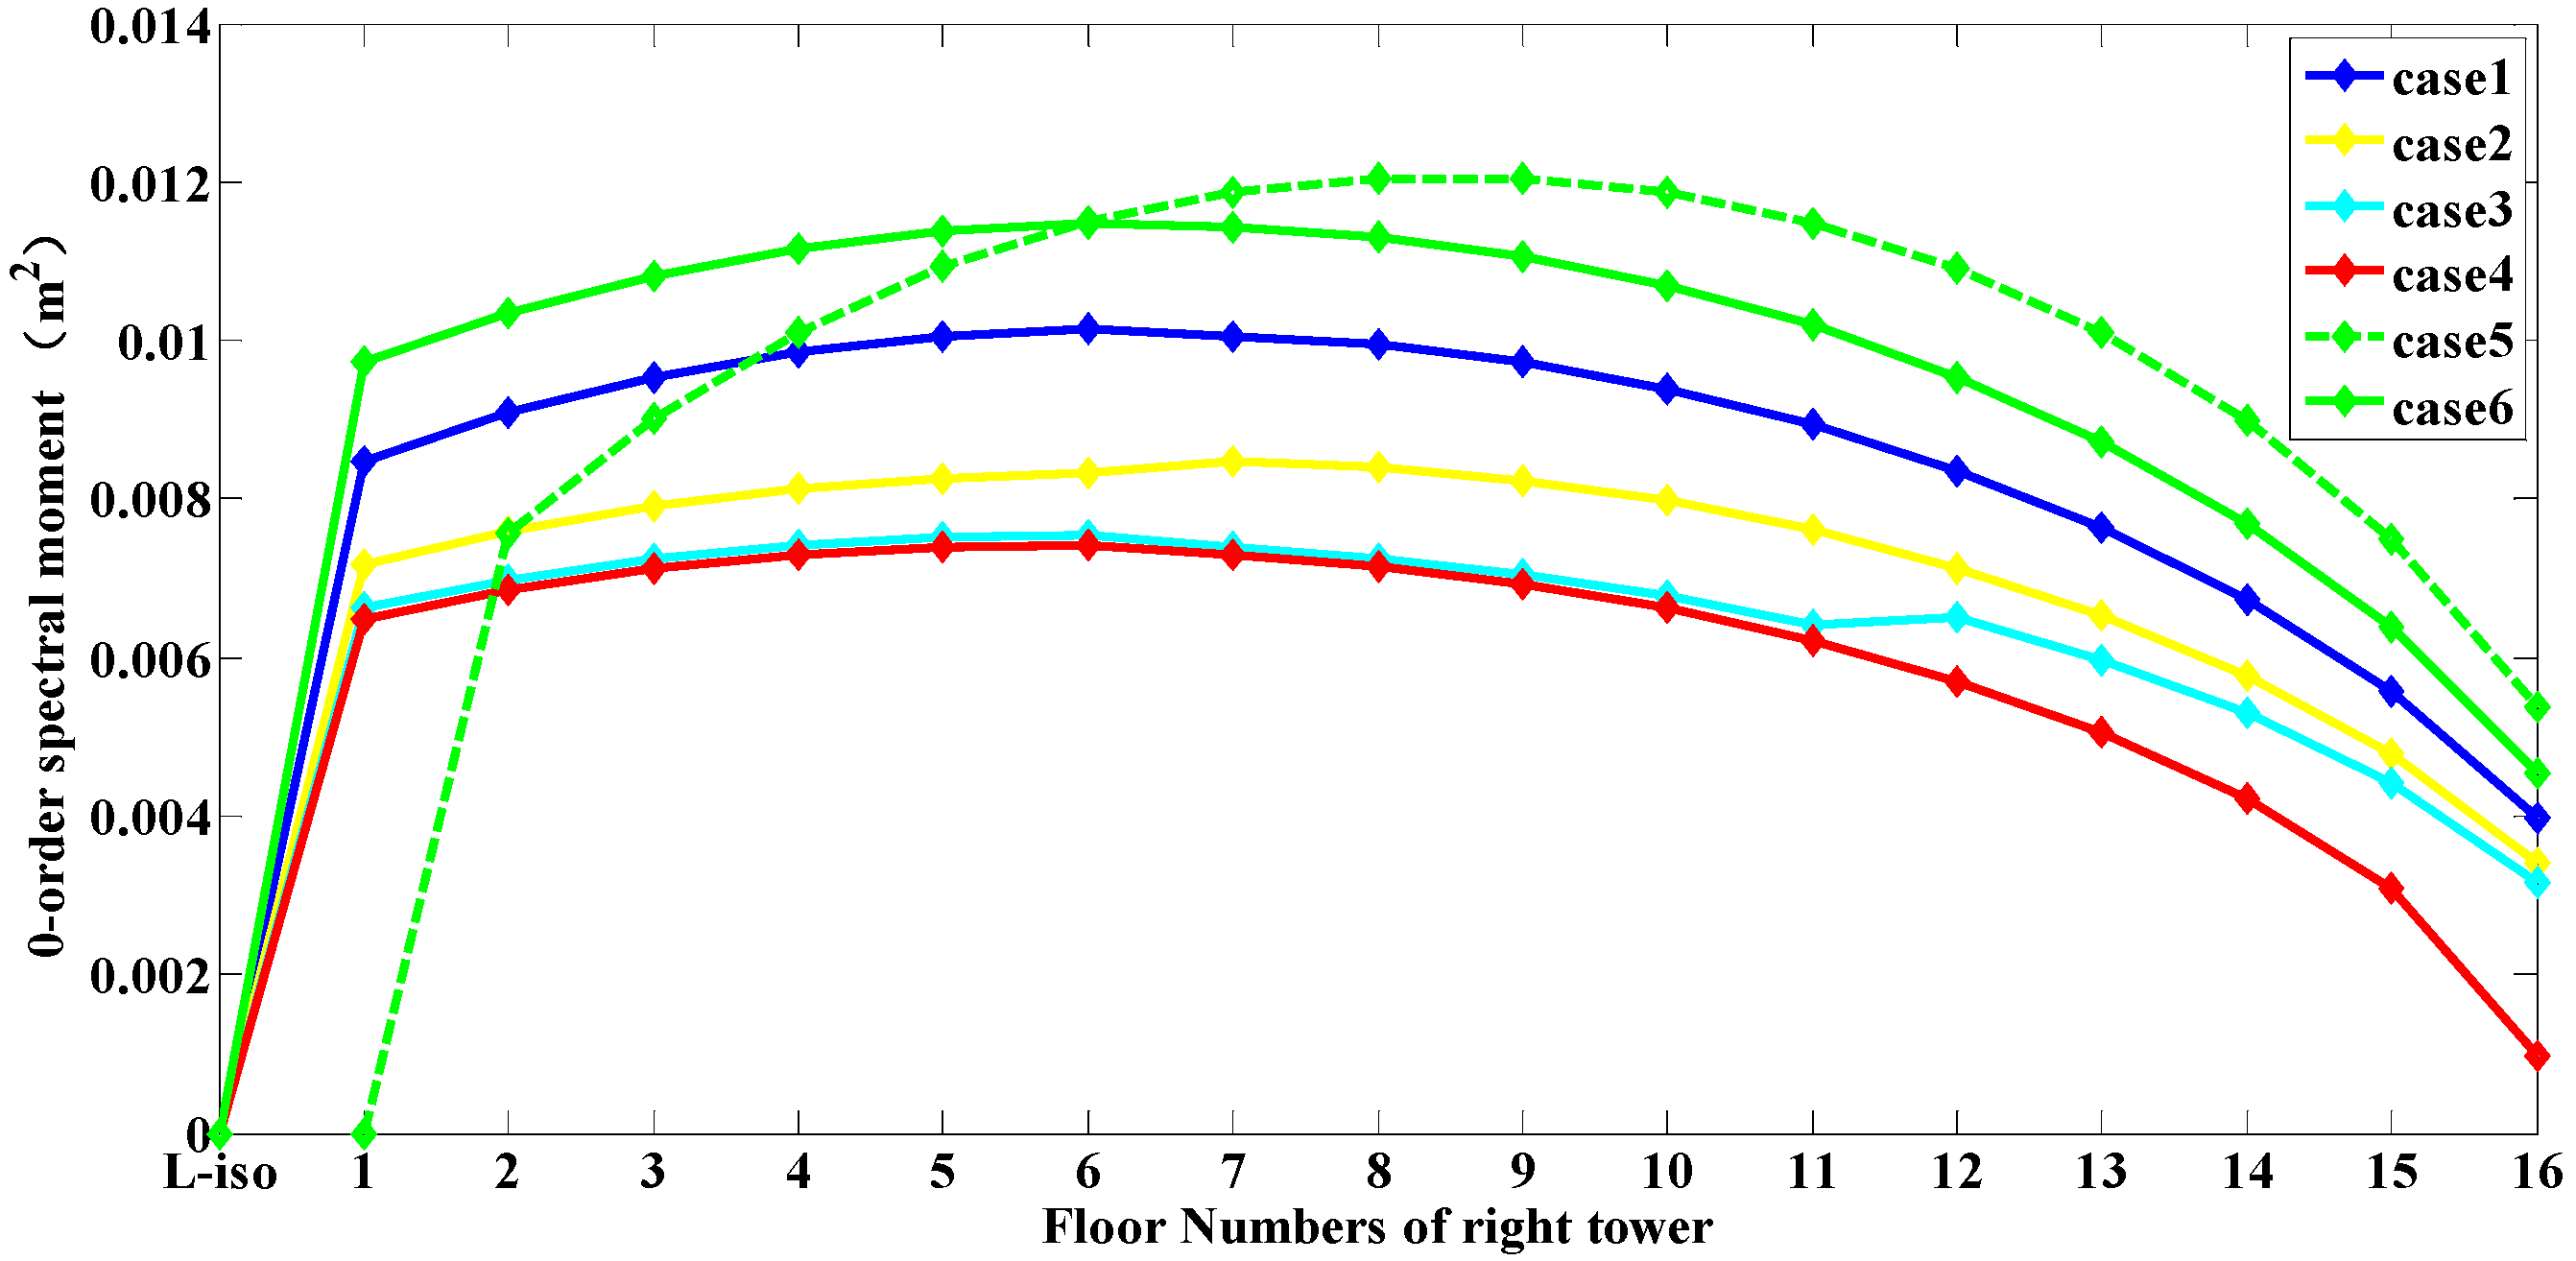
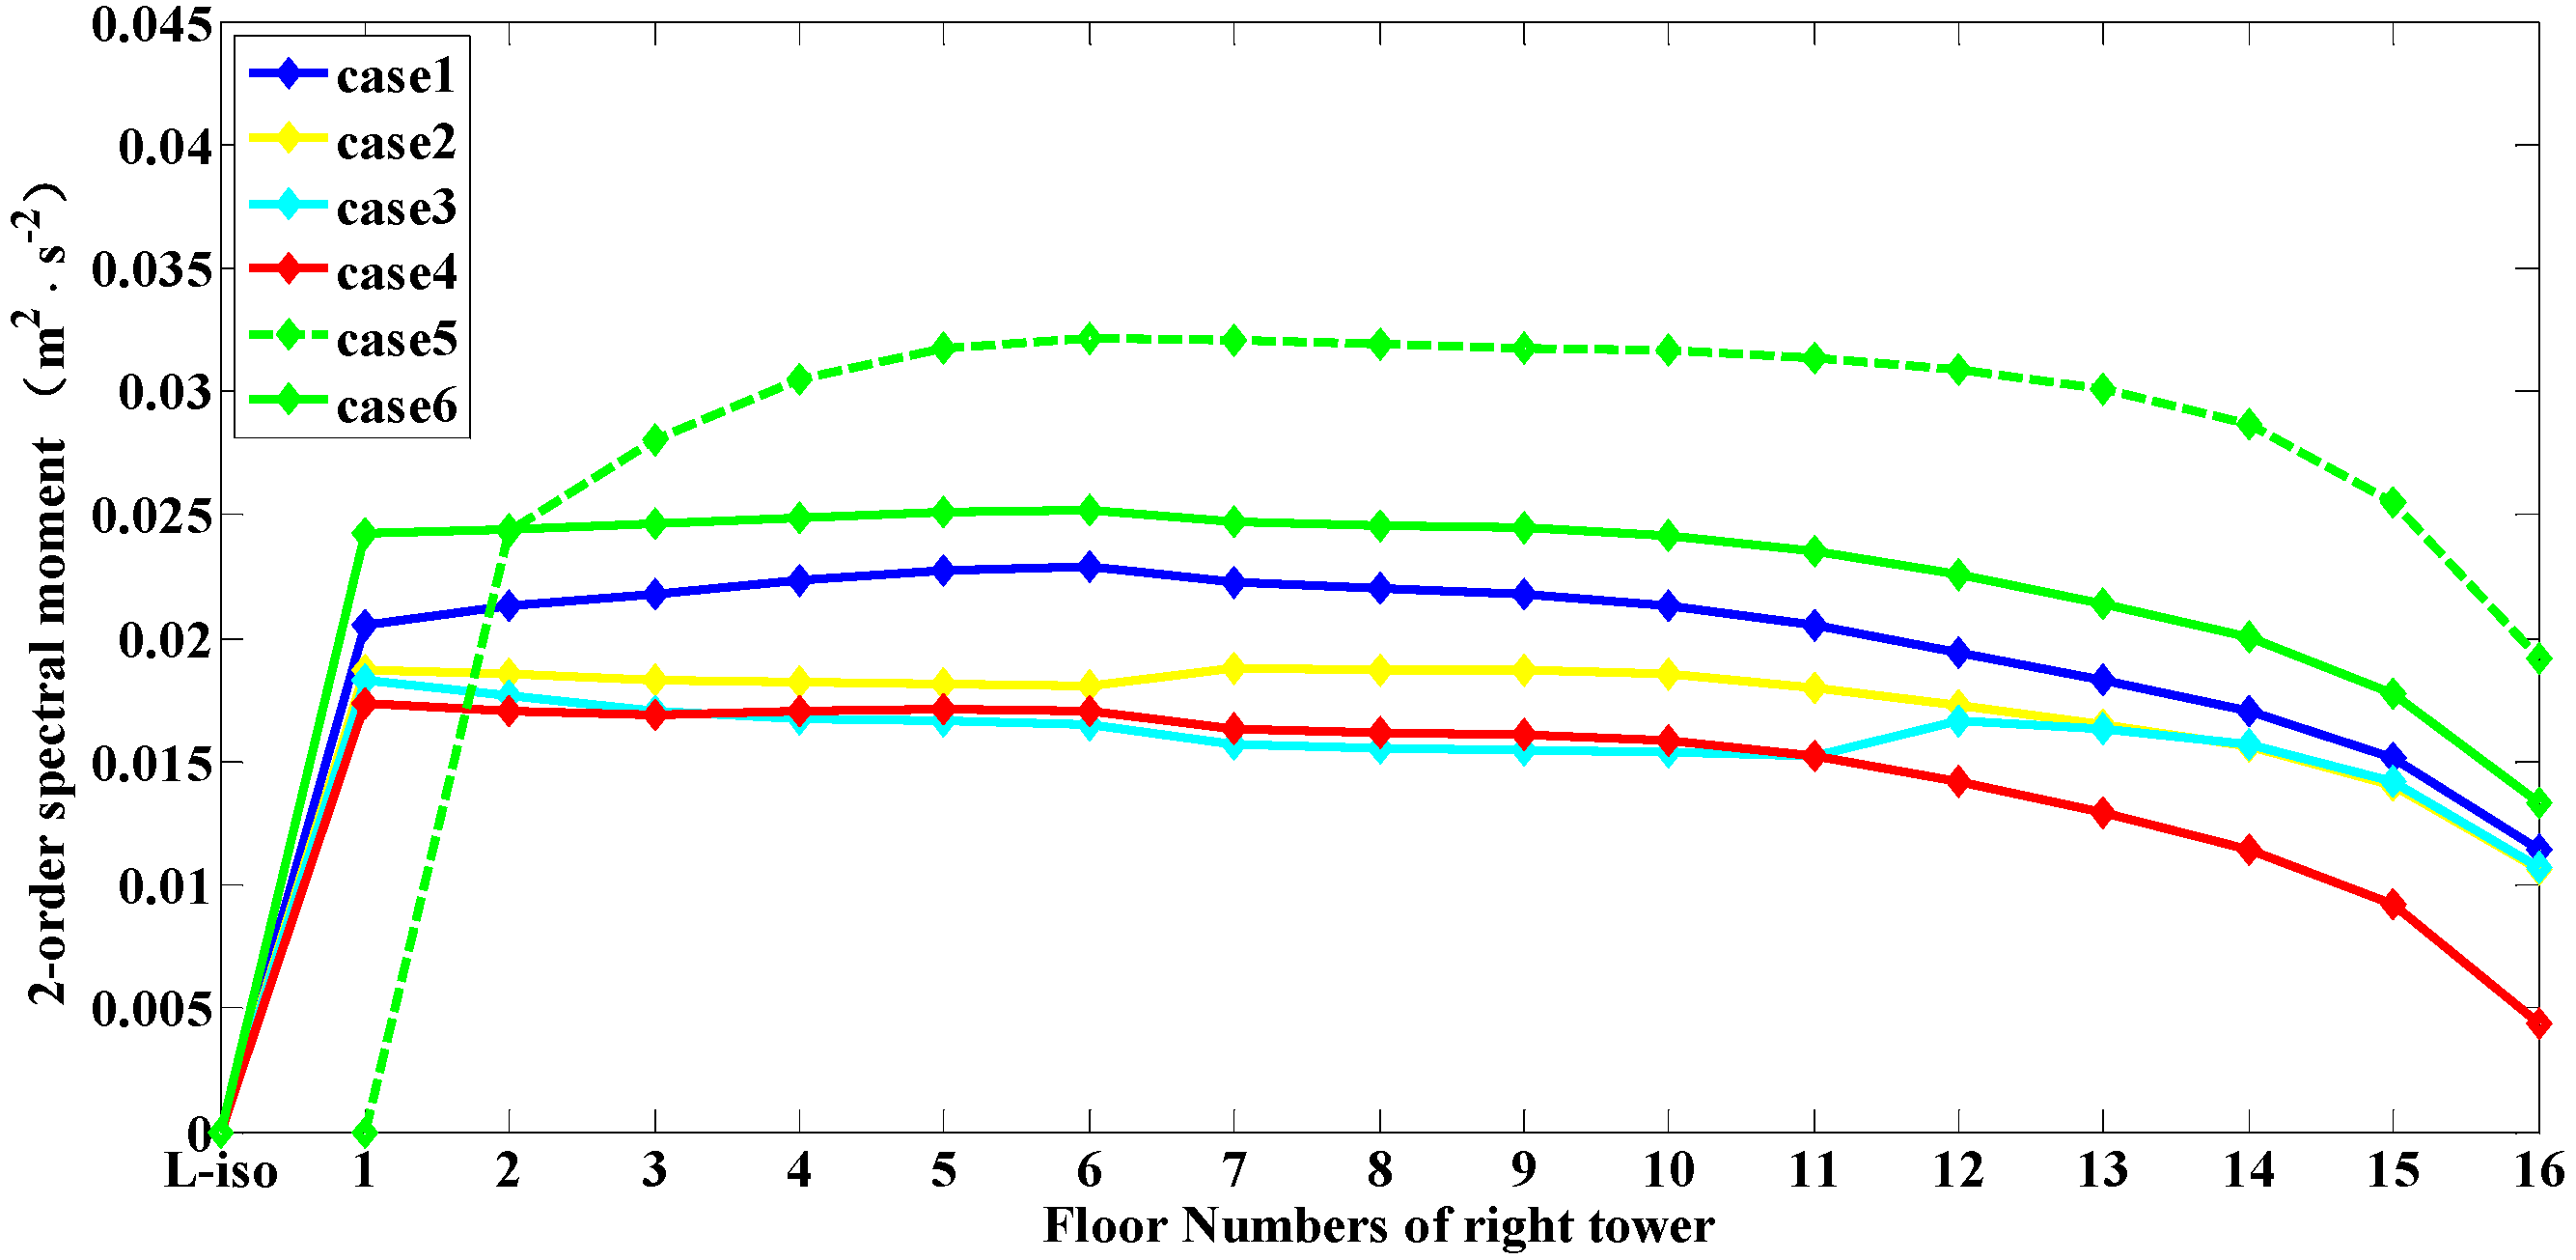
4.2.1. Effectiveness Analysis

According to the random seismic response analysis of the single-DOF layer shear model of the isolated structure, the optimal parameters that minimize the total energy of the vibration control of the structure are obtained. Assuming that the parameters of each connection control device are the optimal damping and stiffness, that is, the optimal damping Cc = 6.7223 × 10⁶ N·s/m and the optimal stiffness Kc = 0 N/m, the position of the connection control device is taken as the control parameter and the total energy of the vibration of the structure is taken as the control objective, the random seismic response analysis of the multi-DOF layer shear model of the isolated structure is carried out. The Clough–Penzien spectrum is used for random analysis.
Firstly, the model given in the first paragraph of Section 4 is regarded as model 2, which is regarded as an isolation structure. In order to study the effect of the CPC method (as shown in Figure 6, model 3) on the natural vibration characteristics and random response of the structure compared with the seismic scheme (as shown in Figure 6, model 1) and the interlayer seismic isolation scheme (as shown in Figure 6, model 2), and the effect of different damper arrangement schemes on the damping effect when the composite passive control scheme is adopted, this paper compares and analyzes the response control of the structure of the MTB under different control schemes. The control schemes are as follows:
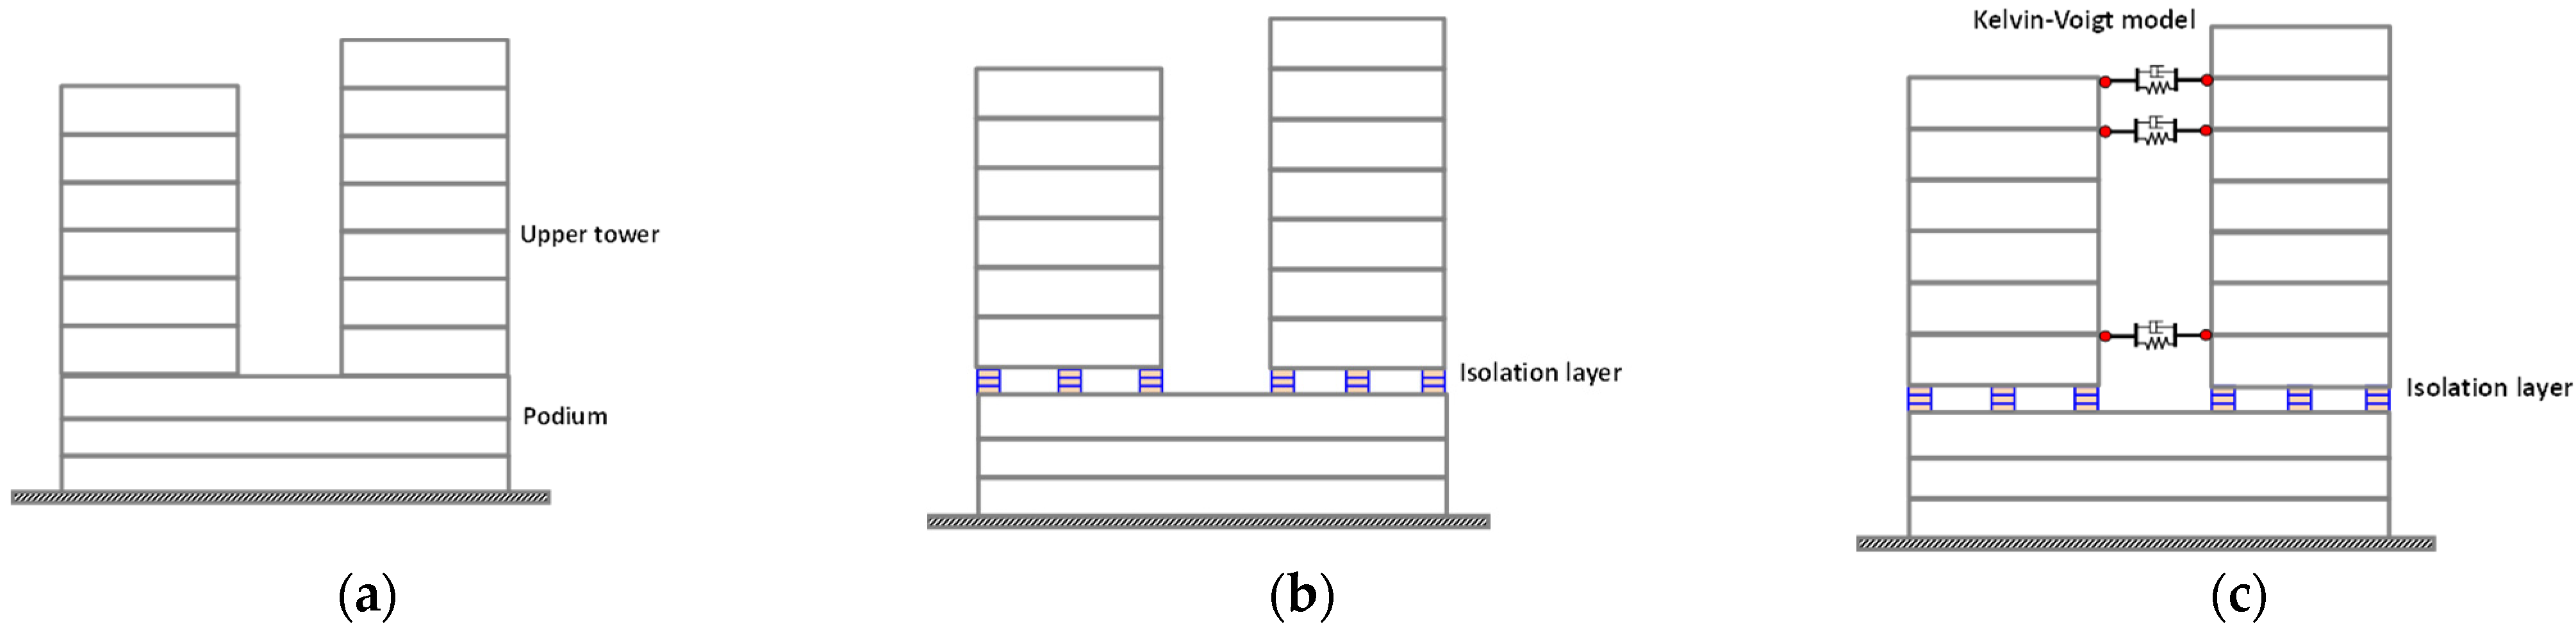
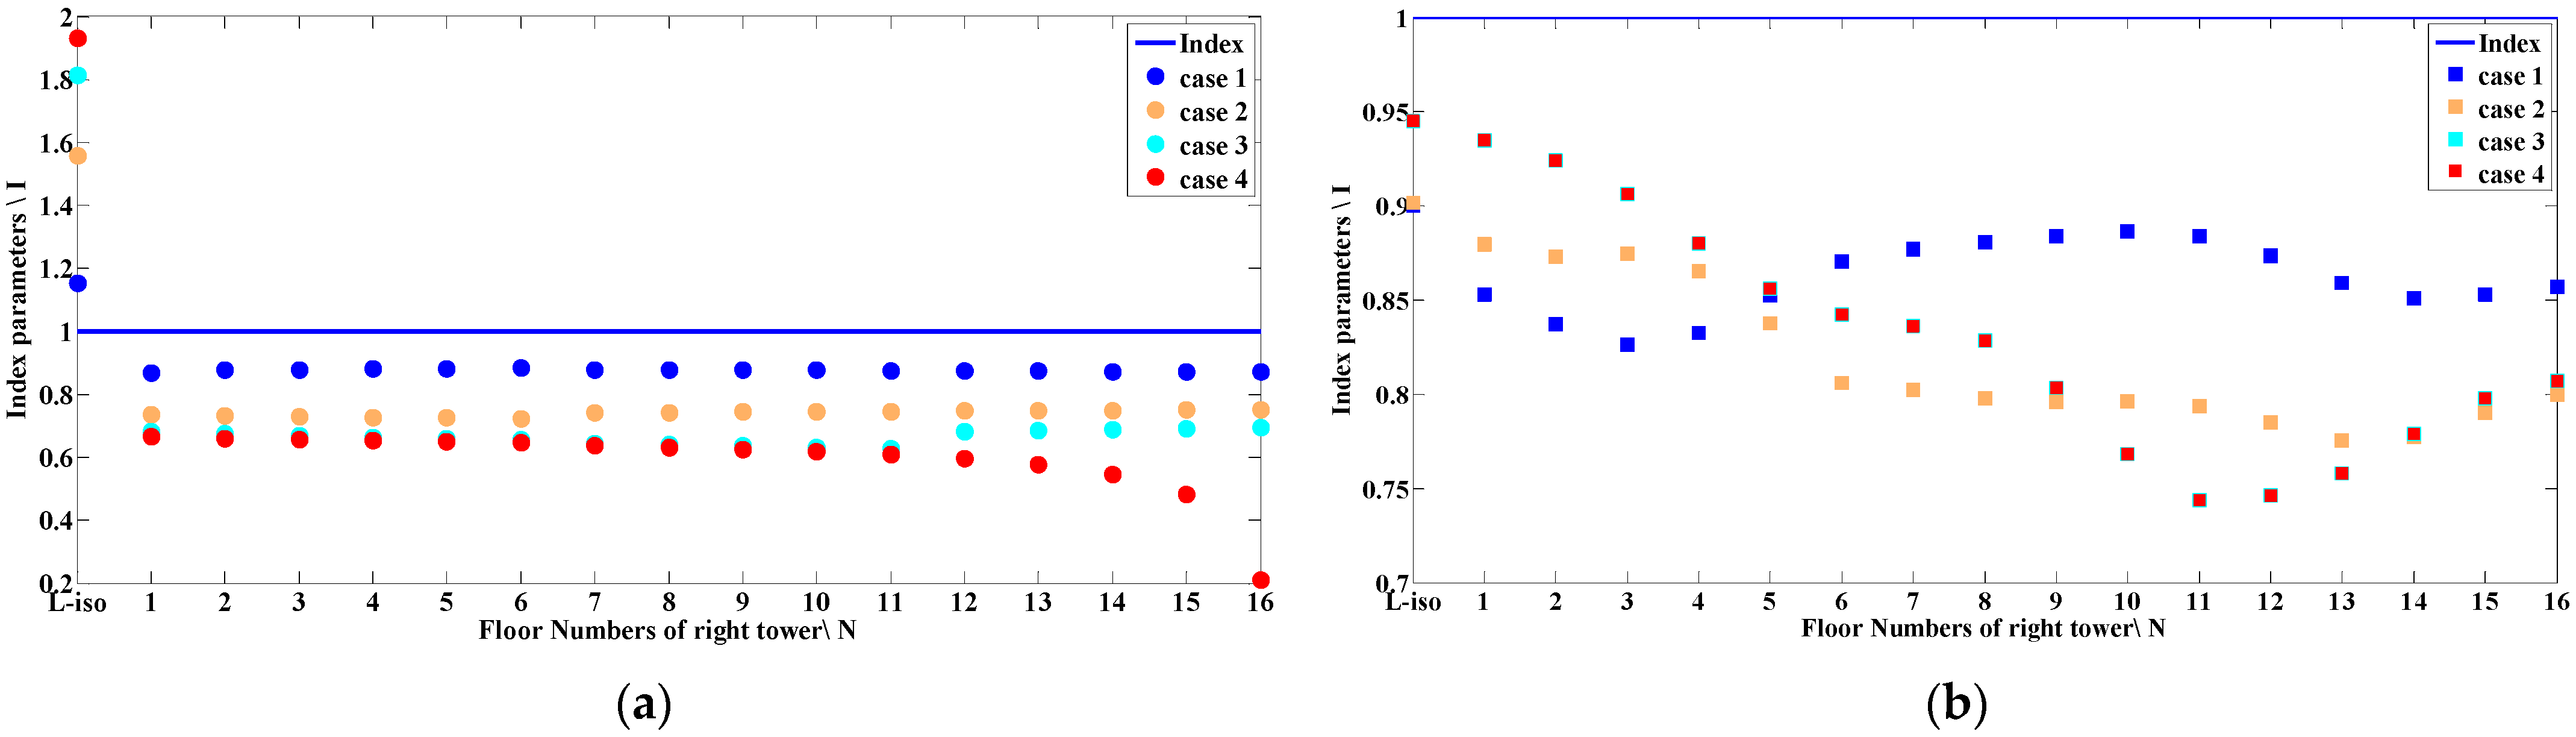
  • Case 1: The MTB adopts a CPC method. On the basis of inter-story isolation, the Kelvin-Voigt model is also used between adjacent towers, as shown in model 3 in Figure 5, and the connection control device is arranged on the first layer of the tower;
  • Case 2: The MTB adopts a CPC method. The connecting control device is arranged on the sixth layer of the tower;
  • Case 3: The MTB adopts a CPC method. The connecting control device is arranged on the 11th layer of the tower;
  • Case 4: The MTB adopts a CPC method. The connecting control device is arranged on the 16th layer of the tower;
  • Case 5: MTB adopts seismic scheme. It is similar to model 2, but it is formed as an uncontrolled structure without the interlayer seismic isolation, as shown in model 1 in Figure 5;
  • Case 6: MTB adopts isolation scheme, as shown in model 2 in Figure 5.
Figure 7 and Figure 8 show the time-varying variance of the top-level displacement and the absolute acceleration of MTB under six different control schemes. It can be concluded that compared with the seismic scheme, the isolation scheme will reduce the top-level absolute acceleration response of the structure, but the top-level displacement acceleration response is slightly enlarged. However, after adopting the CPC method, no matter which layer the passive control device is arranged on, the top-level displacement response and the top-level absolute acceleration response of the structure are reduced, and the closer the damper is arranged to the top-level, the better the control effect on the structural response.
In order to verify the damping effect of the CPC method, the zero- (corresponding to the displacement response of the structure) and second- (corresponding to the velocity response of the structure) order spectral moments of each substructure displacement under six control schemes are compared and analyzed. It can be seen from Figure 9 and Figure 10 that for the podium, the control effect of the CPC method is not significantly different from that of the isolation scheme. Compared with the seismic scheme, the control effect of the isolation scheme or the CPC method on the displacement of each layer of the podium is obvious, but the velocity of the first layer and the second layer is slightly enlarged.
It can be seen from Figure 11 and Figure 12 (where L-iso represents the isolation layer) that for the tower with relatively large natural frequency (left tower), compared with the seismic scheme, the isolation scheme can effectively control the displacement and velocity response of the structure. After adopting the CPC method, the control effect is more obvious, and the control effect is the best when the passive control device is arranged at the bottom of the structure (i.e., the first layer of the tower) closest to the isolation layer.
It can be seen from Figure 13 and Figure 14 that for the tower with small natural frequency (right tower), compared with the seismic scheme, the isolation scheme can effectively control the displacement and velocity response of the structure. After the CPC method is adopted, the control effect is more obvious, and no matter how the passive control device is arranged on any layer, the total energy of structural vibration can be effectively reduced. The energy reduction of the layer and the layer below the passive control device is more obvious. In other words, when the passive control device is arranged on the top of the structure (i.e., the 16th layer of the tower), the control effect is the best.

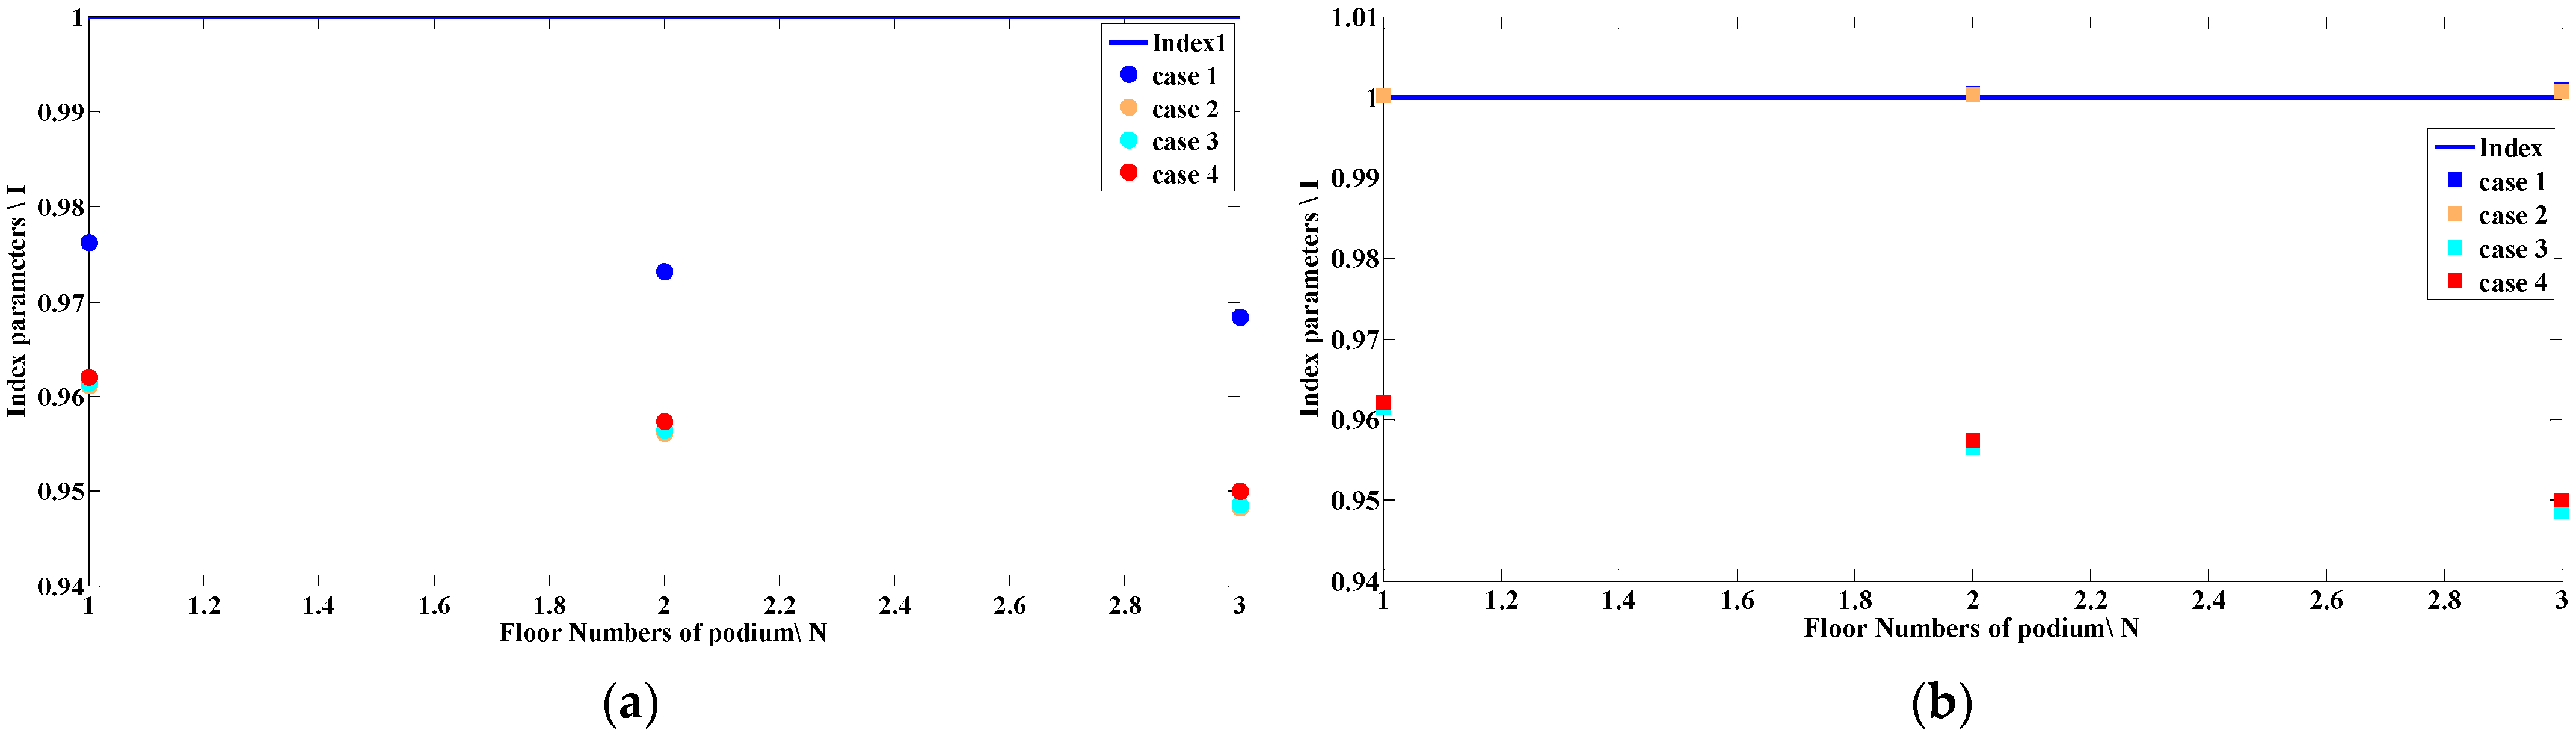
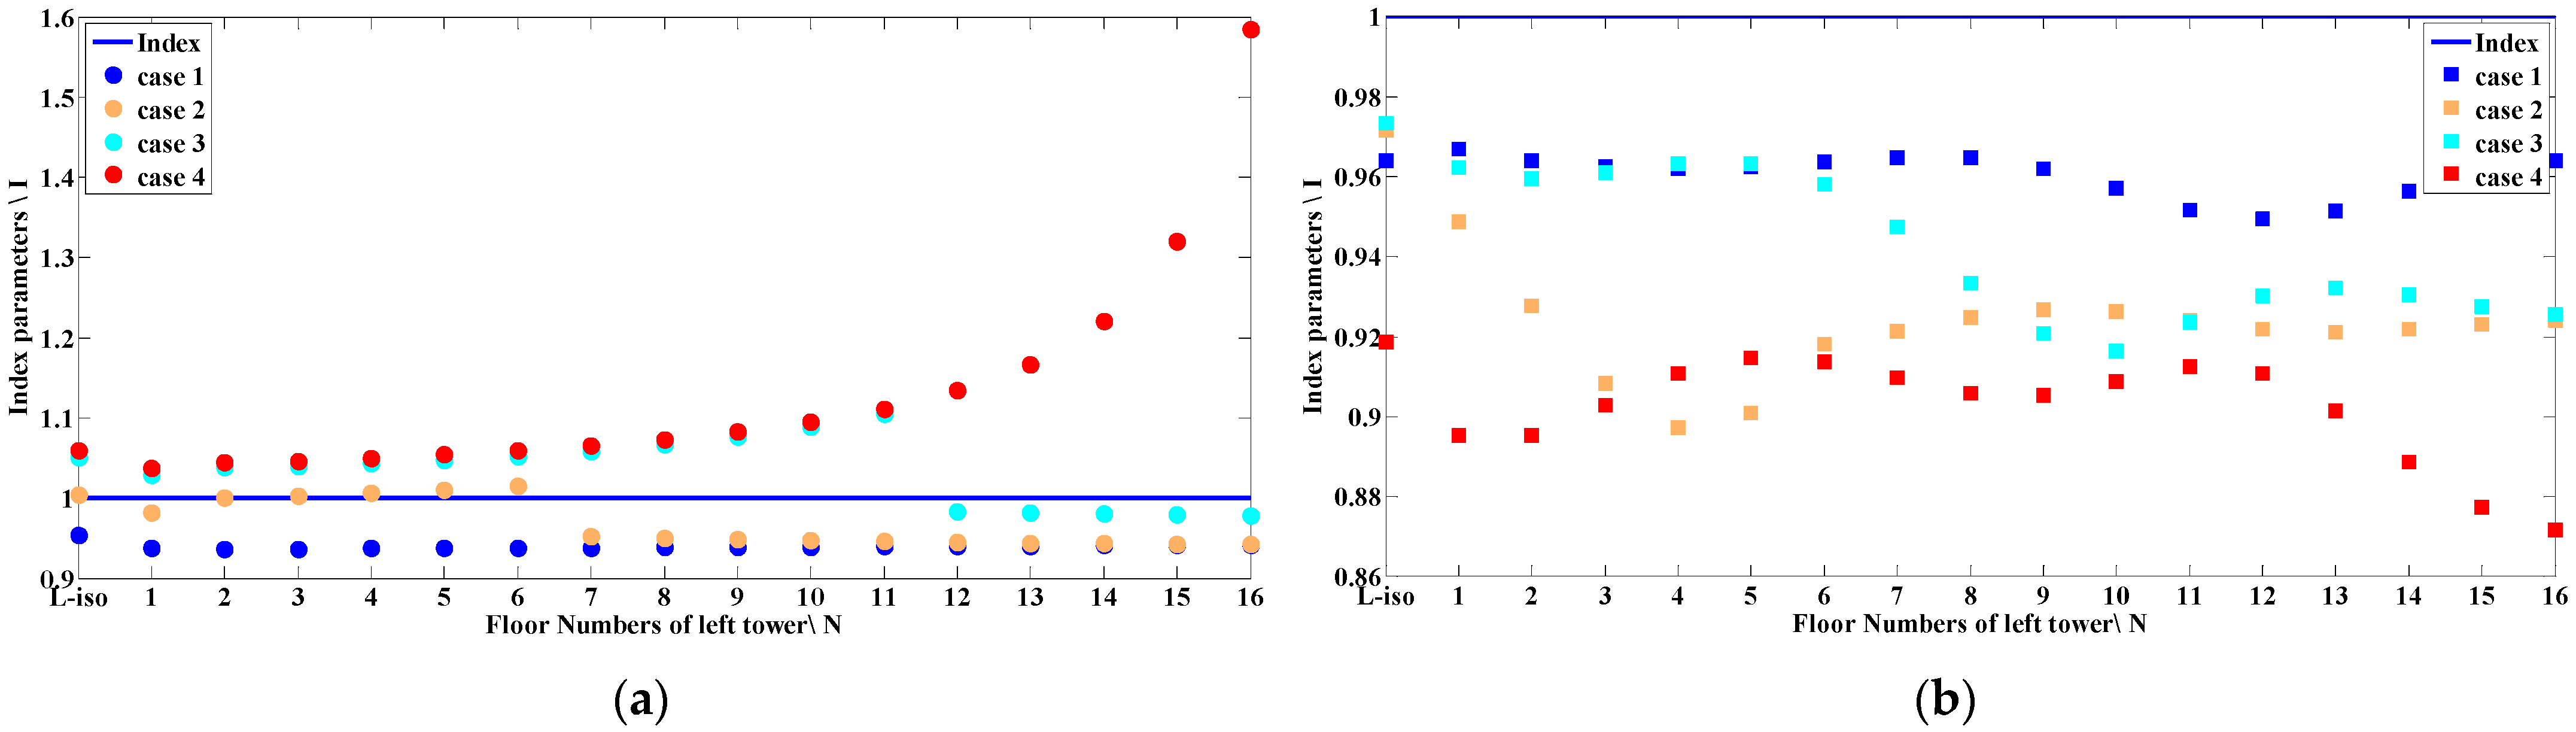
4.2.2. Layout Optimization of Multi-DOF System

In order to further analyze and compare the seismic response control of each substructure of MTB under different damper layout schemes under the optimal performance parameters, this paper continues to study case 1–case 4. In order to quantitatively analyze the improvement of the seismic reduction effect of the CPC method compared with the isolation scheme, the index parameters are introduced:
I u j = σ x c j 2 σ x n j 2 I u ¨ j = σ x ¨ c j 2 σ x ¨ n j 2 ( j = 1 , 2 , ,   n )
where, I u , I u ¨ represents displacement and acceleration control indexes respectively, j represents the number of structural layers, σ x n j 2 , σ x c j 2 represent the displacement mean square deviation of the j layer of the isolation structure and the ‘isolation + shock absorption’ structure, σ x ¨ n j 2 , and σ x ¨ c j 2 represent the absolute acceleration mean square deviation of the j layer of the isolation structure and the ‘isolation + shock absorption’ structure.
Figure 15a,b show that compared with the story isolation scheme, the displacement response and acceleration response of each layer of MTB are further controlled when the CPC method is adopted, and the higher the position of the connection control device, the more obvious the control effect is for the displacement response and absolute acceleration response of the large chassis podium.
According to the analysis of Figure 16a,b, the absolute acceleration response of the left tower is effectively controlled after the CPC method is adopted. Compared with the isolation scheme, when the connection control device is installed on the top of the structure, the index parameter can reach 0.8718. However, for the displacement response of the left tower, the closer the connection control device is to the isolation layer, the better the control effect. When the connection control device rises gradually according to the floor and rises to a certain floor, only the position of the isolation layer and the floors below the isolation layer will produce the phenomenon of response amplification. This is similar to the rule obtained from Figure 11 and Figure 12.
Compared with the left tower, after the CPC method is adopted in the right tower, there is no obvious response amplification phenomenon in other layer positions except the isolation layer according to the analysis of Figure 17a,b, which is mainly related to the natural frequencies of the left tower and the right tower. After the CPC method is adopted, the absolute acceleration response of the right tower is effectively controlled as a whole. Compared with the isolation scheme, when the connecting control device is installed on the top layer of the structure, the index parameters can reach 0.7438, which shows the improvement effect of the CPC method relative to the isolation scheme. For the right tower displacement response, the closer the connection control device to the top level, the better the control effect, and when the connection control device is installed at the top level, the top level index parameter can reach 0.2111.
Based on the above analysis, it can be concluded that the relative displacement and relative velocity at the location of the isolation layer are larger after using the story isolation scheme, and the connection control device uses the interaction between adjacent towers to reduce the structural response under seismic action. After installing the connection control device, the installation layer and the lower layer of the connection control device form a parallel system from two independent towers. The flexible tower has good restraint and can control the structural response well but, relatively speaking, the restraint effect for the rigid tower is not good, and even the response amplification phenomenon may occur. However, as far as the structure is concerned as a whole, the minimum total vibration energy of MTB is taken as the control objective. In order to analyze the improvement of the damping effect of MTB quantitatively by using the CPC method compared with the isolation scheme, the performance index θ is introduced.
θ = σ E n 2 σ E c 2 σ E n 2
where, σEn and σEc represent the vibration energy variance of the isolation structure and the ‘isolation + shock absorption’ structure respectively.
MATLAB numerical simulation is used to calculate the damping effect of MTB under the above four different layout schemes. The damping effects of cases 1 to 4 are 69.63%, 81.32%, 84.26% and 84.64%, respectively. Other than that, MATLAB software is used to simulate and verify the installation of control devices on each layer. When the connecting control device is arranged on the top of the tower, the control effect is the best, and the damping effect will decrease with the decrease of the number of connecting control devices. This is consistent with the rule shown in Figure 18.
There is more energy distribution in the middle of the tower, and less energy distribution in the top of the large chassis podium and the tower. The adoption of the CPC method can reduce the energy of each layer as a whole, and effectively reduce the problem of amplification of the isolation layer response caused by the isolation scheme. When the connection control device is arranged on the top of the tower, the control effect is best.
Therefore, the optimal layout scheme is obtained. That is, the optimal damping of the connecting control device is 6.7223 × 10⁶ N·s/m, the optimized stiffness is 0 N/m. The connecting control device is arranged on the 16th layer of the tower. Figure 19. shows the acceleration power spectral density of the top layer of the corresponding anti-seismic structure, isolation structure and ‘isolation + shock absorption’ structure with the Clough–Penzien spectrum as input. Compared with the anti-seismic structure, the isolation structure and the ‘isolation + shock absorption’ structure show obvious damping effect. At the same time, compared with the isolation structure, the ‘isolation + shock absorption’ structure has a better damping effect at the first, second and third frequencies of the structure, but the overall amplitude fluctuates less with the frequency, indicating that the connection control device has little effect on the dynamic characteristics of the structure. Figure 20 shows the base shear power spectral density of the structure, which is similar to the top acceleration power spectral density. The damping device has little influence on the natural vibration period of the structure before and after control, and has good stability.
Through the above analysis, if the minimum total vibration energy of the structure is taken as the optimization objective and the optimal parameters are obtained, the ‘isolation + shock absorption’ control system can not only maintain the good control performance of the isolation structure, but also have better damping effect at the first two order responses of the structure, and can ensure that the MTB has good robustness after control.

5. Conclusions

The CPC method of “interlayer seismic isolation” + “shock absorption between adjacent towers” is proposed to be applied to the MTB. Combined with the multi-DOF layer shear model and the single-DOF layer shear model of the MTB, the control effect and effectiveness of the CPC method are studied. The main conclusions are:
  • The optimized performance parameters of the connection control device calculated based on the single-DOF layer shear model of MTB are also applicable to the multi-DOF layer shear model. The structural responses calculated by single-DOF layer shear model and multi-DOF layer shear model are basically the same;
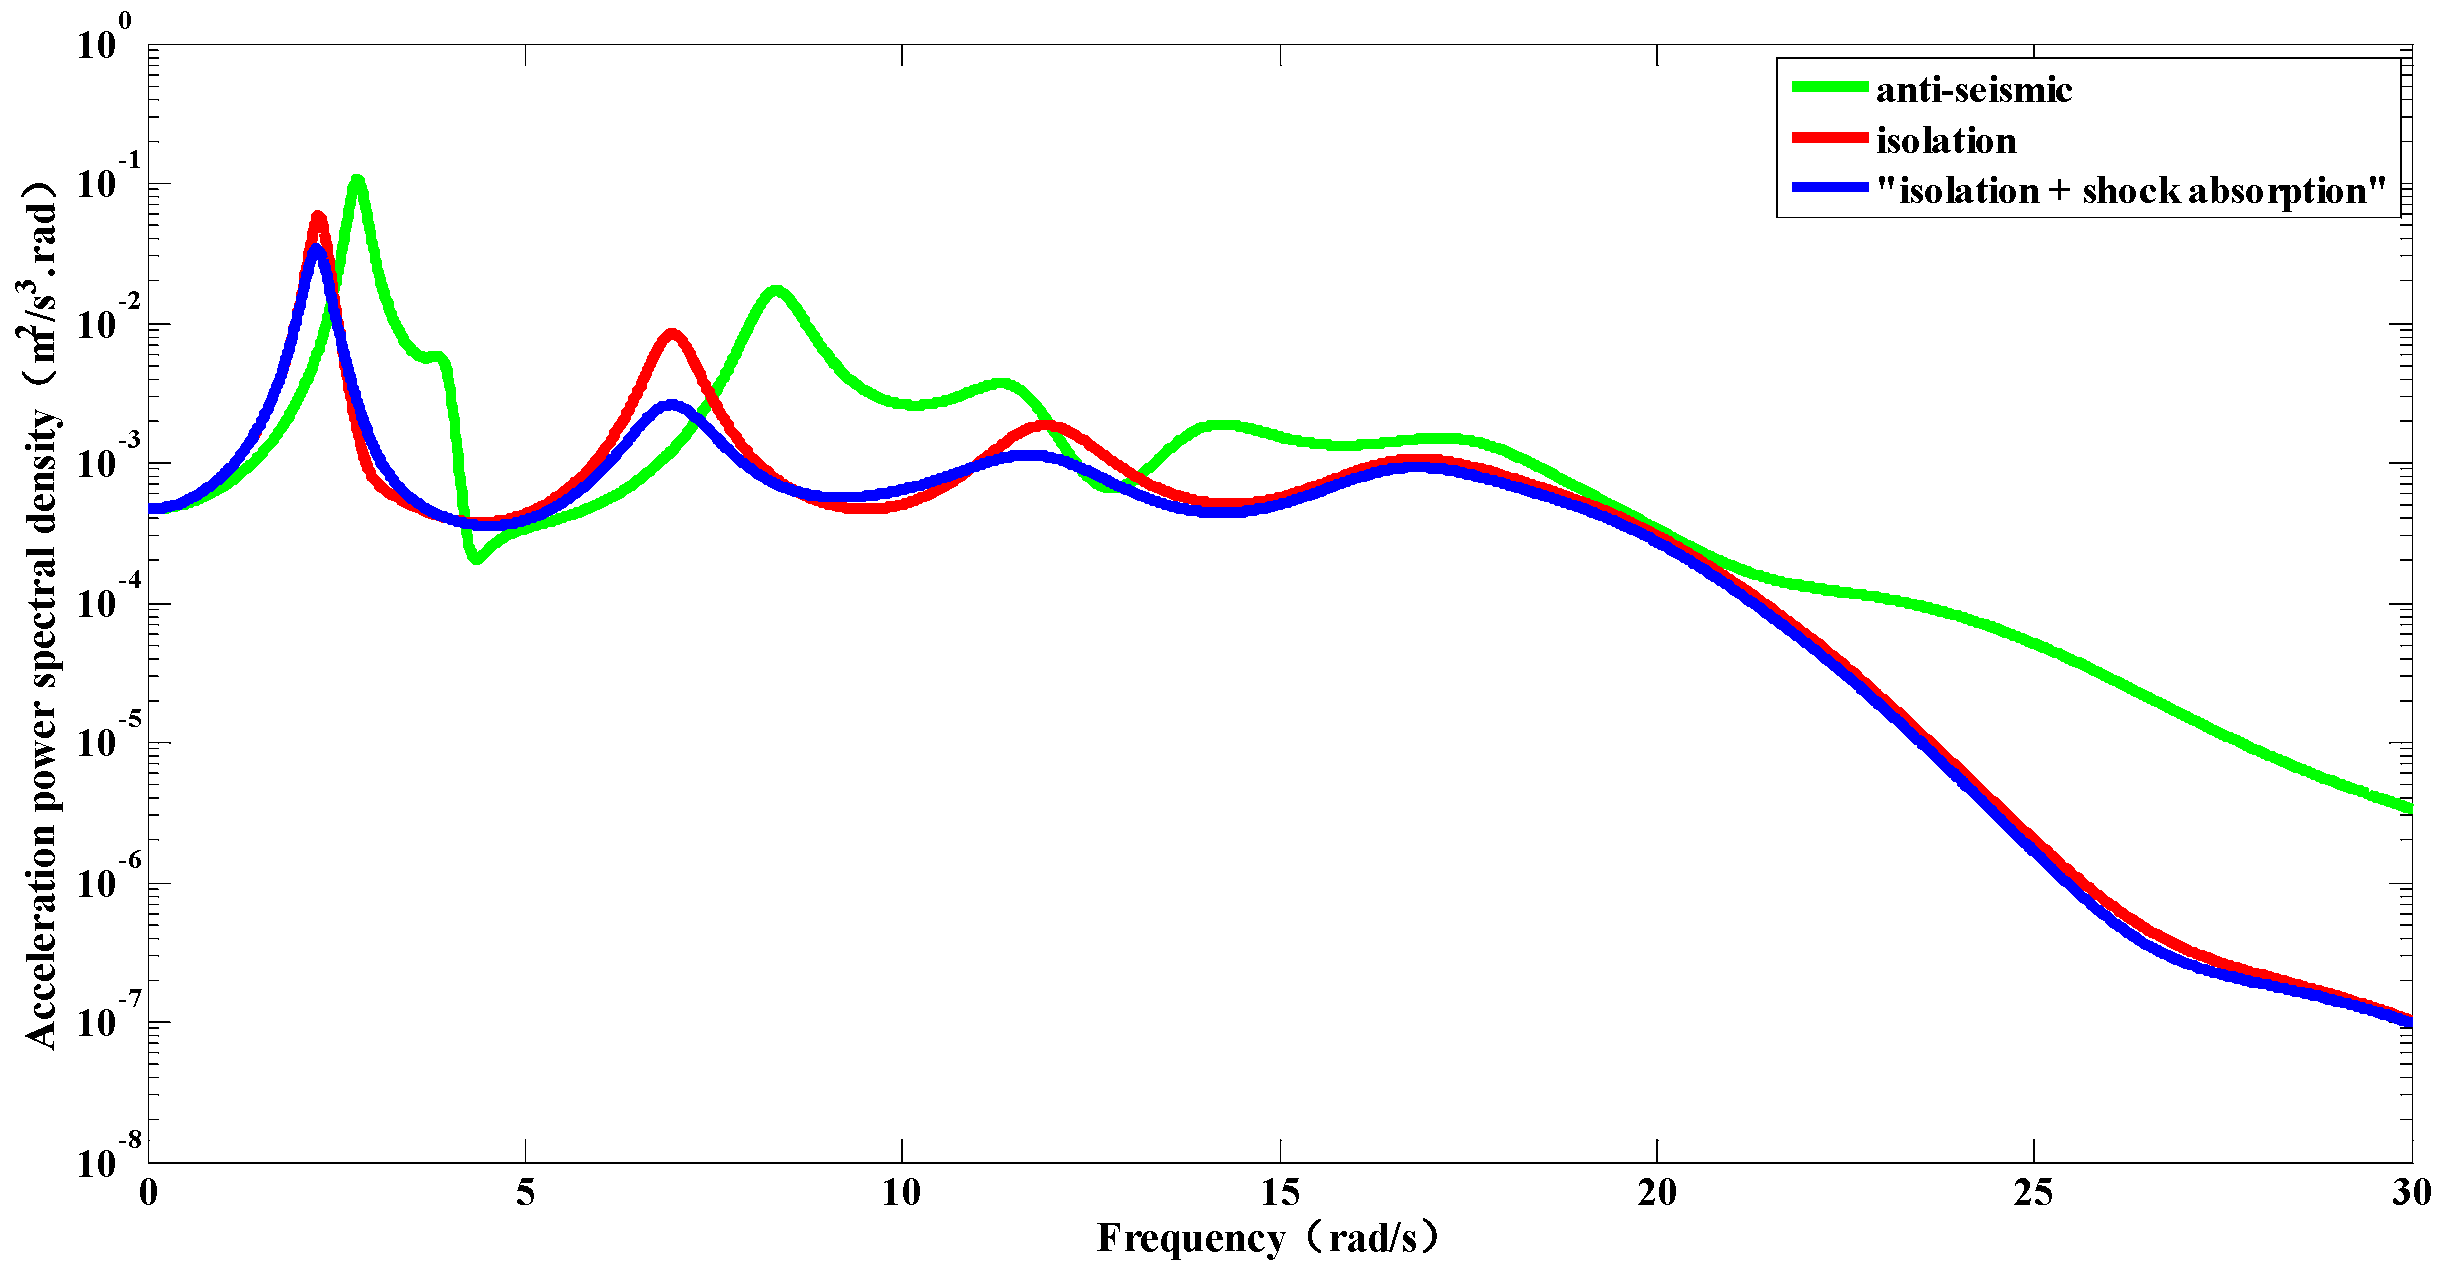
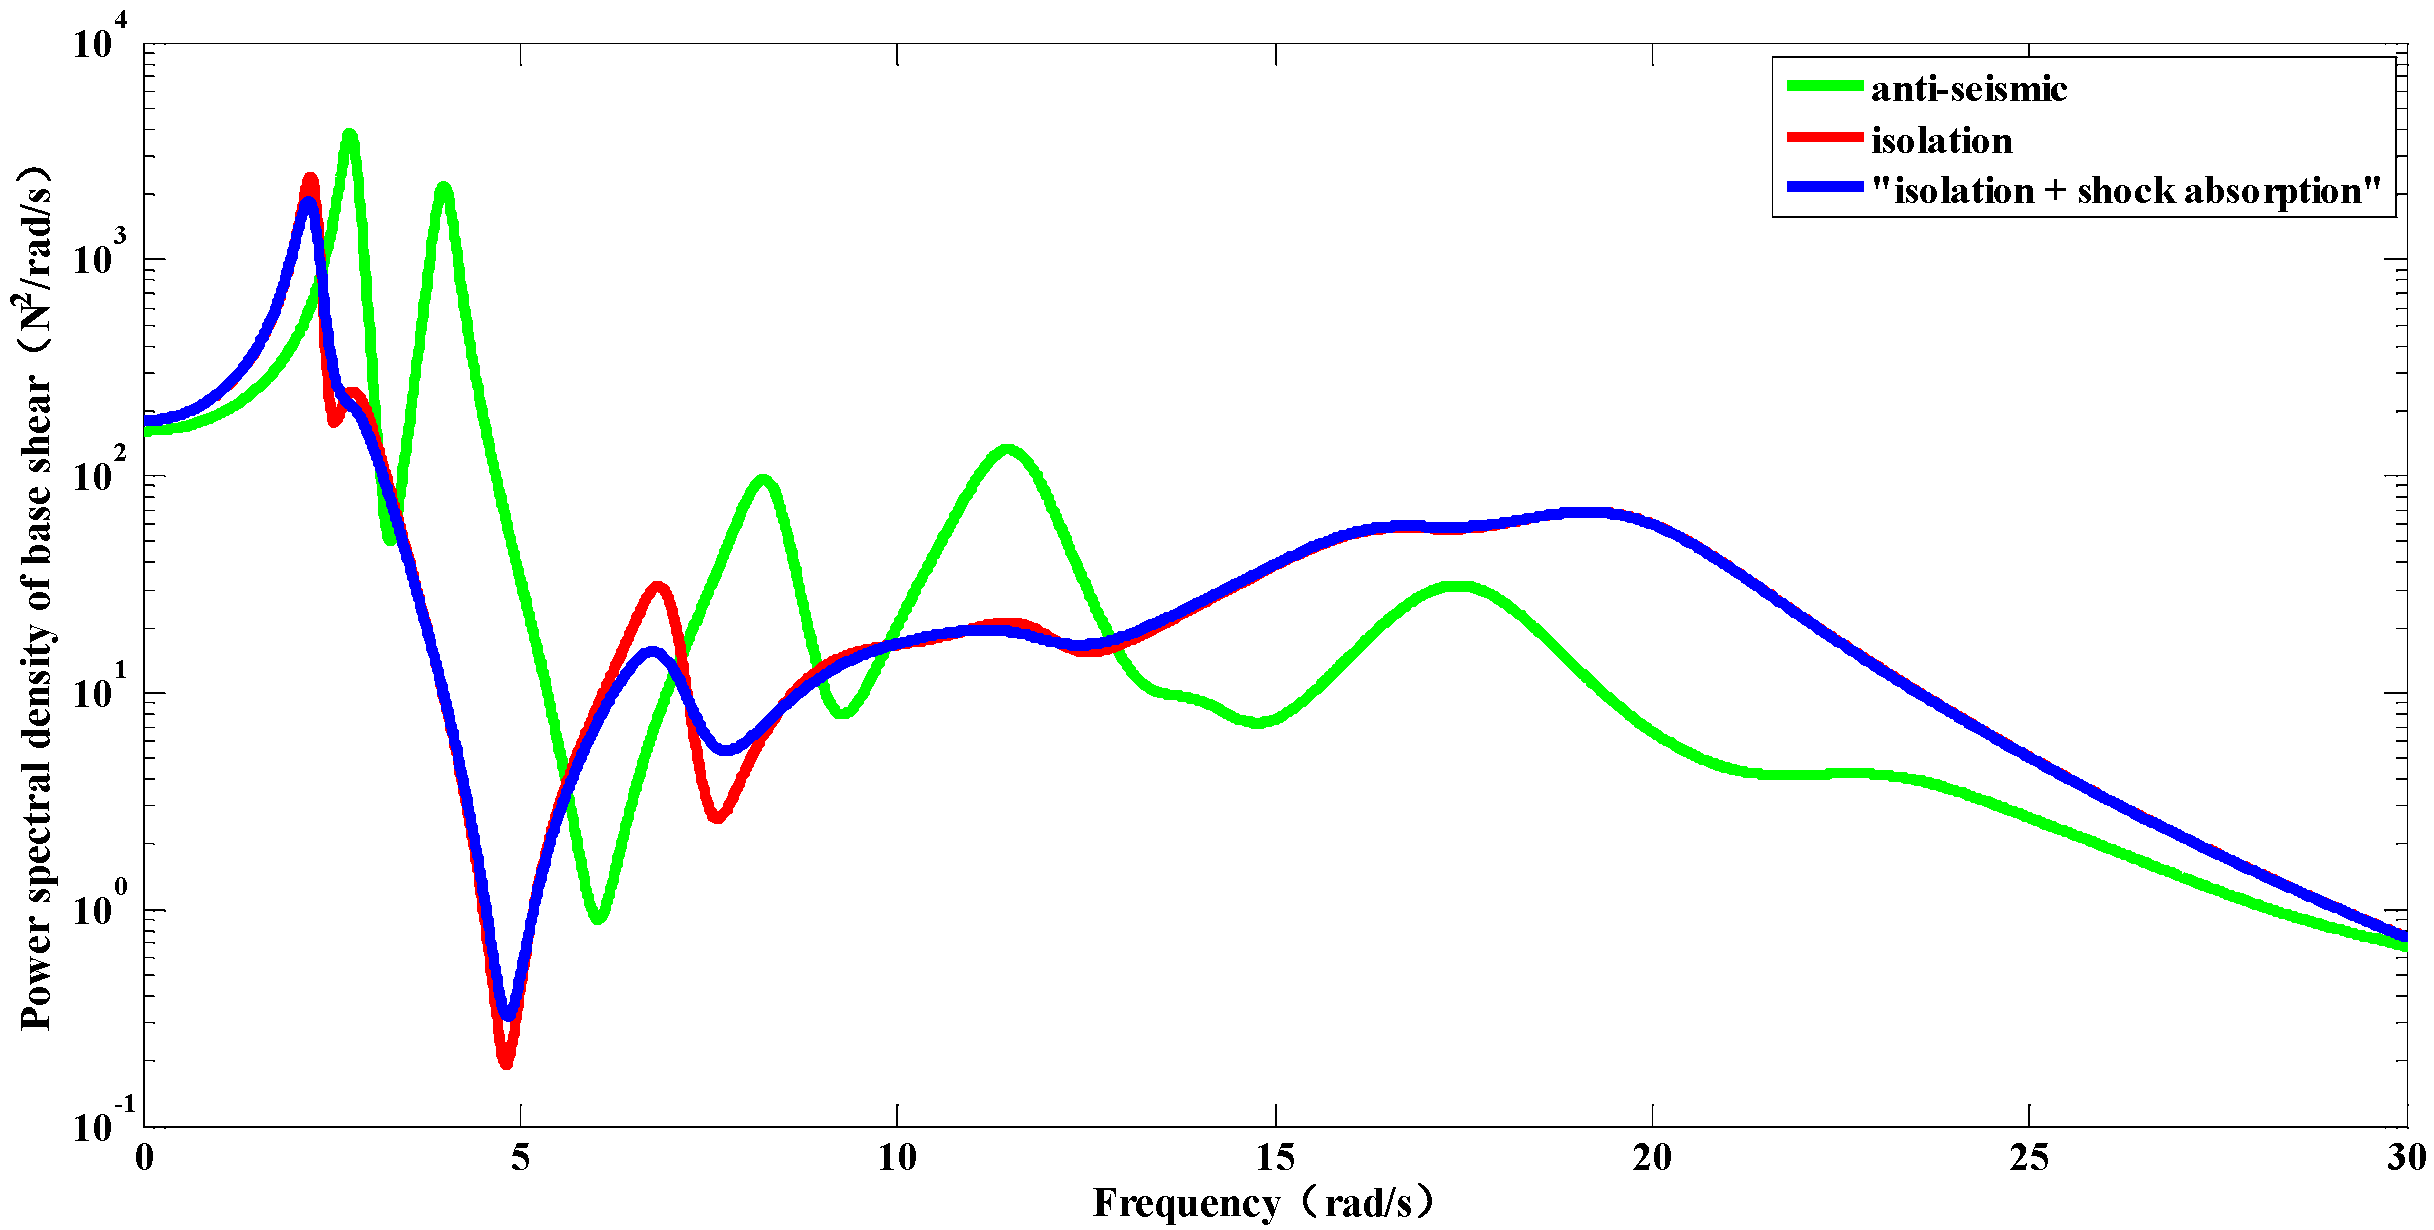
  • When the performance parameters and layout scheme of the control device are reasonable, the CPC method has good damping effect on the displacement response and absolute acceleration response of the structure; compared with the isolation scheme, it keeps the advantages of the isolation scheme, and reduces the response amplification caused by the interlayer isolation;
  • Relatively speaking, the CPC method is better for a tower with small natural frequency and can control the structural response well. In order to effectively restrict the displacement response of the left and right towers and avoid the amplification of part of the layer response, the connection control device is better to arranged near the isolation layer;
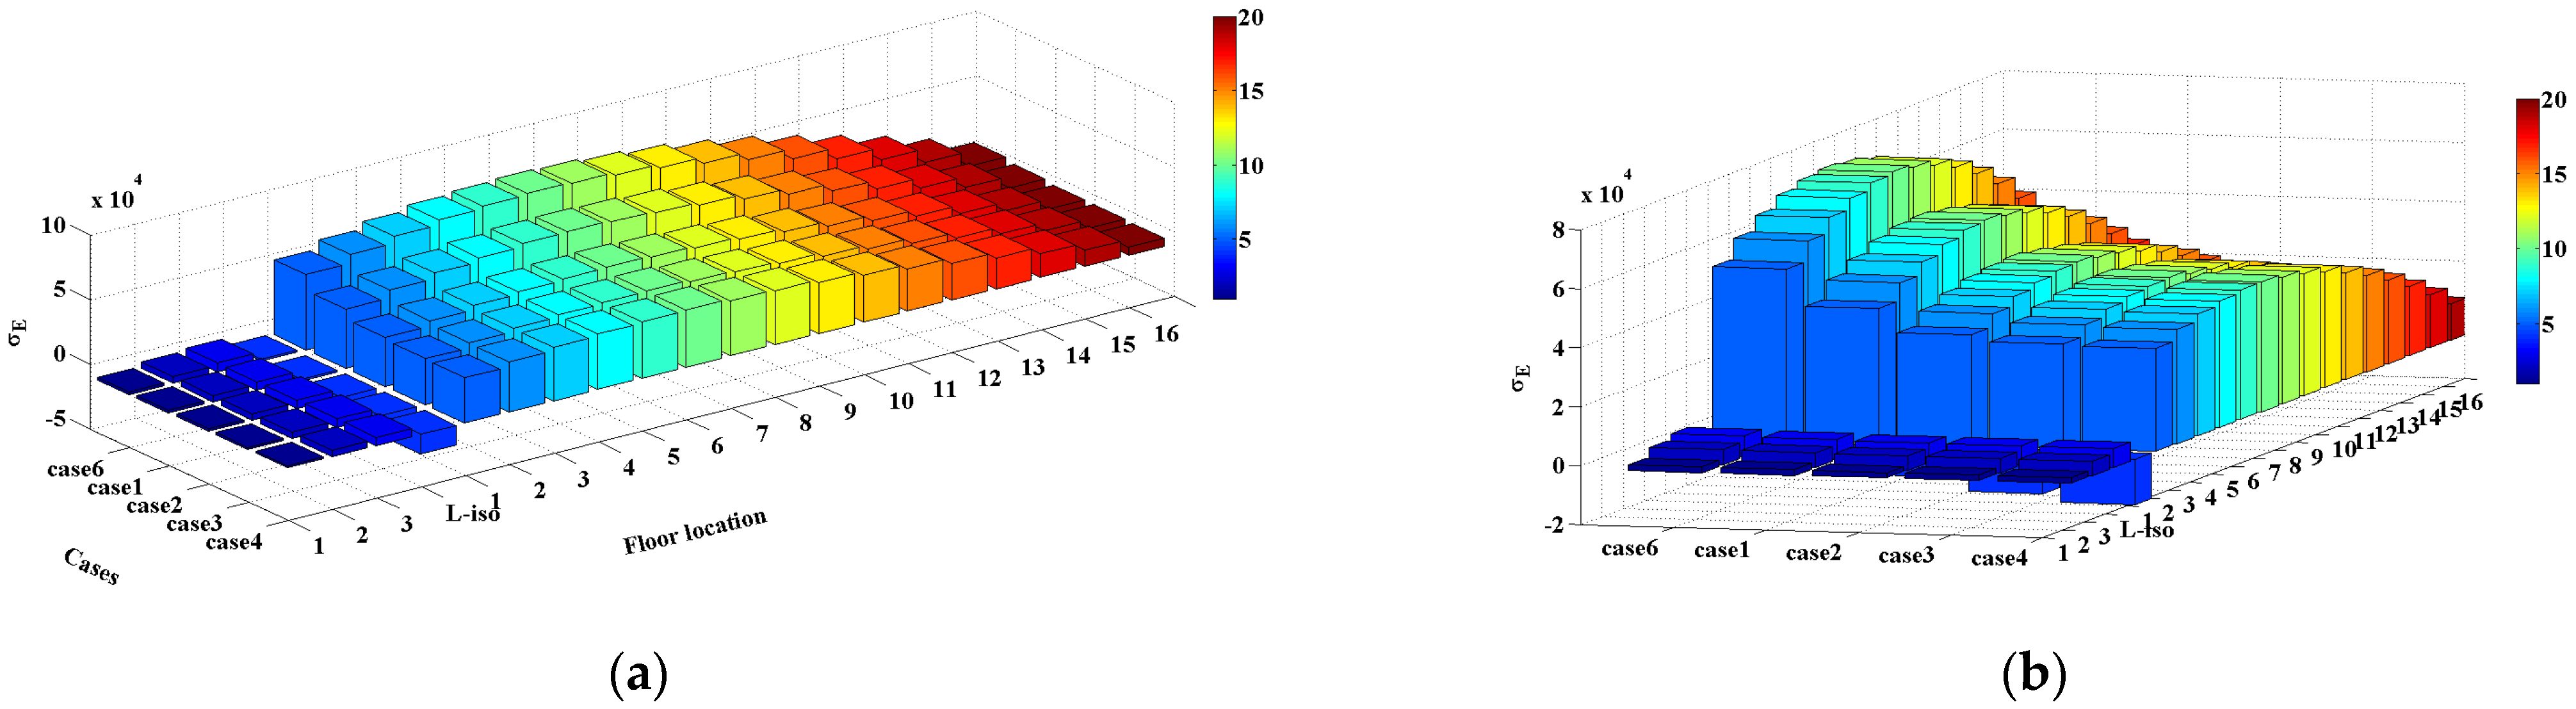
  • Taking the minimum total energy of structural vibration as the optimization objective, it is better to arrange the connection control device at the top of the structure. The control effect can reach more than 69.63%, and the highest can reach 84.64% under the condition of random ground motion as input.
  • In the analysis of the paper, the effectiveness of the CPC method is studied and verified only through theoretical analysis and numerical simulation. In the subsequent research, the finite element simulation or shaking table test can be used to further verify and analysis. Besides, the plane of the calculation model selected in this paper is relatively regular, and only the horizontal excitation is considered. For structures with irregular shapes, or asymmetric structures, such as asymmetric three-tower structures, there must be torsional effect under seismic action. In the subsequent study, it is necessary to combine the coupling and torsional law of the large chassis tower system, and the optimization design of more complex passive control devices under bidirectional or three-dimensional seismic waves.

Author Contributions

Conceptualization, S.Z. and Y.H.; methodology, S.Z.; software, Y.H.; validation, Y.H., C.Z. and S.L.; formal analysis, S.Z. and Y.H.; resources, S.Z. and P.T.; writing—original draft preparation, Y.H.; writing—review and editing, Y.H., C.Z. and S.L., All authors have read and agreed to the published version of the manuscript.

Funding

The research presented was funded by the NingXia Natural Science Foundation of China (grant number 2021AAC05003), National Natural Science Foundation of China (grant number 51908129) and the Project of Young Scholars in the West (grant number XAB2017AW09).

Institutional Review Board Statement

Not applicable.

Informed Consent Statement

Not applicable.

Data Availability Statement

New data were created or analyzed in this study. Data will be shared upon request and consideration of the authors.

Conflicts of Interest

The authors declare no conflict of interest.

References

  1. Priestley, M. Performance Based Seismic Design. Bull. N. Z. Soc. Earthq. Eng. 2000, 33, 325–346. [Google Scholar] [CrossRef] [Green Version]
  2. Qiang, X.; Chen, C.C. Performance-based seismic design of structures: A direct displacement-based approach. Eng. Struct. 2003, 25, 1803–1813. [Google Scholar] [CrossRef]
  3. Gaxiola-Camacho, J.R.; Azizsoltani, H.; Villegas-Mercado, F.J.; Achintya, H. A novel reliability technique for implementation of Performance-Based Seismic Design of structures. Eng. Struct. 2017, 142, 137–147. [Google Scholar] [CrossRef] [Green Version]
  4. Dang, Y.; Huo, K.C.; Qin, F.F. Lateral-Torsional Coupled Seismic Response of Asymmetric Multi-Tower Base Isolated Structures with Large Floors. Adv. Mater. Res. 2011, 243–249, 3975–3979. Available online: https://www.scientific.net/AMR.243-249.3975 (accessed on 12 December 2021). [CrossRef]
  5. Petti, L.; Giannattasio, G.; De Iuliis, M.; Palazzo, B. Small scale experimental testing to verify the effectiveness of the base isolation and tuned mass dampers combined control strategy. Smart Struct. Syst. 2010, 6, 57–72. [Google Scholar] [CrossRef] [Green Version]
  6. Mehair, Y.; Nelson, L.; Elisa, L.; John, L.W. Effect of podium interference on shear force distributions in tower walls supporting tall buildings. Eng. Struct. 2017, 148, 639–659. [Google Scholar] [CrossRef]
  7. Zhou, Y.; Chen, P.; Wang, C.Y.; Zhang, L.X.; Lu, L. Seismic performance evaluation of tall, multi-tower reinforced concrete buildings with large bottom podiums. Struct. Concr. 2018, 19, 1591–1607. [Google Scholar] [CrossRef]
  8. Zhou, Y.; Chen, P.; Zhang, L.X.; Wang, C.Y.; Lu, L. Shaking table tests and numerical analysis of an over-track multi-tower building. Struct. Infrastruct. Eng. 2019, 15, 230–243. [Google Scholar] [CrossRef]
  9. Moehle, J.P. Seismic Response of Vertically Irregular Structures. J. Struct. Eng. 2014, 110, 2002–2014. [Google Scholar] [CrossRef]
  10. Elnashai, A.; Soliman, M. Effect of Building Configuration on Seismic Response Parameters; University of Missouri—Rolla: St. Louis, MO, USA, April 1995; pp. 7, 26. Available online: https://scholarsmine.mst.edu/icrageesd/03icrageesd/session07/15/ (accessed on 12 December 2021).
  11. Du, Y.F.; Jia, S.X. Analysis of torsional vibration response isolated in multi-tower structure with large podium subjected to multi-dimensional earthquake. Earthq. Resist. Eng. Retrofit. 2012, 34, 62–67. Available online: http://en.cnki.com.cn/Article_en/CJFDTOTAL-GCKZ201205011.htm (accessed on 12 December 2021). (In Chinese).
  12. Wu, Y.X.; Lu, J.F.; Zhao, X.; Lin, Y.Q. Model Test and Lateral–Torsional Coupling Effect Analysis of the Mid-story Isolation Structure with Large Chassis. Adv. Eng. Sci. 2018, 50, 48–55. Available online: http://en.cnki.com.cn/Article_en/CJFDTotal-SCLH201806007.htm (accessed on 12 December 2021). (In Chinese).
  13. Ryan, K.L.; Earl, C.L. Analysis and design of inter-story isolation systems with nonlinear devices. J. Earthq. Eng. 2010, 7, 1044–1062. [Google Scholar] [CrossRef]
  14. Koh, T.; Kobayashi, M. Vibratory characteristics and earthquake response of midstory isolated buildings. Mem. Inst. Sci. Technol. 2000, 39, 97–114. [Google Scholar]
  15. Earl, C.L. Effectiveness and feasibility of inter-story isolation systems. Master’s Thesis, Utah State University, Logan, UT, USA, 2007. Available online: https://www.proquest.com/docview/304807965?accountid=130516 (accessed on 12 December 2021).
  16. Zhou, F.L. Advanced passive control techniques for retrofit of existing buildings. In Proceedings of the 12th WCEE Conference, Auckland, New Zealand, 30 January–4 February 2000; Vancouver Ltd.: Vancouver, BC, Canada, 2007; pp. 1–7. Available online: https://www.iitk.ac.in/nicee/wcee/article/0194.pdf (accessed on 12 December 2021).
  17. Wang, S.J.; Chang, K.C.; Hwang, J.S.; Lee, B.H. Simplified analysis of mid-story seismically isolated buildings. Earthq. Eng. Eng. Vib. 2011, 40, 119–133. [Google Scholar] [CrossRef]
  18. Xu, Y.L.; He, Q.; Ko, J.M. Dynamic response of damper-connected adjacent buildings under earthquake excitation. Eng. Struct. 1999, 21, 135–148. [Google Scholar] [CrossRef]
  19. Zhang, W.S.; Xu, Y.L. Dynamic characteristics and seismic response of adjacent building s linked by discrete dampers. Earthq. Eng. Struct. Dyn. 1999, 28, 1163–1185. [Google Scholar] [CrossRef]
  20. Xu, Y.L.; Zhang, W.S.; Ko, J.M. Experimental investigation of adjacent building s connected by fluid damper. Earthq. Eng. Struct. Dyn. 1999, 28, 601–631. [Google Scholar] [CrossRef]
  21. Basili, M.; Angelis, M.D. A reduced order model for optimal design of 2-mdof adjacent structures connected by hysteretic dampers. J. Sound Vib. 2007, 306, 297–317. [Google Scholar] [CrossRef]
  22. Basili, M.; Angelis, M.D. Optimal passive control of adjacent structures interconnected with nonlinear hysteretic devices. J. Sound Vib. 2007, 301, 106–125. [Google Scholar] [CrossRef]
  23. Matsagar, V.A.; Jangid, R.S. Viscoelastic damper connected to adjacent structures involving seismic isolation. Statyba 2005, 11, 309–322. [Google Scholar] [CrossRef]
  24. Quinonero, F.; Massegu, J.R.; Rossell, J.M.; Karimi, H.R. Semiactive-passive structural vibration control strategy for adjacent structures under seismic excitation. J. Frankl. Inst. 2012, 349, 3003–3026. [Google Scholar] [CrossRef]
  25. Quinonero, F.; Massegu, J.R.; Rossell, J.M.; Karimi, H.R. Vibration control for adjacent structures using local state information. Mechatronics 2014, 24, 336–344. [Google Scholar] [CrossRef] [Green Version]
  26. Klein, R.E.; Healey, M.D. Semi-Active Control of Wind Induced Oscillations in Structures. Struct. Control 1987, 354–369. [Google Scholar] [CrossRef]
  27. Zhu, H.P.; Xu, Y.L. Optimum parameters of Maxwell model-defined dampers used to link adjacent structures. J. Sound Vib. 2005, 279, 253–274. [Google Scholar] [CrossRef]
  28. Zhu, H.P.; Wen, Y.P.; Iemura, H.A. Study on interaction control for seismic response of parallel structures. Comput. Struct. 2001, 79, 231–242. [Google Scholar] [CrossRef]
  29. Zhu, H.P.; Lemura, H. A study of response control on the passive coupling element between two parallel structures. Struct. Eng. Mech. 2000, 9, 383–396. [Google Scholar] [CrossRef]
  30. Wu, Q.Y.; Dai, J.Z.; Zhu, H.P. Optimum Design of Passive Control Devices for Reducing the Seismic Response of Twin-Tower-Connected Structures. J. Earthq. Eng. 2018, 22, 826–860. [Google Scholar] [CrossRef]
  31. Patel, C.C.; Jangid, R.S. Seismic response of dynamically similar adjacent buildings connected with viscous dampers. IES J. Part A Civ. Struct. Eng. 2010, 3, 1–13. [Google Scholar] [CrossRef]
  32. Patel, C.C. Random response analysis of adjacent structures connected with friction damper. Asian J. Civ. Eng. 2021, 22, 1115–1129. [Google Scholar] [CrossRef]
  33. Teng, J. Theory, Technology and Method of Structural Random Vibration; Science Press: Beijing, China, 2009. (In Chinese) [Google Scholar]
  34. Fang, T. Engineering Random Vibration; National Defense Industry Press: Beijing, China, 1995; Available online: http://img.sslibrary.com/n/slib/book/slib/10651331/89934eed94114334b344b3f01fe1f236/bb7a7c31ea20dd0eb9fc96293b28fdeb.shtml?dxbaoku=false&deptid=2705&fav=http%3A%2F%2Fwww.sslbrary.com%2Freader%2Fpdg%2Fpgreader%3Fd%3Dd0d360de62f70fabbb93e5380e63a5bb%26ssid%3D10651331&fenlei=1806010203&spage=1&t=5&username=218.95.214.4&view=-1 (accessed on 12 December 2021). (In Chinese)
  35. Zhong, W.X. Making great efforts to create the road of independent innovation in engineering application of random vibration theory in China. Appl. Math. Mech. 2017, 38, 3. Available online: https://d.wanfangdata.com.cn/periodical/xmgljs201902003 (accessed on 12 December 2021). (In Chinese).
  36. Grigoriu, M.; Soong, T.W. Random Vibration of Mechanical and Structural Systems. NASA STI/Recon Tech. Rep. A 1993, 93, 14690. Available online: https://ui.adsabs.harvard.edu/abs/1993STIA...9314690S/abstract (accessed on 12 December 2021).
  37. Robson, J.D. Random vibration and statistical linearization. J. Sound Vib. 1990, 141, 532–533. Available online: https://www.researchgate.net/publication/239289840_Random_vibration_and_statistical_linearization (accessed on 12 December 2021). [CrossRef]
  38. Housner, G.W. Characteristics of strong motion earthquakes. Bull. Seismol. Soc. Am. 1947, 37, 19–37. Available online: https://www.researchgate.net/publication/245644155_Characteristics_of_Strong_Motion_Earthquakes (accessed on 12 December 2021). [CrossRef]
  39. Kanai, K.; Yoshizawa, S.; Suzuki, T. An empirical formula for the spectrum of strong earthquake motions. Bull. Earthq. Res. Inst. Univ. Tokyo 1963, 41, 261–270. Available online: https://www.researchgate.net/publication/29773851_An_Empirical_Formula_for_the_Spectrum_of_Strong_Earthquake_Motions_II (accessed on 12 December 2021).
  40. Tajimi, H. A statistical method of determining the maxi-mum response of a building structure during an earth-quake. In Proceedings of the Second World Conference on Earthquake Engineering (WCEE), Tokyo, Japan, 11–18 July 1960; Volume 2, pp. 781–798. Available online: https://www.researchgate.net/publication/245080913_A_Statistical_Method_of_Determining_the_Maximum_Response_of_a_Building_Structure_during_An_Earthquake (accessed on 12 December 2021).
  41. Clough, R.W.; Penzien, J.; Griffin, D.S. Dynamics of structures. J. Appl. Mech. 1977, 44, 366. Available online: https://www.researchgate.net/publication/258886062_Dynamics_of_Structures (accessed on 12 December 2021). [CrossRef] [Green Version]
  42. OU, J.P.; Niu, D.T.; Du, X.L. The model of random ground motion and its parameters are used to determine. Seism. Eng. Eng. Vib. 1991, 11, 45–54. Available online: http://qikan.cqvip.com/Qikan/Article/Detail?id=462511 (accessed on 12 December 2021). (In Chinese).
  43. Li, H.J.; Chen, C. An improved Jinjing Qingpu model for stable earthquake ground motion. Eng. Mech. 2014, 31, 158–163. Available online: http://www.cqvip.com/QK/95324X/20142/48618314.html (accessed on 12 December 2021). (In Chinese).
Figure 1. Calculation diagram of multi-DOF (degrees of freedom) layer shear model of multi-tower building (MTB) with the adopted compositive passive control (CPC) method.
Buildings 12 00137 g001
Figure 2. Calculation diagram of single-DOF layer shear model of MTB with the adopted CPC method.
Buildings 12 00137 g002
Figure 3. Deducing process.
Buildings 12 00137 g003
Figure 4. Optimization process.
Buildings 12 00137 g004
Figure 5. Mean square deviation of total vibration energy for single-DOF shear model of MTB.
Buildings 12 00137 g005
Figure 6. Schematic view of the models. (a) Model 1, known as ‘anti-seismic structure’; (b) Model 2, known as ‘isolation structure’; (c) Model 3, known as ‘isolation + shock absorption’ structure.
Buildings 12 00137 g006
Figure 7. Time-varying variance of top displacement.
Buildings 12 00137 g007
Figure 8. Time-varying variance of top-level absolute acceleration.
Buildings 12 00137 g008
Figure 9. Zero-order spectral moment of the displacement of each layer of the podium.
Buildings 12 00137 g009
Figure 10. Second-order spectral moment of displacement of each layer of the podium.
Buildings 12 00137 g010
Figure 11. Zero-order spectral moment of the displacement of each layer of the left tower.
Buildings 12 00137 g011
Figure 12. Second-order spectral moment of the displacement of each layer of the left tower.
Buildings 12 00137 g012
Figure 13. Zero-order spectral moment of the displacement of each layer of the right tower.
Buildings 12 00137 g013
Figure 14. Second-order spectral moment of the displacement of each layer of the right tower.
Buildings 12 00137 g014
Figure 15. (a) Control effect of displacement response of podium; (b) control effect of absolute acceleration response of podium.
Buildings 12 00137 g015
Figure 16. (a) Control effect of displacement response of left tower; (b) control effect of absolute acceleration response of left tower.
Buildings 12 00137 g016
Figure 17. (a) Control effect of displacement response of right tower; (b) control effect of absolute acceleration response of right tower.
Buildings 12 00137 g017
Figure 18. Energy distribution map of layer position under different control schemes: (a) a three-dimensional view from one angle; (b) a three-dimensional view from another angle.
Buildings 12 00137 g018
Figure 19. Acceleration power spectral density of structure top layer.
Buildings 12 00137 g019
Figure 20. Power spectral density of base shear.
Buildings 12 00137 g020
Publisher’s Note: MDPI stays neutral with regard to jurisdictional claims in published maps and institutional affiliations.

